Article

Urine Extracellular Vesicle miRNA Changes Induced by Vicadrostat with/Without Empagliflozin in Patients with Chronic Kidney Disease

by
Denis Delic
1,2,*,†,
Isabella Gashaw
3,†,
Ileana Duran-Fernandez
4,
Lisa Cronin
5,
Sibylle J. Hauske
2,6,‡,
Peter Rossing
7,8,§ and
Katherine R. Tuttle
9,10,§
1
Boehringer Ingelheim Pharma GmbH & Co. KG, 88400 Biberach, Germany
2
Fifth Department of Medicine (Nephrology/Endocrinology/Rheumatology), University Medical Centre Mannheim, University of Heidelberg, 68167 Heidelberg, Germany
3
Boehringer Ingelheim Pharma GmbH & Co. KG, 55216 Ingelheim am Rhein, Germany
4
Staburo GmbH, 81549 Munich, Germany
5
Boehringer Ingelheim Pharmaceuticals, Ridgefield, CT 06877, USA
6
Boehringer Ingelheim International GmbH, 55216 Ingelheim am Rhein, Germany
7
Steno Diabetes Center Copenhagen, 2730 Herlev, Denmark
8
Department of Clinical Medicine, University of Copenhagen, 2200 Copenhagen, Denmark
9
Providence Inland Northwest Health, Spokane, WA 99201, USA
10
Nephrology Division, Kidney Research Institute, University of Washington, Seattle, WA 98195, USA
*
Author to whom correspondence should be addressed.
Equally contributed first authors.
Deceased; contributions were made prior to their passing on 26 June 2025 (see Acknowledgments).
§
Equally contributed last authors.
Int. J. Mol. Sci. 2025, 26(22), 10810; https://doi.org/10.3390/ijms262210810
Submission received: 5 September 2025 / Revised: 29 September 2025 / Accepted: 7 October 2025 / Published: 7 November 2025

Abstract

Vicadrostat, a selective aldosterone synthase inhibitor, reduced albuminuria with concurrent renin–angiotensin system inhibition and empagliflozin, suggesting additive efficacy for chronic kidney disease (CKD) treatment. Specific urinary extracellular vesicle microRNAs (uEV miRNAs) may reflect key mechanisms of kidney injury. We investigated how vicadrostat alone or with empagliflozin affected uEV miRNA expression in study participants. Small RNA sequencing was conducted on uEV miRNAs from 435 participants with CKD who completed 14 weeks treatment in the phase II trial of vicadrostat given with or without empagliflozin. Differentially expressed uEV miRNAs in participants with ≥30% UACR (urine albumin–creatinine ratio) reduction treated with 10 or 20 mg vicadrostat were pooled and evaluated with or without empagliflozin. Changes in miRNA-142-5p correlated significantly with changes in UACR in participants treated with vicadrostat alone, whereas changes in expression of eight additional uEV miRNAs (miR-192-5p, miR-194-5p, miR-6882-5p, miR-27a-5p, miR-381-3p, miR-192-3p, miR-513a-5p, and miR-199b-3p) correlated with ≥30% UACR improvements in patients treated with vicadrostat plus empagliflozin. Cellular deconvolution revealed that these miRNAs were expressed in various kidney cell types. Vicadrostat plus empagliflozin altered uEV miRNAs involved in immunomodulatory and fibrotic pathways irrespective of participant diabetes status. Regulation of miRNAs may provide insights into synergistic mechanisms of vicadrostat and empagliflozin in CKD treatment.

1. Introduction

The global burden of chronic kidney disease (CKD) is substantial and growing: approximately 10% of adults worldwide have CKD, resulting in 1.2 million deaths each year [1,2,3]. By 2040, CKD is estimated to become the fifth leading cause of death globally—one of the largest projected increases in any major cause of death [4,5]. First-line treatment for CKD includes renin–angiotensin system (RAS) inhibition, in the form of angiotensin converting enzyme (ACE) inhibitors or angiotensin receptor blockers (ARBs), and sodium-glucose co-transporter 2 inhibitors (SGLT2i) [6]. Risk-based therapy for people with CKD and type 2 diabetes (T2D) who have residual albuminuria includes a non-steroidal mineralocorticoid receptor antagonist (MRA). Although ACE inhibitors, ARBs, and non-steroidal MRAs provide benefit for CKD, they do not fully block the effects of aldosterone and increase the risk of hyperkalemia [7,8,9]. Vicadrostat is a potent, highly selective aldosterone synthase inhibitor in clinical development in combination with the SGLT2i empagliflozin (VicaEmpa) for treatment of CKD and heart failure. In a phase 2, randomized, placebo-controlled clinical trial, vicadrostat dose-dependently reduced albuminuria with concurrent renin–angiotensin system inhibition and empagliflozin, suggesting additive efficacy [10].
The underlying molecular mechanisms remain to be elucidated for the effects of vicadrostat in CKD. Urine albumin–creatine ratio (UACR) and estimated glomerular filtration rate (eGFR) are commonly used biomarkers in chronic kidney disease trials but not ideal for molecular differentiation between treatments during disease progression. In recent years, studies have underlined the importance of exosomes as liquid biopsies and a novel source of biomarkers in kidney diseases [11]. Furthermore, miRNAs exhibit superior stability in degraded RNA samples, which makes them more suitable biomarkers [12].
MiRNAs are small non-coding RNA molecules that regulate gene expression, and have important roles in CKD [13,14]. In particular, miRNAs promote tubulointerstitial and glomerular fibrosis [13]. Urine exosomes contain miRNAs packaged in extracellular vesicles that are secreted in large quantities from all nephron segments [15]. Urinary exosomal miRNA content is altered in patients with focal segmental glomerulosclerosis [16,17] and in patients with type 1 or type 2 diabetes and CKD [18,19,20]. Notably, human urinary extracellular vesicle (uEV) miRNA patterns may also be used to identify cellular targets of drug effects [21].
In the present study, we investigated effects of vicadrostat plus empagliflozin or vicadrostat alone on uEV miRNA expression to evaluate their potential mechanistic effects in CKD.

2. Results

2.1. Effects of Vicadrostathigh, Empagliflozin, and Vicadrostathigh Plus Empagliflozin Resulted in Unique uEV miRNA Profiles

The baseline characteristics of the study population (Table 1) were similar to the overall trial population [22].
To investigate a potential molecular mechanism for the effect of vicadrostat treatment in CKD, uEV miRNA profiling was performed. Percentage change in UACR from baseline to the end of treatment at week 14 was similar in participants who received the high doses (10 or 20 mg) vicadrostat [10]. A subgroup analysis was performed on patients with CKD receiving high doses (10 or 20 mg) of vicadrostat (vicadrostathigh) who showed ≥30% reduction in UACR compared to baseline. An exploratory analysis of 724 miRNAs present in uEV revealed that miRNAs were modulated (≥1.5 fold; p ≤ 0.01) by the vicadrostathigh treatment in this subgroup; the expression of the seven miRNAs miR-3158-5p, miR-4436b-3p, miR-6746-5p, miR-454-3p, miR-6802-5p, miR-200c-3p, and miR-1296-5p increased, whereas the expression of the two miRNAs miR-550a-3-5p and miR-142-5p decreased in patients with CKD receiving vicadrostathigh who showed a reduction of ≥30% in UACR (Figure 1A). Participants who were treated with empagliflozin alone and experienced ≥30% UACR reduction are characterized by an increased uEV level of miR-141-5p and decreased levels of miR-6509-5p, miR-148b-3p, miR-192-3p, miR-26a-1-3p, miR-625-5p, miR-378a-5p, miR-145-5p, miR-365a-3p, miR-6826-5p, and miR-1287-5p (Figure 1B). Participants with ≥30% UACR reduction following vicadrostathigh plus empagliflozin treatment experienced a decreased expression of 26 miRNAs (Figure 1C). Interestingly, only a decreased level of miR-192-3p overlapped between empagliflozin mono treatment and treatment in combination with vicadrostat (Figure 1D).

2.2. Changes in uEV miRNA Expression Profiles Associated with Albuminuria

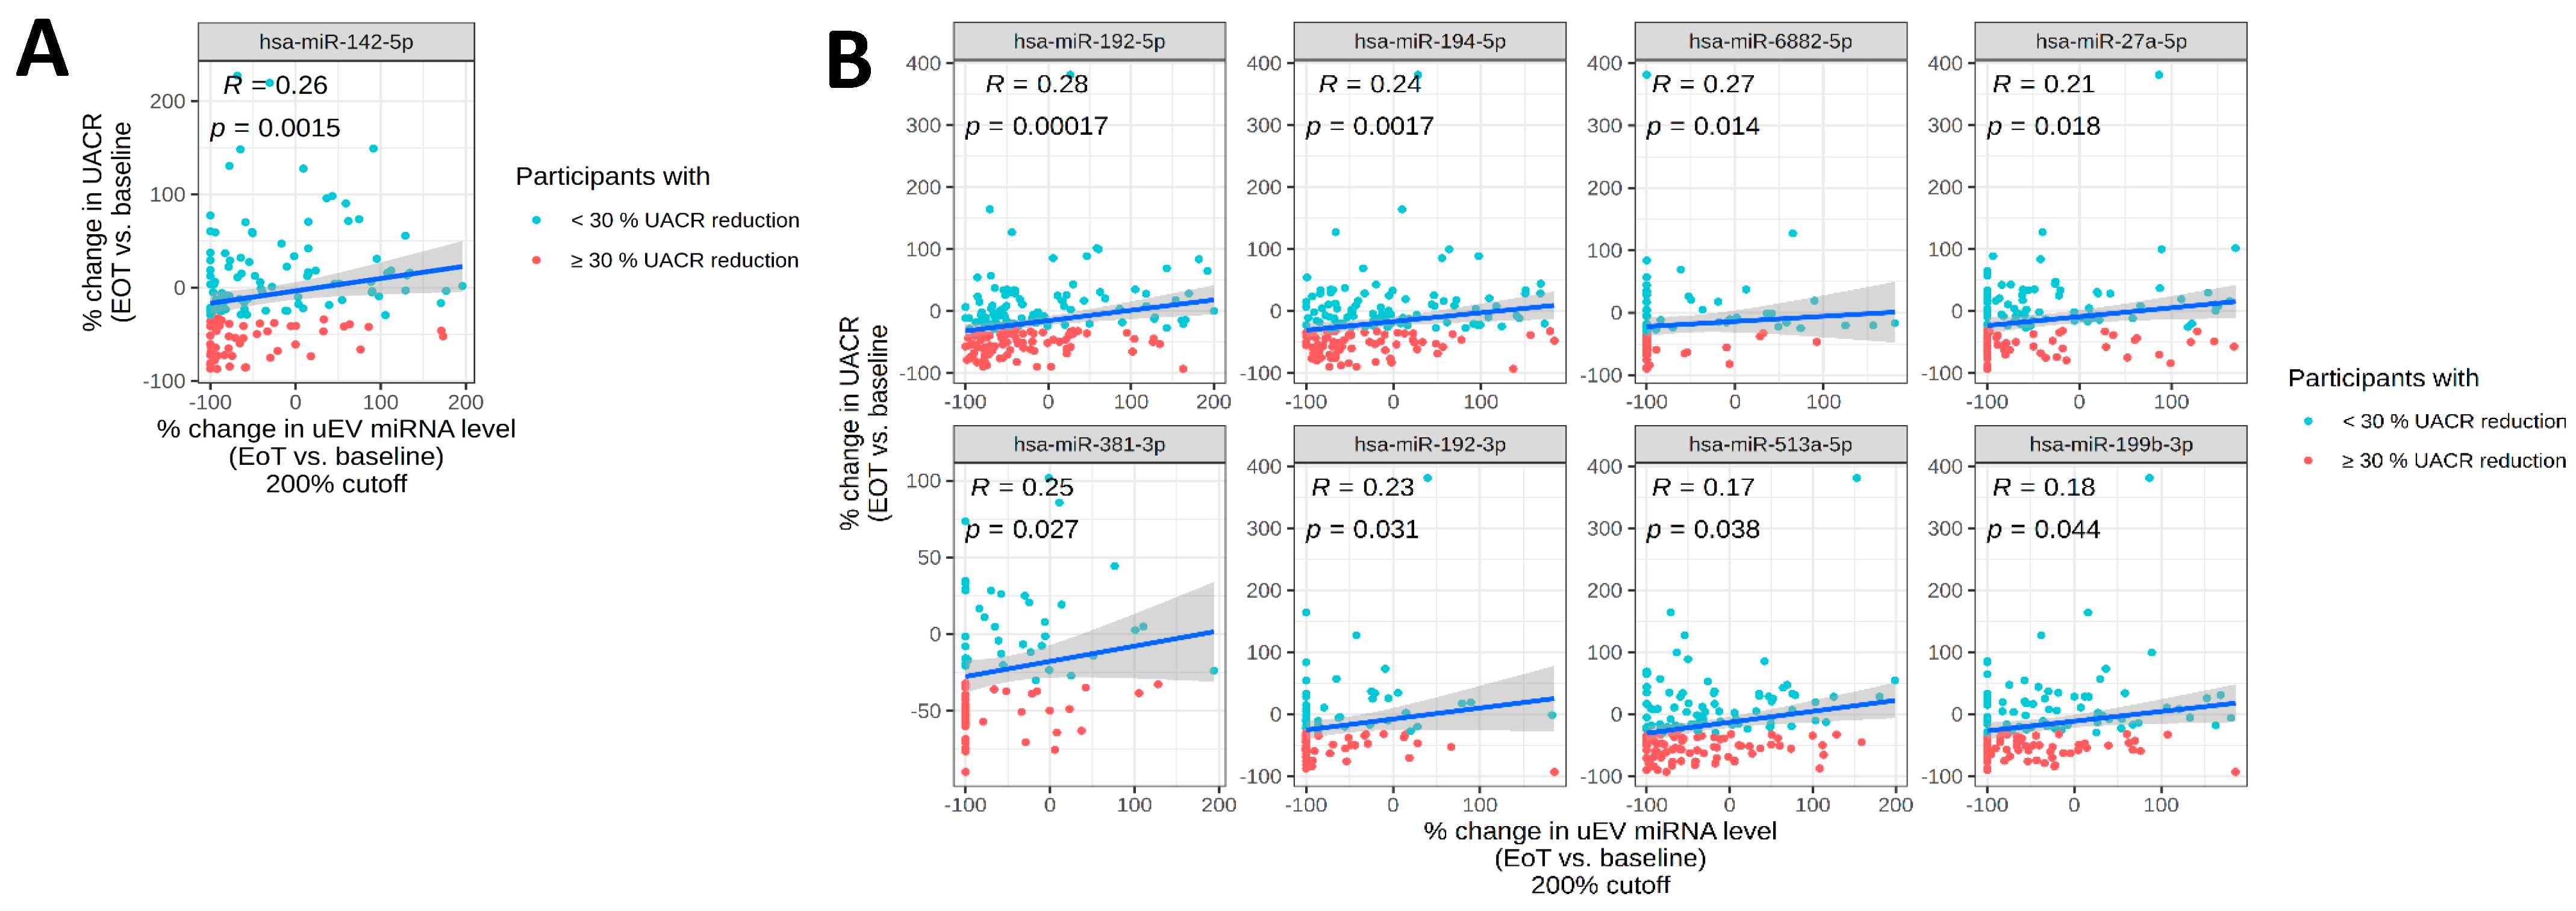
Due to small numbers of participants receiving empagliflozin-only treatment, the following analyses are focused on vicadrostat monotherapy and vicadrostat plus empagliflozin combination therapy. The correlation analysis revealed that the % changes in uEV miR-142-5p expression significantly correlated with % changes in UACR (r2 = 0.26; p = 0.0015) (Figure 2A). The combined therapy with vicadrostat and empagliflozin resulted in significant correlations between expression changes and UACR for the following miRNAs: miR-192-5p (r2 = 0.28; p < 0.001), miR-194-5p (r2 = 0.24; p = 0.0017), miR-6882-5p (r2 = 0.27; p = 0.014), miR-27a-5p (r2 = 0.21; p = 0.018), miR-381-3p (r2 = 0.25; p = 0.027), miR-192-3p (r2 = 0.23; p = 0.031), miR-513a-5p (r2 = 0.17; p = 0.038), and miR-199b-3p (r2 = 0.18; p = 0.044) (Figure 2B).
The differential expression and correlations with UACR of the outcome-related uEV miRNAs are summarized in Table 2.
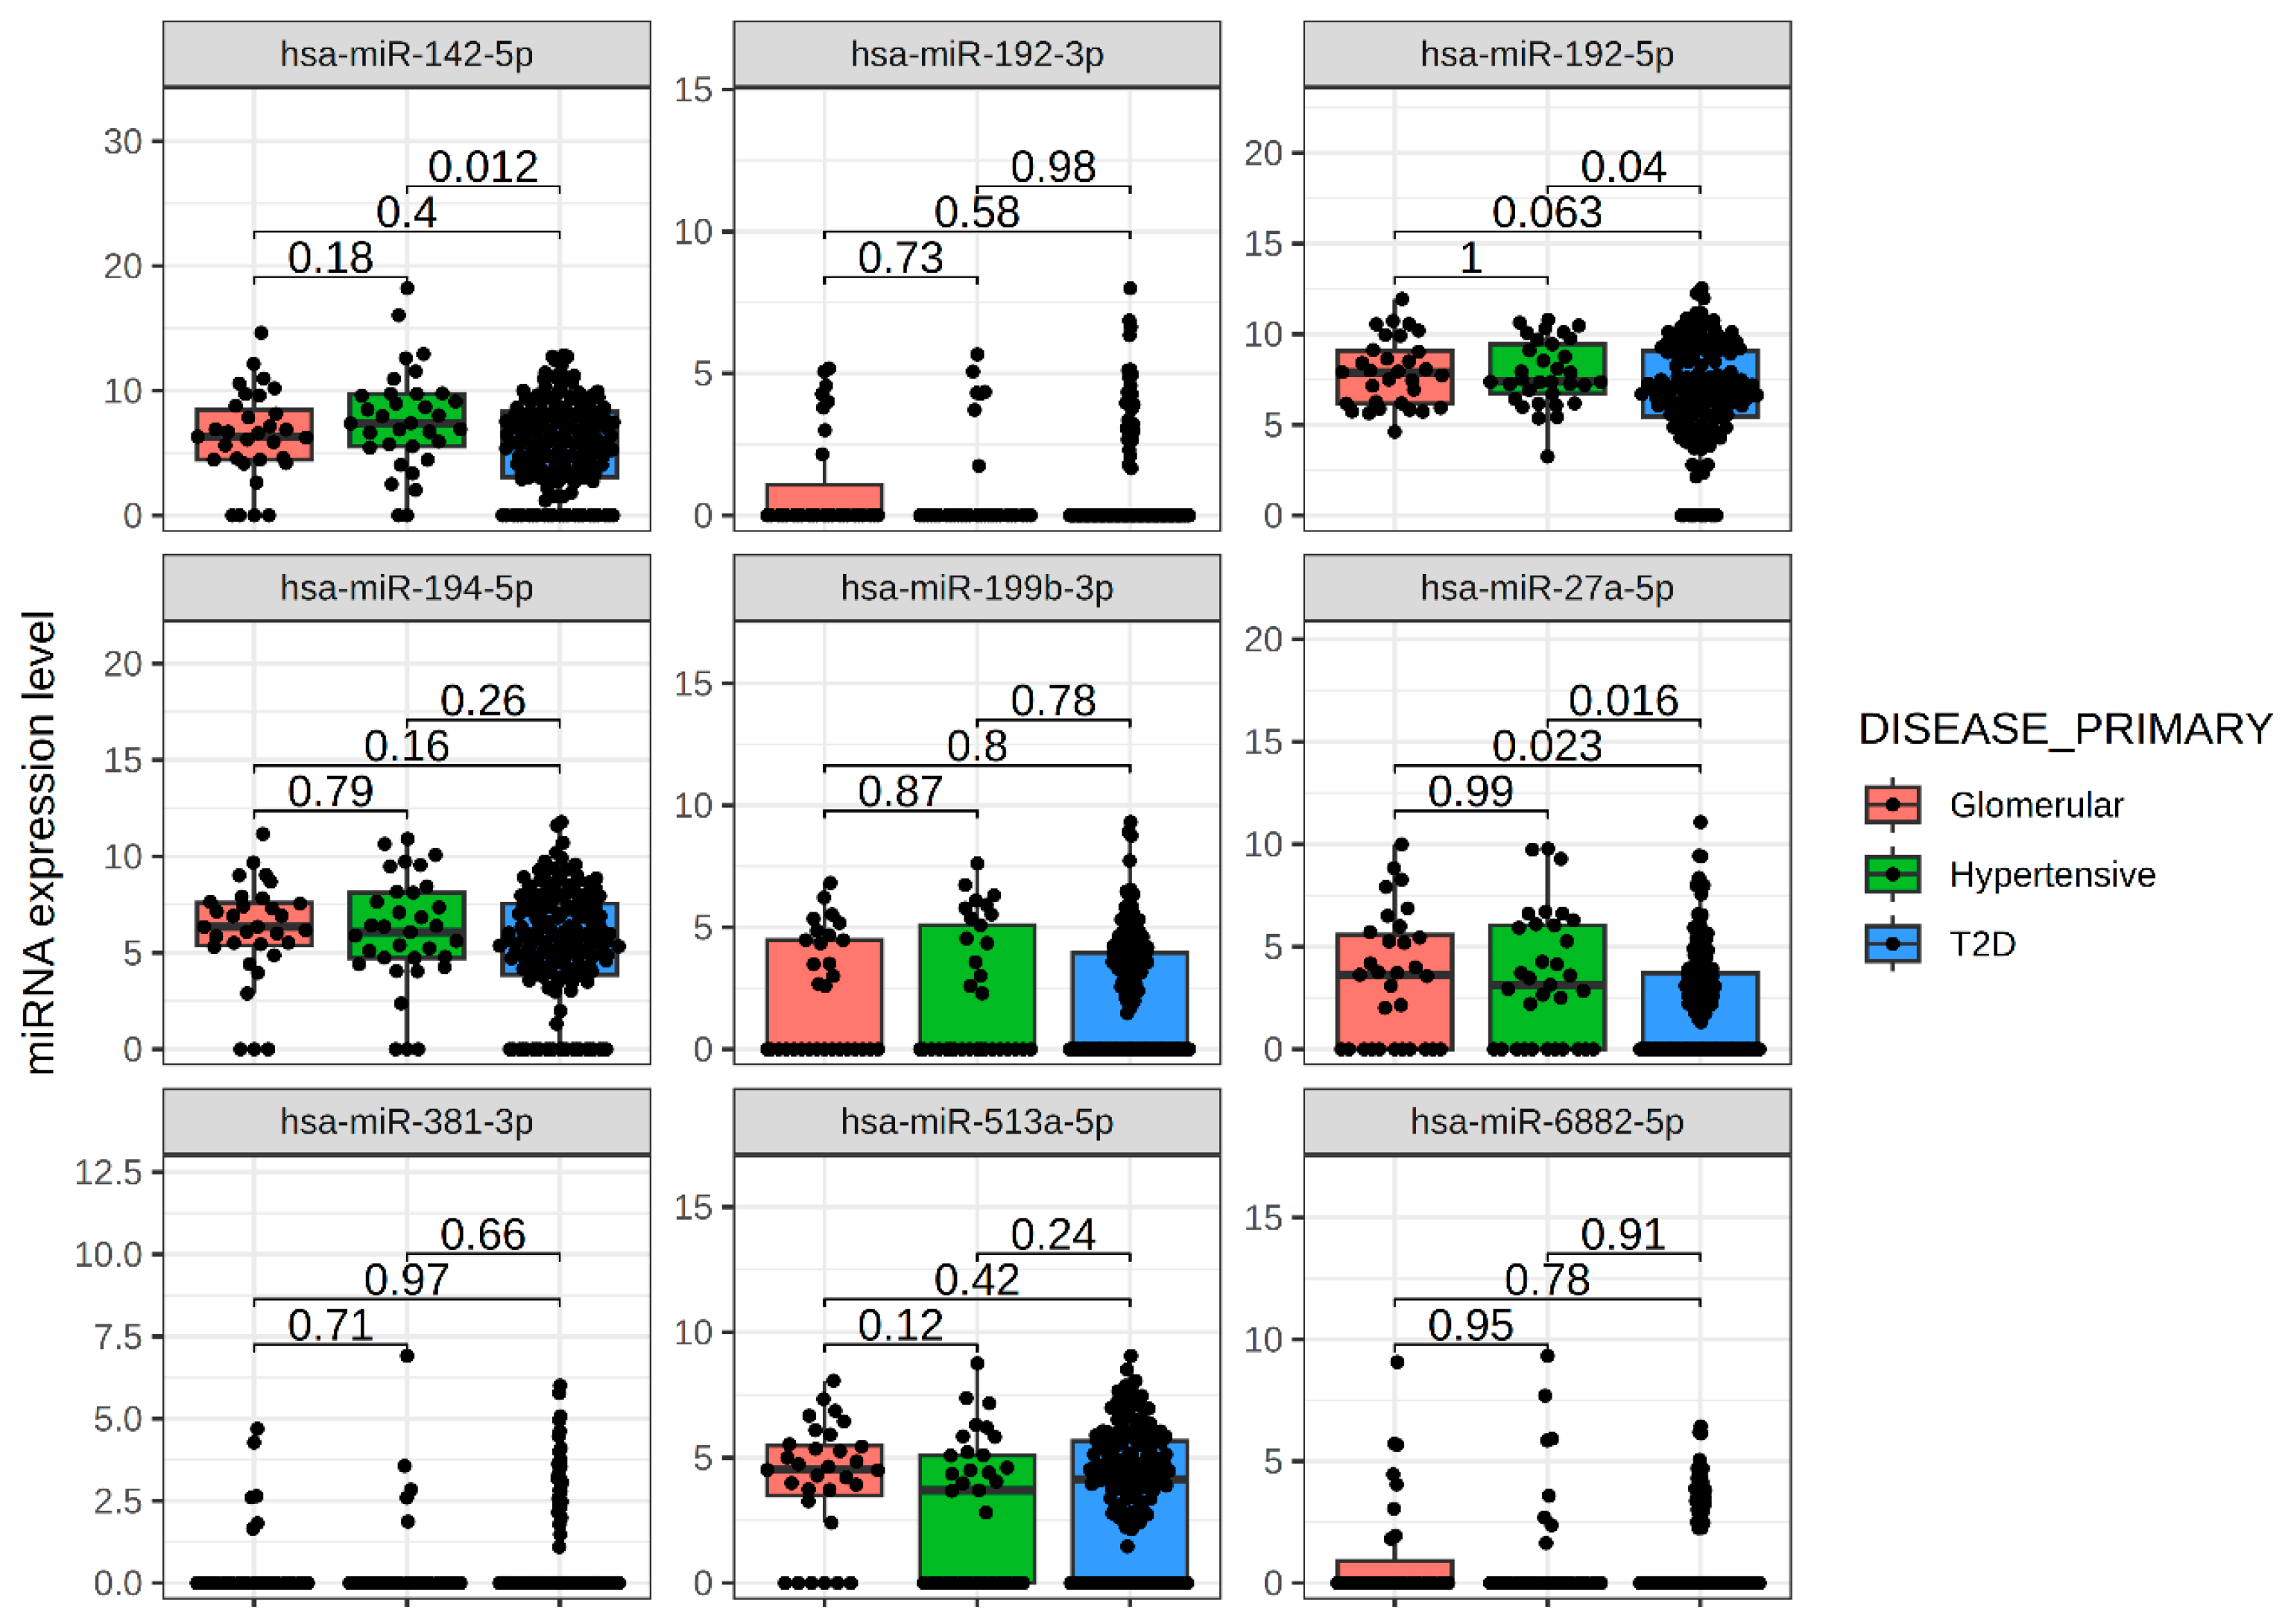
Changes in uEV miRNA expression in response to vicadrostathigh treatment were not apparent in participants who showed <30% reduction in UACR compared to baseline (Table S1) or in participants treated with placebo or 3 mg vicadrostat with or without empagliflozin who showed ≥30% UACR reduction (Table S2). Alterations of uEV miRNA expression profiles were present irrespective of diabetes status (Table S3). Participants were also categorized by their CKD diagnosis to assess the expression of vicadrostat-regulated miRNAs (Figure 3). Baseline expression of the miRNAs was similar across diagnoses. Strong expression levels in uEV were identified for miR-142-5p, miR-192-5p and miR-194-5p, moderate expression of miR-27a-5p, miR-199b-3p, and miR-513a-5p, as well as a weak expression of miR-192-3p, miR-381-5p, and miR-6882-5p.

2.3. Sustained Effects of Vicadrostat on uEV miRNAs Four Weeks Post-Treatment

The changes in the pre-selected uEV miRNAs were measured at two additional time-points, namely week 6 and a follow-up visit 4 weeks after discontinuation of the study treatment (Figure 4). The changes in uEV expression profiles were not apparent after week 6 of treatment but sustained after 4 weeks of completion of 14 weeks of treatment with vicadrostathigh (Figure 4).

2.4. Functional Assessments of Treatment Effects

Established functions of the uEV miRNAs according to kidney diseases are summarized in Table 3.
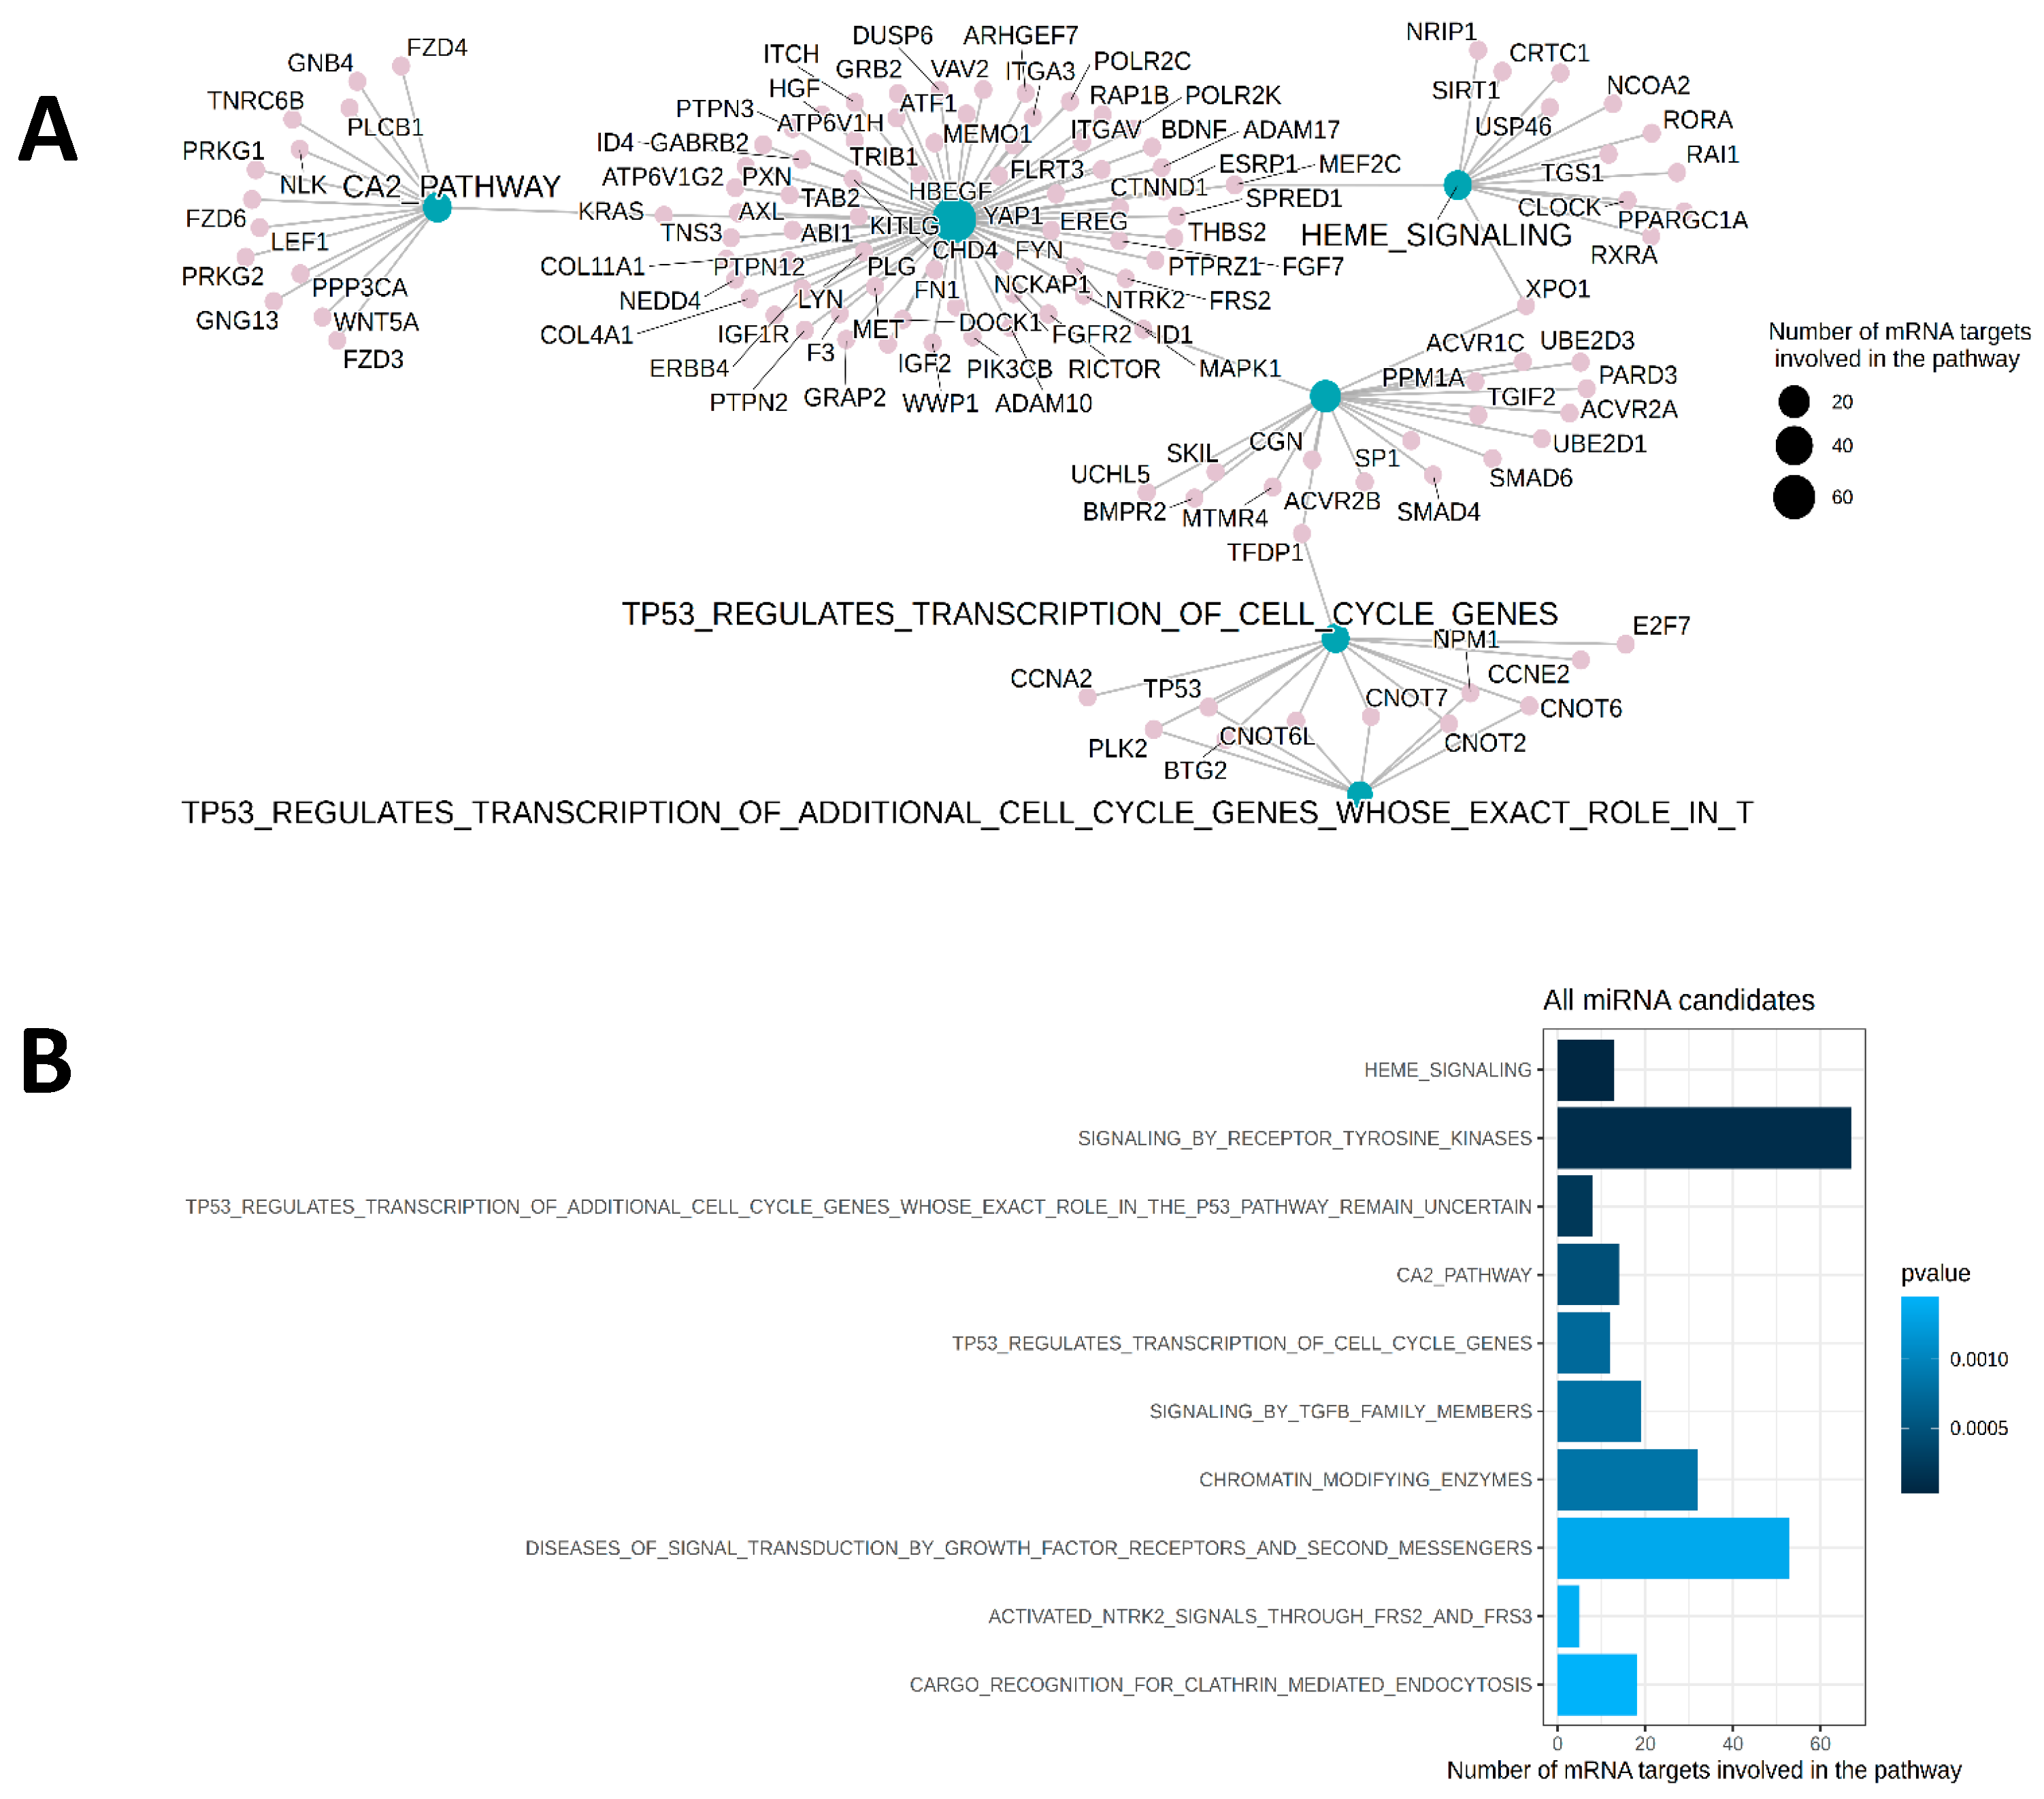
A pathway enrichment analysis with the predicted targetome of the miRNA candidates revealed that pathways such as TGF-beta signaling, heme signaling, and calcium signaling are significantly enriched (Figure 5A) with several direct target mRNAs that are involved in the regulation of the respective signaling pathways (Figure 5B).
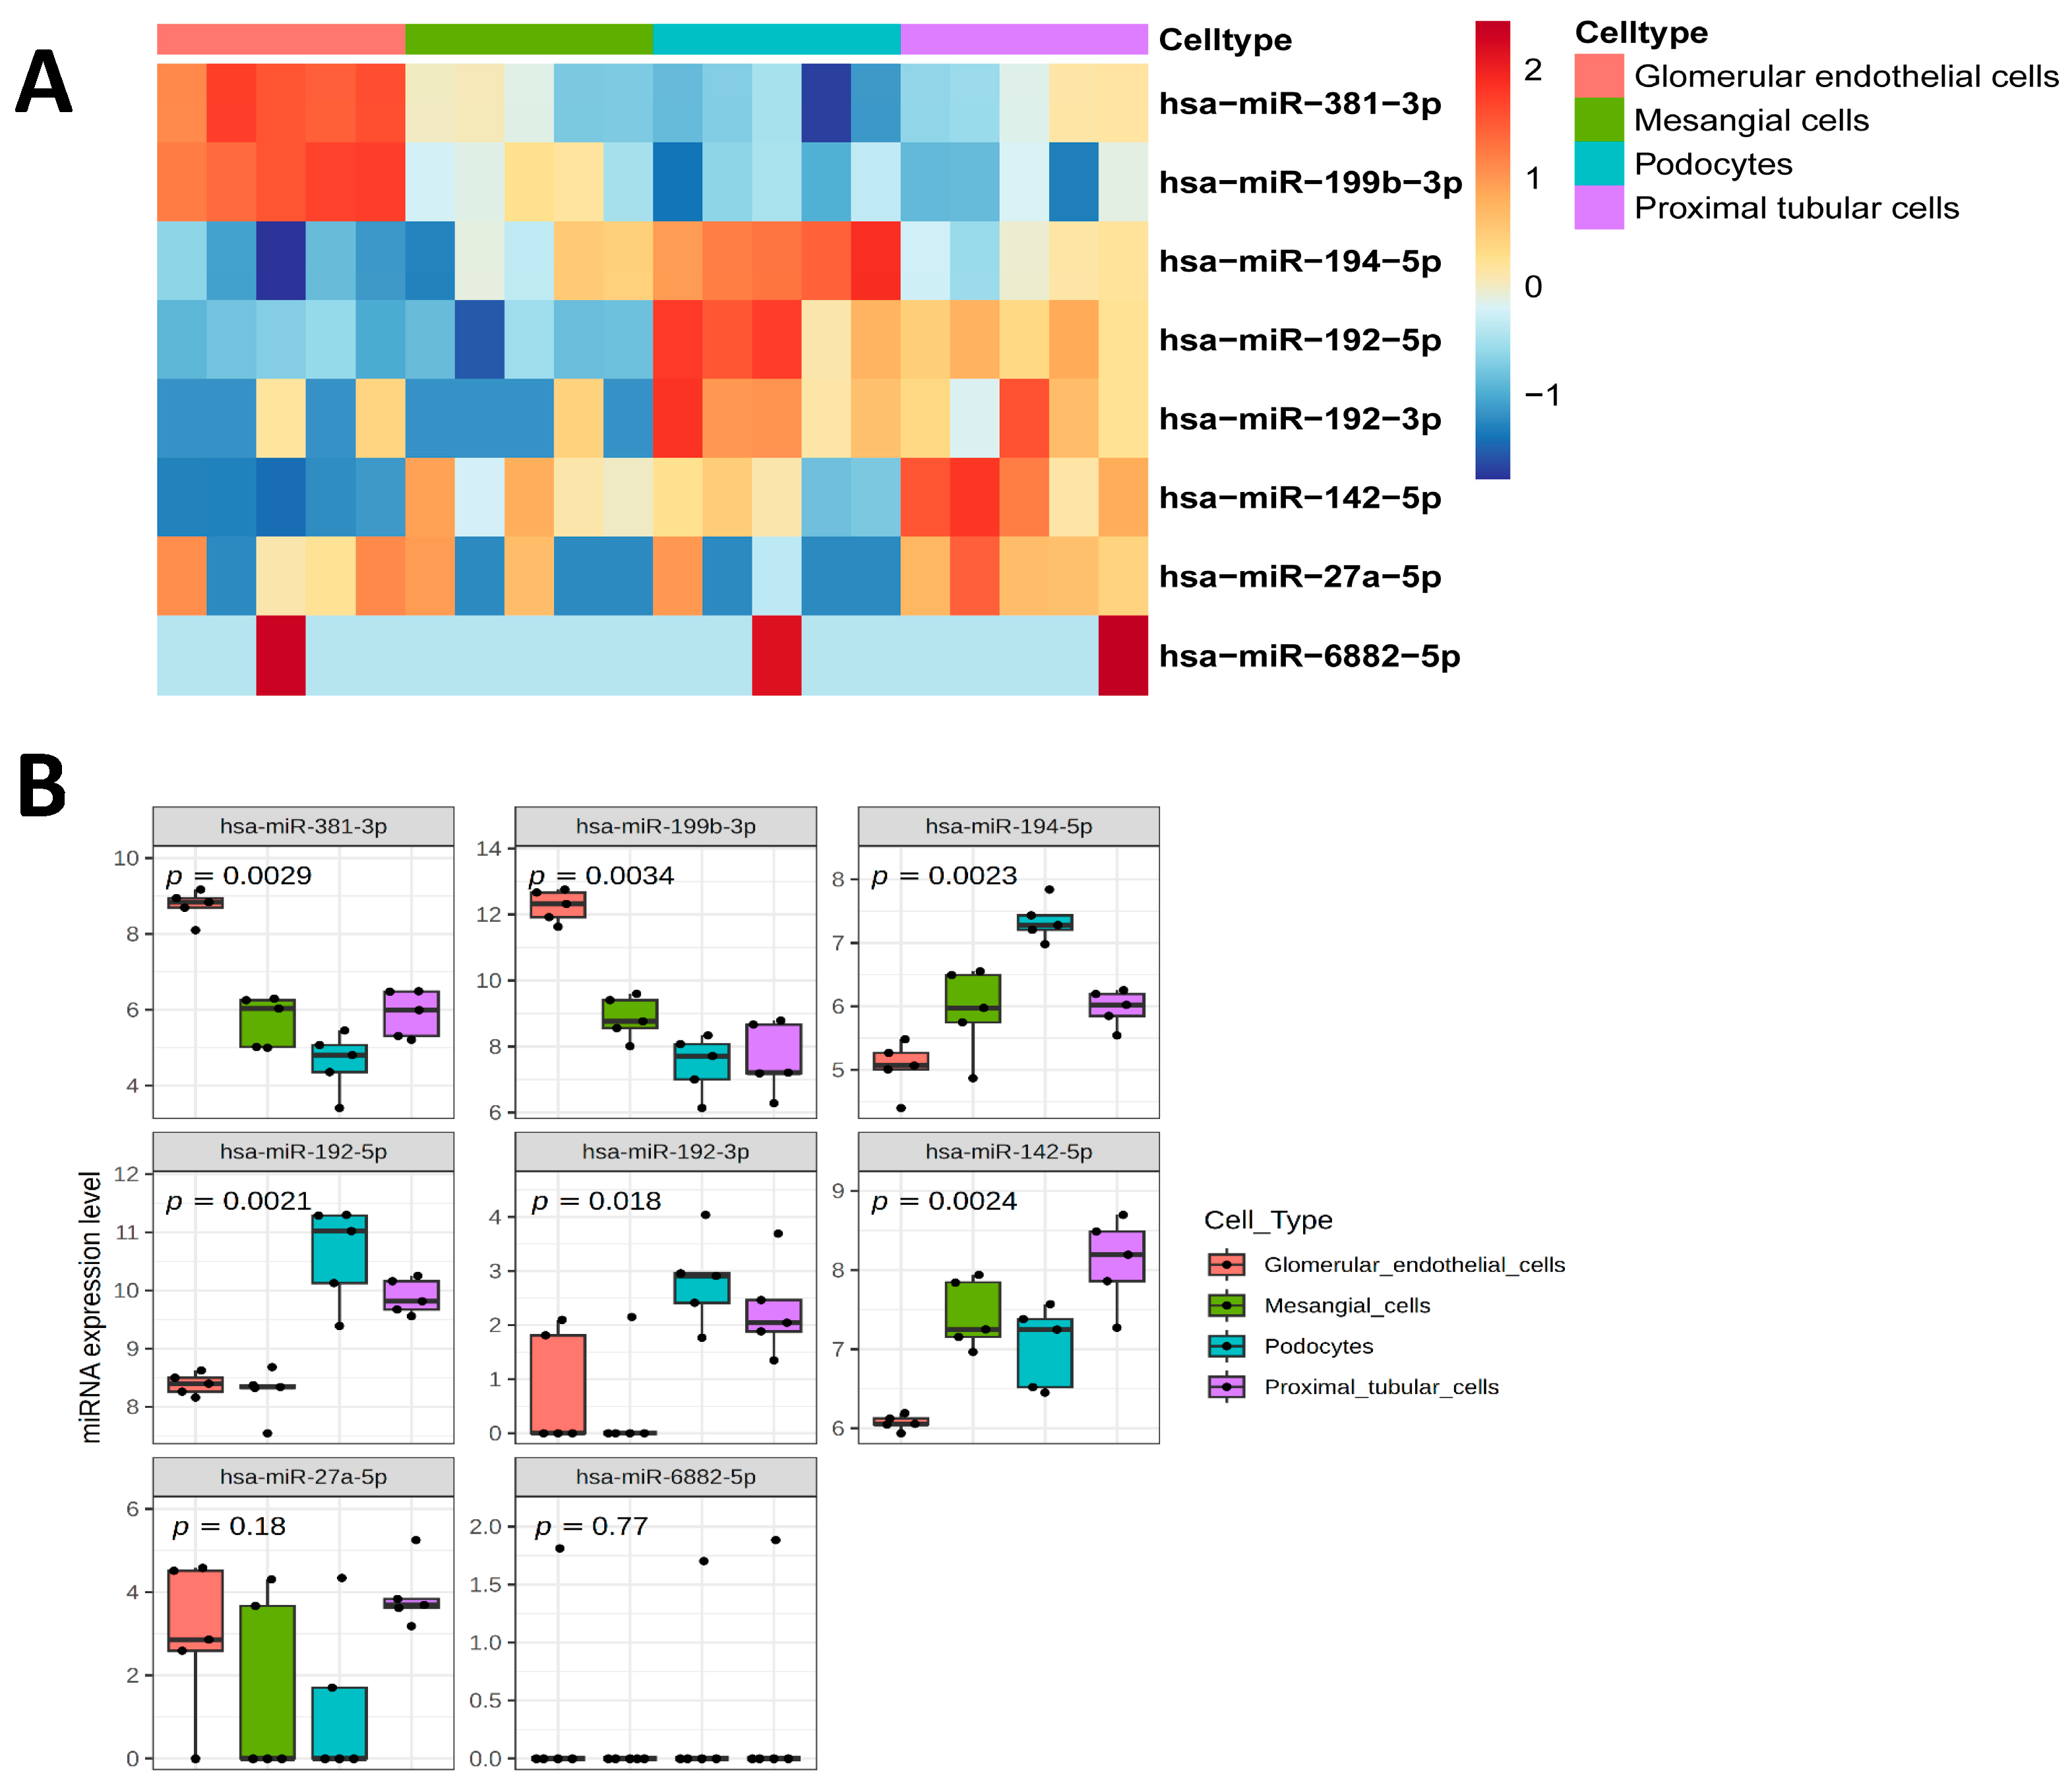
Using publicly available data for extracellular vesicle miRNAs obtained from human conditionally immortalized podocytes, glomerular endothelial cells, mesangial cells, and proximal tubular cells, we identified that miR-142-5p showed significantly higher expression in EVs that are reported to be derived from proximal tubular cells, mesangial cells, and podocytes compared to glomerular endothelial cells (Figure 6A,B). miR-192-5p and miR-194-5p are significantly enriched in podocytes and miR-381-3p and miR-199b-3p in glomerular endothelial cells, whereas miR-192-3p and miR-27a-5p are expressed in various kidney cell types (Figure 6B). miR-513a-5p and miR-6882-5p have not been linked previously to EVs of the analyzed kidney cells (Figure 6A,B).

2.5. Correlations of uEV miRNA Expression with UACR and eGFR

The changes in uEV miRNA expression levels after vicadrostathigh alone or vicadrostathigh plus empagliflozin treatment were not significantly correlated with baseline UACR and eGFR (Table S4). Conversely, baseline uEV miRNA levels did not associate with changes in UACR or eGFR (Table S5).

3. Discussion

Here we present unique pharmacological effects of three different treatments on uEV miRNAs in a population with CKD. We were able to differentiate potential mechanisms of the individual treatments and provide evidence for the additive effects of vicadrostat plus empagliflozin in CKD based on more pronounced effects on alterations in uEV miRNA levels. The trial design allowed for a direct comparison of the mechanistic effects of vicadrostat alone versus vicadrostat plus empagliflozin. This study focused on changes in miRNAs in patients who experienced more than a 30% reduction in UACR. From the regulated biomarkers, there was one miRNA (miR-142-5p) with a significant relationship to UACR changes on vicadrostat treatment, while eight miRNAs showed correlation to changes in UACR in patients on vicadrostat plus empagliflozin. This observation supports an overall benefit of combined treatment. Additionally, the changes in miRNA profiles were long-lasting, persisting 4 weeks after treatment, suggesting a sustained impact on pathogenic mechanisms like fibrosis and inflammation.
In general, miRNAs are protected from degradation through encapsulation in microvesicles such as exosomes. Urine is rich in exosomes, which are secreted by cells from all nephron segments. Due to mechanical and charge barriers in the glomerulus, circulating microvesicles from serum cannot cross the nephron, suggesting that urinary exosomes originate primarily from kidney cells [21]. High expression levels of targeted miRNAs are present in various kidney cells, suggesting that vicadrostat plus empagliflozin treatment may affect different cell types, and as such, could offer a therapeutic option for diverse CKD etiologies. This is further supported by similar baseline expression patterns of targeted miRNAs across different CKD subgroups including diabetes, hypertension, and glomerular diseases.
Urinary exosomal miRNAs have been considered as potential biomarkers for disease activity in CKD, reflecting specific characteristics of kidney cells. Although their diagnostic and prognostic properties have been recently reported [36], there is limited information on their utility for monitoring treatment. All treatments regulated miR-192-3p, a marker associated with diabetic kidney disease [36], and that has shown high diagnostic accuracy, with 89% sensitivity and specificity [37]. Empagliflozin, vicadrostat, and vicadrostat plus empagliflozin treatments, individually and combined, effectively reduce albuminuria and regulate miR-192-3p independently of diabetes status in the present study. Mechanistically, miR-192 contributes to kidney disease by forming a TGF-β-induced positive feedback loop with p53, suppressing Zeb2, and promoting kidney fibrosis, while its inhibition or deletion reduces these pathological features [38]. In a previous preclinical study, empagliflozin treatment significantly improved kidney function and reduced interstitial fibrosis in 5/6 nephrectomy rats [39]. scRNA-seq revealed that empagliflozin modulated the TGF-β signaling pathway, inhibited intercellular communication, and reduced the expression of fibrotic genes such as Col4a1 or Fn1 [40] that are associated with miR-192-mediated TGF-beta/SMAD3-driven renal fibrosis [41]. Moreover, treatment with the locked nucleic acid-anti-miRNA-192 reduced kidney fibrosis and proteinuria in diabetic mice [41]. Treatment with vicadrostat plus empagliflozin also resulted in decreased levels of the pro-fibrotic miR-194-5p. Urinary exosomal miR-194-5p was upregulated >3-fold compared to controls in children with nephrotic syndrome and correlated with the degree of proteinuria [42]. The levels of miR-194-5p decreased in parallel with proteinuria reduction when children were treated by immunosuppression [42].
Immunomodulatory effects were also apparent by uEV miRNAs with vicadrostat plus empagliflozin treatment, in addition to the vicadrostat effects associated with fibrosis. A decreased level of the oncogenic miRNA-381-3p, which is a dual suppressor of TNF-induced apoptosis and necroptosis that promotes the proliferation of kidney cancer cells, was observed [29]. Vicadrostat plus empagliflozin treatment also reduced the uEV miR-27a-5p level, which is involved in the regulation of NF-kB signaling [28].
This study has several notable limitations. The clinical trial was conducted at 204 sites in 29 countries [22]. While urine sampling adhered to a standardized protocol, variability in procedural conduct is possible [43]. Furthermore, novel methodologies are required for absolute quantification of uEV miRNA levels. Nevertheless, the informative results obtained from uEV miRNA profiling indicate overall robustness of EV extraction and RNA sequencing. Although this study offers potential mechanistic insights into vicadrostat and empagliflozin treatments, the newly identified biomarkers are not intended to monitor treatment response without further research and validation. Finally, the 8-week run-in period for empagliflozin randomization might have affected uEV miRNAs. Overall, these limitations resulted in a rather weak correlation between the identified miRNAs and UACR. Nevertheless, the robust expression of miR-142-5p, miR-192-5p, and miR-194-5p, with low 95% confidence intervals, offer potential as mechanistic biomarkers for future studies.
In conclusion, our findings demonstrate that uEV miRNAs were responsive to a CKD treatment intervention and reflected distinct mechanistic potential for the effects of vicadrostat, empagliflozin, or their combination in a broad range of kidney cell types. The robust and sustained modulation of miRNA profiles, especially under vicadrostat plus empagliflozin treatment, highlights their potential use as biomarkers for disease activity and treatment response in CKD.

4. Materials and Methods

4.1. Clinical Trial

Participants (male and female) with CKD, with or without T2D, were initially randomized to receive empagliflozin 10 mg once daily or a matched placebo, alongside RAS inhibition, for an 8-week run-in period [22]. Subsequently, participants underwent a second randomization baseline to receive vicadrostat (3 mg, 10 mg, or 20 mg once daily) or a matched placebo for 14 weeks, followed by a 4-week follow-up. The primary outcome was the change in UACR in the first morning void urine (FMV) from baseline to week 14. The main secondary outcome was a decrease in UACRFMV of ≥30% from baseline after 14 weeks. Additional outcomes included changes in estimated glomerular filtration rate (eGFR), blood pressure, and serum potassium from baseline to week 14. Of the 586 participants randomized at baseline, 452 participants completed the study [8]. Urinary samples available from 435 patients were included in the miRNA assessment, from which sets (minimum at baseline and end of treatment) were available for 412 patients.

4.2. Urinary EV Small RNA Sequencing

Spot urine samples (9 mL) were collected and stored immediately at −20 °C. Urine samples were centrifuged for 10 min at 16,000× g and 4 °C before RNA isolation. No freeze–thaw cycles were included. uEV miRNAs were isolated using the exoRNeasy Serum/Plasma Maxi Kit (Qiagen, Hilden, Germany). Characterization of EVs was previously described [44,45]. miRNA libraries were prepared using the QIAseq miRNA Library Kit (Qiagen, Hilden, Germany) following the manufacturer’s protocol, starting with ∼1 ng of input RNA for each sample. Quality control and concentrations of individual libraries were assessed using a Bioanalyzer 2100 Instrument and High Sensitivity DNA Kit (Agilent Technologies, Santa Clara, CA, USA). A miRNA-sized library is approximately 200 bp, and libraries were diluted to 4 nM. Small RNA sequencing was performed on the Illumina NovaSeq 6000 platform (Illumina Inc., San Diego, CA, USA) as 85 bp cycle single-end read. Ten million reads per sample were used as the cut-off.

4.3. Bioinfomatic Analysis

Exploratory analyses of changes in miRNA expression levels over time were performed to identify differentially expressed miRNAs (Figure S1). Preprocessing of the data (quality check, adapter trimming, reads alignment, miRNA reads quantification, quality control metrics) was performed using nf-core/smrnaseq: v2.3.1-g5901bea from Nextflow: 23.10.1. Exploratory analyses of changes in miRNA expression levels over time were performed to identify differentially expressed miRNAs. This analysis was conducted using the limma package [46]. Briefly, only miRNAs with counts per million (CPM) >= 1 in at least half the samples in at least one subgroup were included in the analysis. Data were normalized using the TMM method described by Robinson and Oshlack and voom-transformed [47]. To account for correlation between subjects, the duplicateCorrelation function was used with subject as a blocking factor, a linear model was fit using the lmFit-function and, finally, moderated t-statistics were computed to derive the log2 fold change. miRNAs were reported as differentially expressed if the fold-change was ≥1.5 and p ≤ 0.01.

4.4. Statistical Analysis

Correlation analysis was conducted to examine the relationship between miRNA expression and the UACR percentage change from baseline to end of treatment (EoT). Statistical analysis was performed using Spearman’s rank correlation. MiRNA expression at baseline was compared across the disease subgroups: diabetic kidney disease (type 2 diabetes), glomerular disease (FSGS, IgAN, MN), and hypertensive disease was performed using the Wilcoxon rank-sum test. Group comparisons over time were performed using a paired Wilcoxon rank-sum test. The enrichment analysis was performed using this R package:clusterProfiler 4.0: A universal enrichment tool for interpreting omics data: The Innovation. Predicted mRNA targets from the miRNA candidates were obtained from MSigDB (Molecular Signature Database) using the filters msigdbr (species = “human”, category = “C3”, subcategory = “MIRDB”) [48,49]. Universe is defined as a list of all predicted mRNA targets for all annotated miRNAs in the MSigDB. Cell type-specific expression was evaluated using publicly available data for human conditionally immortalized podocytes, glomerular endothelial cells, mesangial cells, and proximal tubular cells (PTCs) (PRJNA905899) [14].

Supplementary Materials

The following supporting information can be downloaded at https://www.mdpi.com/article/10.3390/ijms262210810/s1.

Author Contributions

Conceptualization: D.D. and I.G.; Methodology: D.D. and I.D.-F.; Formal Analysis: D.D., I.G. and I.D.-F.; Investigation: D.D., I.G., L.C., S.J.H., P.R. and K.R.T.; Visualization: D.D., I.G. and I.D.-F.; Writing—Original Draft Preparation: D.D., I.G. and K.R.T.; Writing—Review and Editing: All authors have read and agreed to the published version of the manuscript.

Funding

This study was supported and funded by Boehringer Ingelheim.

Institutional Review Board Statement

The principles of the Declaration of Helsinki and the International Council for Harmonisation’s Good Clinical Practice guidelines, as well as applicable regulatory requirements, were followed. Independent ethics committees or institutional review boards reviewed the clinical trial materials and approved participating centers. The institutional review boards and independent ethics committees that approved the study protocol are listed in Supplementary Table S6. The trial was registered at ClinicalTrials.gov with registration number: NCT05182840.

Informed Consent Statement

Informed consent was obtained from all subjects involved in the study.

Data Availability Statement

To ensure the independent interpretation of clinical study results and enable authors to fulfill their role and obligations under the International Committee of Medical Journal Editors criteria, Boehringer Ingelheim grants all external authors access to relevant clinical study data. In adherence with the Boehringer Ingelheim policy on transparency and publication of clinical study data, scientific and medical researchers can request access to clinical study data, typically, 1 year after the approval has been granted by major regulatory authorities or after termination of the development program. Researchers should use the https://vivli.org/ (accessed on 15 September 2025) link to request access to study data and visit www.mystudywindow.com/msw/datasharing (accessed on 15 September 2025) for further information.

Acknowledgments

Sibylle J. Hauske, one of the co-authors of this manuscript, sadly passed away on 26 June 2025. Hauske made substantial contributions to the conception and design of the study, as well as to the interpretation of the data. In accordance with the International Committee of Medical Journal Editors authorship guidelines, we respectfully include Hauske as a co-author. The remaining authors take full responsibility for the integrity and accuracy of the work presented. The authors thank Marcel Rorsel, Christian Wohnhaas, and Jessica Landler for technical assistance and Manuel Kuhn and Daniel Schreyer for bioinformatic support, including the code review and statistical quality check. The authors meet the criteria for authorship as recommended by the International Committee of Medical Journal Editors (ICMJE), as supported by the Good Publication Practice (GPP) guidelines. The authors did not receive payment related to the development of the manuscript. Debra Brocksmith MB ChB, PhD of Envision Ignite, an Envision Medical Communications agency, a part of Envision Pharma Group, provided editorial and formatting support, which was contracted and funded by Boehringer Ingelheim. Boehringer Ingelheim was given the opportunity to review the manuscript for medical and scientific accuracy, as well as intellectual property considerations.

Conflicts of Interest

D.D., I.G., L.C., and S.J.H. are employees of Boehringer Ingelheim (S.J.H. deceased). I.D.-F. is an external employee and contracted by Boehringer Ingelheim. P.R. declares consultancy and/or speaker’s fees (to his institution) from Abbott, Astellas, AstraZeneca, Bayer, Boehringer Ingelheim, Eli Lilly, Gilead, MSD, Novo Nordisk, Sanofi, and Vifor Pharma, and research grants from AstraZeneca, Bayer, and Novo Nordisk. K.R.T. declares research grants from the National Institutes of Health and Travere Therapeutics, and consultancy and/or speaker’s fees from Bayer, Boehringer Ingelheim, Eli Lilly, and Novo Nordisk.

References

  1. Xie, Y.; Bowe, B.; Mokdad, A.H.; Xian, H.; Yan, Y.; Li, T.; Maddukuri, G.; Tsai, C.Y.; Floyd, T.; Al-Aly, Z. Analysis of the Global Burden of Disease study highlights the global, regional, and national trends of chronic kidney disease epidemiology from 1990 to 2016. Kidney Int. 2018, 94, 567–581. [Google Scholar] [CrossRef]
  2. Bikbov, B.; Purcell, C.A.; Levey, A.S.; Smith, M.; Abdoli, A.; Abebe, M.; Adebayo, O.M.; Afarideh, M.; Agarwal, S.K.; Agudelo-Botero, M.; et al. Global, regional, and national burden of chronic kidney disease, 1990–2017: A systematic analysis for the Global Burden of Disease Study 2017. Lancet 2020, 395, 709–733. [Google Scholar] [CrossRef]
  3. Deng, L.; Guo, S.; Liu, Y.; Zhou, Y.; Liu, Y.; Zheng, X.; Yu, X.; Shuai, P. Global, regional, and national burden of chronic kidney disease and its underlying etiologies from 1990 to 2021: A systematic analysis for the Global Burden of Disease Study 2021. BMC Public Health 2025, 25, 636. [Google Scholar] [CrossRef]
  4. Foreman, K.J.; Marquez, N.; Dolgert, A.; Fukutaki, K.; Fullman, N.; McGaughey, M.; Pletcher, M.A.; Smith, A.E.; Tang, K.; Yuan, C.W.; et al. Forecasting life expectancy, years of life lost, and all-cause and cause-specific mortality for 250 causes of death: Reference and alternative scenarios for 2016–40 for 195 countries and territories. Lancet 2018, 392, 2052–2090. [Google Scholar] [CrossRef] [PubMed]
  5. Francis, A.; Harhay, M.N.; Ong, A.C.M.; Tummalapalli, S.L.; Ortiz, A.; Fogo, A.B.; Fliser, D.; Roy-Chaudhury, P.; Fontana, M.; Nangaku, M.; et al. Chronic kidney disease and the global public health agenda: An international consensus. Nat. Rev. Nephrol. 2024, 20, 473–485. [Google Scholar] [CrossRef]
  6. Rossing, P.; Caramori, M.L.; Chan, J.C.N.; Heerspink, H.J.L.; Hurst, C.; Khunti, K.; Liew, A.; Michos, E.D.; Navaneethan, S.D.; Olowu, W.A.; et al. Executive summary of the KDIGO 2022 Clinical Practice Guideline for Diabetes Management in Chronic Kidney Disease: An update based on rapidly emerging new evidence. Kidney Int. 2022, 102, 990–999. [Google Scholar] [CrossRef]
  7. Gilligan, S.; Raphael, K.L. Hyperkalemia and hypokalemia in CKD: Prevalence, risk factors, and clinical outcomes. Adv. Chronic Kidney Dis. 2017, 24, 315–318. [Google Scholar] [CrossRef]
  8. Rossignol, P.; Ruilope, L.M.; Cupisti, A.; Ketteler, M.; Wheeler, D.C.; Pignot, M.; Cornea, G.; Schulmann, T.; Lund, L.H. Recurrent hyperkalaemia management and use of renin-angiotensin-aldosterone system inhibitors: A European multi-national targeted chart review. Clin. Kidney J. 2020, 13, 714–719. [Google Scholar] [CrossRef] [PubMed]
  9. Epstein, M.; Kovesdy, C.P.; Clase, C.M.; Sood, M.M.; Pecoits-Filho, R. Aldosterone, mineralocorticoid receptor activation, and CKD: A review of evolving treatment paradigms. Am. J. Kidney Dis. 2022, 80, 658–666. [Google Scholar] [CrossRef] [PubMed]
  10. Tuttle, K.R.; Hauske, S.J.; Canziani, M.E.; Caramori, M.L.; Cherney, D.; Cronin, L.; Heerspink, H.J.L.; Hugo, C.; Nangaku, M.; Rotter, R.C.; et al. Efficacy and safety of aldosterone synthase inhibition with and without empagliflozin for chronic kidney disease: A randomised, controlled, phase 2 trial. Lancet 2024, 403, 379–390. [Google Scholar] [CrossRef] [PubMed]
  11. Agborbesong, E.; Bissler, J.; Li, X. Liquid Biopsy at the Frontier of Kidney Diseases: Application of Exosomes in Diagnostics and Therapeutics. Genes 2023, 14, 1367. [Google Scholar] [CrossRef] [PubMed]
  12. Hall, J.S.; Taylor, J.; Valentine, H.R.; Irlam, J.J.; Eustace, A.; Hoskin, P.J.; Miller, C.J.; West, C.M. Enhanced stability of microRNA expression facilitates classification of FFPE tumour samples exhibiting near total mRNA degradation. Br. J. Cancer. 2012, 107, 684–694. [Google Scholar] [CrossRef] [PubMed]
  13. Trionfini, P.; Benigni, A.; Remuzzi, G. MicroRNAs in kidney physiology and disease. Nat. Rev. Nephrol. 2015, 11, 23–33. [Google Scholar] [CrossRef]
  14. Liu, Z.; Fu, Y.; Yan, M.; Zhang, S.; Cai, J.; Chen, G.; Dong, Z. microRNAs in kidney diseases: Regulation, therapeutics, and biomarker potential. Pharmacol. Ther. 2024, 262, 108709. [Google Scholar] [CrossRef]
  15. Erdbrügger, U.; Le, T.H. Extracellular Vesicles in Renal Diseases: More than Novel Biomarkers? J. Am. Soc. Nephrol. 2016, 27, 12–26. [Google Scholar] [CrossRef]
  16. Ramezani, A.; Devaney, J.M.; Cohen, S.; Wing, M.R.; Scott, R.; Knoblach, S.; Singhal, R.; Howard, L.; Kopp, J.B.; Raj, D.S. Circulating and urinary microRNA profile in focal segmental glomerulosclerosis: A pilot study. Eur. J. Clin. Investig. 2015, 45, 394–404. [Google Scholar] [CrossRef]
  17. Sun, Y.; Liu, S.; Ding, W.; Zhu, C.; Jiang, G.; Li, H. Recent Advances in miRNA Biomarkers for Diagnosis and Prognosis of Focal Segmental Glomerulosclerosis. Kidney Dis. 2025, 11, 283–291. [Google Scholar] [CrossRef]
  18. Barutta, F.; Tricarico, M.; Corbelli, A.; Annaratone, L.; Pinach, S.; Grimaldi, S.; Bruno, G.; Cimino, D.; Taverna, D.; Deregibus, M.C.; et al. Urinary exosomal micro-RNAs in incipient diabetic nephropathy. PLoS ONE 2013, 8, e73798. [Google Scholar] [CrossRef] [PubMed]
  19. Delić, D.; Eisele, C.; Schmid, R.; Baum, P.; Wiech, F.; Gerl, M.; Zimdahl, H.; Pullen, S.S.; Urquhart, R. Urinary Exosomal miRNA Signature in Type II Diabetic Nephropathy Patients. PLoS ONE 2016, 11, e0150154. [Google Scholar] [CrossRef]
  20. Lee, C.C.; Chen, C.C.; Hsu, C.K.; Chen, Y.T.; Chen, C.Y.; Yang, K.J.; Hung, M.J.; Wu, I.W. Urinary microRNA in Diabetic Kidney Disease: A Literature Review. Medicina 2023, 59, 354. [Google Scholar] [CrossRef]
  21. Barreiro, K.; Lay, A.C.; Leparc, G.; Tran, V.D.T.; Rosler, M.; Dayalan, L.; Burdet, F.; Ibberson, M.; Coward, R.J.M.; Huber, T.B.; et al. An in vitro approach to understand contribution of kidney cells to human urinary extracellular vesicles. J. Extracell. Vesicles 2023, 12, e12304. [Google Scholar] [CrossRef]
  22. Tuttle, K.R.; Rossing, P.; Hauske, S.J.; Cronin, L.; Hussain, J.; de Zeeuw, D.; Heerspink, H.J.L. Methods Article for a Study Protocol: Study Design and Baseline Characteristics for Aldosterone Synthase Inhibition in Chronic Kidney Disease. Am. J. Nephrol. 2024, 55, 262–272. [Google Scholar] [CrossRef] [PubMed]
  23. Ren, F.J.; Yao, Y.; Cai, X.Y.; Fang, G.Y. Emerging Role of MiR-192-5p in Human Diseases. Front. Pharmacol. 2021, 12, 614068. [Google Scholar] [CrossRef] [PubMed]
  24. Puppo, M.; Bucci, G.; Rossi, M.; Giovarelli, M.; Bordo, D.; Moshiri, A.; Gorlero, F.; Gherzi, R.; Briata, P. miRNA-Mediated KHSRP Silencing Rewires Distinct Post-transcriptional Programs during TGF-β-Induced Epithelial-to-Mesenchymal Transition. Cell Rep. 2016, 16, 967–978. [Google Scholar] [CrossRef] [PubMed]
  25. Jia, Y.; Guan, M.; Zheng, Z.; Zhang, Q.; Tang, C.; Xu, W.; Xiao, Z.; Wang, L.; Xue, Y. miRNAs in Urine Extracellular Vesicles as Predictors of Early-Stage Diabetic Nephropathy. J. Diabetes Res. 2016, 2016, 7932765. [Google Scholar] [CrossRef]
  26. Jenkins, R.H.; Martin, J.; Phillips, A.O.; Bowen, T.; Fraser, D.J. Transforming growth factor β1 represses proximal tubular cell microRNA-192 expression through decreased hepatocyte nuclear factor DNA binding. Biochem. J. 2012, 443, 407–416. [Google Scholar] [CrossRef]
  27. Zhang, Y.; Qian, B.; Yang, Y.; Niu, F.; Lin, C.; Yuan, H.; Wang, J.; Wu, T.; Shao, Y.; Shao, S.; et al. Visceral Adipocyte-Derived Extracellular Vesicle miR-27a-5p Elicits Glucose Intolerance by Inhibiting Pancreatic β-Cell Insulin Secretion. Diabetes. 2024, 73, 1832–1847. [Google Scholar] [CrossRef]
  28. Romay, M.C.; Che, N.; Becker, S.N.; Pouldar, D.; Hagopian, R.; Xiao, X.; Lusis, A.J.; Berliner, J.A.; Civelek, M. Regulation of NF-κB signaling by oxidized glycerophospholipid and IL-1β induced miRs-21-3p and -27a-5p in human aortic endothelial cells. J. Lipid Res. 2015, 56, 38–50. [Google Scholar] [CrossRef]
  29. Zhao, C.; Zhou, Y.; Ran, Q.; Yao, Y.; Zhang, H.; Ju, J.; Yang, T.; Zhang, W.; Yu, X.; He, S. MicroRNA-381-3p Functions as a Dual Suppressor of Apoptosis and Necroptosis and Promotes Proliferation of Renal Cancer Cells. Front. Cell. Dev. Biol. 2020, 8, 290. [Google Scholar] [CrossRef]
  30. Zhou, G.; Zhang, X.; Wang, W.; Zhang, W.; Wang, H.; Xin, G. Both Peripheral Blood and Urinary miR-195-5p, miR-192-3p, miR-328-5p and Their Target Genes PPM1A, RAB1A and BRSK1 May Be Potential Biomarkers for Membranous Nephropathy. Med. Sci. Monit. 2019, 25, 1903–1916. [Google Scholar] [CrossRef]
  31. Ali, H.; Malik, M.Z.; Abu-Farha, M.; Abubaker, J.; Cherian, P.; Nizam, R.; Jacob, S.; Bahbahani, Y.; Naim, M.; Ahmad, S.; et al. Global analysis of urinary extracellular vesicle small RNAs in autosomal dominant polycystic kidney disease. J. Gene Med. 2024, 26, e3674. [Google Scholar] [CrossRef]
  32. Miao, X.; Tian, Y.; Wu, L.; Zhao, H.; Liu, J.; Gao, F.; Zhang, W.; Liu, Q.; Guo, H.; Yang, L.; et al. CircRTN4 aggravates mesangial cell dysfunction by activating the miR-513a-5p/FN axis in lupus nephritis. Lab. Investig. 2022, 102, 966–978. [Google Scholar] [CrossRef] [PubMed]
  33. Gholaminejad, A.; Abdul Tehrani, H.; Gholami Fesharaki, M. Identification of candidate microRNA biomarkers in renal fibrosis: A meta-analysis of profiling studies. Biomarkers 2018, 23, 713–724. [Google Scholar] [CrossRef]
  34. Su, S.; Zhao, Q.; He, C.; Huang, D.; Liu, J.; Chen, F.; Chen, J.; Liao, J.Y.; Cui, X.; Zeng, Y.; et al. miR-142-5p and miR-130a-3p are regulated by IL-4 and IL-13 and control profibrogenic macrophage program. Nat. Commun. 2015, 6, 8523. [Google Scholar] [CrossRef] [PubMed]
  35. Talebi, F.; Ghorbani, S.; Chan, W.F.; Boghozian, R.; Masoumi, F.; Ghasemi, S.; Vojgani, M.; Power, C.; Noorbakhsh, F. MicroRNA-142 regulates inflammation and T cell differentiation in an animal model of multiple sclerosis. J. Neuroinflammation 2017, 14, 55. [Google Scholar] [CrossRef] [PubMed]
  36. Mahtal, N.; Lenoir, O.; Tinel, C.; Anglicheau, D.; Tharaux, P.L. MicroRNAs in kidney injury and disease. Nat. Rev. Nephrol. 2022, 18, 643–662. [Google Scholar] [CrossRef]
  37. Garmaa, G.; Nagy, R.; Kói, T.; Uyen Nguyen, D.T.; Gergő, D.; Kleiner, D.; Csupor, D.; Hegyi, P.; Kökény, G. Panel miRNAs are potential diagnostic markers for chronic kidney diseases: A systematic review and meta-analysis. BMC Nephrol. 2024, 25, 261. [Google Scholar] [CrossRef]
  38. Deshpande, S.D.; Putta, S.; Wang, M.; Lai, J.Y.; Bitzer, M.; Nelson, R.G.; Lanting, L.L.; Kato, M.; Natarajan, R. Transforming growth factor-β-induced cross talk between p53 and a microRNA in the pathogenesis of diabetic nephropathy. Diabetes. 2013, 62, 3151–3162. [Google Scholar] [CrossRef]
  39. Lei, L.; Xiang, Y.X.; Luo, M.L.; Zhang, Z.Y.; Wu, H.W.; Tang, C.; Cui, T.J.; Zhang, X.M.; Wang, X.H.; Delic, D.; et al. Intercellular Communication Network of CellChat Uncovers Mechanisms of Kidney Fibrosis Based on Single-Cell RNA Sequencing. Kidney Blood Press. Res. 2025, 50, 276–299. [Google Scholar] [CrossRef]
  40. Chung, A.C.; Huang, X.R.; Meng, X.; Lan, H.Y. miR-192 mediates TGF-beta/Smad3-driven renal fibrosis. J. Am. Soc. Nephrol. 2010, 21, 1317–1325. [Google Scholar] [CrossRef]
  41. Putta, S.; Lanting, L.; Sun, G.; Lawson, G.; Kato, M.; Natarajan, R. Inhibiting microRNA-192 ameliorates renal fibrosis in diabetic nephropathy. J. Am. Soc. Nephrol. 2012, 23, 458–469. [Google Scholar] [CrossRef] [PubMed]
  42. Chen, T.; Wang, C.; Yu, H.; Ding, M.; Zhang, C.; Lu, X.; Zhang, C.Y.; Zhang, C. Increased urinary exosomal microRNAs in children with idiopathic nephrotic syndrome. EBioMedicine 2019, 39, 552–561. [Google Scholar] [CrossRef] [PubMed]
  43. Zhang, Y.; Lan, M.; Chen, Y. Minimal Information for Studies of Extracellular Vesicles (MISEV): Ten-Year Evolution (2014–2023). Pharmaceutics 2024, 16, 1394. [Google Scholar] [CrossRef]
  44. Enderle, D.; Spiel, A.; Coticchia, C.M.; Berghoff, E.; Mueller, R.; Schlumpberger, M.; Sprenger-Haussels, M.; Shaffer, J.M.; Lader, E.; Skog, J.; et al. Characterization of RNA from Exosomes and Other Extracellular Vesicles Isolated by a Novel Spin Column-Based Method. PLoS ONE 2015, 10, e0136133. [Google Scholar] [CrossRef]
  45. Buschmann, D.; Kirchner, B.; Hermann, S.; Märte, M.; Wurmser, C.; Brandes, F.; Kotschote, S.; Bonin, M.; Steinlein, O.K.; Pfaffl, M.W.; et al. Evaluation of serum extracellular vesicle isolation methods for profiling miRNAs by next-generation sequencing. J. Extracell. Vesicles 2018, 7, 1481321. [Google Scholar] [CrossRef]
  46. Ritchie, M.E.; Phipson, B.; Wu, D.; Hu, Y.; Law, C.W.; Shi, W.; Smyth, G.K. limma powers differential expression analyses for RNA-sequencing and microarray studies. Nucleic Acids Res. 2015, 43, e47. [Google Scholar] [CrossRef] [PubMed]
  47. Robinson, M.D.; Oshlack, A. A scaling normalization method for differential expression analysis of RNA-seq data. Genome Biol. 2010, 11, R25. [Google Scholar] [CrossRef] [PubMed]
  48. Chen, Y.; Wang, X. miRDB: An online database for prediction of functional microRNA targets. Nucleic Acids Res. 2020, 48(D1), D127–D131. [Google Scholar] [CrossRef] [PubMed]
  49. Liu, W.; Wang, X. Prediction of functional microRNA targets by integrative modeling of microRNA binding and target expression data. Genome Biol. 2019, 20, 18. [Google Scholar] [CrossRef]
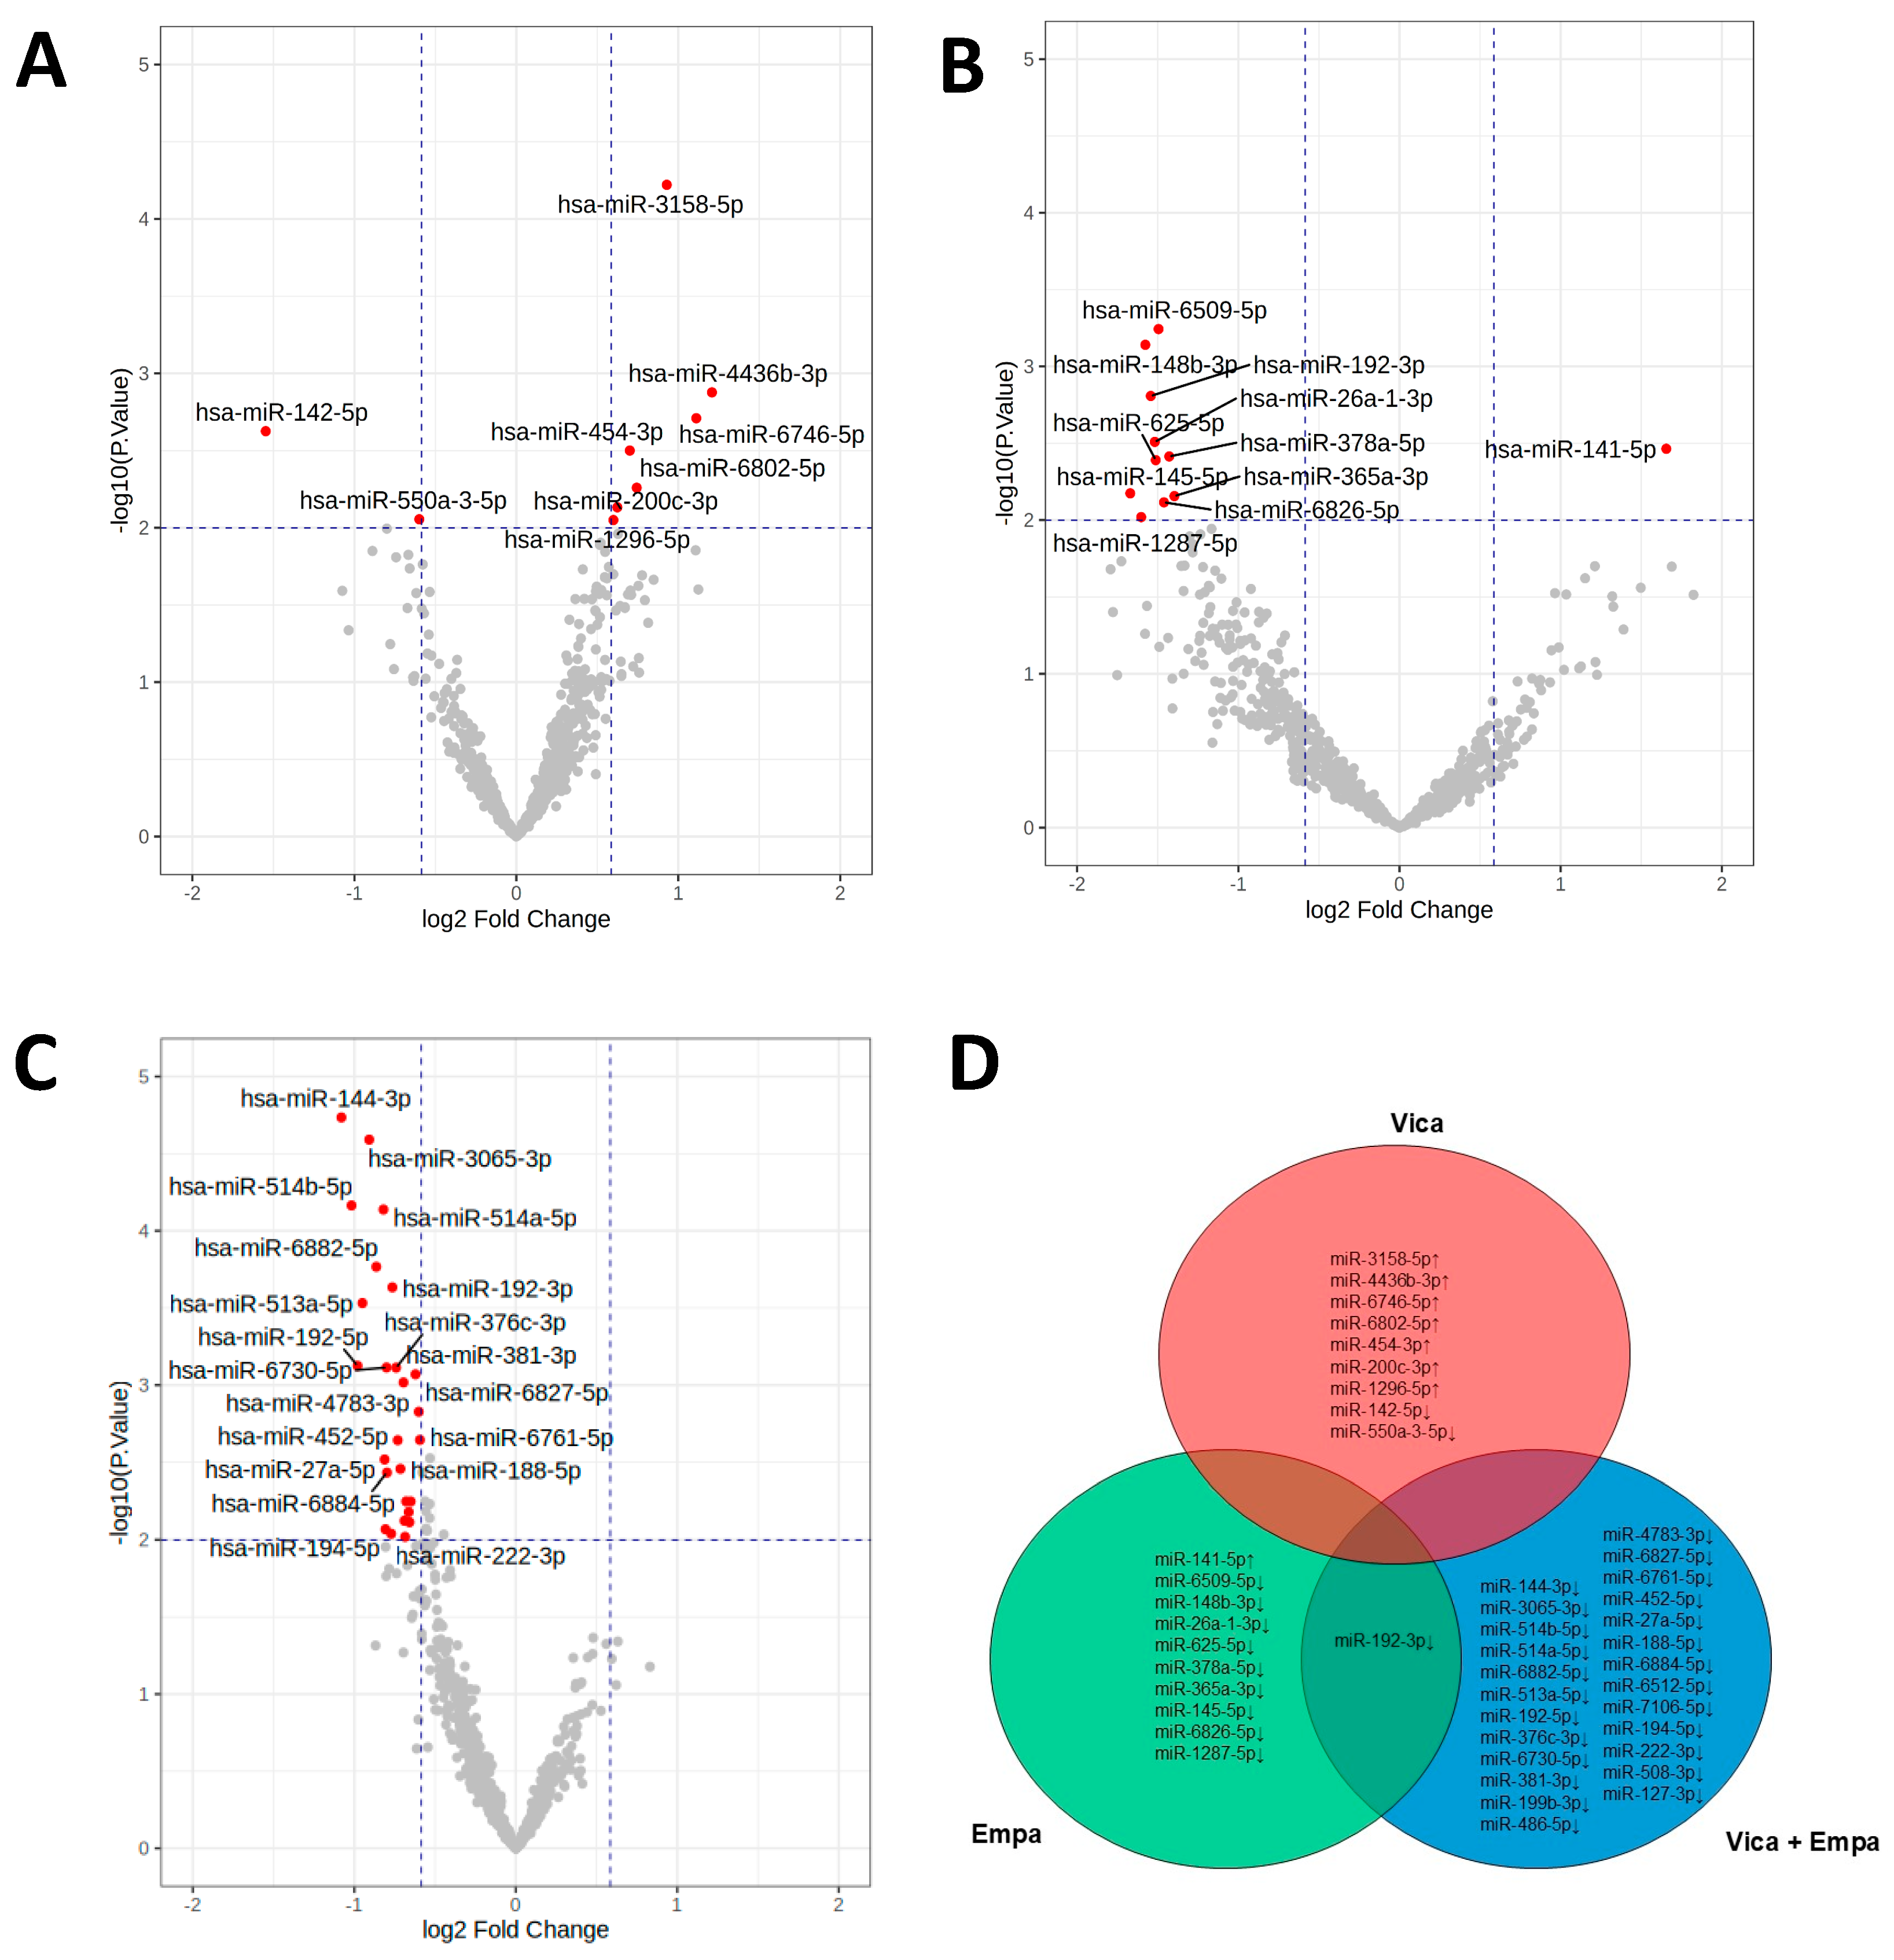
Figure 1. Effects of vicadrostat, empagliflozin, and vicadrostat plus empagliflozin on uEV expression. Treatment-mediated changes in miRNAs in patients with CKD receiving Vicahigh alone (n = 49) (A), empa alone (n = 11) (B), or Vicahigh plus empa (n = 63) (C) who showed ≥30% reduction in UACR. (D) Venn diagram illustrating unique and overlapping, significantly regulated miRNA species after treatment with therapeutic doses of vica (red) or empa (green) alone or in combination (vica plus empa) (blue). Arrows indicate direction of deregulation. Vertical and horizontal dotted lines represent the fold-change and p-value cut-offs. Differentially expressed miRNAs fulfilling the following criteria: p-value ≤ 0.01, |log2 fold-change| ≥ 0.585 are highlighted by red dots. Vicahigh = Vica 10 mg + Vica 20 mg; Vica, vicadrostat; Empa, empagliflozin.
Ijms 26 10810 g001
Figure 2. Correlation between changes in uEV miRNAs and UACR. (A) Significant correlation between Vicahigh-derived changes in uEV miRNAs and changes in UACR (in all participants without empa in run-in period). (B) Significant correlation between Vicahigh + Empa-derived changes in uEV miRNAs and changes in UACR (in all participants with empa in run-in period). Gray shaded areas indicate 95% confidence interval. EoT = End of treatment (week 14).
Ijms 26 10810 g002
Figure 3. Analysis of differentially expressed uEV miRNAs based on the CKD diagnosis among participants receiving the placebo during the run-in phase. Glomerular: glomerular disease (FSGS, MN, AS) (n = 31); Hypertensive: patients with hypertension-associated CKD (n = 33); T2D: type 2 diabetes-associated CKD (n = 141). P-values indicate level of significance for group comparisons. miRNA expression levels are given in normalized log2 cpm + 1. Values are presented in boxplots (median with interquartile range (IQR)).
Ijms 26 10810 g003
Figure 4. Effects of vicadrostat alone (A) and empagliflozin combination therapy (B) on uEV miRNAs at 4 weeks after treatment completion in participants with ≥30% UACR reduction. P-values indicate level of significance for group comparisons. miRNA expression levels are given in normalized log2 cpm + 1. Values are presented in boxplots (median with interquartile range (IQR)).
Ijms 26 10810 g004
Figure 5. Pathway overrepresentation analysis. (A): Network analysis of significantly enriched pathways regulated by the eight identified miRNAs and respective messenger RNA (mRNA) targets involved in the regulation. Size of the blue dots reflects number of mRNA targets (pink) in the pathway (blue). (B) Significant enrichment of the top 10 pathways. P-value range is highlighted by the blue scale.
Ijms 26 10810 g005
Figure 6. Enriched expression profiles in various kidney cell type-derived EVs. (A) Heatmap illustrating expression profiles of identified uEV miRNAs across EVs derived from glomerular endothelial cells, mesangial cells, podocytes, and proximal tubular cells. Expression levels were z-score normalized. (B) Box plots show significant enrichment of identified uEV miRNAs across EVs derived from glomerular endothelial cells, mesangial cells, podocytes, and proximal tubular cells. Kruskal–Wallis test p values are highlighted at the top of the graphs. miRNA expression levels are given in normalized log2 cpm + 1. n = 5/cell type.
Ijms 26 10810 g006
Table 1. Baseline and demographic and clinical characteristics of study participants.
VicahighVicalowEmpaVicahigh
+ Empa
Vicalow
+ Empa
Placebo
n = 99n = 59n = 54n = 101n = 62n = 62
Gender
Female35 (35%)15 (25%)23 (43%)32 (32%)21 (34%)17 (27%)
Male64 (65%)44 (75%)31 (57%)69 (68%)41 (66%)45 (73%)
Age (years)65 (10)65 (11)65 (10)61 (13)66 (11)62 (12)
Ethnicity/Race
Asian25 (25%)20 (34%)13 (24%)38 (38%)14 (23%)12 (19%)
Black or African American14 (14%)3 (5.1%)9 (17%)8 (7.9%)6 (9.7%)9 (15%)
White
Other/Mixed
56 (57%)
4 (4.0%)
33 (56%)
3 (5.1%)
31 (57%)
1 (1.9%)
52 (51%)
3 (3.0%)
41 (66%)
1 (1.6%)
38 (61%)
3 (4.8%)
Diabetes
Yes64 (65%)41 (69%)38 (70%)65 (64%)54 (87%)42 (68%)
No35 (35%)18 (31%)16 (30%)36 (36%)8 (13%)20 (32%)
BMI (kg/m2)29.9 (4.7)30.0 (4.9)29.5 (5.5)29.4 (5.5)30.1 (5.7)30.5 (6.2)
eGFR (mL/min/1.73 m2)55 (17)53 (16)49 (18)52 (19)50 (17)56 (19)
UACR (mg/g)615 (593)848 (1,350)690 (810)759 (897)770 (843)715 (747)
SBP (mmHg)137 (16)135 (20)133 (13)134 (15)135 (16)134 (16)
DBP (mmHg)77 (9)78 (9)77 (9)77 (9)76 (9)81 (10)
Serum potassium (mmol/L)4.29 (0.51)4.24 (0.39)4.23 (0.41)4.28 (0.36)4.35 (0.40)4.29 (0.39)
Serum aldosterone (pmol/L)
Participants with
174 (236)195 (181)160 (132)148 (133)163 (125)175 (134)
<30% reduction49 (49%)40 (68%)40 (68%)38 (38%)40 (65%)53 (85%)
≥30% reduction49 (49%)19 (32%)19 (32%)63 (62%)21 (34%)9 (15%)
Unknown1 (1.0%)0 (0%)0 (0%)0 (0%)1 (1.6%)0 (0%)
n (%); Mean (SD); Vica, Vicadrostat; Empa, Empagliflozin; Vicahigh, Vica 10 mg + Vica 20 mg; Vicalow, Vica 3 mg, BMI, body mass index; SBP, systolic blood pressure; DBP, diastolic blood pressure.
Table 2. Changes in uEV miRNAs and correlations with UACR by Vicahigh or VicahighEmpa treatment.
miRNAEoT/Baseline
(Vicahigh/Empa)
p-ValueEoT/Baseline
(Vicahigh)
p-ValueCorrelation with
UACR (p-Value)
miR-142-5p−1.830.048−2.920.0020.26 (0.001)
miR-192-5p−1.970.001−1.030.9060.28 (<0.001)
miR-194-5p−1.710.009−1.340.2460.24 (0.002)
miR-27a-5p−1.760.003−1.370.1340.21 (0.018)
miR-381-3p−1.540.0011.080.5510.25 (0.027)
miR-192-3p−1.700.000−1.070.6470.23 (0.031)
miR-199b-3p−1.580.008−1.390.0760.18 (0.044)
miR-513a-5p−1.930.0001.250.2830.17 (0.038)
miR-6882-5p−1.820.0001.090.6190.27 (0.014)
Fold-changes, p-values, and correlation coefficients are summarized. EoT, end of treatment; Vica, vicadrostat; Empa, empagliflozin; Vicahigh, Vica 10 mg + Vica 20 mg.
Table 3. Potential miRNA associations with mechanisms of kidney disease.
miRNAFunctionsReferences
miR-192-5pKey role in transforming growth factor beta (TGFβ) signaling pathway. Reduced expression can be linked to reduced extracellular matrix proliferation and attenuated epithelial–mesenchymal transformation. Increased expression in patients with albuminuria.[23,24,25]
miR-194-5pInvolved in TGFβ signaling pathway; reduced expression in patients with albuminuria.[26]
miR-27a-5pIncreased miR-27a-5p in the pancreatic islets of genetic and dietary mouse models of obesity is mainly derived from visceral adipocyte-secreted EVs and serves as a pathogenic factor driving β-cell insulin secretion injury; involved in regulation of nuclear factor kappa B (NF-kB) signaling.[27,28]
miR-381-3pFunctions as a dual suppressor of apoptosis and necroptosis and promotes proliferation of kidney cancer cells.[29]
miR-192-3pIncreased level in urinary sediment obtained from membranous nephropathy compared to healthy controls by participating in inflammation and apoptosis.[30]
miR-199b-3pSignificantly upregulated in ADPKD (Autosomal dominant polycystic kidney disease) patient urine extracellular vesicles.[31]
miR-513a-5pCircRTN4 (circular RNA derived from exon 4 and 5 of the Reticulon 4 (RTN4) mRNA) exacerbates mesangial cell dysfunction by activating the miR-513a-5p/FN (fibronectin) axis in lupus nephritis.[32]
miR-6882-5pUnknown.
miR-142-5pIncreased expression in kidney fibrosis (results obtained from a meta-analysis). miR-142-5p is regulated by IL-4 and IL-13 and controls profibrogenic macrophage program; miR-142a-5p overexpression in activated lymphocytes shifts the pattern of T cell differentiation towards Th1 cells.[33,34,35]
Disclaimer/Publisher’s Note: The statements, opinions and data contained in all publications are solely those of the individual author(s) and contributor(s) and not of MDPI and/or the editor(s). MDPI and/or the editor(s) disclaim responsibility for any injury to people or property resulting from any ideas, methods, instructions or products referred to in the content.