Article

Genome-Wide Identification and Characterization of Isoflavone Synthase (IFS) Gene Family, and Analysis of GgARF4-GgIFS9 Regulatory Module in Glycyrrhiza glabra

1
Key Laboratory of Xinjiang Phytomedicine Resource and Utilization of Ministry of Education, Key Laboratory of Oasis Town and Mountain-Basin System Ecology of Bingtuan, College of Life Sciences, Shihezi University, Shihezi 832000, China
2
Department of Civil, Environmental and Construction Engineering, College of Engineering and Computer Science, University of Central Florida, Orlando, FL 32816, USA
*
Authors to whom correspondence should be addressed.
These authors contributed equally to this work.
Int. J. Mol. Sci. 2025, 26(21), 10435; https://doi.org/10.3390/ijms262110435
Submission received: 15 September 2025 / Revised: 23 October 2025 / Accepted: 24 October 2025 / Published: 27 October 2025

Abstract

Isoflavone synthase (IFS) is the key enzyme in isoflavonoid biosynthesis and has been functionally characterized in numerous plant species. Glycyrrhiza species, valued for their medicinal properties, accumulate flavonoids with significant physiological activities. Among these, isoflavones play crucial roles in plant growth, development and stress responses. However, the IFS gene family in Glycyrrhiza remains poorly understood. In this study, we identified 10, 9 and 9 IFS genes in G. uralensis, G. inflata and G. glabra, respectively. Phylogenetic analysis classified these genes into four distinct clades (Clade A–D). Further characterization included chromosomal localization, gene structure, conserved motifs, cis-acting elements and synteny analysis. Using yeast one-hybrid (Y1H) screening, dual-luciferase assays and an electrophoretic mobility shift assay (EMSA), these results revealed that auxin response factor 4 (GgARF4) directly binds to the isoflavone synthase 9 (GgIFS9) promoter and activates its expression. Following indole-3-acetic acid (IAA) treatment, RNA-seq revealed that in the differentially expressed genes (DEGs), the genes involved in isoflavonoid and flavonoid biosynthesis pathways were significantly enriched. The result of quantitative reverse transcription polymerase chain reaction (qRT-PCR) revealed that GgIFS9 was strongly induced by IAA. β-Glucuronidase (GUS) assays confirmed that IAA activates the expression of the GgIFS9 promoter in Nicotiana tabacum. Our findings reveal that, through GgARF4 and its downstream-activated gene GgIFS9, IAA may promote flavonoid synthesis in G. glabra. This study provides novel insights into the auxin-mediated regulation of secondary metabolism in Glycyrrhiza species.

1. Introduction

Glycyrrhiza glabra L., a member of the Leguminosae family, represents one of the most valued medicinal plants in traditional Chinese medicine (TCM) [1]. The therapeutic potential of this species primarily resides in its dried roots and rhizomes, which contain diverse bioactive compounds responsible for its wide pharmacological applications [2]. Among these bioactive constituents, flavonoids and triterpenoid saponins are particularly noteworthy, with isoflavones emerging as a critical subclass of flavonoids [3]. These specialized metabolites, predominantly found in leguminous plants, play pivotal roles in plant physiology, including growth regulation, developmental processes and stress responses [4,5].
Extensive research has elucidated the multifaceted functions of isoflavones in plant systems. These compounds not only modulate root architecture but also significantly enhance the development of lateral buds, leaves and reproductive structures [6]. Through their influence on endogenous hormone homeostasis, isoflavones promote lateral bud outgrowth and branch elongation, thereby establishing robust branching patterns and optimizing photosynthetic efficiency [7]. Moreover, these metabolites precisely regulate cellular processes during leaf morphogenesis, including cell division and expansion, ultimately contributing to enhanced leaf development and photosynthetic performance [8]. The biosynthesis of isoflavones centers around isoflavone synthase (IFS), a cytochrome P450 monooxygenase that serves as the key enzyme in the phenylpropanoid pathway [9]. IFS catalyzes the conversion of flavanones into 2-hydroxyisoflavones, which subsequently undergo dehydration mediated by isoflavone dehydratase (HID) to yield 4′-hydroxyisoflavones [10]. Alternatively, 2-hydroxyisoflavones can be modified through methylation by 2-hydroxyisoflavone 4′-O-methyltransferase (HI4′OMT), producing various derivatives including biochanin A and chickpea isoflavone A [10]. Notably, the metabolic network branches at naringenin, which serves as a common precursor for multiple pathways, including those leading to flavonols and anthocyanins through the actions of flavanone 3-hydroxylase (F3H) and flavonol synthase (FLS) [11]. Additional transformations of liquiritigenin and naringenin yield various defensive compounds such as flavones and quercetin, significantly contributing to plant adaptation mechanisms [12].
The phytohormone auxin stands as a fundamental regulator of plant growth and development [13,14]. The auxin signaling pathway, mediated by auxin response factors (ARFs), plays a particularly significant role in root system development and the biosynthesis of secondary metabolites, including isoflavones. Integrated transcriptomic and metabolomic analysis in Pueraria lobata have demonstrated a positive correlation between auxin/ARF expression, root expansion, and the accumulation of flavonoids and isoflavones in root tubers [15]. Similar investigations in peanut have revealed the involvement of auxin in nodulation processes and flavonoid accumulation [16]. Furthermore, exogenous IAA application in Cicer arietinum has been shown to elevate levels of antioxidant enzymes (catalase and glutathione) along with secondary metabolites including flavonoids and phenols [17]. However, there are few reports of IFS gene family and regulation mechanism in G. glabra.
Therefore, in the present study, we conducted an analysis of the IFS gene family across three Glycyrrhiza species (G. uralensis, G. inflata and G. glabra). Molecular characterization revealed that GgARF4 directly bound to and transcriptionally activated the GgIFS9 promoter. RNA-seq analysis highlighted significant enrichment of phenylpropanoid biosynthesis pathways among DEGs. The expression patterns of GgIFS genes indicated that GgIFS9 was induced by IAA in G. glabra. Functional validation demonstrated that IAA treatment enhanced GgIFS9 promoter activity. These findings provide crucial insights into the molecular mechanisms governing isoflavone biosynthesis and establish a foundation for future efforts to develop G. glabra cultivars with enhanced isoflavone content through targeted genetic approaches.

2. Results

2.1. Identification and Classification of IFS Gene Family Members

A total of 9, 9, 10 members of GgIFS, GiIFS, GuIFS were obtained from the genome of G. glabra, G. inflata and G. uralensis. The ID of IFS members was named according to the location of chromosomes. The coding sequences (CDSs) and protein sequences are listed in Table S1. Subsequently, we predicted the physicochemical properties of IFS proteins in three Glycyrrhiza species, including the number of amino acids (aa), molecular weight (MV), theoretical pI, instability index, aliphatic index and grand average of hydropathicity (GRAVY) (Table S2). The molecular weight ranged from 38.817 to 60.610 kDa and the pI spanmed from 6.07 to 8.05. The GRAVY values were negative, indicating that they were hydrophilic. Most of the instability indexes of the IFS proteins were above 40, showing that they were unstable. The prediction of subcellular localization revealed that most IFS proteins were located in the cytoplasm, while others were located in chloroplast, membrane, nucleus and endosome (Table S2).

2.2. Phylogenetic Relations of the IFS Gene Family

In order to further elucidate the evolutionary relationships in the IFS gene family, we constructed a phylogenetic tree using the protein sequences of the IFS gene family. The 44 members were divided into four branches (Clade A–D) (Figure 1). Clade A only contained six AtIFS genes, comprising the smallest size group. The Clade B contained 15 gene members, comprising the largest group. Clade C and Clade D had 9 and 14 members, respectively.

2.3. Chromosome Location of IFS Genes in Three Glycyrrhiza Species

To investigate the distribution of IFS genes on the chromosomes, 28 IFS genes were mapped (Figure 2). The 28 IFS genes were unevenly distributed on chromosome 2 and 4 in three Glycyrrhiza species. For example, five members were located on chromosome 2 and four members on chromosome 4 in G. glabra (Figure 2A).

2.4. Analysis of Collinearity Relationships Among IFS Gene Families in Three Glycyrrhiza Species

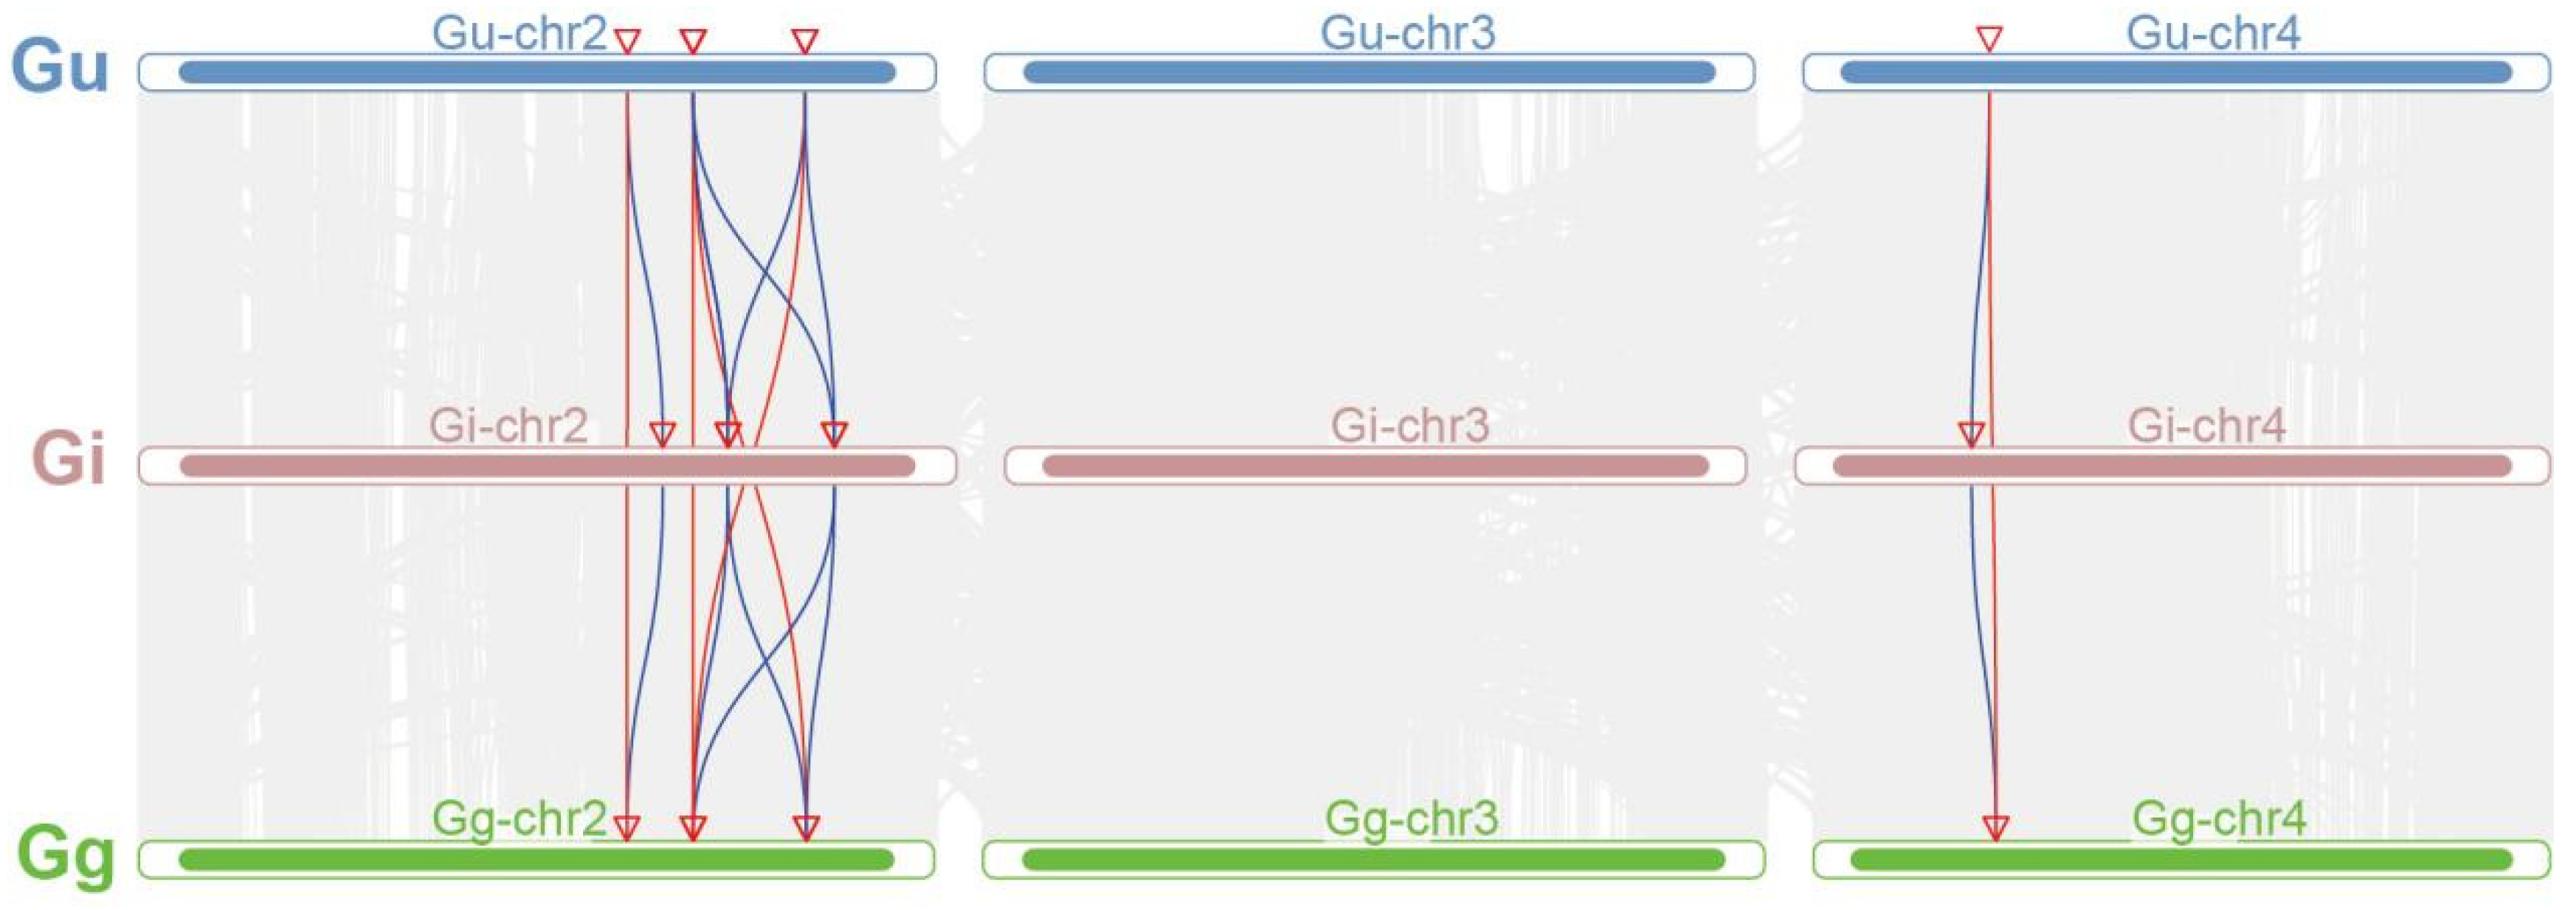
To explore the gene duplication events of IFS genes, the collinearity relationship was analyzed (Figure 3). In the figure, different colored lines connect the chromosomes of different species, with each line representing a collinear region between chromosomes, indicating the conserved order and orientation of genes in these regions. We found four collinear gene pairs among G. uralensis, G. inflata and G. glabra. The IFS genes between two Glycyrrhiza species all have five gene pairs’ collinearity relationships, and one IFS gene was homologous to two IFS genes in three Glycyrrhiza species (Table S3). In G. uralensis, G. inflata and G. glabra, there was one segmental duplicated gene pair (Figure S1). These results suggested that these IFS genes may play an important role in the evolution of the IFS gene family in licorice.

2.5. Analysis of Promoter Cis-Acting Elements, Conserved Motifs and Gene Structures of IFS Gene Family

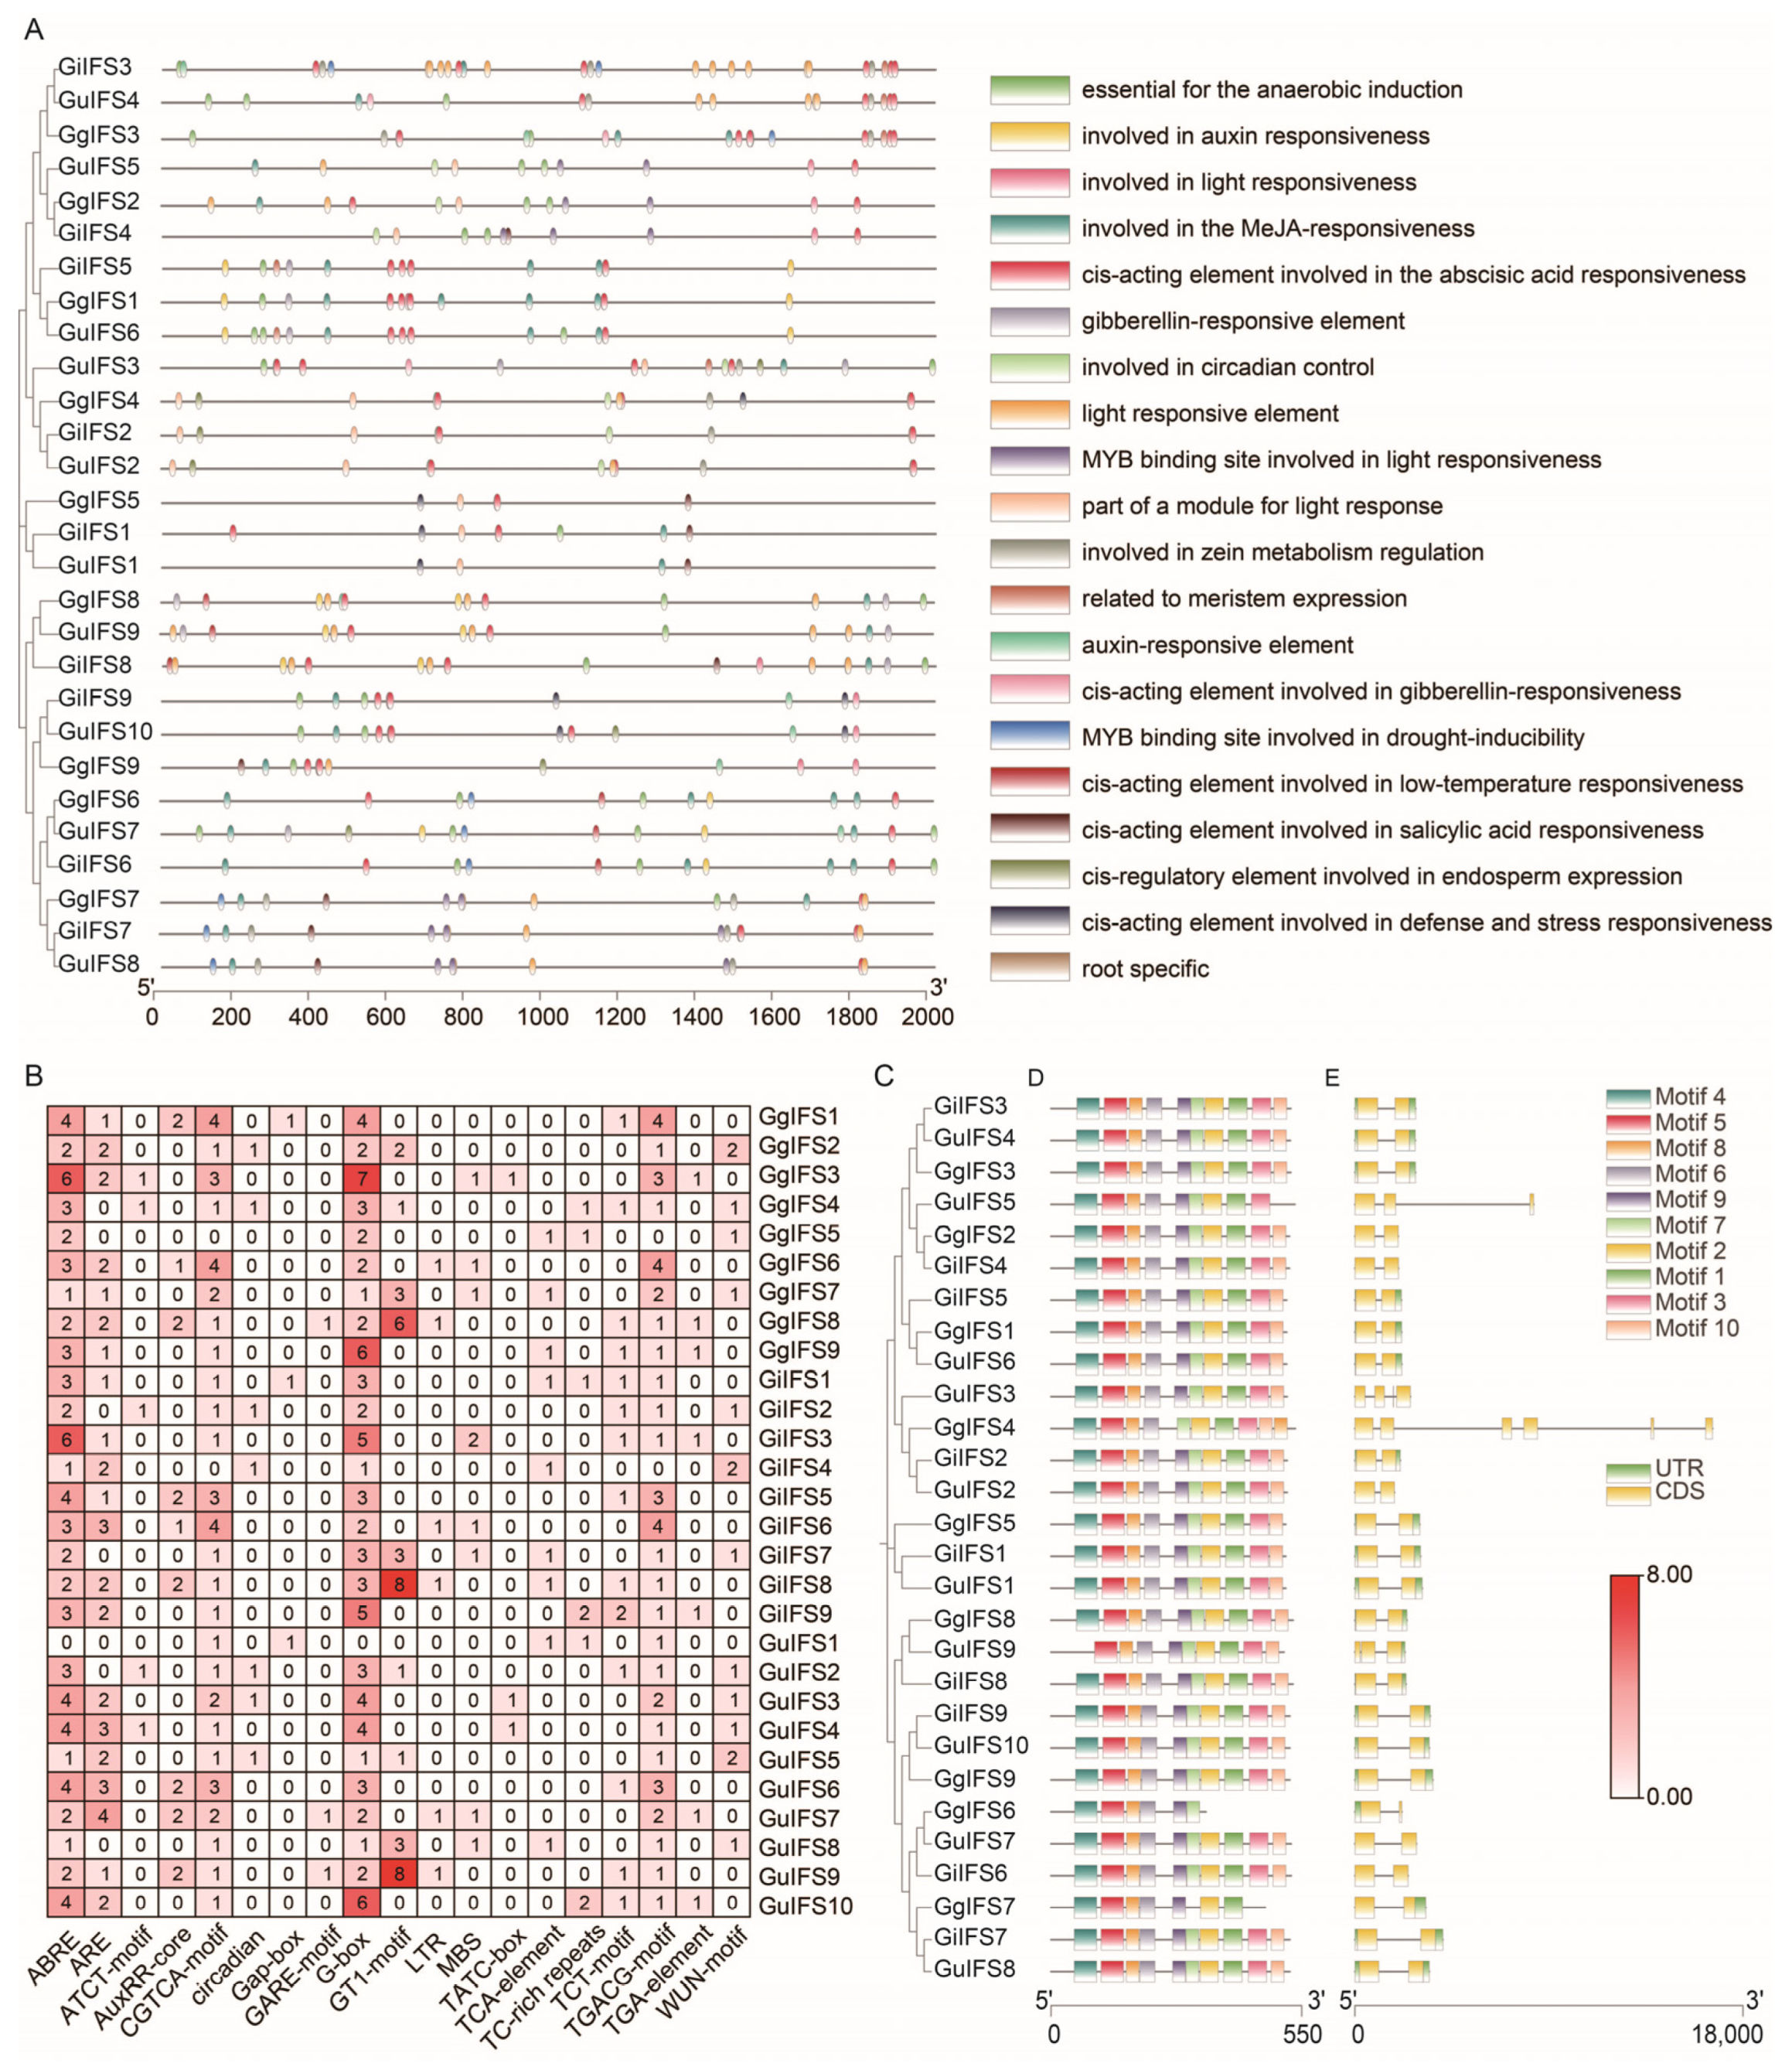
We analyzed the IFS gene family from different aspects, including cis-acting elements, conserved motifs and exon–intron structure (Figure 4). The evolutionary relationship of closely related genes exhibited similar cis-acting element distribution patterns (Figure 4A). The 19 cis-acting elements were identified, and they can be divided into three categories: hormone-responsive (auxin, ABA, MeJA, salicylic acid and gibberellin) elements, stress-responsive elements and development-responsive elements. The stress-responsive elements, such as the MYB binding site (MBS) and low-temperature reactivity (LTR), also existed in IFS genes (Figure 4B). The heatmap of cis-acting elements shows that many elements were hormone-responsive, such as ABA (ABRE), auxin (AuRR-core and TGA-element), gibberellin (GARE-motif, TATC-box and P-box), MeJA (CGTCA-motif and TGACG-motif) and salicylic acid (TCA-element) (Figure 4B). A total of ten motifs were identified, namely motif 1–10 (Figure 4D). The number of motifs ranged from 5 to 10; most of IFS proteins had 10 motifs. The results of gene structure analysis indicated that genes closely related in terms of their evolutionary relationship exhibited similar gene structures (Figure 4C,E).

2.6. The GgARF4 Protein Positively Regulates Isoflavone Synthase GgIFS9 in G. glabra

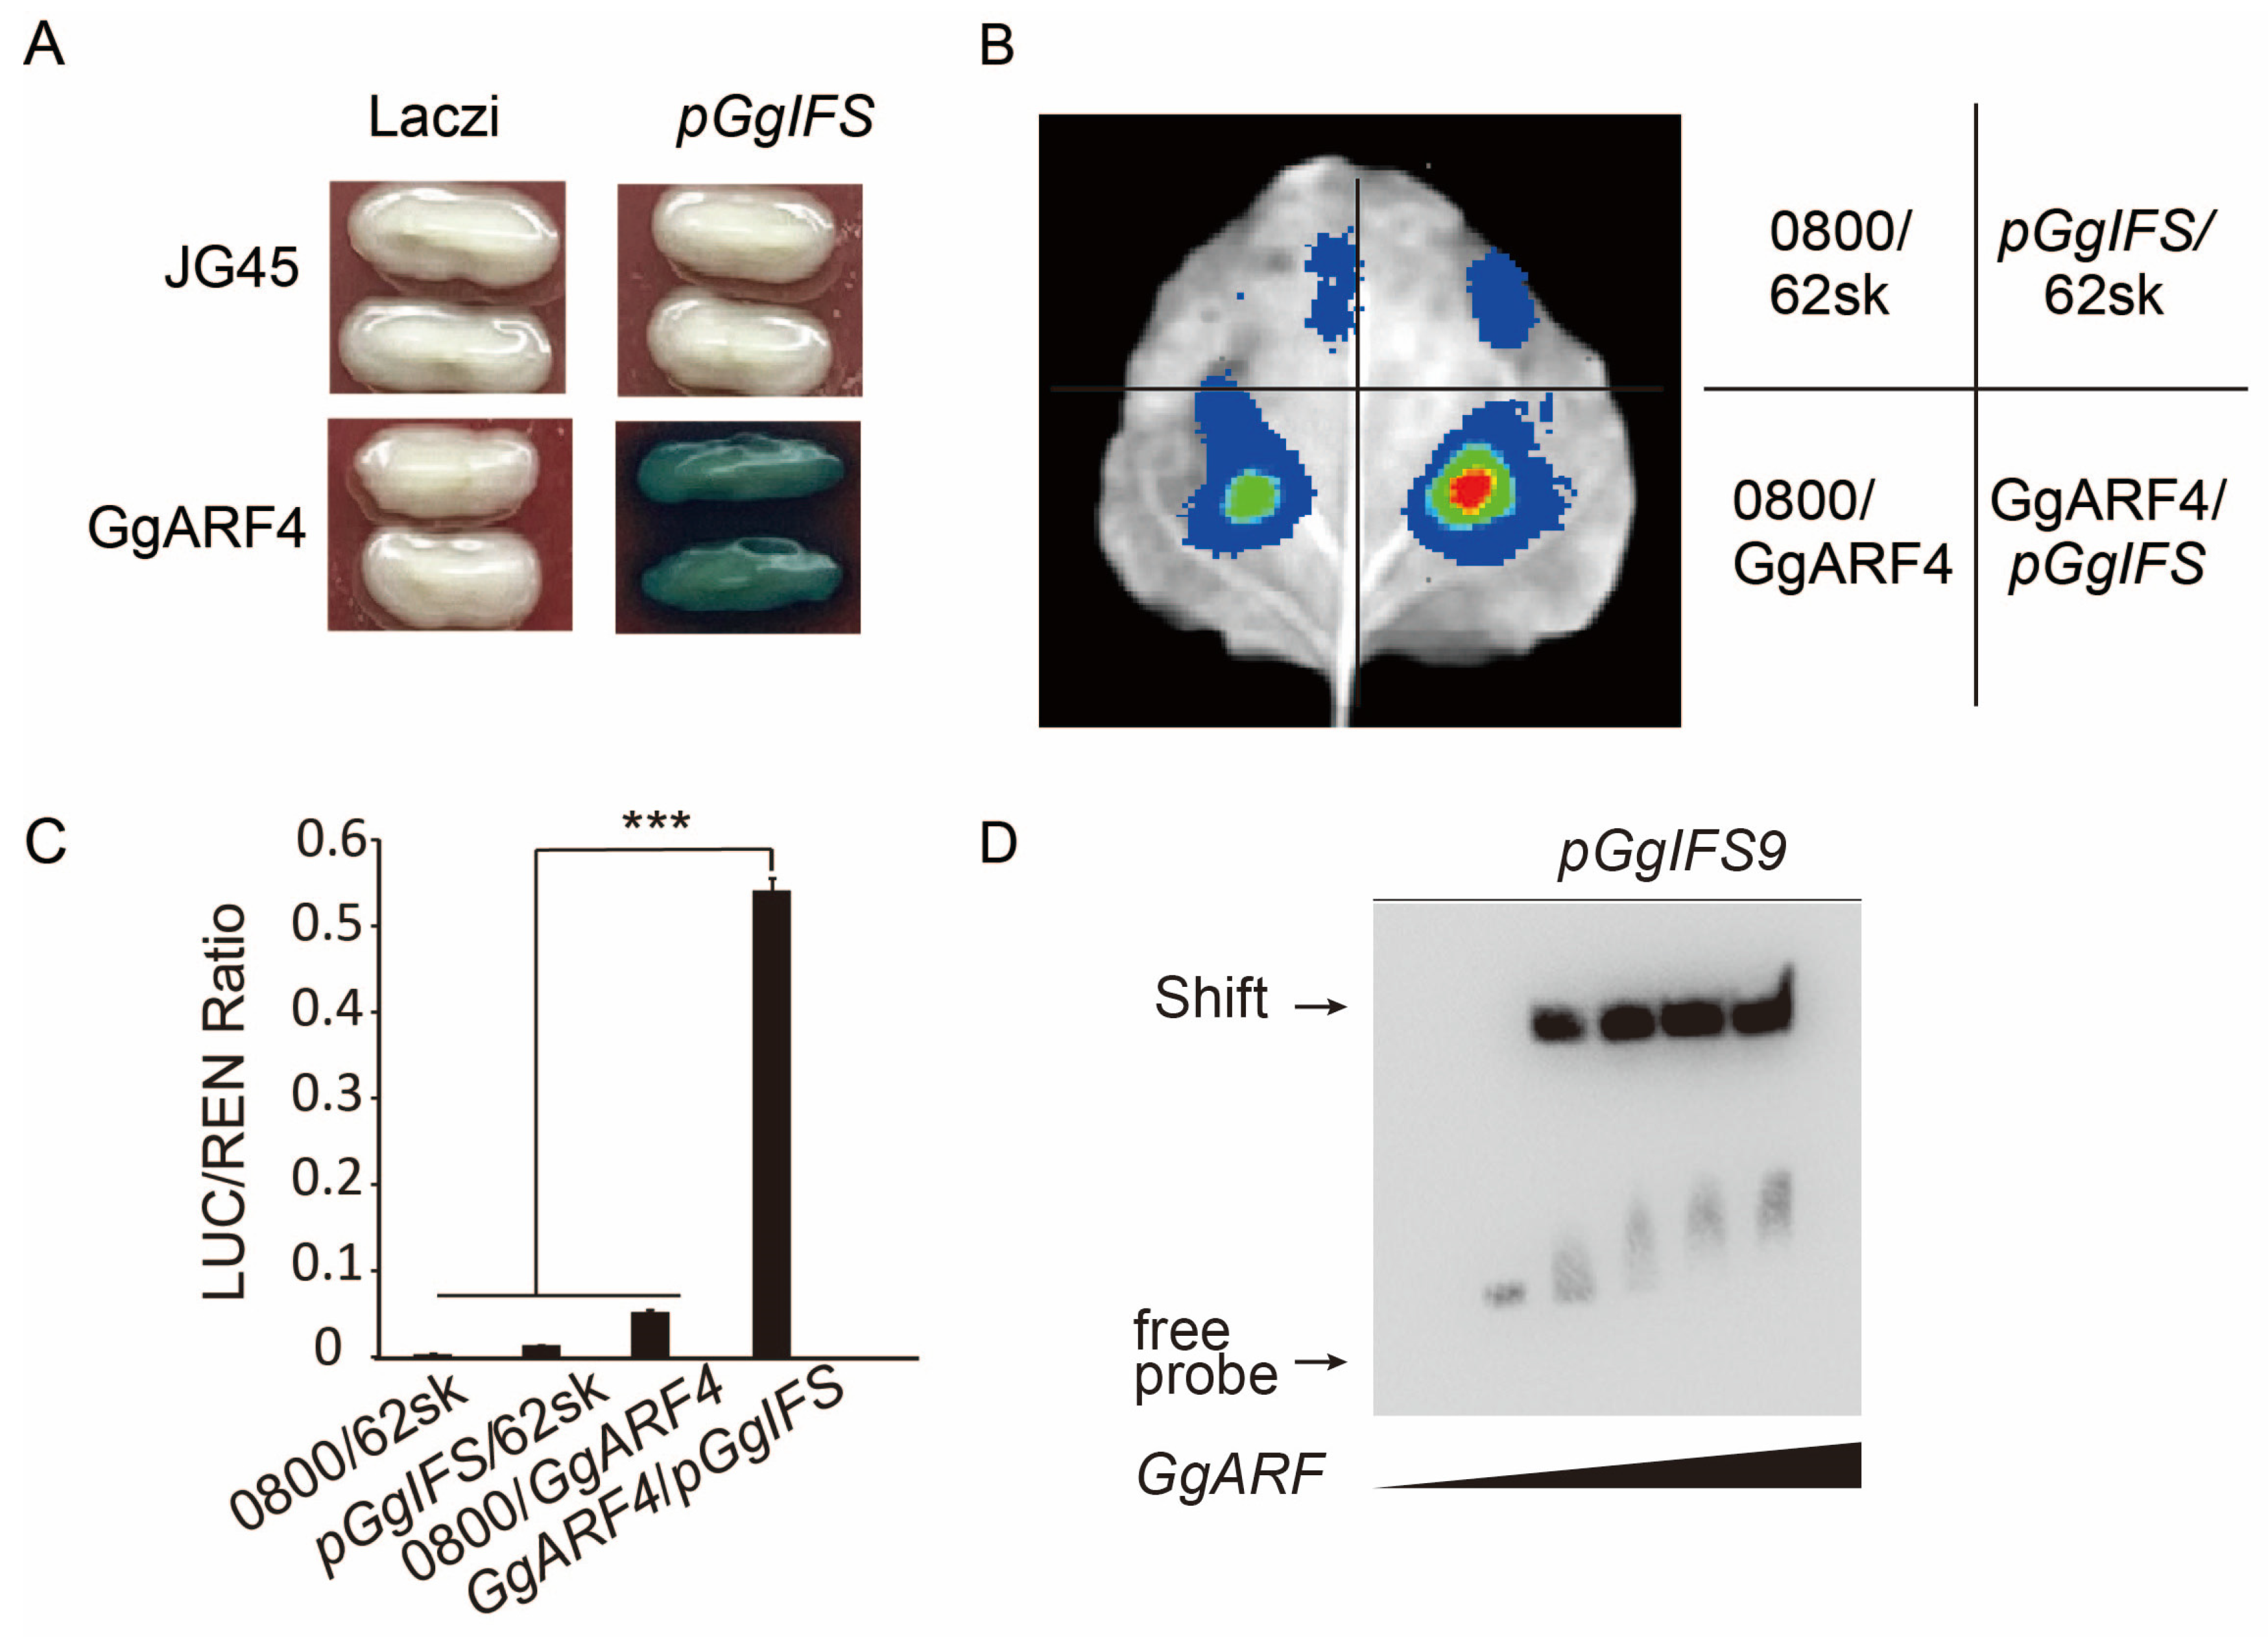
In order to identify the transcription factors that interact with the GgIFS9 gene, we conducted yeast library screening. The candidate TFs are listed in Table S4. To clarify whether the candidate TFs can directly regulate the transcription of the GgIFS9 gene, we conducted a Y1H assay (Figure S2). The results showed that only GgARF4 could bind to the promoter of GgIFS9 (Figure 5A). The result of a transient in vivo expression assay in N. tabacum showed that, compared with that of the control, the LUC reporter activity of GgARF4 with the co-transfected GgIFS9 promoter was significantly enhanced, with about a six-fold change (Figure 5B,C). The results of the EMSA revealed that GgARF4 had binding affinity for the promoter of GgIFS9 (Figure 5D). Based on the results, this study confirmed that GgARF4 can directly bind to the promoter sequence of the GgIFS9 gene and activate its expression.

2.7. Transcriptome Sequencing Analysis and qRT-PCR Analysis of GgIFS Genes After IAA Treatment

To characterize the molecular mechanism, we performed RNA-seq on the wild-type and IAA-treated plant of G. glabra. In DEGs, up-regulated genes and down-regulated genes were identified (Figure S3). The KEGG enrichment analysis showed that the biosynthesis of nitrogen metabolism, isoflavonoid biosynthesis and flavonoid biosynthesis, ubiquinone and other terpenoid–quinones were enriched in the DEGs (Figure 6A). The results of Gene Ontology (GO) revealed that the extracellular region, heme binding, defense response, peroxidase activity, the hydrogen peroxide catabolic process, transferase activity, transferring alkyl or aryl (other than methyl) groups, chitinase activity and nitrate transmembrane transporter activity were enriched (Figure 6B). To identify the candidate gene, we conducted qRT-PCR to analyze the expression of GgIFS genes under normal conditions and with IAA treatment. The qRT-PCR results revealed that a root-specific gene, GgIFS9, was most significantly up-regulated after IAA treatment (Figure S4).

2.8. Expression Pattern of Up-Regulated Genes in the Transcriptome After IAA Treatment

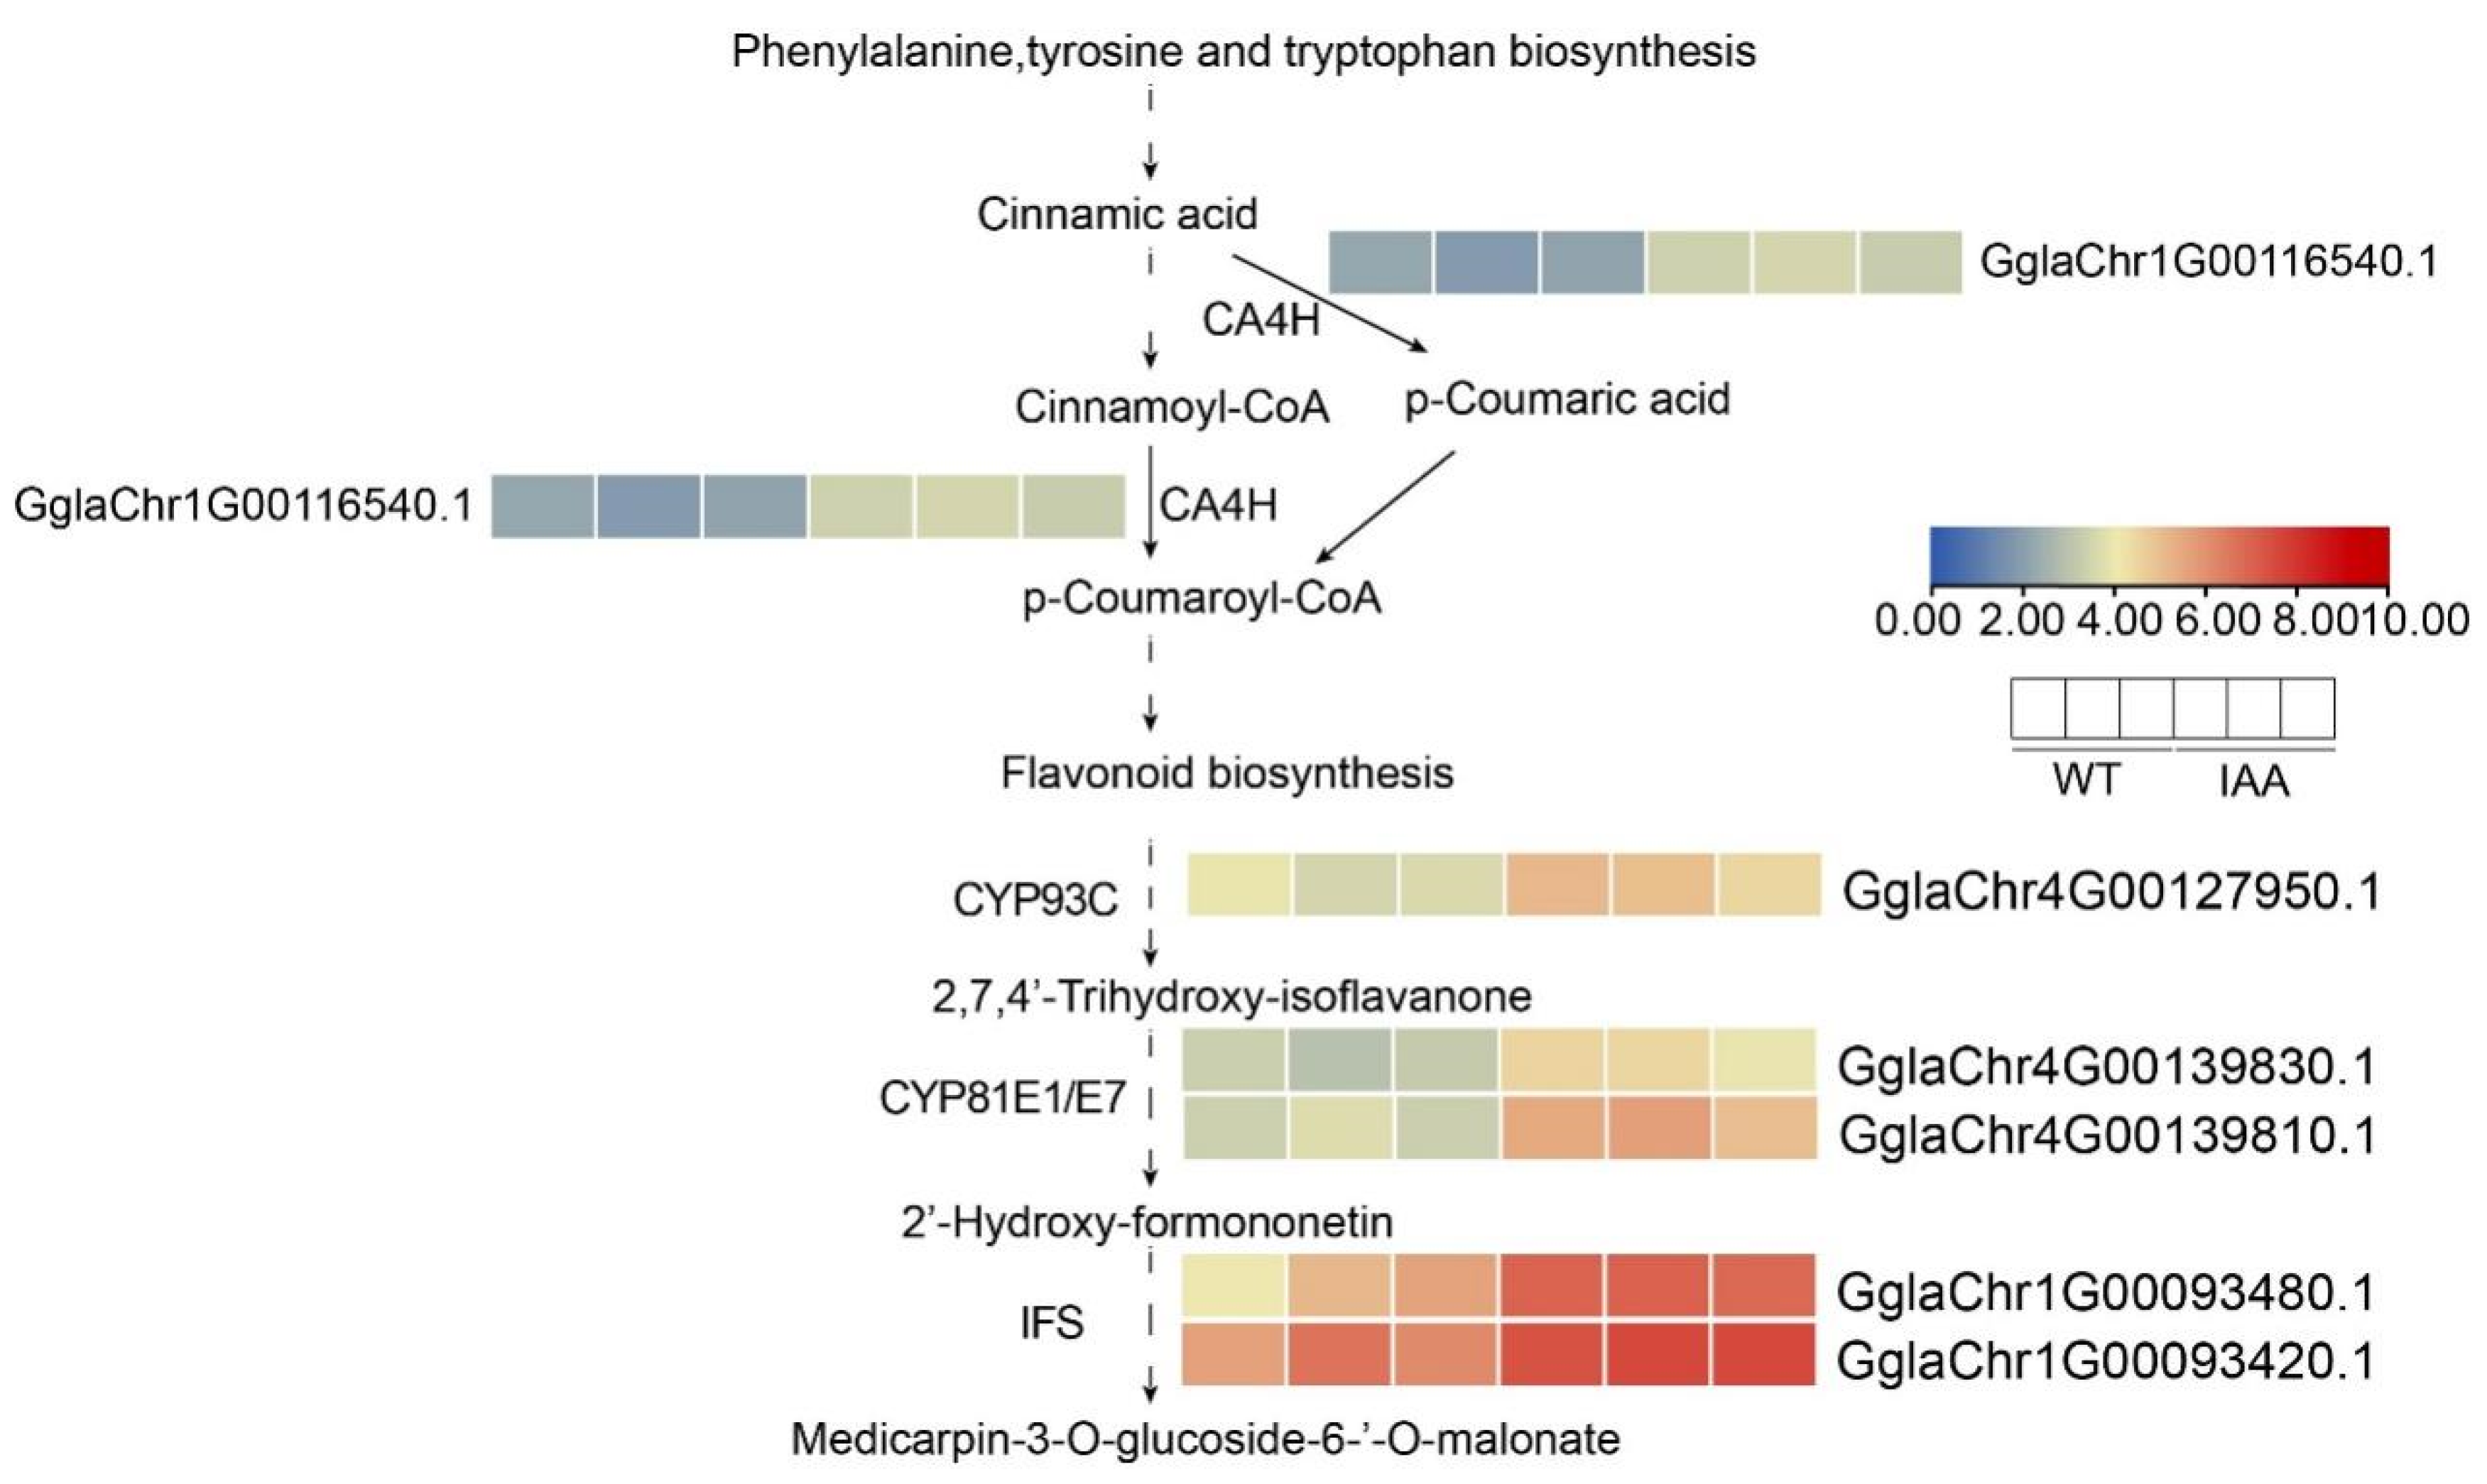
In the DEGs, some up-regulated genes were found in the phenylpropanoid metabolic pathways (Figure 7). These genes included cytochrome P450 monooxygenase 93C (CYP93C), cytochrome P450 monooxygenase 81E1/E7 (CYP81E1/E7), trans-cinnamate 4-monooxygenase (CA4H) and 2-hydroxyisoflavanone synthase (IFS). These results revealed that IAA treatment can enhance flavonoid accumulation via the phenylpropanoid metabolic pathway.

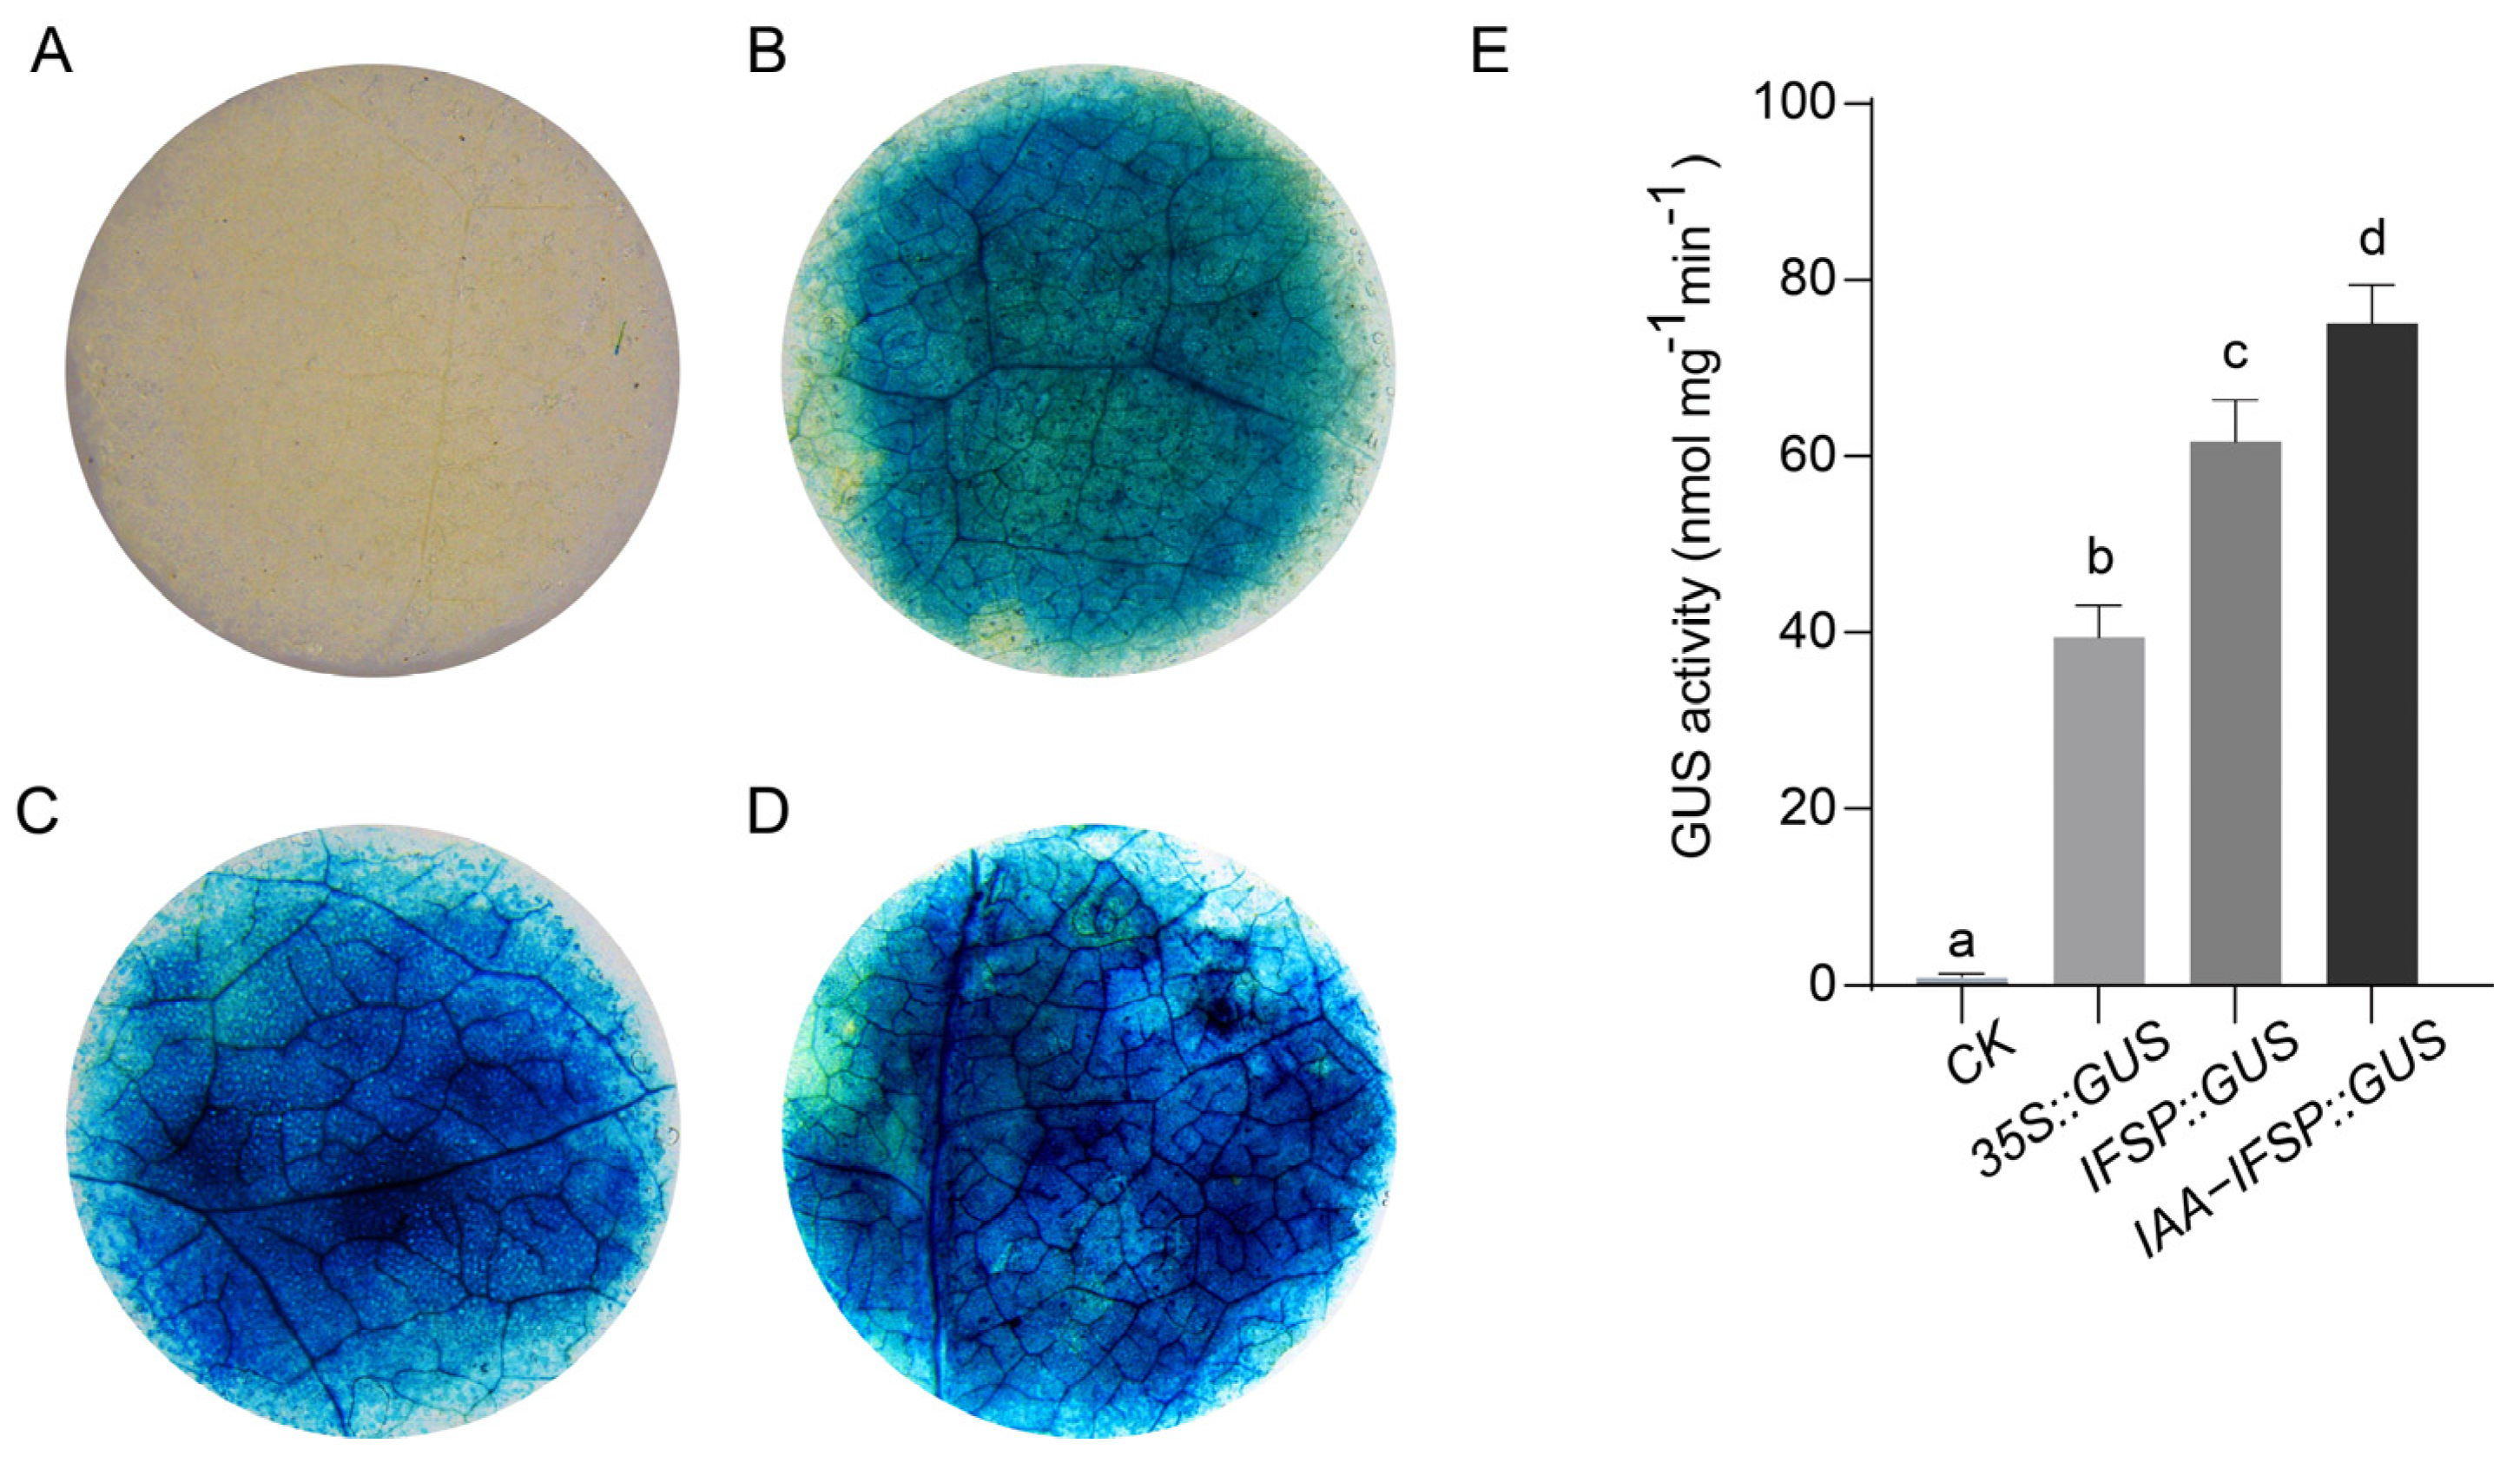
2.9. GUS Staining and GUS Activity of the GgIFS9 Promoter After IAA Treatment

In order to investigate the activity of the GgIFS9 promoter, we conducted GUS staining on the negative control, positive control, and pCAMBIA1304-GgIFS9 promoter under normal conditions and under IAA treatment in N. tabacum. The leaf of the negative control was not blue, and the leaf of the positive control was blue (Figure 8A,B). After IAA treatment, the blueness of the leaf was darker than that under normal conditions (Figure 8C,D), indicating that IAA treatment enhanced the activity of the GgIFS9 promoter. Then, we quantitatively analyzed the GUS activity, with the results showing that the GUS activity of the negative control (CK) was the lowest (Figure 8E). The GUS activity of the pCAMBIA1304-GgIFS9 promoter was higher than the GUS activity of the pCAMBIA1304 empty vector with the 35S promoter, indicating that the GgIFS9 promoter was more active than the 35S promoter. After IAA treatment, the GUS activity of the pCAMBIA1304-GgIFS9 promoter was higher than that under the normal condition, further illustrating the IAA treatment enhanced the activity of the GgIFS9 promoter.

3. Discussion

G. glabra is an important medicinal plant rich in medicinal components, such as triterpene saponins and flavonoids [18]. Isoflavone has many functions, such as anti-tumor, anti-cardiovascular disease, immune regulation, antibacterial and anti-inflammatory properties [19,20]. IFS can convert flavonoids into isoflavones, and the IFS gene is a key gene in deciding the concentration of isoflavonoids [21]. In recent years, researchers have identified IFS genes in many plants species, such as Trifolium pratense, Cicer arietinum L., Lotus japonicus, soybean and other legumes [22,23,24,25,26]. However, research on the three Glycyrrhiza species and investigations of the molecular mechanism of isoflavonoids are limited. In this study, we identified 9 GgIFS genes, 9 GiIFS genes and 10 GuIFS genes. These members could be divided into four clades in the phylogenetic tree (Clade A–D), in contrast to the six clades of 139 IFS proteins [27].
Interacting with the promoter of genes, transcription factors play pivotal roles in their regulatory networks [28]. Previous studies have indicated that MYB and bHLH TFs are related to the synthesis of isoflavones [29,30]. This research revealed that GmMYB29 and GmMYB133 regulate the GmIFS2 promoter, and the expression of GmIFS2 is activated, participating in the synthesis of isoflavone [31]. In our current investigation, through Y1H, dual-luciferase assays and an EMSA (Figure 5), we found that the auxin response factor GgARF4 interacted with GgIFS9.
There are various hormone-responsive elements in the promoter region of GgIFS genes (Figure 4A,B), which suggests that hormones may affect the expression of GgIFS genes. The results of qRT-PCR revealed that, after IAA treatment, some GgIFS genes were highly expressed, especially the GgIFS9 gene (Figure S4), which reflects the results of previous research showing that IFS genes are differentially regulated under IAA treatment in soybean [32].
In recent years, RNA-seq has become an important technique for profiling targets of DEGs under particular conditions [33]. The ARF is an important transcription factor in the plant auxin signaling pathway [34]. The research revealed that ARF2 positively regulated flavonols biosynthesis in A. thaliana [35]. Through the Aux/IAA-ARF signaling pathway, auxin regulates anthocyanin biosynthesis in apple [36]. The results indicated that auxin affected flavonol accumulation through the ARF by regulating the flavonoid biosynthesis genes [37]. The flavonoid biosynthesis pathway is impacted by several plant hormones, transcription factors and non-coding RNAs [38]. Through the aux/IAA-ARF signaling pathway, flavonoid biosynthesis is regulated by auxin (indole-3-acetic, IAA) [39]. In anthocyanin biosynthesis, auxin negatively regulates flavonoid biosynthesis [40]. Therefore, we conducted RNA-seq analysis of the wild-type and IAA-treated G. glabra. Compared to the control, the isoflavonoid biosynthesis and flavonoid biosynthesis pathways were enriched after IAA treatment (Figure 6), indicating that IAA may modulate isoflavonoid biosynthesis and flavonoid biosynthesis. Compared to that under normal conditions, the promoter activity of GgIFS9 was significantly enhanced under IAA treatment (Figure 8), suggesting that IAA may act as a positive regulator of isoflavone biosynthesis. Further work is needed to determine the content of flavonoids and for metabolite quantification under IAA treatment and normal conditions by using LC-MS/HPLC in G. glabra.
Collectively, these findings have deepened our understanding of the molecular mechanism by which ARF mediates the IAA signaling pathway to regulate the IFS genes in G. glabra, perhaps influencing the synthesis and accumulation of isoflavones. This provides valuable insights for future research and potential applications in crop improvement.

4. Materials and Methods

4.1. Identification and Characterization of IFS Genes

The protein sequences of AtIFS were downloaded from the TAIR database (https://www.arabidopsis.org, accessed on 4 August 2024) [41]. We used the IFS sequences of A. thaliana as the query to blast the genomic data of G. uralensis, G. inflata, G. glabra and G. max with an E-value of 1 × 10⁻⁵. Then, the Pfam database (http://pfam.xfam.org/, accessed on 6 August 2024) and NCBI-CDD (https://www.ncbi.nlm.nih.gov/cdd/, accessed on 6 August 2024) were used to verify the domain [42]. Proteins without the domain were removed. We used the database ExPASy (https://web.expasy.org/protparam/, accessed on 7 August 2024) to analyze the physicochemical properties, including the number of amino acids, molecular weight (MW), isoelectric point (pI), instability index, aliphatic index and grand average of hydropathicity (GRAVY) [43]. We used the website for Euk-mPLOC (http://www.csbio.sjtu.edu.cn/bioinf/euk-multi-2/, accessed on 8 August 2024) to predict the subcellular localization of IFS proteins [44].

4.2. Phylogenetic Tree Construction

We used the IFS protein sequences to perform phylogenetic analysis in G. uralensis, G. inflata, G. glabra, G. max and A. thaliana. Using the MEGA X software (version 10.2.6, www.megasoftware.net, accessed on 15 August 2024), we constructed the phylogenetic tree using the Neighbor-Joining (NJ) method with 1000 bootstrap repeats [45]. The phylogenetic tree was visualized on the online tool Evolview (https://evolgenius.info/, accessed on 20 August 2024) [46].

4.3. Chromosome Distribution of IFS Genes in Three Glycyrrhiza Species

Using the genomic data and the gff file, we determined the position of IFS genes on the chromosome in three Glycyrrhiza species. Using TBtools software (Version 2.056), we drafted a chromosome distribution map [47].

4.4. Gene Structure and Motif Analysis of the IFS Gene Family Members in Three Glycyrrhiza Species

We used the online tool Gene Structure Display Server 2.0 to visualize the gene structure of IFS genes [48]. The online tool MEME (http://genocat.tools/tools/meme.html, accessed on 20 August 2024) was used to obtain the motifs, and the results were presented using TBtools software (Version 2.056) [49].

4.5. The Analysis of IFS Promoter Genes in Three Glycyrrhiza Species

The 1500 bp upstream genomic sequences of the IFS genes were analyzed using PlantCARE (http://bioinformatics.psb.ugent.be/webtools/plantcare/html/, accessed on 25 August 2024) to search for the distribution of cis-regulatory elements [50]. We used the TBtools application (Version 2.056) to draft a heatmap of cis-regulatory elements.

4.6. Synteny and Duplication Analysis

We used the Multiple Collinearity Scan toolkit to analyze the duplication events [51]. The collinearity analysis was mapped using the TBtools application (Version 2.056). The collinear gene pairs of IFS gene family members among the three Glycyrrhiza species were listed in Table S3. We calculated the synonymous (Ks), non-synonymous (Ka), and Ka/Ks ratios using the KaKs Calculator (https://sourceforge.net/projects/kakscalculator2/, accessed on 25 August 2024).

4.7. Yeast Library Screening and Y1H Assay

The 1500 bp promoter fragments of GgIFS9 were cloned from G. glabra and then inserted into the pHIS2 vector (Clontech, Mountain View, CA, USA). The pHIS2 vector was linearized and transformed into the yeast strain Y187. The transformed yeast cells were evenly plated on SD-Trp/-Leu with different concentrations of 3-aminotriazole (3-AT) to determine the minimal inhibitory concentration of 3-AT, followed by incubation at 30 °C for 3–5 days. The minimal 3-AT concentration that could significantly inhibit yeast strain growth was selected for yeast library screening. Through yeast library screening, candidate transcription factors (TFs) were identified (Table S4). The coding sequences of TFs were cloned and then inserted into the pGADT7 vector (Clontech, Mountain View, CA, USA). The promoter of GgIFS9 was inserted into the placzi vector (Clontech, Mountain View, CA, USA). The yeast strain EGY48 was co-transformed with JG45 prey vectors containing candidate TFs and the promoter of GgIFS9, followed by incubation at 30 °C for 3–5 days.

4.8. In Vivo Dual-Luciferase Assay

In the dual-luciferase (LUC) reporter assay, 1500 bp promoter fragments upstream of the GgIFS gene from genomic DNA were amplified and individually cloned into the pGreenII 0800-LUC vector before the firefly luciferase LUC reporter gene. The GgARF4 gene was inserted into the pGreenII 62-SK vector. These vectors were then introduced into Agrobacterium tumefaciens strain GV3101 and co-infiltrated into the epidermal cells of N. tabacum leaves. After 60 h of incubation, the leaves were daubed with D-Luciferin potassium, and then the signals of the leaves were visualized in the IVScope 7000 plant in vivo imaging system (Shanghai Qinxiang Scientific Instrument Co., Ltd., Shanghai, China). The activities of LUC and REN (Renilla luciferase) were quantified using the Dual-Luciferase Reporter Assay System (Promega Corp., Madison, WI, USA). Three independent biological replicates were conducted in the experiment.

4.9. EMSA

We used the Thermos Scientific Lightshift Kit (ThermoFisher, Shanghai, China) to perform the EMSA. The promoter fragment of the GgIFS9 gene was labeled with biotin of the probe. The probe sequence was listed in Table S6. Three independent biological replicates were conducted in the experiment.

4.10. RNA-Seq Analysis and qRT-PCR Analysis of GgIFS Genes

With a temperature of 25 °C, a 16 h/8 h night cycle a day, and 60–70% relative humidity, we grew G. glabra. Using 2 µM IAA and water, we applied the treatment to G. glabra. The roots of G. glabra were frozen in liquid nitrogen and then stored at −80 °C until use. Using the primer premier software, we designed the qRT-PCR primers, and the total RNA was extracted using the RNAprep Pure Plant Kit (TIANGEN, Beijing, China) [52]. Using agarose gel (1.0%) electrophoresis, we assessed the quality of the extracted RNA, and using NanoDrop One (Thermo Fisher Scientific, USA, Waltham), we measured the concentration and purity (OD260/OD280). An amount of 1 µg of total RNA was reversely transcribed into cDNA using the FastKing One Step RT-PCR Kit (TIANGEN, Beijing, China). Using SuperReal PreMix Plus (SYBR Green) (TIANGEN, Beijing, China), we performed qRT-PCR. The mixture contained 20 µL: 2 × 10 µL SuperReal PreMix Plus, 0.6 µLforward primer, 0.6 µL reverse primer, 2 µL cDNA, and 6.8 µL RNase-free H2O. The primers are listed in Table S5. The qRT-PCR reaction conditions were set at 95 °C for 15 min, followed by 40 cycles of 95 °C for 10 s, 60 °C for 20 s, and 72 °C for 20 s, followed by 95 °C for 15 s, 60 °C for 1 min and 95 °C for 15 s. The expression of genes was calculated by the 2−△△CT method, and three biological replicates were taken for each.
Three biological replicates were set for each control. The raw sequencing data were processed by using FastQC (Cambridge, Cambridgeshire, United Kingdom) and Trimmomatic (Forschungszentrum Jülich & University of Düsseldorf, North Rhine-Westphalia, Germany), and low-quality reads were removed to obtain clean reads. The clean reads were mapped onto the G. glabra genome using HISAT2. The levels of gene expression were normalized using per kilobase of transcript per Million mapped reads (FPKM). DESeq2 software (Version 1.42.x) was used for screening of the DEGs. The threshold parameters used for screening the DEGs were an FDR < 0.05 and a fold change (FC) ≥ 2. Using the online website for Gene Ontology (GO) (http://geneontology.org/, accessed on 15 September 2024) and KEGG (http://www.genome.jp/kegg/pathway.html, accessed on 25 September 2024), we performed enrichment analysis to identify functional annotations related to metabolic pathways. The DEGs of the RNA-Seq were listed in Table S7.

4.11. β-Glucuronidase (GUS) Staining and GUS Activity

The 1500 bp promoter of GgIFS9 was amplified using genomic DNA as the template. The fragment was inserted into the pCAMBIA1304 empty vector. The pCAMBIA1304::GgIFS9 plasmid was inserted into Agrobacterium tumefaciens strain GV3101 and co-infiltrated into the epidermal cells of leaves in N. tabacum. We used the GUS Straining Kit (Coolaber, Beijing, China) to detect the GUS activity. Three independent biological replicates were conducted in the experiment.

4.12. Statistical Analysis

Mean values and standard errors were calculated using Microsoft Excel software. Student’s t test was conducted with the SPSS program (Version 23.0) to determine the significance of differences between the control and treated samples or between time points. The significance threshold was set at p < 0.01.

5. Conclusions

Through genome-wide identification and analysis, this study comprehensively identified 9, 9, and 10 IFS genes in G. uralensis, G. inflata and G. glabra, elucidating the pivotal role of GgIFS9 in isoflavone biosynthesis in G. glabra. This study is the first to identified the molecular mechanism by which auxin response factor GgARF4 regulates GgIFS9 expression. These findings provide crucial theoretical insights into the regulatory network of plant isoflavone biosynthesis.

Supplementary Materials

The following are available online at https://www.mdpi.com/article/10.3390/ijms262110435/s1.

Author Contributions

Conceptualization, H.L., S.S. and S.X.; methodology, Q.X. (Quanliang Xie), X.H., S.C., J.G. and L.Z.; software, Z.L. (Ziqi Li), S.K. and X.C.; validation, Q.X. (Qing Xu) and X.H.; formal analysis, J.G. and L.Z.; investigation, Qing Xu., X.H., Z.L. (Ziqi Li) and S.C.; resources, Q.X. (Qing Xu), Z.L. (Zihan Li), S.K. and X.C.; data curation, X.H.; writing—original draft preparation, X.H.; writing—review and editing, S.S. and H.L.; visualization, S.X. and Z.L. (Zihan Li); supervision, S.X., F.W., S.S., H.L. and X.H.; project administration, S.S. and S.X. All authors have read and agreed to the published version of the manuscript.

Funding

This research was supported by Ministry of Education Key Laboratory of Xinjiang Phytomedicine Resource Utilization Project (Grant number XPRU202002), Science and Technology Project of Bingtuan (Grant number 2023AB052, 2023CB008-17, 2024DA021), Natural Science Foundation of China (Grant number 32260083), Tianchi Talent Project of Xinjiang (Grant number CZ001604), Science and Technology Project of Shihezi University (Grant number ZZZC201929B, KX6077).

Institutional Review Board Statement

Not applicable.

Informed Consent Statement

Not applicable.

Data Availability Statement

All data are presented in the article and Supplementary Materials. All authors agree with the MDPI Research Data Policies.

Conflicts of Interest

The authors declare no conflicts of interest.

Abbreviations

IFS: Isoflavone synthase; GgARF4: auxin response factor 4 in Glycyrrhiza glabra; DEGs: differentially expressed genes; GUS: β-Glucuronidase; qRT-PCR: quantitative reverse transcription chain reaction.

References

  1. Nomura, T.; Fukai, T.; Akiyama, T. Chemistry of phenolic compounds of licorice (Glycyrrhiza species) and their estrogenic and cytotoxic activities. Pure Appl. Chem. 2002, 74, 1199–1206. [Google Scholar] [CrossRef]
  2. Han, J.-B.; Wu, Y.; Wang, S.; Yi, L.; Qiu, R.; Zhou, H. Chemical constituents and chemotaxonomic study of Glycyrrhiza glabra L. Biochem. Syst. Ecol. 2020, 92, 104130. [Google Scholar]
  3. Yin, Y.; Tian, X.; He, X.; Yang, Z.; Fang, W. Exogenous melatonin stimulated isoflavone biosynthesis in NaCl-stressed germinating soybean (Glycine max L.). Plant Physiol. Biochem. 2022, 185, 123–131. [Google Scholar] [CrossRef]
  4. Qin, W.T.; Zhang, J.; Wu, J.H.; Sun, G.Z.; Yang, W.Y.; Liu, J. Effects of drought stress on biosynthesis of isoflavones in soybean seedling. Chin. J. Appl. Ecol. 2016, 27, 3927–3934. [Google Scholar]
  5. Lozovaya, V.V.; Lygin, A.V.; Ulanov, A.V.; Nelson, R.L.; Dayde, J.; Widholm, J.M. Effect of Temperature and Soil Moisture Status during Seed Development on Soybean Seed Isoflavone Concentration and Composition. Crop Sci. 2005, 45, 1934–1940. [Google Scholar] [CrossRef]
  6. Chen, M.; Zhao, H.; Cheng, Y.; Wang, L.; Alotaibi, S.H.; Zhang, Y. Anti-human Glioma Cancer Potentials of Neobavaisoflavone as Natural Antioxidant Compound and Its Inhibition Profiles for Acetylcholinesterase and Butyrylcholinesterase Enzymes with Molecular Modeling and Spin Density Distributions Studies. J. Oleo Sci. 2022, 71, 277–288. [Google Scholar] [CrossRef]
  7. Ahmad, A.; Biersack, B.; Li, Y.; Bao, B.; Kong, D.; Ali, A.; Banerjee, S.; Sarkar, F.H. Perspectives on the role of isoflavones in prostate cancer. AAPS J. 2013, 15, 991–1000. [Google Scholar] [CrossRef]
  8. Zhang, Z.; Wang, C.Z.; Du, G.J.; Qi, L.W.; Calway, T.; He, T.C.; Du, W.; Yuan, C.S. Genistein induces G2/M cell cycle arrest and apoptosis via ATM/p53-dependent pathway in human colon cancer cells. Int. J. Oncol. 2013, 43, 289–296. [Google Scholar] [CrossRef]
  9. Mahmoud, A.M.; Yang, W.; Bosland, M.C. Soy isoflavones and prostate cancer: A review of molecular mechanisms. J. Steroid Biochem. Mol. Biol. 2014, 140, 116–132. [Google Scholar] [CrossRef]
  10. Barnes, S. Mechanisms of Action of Isoflavones in Cancer Prevention. In Bioactive Compounds and Cancer; Nutrition and Health; Milner, J.A., Romagnolo, D.F., Eds.; Humana Press: Totowa, NJ, USA, 2010; pp. 633–670. [Google Scholar]
  11. Lu, Y.; An, Y.; Lv, C.; Ma, W.; Xi, Y.; Xiao, R. Dietary soybean isoflavones in Alzheimer’s disease prevention. Asia Pac. J. Clin. Nutr. 2018, 27, 946–954. [Google Scholar] [PubMed]
  12. Schreiner, M.; Mewis, I.; Huyskens-Keil, S.; Jansen, M.A.K.; Zrenner, R.; Winkler, J.B.; Krumbein, A. UV-B-Induced Secondary Plant Metabolites—Potential Benefits for Plant and Human Health. Crit. Rev. Plant Sci. 2012, 31, 229–240. [Google Scholar] [CrossRef]
  13. Saini, S.; Sharma, I.; Kaur, N.; Pati, P.K. Auxin: A master regulator in plant root development. Plant Cell Rep. 2013, 32, 741–757. [Google Scholar] [CrossRef]
  14. Li, Y.; Han, S.; Qi, Y. Advances in structure and function of auxin response factor in plants. J. Integr. Plant Biol. 2023, 65, 617–632. [Google Scholar] [CrossRef]
  15. Wang, L.; Yin, F.; Zhu, W.; Zhang, M.; Xiao, X.; Yao, Y.; Ge, F.; Wang, W. Transcriptomics integrated with targeted metabolomics reveals endogenous hormone changes in tuberous root expansion of Pueraria. BMC Genom. 2024, 25, 1112. [Google Scholar] [CrossRef]
  16. Wang, J.; Diao, R.; Wu, Z.; Wan, S.; Yang, S.; Li, X. Transcriptomic and Metabolomic Analyses Reveal the Roles of Flavonoids and Auxin on Peanut Nodulation. Int. J. Mol. Sci. 2023, 24, 10152. [Google Scholar] [CrossRef]
  17. Mnafgui, W.; Hajlaoui, H.; Rizzo, V.; Muratore, G.; Eleuch, A. Priming with EDTA, IAA and Fe alleviates Pb toxicity in Trigonella Foneum graecum L. growth: Phytochemicals and secondary metabolites. J. Biotechnol. 2022, 356, 42–50. [Google Scholar] [CrossRef] [PubMed]
  18. Chen, H.; Zhang, X.; Feng, Y.; Rui, W.; Shi, Z.; Wu, L. Bioactive components of Glycyrrhiza uralensis mediate drug functions and properties through regulation of CYP450 enzymes. Mol. Med. Rep. 2014, 10, 1355–1362. [Google Scholar] [CrossRef]
  19. Křížová, L.; Dadáková, K.; Kašparovská, J.; Kašparovský, T. Isoflavones. Molecules 2019, 24, 1076. [Google Scholar] [CrossRef]
  20. Dakora, F.D.; Phillips, D.A. Diverse functions of isoflavonoids in legumes transcend anti-microbial definitions of phytoalexins. Physiol. Mol. Plant Pathol. 1996, 49, 1–20. [Google Scholar] [CrossRef]
  21. Du, H.; Huang, Y.; Fau-Tang, Y.; Tang, Y. Genetic and metabolic engineering of isoflavonoid biosynthesis. Appl. Microbiol. Biotechnol. 2010, 86, 1293–1312. [Google Scholar] [CrossRef]
  22. Kim, B.G.; Kim, S.Y.; Song, H.S.; Lee, C.; Hur, H.G.; Kim, S.I.; Ahn, J.H. Cloning and expression of the isoflavone synthase gene (IFS-Tp) from Trifolium pratense. Mol. Cells 2003, 15, 301–306. [Google Scholar] [CrossRef]
  23. Jung, W.; Yu, O.; Lau, S.M.; O’Keefe, D.P.; Odell, J.; Fader, G.; McGonigle, B. Identification and expression of isoflavone synthase, the key enzyme for biosynthesis of isoflavones in legumes. Nat. Biotechnol. 2000, 18, 208–212, Erratum in Nat. Biotechnol. 2000, 18, 559. [Google Scholar] [CrossRef]
  24. Overkamp, S.; Hein, F.; Barz, W. Cloning and characterization of eight cytochrome P450 cDNAs from chickpea (Cicer arietinum L.) cell suspension cultures. Plant Sci. 2000, 155, 101–108. [Google Scholar]
  25. Shimada, N.; Akashi, T.; Aoki, T.; Ayabe, S. Induction of isoflavonoid pathway in the model legume Lotus japonicus: Molecular characterization of enzymes involved in phytoalexin biosynthesis. Plant Sci. 2000, 160, 37–47. [Google Scholar] [CrossRef] [PubMed]
  26. Steele, C.L.; Gijzen, M.; Qutob, D.; Dixon, R.A. Molecular characterization of the enzyme catalyzing the aryl migration reaction of isoflavonoid biosynthesis in soybean. Arch. Biochem. Biophys. 1999, 367, 146–150. [Google Scholar] [CrossRef] [PubMed]
  27. Sajid, M.; Stone, S.R.; Kaur, P. Phylogenetic Analysis and Protein Modelling of Isoflavonoid Synthase Highlights Key Catalytic Sites towards Realising New Bioengineering Endeavours. Bioengineering 2022, 9, 609. [Google Scholar] [CrossRef]
  28. Karin, M. Too many transcription factors: Positive and negative interactions. New Biol. 1990, 2, 126–131. [Google Scholar]
  29. Han, X.Y.; Yin, Q.G.; Liu, J.Y.; Jiang, W.B.; Di, S.K.; Pang, Y.Z. GmMYB58 and GmMYB205 are seed-specific activators for isoflavonoid biosynthesis in Glycine max. Plant Cell Rep. 2017, 36, 1889–1902. [Google Scholar] [CrossRef]
  30. Wang, T.L. Functional Analysis of Soybean bHLH Transcription Factors GmbHLH3 and GmPIF1; Jilin University: Changchun, China, 2020. [Google Scholar]
  31. Bian, S.; Li, R.; Xia, S.; Liu, Y.; Jin, D.; Xie, X.; Dhanbhadel, S.; Zhai, L.; Wang, J.; Li, X. Soybean CCA1-like MYB transcription factor GmMYB133 modulates isoflavonoid biosynthesis. Biochem. Biophys. Res. Commun. 2018, 507, 324–329. [Google Scholar] [CrossRef] [PubMed]
  32. Lian, Y.; Li, H.; Wang, S.; Wu, Y.; Li, J.; Lei, C.; Lu, W. Expression Analysis of IFSI Gene in Isoflavonoids Pathway in Soybean. Acta Agric. Boreali-Sin. 2013, 28, 25–29. [Google Scholar]
  33. Wang, Z.; Gerstein, M.; Snyder, M. RNA-Seq: A revolutionary tool for transcriptomics. Nat. Rev. Genet. 2009, 10, 57–63. [Google Scholar] [CrossRef]
  34. Woodward, A.W.; Bartel, B. Auxin: Regulation, action, and interaction. Ann. Bot. 2005, 95, 707–735. [Google Scholar] [CrossRef]
  35. Jiang, W.; Xia, Y.; Su, X.; Pang, Y. ARF2 positively regulates flavonols and proanthocyanidins biosynthesis in Arabidopsis thaliana. Planta 2022, 256, 44. [Google Scholar] [CrossRef]
  36. Wang, Y.C.; Wang, N.; Xu, H.F.; Jiang, S.H.; Fang, H.C.; Su, M.Y.; ZHANG, Z.Y.; Zhang, T.L.; Chen, X.S. Auxin regulates anthocyanin biosynthesis through the Aux/IAA-ARF signaling pathway in apple. Hortic. Res. 2018, 5, 59. [Google Scholar] [CrossRef]
  37. Lewis, D.R.; Ramirez, M.V.; Miller, N.D.; Vallabhaneni, P.; Keith Ray, W.; Helm, R.F.; Winkel, B.S.J.; Muday, G.K. Auxin and ethylene induce flavonol accumulation through distinct transcriptional networks. Plant Physiol. 2011, 156, 144–164. [Google Scholar] [CrossRef] [PubMed]
  38. Zheng, X.; Zhang, X.; Zeng, F. The regulatory network composed of phytohormones, transcription factors and non-coding RNAs is involved in the flavonoids biosynthesis of fruits. Hortic. Plant J. 2025; in press. [Google Scholar] [CrossRef]
  39. Chen, Z.; Yu, L.; Liu, W.; Zhang, J.; Wang, N.; Chen, X. Research progress of fruit color development in apple (Malus domestica Borkh.). Plant Physiol. Biochem. 2021, 162, 267–279. [Google Scholar] [CrossRef] [PubMed]
  40. An, J.P.; Zhang, X.W.; Liu, Y.J.; Wang, X.F.; You, C.X.; Hao, Y.J. ABI5 regulates ABA-induced anthocyanin biosynthesis by modulating the MYB1-bHLH3 complex in apple. J. Exp. Bot. 2021, 72, 1460–1472. [Google Scholar] [CrossRef]
  41. Garcia-Hernandez, M.; Berardini, T.Z.; Chen, G.; Crist, D.; Doyle, A.; Huala, E.; Knee, E.; Lambrecht, M.; Miller, N.; Mueller, L.; et al. TAIR: A resource for integrated Arabidopsis data. Funct. Integr. Genom. 2002, 2, 239–253. [Google Scholar] [CrossRef] [PubMed]
  42. Finn, R.D.; Mistry, J.; Schuster-Böckler, B.; Grffiths-Jones, S.; Hollich, V.; Lassmann, T.; Moxon, S.; Marshall, M.; Khanna, A.; Durbin, R.; et al. Pfam: Clans, web tools and services. Nucleic Acids Res. 2006, 34, D247–D251. [Google Scholar] [CrossRef]
  43. Gasteiger, E.; Gattiker, A.; Hoogland, C.; Ivanyi, I.; Appel, R.; Bairoch, A. ExPASy: The proteomics server for in-depth protein knowledge and analysis. Nucleic Acids Res. 2003, 31, 3784–3788. [Google Scholar] [CrossRef]
  44. Chou, K.C.; Shen, H.B. A new method for predicting the subcellular localization of eukaryotic proteins with both single and multiple sites: Euk-mPLoc 2.0. PLoS ONE 2010, 5, e9931. [Google Scholar] [CrossRef]
  45. Kumar, S.; Stecher, G.; Li, M.; Knyaz, C. MEGA X: Molecular Evolutionary Genetics Analysis across Computing Platforms. Mol. Biol. Evol. 2018, 35, 1547–1549. [Google Scholar] [CrossRef]
  46. Subramanian, B.; Gao, S.; Lercher, M.J. Evolview v3: A webserver for visualization, annotation, and management of phylogenetic trees. Nucleic Acids Res. 2019, 47, W270–W275. [Google Scholar] [CrossRef] [PubMed]
  47. Chen, C.; Chen, H.; Zhang, Y.; Thomas, H.; Frank, M.; He, Y.; Xia, R. TBtools: An Integrative Toolkit Developed for Interactive Analyses of Big Biological Data. Mol. Plant 2020, 13, 1194–1202. [Google Scholar] [CrossRef] [PubMed]
  48. Hu, B.; Jin, J.; Guo, A.Y.; Zhang, H.; Luo, J.; Gao, G. GSDS 2.0: An upgraded gene feature visualization server. Bioinformatics 2015, 31, 1296–1297. [Google Scholar] [CrossRef]
  49. Bailey, T.L.; Johnson, J.; Grant, C.E.; Noble, W.S. The MEME Suite. Nucleic Acids Res. 2015, 43, W39–W49. [Google Scholar]
  50. Lescot, M.; Déhais, P.; Thijs, G.; Marchal, K.; Moreau, Y.; Peer, Y.; Rouzé, P.; Rombauts, S. PlantCARE, a database of plant cis-acting regulatory elements and a portal to tools for in silico analysis of promoter sequences. Nucleic Acids Res. 2002, 30, 325–327. [Google Scholar] [CrossRef]
  51. Xu, Y.; Bi, C.; Wu, G.; Wei, S.; Dai, X.; Yin, T.; Ye, N. VGSC: A Web-Based Vector Graph Toolkit of Genome Synteny and Collinearity. BioMed Res. Int. 2016, 2016, 7823429, Erratum in BioMed Res. Int. 2019, 2019, 2150291. [Google Scholar]
  52. Singh, V.K.; Mangalam, A.K.; Dwivedi, S.; Naik, S. Primer premier: Program for design of degenerate primers from a protein sequence. Biotechniques 1998, 24, 318–319. [Google Scholar] [CrossRef] [PubMed]
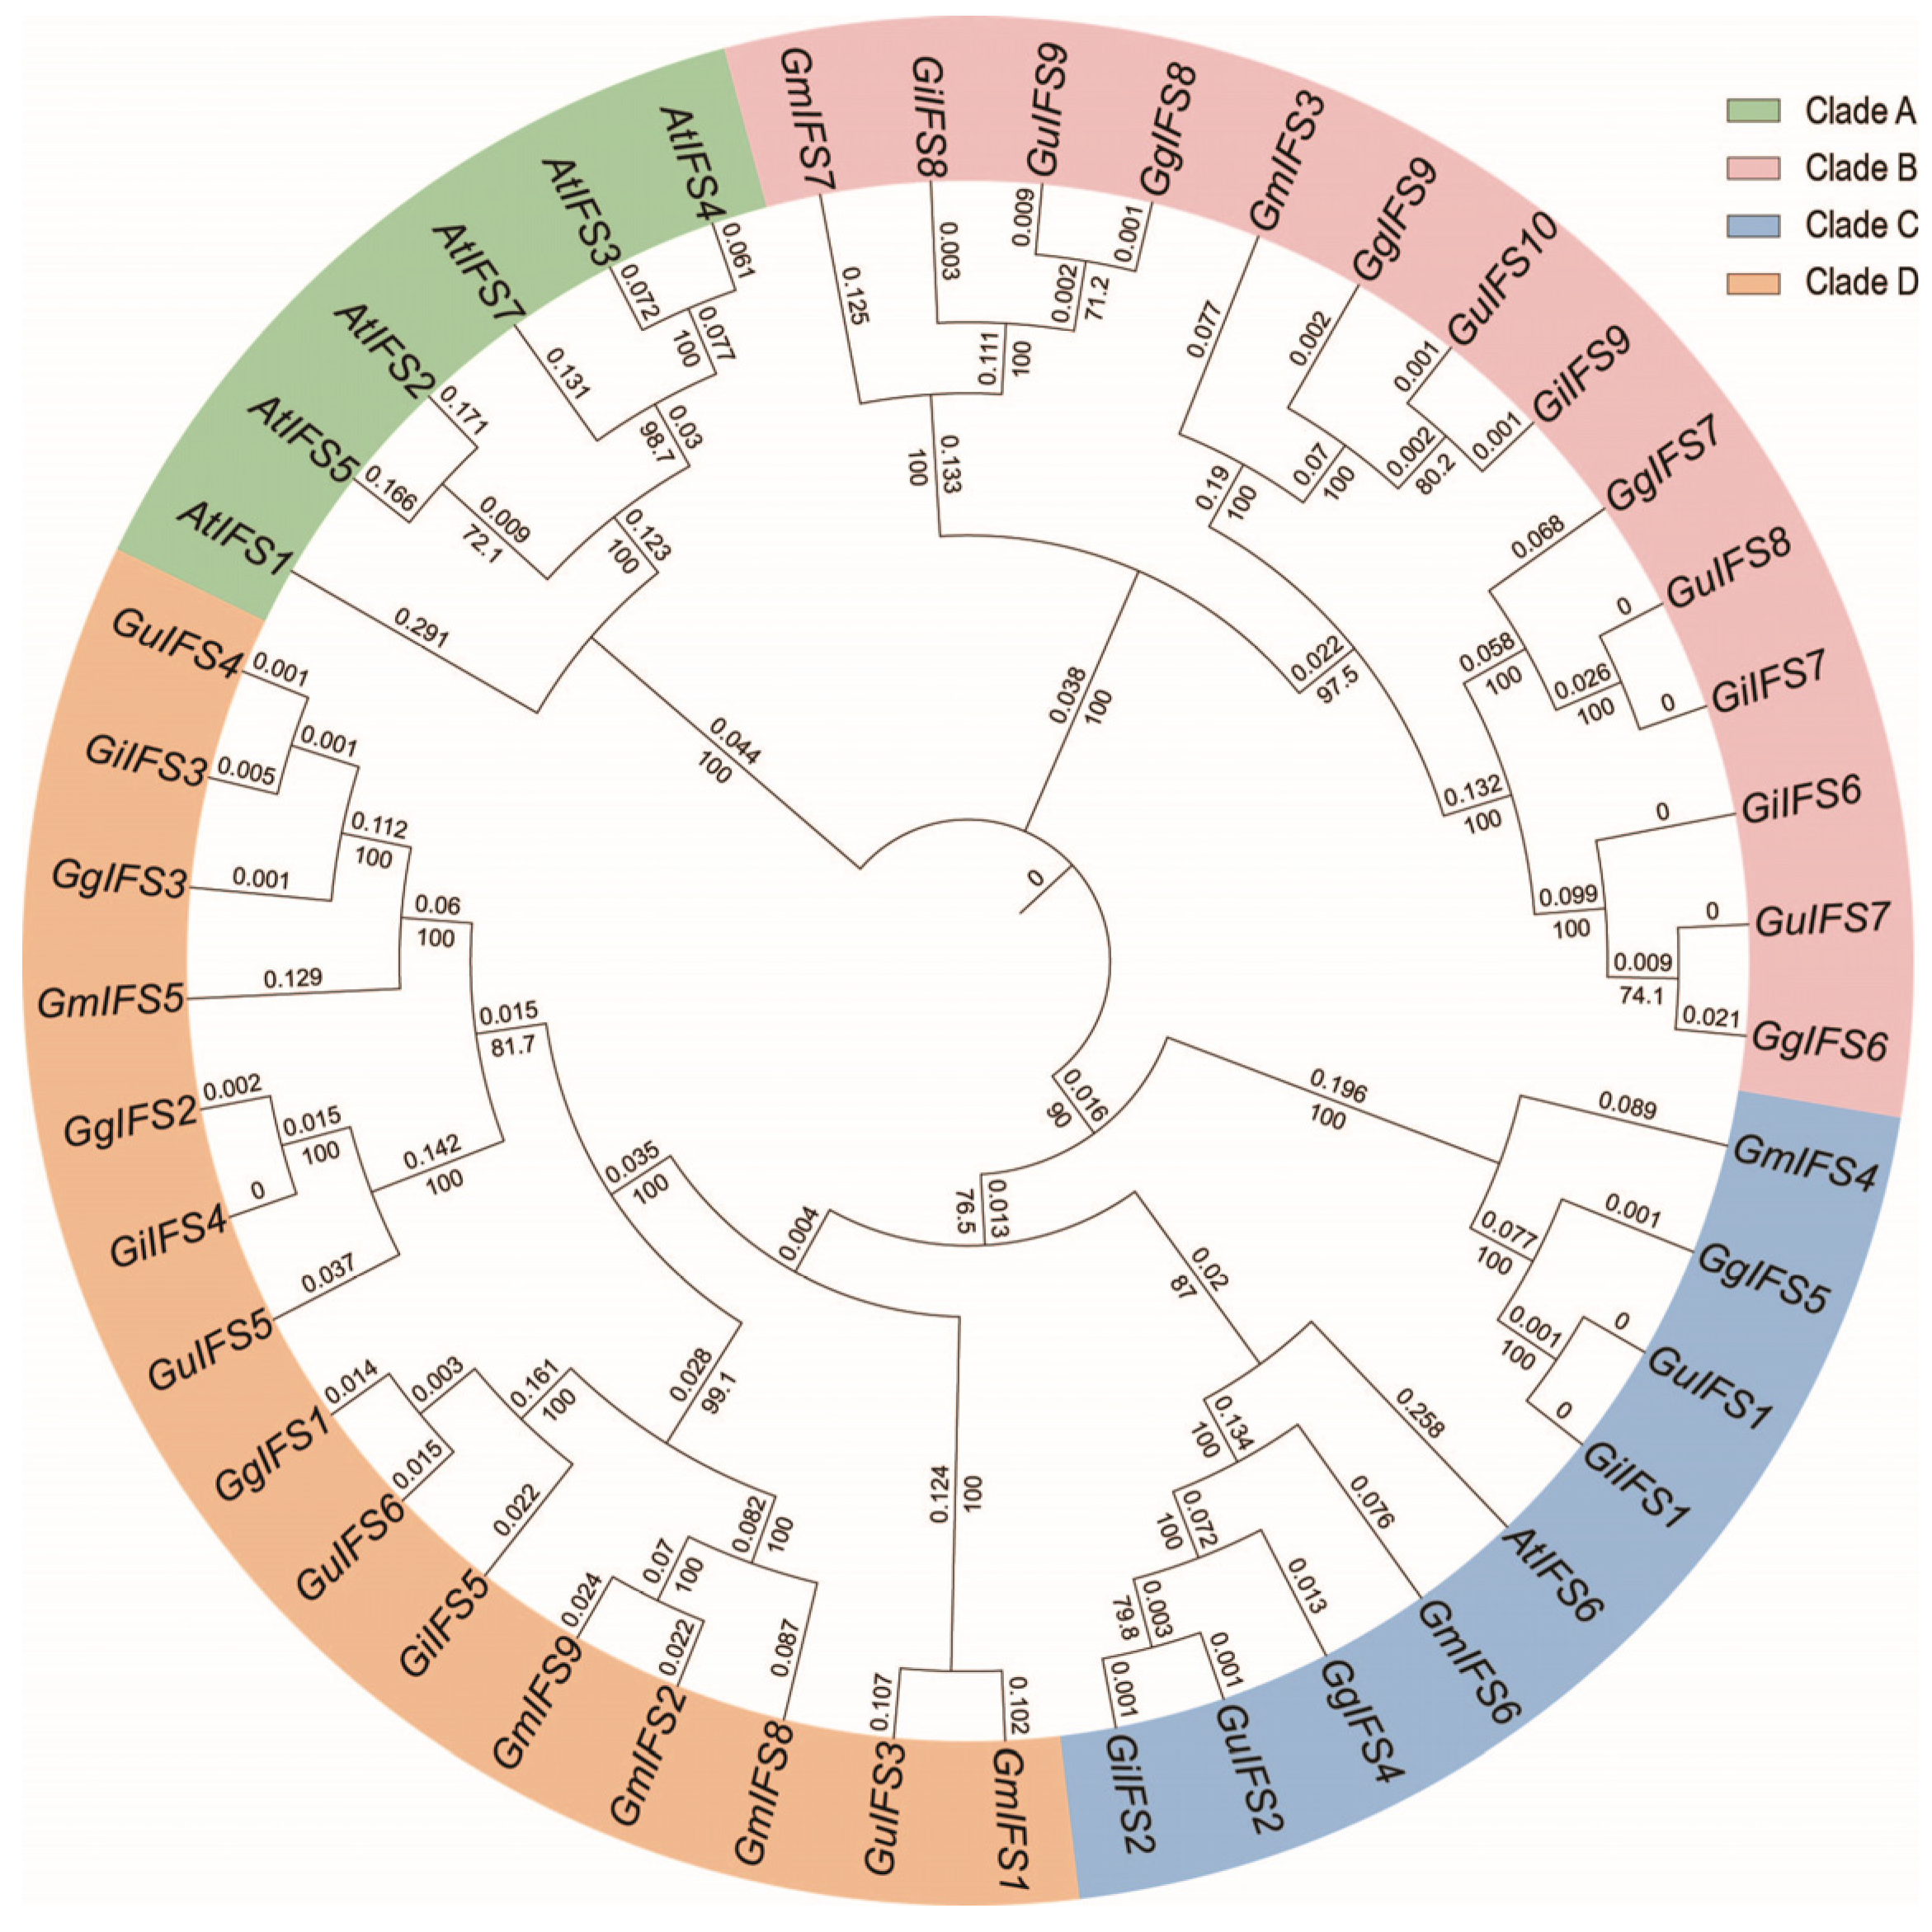
Figure 1. Phylogenetic analysis of the IFS gene family members in G. uralensis, G. inflata, G. glabra, G. max and A. thaliana. Gu, Gi, Gg, Gm and At represent G. uralensis, G. inflata, G. glabra, G. max and A. thaliana, respectively. The phylogenetic tree is divided into four branches: Clade A, Clade B, Clade C and Clade D. The namex of IFS genes on the branches represent different IFS gene members of each species, and the phylogenetic tree shows the degree of genetic relationship among these gene members.
Ijms 26 10435 g001
Figure 2. Distribution map of IFS family genes on the chromosomes of three Glycyrrhiza species. (AC) corresponds to G. glabra, G. inflata and G. uralensis, respectively. Chr2 and chr4 represents different chromosomes and different colors indicate different characteristics of the chromosomes. The IFS genes are marked in red and the arrows indicate their positions on the chromosomes. The scale on the left side of the chromosome represents the chromosome length (in Mb).
Ijms 26 10435 g002
Figure 3. Collinearity relationship diagram of IFS family genes among chromosomes of G. uralensis, G. inflata and G. glabra. Gu, Gi and Gg represent G. uralensis, G. inflata and G. glabra, respectively. Gg-Chr2–Gg-Chr4, Gi-Chr2–Gi-Chr4, and Gu-Chr2–Gu-Chr4 represent different chromosomes of the corresponding Glycyrrhiza species. The arrows represent gene location.
Ijms 26 10435 g003
Figure 4. Analysis of promoter cis-acting elements, conserved motifs and gene structure of IFS family genes in G. uralensis, G. inflata and G. glabra. (A) Analysis of the distribution of cis-acting elements in the promoter region of IFS genes. Different-colored ellipses represent different types of elements. The horizontal axis represents the base positions from the 5′ to the 3′ end of the promoter. (B) The heatmap of the number of different cis-acting elements in each IFS gene, which is reflected by the depth of color. The specific values are marked within the squares. (C) Phylogenetic tree-based evolutionary relationship analysis of IFS genes from different species. The branches reflect the degree of genetic relatedness. (D) Conserved motif analysis of the IFS genes from different species. Squares of different colors represent different motifs, visually presenting the types and positions of motifs contained in the genes. (E) Gene structure analysis of the IFS genes. The black lines and green bars represent the introns and exons, respectively.
Ijms 26 10435 g004
Figure 5. The GgARF4 protein binds directly to the promoter of the GgIFS9 gene and activates its expression. (A) Interaction between GgIFS9 and GgARF4 in the yeast one-hybrid (Y1H) assay. The placzi and JG45 empty vectors were used as negative controls. (B) Dual-luciferase assay conducted to determine the interaction between GgIFS9 and GgARF4 in tobacco in vivo. The pGreenⅡ 62-SK and pGreenⅡ 0800-LUC empty vectors were used as controls. (C) Quantification of LUC expression. The pGreenⅡ 62-SK and pGreenⅡ 0800-LUC empty vectors (0800/62sk), the pGreenⅡ 62-SK and pGreenⅡ0800-LUC-GgIFS (pGgIFS/62sk) empty vectors, the pGreenⅡ 62-SK-GgARF4 and pGreenⅡ 0800-LUC empty vectors (0800/GgARF4) were used as controls. The data have been normalized according to the LUC/REN standard. Statistical tests were conducted via one-way analysis of variance (ANOVA, *** p  <  0.001). (D) EMSA of GgARF4 and GgIFS9. The EMSA was performed as described in the Methods section. Cold and mutant competitor controls were not included in this experiment. Error bars represent the SD (n = 3). Statistical tests were conducted via one-way analysis of variance (ANOVA, *** p  <  0.001).
Ijms 26 10435 g005
Figure 6. Transcriptomic analysis between the wild-type and IAA-treated G. glabra. (A) KEGG annotation of DEGs. (B) GO annotation of DEGs. Three independent biological replicates were conducted in the experiment.
Ijms 26 10435 g006
Figure 7. Expression analysis of DGEs in the phenylpropanoid metabolic pathways. Dashed arrows indicate that intermediate steps are involved in the reaction, whereas solid arrows denote that the reaction proceeds in a single step without intermediates.
Ijms 26 10435 g007
Figure 8. GUS staining and GUS activity of the GgIFS9 promoter. (A) The negative control (the pCAMBIA1304 empty vector without the 35S promoter) (CK) subject to GUS staining. (B) The positive control (the pCAMBIA1304 empty vector with the 35S promoter) (35S::GUS) subject to GUS staining. (C) GUS staining of the pCAMBIA1304-GgIFS9 (IFSP::GUS) promoter under normal conditions. (D) GUS staining of the pCAMBIA1304-GgIFS9 (IAA_IFSP::GUS) promoter after IAA treatment. (E) GUS activity of the pCAMBIA1304 empty vector without the 35S promoter (CK), the pCAMBIA1304 empty vector with the 35S promoter (35S::GUS), the pCAMBIA1304-GgIFS9 promoter under normal conditions (IFSP::GUS) and the pCAMBIA1304-GgIFS9 promoter after IAA treatment (IAA_IFSP::GUS). The a, b, c, d represent significant differences among them. Scale bar = 2 mm. Error bars represent the SD (n = 3).
Ijms 26 10435 g008
Disclaimer/Publisher’s Note: The statements, opinions and data contained in all publications are solely those of the individual author(s) and contributor(s) and not of MDPI and/or the editor(s). MDPI and/or the editor(s) disclaim responsibility for any injury to people or property resulting from any ideas, methods, instructions or products referred to in the content.