
HGS Promotes Tumor Growth, Whereas the Coiled-Coil Domain and Its Oligopeptide of HGS Suppress It


Abstract
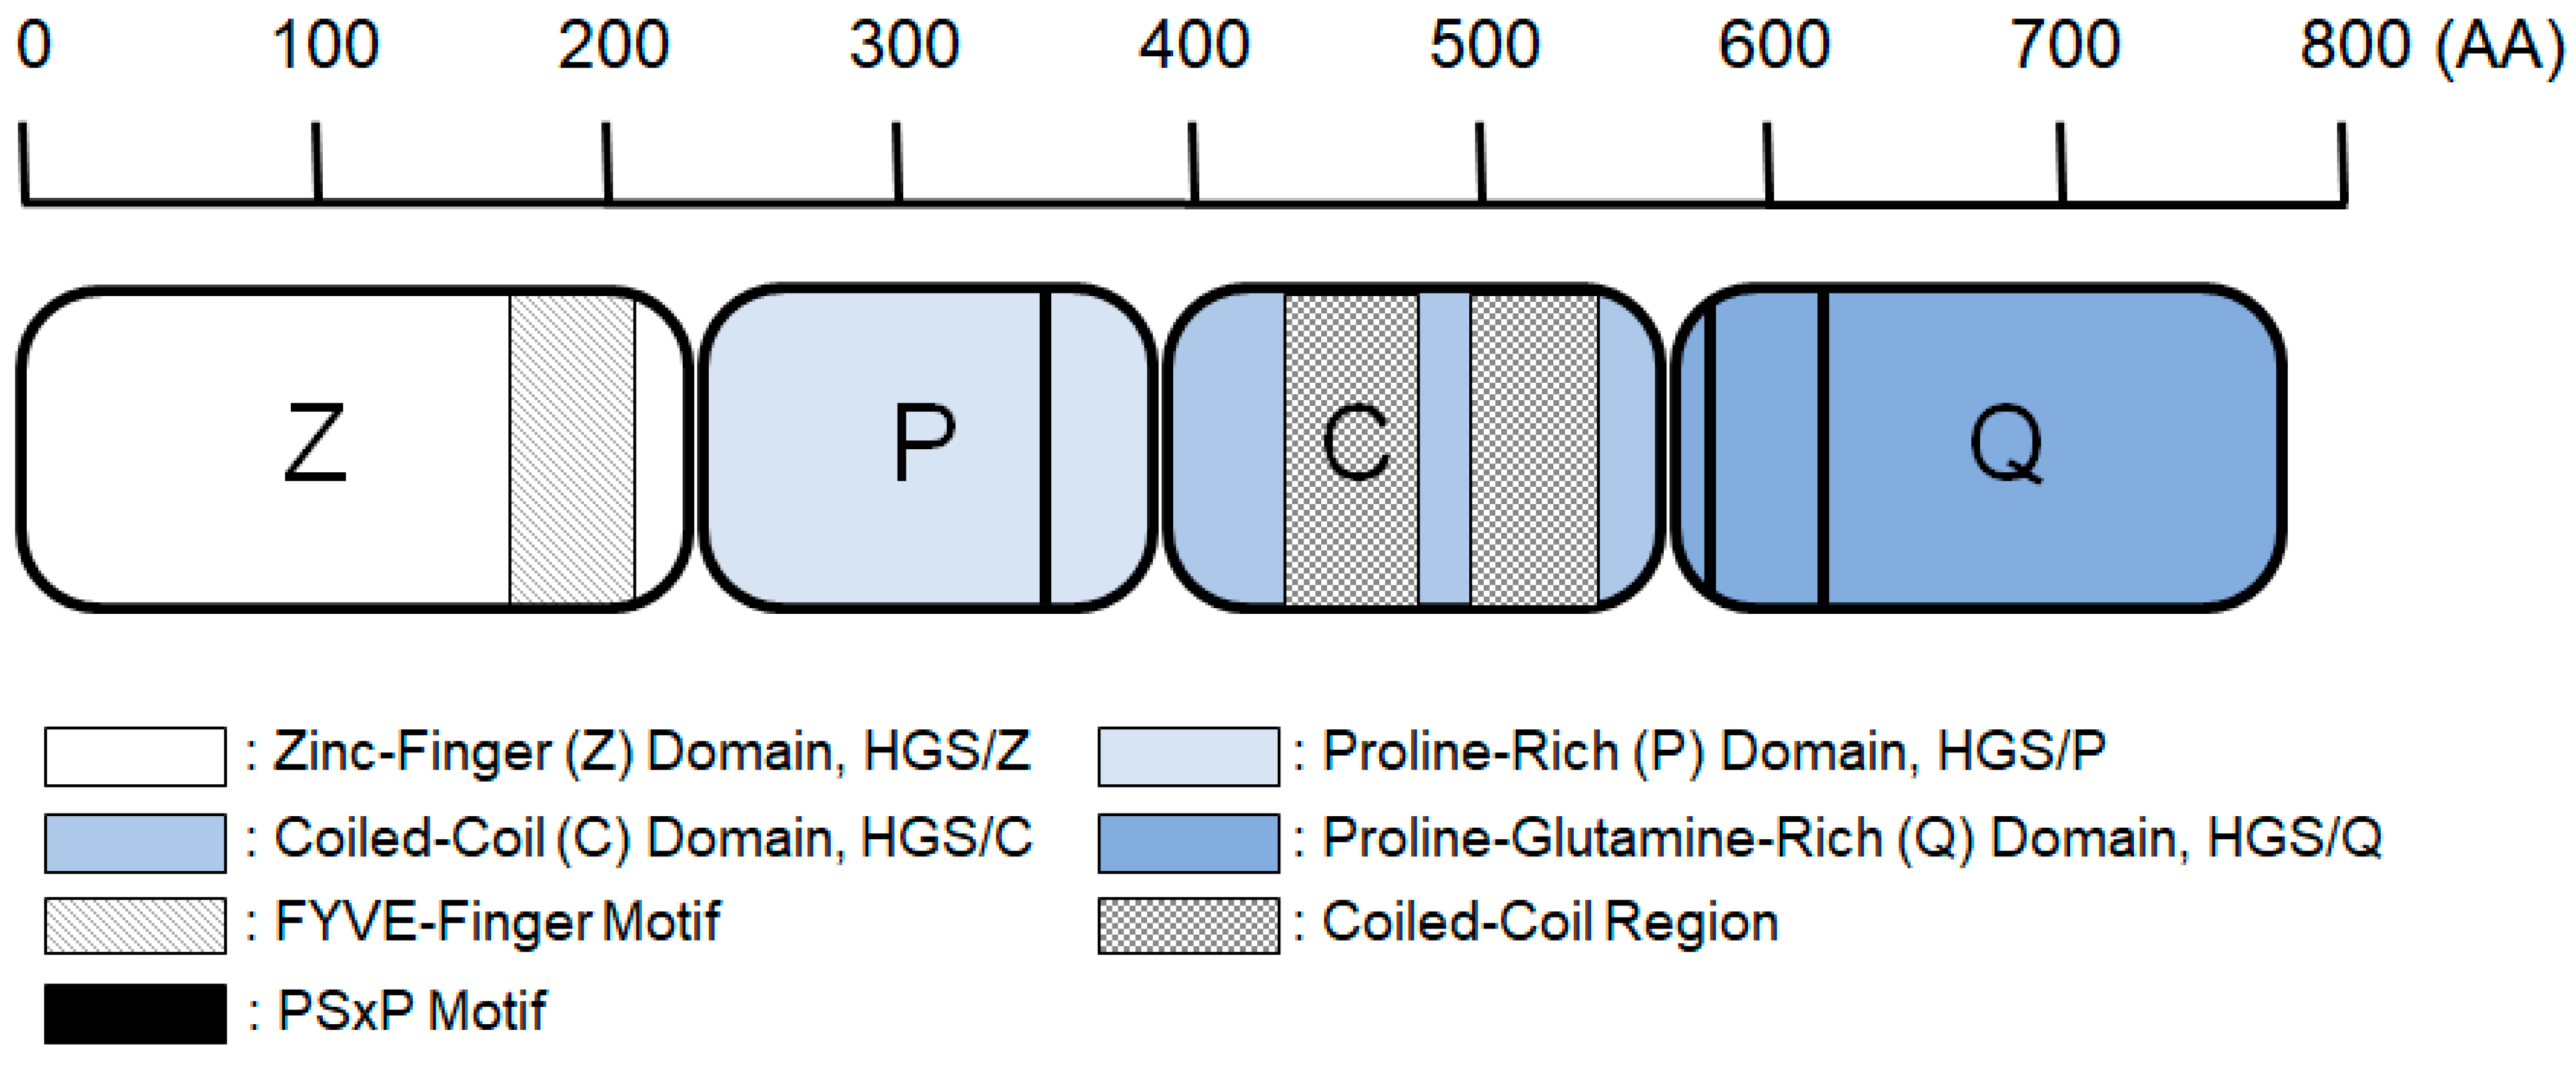
1. Introduction
2. Results
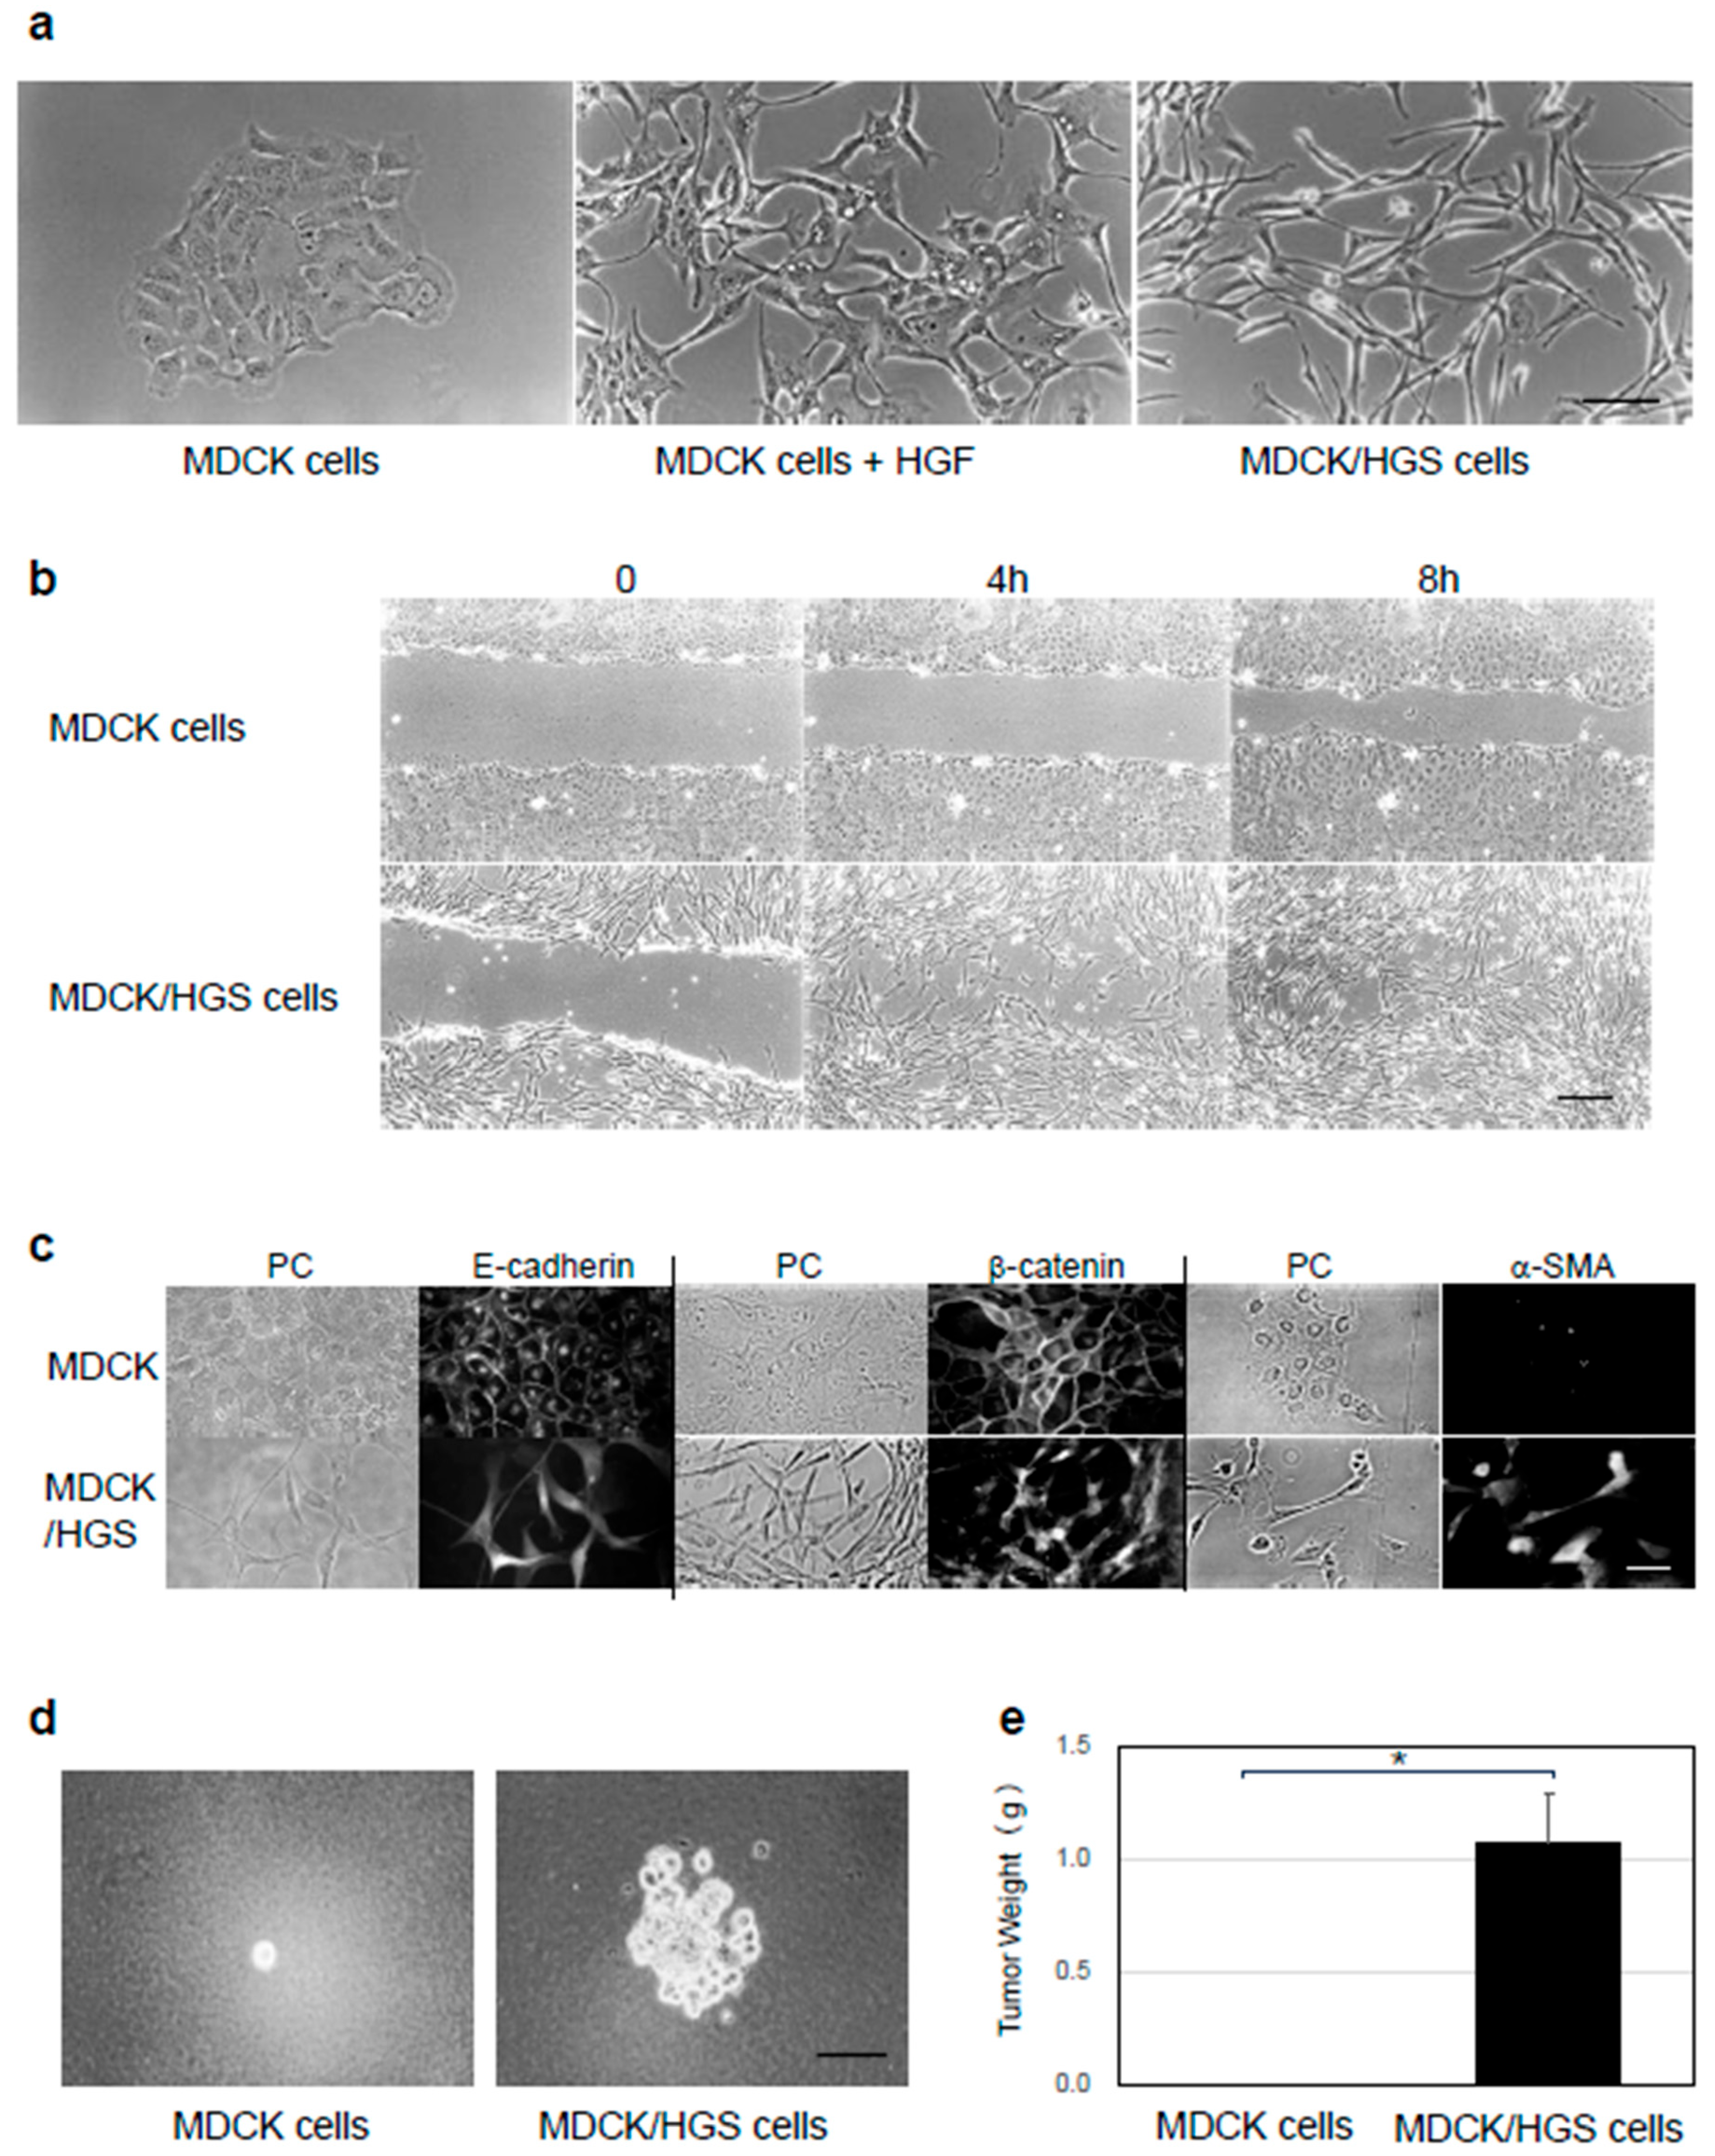
2.1. HGS Induces EMT in MDCK Cells
2.2. HGS/CQ Induces EMT, Whereas HGS/C Inhibits EMT
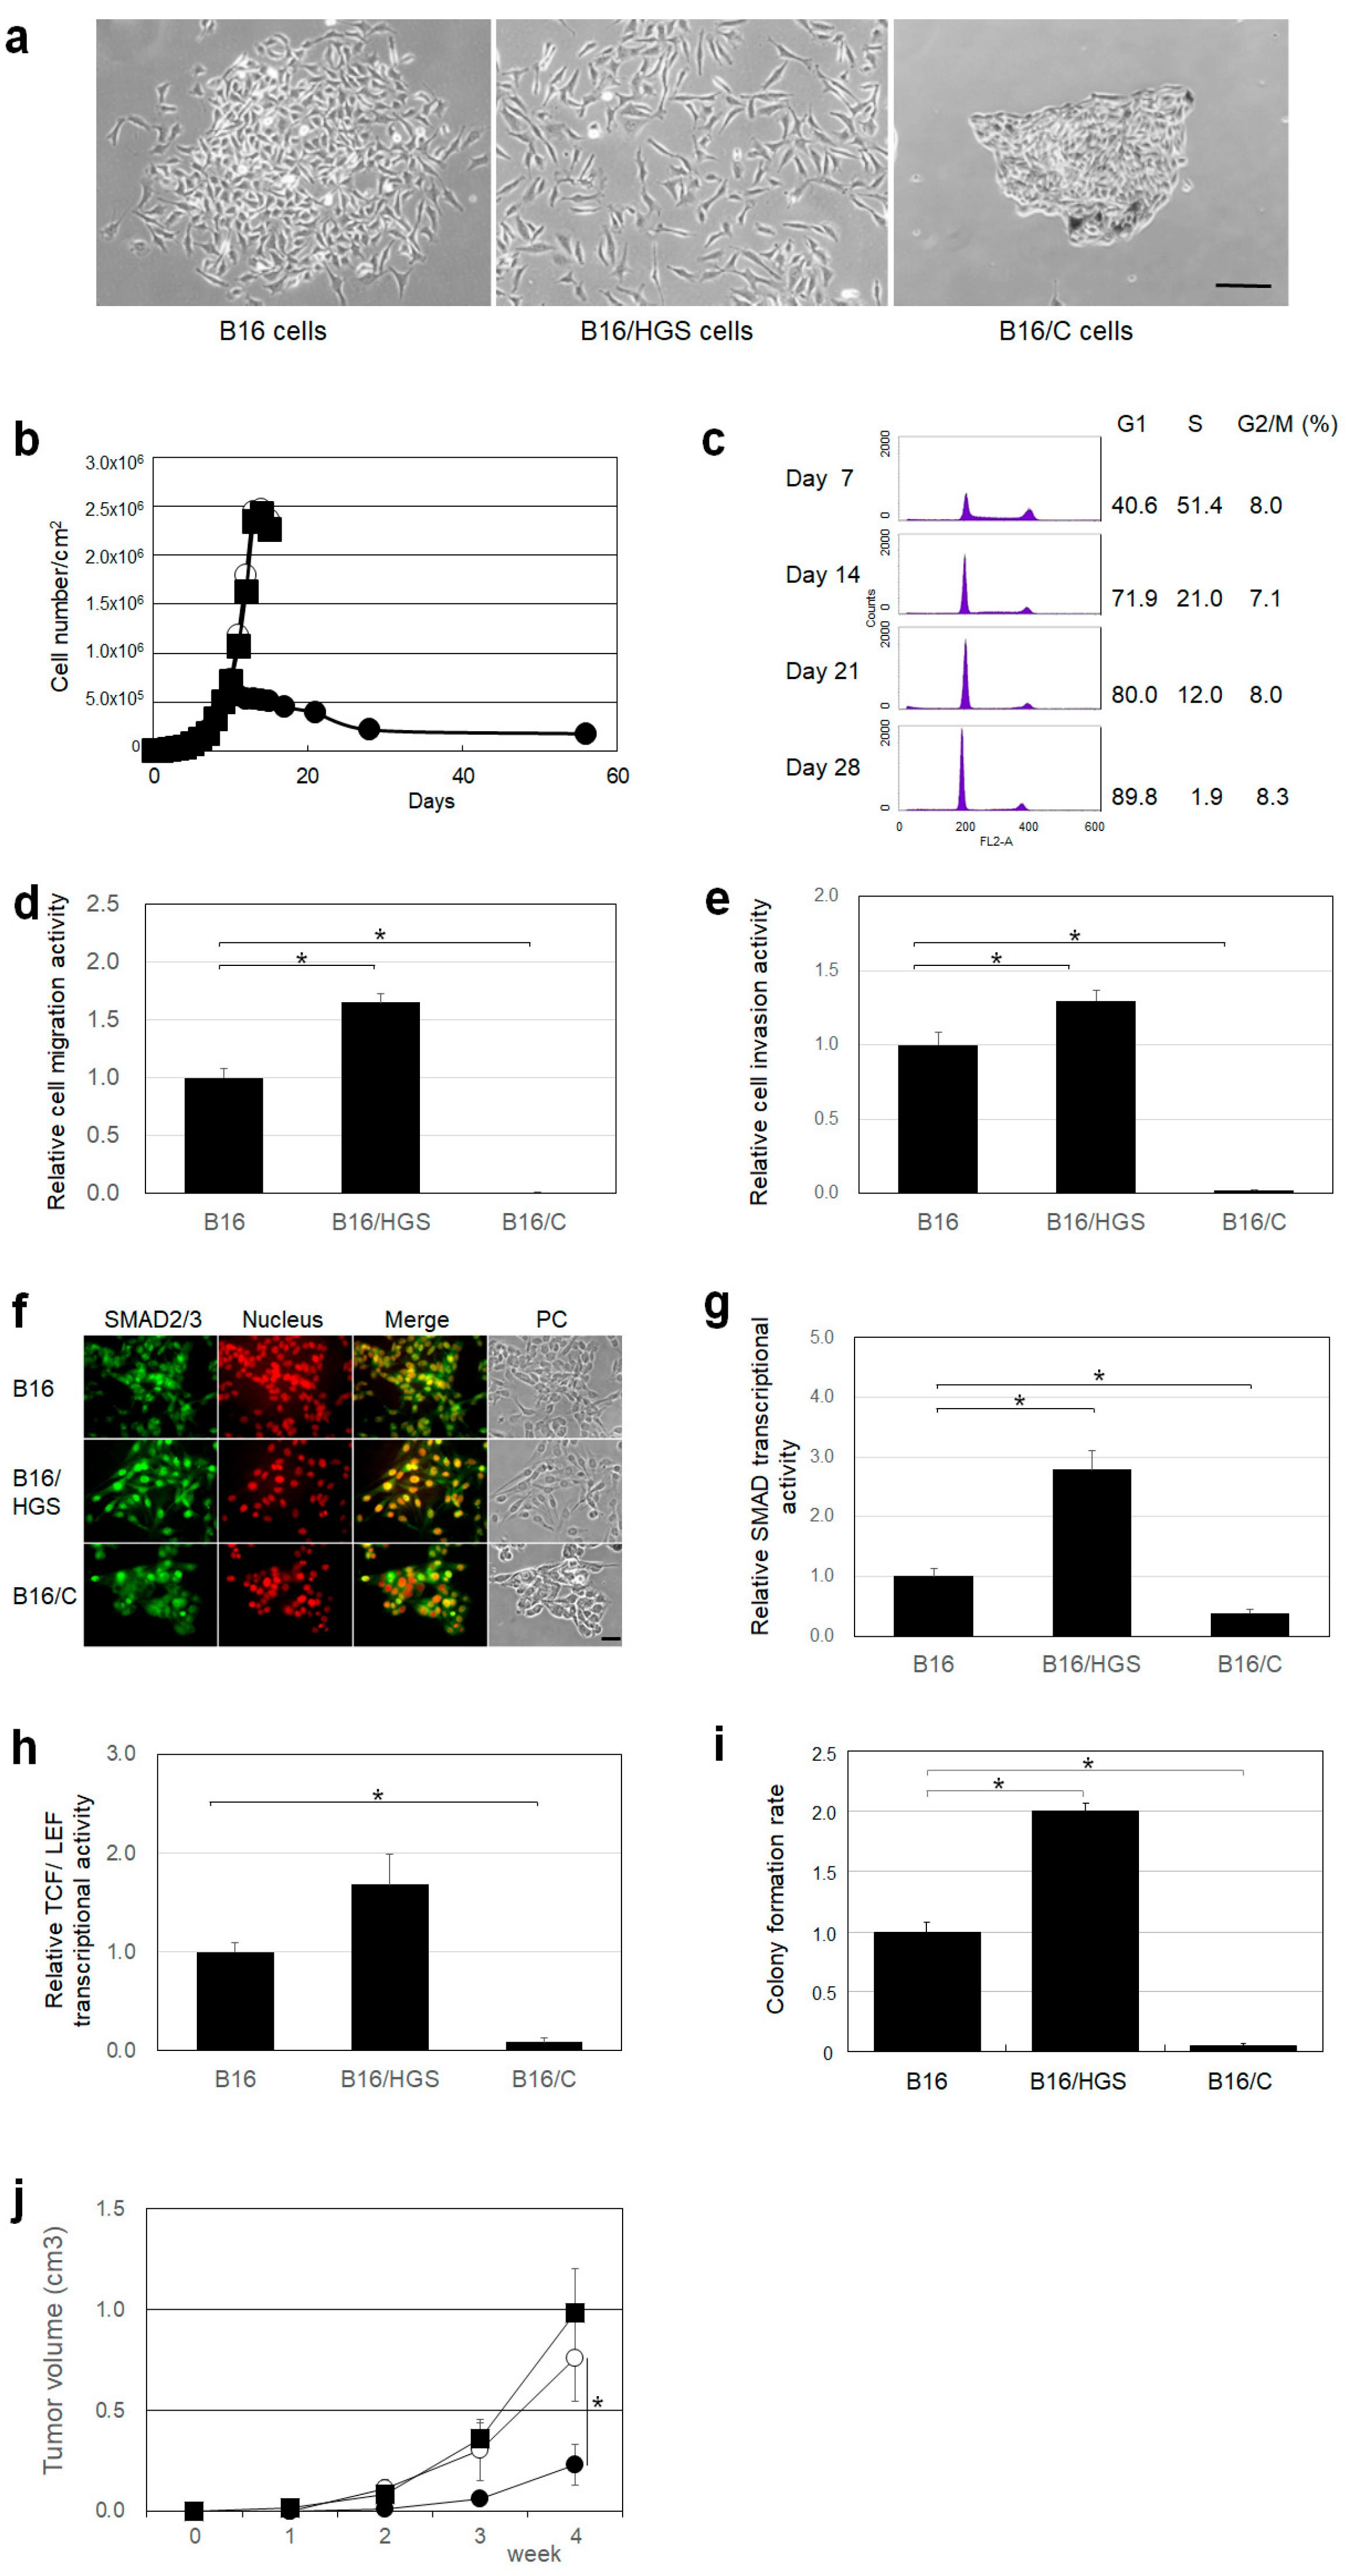
2.3. HGS Promotes Cancer Characteristics, Whereas HGS/C Suppresses Them in Mouse Melanoma B16 Cells
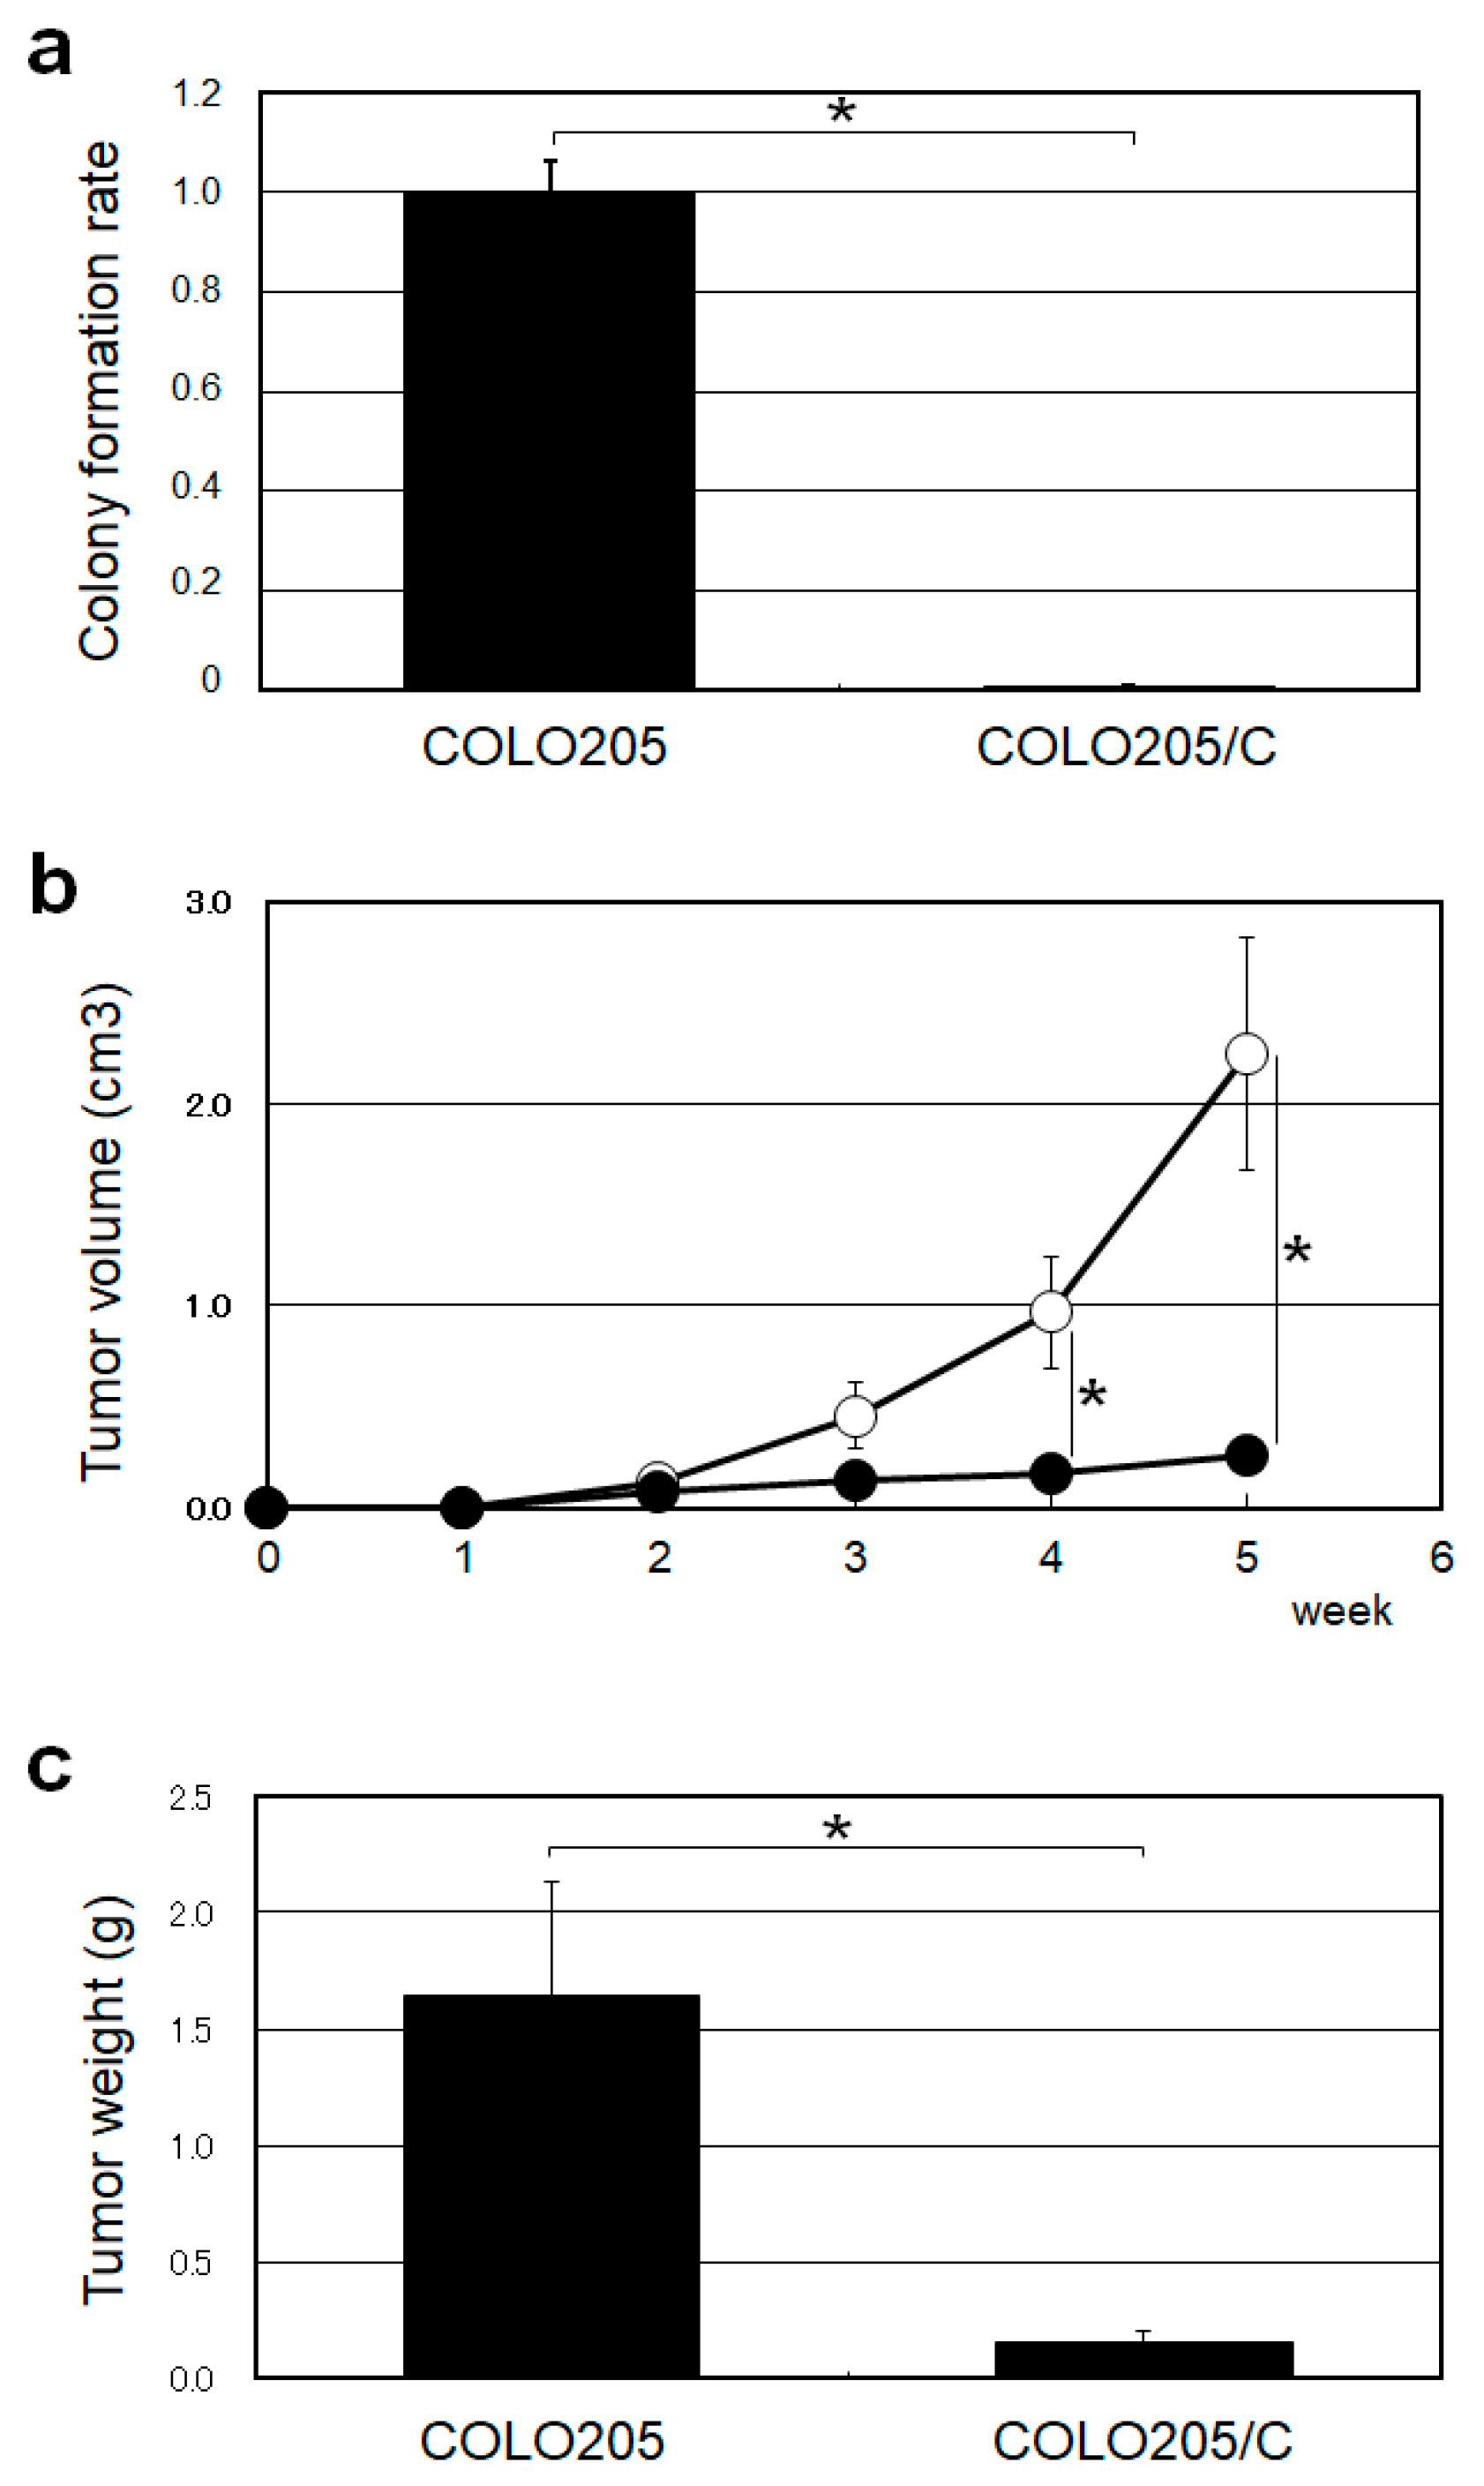
2.4. HGS/C Suppressed Tumorigenicity in Human Colorectal Cancer COLO205 Cells
2.5. Oligopeptides Constituting HGS/C
2.6. OP12-462 Inhibits Anchorage-Independent Growth
3. Discussion
4. Materials and Methods
4.1. Antibodies and Reagents
4.2. Proteins
4.3. Oligopeptides
4.4. Cells
4.5. Mice
4.6. Stable Transfectants
4.7. Immunocytochemical Analysis
4.8. Cell Culture in Soft Agar Medium
4.9. Tumor Formation in Mouse
4.10. Cell Motility and Invasive Assay
4.11. SMAD and TCF/LEF Response Element Assay
4.12. In Vitro Anchorage-Independent/Dependent Growth Inhibition Test
4.13. Oligopeptide Tumor Growth Inhibition Test
4.14. Statistical Analysis
Author Contributions
Funding
Institutional Review Board Statement
Informed Consent Statement
Data Availability Statement
Conflicts of Interest
Abbreviations
References
- Komada, M.; Kitamura, N. Growth factor-induced tyrosine phosphorylation of Hrs, a novel 115-kilodalton protein with a structurally conserved putative zinc finger domain. Mol. Cell. Biol. 1995, 15, 6213–6221. [Google Scholar] [CrossRef]
- Komada, M.; Soriano, P. Hrs, a FYVE finger protein localized to early endosomes, is implicated in vesicular traffic and required for ventral folding morphogenesis. Genes Dev. 1999, 13, 1475–1485. [Google Scholar] [CrossRef]
- Williams, R.L.; Urbé, S. The emerging shape of the ESCRT machinery. Nat. Rev. Mol. Cell Biol. 2007, 8, 355–368. [Google Scholar] [CrossRef] [PubMed]
- Hurley, J. The ESCRT complexes. Crit. Rev. Biochem. Mol. Biol. 2010, 45, 463–487. [Google Scholar] [CrossRef] [PubMed]
- Henne, W.M.; Buchkovich, N.J.; Emr, S.D. The ESCRT Pathway. Dev. Cell 2011, 21, 777–791. [Google Scholar] [CrossRef] [PubMed]
- Schmidt, O.; Teis, D. The ESCRT machinery. Curr. Biol. 2012, 22, R116–R120. [Google Scholar] [CrossRef]
- Vietri, M.; Radulovic, M.; Stenmark, H. The many functions of ESCRTs. Nat. Rev. Mol. Cell Biol. 2020, 21, 25–42. [Google Scholar] [CrossRef]
- Gruenberg, J.; Stenmark, H. The biogenesis of multivesicular endosomes. Genes Dev. 2004, 5, 17–23. [Google Scholar] [CrossRef]
- Rusten, T.E.; Stenmark, H. How do ESCRT proteins control autophagy? J. Cell Sci. 2009, 122, 2179–2183. [Google Scholar] [CrossRef] [PubMed]
- Fader, C.M.; Colombo, M.I. Autophagy and multivesicular bodies: Two closely related partners. Cell Death Differ. 2009, 16, 70–78. [Google Scholar] [CrossRef] [PubMed]
- Schiel, J.A.; Prekeris, R. Membrane dynamics during cytokinesis. Cell Death Differ. 2013, 25, 92–98. [Google Scholar] [CrossRef] [PubMed]
- Votteler, J.; Sundquist, W. Virus budding and the ESCRT pathway. Cell Host Microbe 2013, 14, 232–241. [Google Scholar] [CrossRef] [PubMed]
- Ogura, K.; Kohno, K.; Tai, T. Molecular cloning of a rat brain cDNA, with homology to a tyrosine kinase substrate, that induces galactosylceramide expression in COS-7 cells. J. Neurochem. 1998, 71, 1827–1836. [Google Scholar] [CrossRef] [PubMed]
- Ren, X.; Kloer, D.P.; Kim, Y.C.; Ghirlando, R.; Saidi, L.F.; Hummer, G.; Hurly, J.H. Hybrid structural model of the complete human ESCRT-0 complex. Structure 2009, 17, 406–416. [Google Scholar] [CrossRef]
- Bache, K.G.; Brech, A.; Mehlum, A.; Stenmark, H. Hrs regulates multivesicular body formation via ESCRT recruitment to endosomes. J. Cell. Biol. 2003, 162, 435–442. [Google Scholar] [CrossRef] [PubMed]
- Taelman, V.F.; Dobrowolski, R.; Plouhinec, J.L.; Fuentealba, L.C.; Vorwald, P.P.; Gumper, I.; Sabatini, D.D.; Robertis, E.M.D. Wnt signaling requires sequestration of glycogen synthase kinase 3 inside multivesicular endosomes. Cell 2010, 143, 1136–1148. [Google Scholar] [CrossRef] [PubMed]
- Wegner, C.S.; Rodahl, L.M.W.; Stenmark, H. ESCRT Proteins and Cell Signalling. Traffic 2011, 12, 1291–1297. [Google Scholar] [CrossRef]
- Hay, E.D. An overview of epithelio-mesenchymal transformation. Acta Anat. 1995, 154, 8–20. [Google Scholar] [CrossRef]
- Boyer, B.; Valles, A.M.; Edme, N. Induction and regulation of epithelial-mesenchymal transitions. Biochem. Pharmacol. 2000, 60, 1091–1099. [Google Scholar] [CrossRef] [PubMed]
- Thiery, J.P. Epithelial-mesenchymal transitions in tumour progression. Nat. Rev. Cancer 2002, 2, 442–454. [Google Scholar] [CrossRef] [PubMed]
- Lamouille, S.; Xu, J.; Derynck, R. Molecular mechanisms of epithelial-mesenchymal transition. Nat. Rev. Mol. Cell Biol. 2014, 15, 178–196. [Google Scholar] [CrossRef]
- Nelson, W.J.; Nusse, R. Convergence of Wnt, β-catenin, and cadherin pathways. Science 2004, 303, 1483–1487. [Google Scholar] [CrossRef] [PubMed]
- Kam, Y.; Quaranta, V. Cadherin-bound β-catenin feeds into the Wnt pathway upon adherens junctions dissociation: Evidence for an intersection between beta-catenin pools. PLoS ONE 2009, 4, e4580. [Google Scholar] [CrossRef]
- Cano, A.; Perez-Moreno, M.A.; Rodrigo, I.; Locascio, A.; Blanco, M.J.; Barrio, M.G.d.; Portillo, F.; Nieto, M.A. The transcription factor snail controls epithelial-mesenchymal transitions by repressing E-cadherin expression. Nat. Cell Biol. 2000, 2, 76–83. [Google Scholar] [CrossRef] [PubMed]
- Perez-Moreno, M.A.; Locascio, A.; Rodrigo, I.; Dhondt, G.; Portillo, F.; Nieto, M.A.; Cano, A. A new role for E12/E47 in the repression of E-cadherin expression and epithelial-mesenchymal transitions. J. Biol. Chem. 2001, 276, 27424–27431. [Google Scholar] [CrossRef] [PubMed]
- Stoker, M.; Perryman, M. An epithelial scatter factor released by embryo fibroblasts. J. Cell Sci. 1985, 77, 209–223. [Google Scholar] [CrossRef]
- Ogura, K.; Tai, T. Characterization of the functional domains of galactosylceramide expression factor 1 in MDCK cells. Glycobiology 2001, 11, 751–758. [Google Scholar] [CrossRef] [PubMed]
- Ogura, K.; Niino, Y.S.; Tai, T. Galactosylceramide expression factor-1 induces myogenesis in MDCK and C3H10T1/2 cells. Arch. Biochem. Biophys. 2004, 426, 279–285. [Google Scholar] [CrossRef] [PubMed]
- Uehara, Y.; Kitamura, N. Expression of a human hepatocyte growth factor/scatter factor cDNA in MDCK epithelial cells influences cell morphology, motility, and anchorage-independent growth. J. Cell Biol. 1992, 117, 889–894. [Google Scholar] [CrossRef]
- Toyoshima, M.; Tanaka, N.; Aoki, J.; Tanaka, Y.; Murata, K.; Kyuuma, M.; Kobayashi, H.; Ishii, N.; Yaegashi, N.; Sugamura, K. Inhibition of tumor growth and metastasis by depletion of vesicular sorting protein Hrs: Its regulatory role on E-cadherin and β-catenin. Cancer Res. 2007, 67, 5162–5171. [Google Scholar] [CrossRef] [PubMed]
- Mattissek, C.; Teis, D. The role of the endosomal sorting complexes required for transport (ESCRT) in tumorigenesis. Mol. Membr. Biol. 2014, 31, 111–119. [Google Scholar] [CrossRef] [PubMed]
- Yan, S.; Zhang, G.; Luo, W.; Xu, M.; Peng, R.; Du, Z.; Liu, Y.; Bai, Z.; Xiao, X.; Qin, S. PROTAC technology: From drug development to probe technology for target deconvolution. Eur. J. Med. Chem. 2024, 276, 116725. [Google Scholar] [CrossRef]
- Hashimoto, J.; Watanabe, T.; Seki, T.; Karasawa, S.; Izumikawa, M.; Seki, T.; Iemura, S.-I.; Natsume, T.; Nomura Goshima, N.; Miyawaki, A.; et al. Novel in vitro protein fragment complementation assay applicable to high-throughput screening in a 1536-well format. J. Biomol. Screen. 2009, 14, 970–979. [Google Scholar] [CrossRef] [PubMed]
- Kawashima, I.; Terashima, T.; Tai, T. An immunocytochemical technique with monoclonal antibodies to glycosphingolipids in rat primary cerebellar cultures: Influence of detergent permeabilization. Brain Res. Brain Res. Protoc. 1998, 2, 299–305. [Google Scholar] [CrossRef] [PubMed]
- Albini, A.; Iwamori, Y.; Kleinman, H.K.; Martin, G.R.; Aaronson, S.A.; Kozlowski, J.M.; McEwan, R.N. A rapid in vitro assay for quantitating the invasive potential of tumor cells. Cancer Res. 1987, 47, 3239–3245. [Google Scholar] [PubMed]


| HGS Mutants (a) | Cell Morphology | |
|---|---|---|
| HGF – | HGF + (b) | |
| MDCK - - - - | E (c) | M (d) |
| MDCK/HGS ZPCQ | M | M |
| - PCQ | M | M |
| - - CQ | M | M |
| - - - Q | E | M |
| ZP - - | E | M |
| Z - - - | E | M |
| - P - - | E | M |
| ZPC - | E | E |
| - PC - | E | E |
| - - C - | E | E |
| MDCK Mutant Cells | TGF-β – | TGF-β + (a) |
|---|---|---|
| MDCK cells | 1.00 ± 0.016 | 11.1 ± 0.12 |
| MDCK/HGS cells | 566 ± 13.5 | 3664 ± 14.6 |
| MDCK/C cells | 0.91 ± 0.065 | 0.73 ± 0.088 |
Disclaimer/Publisher’s Note: The statements, opinions and data contained in all publications are solely those of the individual author(s) and contributor(s) and not of MDPI and/or the editor(s). MDPI and/or the editor(s) disclaim responsibility for any injury to people or property resulting from any ideas, methods, instructions or products referred to in the content. |
© 2025 by the authors. Licensee MDPI, Basel, Switzerland. This article is an open access article distributed under the terms and conditions of the Creative Commons Attribution (CC BY) license (https://creativecommons.org/licenses/by/4.0/).
Share and Cite
Ogura, K.; Kawashima, I.; Kasahara, K. HGS Promotes Tumor Growth, Whereas the Coiled-Coil Domain and Its Oligopeptide of HGS Suppress It. Int. J. Mol. Sci. 2025, 26, 772. https://doi.org/10.3390/ijms26020772
Ogura K, Kawashima I, Kasahara K. HGS Promotes Tumor Growth, Whereas the Coiled-Coil Domain and Its Oligopeptide of HGS Suppress It. International Journal of Molecular Sciences. 2025; 26(2):772. https://doi.org/10.3390/ijms26020772
Chicago/Turabian StyleOgura, Kiyoshi, Ikuo Kawashima, and Kohji Kasahara. 2025. "HGS Promotes Tumor Growth, Whereas the Coiled-Coil Domain and Its Oligopeptide of HGS Suppress It" International Journal of Molecular Sciences 26, no. 2: 772. https://doi.org/10.3390/ijms26020772
APA StyleOgura, K., Kawashima, I., & Kasahara, K. (2025). HGS Promotes Tumor Growth, Whereas the Coiled-Coil Domain and Its Oligopeptide of HGS Suppress It. International Journal of Molecular Sciences, 26(2), 772. https://doi.org/10.3390/ijms26020772