1. Introduction
Adipose tissue plays a central role in systemic energy homeostasis and endocrine regulation. Excess energy is stored in the form of lipids within mature adipocytes of white adipose tissue (WAT). In case of energy deprivation, these lipids are mobilized to supply energy to peripheral tissues. In response to sustained overnutrition, adipose tissue expands to accommodate an increased energy storage, thereby preventing ectopic lipid deposition and lipotoxicity in other organs and tissues. Adipose tissue is not merely passive energy storage but also functions as an endocrine organ, secreting a variety of biologically active molecules, including hormones, adipokines, extracellular matrix proteins, growth factors, and microRNAs [
1,
2]. Adipokines (adiponectin, leptin, etc.) play critical roles in regulating glucose and lipid metabolism, insulin sensitivity, inflammation, and vascular function. Dysregulated adipokine secretion is closely linked to obesity and its associated comorbidities, such as type 2 diabetes, cardiovascular disease, and metabolic syndrome [
3]. Adipose tissue expansion occurs through an increase in adipocyte number (hyperplasia) and/or an increase in adipocyte size (hypertrophy) [
4]. Both processes can contribute to adipose tissue expansion, yet hypertrophic growth is more strongly linked to adipose tissue dysfunction, including hypoxia, chronic inflammation, and insulin resistance [
3,
4,
5].
Adipocyte differentiation (adipogenesis) is a multistep process tightly governed by the coordinated transcriptional and signaling networks that control the commitment of progenitor cells to adipocyte lineage, clonal expansion of committed preadipocytes, and terminal differentiation to adipocytes [
5]. Insulin is a key endocrine regulator of energy and lipid metabolism, exerting its effects through activating the intracellular signaling cascade that includes the insulin receptor (IR), insulin receptor substrate (IRS) proteins, phosphoinositide 3-kinase (PI3K), and protein kinase B (AKT). In adipose tissue, insulin plays a crucial role in both morphogenesis and function, promoting adipocyte differentiation and supporting the acquisition of a functionally mature adipocyte phenotype [
6]. In the context of metabolic syndrome, obesity, and insulin resistance, adipose tissue dysfunction extends beyond the morphological alterations and includes impaired proliferation of stem and progenitor cells, abnormal adipocyte maturation, and disruptions in endocrine function, as reflected by altered secretion profiles of adipokines, growth factors, and microRNAs [
2].
Adiponectin is among the most important adipokines abundantly secreted by adipocytes of WAT, exerting insulin-sensitizing, anti-inflammatory, and anti-atherogenic effects [
7]. Circulating adiponectin levels are typically high in healthy individuals but decline significantly in conditions such as obesity, type 2 diabetes, and cardiovascular disease. Low adiponectin levels are strongly associated with insulin resistance and an increased risk of metabolic complications [
5]. Adiponectin exists in multiple forms including trimeric (low molecular weight), hexameric (medium), and high molecular weight (HMW), the latter being considered the most metabolically active form [
5,
7,
8,
9]. Adiponectin exerts its effects through two “classical” receptors, AdipoR1 and AdipoR2, which activate the key downstream signaling pathways, including AMP-activated protein kinase (AMPK) and peroxisome proliferator-activated receptor-α (PPAR-α) [
8,
10]. Importantly, T-cadherin has been identified as a specific receptor for high-molecular-weight (HMW) adiponectin [
11], although the downstream signaling pathways triggered by this interaction remain largely unexplored.
T-cadherin (also known as cadherin-13 or H-cadherin) is an atypical member of the cadherin superfamily. Unlike “classical cadherins”, which are transmembrane glycoproteins, T-cadherin lacks both transmembrane and intracellular domains and is tethered to the plasma membrane via a glycosylphosphatidylinositol (GPI) anchor [
5]. Due to this unique structure, T-cadherin is not involved in classic cell–cell adhesion but is thought to operate as a signaling receptor, which sequesters the circulating adiponectin on the cell surface of organ and tissues, thereby facilitating its protective effects [
11,
12,
13]. Supporting this, a substantial body of genetic and experimental evidence underscores the important role of T-cadherin in metabolic health. Genome-wide association studies revealed that reduced systemic HMW adiponectin was associated with single nucleotide polymorphisms (SNPs) in CDH13 gene, potentially suggesting the existence of an autocrine signaling loop [
5,
12,
13,
14].
In fact, T-cadherin binds two structurally and functionally distinct ligands: HMW adiponectin and low-density lipoprotein (LDL). This dual ligand specificity suggests that T-cadherin may act as a molecular “switch,” modulating cellular responses based on the plasma concentrations of circulating ligands. Under physiological conditions, where adiponectin levels are high—as in healthy individuals—T-cadherin mediates cardiovascular and metabolic protection. In contrast, under pathological conditions such as obesity or metabolic syndrome with elevated LDL in the bloodstream, T-cadherin may drive pathological changes [
5]. Upon binding LDL, T-cadherin initiates intracellular signaling cascades, triggering calcium influx or ERK1/2 phosphorylation or NF-κB activation that collectively stimulate cell proliferation with potentially pro-atherosclerotic effects in vessel walls [
15,
16].
Although the roles of T-cadherin in the cardiovascular and nervous systems are well established [
5,
17], its function in adipose tissue, particularly in the light of progenitor/stem cell renewal and adipocyte differentiation, remains poorly elucidated [
5]. Single-cell RNA sequencing data reported T-cadherin expression in mesenchymal stem cells (MSCs) derived from various sources including adipose tissue [
18,
19,
20]. In our recent study, we demonstrated that adipose-derived murine MSCs, lacking the full-size T-cadherin, are more inclined to differentiate along the adipogenic lineage than control cells, a tendency marked by greater lipid-droplet accumulation and altered levels of the key early and late adipogenic markers [
2]. We also explored the effects of T-cadherin ligands (LDL and adiponectin) on adipogenic differentiation and demonstrated the existence of a feedback loop mediated by T-cadherin, supporting the idea that T-cadherin acts as a key mediator linking extracellular metabolic cues to adipocyte differentiation [
2]. Additional evidence indicates that altered T-cadherin levels in adipose tissue and circulation can reflect lipid-metabolism disturbances and are linked to metabolic disorders [
21,
22]. For example, Göddeke et al. demonstrated that T-cadherin mRNA levels are reduced in the visceral adipose tissue of both obese mice and humans [
21]. In the same study, siRNA-mediated knockdown of T-cadherin in 3T3-L1 preadipocytes prior to differentiation led to a decreased expression of key adipogenic transcription factors, PPARγ and C/EBPα, and significantly impaired the terminal adipocyte differentiation. Additionally, T-cadherin was shown to affect fatty acid uptake and lipid accumulation during differentiation [
21], highlighting the functional role of T-cadherin in metabolic remodeling during adipogenesis and regulation of adipose tissue homeostasis.
The present study aims to examine the expression dynamics and functional role of T-cadherin during adipogenesis using the well-established 3T3-L1 mouse preadipocyte model. Specifically, we analyzed: (1) temporal changes in T-cadherin expression across distinct stages of differentiation, and evaluated its impact on (2) lipid droplet formation, (3) the expression of early and late adipogenic markers, and (4) the activation of key signaling pathways involved in adipocyte differentiation and maturation, including downstream components of the insulin/IGF-1 axis such as APPL1, PI3K, AMPK, ERK, and AKT. Elucidating the role of T-cadherin in adipogenesis may uncover novel regulatory mechanisms governing adipose tissue plasticity and provide a valuable insight into how metabolic cues are integrated during adipocyte renewal, differentiation, and function. Ultimately, these findings could contribute to identifying the new therapeutic targets for obesity and clarify key aspects of metabolic dysfunction.
3. Discussion
A growing body of evidence indicates that differentiation of preadipocytes into mature fat cells is a complex process involving an interplay of regulatory factors that exert both positive and negative effects on a network of signaling pathways converging on the adipogenic gene program. Upon exposure to adipogenic inducers, 3T3-L1 cells proceed through three key stages: commitment to the preadipocyte lineage, clonal expansion of the committed cells, and terminal differentiation marked by the expression of adipocyte-specific genes and intracellular triglyceride accumulation [
36,
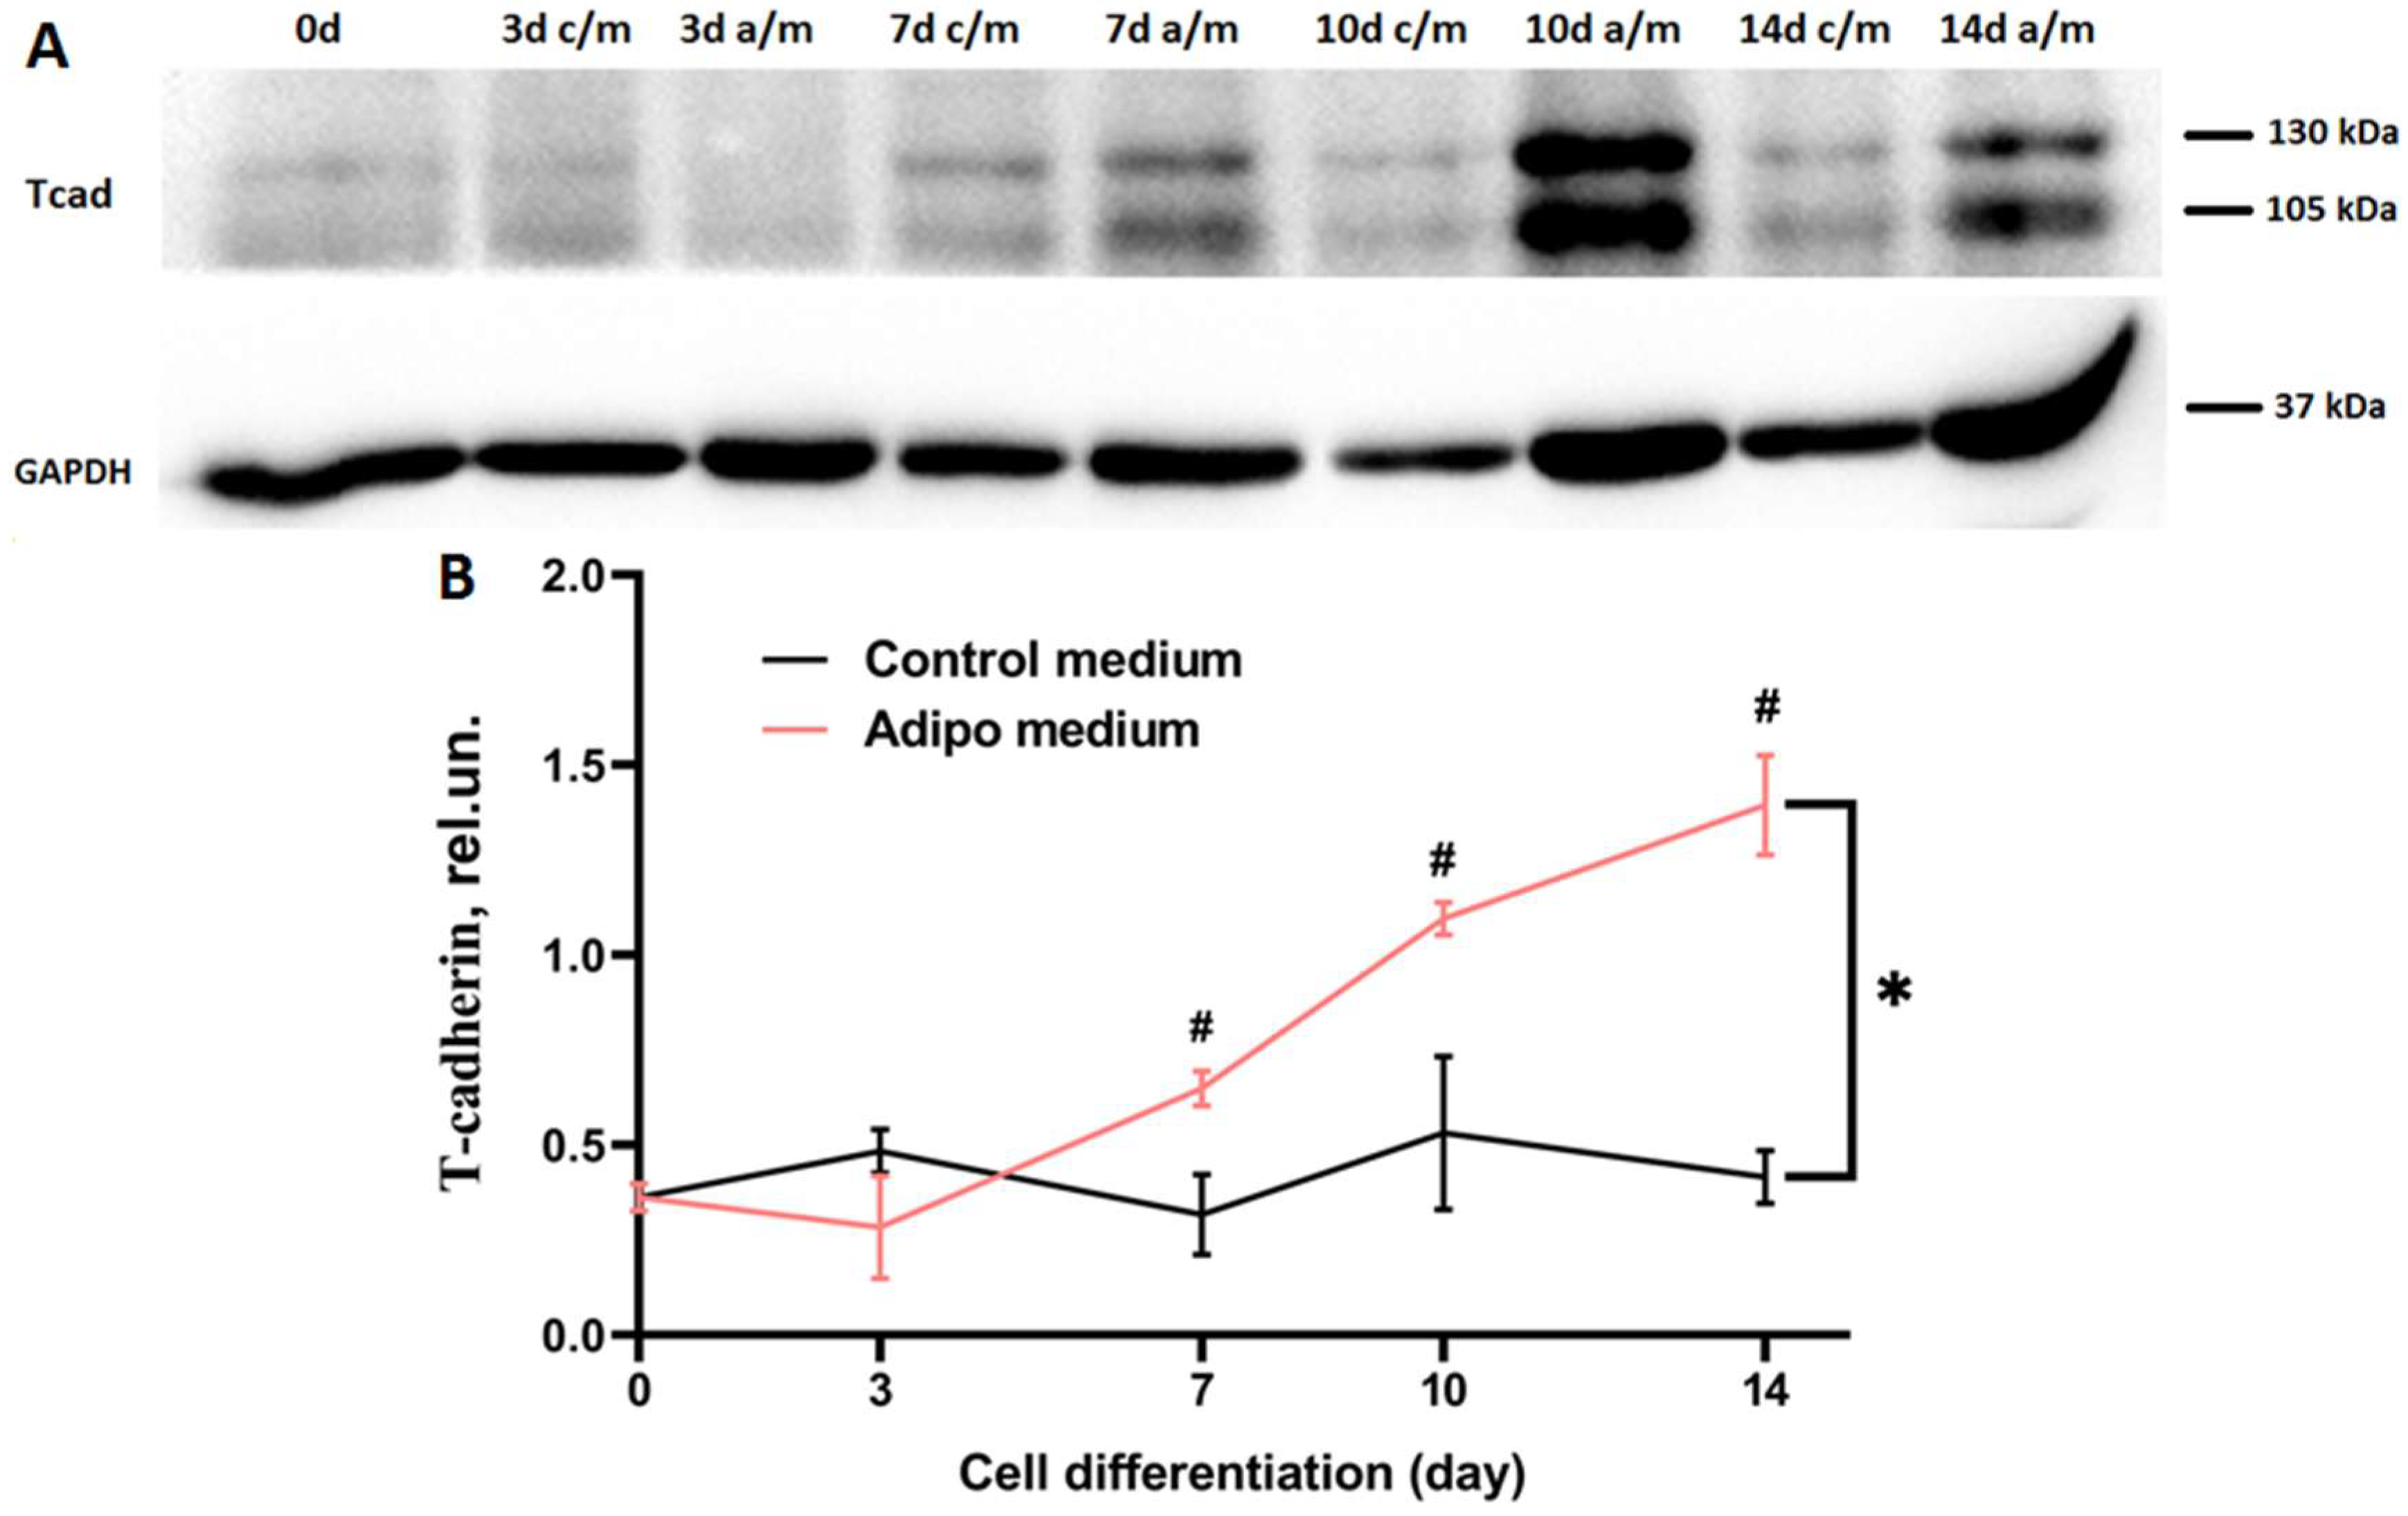
40]. Our findings demonstrate that T-cadherin expression is dynamically regulated during adipogenesis and T-cadherin exerts a stage-specific effects on 3T3-L1 differentiation. T-cadherin levels rose sharply in mid-to-late differentiation of 3T3-L1 WT cells (days 7–10), suggesting its functional role in the transition from proliferating preadipocytes to mature adipocytes (
Figure 1). This elevated expression suggests that T-cadherin may coordinate the late stages of adipogenesis by regulating cell–cell or cell–matrix interactions as differentiating cells round up and accumulate lipids. Of note, a modest increase in T-cadherin expression on day 7 in control medium may reflect its role in contact inhibition—particularly relevant under our experimental conditions, where cells were seeded and maintained in culture for 14 days without passaging. This explanation is supported by the earlier findings demonstrating that T-cadherin mediates contact inhibition of endothelial cell migration during angiogenesis through interactions with the surrounding stromal cells [
41,
42,
43].
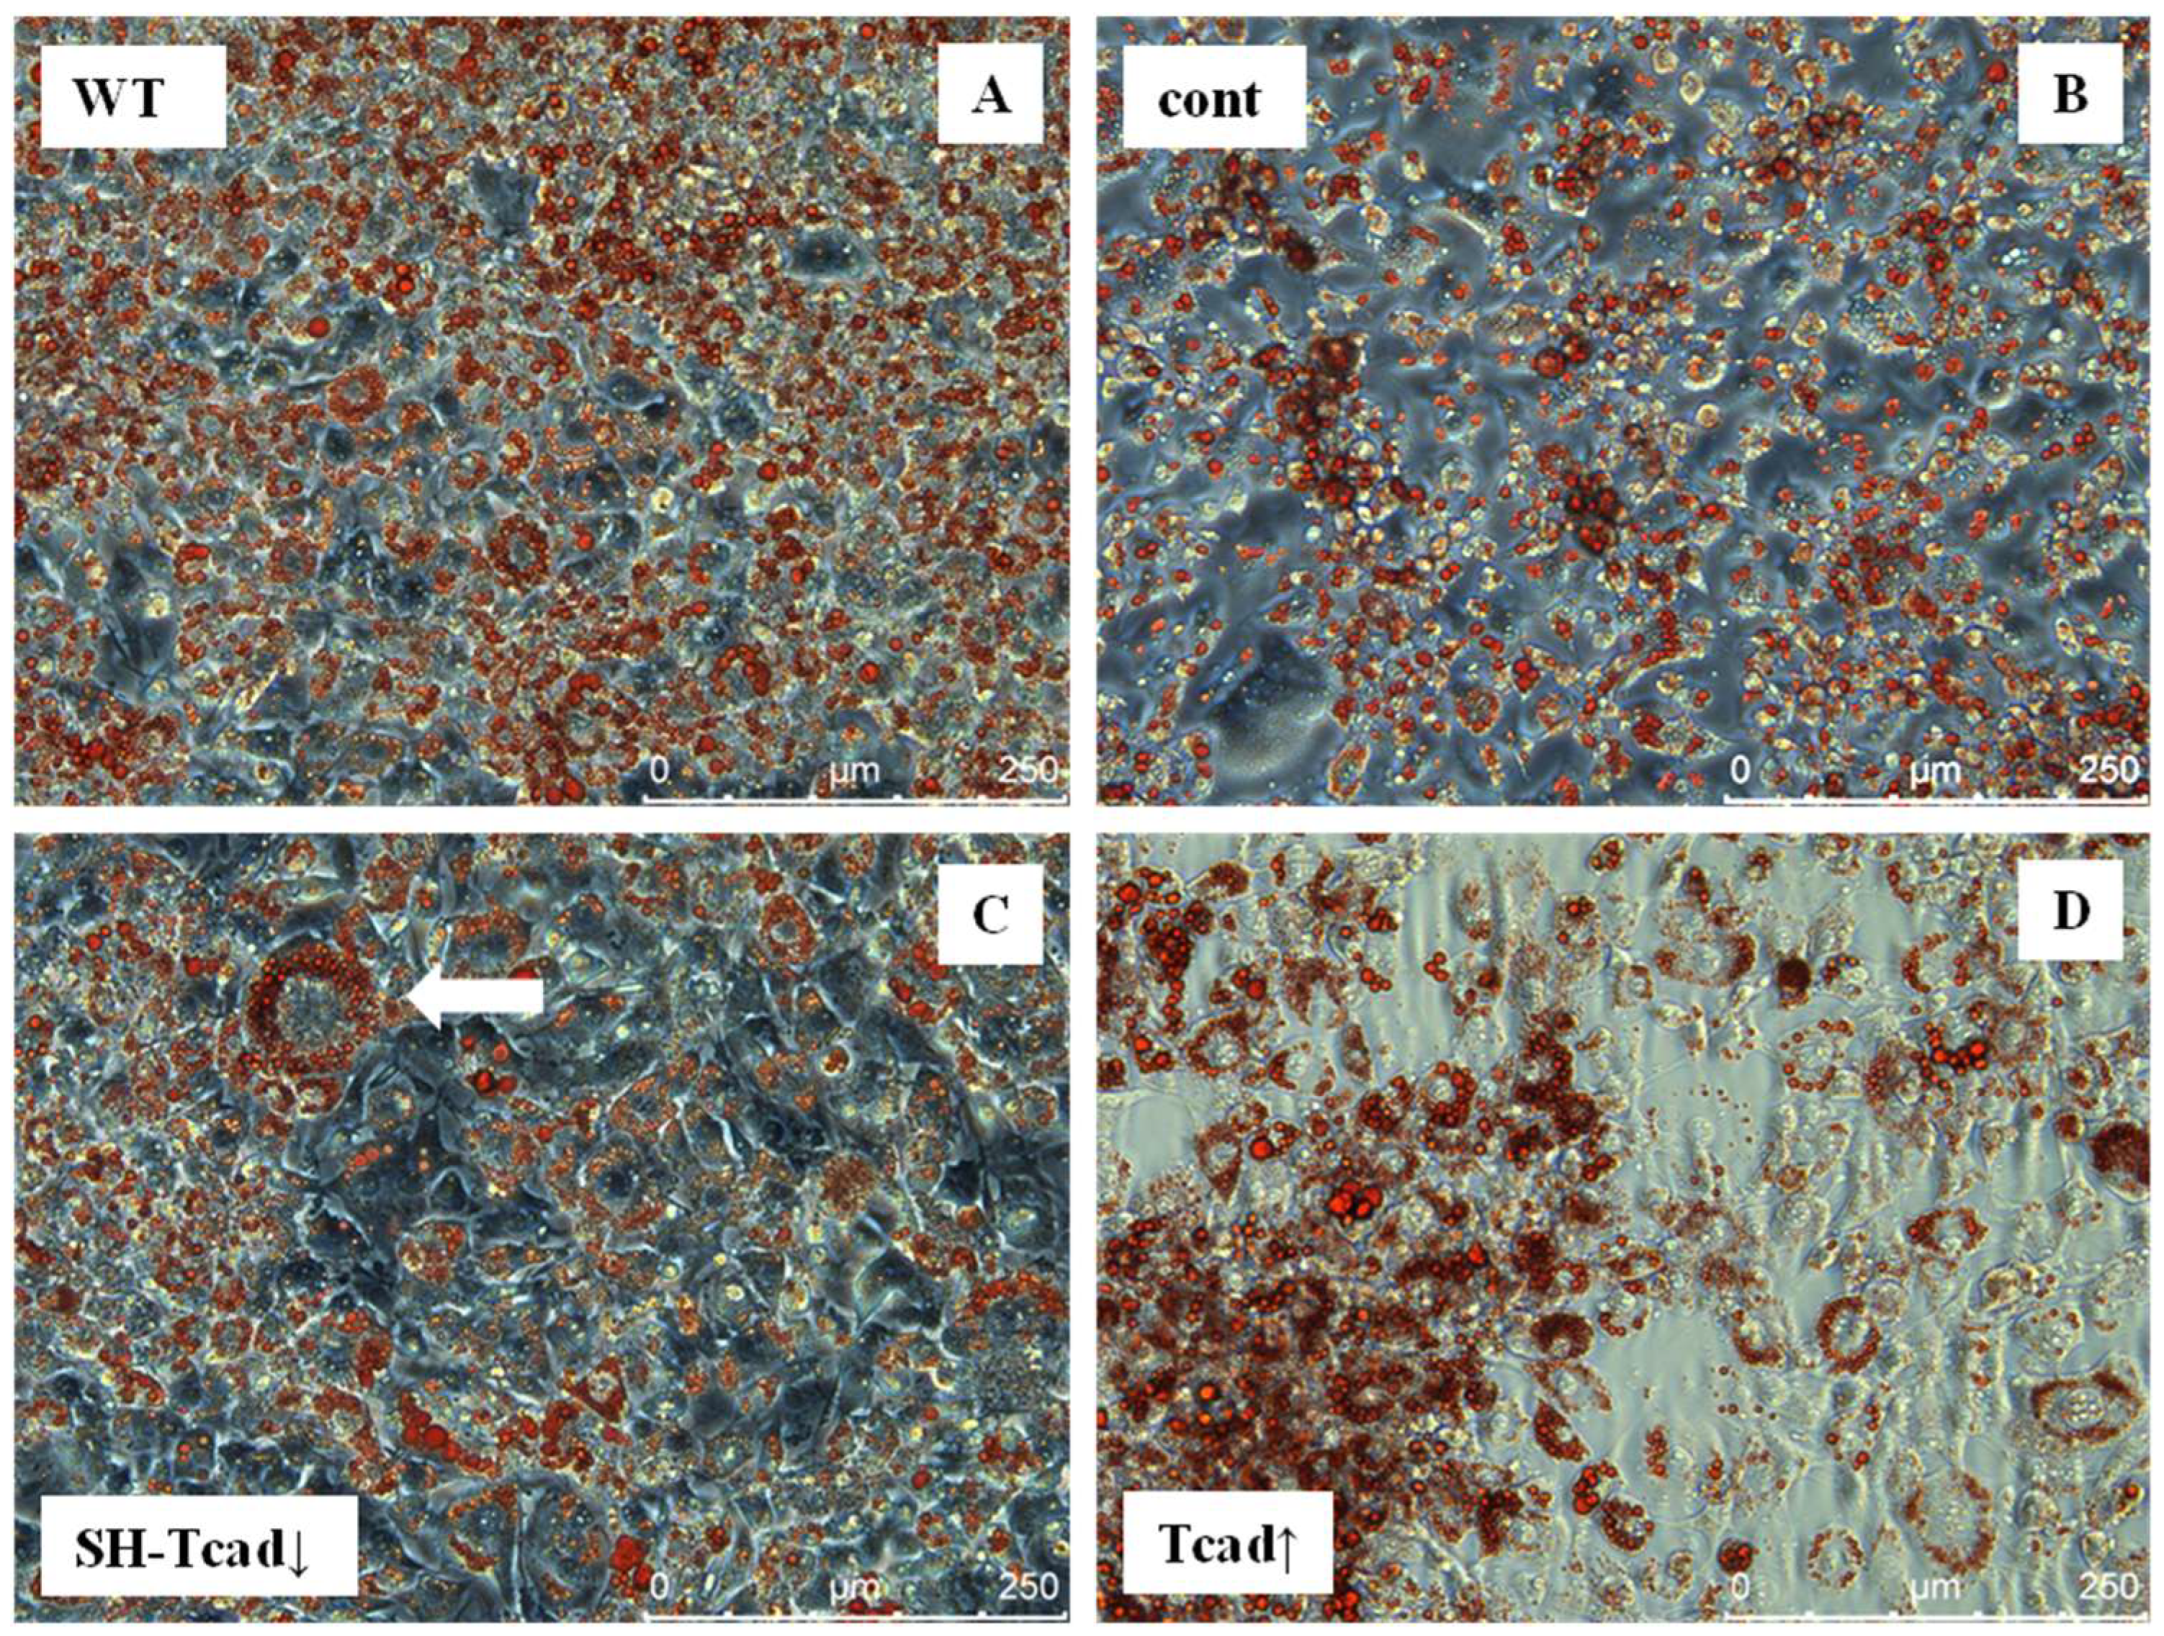
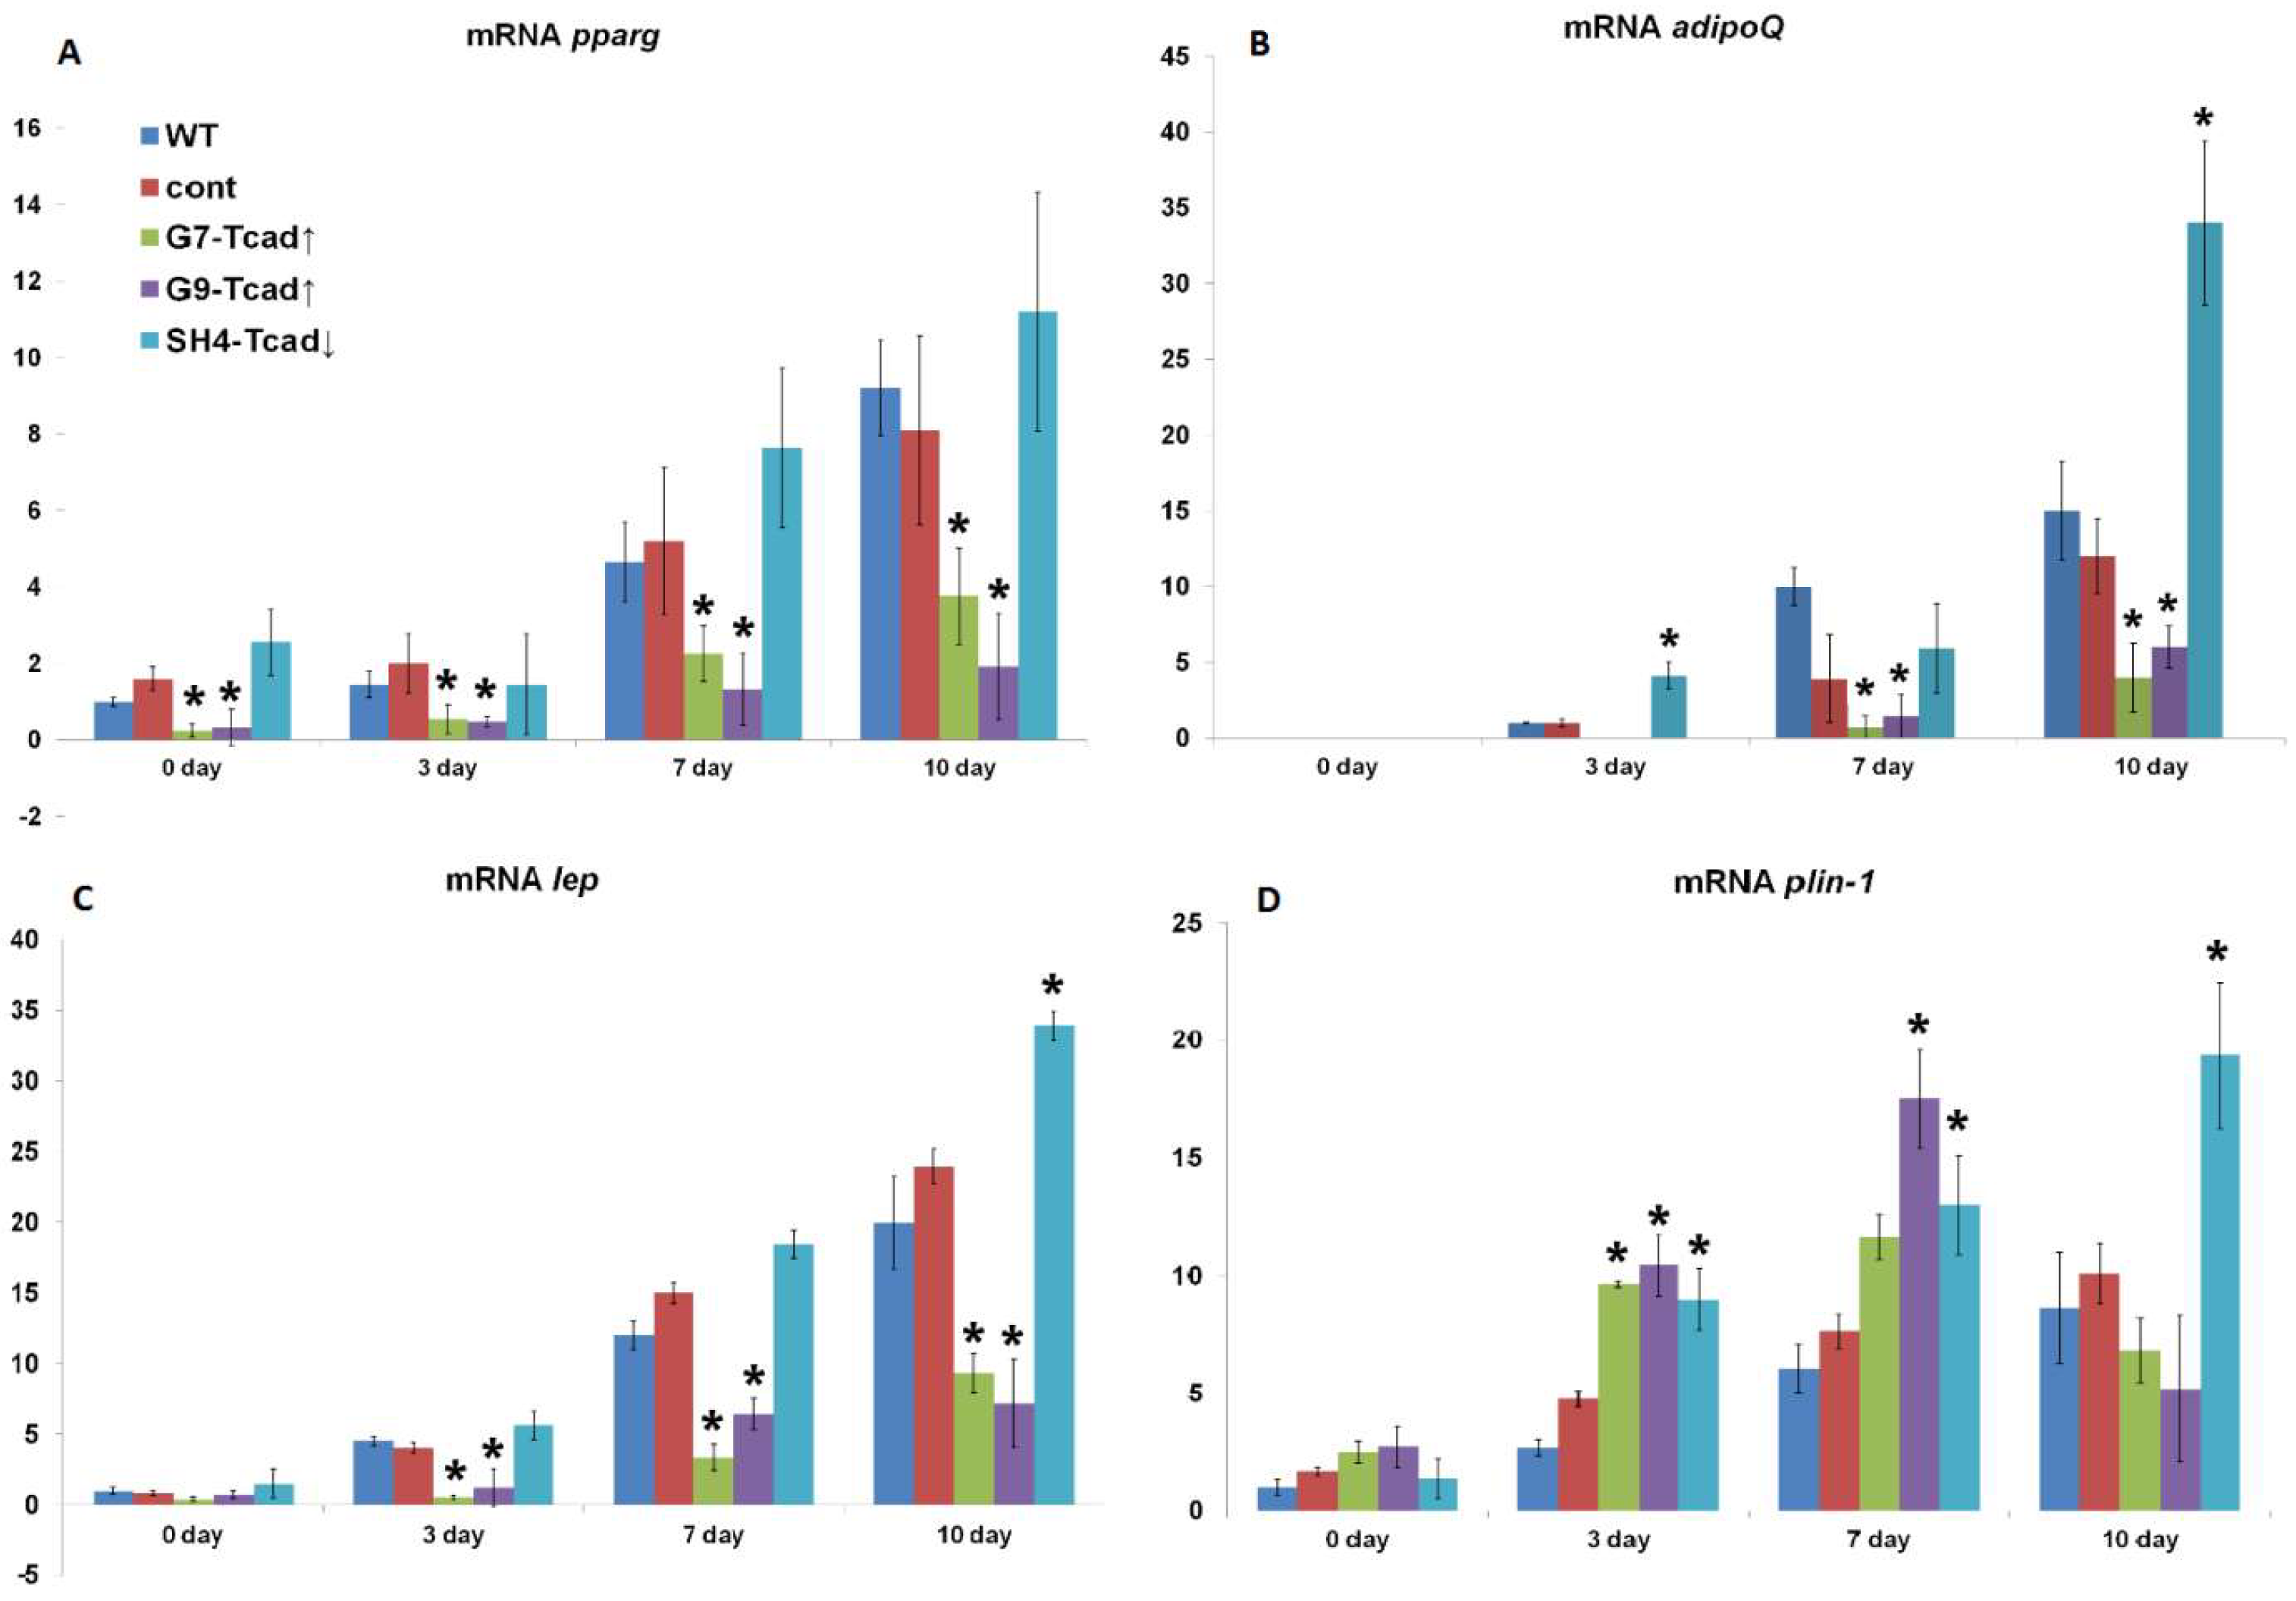
We further examined the role of T-cadherin in adipogenic differentiation by experimentally altering T-cadherin levels. We found that T-cadherin silencing accelerated lipid-droplet formation (
Figure 3) and adipogenic marker expression (
Figure 6), whereas its overexpression delayed these processes. Preadipocytes with suppressed T-cadherin accumulated conspicuously larger lipid droplets as early as day 7 (
Figure 3), and showed earlier and higher expression levels of adiponectin, leptin, and perilipin mRNAs (
Figure 6), consistent with the accelerated adipocyte differentiation. In comparison, T-cadherin overexpression resulted in fewer cells with lipid droplets (
Figure 3) and significantly downregulated adipogenic markers (pparγ, adipoQ, lep, plin-1) (
Figure 6), indicating a differentiation delay [
34]. Of note, control vector-transfected cells demonstrated the same levels of adipogenic markers as WT cells, confirming that these effects were T-cadherin-specific.
In contrast to our findings, Gödekke et al. [
21] reported that transient siRNA-mediated knockdown of T-cadherin in 3T3-L1 cells reduced pparγ and c/ebpα expression, thereby impairing terminal differentiation. This apparent discrepancy likely reflects methodological differences. Gödekke et al. employed transient siRNA knockdown either immediately before adipogenic induction (day 0) or during the early induction phase (day 4). Such short-term T-cadherin suppression at the early stages of adipogenesis may affect the expression of early adipogenic factors, thereby impairing initiation of the adipogenic program. By contrast, we established stable shRNA-mediated knockdown clones through antibiotic selection and single-cell cloning. The clones maintained suppressed T-cadherin expression throughout both the expansion and differentiation stages, providing a consistent background for long-term analysis. Furthermore, the adipogenic induction protocols differed substantially: Gödekke et al. applied a cocktail containing troglitazone, hydrocortisone, transferrin, T3, and insulin, whereas we utilized the classical, widely used differentiation mixture of IBMX, dexamethasone, insulin, and FBS [
30].
Our findings are consistent with our previously published work on the role of T-cadherin in the adipogenic differentiation of mesenchymal stem/stromal cells (MSCs) [
2]. Specifically, we have demonstrated that T-cadherin deficiency facilitated adipogenic differentiation of MSCs, as evidenced by elevated adiponectin and leptin secretion, along with characteristic morphological changes. Therefore, our combined results—both previous and present—support the notion that the cells lacking full-size T-cadherin are predisposed to adipogenic lineage commitment. One possible explanation is that the inhibitory effects of T-cadherin overexpression may be facilitated by signals arising from T-cadherin–mediated homophilic adhesion, which serve to maintain preadipocytes in an undifferentiated state. Such adhesion-dependent signaling could sustain anti-adipogenic pathways or preserve a progenitor-like transcriptional profile. Of note, cell adhesion molecules are well-known regulators of adipocyte commitment through their influence on Wnt/β-catenin signaling and other pathways that actively suppress adipogenesis [
44]. We previously demonstrated that T-cadherin regulates endothelial monolayer permeability. Overexpression of T-cadherin induced phosphorylation of VE-cadherin at Y731—a key site for β-catenin binding—thereby activating Rho GTPases signaling, actin cytoskeleton remodeling and VE-cadherin endocytosis, ultimately resulting in disruption of the endothelial barrier [
45]. In this context, the endogenously elevated T-cadherin expression during differentiation may function as a feedback mechanism through cell–cell adhesion signals that restricts an excessive or premature adipogenic conversion in vitro and in vivo. Collectively, our results implicate T-cadherin as a suppressor of adipogenic program: its downregulation promotes commitment to the adipocyte lineage, whereas its overexpression impedes adipogenesis.
Next, we demonstrated that T-cadherin is involved in the interplay between differentiation and proliferation in 3T3-L1 cells. Although cell proliferation and adipogenic differentiation are generally considered mutually exclusive processes, a functional cross-talk between them has been well established [
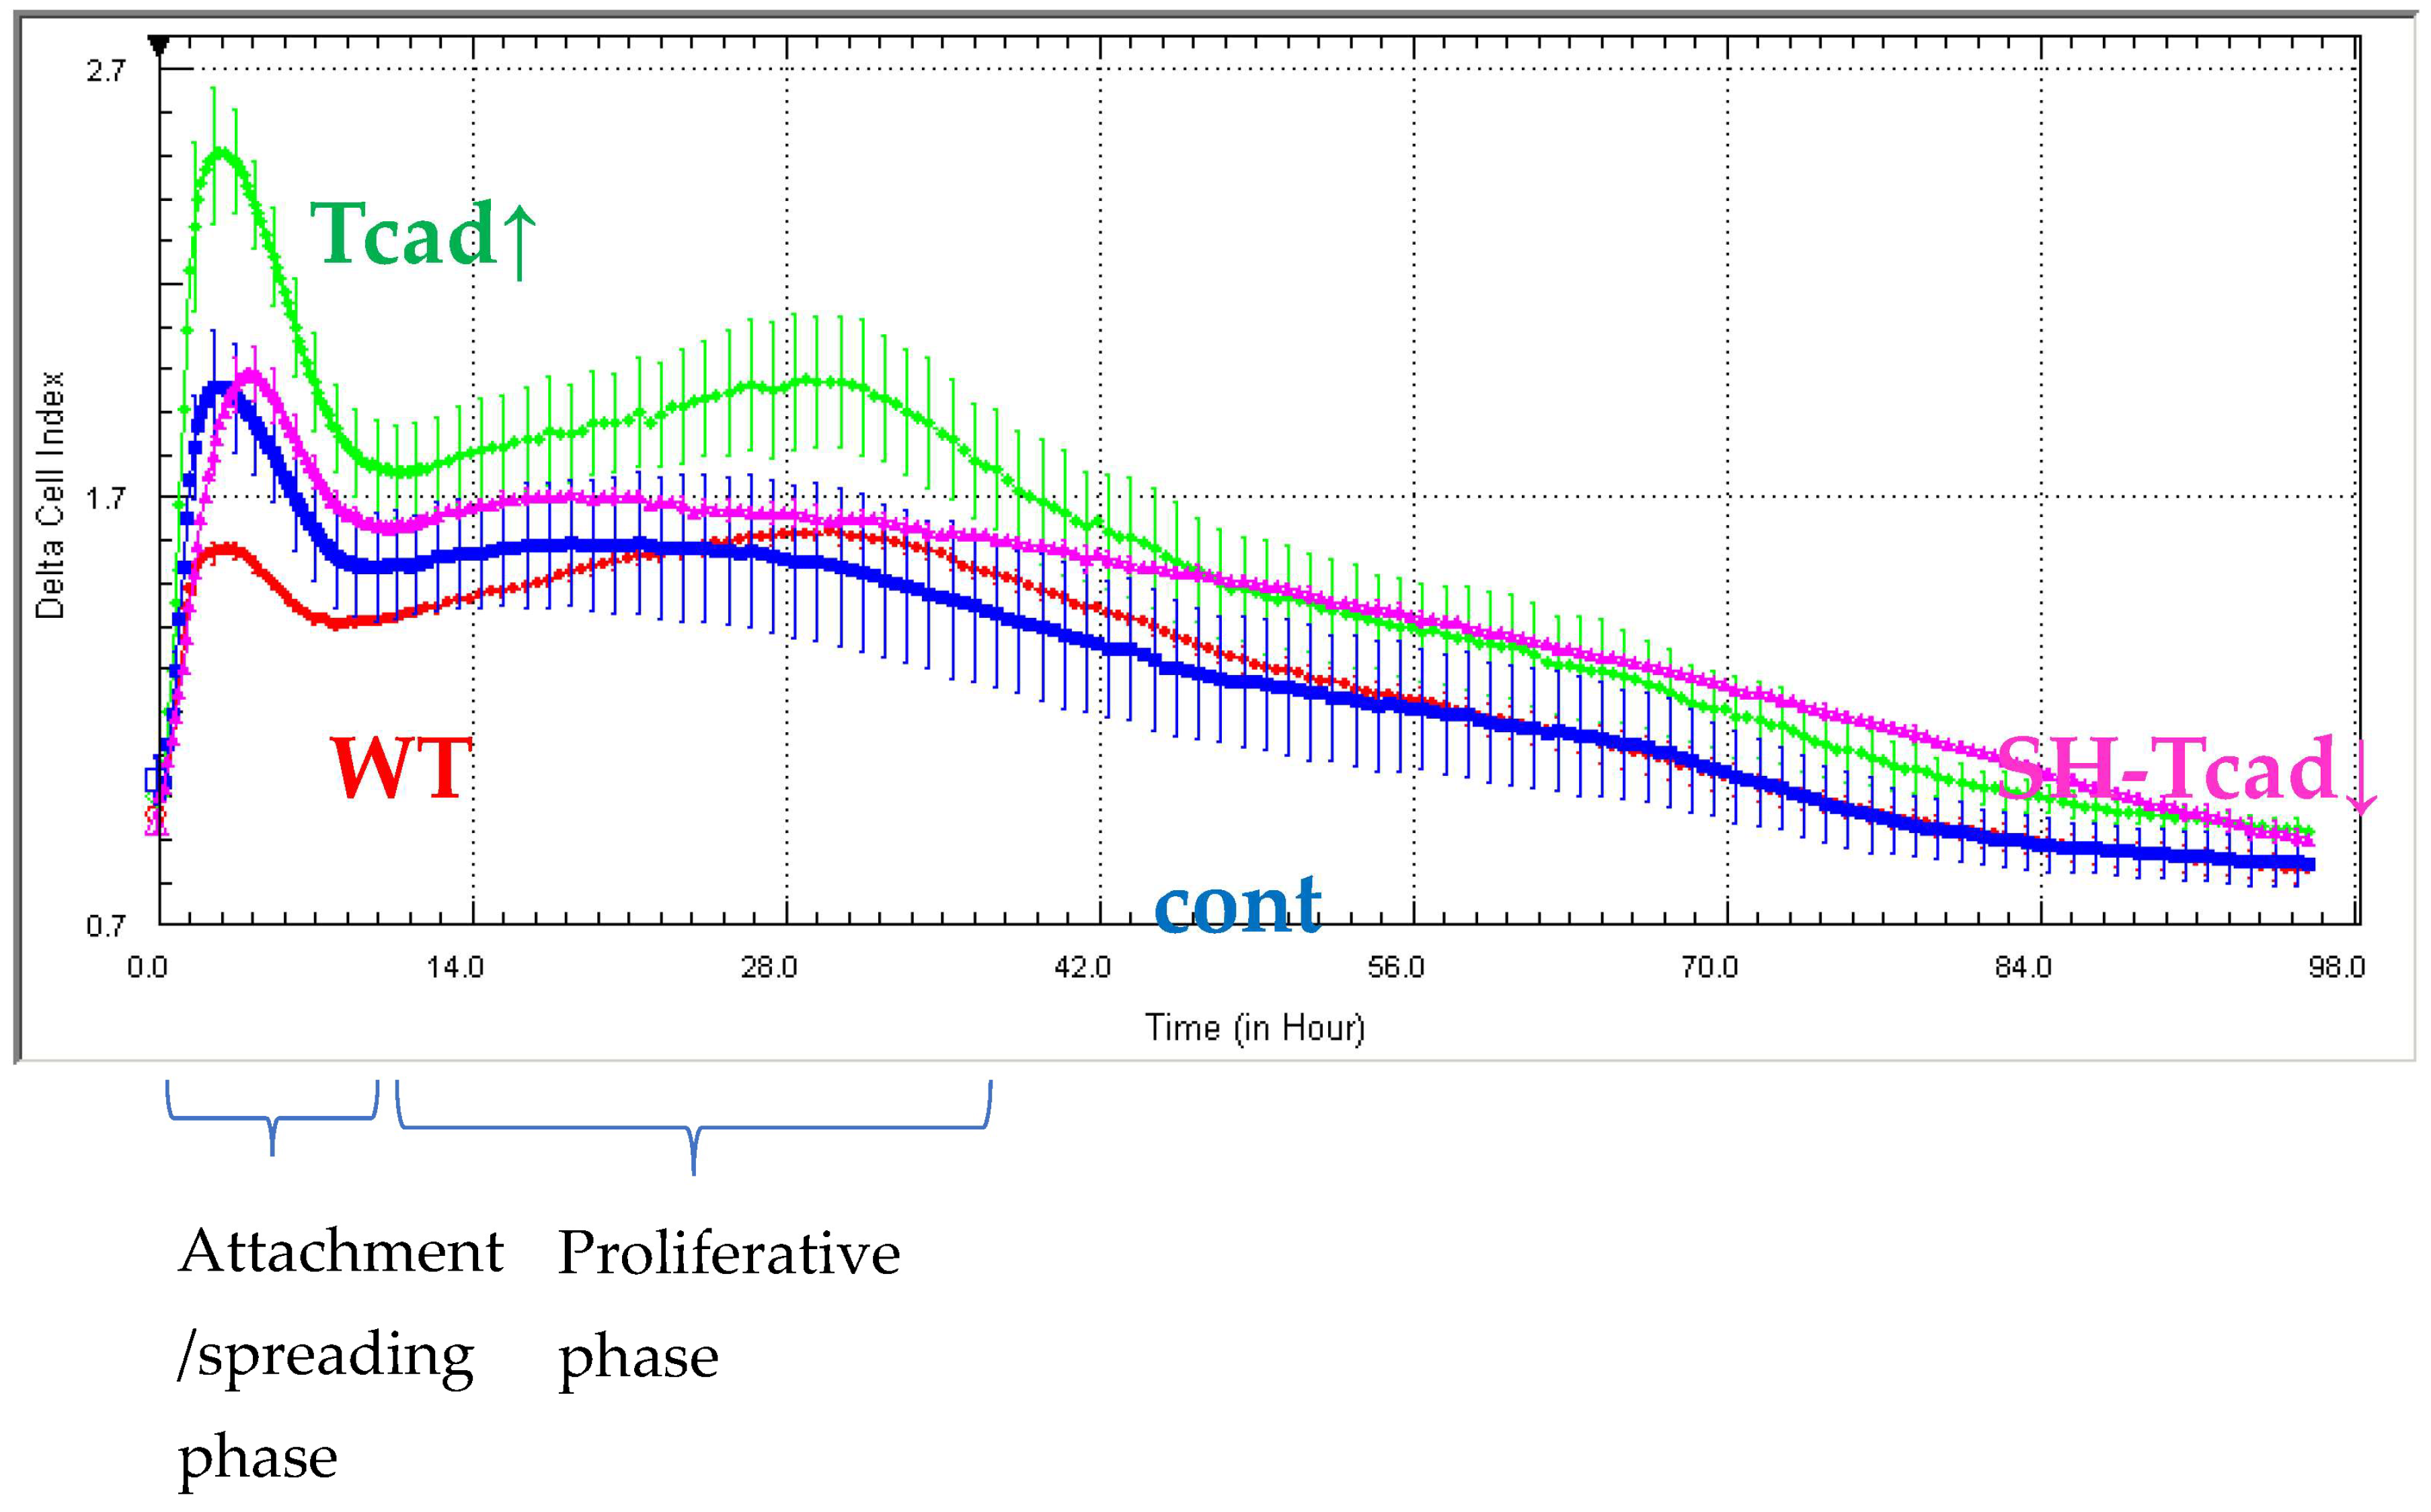
27]. In adipogenic conditions, prior to terminal differentiation growth-arrested preadipocytes re-enter the cell cycle and undergo several rounds of division (clonal expansion) before committing to the adipogenic program. Our results highlight a dual role for T-cadherin in both the differentiation process itself and in the proliferative phase preceding differentiation. T-cadherin overexpression significantly enhanced 3T3-L1 proliferation, as evidenced by increased impedance-based cell index during both the initial attachment/spreading stage and the main proliferative phase (10–30 h) (
Figure 4). In contrast, T-cadherin-deficient cells, WT, and vector control (cont) cells exhibited comparable proliferation rates, suggesting that endogenous T-cadherin is not a limiting factor for proliferation under basal conditions. While T-cadherin deficiency does not significantly affect cell proliferation, T-cadherin overexpression appears to stimulate cell cycle progression. These findings are consistent with the previous studies showing that T-cadherin overexpression in endothelial cells, vascular smooth muscle cells, and pericytes enhanced proliferation, migration, and survival via activation of pro-mitogenic pathways or modulation of key signaling checkpoints involved in cell cycle control [
46,
47,
48,
49].
Literature provides abundant data underscoring the importance of the precise timing for proliferation–differentiation transition during adipogenesis. In 3T3-L1 cells, transient activation of the ERK/MAPK signaling pathway within the first ~12 h of adipogenic induction is essential for mitotic clonal expansion of preadipocytes and upregulation of key adipogenic transcription factors, including C/EBPβ/δ and PPARγ [
50]. However, if ERK/MAPK mitogenic signaling persists beyond this early stage, it can lead to the phosphorylation and inactivation of C/EBPs, PPARγ, and other differentiation-related factors, thereby impairing terminal adipocyte differentiation [
50,
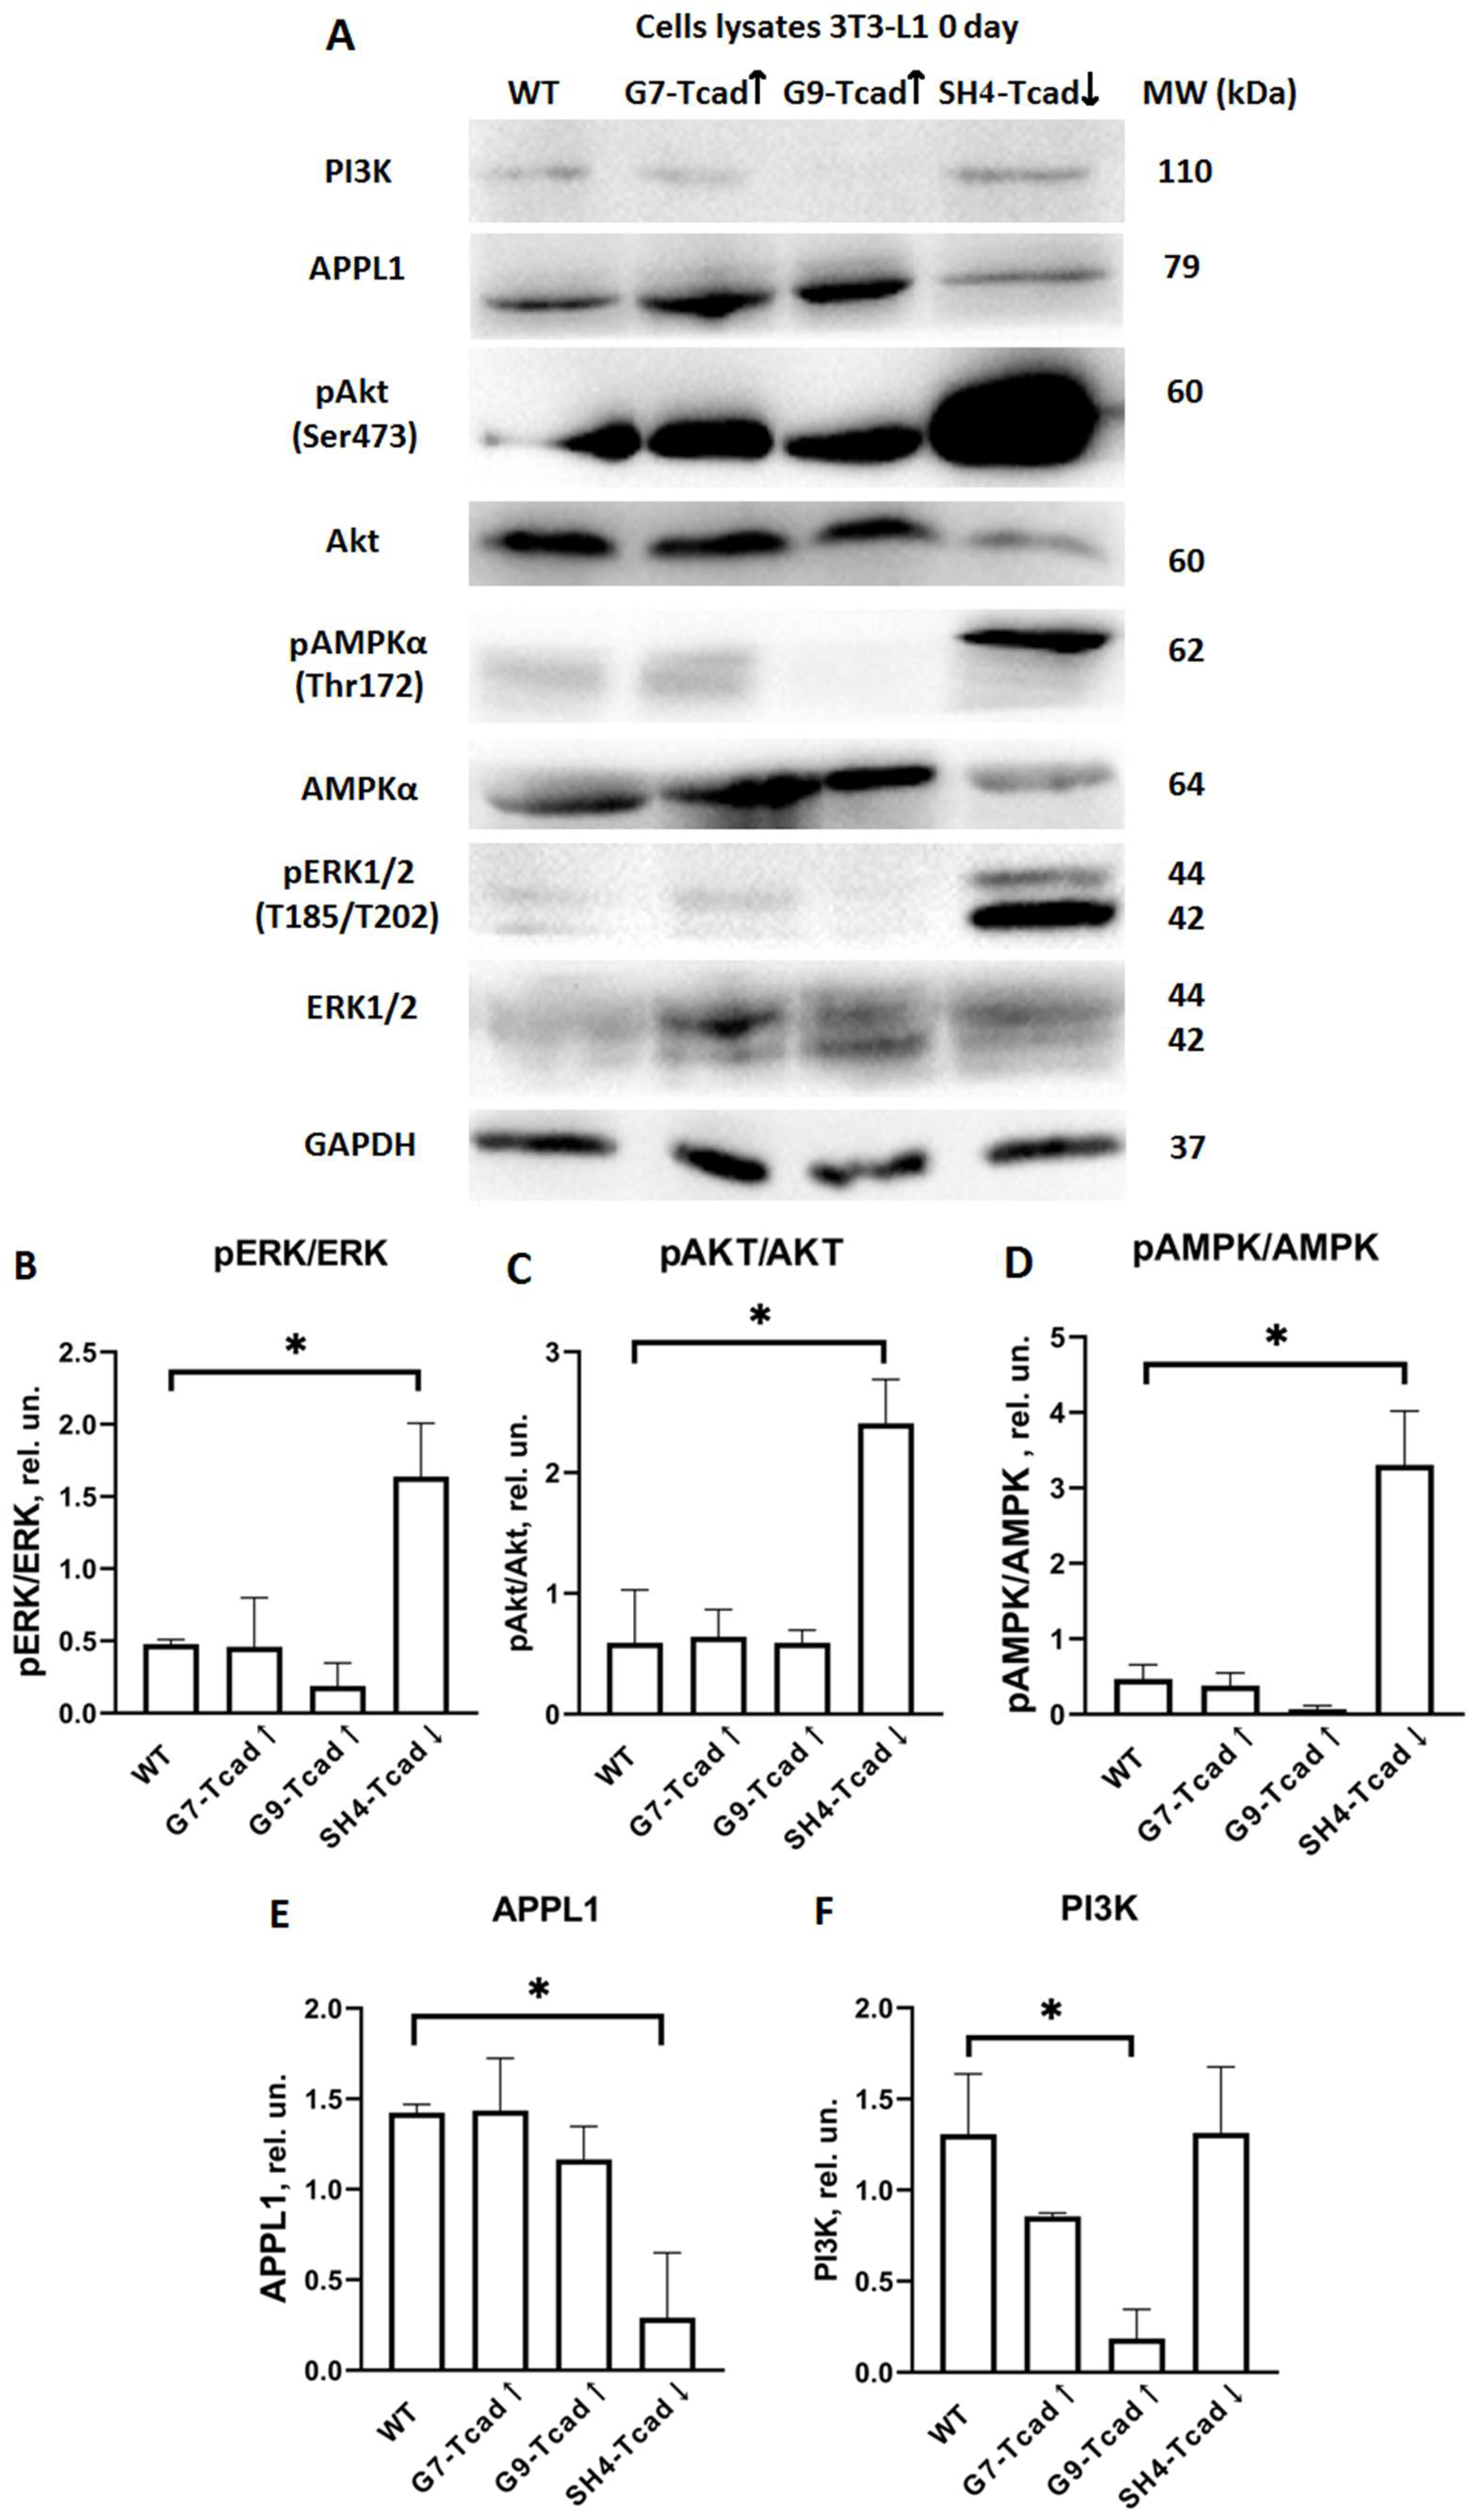
51]. Our data indicate that, at baseline prior to adipogenic stimulation (day 0), T-cadherin-deficient cells (SH4 Tcad↓) exhibited elevated ERK1/2 phosphorylation (compared to WT and T-cadherin overexpressing cells), presumably priming them for the early clonal expansion and differentiation (
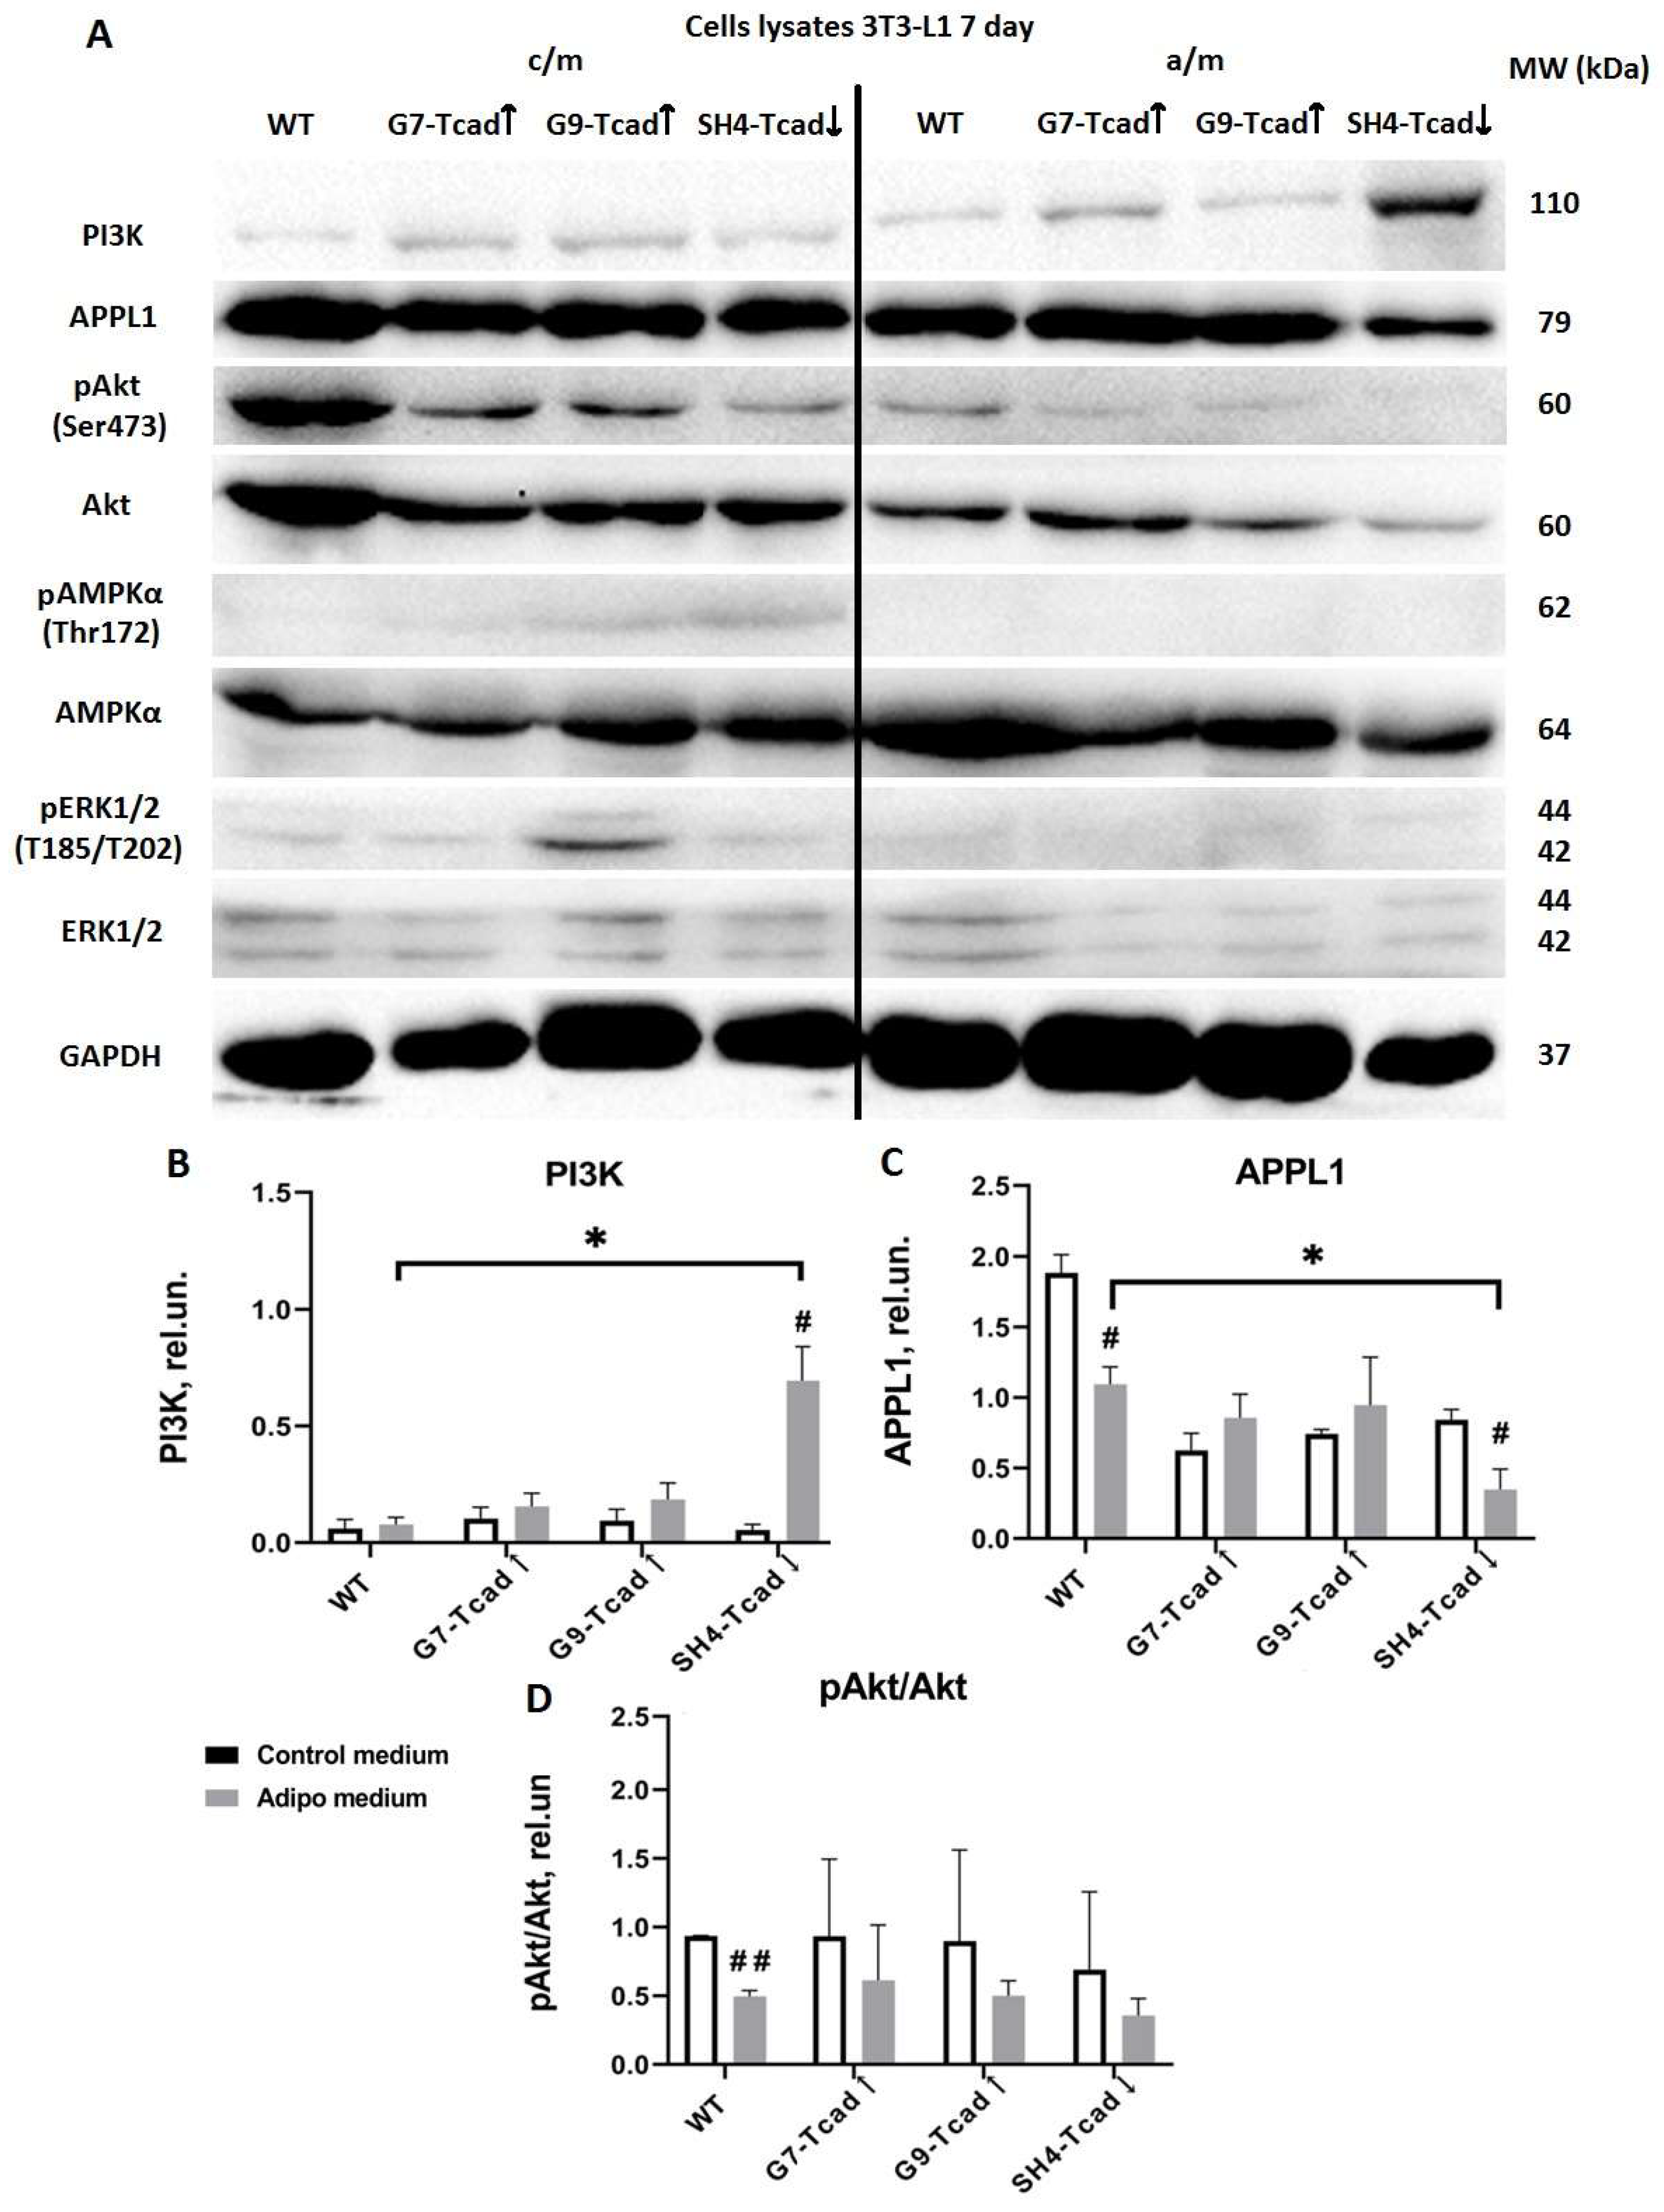
Figure 7). In contrast, G7-Tcad↑ and G9-Tcad↑ cells maintained sustained ERK activation during mitotic phase and later (day 7), consistent with their increased proliferation and attenuated differentiation (
Figure 7 and
Figure 8). These data suggest that prolonged ERK signaling in T cadherin-overexpressing cells may reinforce the proliferative state, whereas its early decline in SH4 Tcad↓ facilitates differentiation (day 7). In the context of adipose tissue homeostasis, these effects of T-cadherin may help to set the balance between progenitor expansion and differentiation commitment—a dynamic interplay that is central to adipose tissue plasticity.
We further explored the role of T-cadherin in regulating key adipogenic signaling pathways. The adipogenic effects of insulin are primarily mediated through PI3K/AKT signaling, which upregulates PPARγ and C/EBPα—the main transcription factors governing terminal adipocyte differentiation and the activation of mTORC1 [
1]. The PI3K-AKT axis plays a central role in mediating insulin effects on both metabolism and cell proliferation, and its activation is considered both necessary and sufficient to induce adipocyte differentiation in vitro [
1,
37]. We examined PI3K and AKT expression and activation levels as critical nodes within the insulin signaling cascade. At baseline (day 0), T-cadherin-deficient cells exhibited a marked pre-activation of the insulin signaling pathway. Even in the absence of adipogenic inducers (day 0), AKT phosphorylation was markedly elevated in SH4-Tcad↓ cells, significantly exceeding the levels detected in WT and T-cadherin-overexpressing cells (G7-Tcad↑ and G9-Tcad↑) (
Figure 7). However, upon adipogenic induction (day 7), SH4-Tcad↓ cells did not show a statistically significant increase in pAKT compared to WT cells. We attribute this to the baseline differences (day 0): even prior to induction, SH4-Tcad↓ cells exhibited elevated pAKT levels relative to WT (
Figure 8). In contrast, upon adipogenic induction (day 7), the level of PI3K rose significantly in T-cadherin deficient cells compared to WT or T-cadherin overexpressing cells, most likely reflecting their enhanced response to the insulin present in the induction cocktail (
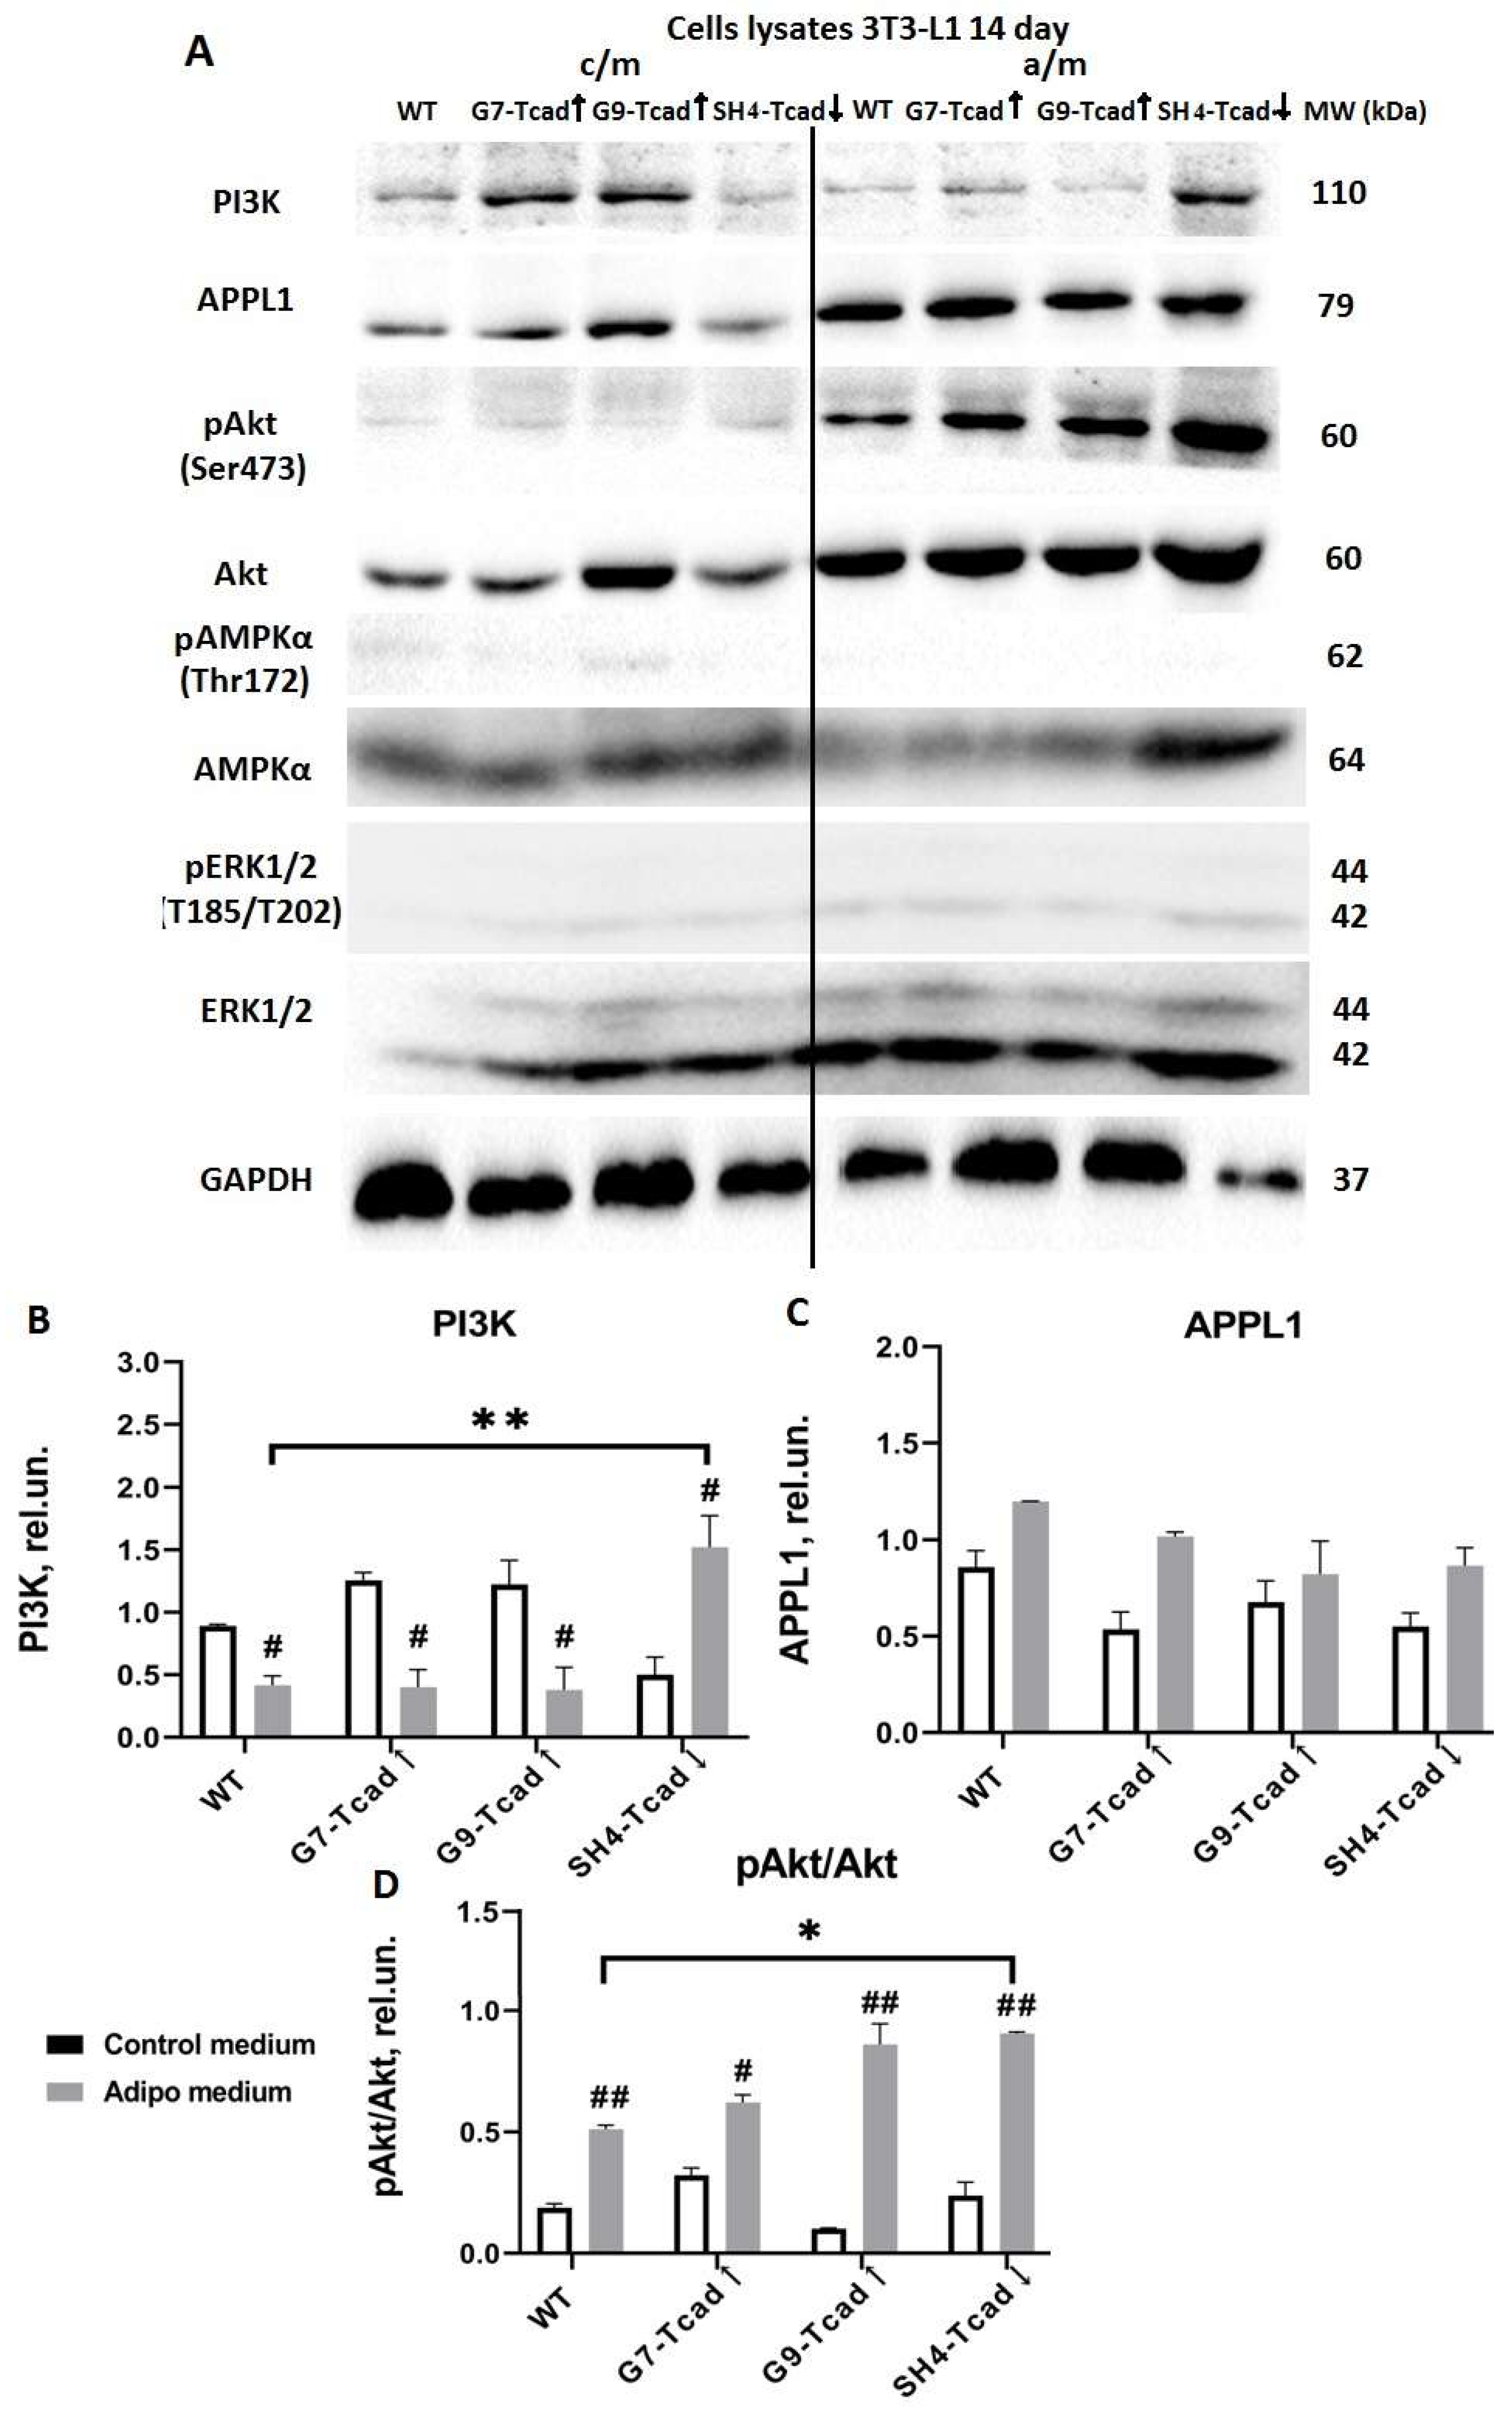
Figure 8). By day 14, (the end point of the differentiation timeline) cumulative effect of T-cadherin knockdown on the PI3K–AKT pathway became clearly evident. Both PI3K protein expression and phospho-AKT levels were significantly higher in SH4-Tcad↓ adipocytes compared to WT (
Figure 9). This activation pattern indicates that, in the absence of T-cadherin, cells exhibited an elevated insulin-dependent activation of the PI3K/AKT signaling or lowered threshold for activation.
Our data therefore suggest that T-cadherin suppression “primes” cells for adipogenic differentiation by elevating AKT activity to the levels normally seen only after induction, while the elevated PI3K indicates that T-cadherin-deficient cells exhibit a more robust commitment to adipogenesis. In T-cadherin overexpressing cells, PI3K levels were modestly and stage-specifically altered rather than consistently decreased, suggesting that elevated T-cadherin shifts the signaling equilibrium without fully suppressing PI3K–AKT activity (
Figure 7,
Figure 8 and
Figure 9). The overall trend of decreased PI3K/AKT signaling in G7-Tcad↑ and G9-Tcad↑ cells, correlating with their reduced adipogenic potential (
Figure 7,
Figure 8 and
Figure 9), suggests that T-cadherin elevated expression may impose a restraint on the insulin/PI3K/AKT axis, both prior to and during adipogenesis.
Our data are in line with the previous studies, where T-cadherin overexpression and homophilic interaction in human endothelial cells attenuated insulin-dependent activation of the PI3K/Akt/mTOR signaling axis, along with the reduced eNOS production, cell migration, and angiogenesis in vitro. In contrast, T-cadherin silencing enhanced insulin sensitivity, suggesting that the reduced responsiveness to insulin in T-cadherin-overexpressing cells may result from a chronic activation of the Akt/mTOR-dependent negative feedback loop within the insulin signaling cascade [
52]. Additionally, co-immunoprecipitation assay revealed a physical association between T-cadherin and the insulin receptor, with both localized to lipid raft domains of the plasma membrane in vascular endothelial cells [
52]. Our findings suggest that T-cadherin could serve as a modulator of PI3K-AKT signaling pathway. Presuming that T-cadherin expression inversely correlates with PI3K-AKT activation, elevated T-cadherin levels may locally impair insulin sensitivity in preadipocytes, whereas downregulated T-cadherin may enhance it. This relationship is particularly significant given that the insulin-PI3K-AKT signaling cascade regulates glucose uptake and lipogenesis, and its impairment is a hallmark of insulin resistance [
53]. Future studies are warranted to investigate whether T-cadherin levels in adipose tissue correlate with systemic insulin sensitivity or adiponectin responsiveness, especially in light of T-cadherin being a receptor for HMW adiponectin, the most metabolically active form of adiponectin [
5,
53,
54].
Towards that end, a similar pre-activation pattern was observed for AMPK in T-cadherin deficient cells: at baseline (day 0), phospho-AMPK was an order of magnitude higher in SH4-Tcad↓ cells compared to WT cells, G7-Tcad↑, and G9-Tcad↑ (
Figure 7). At the first glance, this may appear paradoxical, as AMPK is known to suppress adipogenesis by inhibiting the early mitotic clonal expansion phase, leading to reduced expression of both early (C/EBPs and PPARγ) and late adipogenic markers (fatty acid synthase (FAS), sterol regulatory element-binding protein-1c (SREBP-1c), and the intracellular lipid chaperone aP2) [
4,
55]. However, at later stages of differentiation, this early elevation in AMPK activity did not impair adipogenesis (
Figure 3,
Figure 6,
Figure 8 and
Figure 9). A plausible explanation is that both the timing and cellular context of AMPK activation are critical. In T-cadherin deficient cells, AMPK was pre-activated at confluence in control medium conditions (day 0), but this activation diminished rapidly following the exposure to adipogenic medium comprising insulin (
Figure 7). Supporting this assumption, by days 7 and 14, phospho-AMPK levels were negligible across all cell lines, suggesting that the initial AMPK activation in T-cadherin deficient cells was not sustained throughout differentiation. Recent studies have also shown that AMPK plays a pivotal role in maintaining mitochondrial homeostasis and insulin sensitivity [
56,
57]. Therefore, the elevated phospho-AMPK level detected at baseline in SH4-Tcad↓ cells is more likely indicative of AMPK’s role in supporting metabolic functions, such as mitochondrial biogenesis, or insulin responsiveness rather than adipogenic differentiation, particularly given that phospho-AMPK levels declined following the induction of adipogenesis (days 7, 14).
Additionally, T-cadherin deficiency resulted in a reduced level of APPL1 expression both at baseline (
Figure 7) and on day 7 following adipogenic induction (
Figure 8). By contrast, APPL1 levels remained consistently elevated in T-cadherin-overexpressing cells at day 7, with no evident decline (
Figure 8). APPL1 is an adaptor protein that directly interacts with adiponectin receptors (AdipoR1 and AdipoR2) and plays an important role in intracellular signaling. Upon adiponectin stimulation, the COOH-terminal domain of AdipoR1 interacts with adiponectin, while its intracellular NH
2-terminal domain binds APPL1. APPL1 binds not only to AdipoR1 and AdipoR2 but also to insulin receptor. This interaction is well-characterized and enables APPL1 to mediate multiple signaling cascades, including activation of AKT, PI3K, insulin receptor substrates (IRS1/2), AMPK, p38 MAPK, and GLUT4 membrane translocation [
35,
58]. This crosstalk between insulin signaling, mediated by the PI3K-AKT pathway, and adiponectin signaling, mediated by the APPL1-AMPK axis, constitutes a key mechanism by which adiponectin enhances insulin sensitivity in the target tissues [
35,
58,
59]. Several studies have addressed the role of APPL1 in regulating adipogenic differentiation, yielding both consistent and context-dependent findings. Research by Wen et al. and Lin et al. demonstrated that adipogenic differentiation capacity of MSCs and 3T3-L1 preadipocytes was diminished following APPL1 knockdown [
38,
60]. Conversely, other studies showed that APPL1 knockdown enhanced adipogenesis. For example, adiponectin was demonstrated to enhance osteogenic differentiation in human adipose-derived stem cells by activating the APPL1-AMPK signaling pathway [
61]. In line with these findings, APPL1 knockdown was reported to promote adipogenesis in cultured human bone marrow-derived MSCs by inhibiting autophagy flux and disrupting the balance between adipogenic and osteogenic differentiation—an effect of APPL1 implicated in the pathogenesis of osteoporosis [
38]. Our findings support a link between the enhanced adipogenic potential of T-cadherin deficient cells (earlier and increased lipid accumulation) and their diminished APPL1 expression, whereas elevated APPL1 levels in T-cadherin overexpressing cells were associated with reduced adipogenic capacity and increased proliferation. Given that APPL1 functions as an important cytoplasmic adaptor linking adiponectin receptors (AdipoRs) and the insulin receptor, further investigation is needed to elucidate the molecular mechanisms through which T-cadherin modulates this signaling axis. As a GPI-anchored protein, T-cadherin localizes to lipid raft domains, where it may recruit or immobilize signaling complexes, including APPL1, thereby limiting the availability for downstream signaling [
5]. Exploring whether APPL1, AdipoRs, PI3K or insulin receptor colocalize with T-cadherin within the plasma membrane may provide valuable mechanistic insights into how T-cadherin affects these signaling pathways.
Given the upstream changes in the PI3K–AKT signaling axis in cells with different levels of T-cadherin expression (
Figure 7,
Figure 8 and
Figure 9), we next analyzed the mTOR pathway, a key downstream effector of PI3K that integrates growth factor and metabolic signals to govern cell proliferation and differentiation [
39,
53]. mTOR functions in two complexes, mTORC1 and mTORC2 and regulates protein synthesis, autophagy, cell survival, energy metabolism, lipogenesis, and adipogenesis [
39]. mTORC1 acts as a positive regulator of adipogenesis, since genetic or pharmacological inhibition of mTORC1 blocks adipocyte differentiation, whereas constitutive mTORC1 signaling accelerates adipogenesis. mTORC1 was shown to promote all stages of differentiation including lineage commitment, clonal expansion, and terminal adipogenic differentiation [
62]. In contrast, mTORC2 was demonstrated to function as a negative regulator of adipogenesis [
62]. In the present study, we found that changes in T-cadherin expression modulated the transcript levels of mTOR and its associated complex components (
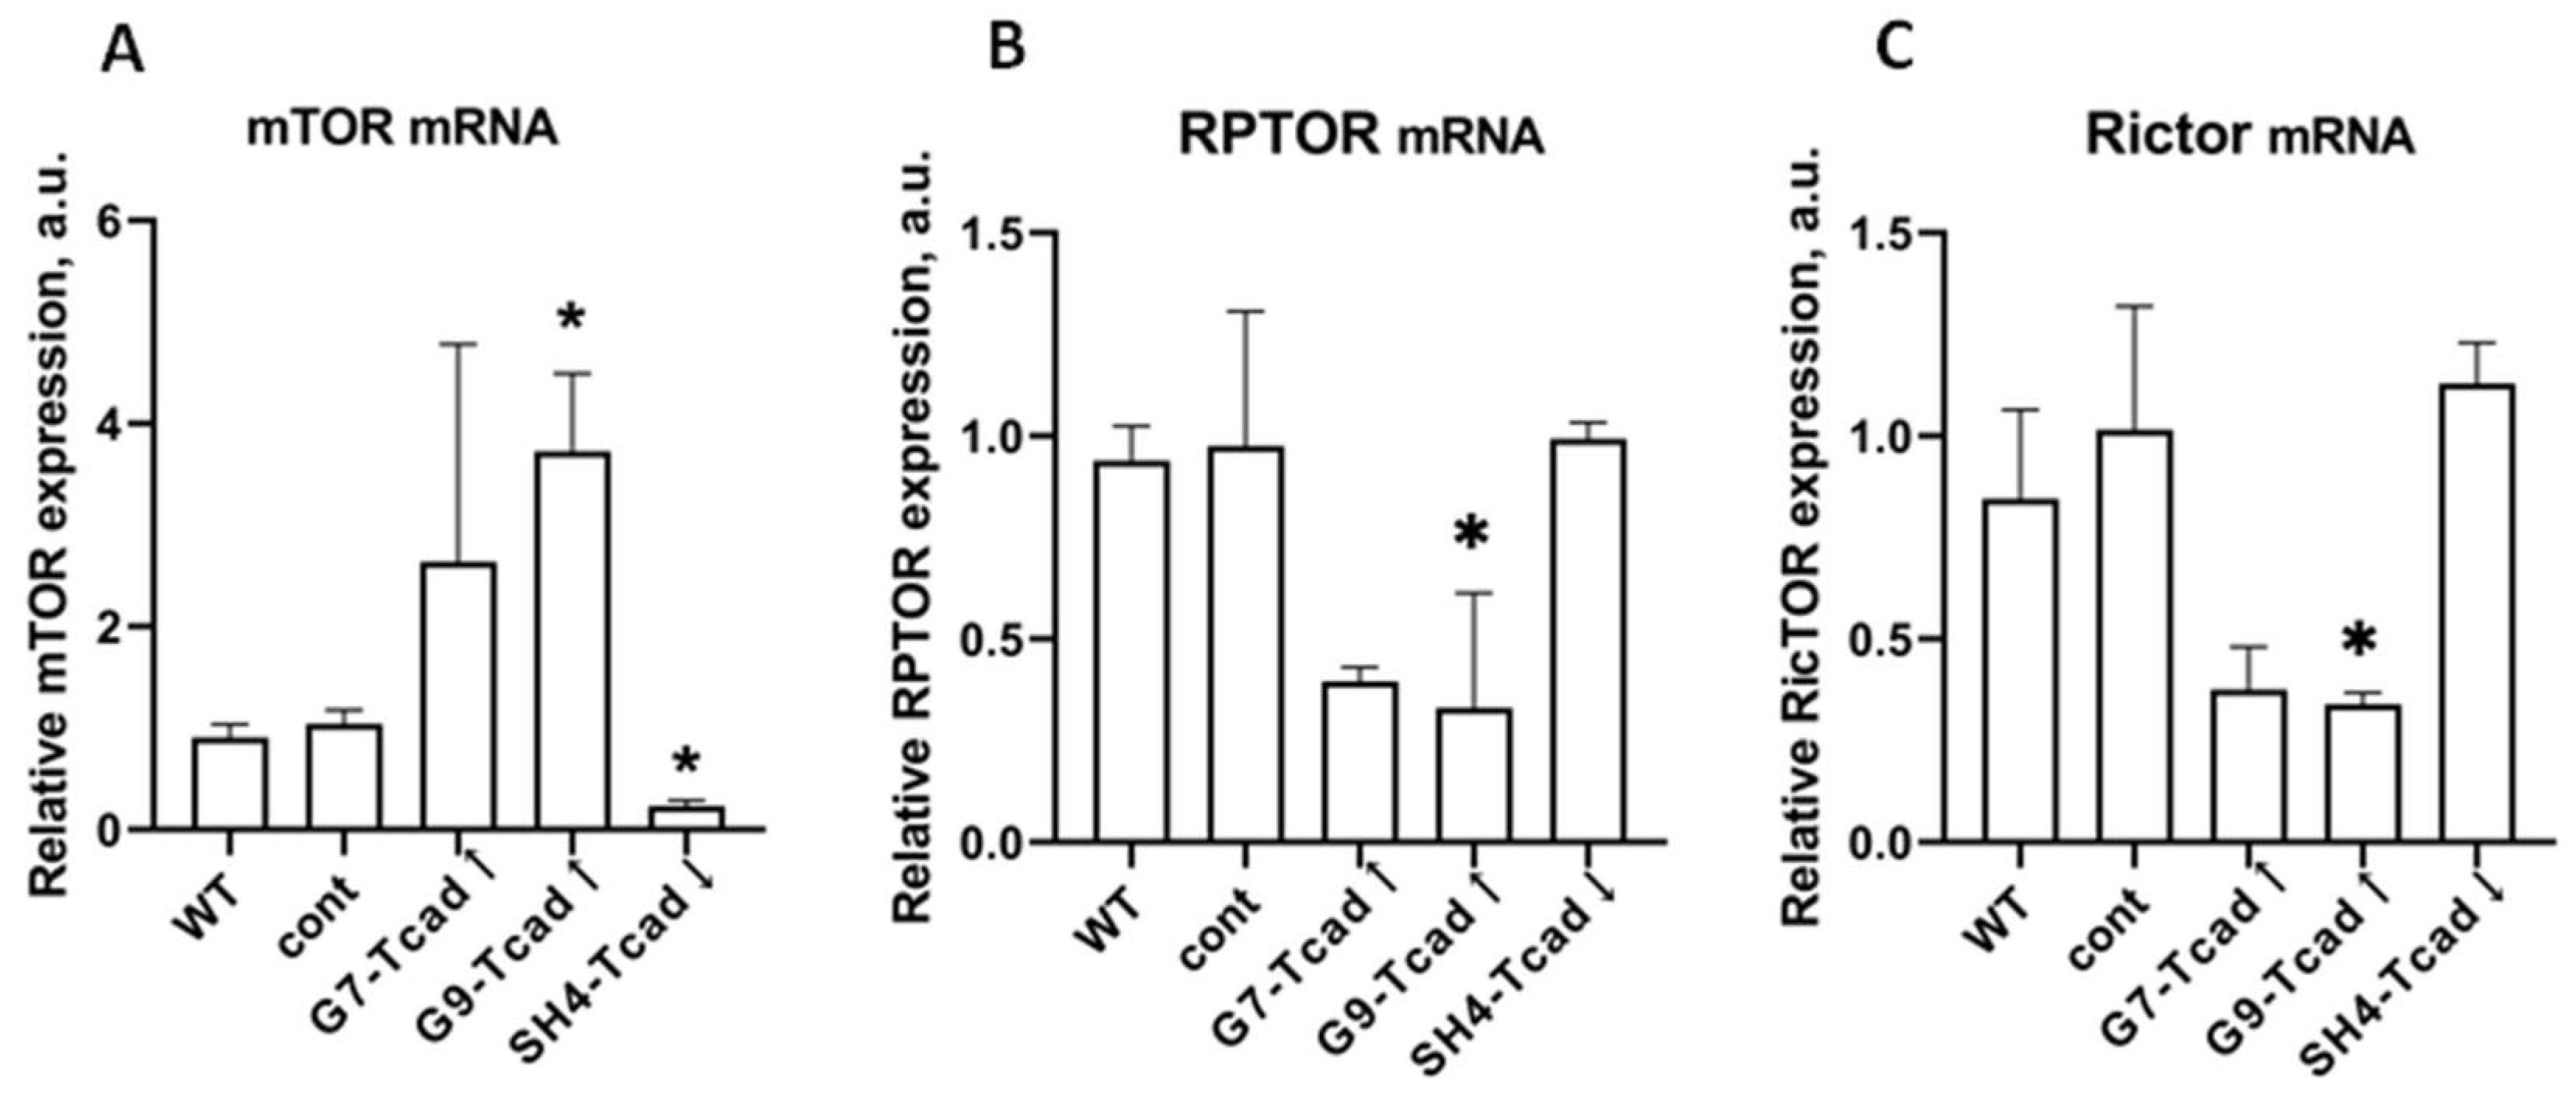
Figure 10). T-cadherin-overexpressing cells had a significantly higher mTOR mRNA levels, but paradoxically exhibited lower mRNA for Rptor (Raptor, mTORC1 scaffold) and Rictor (mTORC2 scaffold). In contrast, T-cadherin deficient cells expressed significantly lower levels of mTOR mRNA, with Raptor/Rictor remaining at the control levels. Although mRNA levels may not directly correlate with the protein content or activity of the mTOR complex per se, these patterns suggest that T-cadherin may modulate mTOR signaling. Elevated T-cadherin expression may increase the total mTOR gene expression, potentially as a compensatory response to reduced PI3K/AKT signaling. Yet, the simultaneous decrease in Raptor and Rictor implies that fewer functional mTOR complexes may assemble. Apparently, T-cadherin overexpression may establish an mTOR-enriched but Raptor/Rictor-deficient environment, thereby impairing the formation and activity of both mTORC1 and mTORC2 complexes. This concept is consistent with the delayed adipogenic differentiation in T-cadherin overexpressing cells, since reduced mTORC1 signaling would be expected to slow down adipogenesis. In contrast, T-cadherin deficient cells exhibited the most pronounced induction of PI3K and phosphorylation of AKT under adipogenic conditions, a combination that strongly activates mTORC1 [
39,
53]. Therefore, despite demonstrating lower levels of mTOR transcripts, these cells are likely to have an enhanced mTORC1 signaling favorable to adipogenesis.
Although our data are preliminary and require further validation through analysis of the phosphorylation status of key mTORC1/mTORC2 targets (e.g., p-mTOR, p-S6K, p-4EBP1), they nonetheless highlight a potential regulatory role of T-cadherin in the mTOR pathway that warrants deeper investigation. Evaluation at the protein level, including assessment of mTORC1 kinase activity and downstream targets will provide direct mechanistic evidence. Nevertheless, our present findings support a model in which T-cadherin modulates the PI3K–AKT–mTOR signaling axis, thereby shaping the cell metabolic profile and propensity for adipogenic differentiation.
In conclusion, our study highlights the multifaceted role of T-cadherin in adipogenesis. T-cadherin affects both the early proliferative expansion of preadipocytes and their subsequent differentiation into mature adipocytes, primarily through modulation of ERK, PI3K–AKT, AMPK, and mTOR signaling pathways. Overexpression of T-cadherin sustains a proliferative, less insulin-responsive state, thereby delaying the transition to lipid-accumulating adipocytes. By contrast, T-cadherin suppression removes this restraint, facilitating earlier differentiation, enhanced insulin signaling, and enhanced lipid accumulation. These findings position T-cadherin as a crucial regulator within the signaling network that governs adipogenic differentiation. Elucidating its precise mechanisms may offer new therapeutic opportunities to improve adipose tissue function by promoting healthy adipocyte turnover and metabolic responsiveness in the context of obesity and insulin resistance.
While our findings provide novel insights into the role of T-cadherin in adipogenesis, several limitations should be acknowledged. First, the study was conducted exclusively using a single murine preadipocyte cell line (3T3-L1), which, although widely used and well-characterized, may not fully capture the complexity and heterogeneity of adipose tissue biology in vitro. Future studies employing adipose-specific T-cadherin knockout mice, proteomic screens or single-cell transcriptomic analyses will be essential to confirm the physiological relevance of our data. These future directions will help to validate and extend our current findings and clarify the role of T-cadherin in regulating adipose tissue plasticity and metabolic health.
4. Materials and Methods
4.1. Cell Culture and Transfections
Mouse 3T3-L1 cells (ATCC CL-173™) were maintained at 37 °C in 5% CO2 in complete medium—Dulbecco’s Modified Eagle’s Medium DMEM (#21969035, Gibco) supplemented with 10% calf serum (FCS, Gibco, Life Technologies, Bleiswijk, The Netherlands) and 1 × antibiotic-antimycotic solution (#15240062, Gibco, Thermo Fisher Scientific, Waltham, MA, USA).
3T3-L1 cells with different levels of T-cadherin expression were generated by T-cadherin or anti-T-cadherin shRNA plasmid transfection, respectively. For overexpression, cells were seeded in 35-mm dishes and transfected with pcDNA-hTcadherin plasmid [
63] using Lipofectamine 2000 (Invitrogen, Waltham, MA, USA) according to the manufacturer’s protocol. After 48 h, G418 (#A1720, Sigma-Aldrich, Merck, Darmstadt, Germany) in the concentration of 500 μg/mL was added for two consecutive 5–7-day selection cycles, after which single-cell cloning was performed in 96-well plates with G418 in concentration of 250 μg/mL. For knockdown, cells were transfected with a mouse T-cadherin shRNA plasmid (sc-43016, Santa Cruz Biotechnology, Dallas, TX, USA) and selected with puromycin (5 μg/mL; P4512б Sigma-Aldrich, Merck, Darmstadt, Germany), followed by the same cloning procedure (with puromycin, 2.5 μg/mL) in 96-well plates.
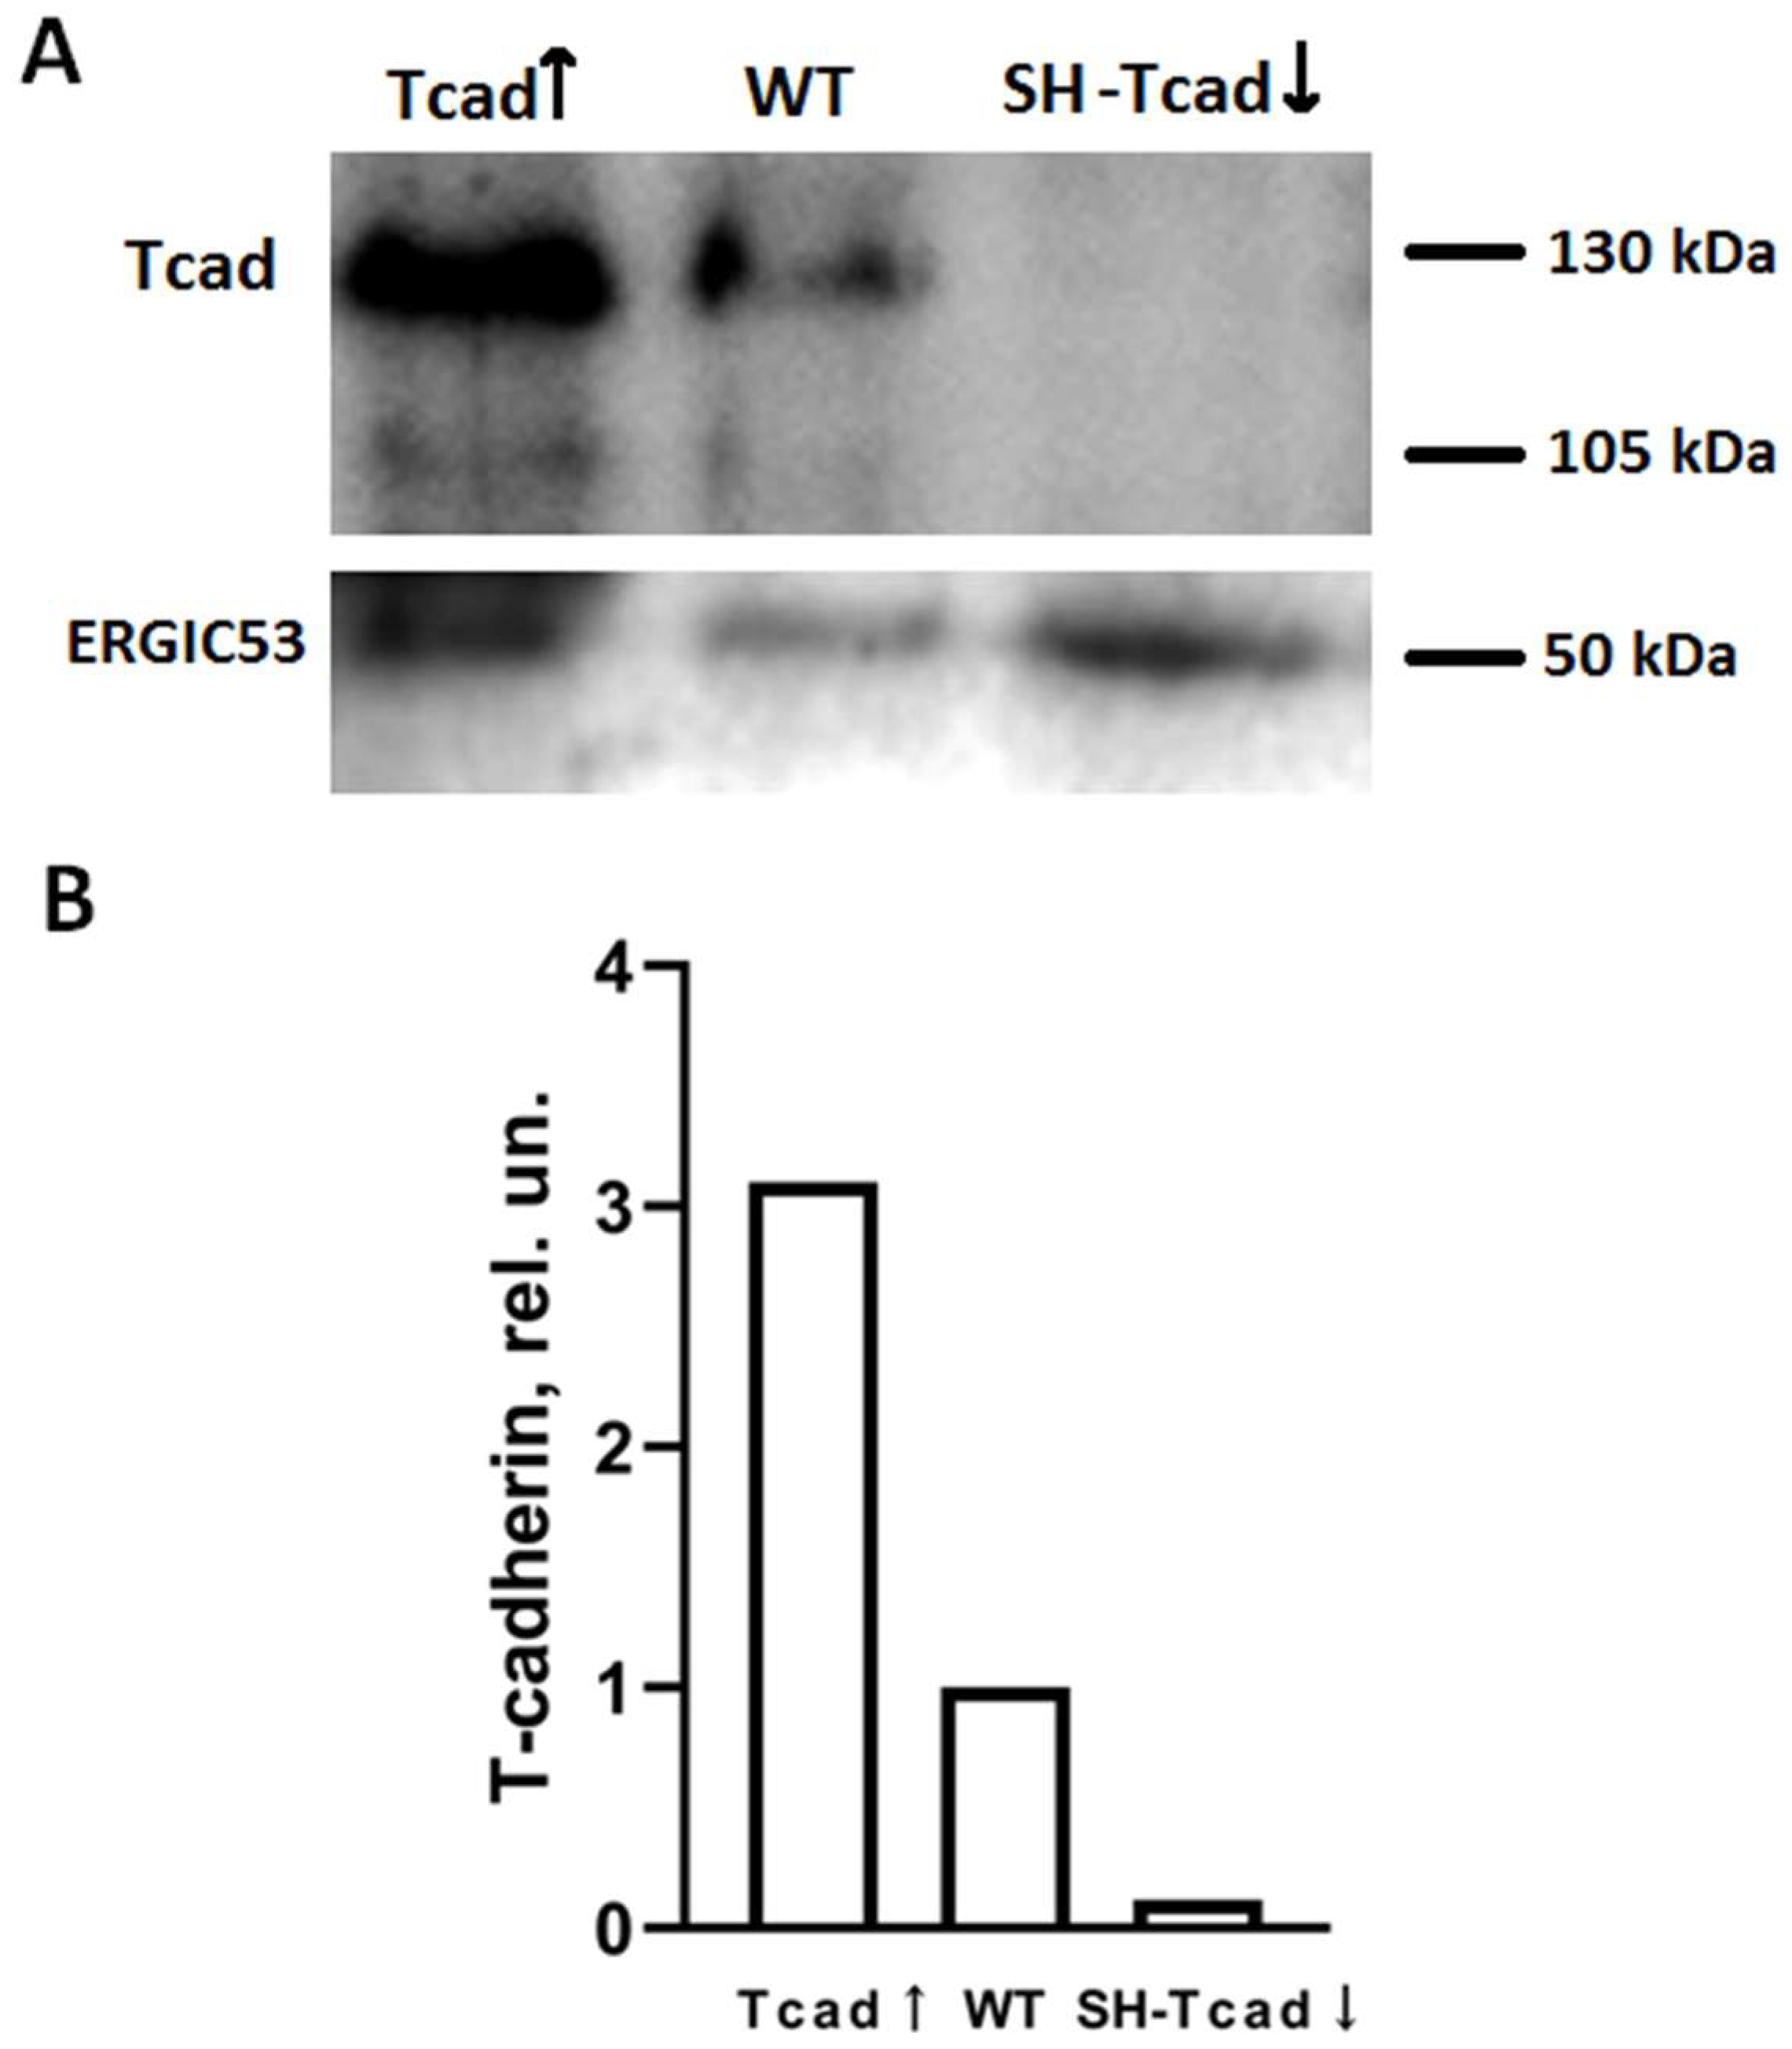
We examined both: the pooled transfectant populations, collected after selection by incubating with antibiotics for >2 weeks, and the clonal cell lines generated by single-cell cloning in 96-well plates with antibiotics. T-cadherin mRNA and protein levels were routinely verified before each experiment by RT-qPCR and immunoblotting.
From the obtained stable 3T3-L1 cell lines we enrolled clones overexpressing T-cadherin (G7-Tcad↑, G9-Tcad↑), T-cadherin knockdown clones (SH1-Tcad↓, SH4-Tcad↓), and two independent control clones transfected with the control vector (cont). Control clones were generated in parallel with the pooled transfectant populations and clonal cell lines; control clone, together with wild-type cells (WT), served as experimental controls.
Pool transfectant cell populations and clonal cell lines were expanded, trypsinised, and used for experiments.
4.2. Adipogenic Differentiation
Confluent 3T3-L1 cells (day 0) were switched to low-glucose DMEM (1g/L; Capricorn Scientific, Ebsdorfergrund, Germany) containing 10% FBS (HyClone, Cytiva, Marlborough, MA, USA), 1 µM dexamethasone (Merck, Darmstadt, Germany), 0.5 mM IBMX (Millipore, Waltham, MA, USA), and 1 μg/mL insulin (Paneco, Moscow, Russia) (adipogenic medium, a/m). Medium was replaced every three days with fresh induction cocktail for 3, 7, 10, or 14 days. Control cells received low-glucose DMEM with 10% FBS only (control medium, c/m).
4.3. Oil Red O Staining
The growth medium was aspirated and replaced with pre-warmed Hank’s buffer (Paneco) containing HEPES (Gibco) at a final concentration of 50 mM. Cells were fixed in 4% paraformaldehyde (30–40 min), rinsed three times in PBS, and stained with Oil Red O (Sigma-Aldrich, Burlington, MA, USA) for 50 min at room temperature. Images were captured using a Leica DMI6000B microscope equipped with DFC7000T camera (Wetzlar, Germany) and ImageJ 1.54d (NIH, Bethesda, MD, USA). 10 random fields per well were analyzed using a Nikon Eclipse Ti microscope equipped with an Andor iXon 897 camera (Andor Technology, Belfast, UK). The experiment was repeated three times.
4.4. Real-Time Proliferation Assay (xCELLigence System)
Cell proliferation was monitored with the xCELLigence real-time cell analysis system (ACEA Biosciences, Inc. San Diego, CA, USA). Each 16-well E-Plate contains gold microelectrodes embedded in the glass bottom; changes in electrical impedance at the electrode surface are converted into a dimensionless “Cell Index” (CI) that reflects cell number, morphology, and attachment.
For background readings, 50 µL of standard medium was added to each well, followed by 5 × 10³ cells in 50 µL growth medium. Cells were allowed to settle for 10 min at room temperature, and the plates were transferred to the station inside the incubator. Impedance was recorded every 14 min for at least 96 h.
4.5. RNA Isolation and RT-qPCR
Total RNA was extracted from cells on days 0, 4, 7, and 10 after induction of adipogenic differentiation or from cells maintained in control medium using RNA extraction kit (HiPure Total RNA Plus Kit, #R4111, Magen Biotechnology Co., Ltd., Guangdong, China). cDNA was generated from 1 µg of total RNA using MMLV RT kit (Evrogen, Russia). qPCR was performed with qPCR mix-HS SYBR (Evrogen, Moscow, Russia) on a Bio-Rad CFX96 (Bio-Rad, Hercules, CA, USA). Primer pairs (
Supplementary Table S1) were designed with NCBI Primer-BLAST and the IDT Oligo Analyzer tool. (
https://eu.idtdna.com/pages/tools/oligoanalyzer, accessed on 2 June 2025). The thermal cycling program for template denaturation, primer annealing and primer extension was 40 cycles of 94 °C for 15 s, 60–62 °C for 30 s, and 72 °C for 20 s, respectively. Relative mRNA transcript level was calculated using the 2
−∆∆Ct method with RPLPO-13 as a reference. The reactions were performed in technical triplicates; biological triplicates are reported as mean ± standard deviation (SD) (unless otherwise stated).
4.6. Protein Extraction and Immunoblotting
Immunoblot analysis was performed as previously described [
2]. Briefly, cells were harvested on days 0, 3, 7, 10, and 14 after induction of adipogenic differentiation or from cells maintained in control medium and lysed in Laemmli buffer (62.5 mM Tris-HCl pH 6.8, 2% SDS, 25% glycerol, 5% β-mercaptoethanol, 0.01% bromophenol blue) supplemented with Protease Inhibitor Cocktail (Sigma-Aldrich, Merck, Darmstadt, Germany) and phosphatase inhibitors (Abcam, Waltham, MA, USA).
Lysates were heated (95 °C, 10 min), clarified, frozen at −20 °C, separated by SDS-PAGE (8%, 215 V, 1 h), and transferred to nitrocellulose membrane (#88018, Thermo Scientific, Waltham, MA, USA) (300 mA, 1.5 h). PageRuler™ Plus Prestained Protein Ladder, 10 to 250 kDa (#26619, Thermo Scientific, USA) was used as the molecular weight marker. Membranes were blocked overnight at 4 °C in 5% skim milk in TBS with 0.1% tween 20 (TBS-T, 4 °C, overnight), incubated with primary antibodies (
Supplementary Table S2) for 1.5 h, followed by incubation with HRP-conjugated secondary antibodies (1:5000 dilution in 5% skim milk in TBS-T, 1 h). Bands were detected with chemiluminescent reagent Affinity™ ECL (femtogram) (#KF8003, Affinity Biosciences, Jiangsu Sheng, China) and visualised on a ChemiDoc (Bio-Rad, Hercules, CA, USA). The densitometry analysis was performed using ImageJ 1.54d.
4.7. Statistical Analysis
All experiments were performed 3 times with duplicates unless otherwise specified. Data analysis was conducted using GraphPad Prism 8.0 (GraphPad Software, San Diego, CA, USA). Data are presented as the mean ± SD. One-way ANOVA with Tukey’s post-hoc test for multiple comparisons was used, t-test was used for pairwise comparisons; p < 0.05 was considered significant.
