Article

Decreased Expression of a Phosphoribosylanthranilate Transferase-Encoding Gene, OsPAT1, Causes Lesion Mimics in Rice

State Key Laboratory of Biocatalysis and Enzyme Engineering, School of Life Sciences, Hubei University, Wuhan 430062, China
*
Authors to whom correspondence should be addressed.
These authors contributed equally to this work.
Int. J. Mol. Sci. 2025, 26(19), 9428; https://doi.org/10.3390/ijms26199428
Submission received: 5 September 2025 / Revised: 24 September 2025 / Accepted: 25 September 2025 / Published: 26 September 2025
(This article belongs to the Collection 30th Anniversary of IJMS: Updates and Advances in Biochemistry)

Abstract

Lesion mimic mutants (LMMs) represent valuable biological tools for investigating plant defense mechanisms and cell death. Although multiple genes triggering lesion mimic formation have been identified, the connection between the lesion mimic phenotype and primary nutrient biosynthesis remains poorly understood. In our study, we characterized a novel rice LMM, lmm9, which exhibited persistent reddish-brown necrotic lesions from seedling stage to maturity, coupled with compromised agronomic traits and increased mortality rates. Map-based cloning and whole-genome sequencing identified a causal insertion in the promoter of Os03g03450/OsPAT1, the sole homolog of Arabidopsis PAT1 in rice, resulting in reduced gene expression. Genetic complementation and RNAi assays confirmed that downregulation of OsPAT1 led to lesion mimic formation in lmm9. OsPAT1 could translate into two variants—the predominant OsPAT1.1 and the C-terminal variant OsPAT1.2. Structural modeling demonstrated high conservation between OsPAT1 and yeast TRP4, and OsPAT1.1 combining the plastid signal sequence of Arabidopsis PAT1 successfully complemented the trp4 mutant in yeast. Notably, OsPAT1.1 and OsPAT1.2 showed different localization patterns, with OsPAT1.1 targeted to mitochondria and OsPAT1.2 localized to chloroplasts. Transcription analysis showed significant upregulation of tryptophan biosynthesis pathway genes in lmm9, consequently increasing the relative abundance of tryptophan and associated metabolites. Our findings provided further evidence that mutations in tryptophan biosynthetic genes can induce lesion mimic phenotypes in rice and would enhance the understanding of metabolic homeostasis in plant stress responses and cell death regulation.

1. Introduction

Plants are constantly facing various biotic and abiotic stresses throughout their lives. As a result, they have developed many strategies to overcome these issues, such as the defense system and metabolic adaptation. Taking the interaction between plants and pathogens as an example, when pathogens adhere to the plant leaves, the leaf cells surrounding the infection sites would die in a short time, known as hypersensitive response (HR), in order to limit the spread of the pathogens. HR is a type of programmed cell death (PCD) and is usually accompanied by the burst of reactive oxygen species (ROS), the induction of defense-related genes, and the accumulation of antibacterial metabolites [1,2]. Sometimes, similar process would be activated spontaneously on plant leaves, stems or other tissues, especially when plants are mutated. Such a phenomenon is known as lesion mimic, and these mutants are called lesion mimic mutants (LMMs) [3,4]. LMMs have been isolated in many plant species, including Arabidopsis, barley, maize, rapeseed, rice, and wheat [3,5,6,7]. Currently, LMMs have been widely used in plant defense and cell death research, demonstrating significant potential for disease control in crop production [4,8].
A number of genes responsible for LMMs have been identified, and many of them encode enzymes participating in photosynthetic pigment metabolic pathways, particularly in tetrapyrrole and chlorophyll synthesis [9,10]. The maize Les22 mutant, carrying a Mutator (Mu) element inserted in the uroporphyrinogen decarboxylase (UROD)-encoding gene, exhibited lesion mimic phenotype [11]. In rice, genes that encoded coproporphyrinogen III oxidase, protoporphyrinogen IX oxidase, and protochlorophyllide oxidoreductase could cause lesion mimics as well if they were mutated [9]. Moreover, the genes mutated in the maize necrotic leaf mutant (nec-t) and the soybean Glycine max lesion mimic mutant 2-1 (Gmlmm2-1) also encoded coproporphyrinogen III oxidases [12,13].
Also, there are other types of genes that cause LMMs. Some of them encoded members of the ubiquitin-proteasome system, such as SPL11, EBR1, and OsCUL3a [14,15,16]. A few genes were involved in plant defense responses, such as NLS1, CslF6, and SDS2 [17,18,19]. Genes that participated in transcription or epigenetic regulation also could be found in the cloned genes for LMMs [10]. As a result, the causal genes of LMMs are varied.
Besides gene mutation, improper expression of certain genes also leads to lesion mimic phenotype in plants. RKe, an ortholog of the bacterial blight resistance gene Xa3/Xa26, caused significant lesion mimics in many tissues when overexpressed in rice [20]. Upregulation of JMJ705, a histone lysine demethylase-encoding gene, could produce lesion mimics on rice leaves [21]. And suppression of OsEDR1 expression in rice plants also led to lesions spontaneously on their leaves [22].
Among these genes, the first rice LMM genes, Sekiguchi Lesion (SL), received less attention. The Sekiguchi lesion was found in a natural mutant rice cultivar, Sekiguchi-asahi, and could be formed in the absence of pathogen [23]. The SL gene encodes a cytochrome P450 monooxygenase that catalyzes tryptamine conversion to serotonin and was isolated decades after its discovery [24]. Interestingly, another LMM, early lesion leaf 1 (ell1), was reported as the allelic mutant of sl [25]. Both mutants exhibited significant changes in tryptophan content and related gene expression, revealing a potential link between tryptophan metabolism and cell death [23,26]. Recently, mutation of EARLY LEAF LESION AND SENESCENCE 1 (ELS1) was also reported to induce lesion mimics and cell death in rice [27]. The ELS1 gene encodes the α-subunit of anthranilate synthase (AS), which is involved in tryptophan biosynthesis, and is also known as ASA2 (or OASA2) [27]. It was found that the expression of ASA1 (or OASA1), the homolog of ELS1/ASA2, and other tryptophan biosynthesis pathway genes was increased in els1, resulting in the disruption of tryptophan metabolism [27]. Both studies established a connection between lesion mimic formation and the tryptophan biosynthesis or degradation process.
Tryptophan is an essential amino acid for all organisms and can be synthesized only in microbes and plants. Its synthetic pathway mainly involves the process from chorismate to tryptophan. The first step is the combination of chorismic acid with the amino group of glutamic acid to form anthranilate, which is the rate-limiting step and is catalyzed by AS [28,29,30]. Then anthranilate receives the phosphoribosyl group from phosphoribosyl-α1-pyrophosphate (PRPP), and generate pyrophosphate (PPi) and N-(5′-phosphoribosyl)anthranilate (PRA), which are catalyzed by the enzyme called anthranilate phosphoribosyltransferase (AnPRT) or phosphoribosylanthranilate phosphoribosyltransferase (PRT). After three more steps, tryptophan is finally synthesized from indole and serine [30].
Most of the enzymes and genes involved in tryptophan synthesis are highly conserved, while the AnPRT in E.coli differs a little from those in other species. In E.coli, this enzyme is fused with the small subunit of AS, forming a bifunctional protein encoded by the TrpD gene [31]. In contrast, TRP4 gene in yeast encodes a monofunctional AnPRT enzyme [32]. The homologous gene in Arabidopsis, named phosphoribosylanthranilate transferase 1 (PAT1), also encodes a single enzyme [33]. The Arabidopsis trp1-1 mutant, defective in PAT1, displayed auxotrophy phenotypes including retarded growth and could be rescued by supplementation with indole and tryptophan [33,34]. However, research on PAT1 homologs in other plants has rarely been reported.
Tryptophan can be degraded to generate other metabolites, such as indole-3-acetic acid (IAA), serotonin, and melatonin. Although a tryptophan-independent pathway for IAA synthesis has been reported in plants, the precursor indole is still a key component in IAA synthesis [35]. Serotonin is not only a well-studied neurotransmitter in mammals, but also a common metabolite in diverse plant species. It can be generated from tryptamine, which is a catabolite of tryptophan and has been reported to participate in plant development and stress response [36]. Melatonin, the well-known animal neurohormone, is derived from serotonin and can be used as a biocide in several plants. Recent studies have shown that melatonin coordinated with many phytohormones and regulated plant innate immunity to overcome plant diseases [37].
In our present study, we demonstrated that a mutation in another tryptophan synthesis gene, OsPAT1, also led to lesion mimic phenotype in rice. This LMM was discovered in the follow-up work to our previous study and was designated as lesion mimic mutant 9 (lmm9). Through map-based cloning and genome sequencing, a T-DNA fragment was identified in the promoter region of the Os03g03450/OsPAT1 gene in lmm9. Genetic complementation and knockdown assays confirmed that reduced OsPAT1 expression underlies the lmm9 phenotype. OsPAT1 encoded two isoforms, OsPAT1.1 and OsPAT1.2, which only differed in a few residues at their C termini. OsPAT1 was evolutionarily conserved and could complement the trp4 mutant in yeast, demonstrating its functional AnPRT activity. Interestingly, OsPAT1.1 and OsPAT1.2 were localized to mitochondria and chloroplasts, respectively. And reduced OsPAT1 expression affected the expression of several genes in the tryptophan synthesis and degradation pathway, leading to the increased accumulation of tryptophan and other metabolites. Collectively, our results provide further evidence that tryptophan synthesis pathway genes participate in lesion mimic formation in rice.

2. Results

2.1. Discovery and Phenotypic Characterization of the lmm9 Mutant

In our previous studies of Xa3/Xa26 gene family members, several plants with obvious lesion spots on their leaves were found in a T1 transgenic line, which was designed to overexpress TRKc in rice cultivar MDJ8. The lesion mimic phenotype was not consistent with the transgenic fragment in the same T1 line, and no lesions appeared in other TRKc-overexpressing T1 transgenic lines. Furthermore, the segregation ratio of the lesion mimic phenotype in the T1 line (Normal leaf: spotted leaf = 14:6, χ2 = 0.238 for 3:1, < χ20.05 = 3.841) indicated that the phenotype was possibly caused by a single recessive Mendelian locus. Therefore, it was predicted that the phenotype might be caused by a spontaneous mutation or an unknown event during the transgenic plant regeneration process. To avoid confusion between spotted leaf (spl) mutants and SQUAMOSA PROMOTER BINDING PROTEIN-Like (SPL) genes, this mutant was named as lmm9 here, based on recent studies [9,10].
Under natural conditions in Wuhan, reddish-brown spotted lesions appeared on the leaf blades, collars, and leaf sheaths of lmm9 plants at as early as the seedling stage (Figure 1a–d). As the plants grew, the lesions expanded from small to large. After the lesions spread across the entire intersecting surface, the leaves would collapse and wither in several days (Figure 1e). When severe lesions developed in multiple tissues, the whole plants became shriveled. On average, more than 80 percent of the mutant plants died before harvest. Nevertheless, a few lmm9 plants still survived to the mature stage, and lesions could be observed on peduncles, spikelets, and seeds (Figure 1e–g).
Besides the lesion mimic phenotype, the lmm9 plants also showed differences in several agronomic traits, compared with the wildtype (WT) MDJ8. The lmm9 plants were significantly shorter than WT in plant height (Figure 1e,h). Their tiller numbers were fewer than WT (Figure 1i). The lmm9 plants also had shorter panicles and lower seed-setting rates (Figure 1j,k). The development of pollen, stamen, and stigma of lmm9 was slightly affected compared with WT (Figure S1). However, no obvious difference was found in grain weight between lmm9 and WT (Figure 1l).
Usually, cell death and ROS accumulation were closely related to lesion mimics in plants. As a result, the leaves of lmm9 and WT were analyzed. Compared to WT, more dark blue spots appeared on lmm9 leaves after trypan blue staining, even before lesion formation, indicating that cell death were increased in lmm9 plants (Figure 1m). The activities of catalase (CAT), peroxidase (POD), and superoxide dismutase (SOD), which are involved in hydrogen peroxide scavenging, in lmm9 leaves were much higher than those in WT (Figure 1n–p). The level of malondialdehyde (MDA), a metabolite of lipid peroxidation products, in lmm9 was also higher than that in WT (Figure 1q).
Chloroplasts and mitochondria are reported to be important components for ROS and programmed cell death (PCD). To determine whether these organelles were affected in the lmm9 plants, their ultrastructure was analyzed by transmission electron microscopy (TEM) using leaf samples. The membranes of both mitochondria and chloroplast thylakoids were very clear in the WT. However, those membranes in lmm9 were disintegrated (Figure S2a–h). The photosynthetic pigments in leaves were also examined, and it was found that the contents of chlorophyll a, chlorophyll b, and carotenoids were all significantly reduced in lmm9 (Figure S2i). All these results together indicated that the lesion mimics could lead to cell death and ROS accumulation in lmm9 mutants.

2.2. Localization and Identification of lmm9 Gene

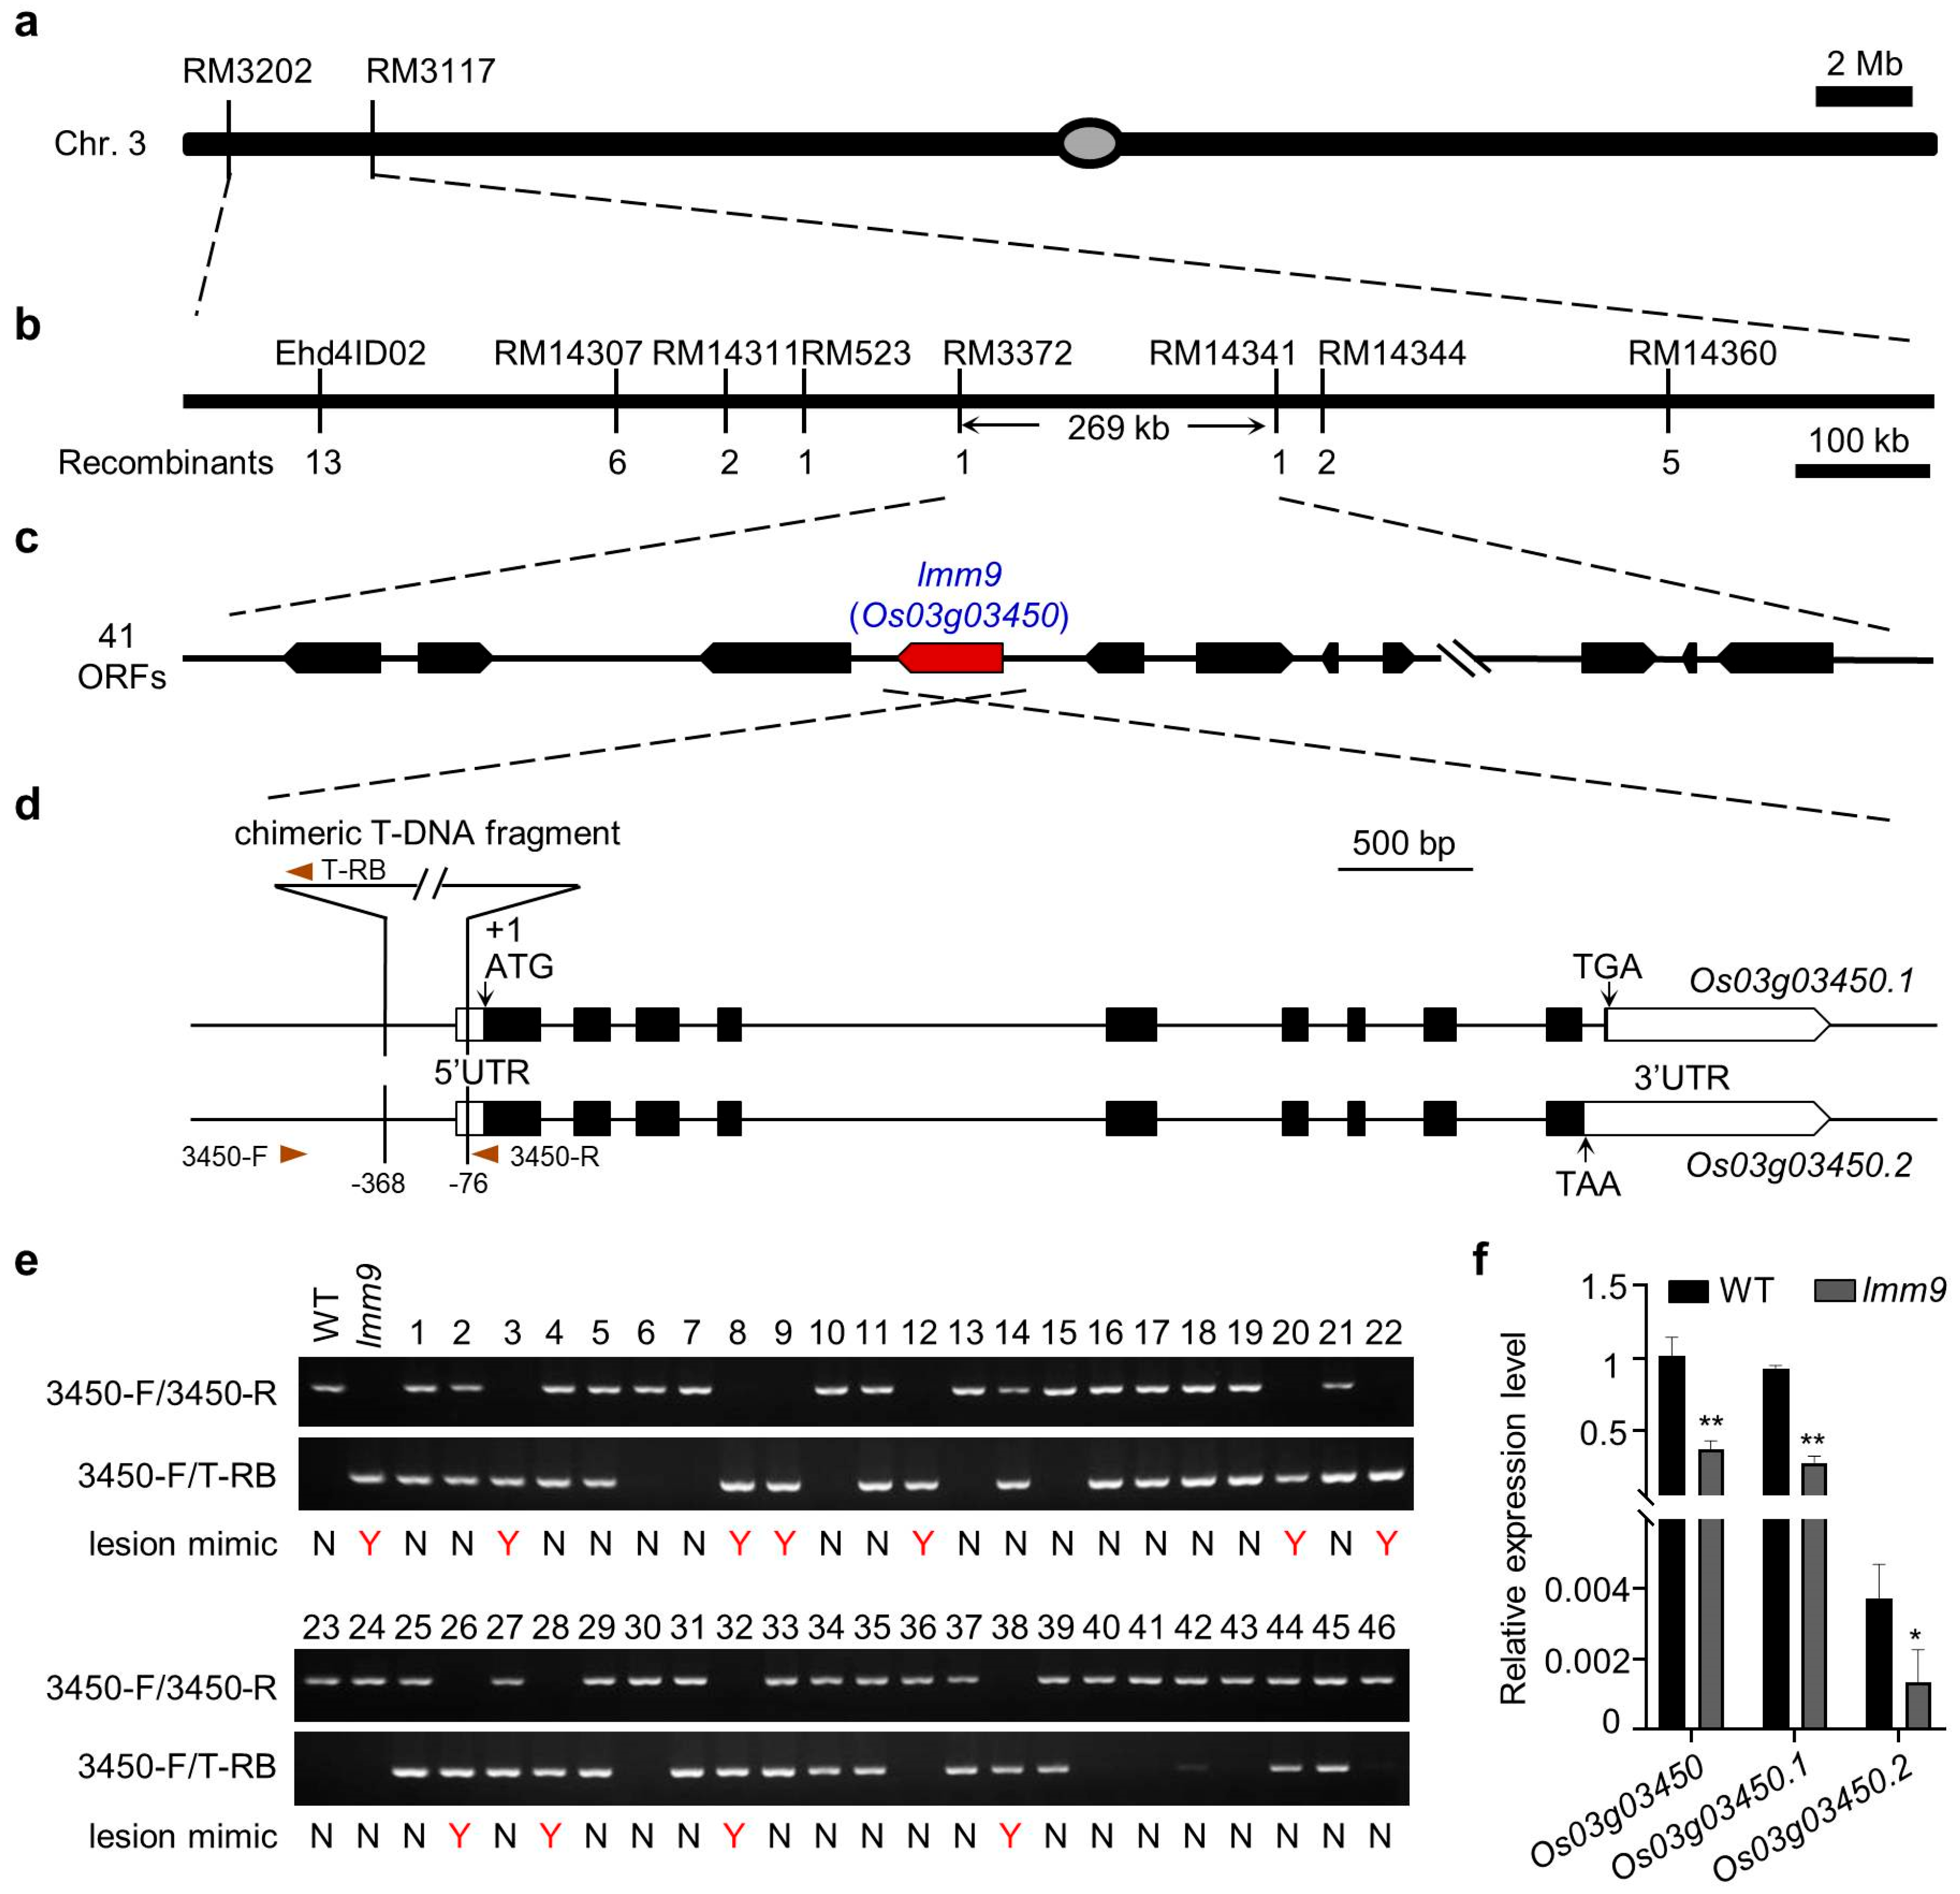
To investigate which gene caused the lesion mimics phenotype, the lmm9 mutant was used as the female parent and hybridized with MH63 (indica). However, no hybrids could be obtained due to the high mortality of lmm9 mutants. Then normal plants segregated from the same lines as the lmm9 mutants, which carried the lmm9 gene at a rate of two-thirds, were chosen as the female parent to hybridize with MH63 again. These plants were also checked for lesion formation in their self-fertilized offspring to determine which plant carried the lmm9 gene. Fortunately, one heterozygous plant was found, and its hybrids were self-crossed and harvested separately for generating segregating populations. Two populations were analyzed, and plants in one population exhibited the same lesion mimic phenotype. Using this population, the lmm9 gene was mapped to a 269 kb genomic region between markers RM3372 and RM14341 on chromosome 3 (Figure 2a,b). In this region, a total of forty-one genes were found according to the reference genome of Nipponbare (Figure 2c).
At the same time, whole-genome sequencing was performed using lmm9 and WT plants. In the mapping region, a large fragment insertion in the promoter of gene Os03g03450 and ten minor differences in other genes were found in lmm9 compared with WT. However, only the insertion could be validated by Sanger sequencing in the subsequent analysis. After identification of the flanking sequences on both sides, it was found that the inserted fragment was an unusual chimera of two segments that was originated from pU1301 vector (not including the GUS reporter gene) and the Agrobacterium Ti plasmid. The fragment was inserted into and replaced the sequence between 368 and 75 base pair upstream of the start codon of Os03g03450 (Figure 2d). To confirm the relationship between the insertion and lesion mimic phenotype, a pair of primers was designed in the flanking sequences and was used to analyze the offsprings of an lmm9 heterozygous plant. In these plants, all the lesion mimic plants were homozygous for the inserted fragment and none of the heterozygous plants developed lesions (Figure 2e). These results suggested that Os03g03450 was probably the lmm9 gene.
Since the insertion occurred in the promoter and untranslated region (UTR) rather than the coding region, the expression of Os03g03450 in lmm9 was analyzed. There were two transcripts for this gene, Os03g03450.1 and Os03g03450.2, which were identical in most parts except for the 3′ terminal sequences (Figure 2d). It was found that the total expression of Os03g03450 in the leaves of lmm9 mutant was much lower than that in WT (Figure 2f). Os03g03450.1 accounted for a large portion of the total transcripts, whereas both Os03g03450.1 and Os03g03450.2 were less abundant in lmm9 than in WT (Figure 2f and Figure S3).

2.3. Downregulation of Os03g03450 Led to the lmm9 Mutant Phenotype

To further confirm whether the lmm9 phenotype was caused by the fragment insertion in the promoter of Os03g03450, a native promoter-driven Os03g03450 fragment was transformed into the lmm9 mutant, generating LMM9-Com plants (Figure 3a). Among the forty-nine T0 transgenic plants, all positive plants no longer developed lesions. Meanwhile, all negative plants remained smaller than WT and developed the same lesions as lmm9. The results were further confirmed in several T1 and T2 generation lines. In the positive transgenic plants of LMM9-Com-7-12 and LMM9-Com-27-4 lines, the growth was restored and no lesions were found (Figure 3b,c). However, the expression of Os03g03450 in LMM9-Com-7 and LMM9-Com-27 was higher than that in WT, likely due to the position effect from transformation (Figure S4). These results suggested that Os03g03450 was the lmm9 gene.
To prove that the reduced Os03g03450 expression was crucial for lesion formation, RNAi plants (LMM9-Ri) were generated (Figure 3d). In the T0 generation, 17 out of 36 plants developed significant lesion mimics similar to the lmm9 mutant and died during growth, leaving only 19 surviving plants with fewer lesions. The lesion mimics could be observed in their T1 and T2 lines. In four different LMM9-Ri T2 lines, the Os03g03450 expression levels in positive transgenic plants were significantly suppressed and lesions developed on their leaves, whereas negative plants showed normal gene expression and growth (Figure 3e,f). These results indicated that the reduced expression of Os03g03450, caused by the promoter insertion, was responsible for the lmm9 mutant phenotype.
Furthermore, site-directed mutagenesis was performed to determine whether Os03g03450 knockout could also induce lesion mimics. Two target sites were selected for CRISPR/Cas9-mediated mutation to generate LMM9-KO plants (Figure S5a). However, only the target in the second exon was mutated in these plants. During the selection for four generations, some plants were found to develop lesions resembling lmm9. Sequencing data revealed that these plants were chimeric mutants harboring multiple allelic mutations in Os03g03450. Unfortunately, these plants all died before harvest. Similarly, in the offspring of plants carrying heterozygous mutations, no homozygous mutants were found. For example, in the offspring of the heterozygous LMM9-KO-T3-10 line, all the plants were either heterozygous or wildtype at the Os03g03450 locus, with no homozygous mutant plants identified (Figure S5b,c). Given the high fatality rate of the lmm9 mutants, these results indicated that Os03g03450 is essential for rice development and that its knockout is lethal.

2.4. Os03g03450 Encoded a Conserved and Functional Enzyme–OsPAT1

According to the gene annotation, Os03g03450 encoded a putative AnPRT enzyme, which was homologous to Arabidopsis PAT1 and yeast TRP4. As a result, this gene was renamed as OsPAT1 hereafter. In rice genome, there were no other genes homologous to OsPAT1, which was consistent with the high fatality of both lmm9 and LMM9-KO plants during growth. A search for homologous proteins of OsPAT1.1 and OsPAT1.2 in other species were carried out based on the NCBI database. All the homologs could be grouped into 4 categories, which mainly corresponded to dicots, monocots, spore plants, and microbes (Figure S6). This phenomenon indicated that these proteins were conserved during evolution.
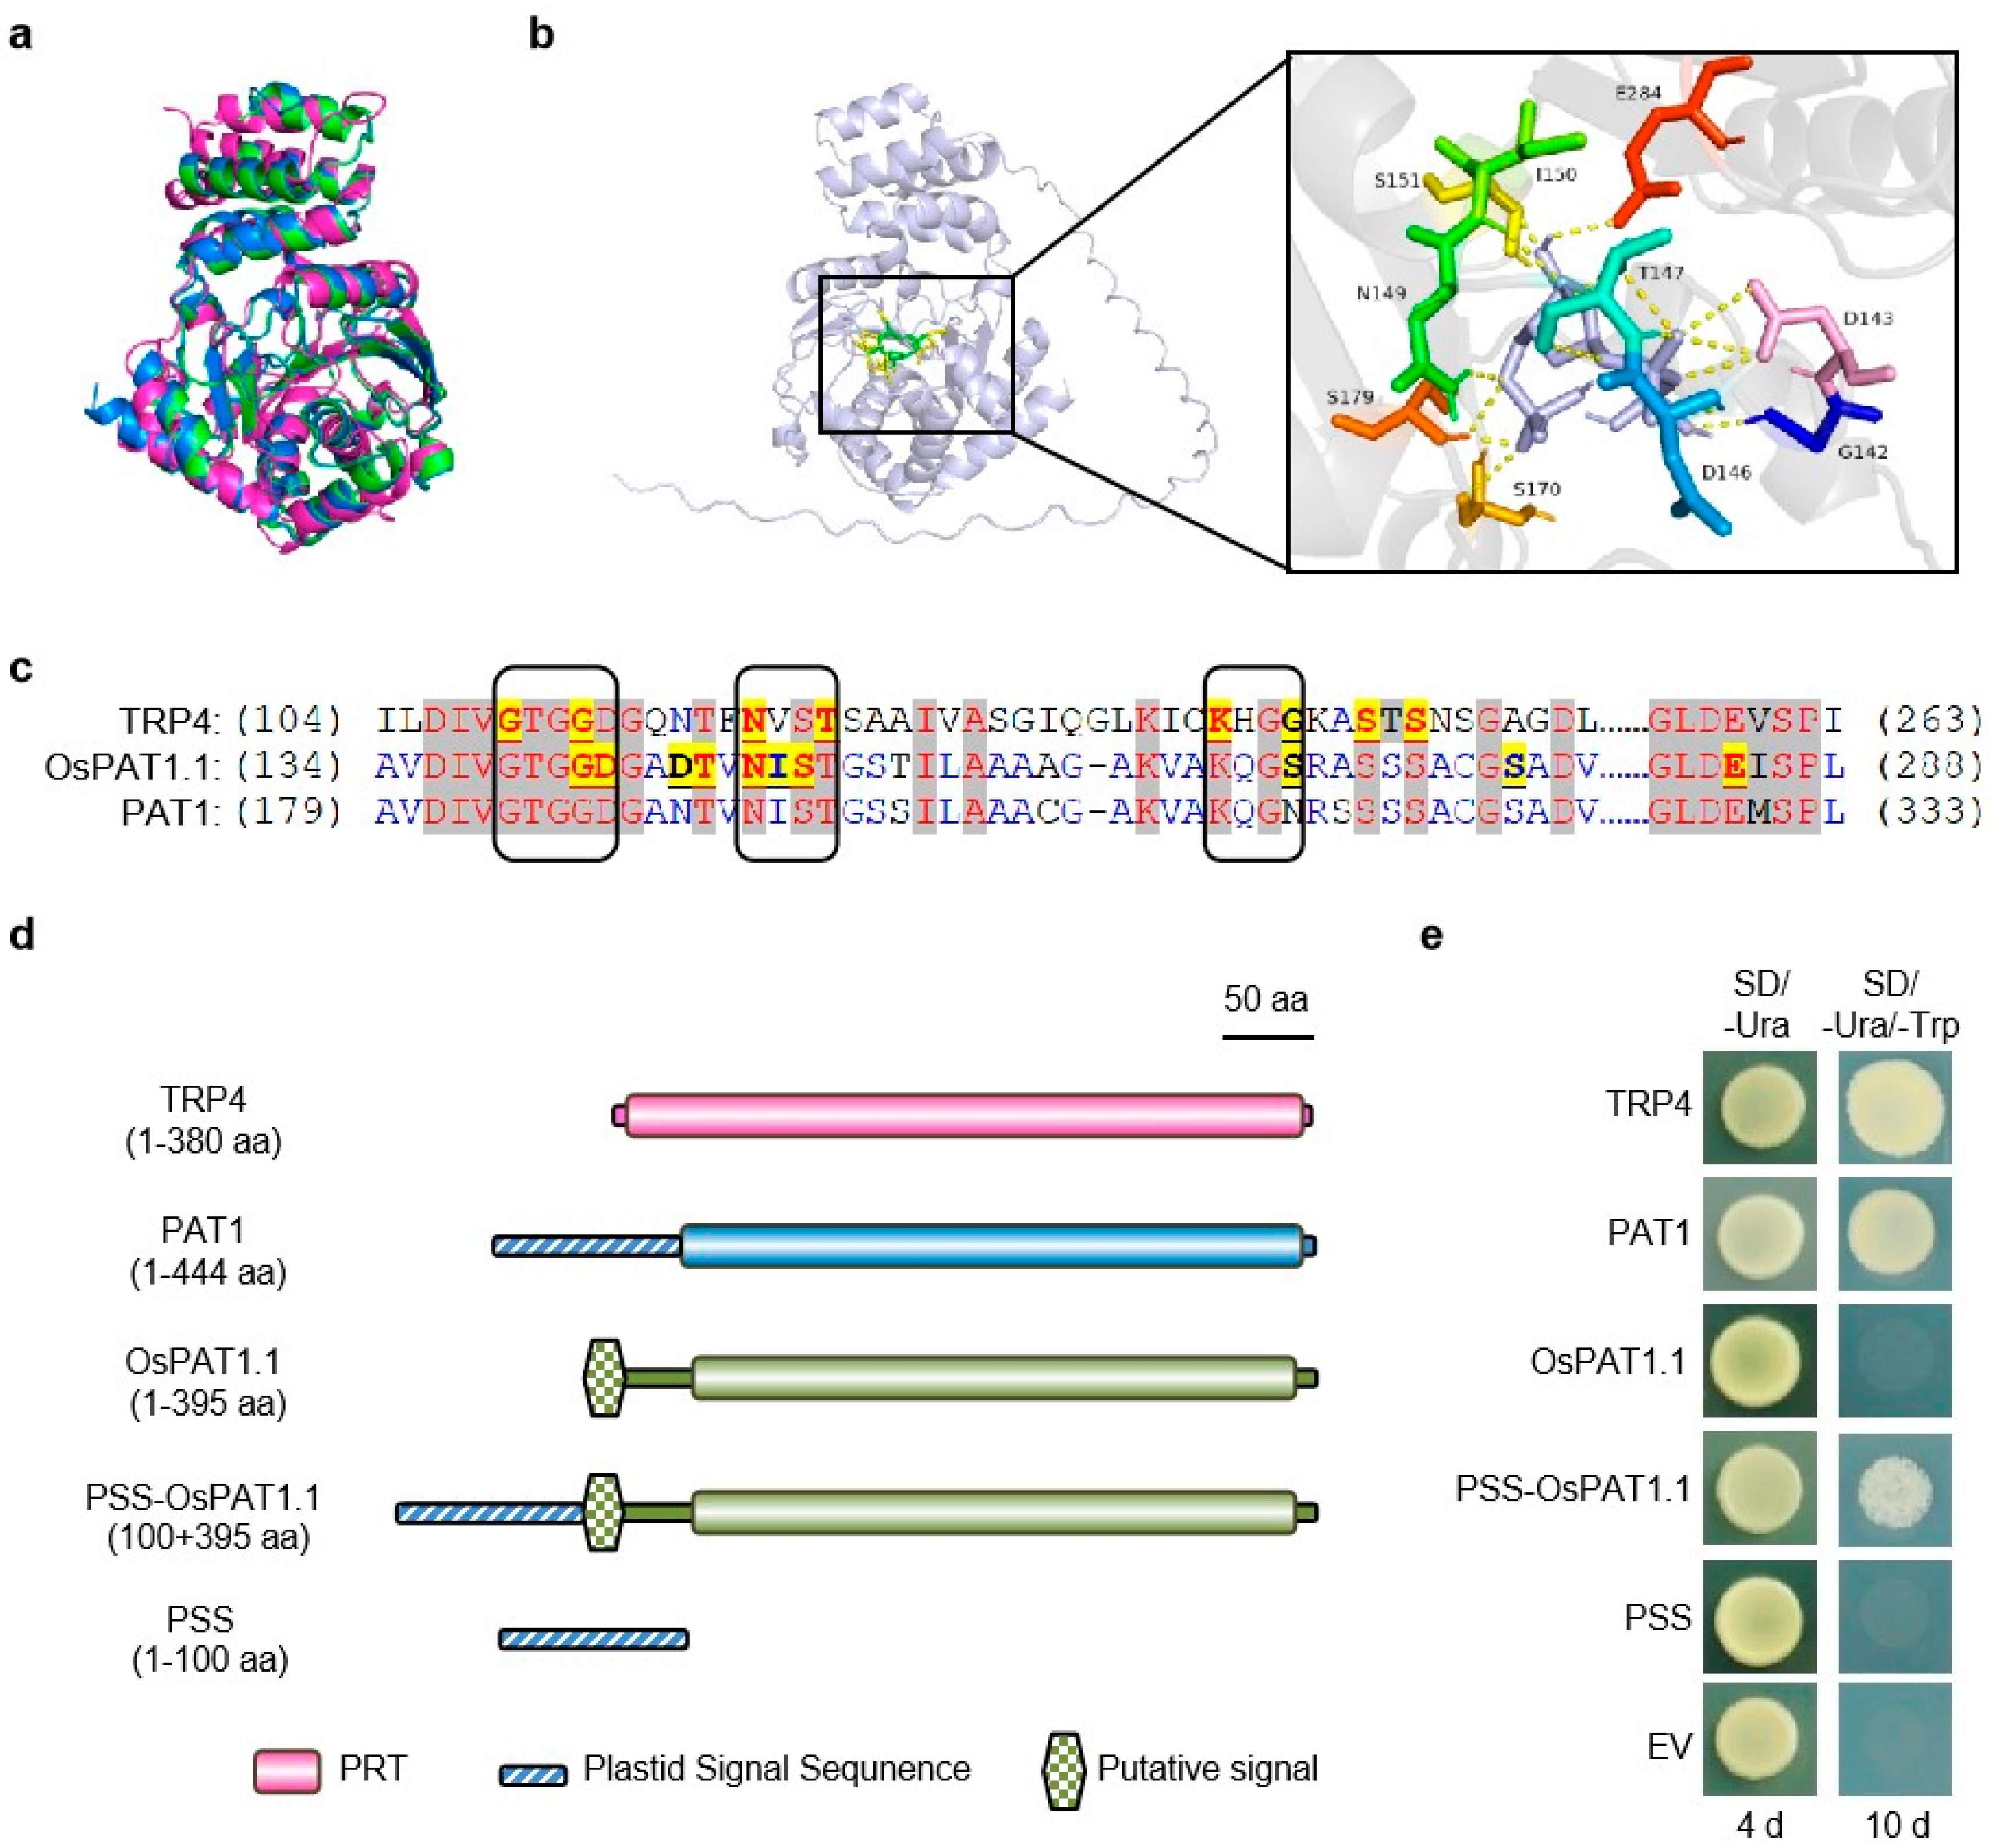
Nonetheless, OsPAT1.1 and OsPAT1.2 exhibited only 56% sequence identity to Arabidopsis PAT1 (Figure S7). To determine whether OsPAT1 possesses enzymatic activity, the three-dimensional structure of OsPAT1.1, the main product of OsPAT1, were predicted by AlphaFold 3 to compare with that of PAT1. Interestingly, OsPAT1.1 and PAT1 possessed nearly identical structures, except for their N-termini (Figure S8a–c). Moreover, their structures perfectly resembled the reported crystal structure of yeast TRP4 (Figure 4a and Figure S8a,d). The core structures of both OsPAT1.1 and PAT1 consisted of an α-helical domain and an α/β domain (Figure S8b,c). A cleft was formed between the two domains in OsPAT1.1, similar to that in TRP4 for binding the substrate PRPP (Figure S8b,d) [38]. To reveal the possible binding conformation, AutoDock was used to predict the potential interactions between OsPAT1.1 and PRPP (Figure 4b). In this conformation, ten residues in total could interact with PRPP, and six of them were located in the reported PRPP-binding motifs in TRP4 (Figure 4b,c). This finding suggested that OsPAT1 may function as an AnPRT enzyme.
To test the enzyme activities, OsPAT1.1 and PAT1 were ectopically expressed in the yeast trp4 mutant strain. Surprisingly, full-length OsPAT1.1 failed to complement the trp4 mutant on tryptophan-deficient medium, while PAT1 succeeded (Figure 4d,e). It was reported that PAT1 contained a plastid signal sequence at its N-terminus [33]. However, only a short undefined signal sequence predicted by InterPro were found in OsPAT1.1 or OsPAT1.2 (Figure 4d). Therefore, the plastid signal sequence of PAT1 was fused to OsPAT1.1 in further experiments. And the modified OsPAT1.1 successfully rescued the trp4 mutant (Figure 4d,e), indicating that OsPAT1 possessed functional AnPRT activity in yeast, though its function might depend on localization signals.

2.5. Expression Pattern and Protein Subcellular Localization of OsPAT1

The expression of OsPAT1 was analyzed in different tissues at seedling and adult stages. High expression levels of OsPAT1 were found in young leaves and flag leaves. OsPAT1 was also expressed in sheaths, panicles, and culms, while its expression in roots was very low (Figure 5a). Then, the promoter of OsPAT1 was linked with the β-glucuronidase (GUS) reporter gene and transformed into MDJ8. The GUS reporter was detected in many tissues, including radicles, leaves, pulvinus, and sheaths at the seeding stage, and flag leaves, sheathes, culms, and panicles at the booting stage (Figure 5b). These results indicated that OsPAT1 could express in most rice tissues.
To determine the subcellular localization of OsPAT1, GFP was fused to both OsPAT1.1 and OsPAT1.2 variants. Surprisingly, OsPAT1.2-GFP was localized in chloroplasts, whereas OsPAT1.1-GFP was localized in mitochondria (Figure 5c). To further validate these findings, fragments of OsPAT1.1 and OsPAT1.2 were analyzed (Figure S9a). The N-terminus of OsPAT1 was localized in chloroplasts, while the remaining regions of both OsPAT1.1 and OsPAT1.2 were localized in mitochondria (Figure S9b). These results suggested that the N-terminus of OsPAT1 alone was insufficient to function as a chloroplast-targeting signal peptide and requires the last six amino acids of OsPAT1.2 for proper localization.

2.6. The Expression of Many Tryptophan Synthesis Pathway Genes Was Induced in the lmm9 Mutant

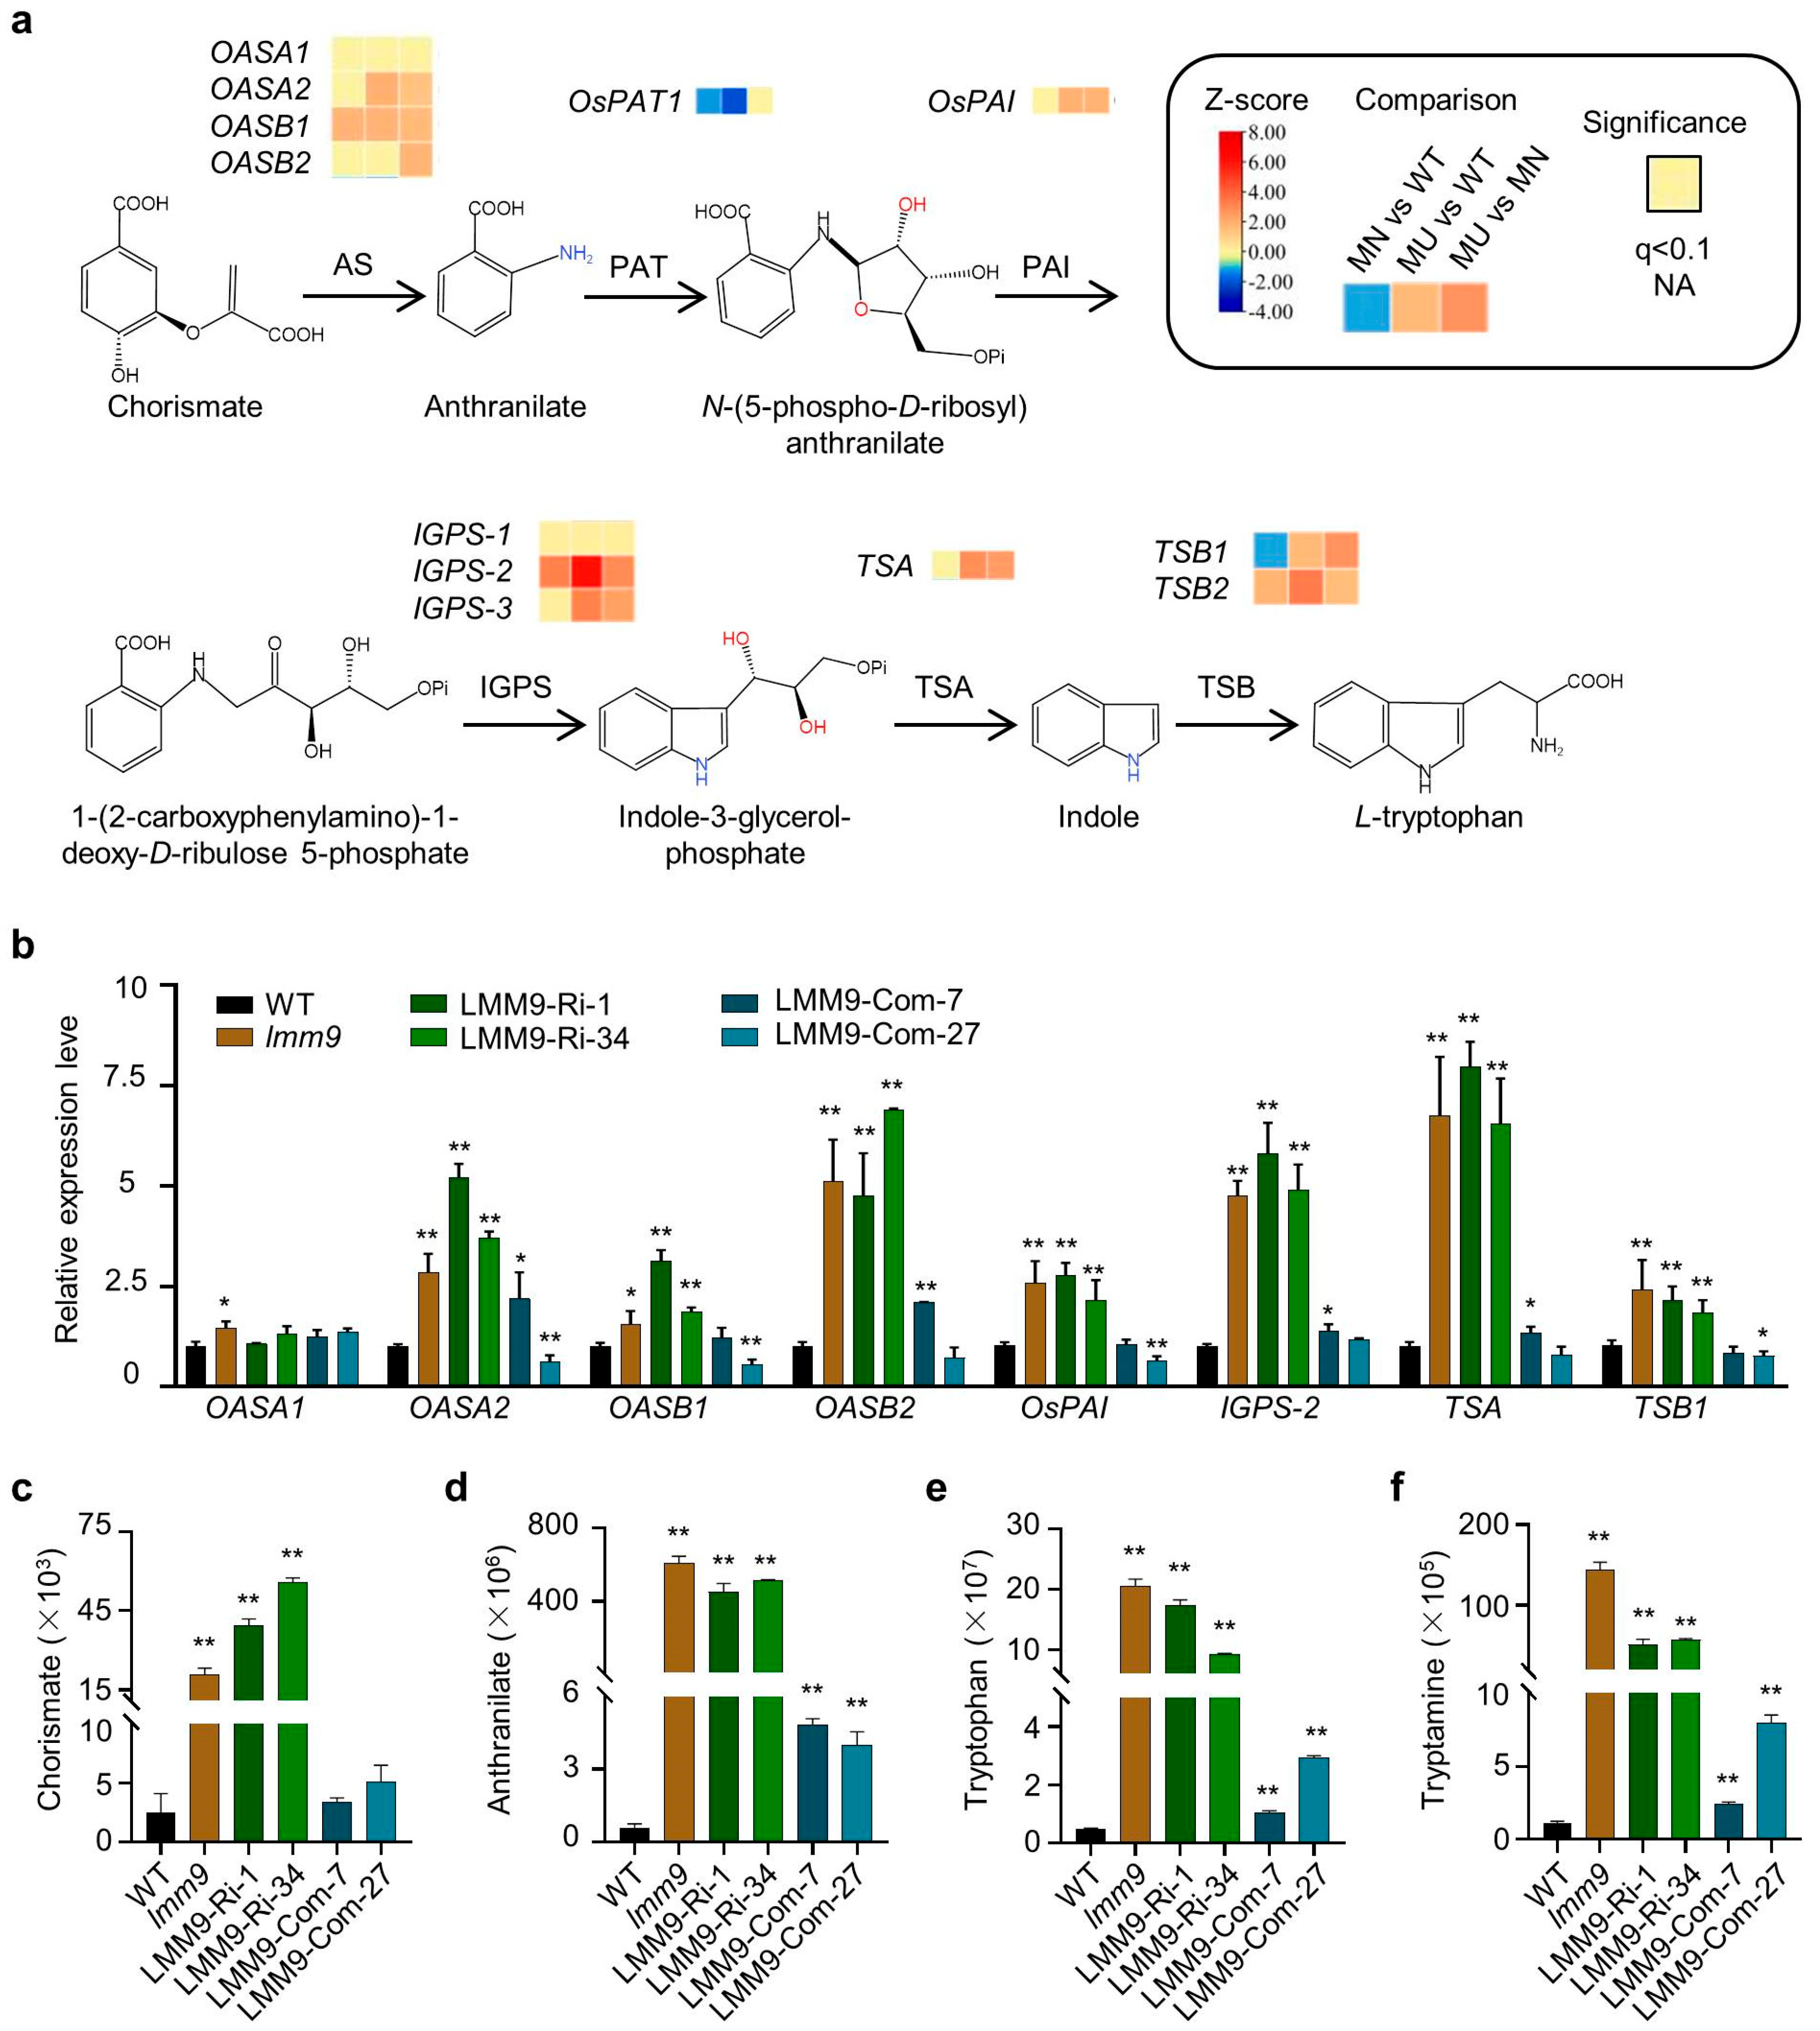
To identify which genes were influenced in the lmm9 mutant, total RNA from rice leaves was sequenced. Compared with the WT, the expression of genes participating in metabolic pathways and the biosynthesis of secondary metabolites were significantly altered in the lmm9 mutant (Figure S10). Notably, the expression of many tryptophan synthesis pathway genes changed similarly in lmm9 (Figure 6a). Several genes involved in downstream reactions of OsPAT1, including OsPAI, IGPS-2, TSA, and TSB1, were all induced in lmm9 (Figure 6a). This could be easily understood since PRA production was possibly blocked in lmm9, and induction of these genes would compensate for it. However, the genes encoding the α and β subunits of AS, except OASA1, were also increased in lmm9 (Figure 6a). These results collectively suggested that a significant metabolic disorder probably occurred in lmm9, similar to the phenomenon observed in the rice els1 and ell1 mutant [26,27]. The expression results were further validated using LMM9-Com and LMM9-Ri plants. Significant upregulation of OASA2, OASB1, OASB2, OsPAI, IGPS-2, TSA, and TSB1 was observed in LMM9-Ri plants, similar to the lmm9 mutants. In contrast, the expression of the same genes in LMM9-Com plants remained unaffected (Figure 6b).
Moreover, the expression of genes that encoded enzymes at downstream of the tryptophan synthesis pathway was also affected. For example, the gene expression of TDC1, TDC3, T5H (ELL1/SL), and OsCOMT15, which are involved in the serotonin and melatonin synthesis, was all induced in lmm9 and LMM9-Ri plants, compared with the WT and LMM9-Com plants (Figure S11).
To further confirm whether the induction of these genes would affect the synthesis and degradation of tryptophan, the relative contents of tryptophan and several important metabolites in lmm9 and related transgenic plants were measured. Chorismate, which participates upstream of OsPAT1, was accumulated in lmm9 and LMM9-Ri plants compared to those in WT and LMM9-Com plants (Figure 6c). Anthranilate, the substrate of OsPAT1, was also accumulated in lmm9 and LMM9-Ri plants, compared to WT (Figure 6d). Similarly, both tryptophan and tryptamine levels were significantly increased in lmm9 and LMM9-Ri plants (Figure 6e,f). Meanwhile, the contents of anthranilate, tryptophan, and tryptamine were slightly upregulated in LMM9-Com plants, possibly due to the higher OsPAT1 expression mentioned above (Figure 6d,f). All these results indicated that both tryptophan anabolism and catabolism were increased in lmm9.

3. Discussion

LMMs are valuable materials for studying plant cell death and defense responses. The genes responsible for LMMs vary widely. Here, we report the characterization and identification of a new rice LMM, lmm9, which exhibited significant lesion mimic phenotypes in multiple tissues and a high lethality rate. It was found that downregulation of OsPAT1, the sole homolog of Arabidopsis PAT1 in the rice genome, caused the lmm9 phenotype. And similar lesion mimics were observed in OsPAT1 knockdown and knockout rice plants. However, the Arabidopsis trp1-1 mutant, which carries the defective PAT1 gene, is a well-known tryptophan auxotroph. Although the development and growth of trp1-1 plants were impaired, no lesion mimic phenotype was observed. This phenomenon reflects the functional differences between the two homologs in rice and Arabidopsis.
The N-terminal sequence of OsPAT1 was different from that of PAT1, and the subcellular location of its main product, OsPAT1.1, also differed from that of PAT1. By searching the database, it was found that the N-termini of AnPRT homologs in monocots were highly conserved, and no homologs contained the plastid transit peptide of PAT1 (Figure S9). These results suggested that AnPRT homologs in monocots and dicots might have diverged during evolution, raising a possibility that PRA could be generated in different organelles depending on the species. Actually, tryptophan can also be synthesized in microbes, which lack chloroplasts. Therefore, more studies are needed to fully elucidate whether tryptophan can be synthesized in other organelles in different plant species.
For a long time, the link between tryptophan and LMM received little attention. Although the sl mutant was the first LMM in rice, the sl gene was not among the first cloned rice LMM genes. The sl and its allelic mutant, ell1, exhibited lesions similar to those in lmm9, and the formation could be influenced by light [23,25]. Both mutants were caused by mutations in the tryptamine 5-hydroxylase, which catalyzes tryptamine conversion to serotonin [24,25]. It was found that both tryptophan synthesis and catabolism genes were induced and the tryptophan metabolism was disturbed in ell1 and sl mutants [23,26]. Unlike the ELL1/SL gene functions in tryptophan catabolism, the ELS1/ASA2 gene encodes the α subunit of the AS enzyme and functions in tryptophan synthesis. In els1, the mutation in ELS1/ASA2 triggered the induction of its homolog, ASA1, and other tryptophan synthesis pathway genes as well [27]. The levels of tryptophan and many related metabolites were also increased, leading to metabolic dysregulation in els1. Suppressing ASA1 expression restored the lesion mimic phenotype in els1 [27]. In all the three mutants, a common character is the constitutive activation of tryptophan metabolism. In lmm9, the expression of genes involved in tryptophan synthesis and degradation was also induced, resulting in significant accumulation of tryptophan and other related metabolites. As a consequence, the lesion mimic phenotype in lmm9 probably resulted from tryptophan metabolic disorder.
Tryptophan synthesis is a multi-step process. The enzymes involved in this process are encoded by many different genes. However, the regulation of their expression has been less studied. In els1, the increased expression of ASA1 could be caused by the compensation response to the mutation of ELS1/ASA2, while the mechanism of the induction of other tryptophan synthesis pathway genes remains unclear [27]. In both lmm9 and ell1/sl, the expression of several tryptophan synthesis pathway genes was also simultaneously induced. This phenomenon suggested that there might be a coordinated regulatory mechanism in rice to maintain synchronized expression of these genes at the transcriptional level, which differed from feedback regulation at the protein level [39]. This mechanism might enable plants to respond effectively to environmental changes or stresses [23,25]. However, such kind of transcriptional activation of tryptophan synthesis pathway genes had not been reported in related Arabidopsis mutants. As a result, further studies are needed to fully clarify the regulatory mechanism and the differences between rice and Arabidopsis. In addition, the tryptophan contents are significantly increased and the tryptophan biosynthesis pathway genes are significantly upregulated in lmm9 compared with WT, however it lacks direct evidences linking tryptophan to the lesion mimic formation. Therefore, the potential relationship between tryptophan and the lesion mimic formation needs to be elucidated through further analysis, such as comparing the lesion mimic phenotype after applying exogenous tryptophan and/or tryptophan inhibitor in the WT and mutants.

4. Materials and Methods

4.1. Plant Materials and Growth Conditions

The wildtype rice (O. sativa ssp. japonica/geng) used in this study was japonica cultivar Mudanjiang 8 (MDJ8). All plants were cultivated under standard field conditions during the typical growing season at Wuhan experimental station, China (geographical coordinates: 114.2° E Longitude, 30.5° N latitude; elevation 15 M above sea level; average daily temperature range 28–30 °C).

4.2. Trypan Blue Staining

Equivalent leaf segments of WT and lmm9 mutant were selected at 30 days post-germination. The samples were subjected to vacuum infiltration in a trypan blue staining solution to ensure complete tissue penetration. Following a 2 min boiling, samples were incubated at 37 °C for overnight. Post-incubation, stained tissues were decolorated in chloral hydrate solution until achieving optimal optical clarity. The characteristic of stained tissues was observed with stereo microscopy.

4.3. Physiological Measurements

Malondialdehyde (MDA) content in WT and lmm9 mutant leaves was quantified using the thiobarbituric acid (TBA) colorimetric method [40]. Absorbance values of the reaction mixtures were measured at 532 nm, 600 nm, and 450 nm using spectrophotometer, with subsequent calculation of MDA concentration based on MDA content formula.
Superoxide dismutase (SOD) activity of WT and lmm9 mutant leaves was determined according to the manufacturer’s protocol for the Superoxide Dismutase Activity Assay Kit (Solarbio). Absorbance at 560 nm were measured via spectrophotometer to calculate enzymatic activity using the SOD activity formula.
Peroxidase (POD) activity was measured through guaiacol-based colorimetric analysis. SOD activity was calculated by measuring absorbance at 470 nm at 30 s intervals absorbance values recording.
Catalase (CAT) activity was determined by monitoring the absorbance decline at 240 nm at 30 s intervals absorbance values recording [41], calculation of CAT activity based on formula.

4.4. Mapping of the lmm9 Gene

Due to the failure of crossing lmm9 mutant with the indica cultivar, Minghui 63 (MH63), the normal plants segregate alongside lmm9 mutants from the same line were chosen as the female parents. According to Mendelian inheritance, these phenotypically normal plants had a two-thirds probability of carrying the lmm9 gene. These plants were hybridized with MH63, and both hybrids and self-pollinated seeds were harvested. Subsequently, the self-pollinated progeny were cultivated and checked for lesion mimic phenotypes to verify whether their parent plants harbored lmm9 gene. Lesions were found in one family, indicating its parent plant was heterozygous. Then, the hybrids from the same plant was cultivated and self-crossed separately to generate segregating populations, since only half of them carried the lmm9 gene. Two populations were obtained, and both were planted in the normal growing season, with one carrying the lmm9 gene for mapping. In this population of about two thousand plants, those that developed lesions were used to identify the lmm9 gene. 105 SSR markers were used in the preliminary mapping, and the lmm9 gene was localized to a 3 Mb region between RM3202 and RM3117 on chromosome 3. After adding new SSR markers and plant samples, lmm9 was fine-mapped to a 269 kb region between RM3372 and RM14341.
Then, genomic DNA was extracted from WT and lmm9 mutant plants at the seedling stage, and whole-genome sequencing library of them were prepared following established protocols [42] and sequenced using Illumina X10 platform (San Diego, CA, USA). The sequencing reads were mapped to the region between RM3372 and RM14341 to identify the differences between WT and lmm9 mutant.

4.5. Vector Construction and Transformation

In the complementation test, an 8.6 kb fragment containing the entire 4.1 kb genomic sequence of Os03g03450, along with 2.1 kb upstream and 2.5 kb downstream region, was amplified using MDJ8 genomic DNA as the template. This fragment was ligated into the pCAMBIA2300 vector via homologous recombination.
For RNAi vector construction, a 310 bp fragment amplified from MDJ8 cDNA was inserted into the pDS1301 vector.
For knockout vector construction, CRISPR-P 2.0 (http://crispr.hzau.edu.cn/CRISPR2, accessed on 5 July 2021) was used to design two targets located in the second exon (5′-gctgctggaggaggagaacgagg-3′) and the third exon (5′-gggttggcgaaggcgatgatagg-3′) [43]. The adapter primers were designed based on these targets, and the target gRNA expression cassettes were inserted into the Cas9 vector using the Liu Yaoguang system to construct the gene editing vector [44].
For GUS vector construction, a 2.3 kb promoter region of Os03g03450 was amplified using MDJ8 genomic DNA as the template. This fragment was ligated into the DX2181 vector.
The vectors were sent to Wuhan Tianwen Company (Wuhan, China) for rice transformation. The lmm9 mutant was used as the recipient of the complementation vector, and MDJ8 was used for the other vectors. The transgenic plants were analyzed using specific primers (Table S1).

4.6. Protein Sequence and Phylogenetic Analysis

The OsPAT1 protein sequence was employed as the query in the NCBI blastp program to identify homologous proteins (Table S2). The retrieved protein sequences were compared using ClustalX version 2, and a phylogenetic tree was constructed with MEGA 11 software through the Neighbor-Joining method. To analyze conserved amino acid residues, homologs from Oryza sativa, Triticum aestivum, Zea mays, Arabidopsis thaliana, Brassica napus, Physcomitrium patens, Fragilariopsis cylindrus, and Chloroflexi bacterium were compared using GENEDOC 2.7 software.

4.7. Subcellular Location of OsPAT1

The alternatively spliced transcripts of OsPAT1 were amplified using specific primers (Table S1). The resulting fragments were ligated into the pAN580-GFP vector via homologous recombination. These constructs, along with a mitochondrial marker vector and a control vector (35S-GFP), were co-transfected into rice protoplasts. Fluorescence signals were captured using a Zeiss LSM980 (Zeiss, Baden-Württemberg, Germany) laser scanning confocal microscope.

4.8. Protein Structure Prediction

The three-dimensional structures of PAT1 and OsPAT1 were modeled using AlphaFold 3 (https://www.alphafoldserver.com, accessed on 20 June 2024) [45].

4.9. Molecular Docking

The interactions between OsPAT1 and PRPP was predicted using PyMOL 3 and AutoDockTools-1.5.7 software [46].

4.10. RNA-Seq Analysis

Leaf samples were collected from three groups: WT, lmm9 mutants with lesion mimics (MU), and lmm9 mutants without lesion mimics (MN), each with three biological replicates. Total RNA was extracted and submitted to the Shenzhen Institute of Agricultural Genomics, Chinese Academy of Agricultural Sciences for high-throughput sequencing. The resulting sequencing data were analyzed to identify differentially expressed genes (DEGs) defined by thresholds of |Log2(fold change)| ≥ 1 and false discovery rate (FDR) ≤ 0.05), each with in MN vs. WT, MU vs. WT, and MN vs. MU groups were screened, and their distribution was visualized in a Venn diagram based on transcriptomic data. Kyoto Encyclopedia of Genes and Genomes (KEGG) pathway enrichment analysis (FDR < 0.05) was subsequently performed on the identified DEGs.

4.11. qRT-PCR Analysis

The primers used for qRT-PCR are listed in Table S1. For each target gene, reactions were performed with three technical replicates, and independent experiments were repeated at least twice. Representative data from one experimental repetition are shown. Relative gene expression levels normalized to the control are presented as column graphs.

4.12. Metabolites Analysis

The WT, lmm9, LMM9-Com, and LMM9-RNAi plants were all grown under standard condition. Their flag leaves were collected at booting stage for metabolites analysis. Three biological replicates were collected for each sample. The samples were extracted and analyzed following the methods previously reported [47].

4.13. Accession Numbers

The sequence data of OsPAT1 can be found in the GenBank through accession numbers PQ660886.1.

Supplementary Materials

The following supporting information can be downloaded at: https://www.mdpi.com/article/10.3390/ijms26199428/s1.

Author Contributions

Resources, H.Z.; Conceptualization, H.Z. and W.Y.; Investigation, J.R., Q.Z., Y.X. and H.Z.; Formal analysis, B.Z., Y.L. and H.L.; analyzed the data. Writing—original draft, J.R. and H.Z.; Writing—review & editing, H.Z. and W.Y.; Funding acquisition, B.Z., Y.L., H.L., H.Z. and W.Y. All authors have read and agreed to the published version of the manuscript.

Funding

This research was supported by grants from the National Natural Science Foundation of China (31872811, 32101747, 32472141, and 32572847) and Natural Science Foundation of Hubei Province (2023AFB650 and JCZRLH202500540).

Institutional Review Board Statement

Not applicable.

Informed Consent Statement

Not applicable.

Data Availability Statement

The original contributions presented in this study are included in the article/Supplementary Material and openly available in Genebank through accession numbers PQ660886.1. Further inquiries can be directed to the corresponding author(s).

Acknowledgments

We thank Xilan Yu (Hubei University) and Shanshan Li (Hubei University) for providing the yeast trp4 mutant.

Conflicts of Interest

The authors declare that they have no conflict of interests.

Abbreviations

The following abbreviations are used in this manuscript:
LMMsLesion mimic mutants
HRHypersensitive response
PCDProgrammed cell death
ROSreactive oxygen species
URODUroporphyrinogen decarboxylase
PEPPPhosphoribosyl group from phosphoribosyl-α1-pyrophosphate
PpiPyrophosphate
PRAN-(5′-phosphoribosyl)anthranilate
AnPRTAnthranilate phosphoribosyltransferase
PRTPhosphoribosylanthranilate phosphoribosyltransferase
PAT1Phosphoribosylanthranilate transferase 1
WTWide type
CATCatalase
PODPeroxidase
SODSuperoxide dismutase

References

  1. Lam, E.; Kato, N.; Lawton, M. Programmed cell death, mitochondria and the plant hypersensitive response. Nature 2001, 411, 848–853. [Google Scholar] [CrossRef] [PubMed]
  2. Durrant, W.E.; Dong, X. Systemic acquired resistance. Annu. Rev. Phytopathol. 2004, 42, 185–209. [Google Scholar] [CrossRef]
  3. Lorrain, S.; Vailleau, F.; Balague, C.; Roby, D. Lesion mimic mutants: Keys for deciphering cell death and defense pathways in plants? Trends Plant Sci. 2003, 8, 263–271. [Google Scholar] [CrossRef]
  4. Kang, S.G.; Lee, K.E.; Singh, M.; Kumar, P.; Matin, M.N. Rice lesion mimic mutants (LMM): The current understanding of genetic mutations in the failure of ROS scavenging during lesion formation. Plants 2021, 10, 1598. [Google Scholar] [CrossRef]
  5. Li, C.; Liu, H.; Wang, J.; Pan, Q.; Wang, Y.; Wu, K.; Jia, P.; Mu, Y.; Tang, H.; Xu, Q.; et al. Characterization and fine mapping of a lesion mimic mutant (Lm5) with enhanced stripe rust and powdery mildew resistance in bread wheat (Triticum aestivum L.). Theor. Appl. Genet. 2022, 135, 421–438. [Google Scholar] [CrossRef]
  6. Yu, M.; Fan, Y.; Li, X.; Chen, X.; Yu, S.; Wei, S.; Li, S.; Chang, W.; Qu, C.; Li, J.; et al. LESION MIMIC MUTANT 1 confers basal resistance to Sclerotinia sclerotiorum in rapeseed via a salicylic acid-dependent pathway. J. Exp. Bot. 2023, 74, 5620–5634. [Google Scholar] [CrossRef]
  7. Rao, Y.; Jiao, R.; Wang, S.; Wu, X.; Ye, H.; Pan, C.; Li, S.; Xin, D.; Zhao, W.; Dai, G.; et al. SPL36 Encodes a Receptor-like Protein Kinase that Regulates Programmed Cell Death and Defense Responses in Rice. Rice 2021, 14, 34. [Google Scholar] [CrossRef] [PubMed]
  8. Sha, G.; Sun, P.; Kong, X.; Han, X.; Sun, Q.; Fouillen, L.; Zhao, J.; Li, Y.; Yang, L.; Wang, Y.; et al. Genome editing of a rice CDP-DAG synthase confers multipathogen resistance. Nature 2023, 618, 1017–1023. [Google Scholar] [CrossRef] [PubMed]
  9. Zhao, M.; Guo, Y.; Sun, H.; Dai, J.; Peng, X.; Wu, X.; Yun, H.; Zhang, L.; Qian, Y.; Li, X.; et al. Lesion mimic mutant 8 balances disease resistance and growth in rice. Front. Plant Sci. 2023, 14, 1189926. [Google Scholar] [CrossRef]
  10. Zhang, A.; Jiang, H.; Chu, H.; Cao, L.; Chen, J. Rice lesion mimic gene cloning and association analysis for disease resistance. Curr. Issues Mol. Biol. 2022, 44, 2350–2361. [Google Scholar] [CrossRef]
  11. Hu, G.; Yalpani, N.; Briggs, S.P.; Johal, G.S. A porphyrin pathway impairment is responsible for the phenotype of a dominant disease lesion mimic mutant of maize. Plant Cell 1998, 10, 1095–1105. [Google Scholar] [CrossRef] [PubMed]
  12. Ma, J.; Yang, S.; Wang, D.; Tang, K.; Feng, X.X.; Feng, X.Z. Genetic mapping of a light-dependent lesion mimic mutant reveals the function of coproporphyrinogen III oxidase homolog in soybean. Front. Plant Sci. 2020, 11, 557, Corrigendum in Front. Plant Sci. 2020, 11, 893. [Google Scholar]
  13. Zhao, Y.; Xu, W.; Wang, L.; Han, S.; Zhang, Y.; Liu, Q.; Liu, B.; Zhao, X. A maize necrotic leaf mutant caused by defect of coproporphyrinogen III oxidase in the porphyrin pathway. Genes 2022, 13, 272. [Google Scholar] [CrossRef] [PubMed]
  14. Zeng, L.R.; Qu, S.; Bordeos, A.; Yang, C.; Baraoidan, M.; Yan, H.; Xie, Q.; Nahm, B.H.; Leung, H.; Wang, G.L. Spotted leaf11, a negative regulator of plant cell death and defense, encodes a U-box/armadillo repeat protein endowed with E3 ubiquitin ligase activity. Plant Cell 2004, 16, 2795–2808. [Google Scholar] [CrossRef]
  15. Liu, Q.; Ning, Y.; Zhang, Y.; Yu, N.; Zhao, C.; Zhan, X.; Wu, W.; Chen, D.; Wei, X.; Wang, G.L.; et al. OsCUL3a negatively regulates cell death and immunity by degrading OsNPR1 in rice. Plant Cell 2017, 29, 345–359. [Google Scholar] [CrossRef]
  16. You, Q.; Zhai, K.; Yang, D.; Yang, W.; Wu, J.; Liu, J.; Pan, W.; Wang, J.; Zhu, X.; Jian, Y.; et al. An E3 ubiquitin ligase-BAG protein module controls plant innate immunity and broad-spectrum disease resistance. Cell Host Microbe 2016, 20, 758–769. [Google Scholar] [CrossRef]
  17. Tang, J.; Zhu, X.; Wang, Y.; Liu, L.; Xu, B.; Li, F.; Fang, J.; Chu, C. Semi-dominant mutations in the CC-NB-LRR-type R gene, NLS1, lead to constitutive activation of defense responses in rice. Plant J. 2011, 66, 996–1007. [Google Scholar] [CrossRef]
  18. Vega-Sanchez, M.E.; Verhertbruggen, Y.; Christensen, U.; Chen, X.; Sharma, V.; Varanasi, P.; Jobling, S.A.; Talbot, M.; White, R.G.; Joo, M.; et al. Loss of Cellulose synthase-like F6 function affects mixed-linkage glucan deposition, cell wall mechanical properties, and defense responses in vegetative tissues of rice. Plant Physiol. 2012, 159, 56–69. [Google Scholar] [CrossRef] [PubMed]
  19. Fan, J.; Bai, P.; Ning, Y.; Wang, J.; Shi, X.; Xiong, Y.; Zhang, K.; He, F.; Zhang, C.; Wang, R.; et al. The monocot-specific receptor-like kinase SDS2 controls cell death and immunity in rice. Cell Host Microbe 2018, 23, 498–510. [Google Scholar] [CrossRef]
  20. Zhang, H.; Cao, Y.; Zhao, J.; Li, X.; Xiao, J.; Wang, S. A pair of orthologs of a leucine-rich repeat receptor kinase-like disease resistance gene family regulates rice response to raised temperature. BMC Plant Biol. 2011, 11, 160. [Google Scholar] [CrossRef]
  21. Li, T.; Chen, X.; Zhong, X.; Zhao, Y.; Liu, X.; Zhou, S.; Cheng, S.; Zhou, D.X. Jumonji C domain protein JMJ705-mediated removal of histone H3 lysine 27 trimethylation is involved in defense-related gene activation in rice. Plant Cell 2013, 25, 4725–4736. [Google Scholar] [CrossRef]
  22. Shen, X.; Liu, H.; Yuan, B.; Li, X.; Xu, C.; Wang, S. OsEDR1 negatively regulates rice bacterial resistance via activation of ethylene biosynthesis. Plant Cell Environ. 2011, 34, 179–191. [Google Scholar] [CrossRef]
  23. Ueno, M.; Shibata, H.; Kihara, J.; Honda, Y.; Arase, S. Increased tryptophan decarboxylase and monoamine oxidase activities induce Sekiguchi lesion formation in rice infected with Magnaporthe grisea. Plant J. 2003, 36, 215–228. [Google Scholar] [CrossRef]
  24. Fujiwara, T.; Maisonneuve, S.; Isshiki, M.; Mizutani, M.; Chen, L.; Wong, H.L.; Kawasaki, T.; Shimamoto, K. Sekiguchi lesion gene encodes a cytochrome P450 monooxygenase that catalyzes conversion of tryptamine to serotonin in rice. J. Biol. Chem. 2010, 285, 11308–11313. [Google Scholar] [CrossRef]
  25. Cui, Y.; Peng, Y.; Zhang, Q.; Xia, S.; Ruan, B.; Xu, Q.; Yu, X.; Zhou, T.; Liu, H.; Zeng, D.; et al. Disruption of EARLY LESION LEAF 1, encoding a cytochrome P450 monooxygenase, induces ROS accumulation and cell death in rice. Plant J. 2021, 105, 942–956. [Google Scholar] [CrossRef]
  26. Xia, S.; Ruan, B.; Rao, Y.; Cui, Y.; Zhang, Q.; Zeng, D.; Qian, Q.; Ren, D. The ell1 mutation disrupts tryptophan metabolism and induces cell death. Plant Signal. Behav. 2021, 16, 1905336. [Google Scholar] [CrossRef]
  27. Li, W.; Cheng, W.; Jiang, H.; Fang, C.; Peng, L.; Tao, L.; Zhan, Y.; Huang, X.; Ma, B.; Chen, X.; et al. Mutation of rice EARLY LEAF LESION AND SENESCENCE 1 (ELS1), which encodes an anthranilate synthase alpha-subunit, induces ROS accumulation and cell death through activating the tryptophan synthesis pathway in rice. Plant J. 2024, 120, 2723–2737. [Google Scholar] [CrossRef] [PubMed]
  28. Bohlmann, J.; Lins, T.; Martin, W.; Eilert, U. Anthranilate synthase from Ruta graveolens. Duplicated AS alpha genes encode tryptophan-sensitive and tryptophan-insensitive isoenzymes specific to amino acid and alkaloid biosynthesis. Plant Physiol. 1996, 111, 507–514. [Google Scholar] [CrossRef] [PubMed]
  29. Tozawa, Y.; Hasegawa, H.; Terakawa, T.; Wakasa, K. Characterization of rice anthranilate synthase alpha-subunit genes OASA1 and OASA2. Tryptophan accumulation in transgenic rice expressing a feedback-insensitive mutant of OASA1. Plant Physiol. 2001, 126, 1493–1506. [Google Scholar] [PubMed]
  30. Maeda, H.; Dudareva, N. The shikimate pathway and aromatic amino Acid biosynthesis in plants. Annu. Rev. Plant Biol. 2012, 63, 73–105. [Google Scholar] [CrossRef] [PubMed]
  31. Crawford, I.P. Synthesis of tryptophan from chorismate: Comparative aspects. Methods Enzymol. 1987, 142, 293–300. [Google Scholar]
  32. Furter, R.; Paravicini, G.; Aebi, M.; Braus, G.; Prantl, F.; Niederberger, P.; Hutter, R. The TRP4 gene of Saccharomyces cerevisiae: Isolation and structural analysis. Nucleic Acids Res. 1986, 14, 6357–6373. [Google Scholar] [CrossRef]
  33. Rose, A.B.; Casselman, A.L.; Last, R.L. A Phosphoribosylanthranilate Transferase Gene Is Defective in Blue Fluorescent Arabidopsis thaliana Tryptophan Mutants. Plant Physiol. 1992, 100, 582–592. [Google Scholar] [CrossRef]
  34. Last, R.L.; Fink, G.R. Tryptophan-requiring mutants of the plant Arabidopsis thaliana. Science 1988, 240, 305–310. [Google Scholar] [CrossRef]
  35. Cohen, J.D.; Strader, L.C. An auxin research odyssey: 1989–2023. Plant Cell 2024, 36, 1410–1428. [Google Scholar] [CrossRef] [PubMed]
  36. Mishra, V.; Sarkar, A.K. Serotonin: A frontline player in plant growth and stress responses. Physiol. Plant 2023, 175, e13968. [Google Scholar] [CrossRef]
  37. Sun, C.; Liu, L.; Wang, L.; Li, B.; Jin, C.; Lin, X. Melatonin: A master regulator of plant development and stress responses. J. Integr. Plant Biol. 2021, 63, 126–145. [Google Scholar] [CrossRef] [PubMed]
  38. Wu, X.; Zhang, M.; Kuang, Z.; Yue, J.; Xue, L.; Zhu, M.; Zhu, Z.; Khan, M.H.; Niu, L. Crystal structures of anthranilate phosphoribosyltransferase from Saccharomyces cerevisiae. Acta Crystallogr. F Struct. Biol. Commun. 2021, 77, 61–69. [Google Scholar] [CrossRef] [PubMed]
  39. Li, J.; Last, R.L. The Arabidopsis thaliana trp5 mutant has a feedback-resistant anthranilate synthase and elevated soluble tryptophan. Plant Physiol. 1996, 110, 51–59. [Google Scholar] [CrossRef]
  40. Janero, D.R. Malondialdehyde and thiobarbituric acid-reactivity as diagnostic indices of lipid peroxidation and peroxidative tissue injury. Free Radic. Biol. Med. 1990, 9, 515–540. [Google Scholar] [CrossRef]
  41. Regni, L.; Del Pino, A.M.; Mousavi, S.; Palmerini, C.A.; Baldoni, L.; Mariotti, R.; Mairech, H.; Gardi, T.; D’Amato, R.; Proietti, P. Behavior of four olive cultivars during salt stress. Front. Plant Sci. 2019, 10, 867. [Google Scholar] [CrossRef]
  42. Zhao, S.; Zhang, C.; Mu, J.Q.; Zhang, H.; Yao, W.; Ding, X.; Ding, J.; Chang, Y. All-in-one sequencing: An improved library preparation method for cost-effective and high-throughput next-generation sequencing. Plant Methods 2020, 16, 74. [Google Scholar] [CrossRef]
  43. Liu, H.; Ding, Y.; Zhou, Y.; Jin, W.; Xie, K.; Chen, L.L. CRISPR-P 2.0: An improved CRISPR-Cas9 tool for genome editing in plants. Mol. Plant 2017, 10, 530–532. [Google Scholar] [CrossRef]
  44. Ma, X.; Zhang, Q.; Zhu, Q.; Liu, W.; Chen, Y.; Qiu, R.; Wang, B.; Yang, Z.; Li, H.; Lin, Y.; et al. A robust CRISPR/Cas9 system for convenient, high-efficiency multiplex genome editing in monocot and dicot plants. Mol. Plant 2015, 8, 1274–1284. [Google Scholar] [CrossRef] [PubMed]
  45. Abramson, J.; Adler, J.; Dunger, J.; Evans, R.; Green, T.; Pritzel, A.; Ronneberger, O.; Willmore, L.; Ballard, A.J.; Bambrick, J.; et al. Accurate structure prediction of biomolecular interactions with AlphaFold 3. Nature 2024, 630, 493–500. [Google Scholar] [CrossRef] [PubMed]
  46. Seeliger, D.; de Groot, B.L. Ligand docking and binding site analysis with PyMOL and Autodock/Vina. J. Comput. Aided Mol. Des. 2010, 24, 417–422. [Google Scholar] [CrossRef] [PubMed]
  47. Wang, J.; Li, H.; Tang, W.; Liang, K.; Zhao, C.; Yu, F.; Qiu, F. A candidate association study of transcription factors in maize revealed the ZmPLATZ15-ZmEREB200 module as a key regulator of waterlogging tolerance at the seedling stage. Plant Physiol. Biochem. 2025, 222, 109664. [Google Scholar] [CrossRef]
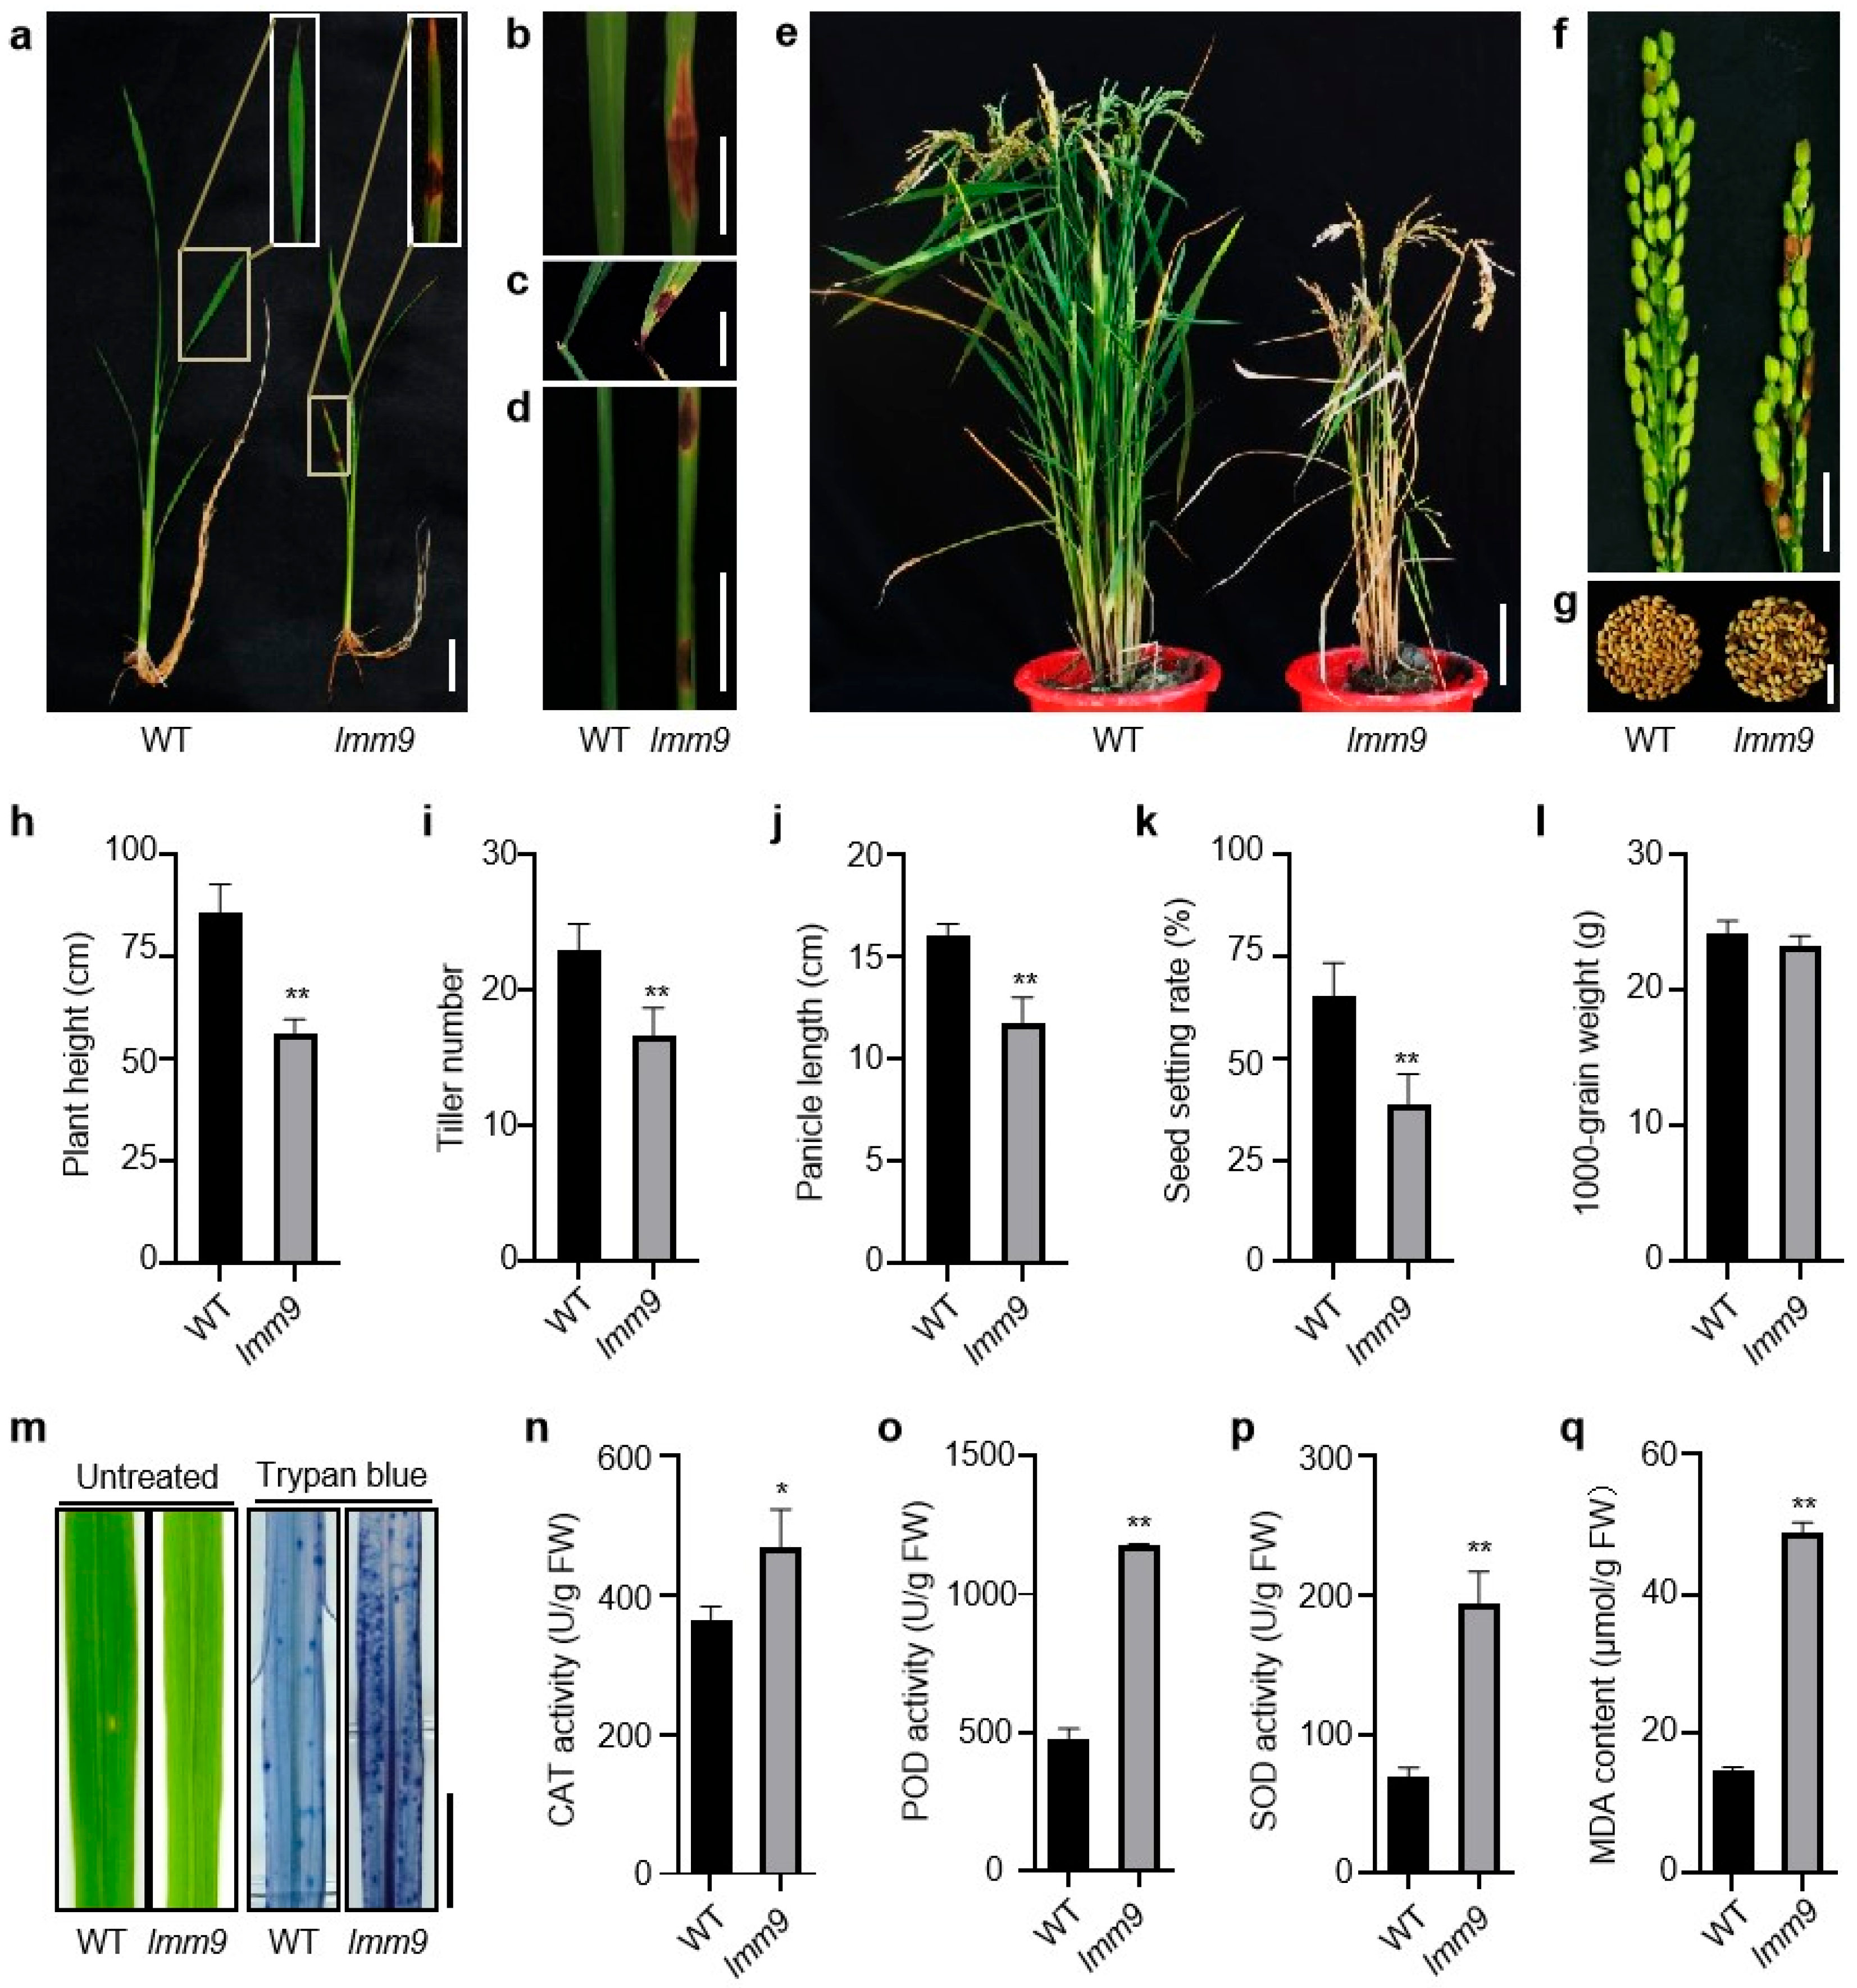
Figure 1. Phenotype comparison of WT and the lmm9 mutant. (a) Phenotypes of WT and lmm9 at seedling stage (about 20 d). Bar = 2 cm. (bd) Reddish-brown spots appeared on leaf blades, collars, and leaf sheaths of lmm9 at tillering stage. All bars = 2 cm. (e) Phenotypes of WT and lmm9 at mature stage. Bar = 10 cm. (f,g) Lesions mimics appeared on the panicles and seeds in lmm9 at mature stage. All bars = 2 cm. (hl) Comparison of main agronomic traits of WT and lmm9. (m) Trypan blue staining of leaves of WT and lmm9 before lesions were formed. Bar = 1 cm. (np) Enzyme activities of WT and lmm9 at tillering stage. CAT, catalase; POD, peroxidase; SOD, superoxide dismutase. (q) Malondialdehyde (MDA) contents in the leaves of WT and lmm9 at tillering stage. Data were presented as means ± SD of three replicates. The significance compared with WT was determined by Student’s t-test at p < 0.05 (*) and p < 0.01 (**).
Ijms 26 09428 g001
Figure 2. Mapping and isolation of the lmm9 gene. (a) The lmm9 gene was genetically mapped to the region between RM3202 and RM3117 on chromosome 3. (b) The lmm9 gene was physically mapped to a ~269 kb region on chromosome 3. (c) Representative candidate ORFs in the corresponding mapping region of Nipponbare. (d) Schematic representation of the chimeric fragment insertion in Os03g03450 gene and its two transcripts (Os03g03450.1 and Os03g03450.2). The white boxes indicate putative UTRs. The black boxes indicate exons. The lines between the boxes indicate introns. The vertical arrows indicate the start codon and stop codon. The arrowheads indicate the positions and orientations of the PCR primers used for LMM9 genotype analysis. (e) Cosegregation analysis of the offsprings of an lmm9 heterozygous plant. All homozygous plants exhibit the lesion mimic phenotype, whereas heterozygous plants and WT do not. Y, yes; N, no. (f) Relative expression levels of total Os03g03450, Os03g03450.1, and Os03g03450.2 in the leaves of WT and lmm9 at adult stage. Data were presented as mean ± SD. The significance compared with WT was determined by Student’s t-test at p < 0.05 (*) and p < 0.01 (**).
Ijms 26 09428 g002
Figure 3. Os03g03450 was responsible for lmm9 mutant. (a) Schematic representation of the insertion in Os03g03450 gene and primers used in the complement test. (b,c) The lesion mimic phenotype of lmm9 could be recovered in the positive transgenic plants in LMM9-Com-7-12 (b) and LMM9-Com-27-4 (c) T2 generation. NPTII-F/NPTII-R, primers used for detecting the LMM9-Com transgenic plants. (d) Schematic representation of the vector used in LMM9-Ri plants. (e,f) The lesion mimic phenotype was observed in LMM9-Ri plants. Relative expression levels of Os03g03450 were presented as means ± SD of three biological replicates. Significant differences compared with WT (Student’s t-test, p < 0.01) were shown as double stars (**).
Ijms 26 09428 g003
Figure 4. Functional analysis of OsPAT1 protein. (a) Three-dimensional structure comparison of PAT1 (Blue) and OsPAT1.1 (Green) predicted by AlphaFold 3 with yeast TRP4 (Magenta). (b) Predicted interactions between OsPAT1.1 and PRPP. PRPP was colored in gray. The PRPP-interacting residues were shown in rainbow colors. (c) Alignment of the PRPP-interacting regions of TRP4, PAT1, and OsPAT1.1. Boxes indicated the conserved motifs in reported AnPRTs. PRPP-interacting residues were highlighted and underlined. (d,e) Combined with the plastid signal sequence of PAT1, the modified OsPAT1.1 complemented the yeast trp4 mutant on tryptophan-deficient medium. PSS, Plastid signal sequence; EV, empty vector.
Ijms 26 09428 g004
Figure 5. Express pattern and protein subcellular localizations of OsPAT1. (a) Relative expression levels of OsPAT1 in different organs of WT plants. Data were presented as means ± SD of three biological replicates. (b) Histochemical analysis of pLMM9::GUS transgenic plants. GUS signals were detected in germinated seeds (1), leaves, pulvinus, and sheathes of young seedlings (2–4), flag leaves, sheathes, culms, and panicles at booting stage (5–8). Bars = 1 cm. (c) Subcellular localizations of OsPAT1.1 and OsPAT1.2. GFP was used as the control. AOX-mcherry was used as the maker for mitochondria localization. Bars = 20 µm.
Ijms 26 09428 g005
Figure 6. The expressions of several genes in tryptophan synthesis pathway were affected by OsPAT1 expression. (a) Heat maps of the expressions of tryptophan synthesis pathway genes in RNA-seq analysis. AS, anthranilate synthase; PAT, phosphoribosylanthranilate transferase; PAI, N-(5′-phosphoribosyl)anthranilate isomerase; IGPS, indole-3-glycerolphosphate synthase; TSA, tryptophan synthase α subunit; TSB, tryptophan synthase β subunit. (b) Relative expression levels of tryptophan synthesis pathway genes in WT, lmm9, and transgenic plants. Data were shown as means ± SD of three replicates. (cf) Relative contents of chorismate (c), anthranilate (d), tryptophan (e), and tryptamine (f) in WT, lmm9 and related transgenic plants. The significance compared with WT was determined by Student’s t-test at p < 0.05 (*) and p < 0.01 (**).
Ijms 26 09428 g006
Disclaimer/Publisher’s Note: The statements, opinions and data contained in all publications are solely those of the individual author(s) and contributor(s) and not of MDPI and/or the editor(s). MDPI and/or the editor(s) disclaim responsibility for any injury to people or property resulting from any ideas, methods, instructions or products referred to in the content.