Article

Examining the Roles of Genomic Context and Endogenous Regulatory Elements on IS1 Transposition Within the Escherichia coli Genome

Department of Molecular Biology, School of Biological Sciences, University of California, 9500 Gilman Dr, La Jolla, San Diego, CA 92093-0116, USA
*
Authors to whom correspondence should be addressed.
Int. J. Mol. Sci. 2025, 26(17), 8375; https://doi.org/10.3390/ijms26178375
Submission received: 31 July 2025 / Revised: 24 August 2025 / Accepted: 26 August 2025 / Published: 28 August 2025

Abstract

Insertion sequence (IS) elements are key drivers of bacterial genome plasticity, yet the overall regulation of their transposition remains poorly understood. This is especially true for the multiple-layer regulation at the donor site, which has been largely overlooked. Using multiple mutation assays, genetic manipulations and reporter genes, this study focuses on characterizing how endogenous DNA sequences, transcriptional and translational factors, and genomic context regulate IS1 transposition from its donor site. Out of six elements within the chromosome of E. coli strain BW25113, IS1A and IS1E (both with the consensus sequence) contribute to over 99.9% of the overall IS1 transposition within the genome while the other four elements without the non-consensus sequence are essentially incapable of transposing. Inducing a ribosomal -1 frameshift at the A6C motif increases transposition over 1000-fold, but this enhancement is largely reversed by restoring InsA-mediated transcriptional regulation. Strikingly, genomic sequences flanking IS1 elements appreciably modulate transposition by promoting transcription or facilitating formation of transpososomes, a phenomenon that remains under-studied. Finally, IS1 was confirmed to undergo replicative transposition intramolecularly, a mechanism shown here to be independent of transposase levels in the cell. These findings contribute to our understanding of mobile genetic element regulation and potentially offer strategies for mitigating their potentially harmful effects.

1. Introduction

DNA mobility is a central theme in genome evolution, and transposons (mobile elements) represent one of the most versatile mechanisms in shaping prokaryotic genomes. As the smallest of the transposons, insertion sequence (IS) elements, are capable of intramolecular and intermolecular transposition [1]. They transpose with a protein that they encode themselves, a transposase, and integrate into their target site to create an insertional mutation. This can happen in a replicative or non-replicative manner (conservative): either the IS element is copied such that the original element remains at its original (donor) location while the copy inserts itself into the target (recipient) location (replicative) or the element is removed from its donor location and moved to the recipient location (non-replicative). Transposition of IS elements can yield multiple genomic effects, including chromosomal DNA rearrangements [2,3], deletions [4,5] and gene/operon (in)activation [6,7]. Furthermore, there has been a strong and concerning link between bacterial resistance to antibiotics and IS element movement [8,9].
Thought to have originated in the AT-rich RD-2 head processing region [10] as a constituent of the P1-phage genome [11], IS1 is a well-studied IS element commonly distributed in Gram-negative enteric bacteria, such as E. coli and Shigella strains as well as Salmonella enterica serovar Typhimurium [12]. Like other IS elements, IS1 insertion usually leads to major genetic changes, involving gene activation [13,14] or inactivation [7,15], as well as multi-drug resistance in bacterial cells [7,13,14].
As shown in Figure 1 and Figure S1, IS1 is the smallest (total of 768 base pairs) among IS elements, with imperfect inverted repeats (IRs) about 30 bp in length at both ends (IRL and IRR denoting the IR at the left side and at the right side, respectively). It carries two overlapping reading frames, insA and insB, which are transcribed in the same direction and are driven by an extremely weak promoter (PIS1) [16,17] that partially overlaps IRL. Near the end of insA lies a poly-adenosine (poly-A) tract (AAAAAAC, referred to as the A6C motif), which occasionally causes the ribosome to undergo a -1-frameshift before continuing translation (the primary translational regulator of IS1). While insA codes for the PIS1 repressor InsA (the primary transcriptional regulator of IS1), insB does not code for a separate protein; rather, the -1 translational frameshift must occur within the A6C motif to avoid the insA stop codon and allow translation of insB to create the transposase InsAB’ necessary for IS1 transposition (Figure 1A). The frameshift rate due to the A6C motif alone is effectively very low; however, the presence of an RNA secondary structure (a “pseudoknot”) downstream of the A6C motif in IS1 [18] may appreciably increase the frameshift rate [19], which also contributes to translational regulation. InsA contains a zinc-finger (ZF) motif and a helix-turn-helix (HTH) motif that are required for its IR-specific DNA binding [16,20,21]. InsAB’ (the transposase) harbors a catalytic DDE motif essential for IS1 transposition [22] in addition to the ZF and HTH motifs it shares with InsA (Figure 1B). This arrangement allows IS1 to be compact as InsA and InsAB’ share DNA binding domains. Thus, the relative concentrations of the two proteins are likely critical in determining the transposition frequency. We here dissect the relative roles of these regulations in IS1 transposition by examining these regulators individually. Lastly, each transposition causes a 8 bp or 9 bp duplication of the target site on either side of the newly inserted IS1 element [23].
Nucleotide sequences, copy numbers and locations of IS1 elements are variable amongst different E. coli strains [24,25]. In the genome of E. coli K12 BW25113 [26] used in this study, there are six IS1 elements (IS1A-IS1F) of the same size (768 bp), which are classified into four types based on their unique sequences [27,28]. As a major type of IS1, IS1A and IS1E have the same nucleotide sequence, which is referred to as IS1’s “consensus sequence” in this study since these two elements have been used the most in investigation of IS1 transposition. IS1A is located at 20,508 bp just downstream of the nhaAR operon (transcribed convergently with respect to IS1A). Directly downstream of IS1A lies rpsT (transcribed in tandem with IS1A), followed by a Rho-independent terminator. IS1E is located at 3,583,483 bp within the uncharacterized yrhA gene (transcribed in tandem with IS1E). As a 2nd type, IS1B and IS1C have the same sequence as well. IS1B is within the afuB gene, and IS1C is located between ykgS and yagJ. As a 3rd type, IS1D is located within the promoter region of gfcA. Lastly, as the 4th type, IS1F is located just downstream of the fecABCDE and fecIR operons, transcribed divergently with respect to IS1F. While the overall IS1 transposition process has been somewhat characterized, most investigations have focused on intermolecular transposition (e.g., plasmid to plasmid transposition) [29,30,31]. Thus far, little information is available concerning the activities of IS1 transposition within a bacterial genome. Essentially no efforts have been devoted to examining the transposition rates of these six IS1 elements present on the E. coli chromosome [32]. Given the slight sequence variability between elements, understanding their individual activities could provide insight into how sequence differences affect transposition efficiency.
For each IS5 transposition event, two key genomic regions are directly involved: one serving as the recipient site (to receive the incoming IS5 element) and the other serving as the donor site (to donate the transposing IS5 element) [33]. Conceivably, the same case applies to IS1. Most previous efforts have concentrated on investigating how IS1 elements insert into their recipient/target sites, ignoring the regulatory layers surrounding the donor site. Consequently, little information is available concerning how the surrounding genomic context and endogenous regulatory factors of IS1 concurrently impact transposition frequencies within the chromosome. Furthermore, while overall IS1 transposition frequencies have been characterized, the transposition rates of individual IS1 elements remain uncharacterized. This is notable given that the sequences of these copies vary slightly, which could influence their transposition activity.
IS1 elements encode a DDE-type transposase that is characterized by the presence of a conserved Asp-Asp-Glu (DDE) motif serving as its catalytic site [27]. Initiating non-replicative transposition requires an endonuclease to make double stranded breaks [28], while replicative transposition usually only requires single stranded nicking [34]. DDE transposases are known to possess intrinsic nicking-ability. The IS1 transposase has been speculated to transpose non-replicatively [35] but has been observed to transpose primarily replicatively [30]. However, it is unclear what the primary mechanism could be by which IS1 transposes (intramolecularly) within a bacterial genome.
This study aims to fill in these gaps, focusing on the IS1 element. Here, we show that the IS1 elements maintaining the consensus sequence, IS1A and IS1E, are the only two out of six elements that significantly contribute to IS1 transposition. Furthermore, in their native state, IS1E transposes at a slightly higher frequency than IS1A. Constitutive induction of the -1 ribosomal frameshift at IS1 drastically increases the transposition frequency for these elements. Overproduction of the repressor InsA nearly abolishes transposition of both native and frameshift-induced IS1 elements. Genomic contexts flanking IS1 elements appreciably affect their transposition by exerting stimulatory effects on transcription of the transposase gene or aiding formation of the transpososome. Lastly, we confirm that the primary mechanism of transposition is replicative.

2. Results

2.1. IS1A and IS1E Maintain the IS1 Consensus Sequence and Are the Primary Contributors to Transposition

There are six IS1 elements (IS1A, IS1B, IS1C, IS1D, IS1E and IS1F) representing four unique types [28] on the chromosome of E. coli K12 strain BW25113 [26]. Type I includes IS1A and IS1E, and their nucleotide sequences are identical (Figure S1). For each of these IS1 elements, its chromosomal location, neighbor gene, orientation (relative to the nearby genes) and similarity to the consensus sequence are shown on Figure 2A. In this study, we define this 768 bp sequence as the IS1 consensus sequence (cons) since these two elements are the dominant contributors for overall IS1 transposition. Type II contains IS1B and IS1C with identical sequences, which reveal 9 mismatches relative to the consensus sequence (Figure S2). IS1D (type III) harbors 9 mismatches, 7 of which are the same as in type II, while IS1F (type IV) harbors 73 mismatches as compared to the consensus sequence (Figure S1). The sequences of all six IS1 elements were confirmed by DNA sequencing. As shown in Figure S2, most of the mismatches were found within the coding region of insA or insAB’.
To identify whether non-consensus sequence (non-cons) elements can transpose, we first determined which types of IS1 element were capable of transposition within the genome using strain WT. Twenty-five independent IS1-mediated Bgl+ mutants, isolated from β-glucoside growth (Bgl+) mutation assays subject to sequencing analyses, carried the IS1 consensus sequence (i.e., IS1A or IS1E from type I) present upstream of the bglGFB promoter (Pbgl) region. Similar sequence analyses were conducted using ten IS1 insertional FZD+ mutants and fifteen SWM+ mutants, and all these mutants carried type I IS1 elements at their respective recipient site (Figure 2B). These results strongly suggest that IS1B/IS1C (type II), IS1D (type III) and IS1F (type IV), each having a non-consensus sequence, are either unable to transpose or transpose at an extremely low frequency.
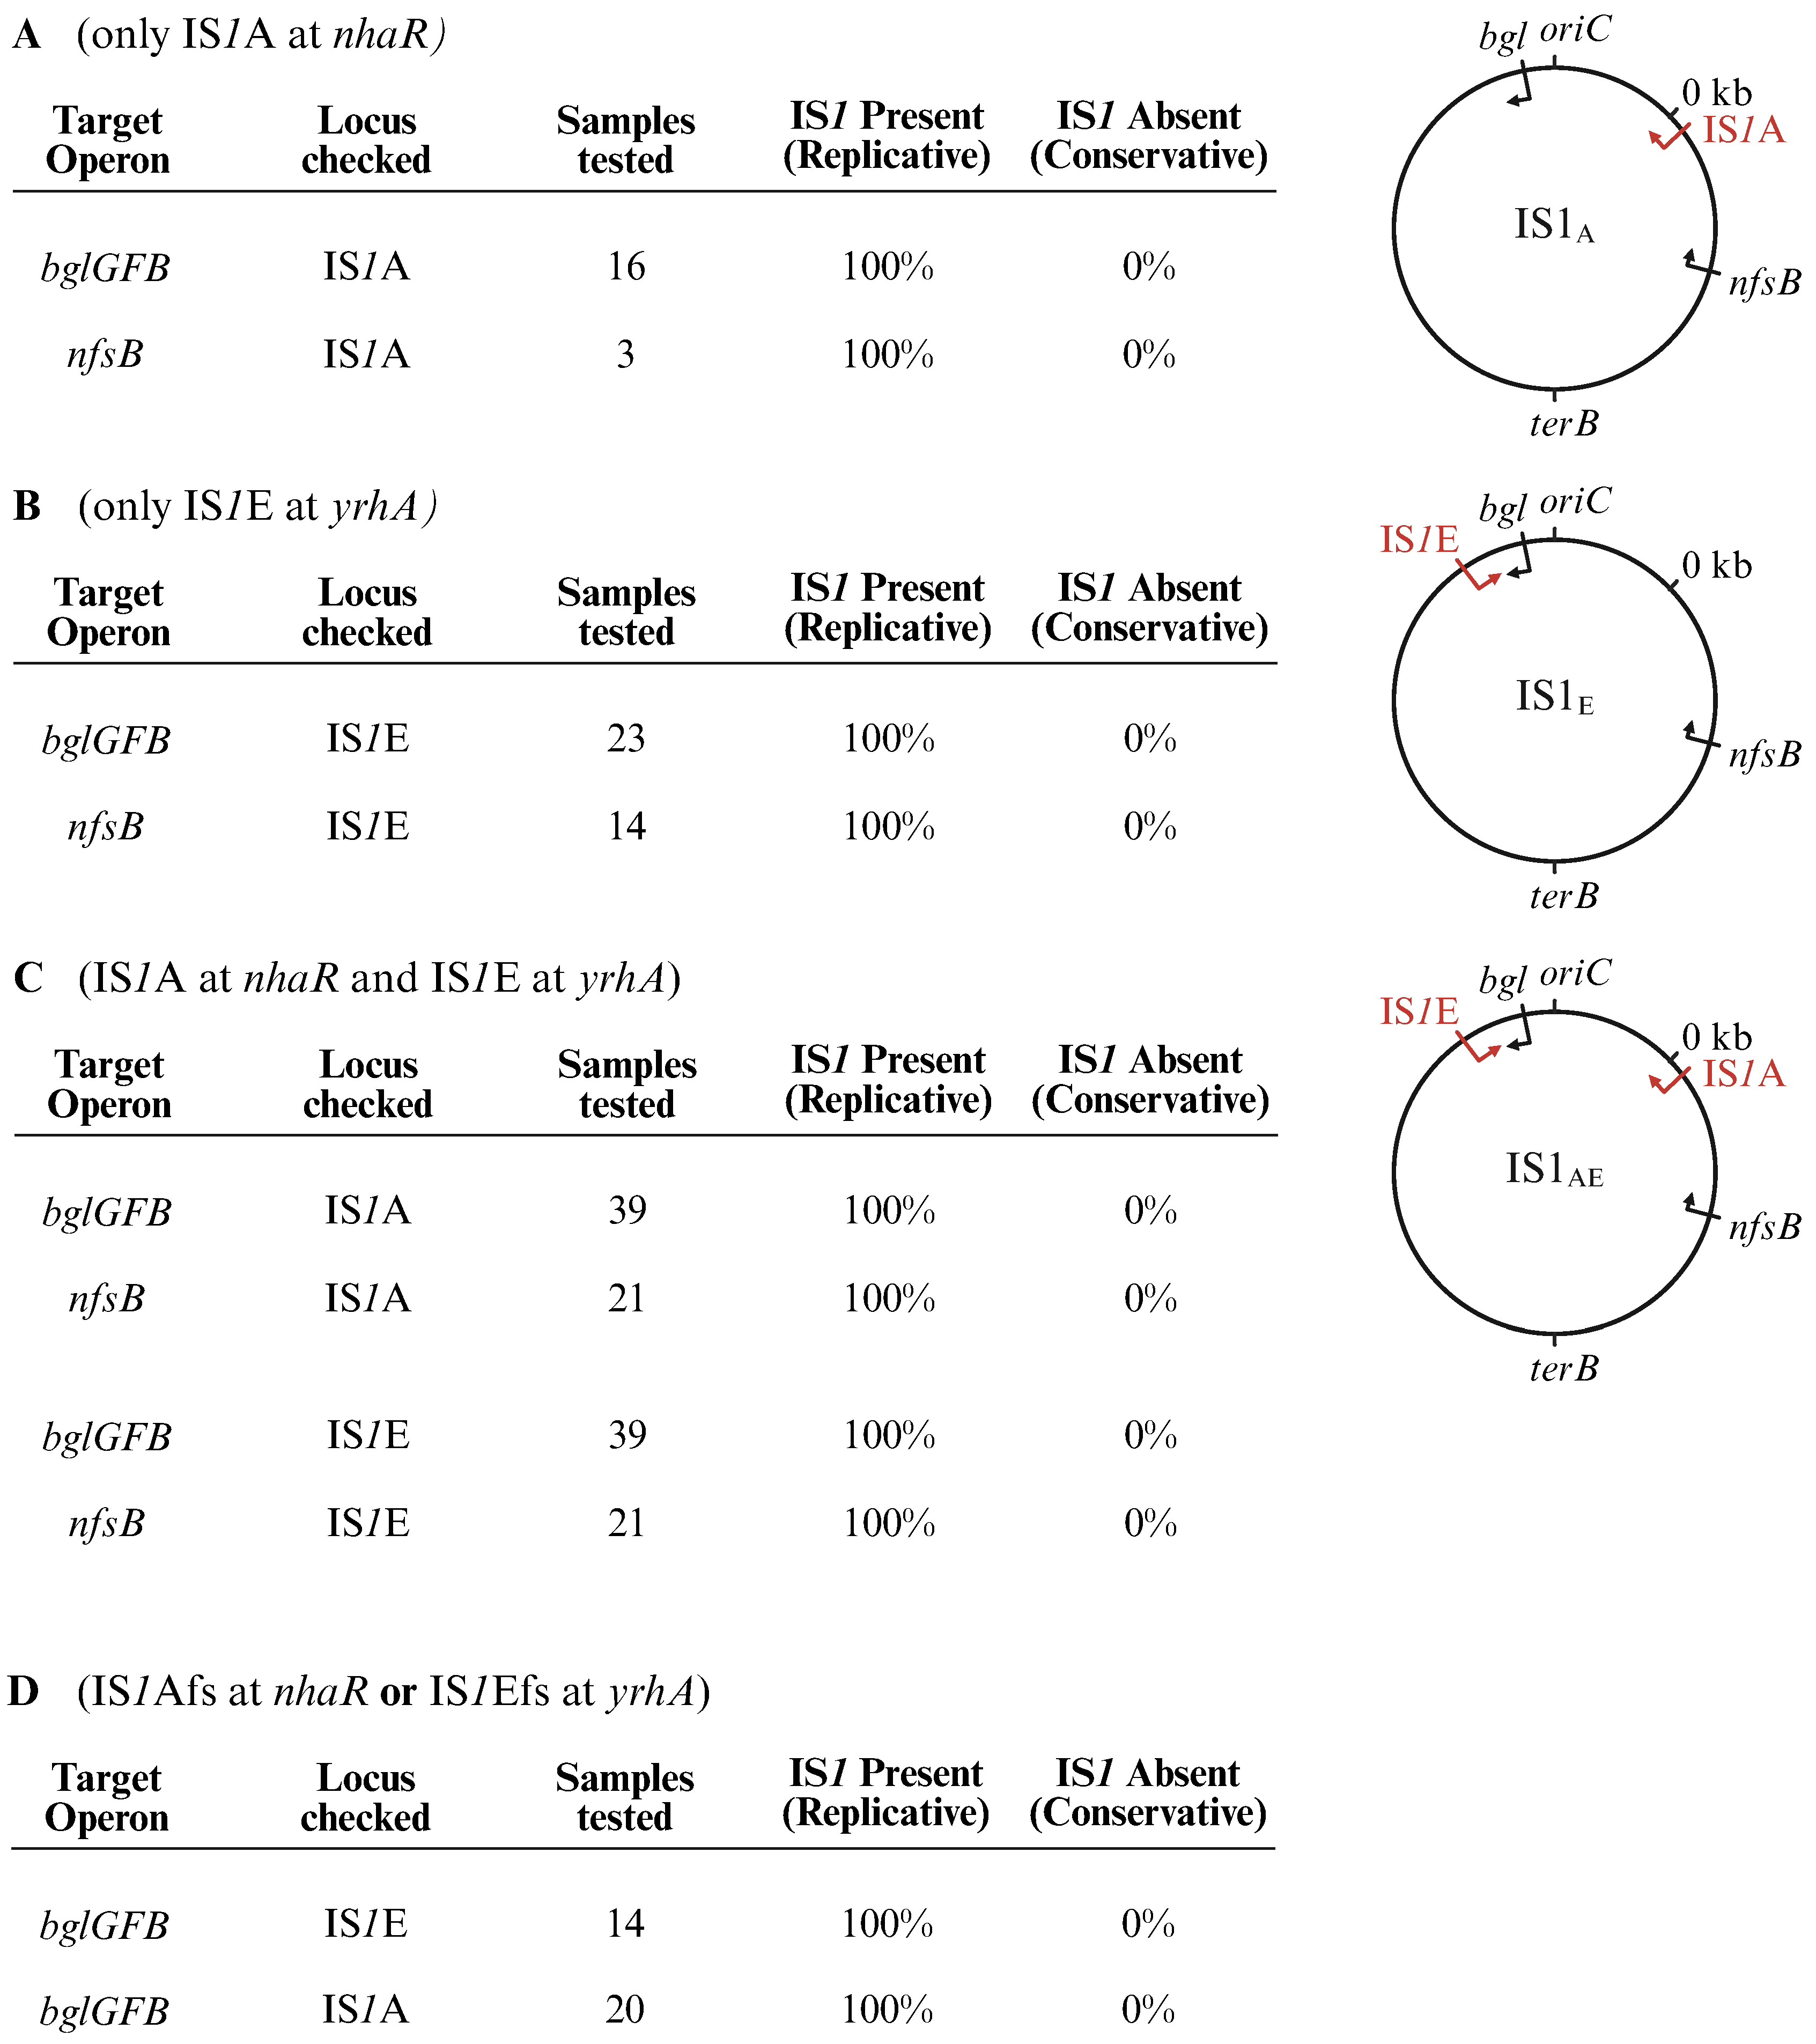
To further examine the transposition activity of non-cons IS1 elements, strain ∆IS1cons was made, in which the two type I elements (IS1A and IS1E) were deleted leaving only four non-consensus elements (IS1B, IS1C, IS1D and IS1F) (right diagram of Figure 2C). Using Bgl+ mutation assays and FZD+ mutation assays, this strain was compared with the WT strain (left diagram of Figure 2C) for IS1 transposition upstream of Pbgl and within nfsB, respectively. IS1 insertional Bgl+ mutations arose from WT plates beginning on day 2 post inoculation, and continued arising with time. However, no IS1-mediated Bgl+ mutations were detected from the plates with strain ∆IS1cons (IS1A/IS1E deleted) during a 2-week incubation (Figure 2D). By using numerous plates and multiple Bgl+ assays, only one singular instance of an IS1 transposition event from ∆IS1cons cells (Figure 2E) was observed, making the rate of transposition for non-cons copies 1 per 1010 cells (over the course of two weeks), and was thus nearly non-detectable. Meanwhile, no IS1 insertional FZD+ mutations were detected on the nfsB target from ∆IS1cons cells although the same mutation readily occurred with WT cells (Figure 2E).
Based on the above results, we conclude: (i) the two type I IS1 elements with consensus sequence, IS1A and IS1E, make up nearly all the transpositions responsible for IS1 insertions seen in our assays, while the other four non-cons IS1 elements (IS1B, IS1C, IS1D and IS1F) are capable of transposing, but with extremely low frequencies; (ii) the endogenous nucleotide sequences embedded within IS1 significantly affect its transposition activity, and (iii) the mismatches in IS1B, IS1C, IS1D and IS1F seem to abolish or drastically minimize production of a functional transposase.

2.2. IS1E Transposes at a Higher Frequency than IS1A Although Both Are Main Contributors for IS1 Transposition

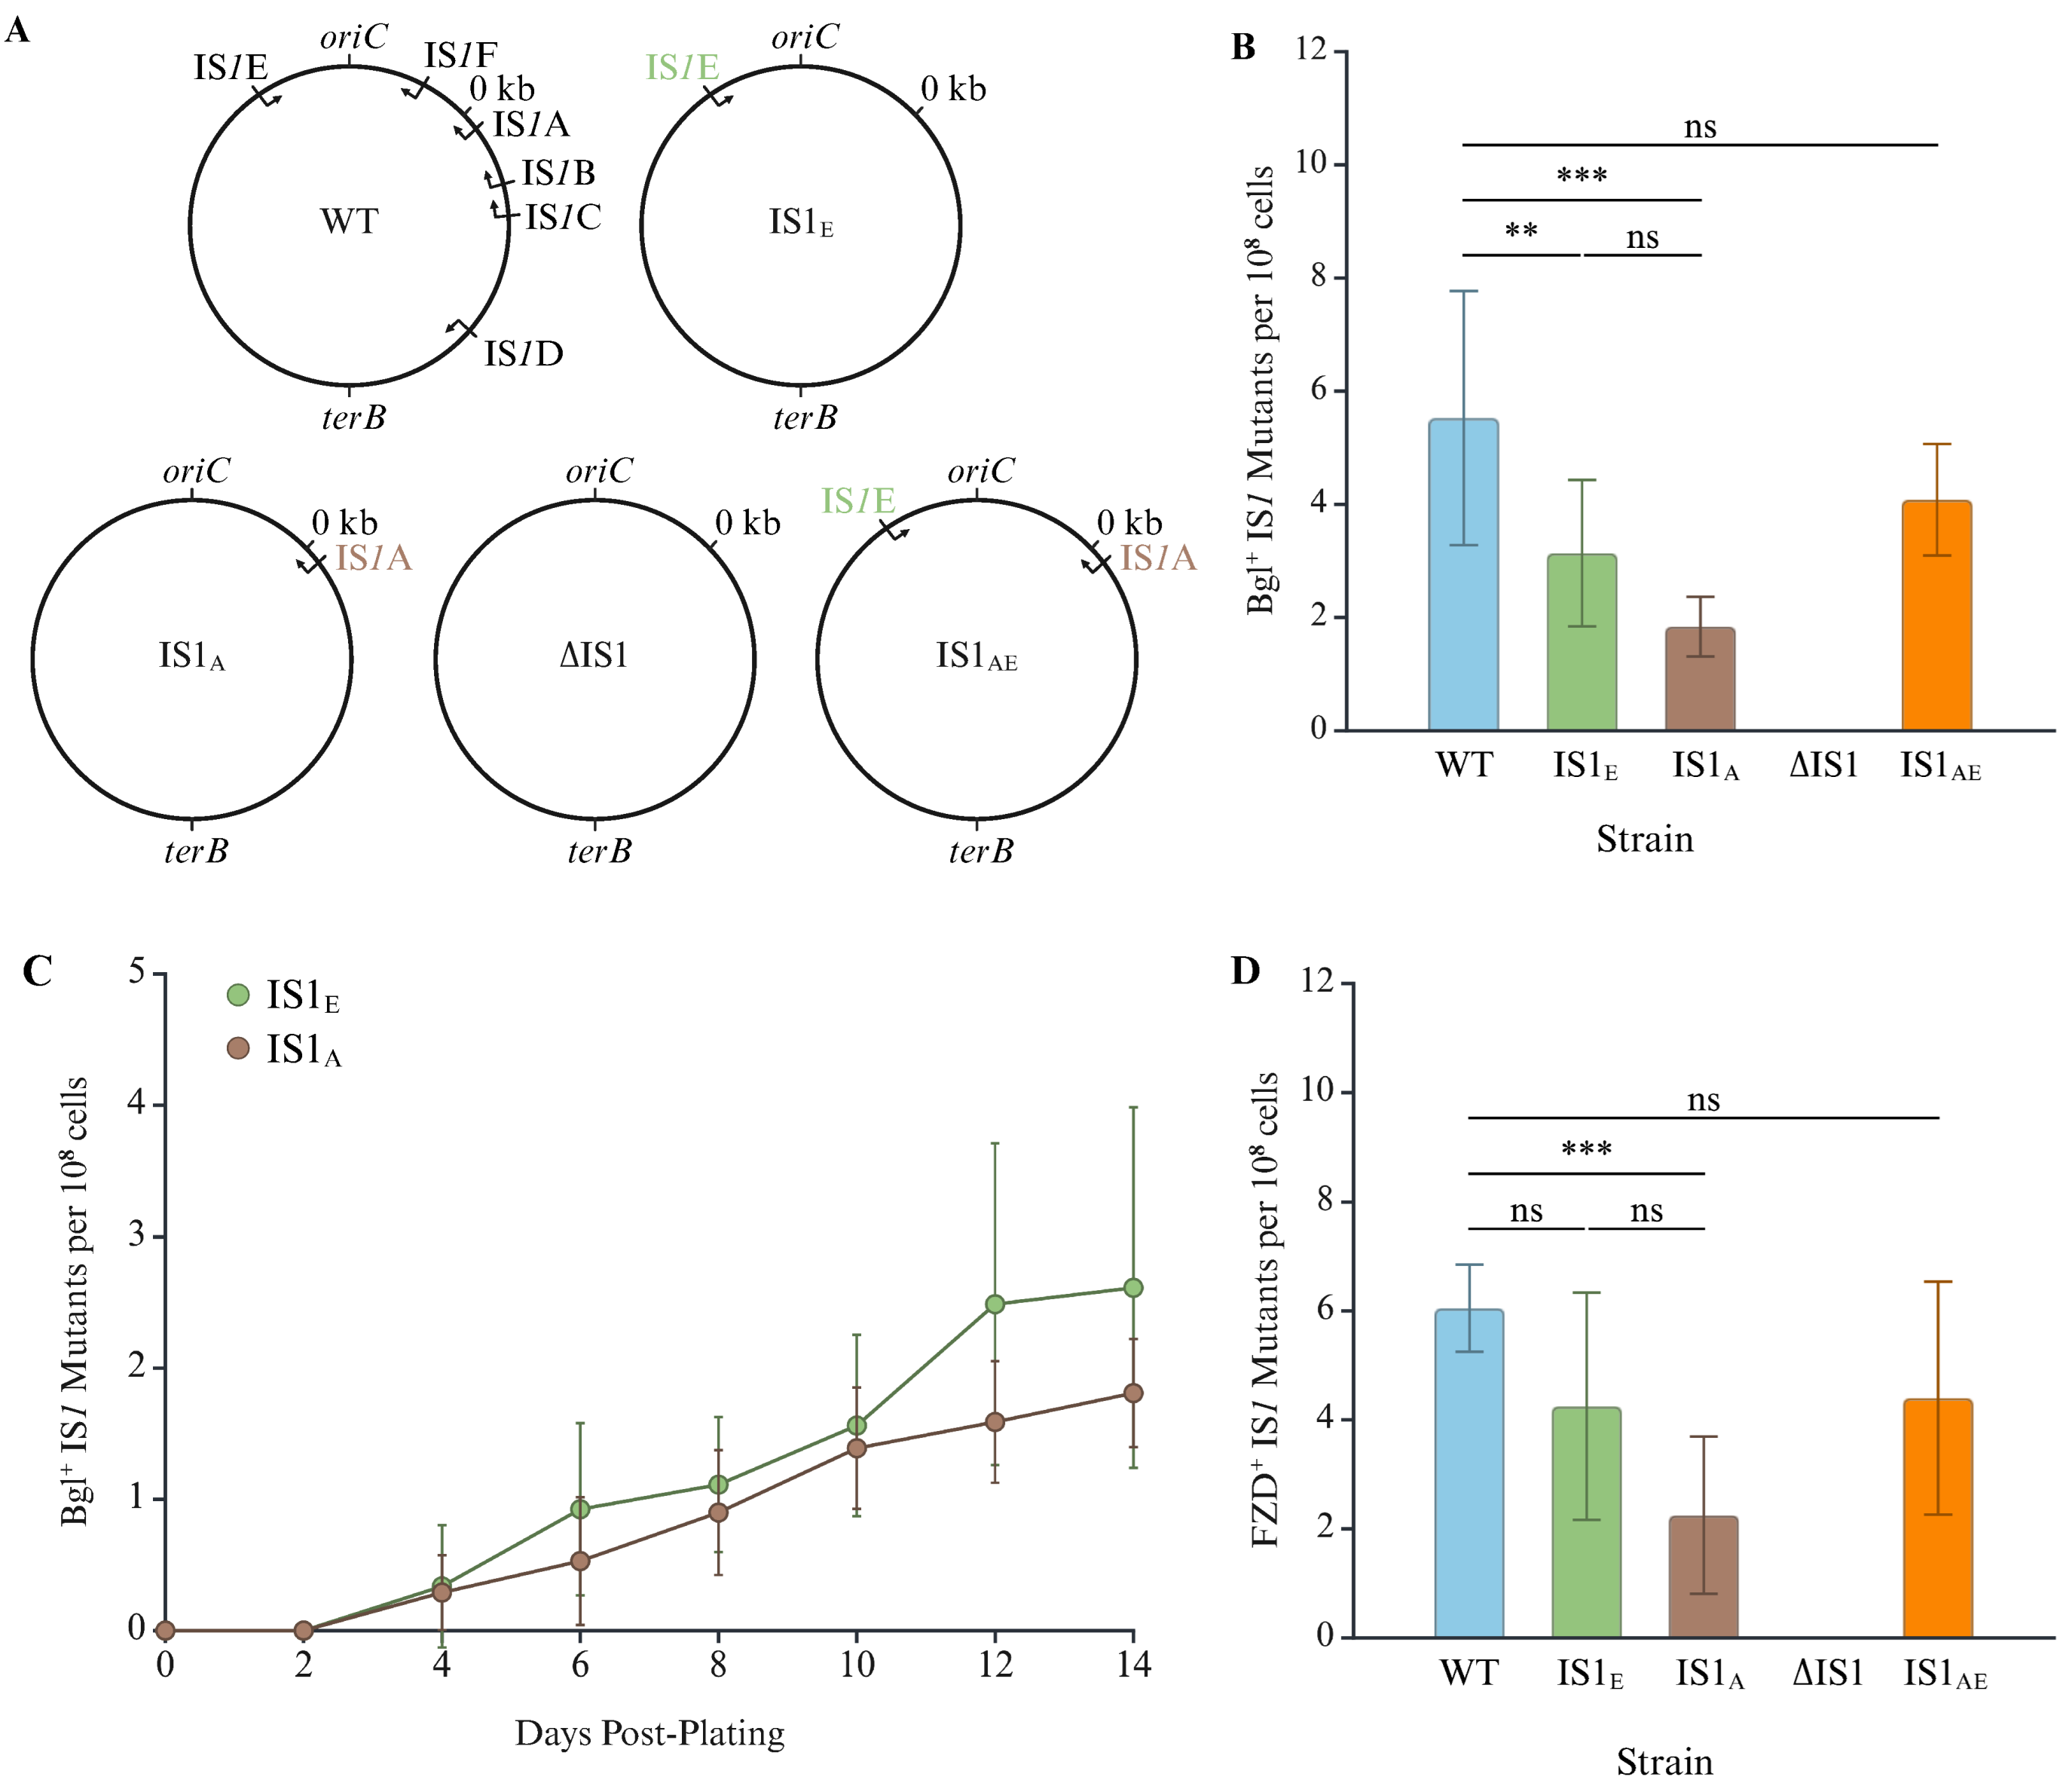
Having shown that IS1A and IS1E, both with the consensus sequence, are the primary sources of IS1 transposition in K12 BW25113, we moved on to determine whether one of them was the main contributor to transposition. To do this, several IS1 deletion strains were made: IS1E (only retaining IS1E at the yrhA locus), IS1A (only retaining IS1A at the nhaR locus), IS1AE (only retaining IS1E and IS1A), and ∆IS1 (having all six copies of IS1 deleted) (Figure 3A).
The frequencies of IS1 transposition into the regulatory region of the bglGFB operon were measured for these strains using the Bgl+ assay (Figure 3B). As expected, the ∆IS1 strain did not result in IS1 transposition, confirming successful removal of all IS1 elements from the chromosome. There was no statistical difference in the frequency of IS1 transposition between the wild-type (WT) strain and the IS1AE strain, confirming that the two consensus copies of IS1 make up most, if not all, of the IS1 transpositions in WT cells. Both single copy IS1 strains, IS1E and IS1A, exhibited a decreased frequency of IS1 transposition (by about half compared to the WT) although somewhat more frequent IS1 insertions were observed for strain IS1E than for strain IS1A. To further examine the transposition activity of IS1E and IS1A, we ran a separate Bgl+ mutation assay over time (Figure 3C). Once again, IS1E yielded slightly more IS1 insertional Bgl+ mutants than IS1A although the differences may not be significant on some days (as demonstrated by the overlapping standard deviations).
The same strains were tested for IS1 transposition using the FZD+ assays to validate these trends at another locus: nfsB. Similar observations were made: WT and IS1AE had similar frequencies of transposition while IS1E had more FZD+ mutants than IS1A (Figure 3D). These findings suggest that neither copy (IS1A nor IS1E) alone is exclusively responsible for overall IS1 transposition, but IS1E transposes slightly more frequently than IS1A.

2.3. Translational Regulation Has a Large Effect on IS1 Transposition

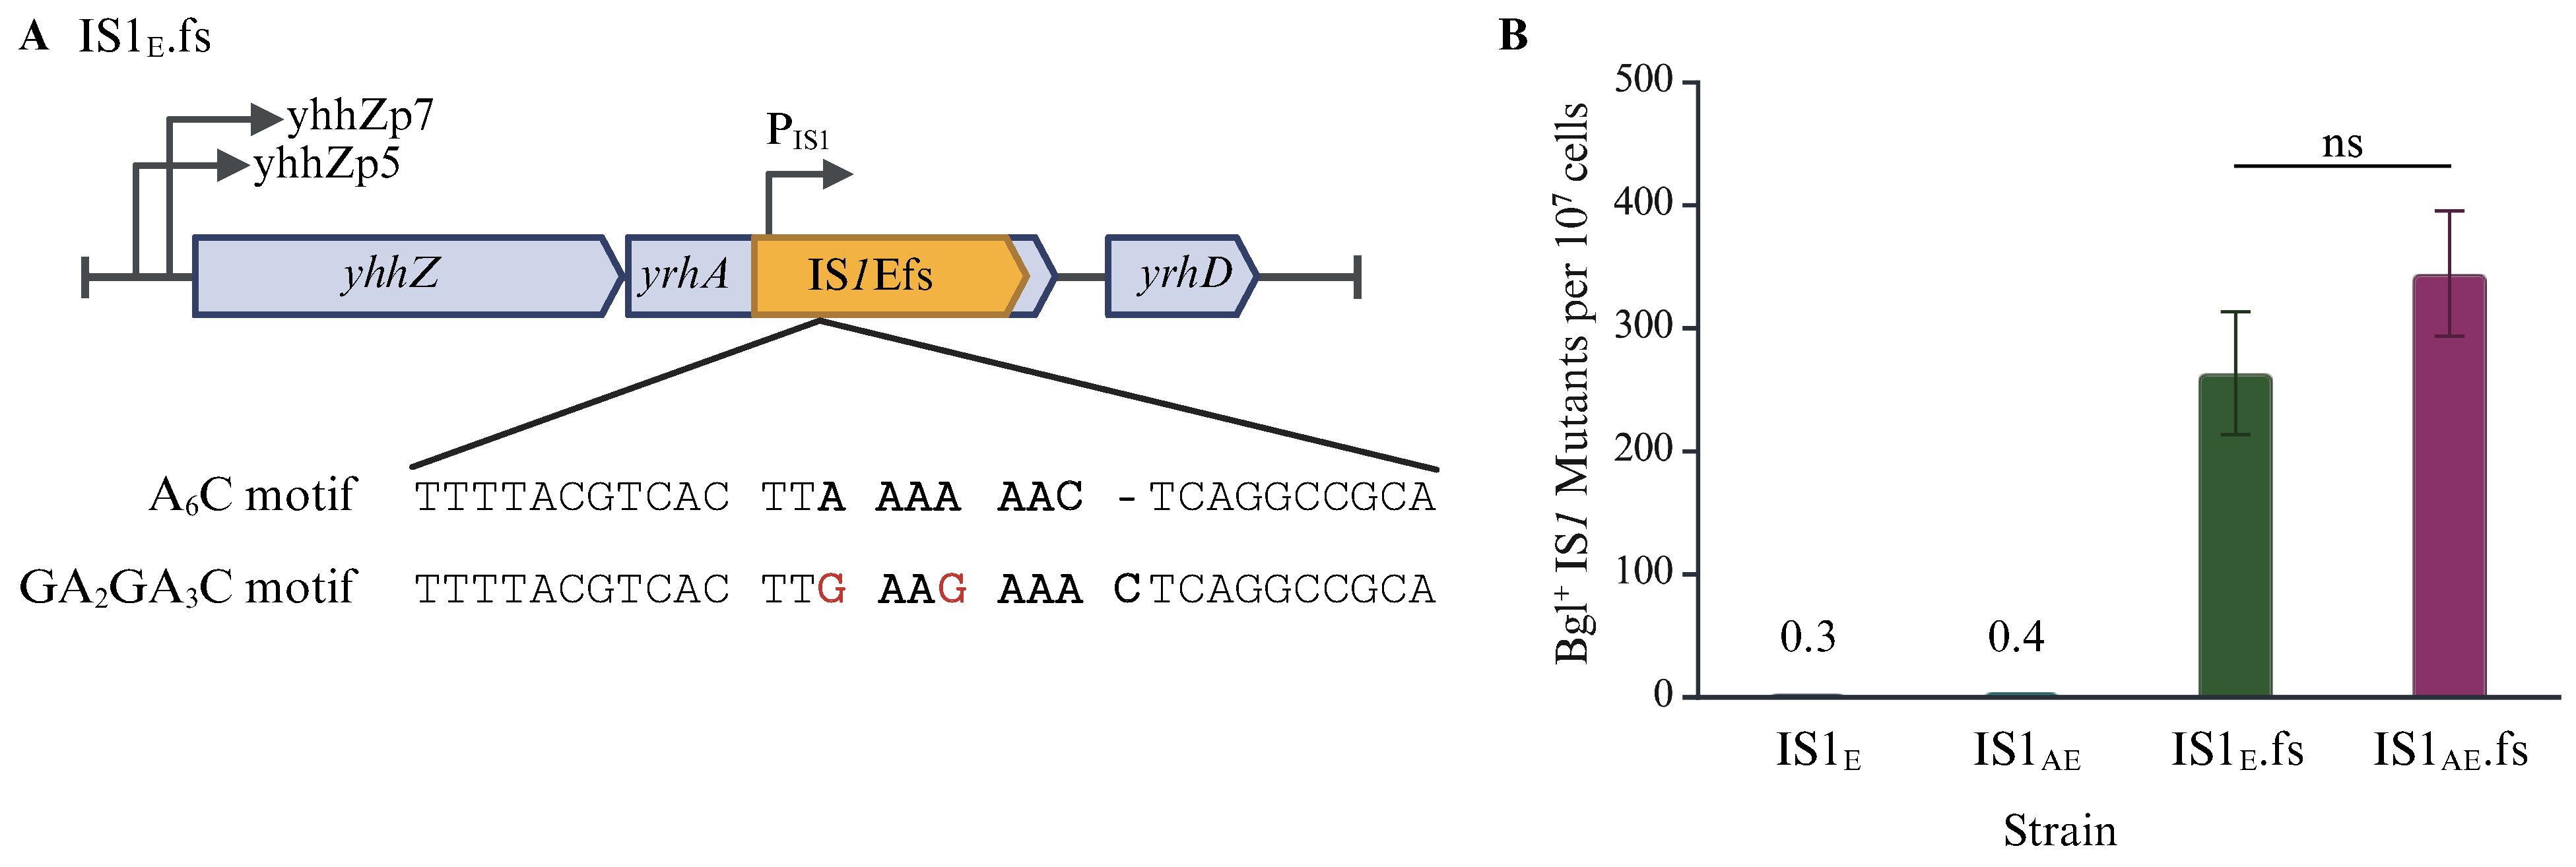
IS1 transposase production is subject to both transcriptional control (mediated by the repressor InsA) and translational control (mediated by ribosomal frameshift at the A6C motif). To characterize the translational regulation, we removed the translational requirement in strain IS1E by changing the A6C motif (AAAAAAC) to the GA2GA3C motif (GAAGAAAC), yielding strain IS1E.fs (Figure 4A). Such alterations caused the default expression of the transposase gene InsAB’ while abolishing repressor gene insA expression. The same changes were made on the IS1E element in strain IS1AE (retaining IS1A and IS1E) to create strain IS1AE.fs, which carries the native IS1A (with the original A6C motif) and the induced frameshift at IS1E (with the GA2GA3C motif). Since IS1 transposition is dependent on transcriptional and translational regulation, these new strains would allow us to separate the two and measure the extent of the translational regulation by removing it.
Using Bgl+ mutation assays, these frameshift-induced strains were compared with the relative native strains for IS1 transposition into the bglGFB target (Figure 4B). The IS1 transposition frequencies in IS1E.fs (with a constitutively induced frameshift in the A6C motif) increased from about 0.3 mutants to 270 mutants per 107 cells, a 900-fold elevation. Strain IS1AE.fs, carrying the frameshift-induced IS1E element, IS1Efs, together with the native IS1A, exhibited a similar increase in transposition over strain IS1AE (0.4 mutants for IS1AE vs. 330 mutants for IS1AE.fs). It is worth noting that strain IS1AE.fs had a somewhat greater insertion frequency than IS1E.fs (330 mutants for IS1AE.fs vs. 270 mutants for IS1E.fs). This could be due to the trans effect of the transposases over-produced by IS1Efs on IS1A transposition (see Section 3). This drastic increase, due to the removal of translational regulation, indicates that translational regulation plays an important and large role in repressing IS1 transposition.

2.4. Transcriptional Regulation Has a Large Effect on IS1 Transposition

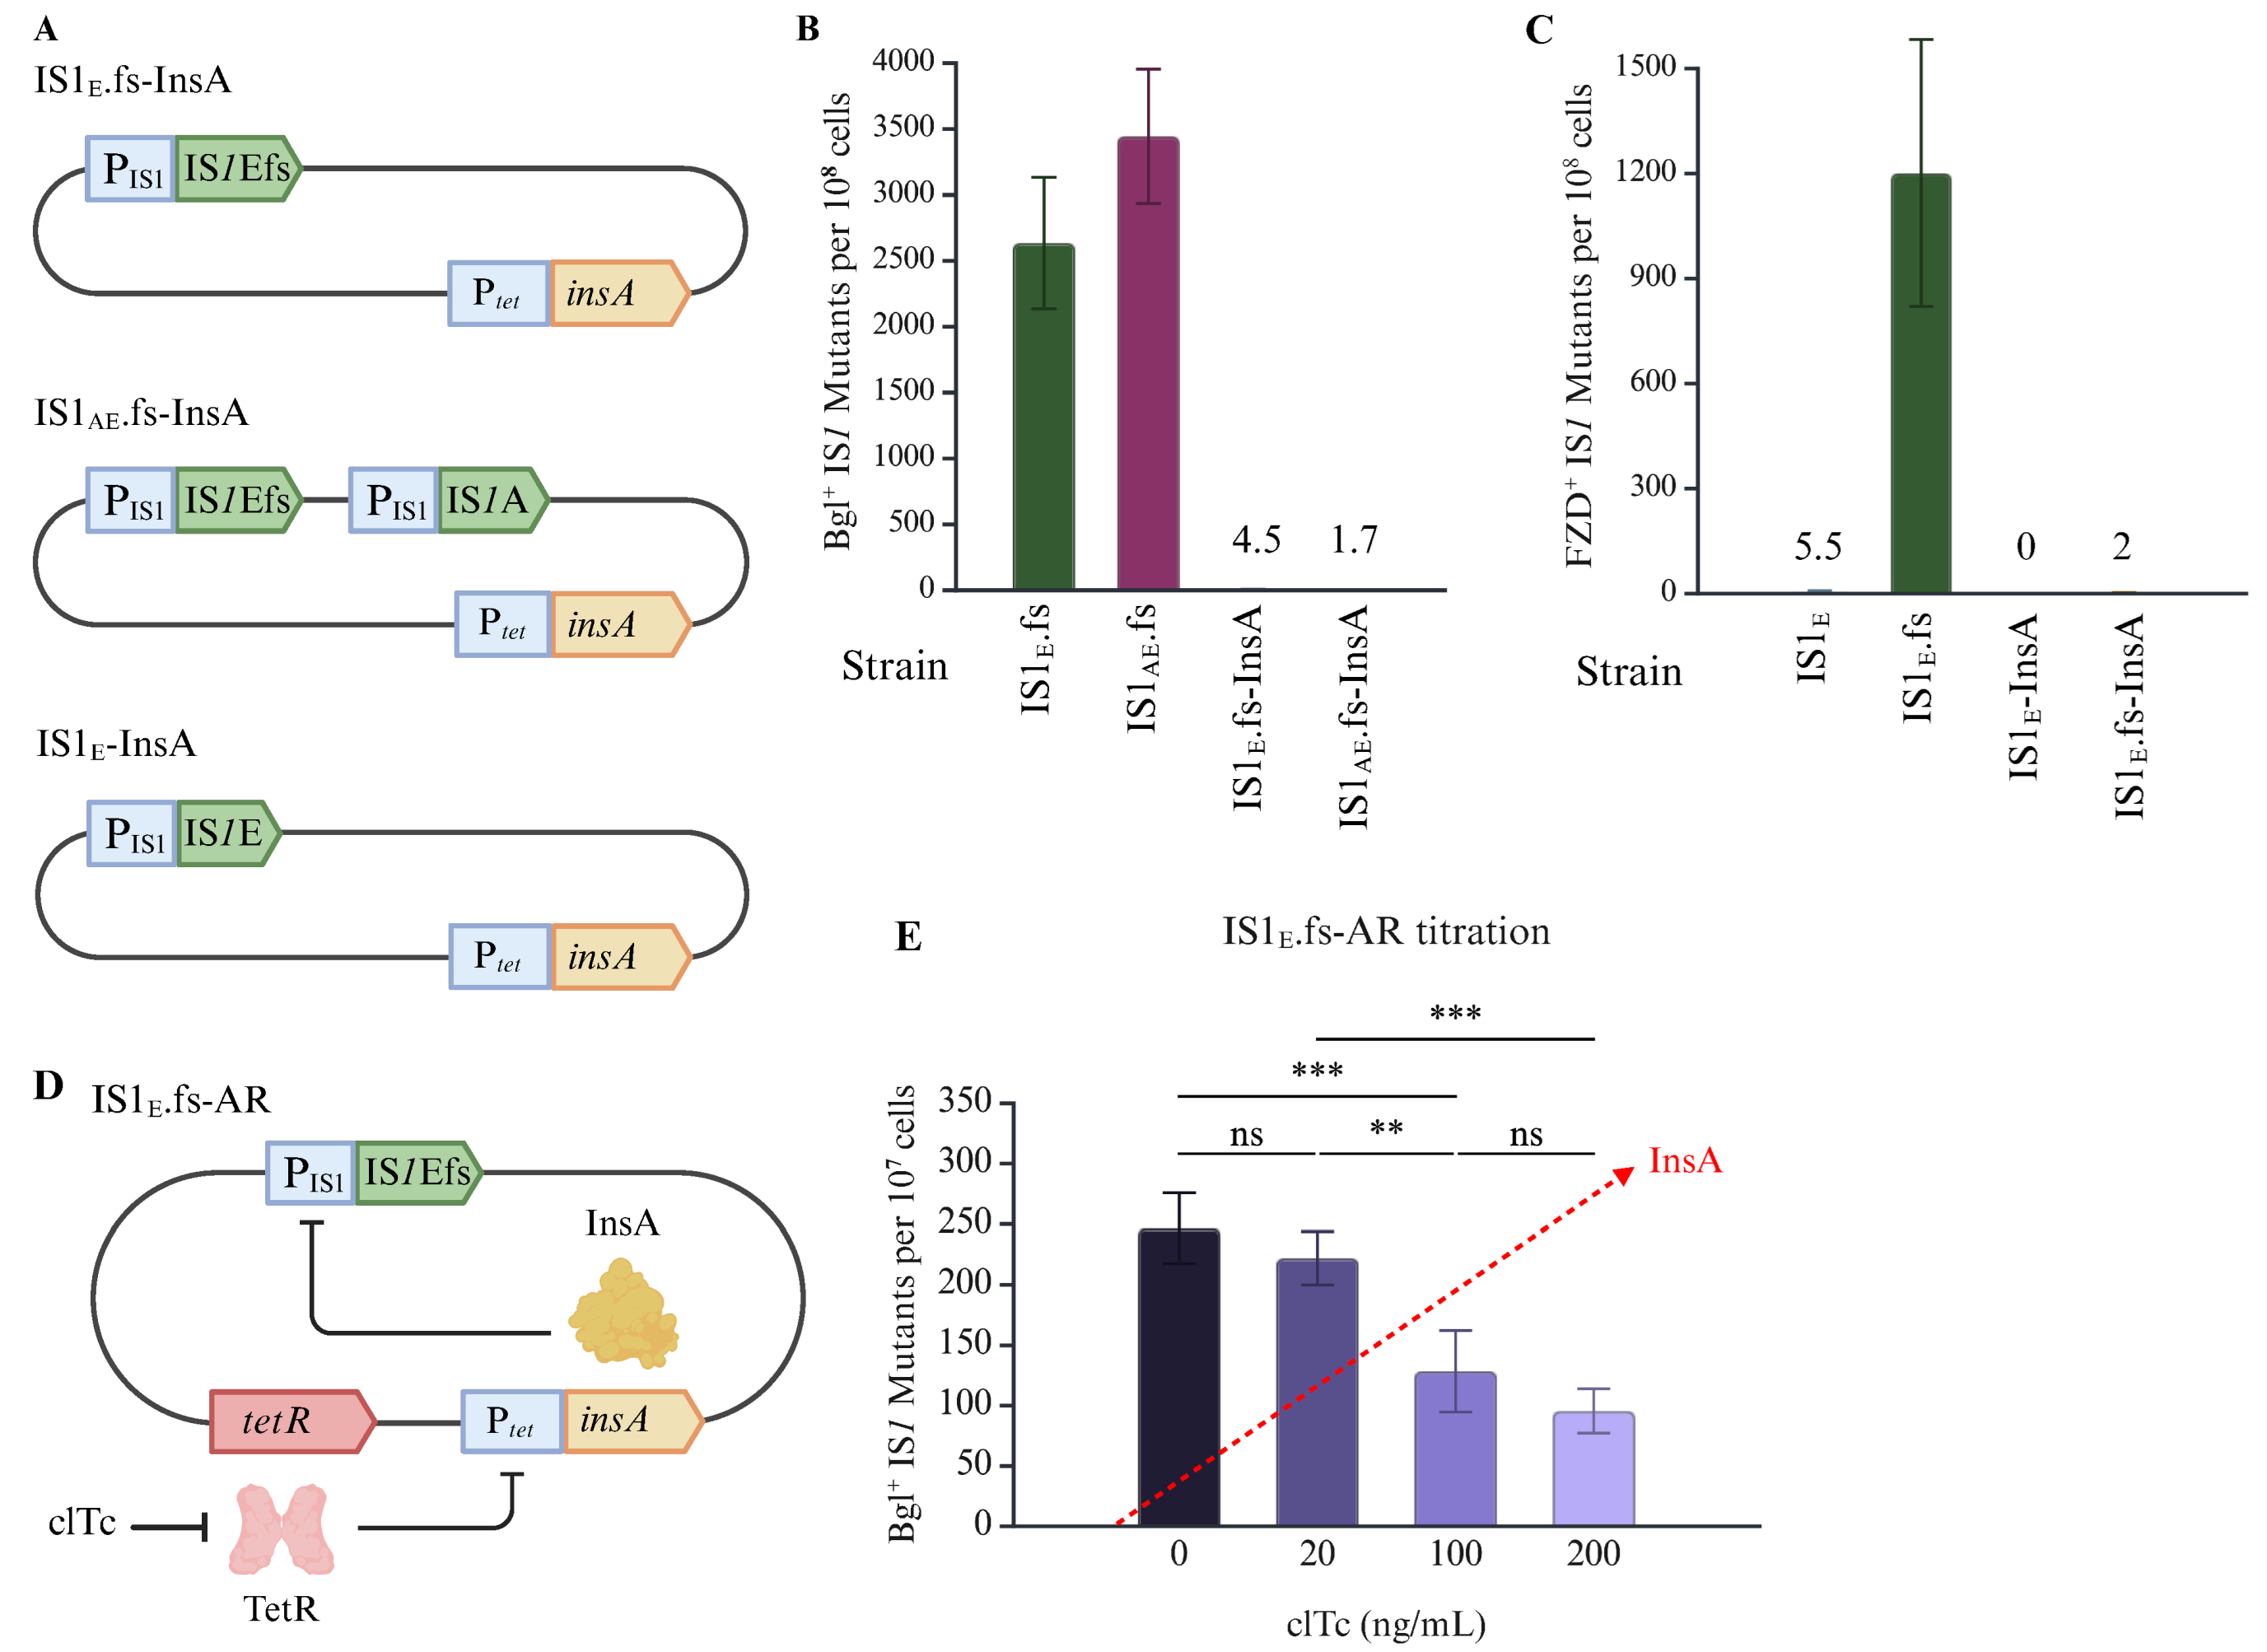
Due to the alterations at the A6C motif, frameshift-induced IS1 elements lose the ability to express the repressor gene insA. To examine the transcriptional regulation affecting IS1 transposition, an expression cassette that constitutively expressed insA at a separate intS locus using a strong promoter (Ptet) was introduced back to IS1E, IS1E.fs, and IS1AE.fs to create IS1E-InsA, IS1E.fs-InsA, and IS1AE.fs-InsA (Figure 5A). This set-up (with the transcriptional repression and the translational frameshift control at two distinct loci) allowed us to investigate the transcriptional effect alone on IS1 transposition using both native IS1 strains and frameshift-induced strains.
The frequencies of IS1 transposition into the bglGFB and nfsB target sites were quantitated for these strains using Bgl+ and FZD+ assays. The addition of InsA to IS1E.fs and IS1AE.fs reduced IS1 transposition into the bglGFB operon by about 1000x, down to native state transposition levels (Figure 5B). Similar effects were observed for transposition into the nfsB gene. As shown in Figure 5C, the insA overexpression abolished IS1E transposition (5.5 FZD+ mutants to 0 mutants per 108 cells) (see strain IS1E in the 1st and 3rd columns), emphasizing how sensitive IS1 transposition is to InsA. This overexpression led to an ~600x decreased transposition frequency for strain IS1E.fs (2nd and 4th columns on Figure 5C). These results highlight the potency of InsA as a repressor for the IS1 promoter PIS1 and the strength of transcriptional regulation in controlling IS1 transposition activity. Of note, InsA not only represses transcription, but also directly represses IS1 transposition by competing with InsAB’ binding to both IRL and IRR.
To vary production of InsA, thus proportionally controlling IS1 transposition activity, a regulatory cascade was created by constitutively expressing tetR, the repressor for Ptet, in strain IS1E.fs-InsA. The resultant strain IS1E.fs-AR harbors three modules, IS1Efs (frameshift-induced IS1E), Ptet driven insA, and constitutively expressed tetR (Figure 5D). This cascade is titratable with the small molecule chlortetracycline (clTc), such that with increasing amounts of clTc, more InsA is produced, and less transposition is expected (Figure 5D). The intended effect was observed; increasing levels of clTc led to a reduction in transposition, supporting the proposed model (Figure 5E). Of note, the addition of clTc at 200 ng/mL only reduced IS1 transposition 2.5-fold as compared to the treatment without clTc, indicating that the insA gene was insufficiently expressed at this level of clTc due to the strong repression by TetR. Though these experimental conditions use much higher levels of InsA and InsAB’ than the native state does, the titratability is adequately demonstrated and shows that IS1 transposition activity is inversely correlated with the levels of InsA.
As described above, the availability of transposases, essential for IS1 transposition, is highly dependent on both transcriptional regulation (mediated by InsA) and translational regulation (mediated by the -1 ribosomal frameshift), implying that IS1 transposition is extremely tightly controlled. Given the potential for genomic disruption, tight regulation makes sense due to the fact that frequent IS1 transposition is likely harmful to the cell: a notion further supported by evidence from other studies [36,37].

2.5. Effects of Genomic Contexts on IS1 Transposition

As shown in Section 2.2, two native IS1 elements with identical sequences, IS1E at the yrhA locus and IS1A at the nhaR locus, exhibited moderately different transposition activity with IS1E transposing at a higher frequency than IS1A (Figure 2), suggesting that the genomic DNA contexts play a role in IS1 transposition. Since all native IS1 elements seldom transpose, comparing the IS1A and IS1E elements in their frameshift-induced state is necessary to observe an influence exerted by the genomic context, since these modified elements transpose at much greater frequencies. To do this, the same alteration to the A6C motif was introduced into IS1A in strain IS1A to create strain IS1A.fs (Figure 6A). Using Bgl+ mutation assays, the activities of IS1 transposition into the bglGFB target in IS1A.fs and IS1E.fs were measured by quantitating the insertion frequencies. Strikingly, the IS1 transposition frequency in IS1A.fs was only half that of IS1E.fs (Figure 6B). Given that removal of the translational regulation and that IS1A and IS1E are sequentially identical, this result indicates that the genomic context, being the only differentiating factor, clearly influences IS1 transposition.
To measure the transcriptional activity of IS1A and IS1E, a lacZ reporter was added downstream of the transposase gene, insAB* (insAB’ with the altered A6C motif), in strains IS1A.fs and IS1E.fs (so that insAB’ and lacZ form an operon) to create IS1A.fs-Z and IS1E.fs-Z (Figure 6C). β-galactosidase assays were conducted by culturing these reporter strains in minimal glycerol media. As shown in Figure 6D, a similar trend in transcriptional activity was revealed as seen with transposition frequency: IS1E.fs presented twice as much transcriptional activity as IS1A.fs. With this result, we conclude that the local genomic regions exert a greater transcriptional effect on IS1E than IS1A since both elements have the same nucleotide sequence but different surrounding chromosomal regions. This result supports the notion that the different transposition activities observed between IS1E and IS1A or between IS1Efs and IS1Afs may be at least partially due to their different insAB’ transcription activities.
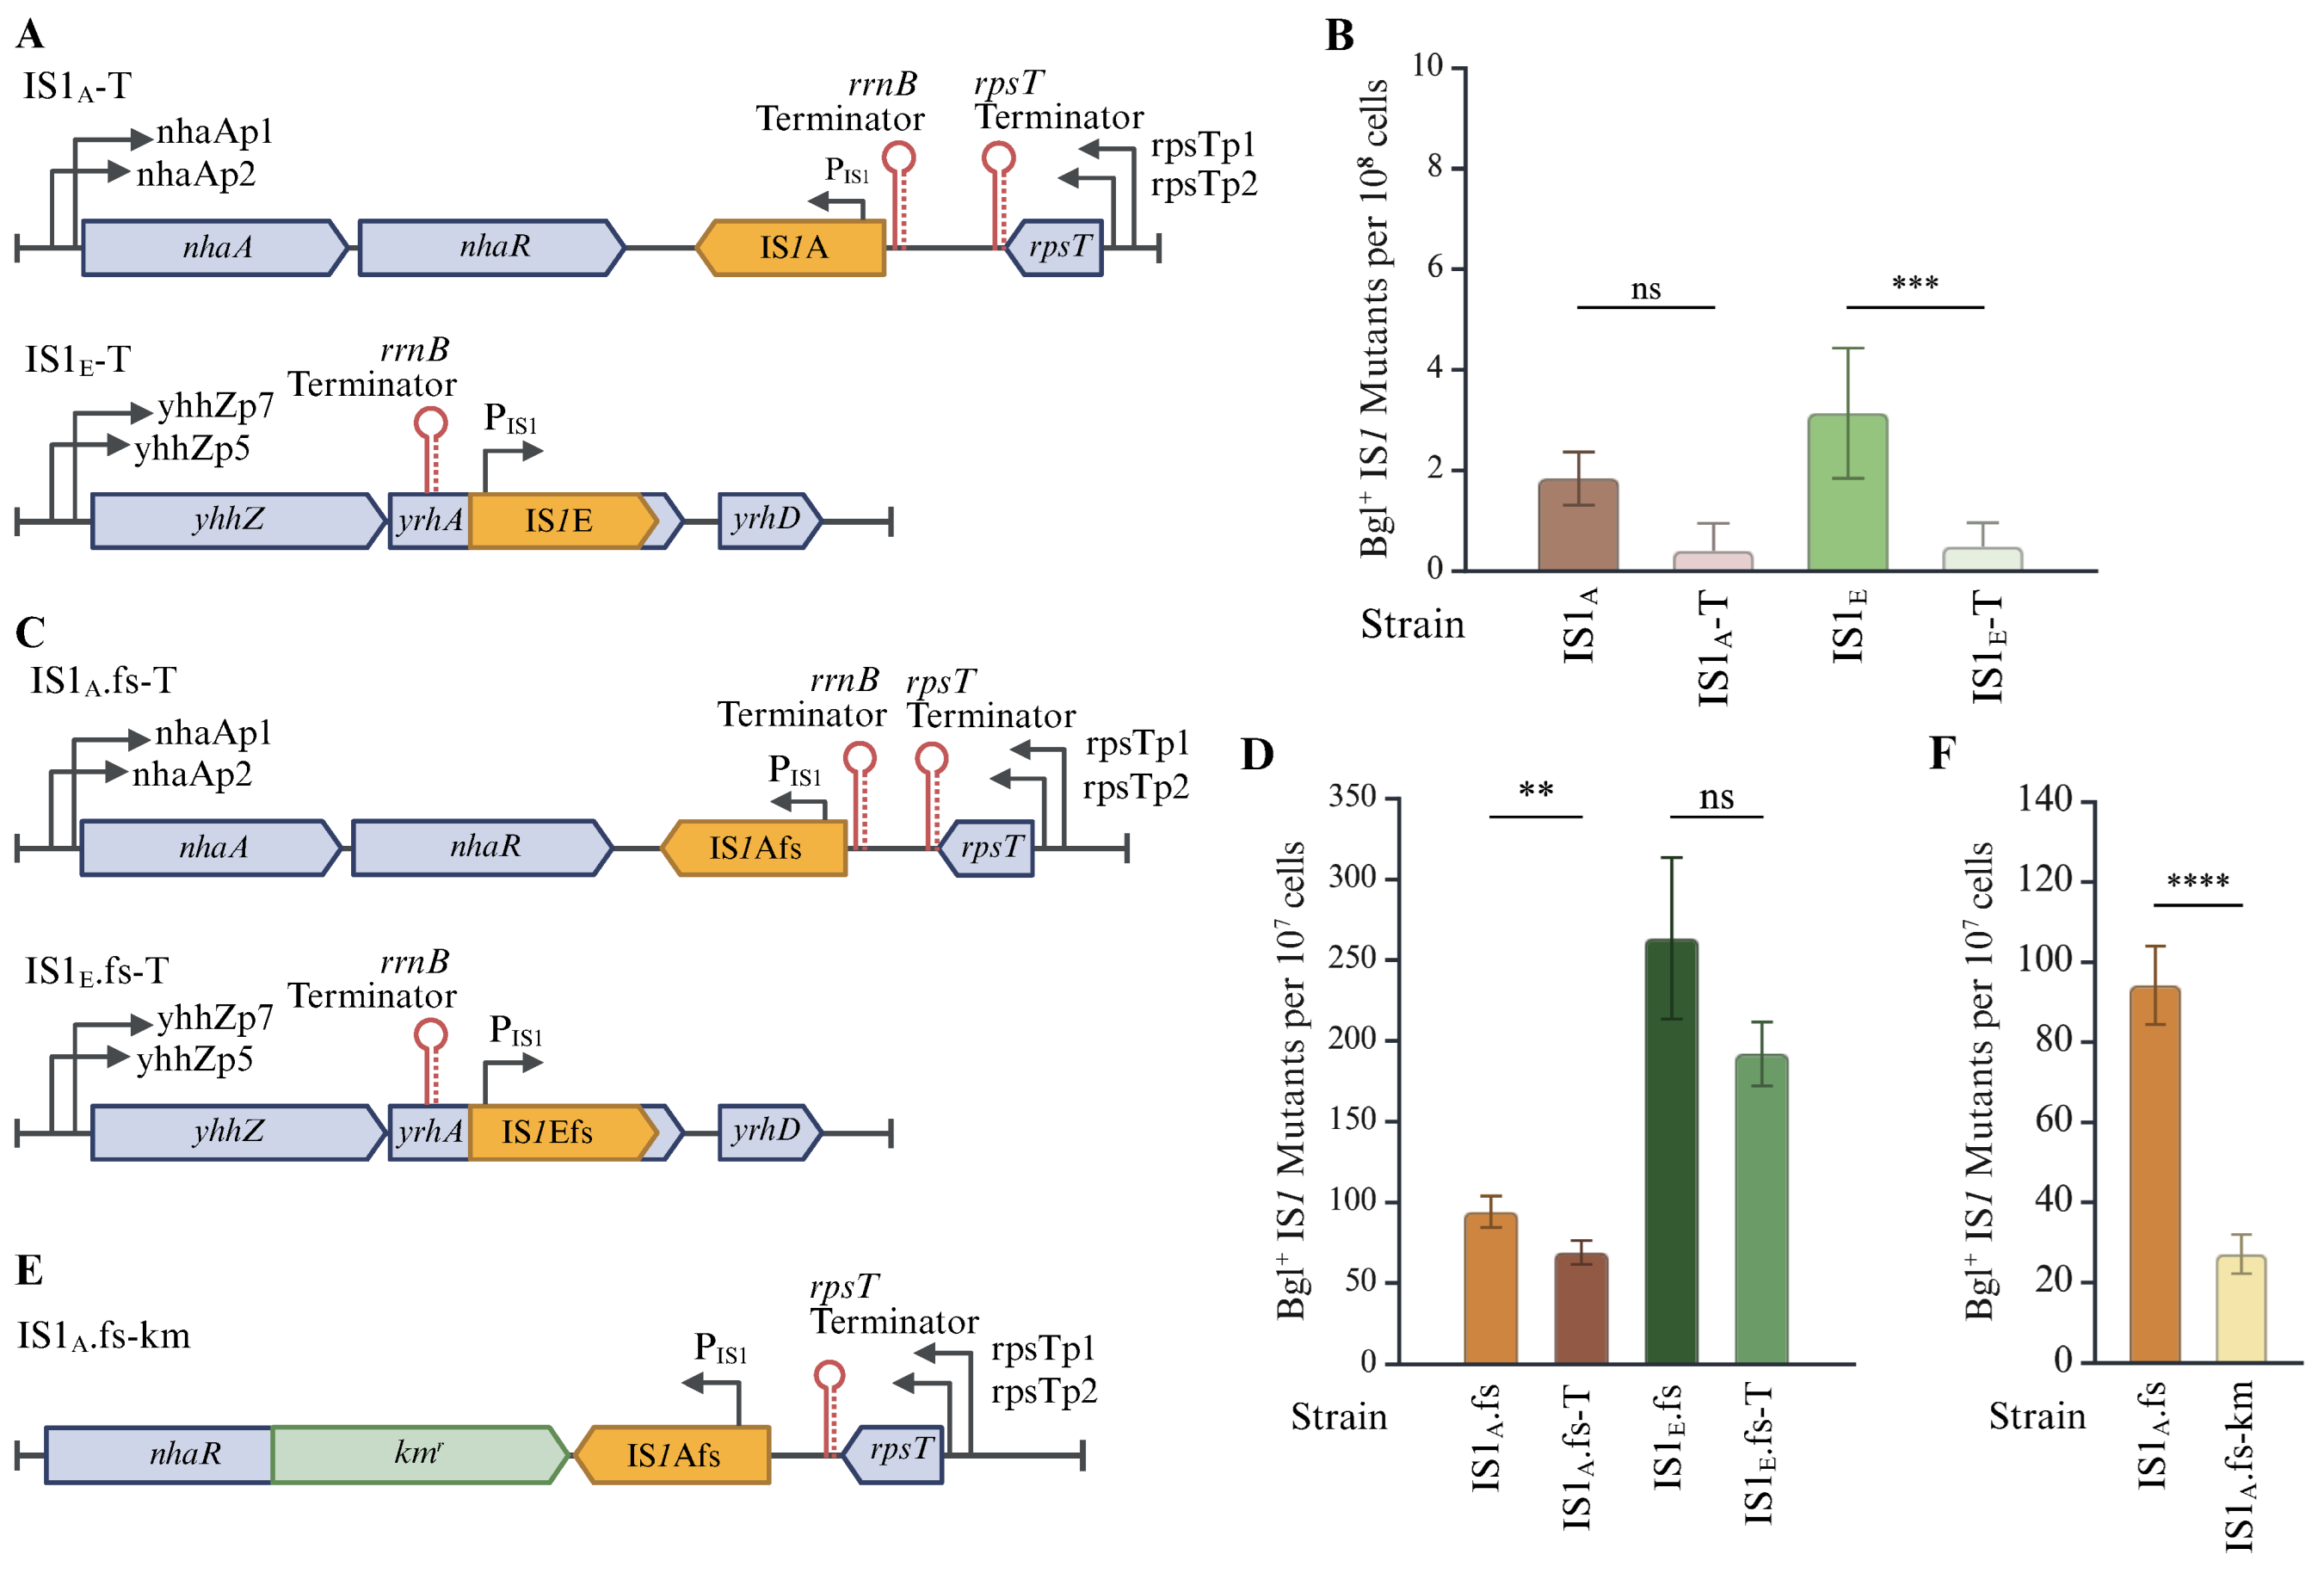
For a more exact look at whether overflowing transcription from upstream genomic regions influenced IS1 transposition, a strong terminator, the rrnB terminator (rrnBT), was added directly upstream of IS1A and IS1E in two native strains to create IS1A-T and IS1E-T (Figure 7A). The presence of rrnBT (conceivably blocking upstream transcription through the insAB’ gene) significantly brought down the frequencies of IS1 insertion into the bglGFB operon (Figure 7B), consistent with the previous observation that genomic DNA contexts positively impacted insAB’ transcription (Figure 6D).
Since the levels of transposition for IS1A-T and IS1E-T were so low, further confirmation was sought using the induced-frameshift versions of these two strains. The same rrnBT was inserted upstream of IS1Afs and IS1Efs to create IS1A.fs-T and IS1E.fs-T (Figure 7C). As can be seen in Figure 7D, IS1 transposition activity was moderately reduced by about 30% in these two frameshift-induced strains by blocking upstream transcription, confirming that the rrnB terminator does have an inhibitory effect. These results are consistent with the previous observation that genomic DNA contexts positively impact insAB’ transcription (Figure 6D).
To determine the possible effect of downstream regions on IS1 transposition, a 1.2 kb kmr tag was inserted downstream of the IS1Afs element in strain IS1A.fs to create IS1A.fs-km (Figure 7E). The kmr gene, oriented in the opposite direction as insAB’, provided a sizable interruption to the region. Bgl+ mutation assays were performed to evaluate whether such a genomic disruption would affect IS1 transposition frequency, comparing IS1A.fs-km and IS1A.fs. The downstream region disruption by insertion of a kmr tag resulted in a 3× reduction in IS1Afs transposition activity (Figure 7F), indicating that the downstream genomic DNA is important for IS1 transposition.
Summarizing the above results, the following conclusions can be drawn: (i) the same IS1 element can transpose at different frequencies when situated at different chromosomal loci; (ii) upstream genomic regions can help to promote transcription of IS1 by transcribing across the downstream transposase gene insAB’; (iii) downstream regions are important for IS1 transposition as well, potentially by assisting formation of transpososomes; and (iv) different genomic contexts seem to affect IS1 transposition using different mechanisms.

2.6. IS1 Mainly Uses a Replicative Mechanism for Transposition Within the Genome

DDE-type transposases are capable of both replicative and non-replicative transposition [38]. The IS1 transposase (a DDE transposase) has been speculated to transpose non-replicatively [35] but observed to transpose primarily replicatively [30]. Several studies have made these observations based on intermolecular (plasmid to genome or plasmid to plasmid) transposition [30,39] as opposed to intramolecular transposition. Given the lack of definitive answers, the mechanism being employed in this study during intrachromosomal transposition under stress-induced conditions was identified.
IS1 transposed only using the replicative mechanism in this study. To come to this conclusion, independent IS1 insertional mutants derived from strains IS1A, or IS1AE via Bgl+ and FZD+ mutation assays were used to examine whether the original element(s) was/were still present in its/their native location(s). If present, the mechanism must have been replicative, and if not, the mechanism must have been non-replicative. 176 new IS1-mediated mutants (involving 117 Bgl+ mutants and 59 FZD+ mutants), which were derived from three distinct parental strains carrying one or two IS1 elements, were examined and all had the original IS1 elements situated in their native loci (Figure 8A–C), clearly demonstrating that all these new insertional events resulted from replicative transposition.
To further support the above conclusion, the same procedure was followed for another 34 IS1 insertional Bgl+ mutants from two frameshift-induced strains (IS1E.fs and IS1A.fs) which transposed at higher frequencies. Again, all samples examined retained the original IS1 elements at their native loci (Figure 8D). These data provide strong evidence that IS1 (primarily) employs a replicative mechanism for intra-chromosomal transposition, regardless of the level of transposase present in the cell. Therefore, the replicative mechanism is IS1’s dominant mode for all types of transposition, either intermolecular or intramolecular. However, our results cannot rule out the possibility of non-replicative transposition occurring under all conditions.

3. Discussion

As a model transposable DNA element, IS1 transposition and its regulation have been extensively investigated in the past decades. However, most research has focused on the regulatory mechanisms behind IS1 transposition into its target site (recipient site) during intermolecular transposition [29,30,31,40,41]. While regulation at the target site is important, the multi-level regulation at the donor site (which provides the IS1 element) also plays a critical role that has been largely overlooked. Thus far, little is known about how the internal nucleotide sequences, both transcriptional and translational controls, and the genomic contexts that flank the IS1 element, collectively influence transposition activity within a bacterial genome. In this study, we reveal that intrinsic nucleotide sequences are vital for efficient IS1 transposition from one chromosomal location to another. Transposition is tightly regulated by InsA-mediated transcriptional control and ribosomal frameshift-mediated translational control, both of which repress transposition activity about 1000-fold. Lastly, genomic contexts flanking the element efficiently impact IS1 transposition either by promoting transcription of the transposase gene or possible by facilitating formation of the transpososomes. To the best of our knowledge, most of these discoveries had not been shown previously on IS1 intra-genomic transposition. In addition to E. coli strains, IS1 elements are widely present not only in other eubacteria but also in archaea, especially in multiple-antibiotic resistant clinical isolates [42,43]. Similar ribosomal frameshift events are known to occur in the members of the IS3, IS5 and IS150 families [44,45]. The regulatory mechanism governing IS1 transposition, elucidated in this study, would likely be applicable to other IS elements, regardless of their origins.
We showed that two out of the six IS1 elements, IS1E and IS1A, present in E. coli strain BW25113, are capable of regular transposition within the genome. These two elements share the same nucleotide sequence, termed the consensus sequence in the present study. The remaining four elements, IS1B, IS1C, IS1D and IS1F, maintaining 90.5% to 98.8% similarity to the consensus sequence (Figure 2A and Figure S2), are incapable of transposing, or transpose at extremely low rates in their native states. There are several possible reasons why these non-consensus sequence IS1 elements lose their transposing ability. Sequence analyses revealed that several nucleotide substitutions present in IS1B, IS1C, and IS1D, and many in IS1F bring about the changes in corresponding amino acid residues, likely giving rise to non-functional or less-functional transposases. For example, the L81F mutation (present in 3 non-cons elements), is situated in the HTH DNA-binding domain, thereby perhaps limiting transposase activity. As introduced earlier, native IS1 elements synthesize little transposase due to immensely tight control [21] and low promoter activity [17]. Therefore, the low amounts of transposases produced by other elements such as IS1E and IS1A may be insufficient to transpose the non-consensus sequence elements. Furthermore, and potentially more importantly, it has been reported that IS1 transposases only function efficiently in cis at their native levels [40], being biased to transpose the element that produces the enzyme [46]. Further study into how the non-consensus sequence IS1 elements respond to larger amounts of transposase would reveal more insight into their transposition. Alternatively, the chromosomal DNA regions surrounding these four elements may somehow prevent their transposition, perhaps by impeding the assembly of transpososomes, as other host regulatory factors influencing transposition, like IHF [17,47,48] and HN-S [49], have been shown to be involved. Lastly, our current experimental conditions may disfavor transposition of these IS1 elements. Future studies would be needed to investigate the mechanistic details that prevent these four IS1 elements from transposing. Alternatively, one might look at the appropriate environmental conditions favoring their transposition.
Our work showed that a 1 bp insertion plus 1 bp substitution into the “slippery” A6C motif near the 3′ end of insA led to an about 1000-fold greater level of transposition. Such a dramatic increase appears to be attributable to the maximal production of the transposase since the rare -1 frameshift is not necessary for InsAB’ synthesis and the InsA repressor is not produced. Several reports revealed that the ratio of InsA to InsAB’, not the absolute levels of IS1 transcripts, determine the frequencies of transposition [18,50]. For a native IS1 element to produce InsAB’, ribosomes must exercise a -1-frameshifting event at the A6C motif of the IS1 transcripts [50]. While the slippery A6C region is required for the frameshift, a pseudoknot (roadblock) structure formed by a folded downstream segment may also facilitate the frameshift by stalling the ribosome [51]. Therefore, the level of InsAB’ would be exclusively dependent on the frequency of this ribosomal frameshift and influenced by a pseudoknot once the IS1 transcripts become available. Using a plasmid system expressing insAB’, Chandler et al. reported that the -1-frameshifting event occurred in about 2% of the IS1 transcripts [18], indicative of a rare frequency of the frameshift. Ideally, a more precise approach measuring the frameshift efficiency would be to employ a sensitive translational fusion system on the chromosome, with an out-of-frame reporter gene (such as lacZ) fused to the 3′ end of a stop codon-less insAB’ gene (with its native promoter or a strong constitutive promoter). In addition to these cis-regulatory factors (slippery sequence and roadblock structure), the efficiency of -1 frameshift is modulated by cellular trans-acting factors such as proteins and micro-RNAs [52] as well as non-cellular factors such as antibiotics [53] in prokaryotic organisms. Future studies will be directed towards identifying both cellular and non-cellular factors that affect the efficacy of frameshifting and explore how these factors impact ribosomal frameshifts on the A6C motif of IS1.
Expression of insA driven by Ptet at a separate chromosomal locus (intS) nearly abolished the intragenomic transposition of not only native-state IS1 elements but also the frameshift-induced elements (therefore maximally expressing insAB’). These results indicate that InsA, sharing the DNA-binding domain with InsAB’, is an incredibly efficient, competitive repressor, not only minimizing IS1 transcription but also outcompeting InsAB’ for binding to both IRL and IRR of IS1. Meanwhile, it is worth noting that Ptet is a stronger promoter than the native IS1 promoter PIS1, which mediated synthesis of a greater than normal amount of InsA, thus strengthening its inhibitory capability.
In the case of any native IS1, PIS1 and InsA comprise an autorepression system since PIS1 drives insA (and insAB’) transcription, and meanwhile InsA represses PIS1. The actual titration for the insA/insAB’ transcription is not clear since the inducer that releases InsA from PIS1 is unknown. To titrate insA expression (thus varying IS1 transposition), we used the established Ptet/TetR system, in which insA is driven by Ptet while TetR (which was constitutively expressed) represses Ptet, and its binding to Ptet is released by adding the inducer clTc. Using this system, IS1 transposition frequencies were successfully titrated, with the larger amounts of InsA leading to less frequent IS1 transpositions. On the other hand, the addition of a large amount (200 ng/mL) clTc only reduced the frequency of IS1 insertion by 2.5-fold (Figure 5E). This was expected because not enough InsA was produced due to the strong repression of Ptet (driving insA) by TetR. A greater transposition reduction could have resulted by adding more clTc, but any levels higher than 200 ng/mL would be toxic to the cells. To improve the Ptet/TetR system, a weaker promoter could be used to drive tetR, which would yield higher levels of InsA, thus, more efficiently repressing IS1 transposition.
Recently, upstream genomic contexts have been shown to exert appreciable effects on transposition of IS5 by promoting its transposase gene transcription [33,54], another DDE-type IS element that does not have a self-repressor, nor its own complete promoter [55]. A similar stimulatory effect was observed for IS1 in this work. We first showed that IS1E transposed more frequently than IS1A (Figure 6B) although these elements carry the same consensus sequence (Figure 2A). Using a transcriptional lacZ reporter, we showed the upstream genomic region increased the levels of IS1 transcription for both IS1Efs and IS1Afs, with more transcripts observed for IS1Efs than for IS1Afs (Figure 6D). These observations were confirmed by introducing a strong rrnB terminator (rrnBT) to block the upstream transcription (Figure 7B,D). Considering the similar effects found for both IS5 and IS1, elevating transposase levels by transcribing through the downstream elements seems to be a common mechanism by which upstream host DNA segments affect transposition. A similar effect was observed for IS1 inter-plasmid transposition, in which the transcripts of an upstream antibiotic-resistance gene were read through into the IS1 sequence [56]. These observations are not surprising since most IS elements carry either weak or incomplete promoters driving their transposase genes [46,54,55,57].
Comparing the upstream DNA regions, there are two promoters (yhhZp5 and yhhZp7) that drive the yhhZ/yhhA operon and possibly the insAB’ gene of IS1E, as these genes are oriented in the same direction, and no terminator is present in the entire region (Figure 4A). However, there is a strong terminator present upstream of IS1A, which conceivably blocks the rpsT promoter from transcribing through the downstream IS1 element (Figure 6A). The presence of different genomic contexts likely account for the observed discrepancy in transcription and transposition between two identical IS1 elements (IS1E and IS1A). It would be interesting to determine if deleting the rpsT terminator has a positive effect on IS1A transposition. An increase in transposition would further indicate that upstream transcription levels can influence IS1 transposition.
Disruption of the downstream region by insertion of a kmr gene decreased IS1A transposition by over 3-fold (Figure 7F), indicating that the downstream genomic DNA is another genomic factor affecting IS1 transposition. This effect should have nothing to do with the increased IS1 transcripts. Instead, this downstream region adjacent to IS1 may facilitate formation of the transpososome (critical for transposition), a nucleoprotein complex consisting of IS1 and its transposase (and possibly some host factors such as IHF) [54,58,59]. Little information is available for formation of IS1 transpososomes. Disruption of the downstream region will likely limit the transposase (and the host factors) to access the region, thus disfavoring transpososome formation. These observed genomic impacts on IS1 transposition are particularly noteworthy given the lack of prior experimental work involved in exploring any possible relationships between transposition of IS elements and their surrounding genomic DNA factors. To further test this model, different and additional edits could be made to the genomic regions surrounding both IS1A and IS1E. For example, to see if the downstream region has similar effects on other IS1 elements, the same kmr gene can be inserted downstream of IS1E. Other alterations, like adding a strong promoter, might also provide insight into the extent to which the genomic context may have on transposition rates.
IS1 transposases are highly efficient in transposing IS1 elements. Therefore, a stringent regulation of transposase production is critical to the host as frequent or deregulated transpositions are harmful due to inactivation of essential genes and abnormal alteration of genome stability, most likely leading to cell death. Stress-induced mutations are usually beneficial to bacterial cells, aiding them to survive harsh environments. During the past decade, increasing evidence has been provided to demonstrate that IS1-mediated mutations usually occur in response to specific environmental conditions such as starvation, and its transposition frequencies are under the control of host DNA-binding proteins and DNA structures [15,60,61,62]. An example of such stress-induced mutation takes place at the usually silent bglGFB operon, where IS1 insertion leads to a positive β-glucoside growth (Bgl+) phenotype and preferentially occurs in the presence of a β-glucoside such as arbutin or salicin, and no other carbon source is available [63]. Another example involves IS1 insertion into the flhDC regulatory region, which occurs preferentially within soft agar but not on hard agar or in liquid media and allows for the “swarming” phenotype [64,65,66]. Lastly, the nfsA and nfsB genes code for oxygen-insensitive nitroreductases, converting furazolidone into a toxic compound active against bacteria. When nfsA is lacking, IS1 can transpose into nfsB in the presence of furazolidone, leading to a furazolidone resistance phenotype (FZD+) [7]. These observations support the notion that environment-directed, protein-regulated IS1 transpositions provide an advantage to host cells, enabling them to adapt to adverse conditions.
It is known that IS1 transposition, either inter- or intramolecularly, can readily cause bacterial resistance to commonly used antibiotics by disrupting the native genes that encode proteins necessary to detoxify toxic compounds [7], or activating endogenous drug resistance genes by creating fusion promoters [13,14]. By flanking the cat gene (encoding a chloramphenicol acetyltransferase), two complete and identical IS1 elements can noticeably mobilize cat from a Tn9 plasmid into the chromosome, conferring bacterial resistance to chloramphenicol [67]. Our ongoing preliminary studies reveal that a miniIS1, composed of a cat gene flanking by IS1’s inverted repeats (IRL and IRR), is capable of transposition within the E. coli genome. Together, these findings suggest a crucial role of IS1 elements in both the emergence of multidrug resistance and the spread of antibiotic resistance genes among bacterial populations, especially in clinical isolates. Expression of the transposase gene (insAB’) is strictly regulated both transcriptionally (mediated by InsA) and translationally (mediated by ribosomal frameshift). Conceivably, any cellular or non-cellular conditions able to compromise such as stringent control would elevate IS1’s capability in developing and spreading drug resistance in bacterial cells. Part of these conditions include (i) a small cellular compound or metabolite produced under a specific condition may release InsA from the IS1 promoter; (ii) a stress condition, such as the presence of UV, high temperature or starvation, may yield frequent point mutations on IS1 elements, leading to the constitutive ribosomal frameshift and/or less InsA production; and (iii) some DNA-binding proteins or small RNAs, when available, may stabilize the pseudoknot structure near the poly-A tract, facilitating the ribosomes to perform the frameshift at the A6C motif. A better understanding of the mechanistic details for IS1 transposition would help to develop new strategies to combat IS1-mediated multidrug resistance in clinical bacterial isolates.
In summary, we have demonstrated that endogenous IS1 nucleotide sequences, intrinsic transcriptional and translational regulators, and the surrounding genomic contexts all significantly influence IS1’s transposition activity. Our findings highlight the complex relationship between sequence integrity, regulatory mechanisms, and genomic environment in modulating IS1 mobility. Notably, these findings reveal a previously uncharacterized sensitivity of IS1 transposition to genomic context. As transposable elements play critical roles in genome evolution and plasticity [1,68], understanding the factors that influence their activities remains a key priority. Future work will be necessary to further elucidate the molecular basis of these effects described above and assess their relevance across diverse genomic backgrounds. The findings revealed from the current work and further future work in this field will help refine our understanding of the tight and elegant regulation of IS elements activities.

4. Materials and Methods

4.1. E. coli Strains and Growth Conditions

Strain ZZ255, derived from E. coli K12 strain BW25113 [69], was used as the wildtype strain, in which four major copies of IS5 (at nmpC, wbbL, yejO, and gltI/lnt) and the lacI/lacZ/lacY genes were deleted [33]. All other strains used in this study were derived from this strain, and they are described in (Table S1).
Bacterial strains were routinely cultured in LB media at 30 °C or 37 °C. For the β-glucoside growth (Bgl+) mutation assay, minimal medium M9 with 0.5% (w/v) β-glucoside as the sole carbon source was used. For furazolidone growth (FZD+) mutation assay and swarming (SWM+) mutation assay, LB media with appropriate alterations was used. For β-glucosidase assays, M9 with 0.5% glycerol was used. The 10 × M9 salt solution (per liter) contained 60 g of Na2HPO4, 30 g of KH2PO4, 10 g of NH4Cl, and 5 g of NaCl. After diluting to 1× M9 medium, it was supplemented with 1 mM MgSO4 and 0.1 mM CaCl2. When necessary, ampicillin (Ap), kanamycin (Km), and chloramphenicol (Cm) were added to the media at 100 μg/mL, 25 μg/mL, and 10 μg/mL, respectively.

4.2. Deletions of IS1 Elements from Chromosome

There are six IS1 elements, classified as four different types based on their nucleotide sequences, across the chromosome of strain BW25113 at loci yrhA, nhaR, yjhU, argF, afuB, and gfcA, respectively. Using the Lambda Red approach [69], these elements were individually deleted by replacing the element with a kanamycin resistance gene (kmr). Briefly, the kmr gene flanked by FRT sequences was PCR amplified from pKD13 plasmid using a pair of chimeric oligos (Table S2), purified via gel electrophoresis and then electroporated into ZZ255 cells expressing Lambda Red proteins to replace the IS1 element of interest via homologous recombination. Successful substitutions of kmr for the IS element led to Km resistant phenotypes. Several Km-resistant colonies were subject to PCR verification. To remove the FRT-flanked kmr gene, pCP20, coding for FLP recombinase, was introduced via electroporation, leaving behind an 85 bp FRT scar. These steps yielded six single IS1 deletion mutants.
To combine multiple IS1 deletions into one strain, we first used P1 transduction followed by flipping out the kmr gene and this two-step cycle was repeated until the desired deletion strains were achieved. Individual P1 phages were prepared using six single IS1 deletions strains as the donor strains, each with an FRT-flanked kmr gene in place of the target IS1. The standard P1 transduction approach was conducted to move an IS1 deletion of interest into the Km-sensitive recipient strain [70].
To make IS1A, every other copy of IS1 besides IS1A was removed with the above “P1 transduction/the kmr gene “flipping-out” strategy such that only the copy of IS1 at nhaR remained. To make IS1E, every other of IS1 copy besides IS1E was removed such that only the copy of IS1 at yrhA remained. To make IS1AE, four elements (IS1B, IS1C, IS1D and IS1F) (all except IS1A and IS1E) were deleted. To make ∆IS1, all IS1 elements were deleted. Finally, to make ∆IS1cons, IS1A and IS1E were deleted (Table S1).

4.3. Construction of IS1fs at yrhA Locus and IS1fs at the nhaR Locus

To synthesize the transposases necessary for transposition, the ribosome must perform -1 translational frameshift at the A6C motif present in the middle of IS1 transcripts. Without such frameshift, IS1 only encodes InsA, the repressor for insA and insAB’. To see the effect of non-frameshift translation on IS1 transposition, the 1st “A” at the A6C motif was altered to “G”, and another “G” was inserted between the 3rd and 4th “A” in the A6C motif in IS1E located at the yrhA locus.
To make such A6C to GA2GA3C alterations in strain IS1E (retaining IS1E alone), a 400 bp genomic region, located at −463 To +95 relative to the 3’ end of IS1E, was first replaced by a kmr gene amplified from the plasmid pKD13 [69] using primers IS1-fs-P1 and yrhD-fs-P2 (Table S2). The kmr gene was flipped out by pCP20 leaving an 85 bp FRT scar to create the intermediate strain IS1E.fs-int1.
A 471 bp 3′ region of insAB’, harboring the modified A6C motif “GAAGAAAC” at the 5′ end, was PCR amplified using primers IS1-gg-F and yrhA-gg-R. Meanwhile, the kmr gene was amplified from pKD13 using primers yrh-km-F and yrhD-fs-P2. These two fragments were fused together by PCR using primers IS1-int-F and yrhD-fs-P2. The resultant combined fragment was electroporated into the cells of IS1E.fs-int1 to replace the 85 bp FRT scar, yielding IS1E.fs-km, in which the modified IS1 element, named IS1E.fs, no longer encodes the repressor InsA, and instead directly encodes the InsAB’ transposase. The gene was flipped out from IS1E.fs-km, yielding strain IS1E.fs.
Using a similar approach as described above, strains IS1A.fs-km and IS1A.fs were created with strain IS1A (retaining IS1A only), in which IS1A.fs at the nhaR locus directly encodes InsAB’ but not InsA, the repressor for insA/insAB’ transcription (Table S1).

4.4. Construction of Ptet Driving insA at the intS Locus

To construct Ptet driving the repressor gene insA, the DNA region, located between +56 and +331 with regard to the 5′ end of IS1, was first amplified from IS1AE genomic DNA using primers Ptet-AB-F and insA-int-P2 (Table S2). The amplified insA was linked to the 3′ end of the “kmr:rrnBT:Ptet” cassette by fusion PCR using primers intS-km-P1 and insAB-int-P2. The fusion product kmr:rrnBT:Ptet-insAB was chromosomally integrated to replace intS, yielding WT–InsA, in which Ptet drives the transcription of insA at the intS locus. This construct was transferred to IS1E, IS1E.fs, and IS1AE.fs to create IS1E-InsA, IS1E.fs-InsA and IS1AE.fs -InsA.
To titrate insA expression, we transferred the tetR expression module (a strong constitutive promoter driving tetR at the attB site) [17] to strain IS1E.fs-InsA, yielding strain IS1AE.fs-AR. Titrated expression of insA is subject to the amount of the inducer, clTc (chlor-tetracycline), added to the media. Increasing amounts of clTc led to higher levels of insA expression, thus less frequent IS1 transposition.

4.5. Construction of Transcriptional Reporters Using lacZ

To quantitate IS1 transcription, a lacZ transcriptional reporter was constructed. The “lacZ:cat” cassette (composed of a promoter-less lacZ structural gene and a chloramphenicol-resistant gene cat with its promoter) plus its upstream lacZ ribosome binding site (RBS) was amplified from the genomic DNA of strain ZZ204 [71] using primers IS1-Z-P1 and yrhD-cat-P2 (Table S2). Using the Lambda-Red system, the amplified DNA fragments (that is, the “lacZ:cat” cassette plus lacZ’s RBS) was integrated immediately downstream of the stop codon TAA of the insAB’ gene in strains IS1A.fs and IS1E.fs to replace the 15 bp IRR region of IS1 and a short genomic region following the IS1 element. This yielded two transcriptional operon reporter strains: IS1A.fs and IS1E.fs, in which insAB’ and lacZ formed an operon and its transcription was driven by PIS1. In each of these reporter, two separate proteins, InsAB’ and LacZ, were made, and the latter can be quantitated by β-galactosidase assays.

4.6. Addition of rrnB Terminator

Using the aforementioned Lambda Red approach, a strong terminator, the rrnB terminator, was added directly upstream of IS1A in strains IS1A and IS1A.fs. The selection markers were subsequently flipped out by pCP20, creating strains IS1A.fs-T and IS1A-T, respectively (Table S1). Similarly, strains IS1E-T and IS1E.fs-T were made by inserting the rrnB terminator upstream of IS1 in strains IS1E and IS1E.fs, respectively. The presence of the terminator would prevent upstream transcription from contributing to IS1 transposase transcription.

4.7. β-Glucoside Growth Mutation (Bgl+) Assay

This mutation assay was the primary method for quantifying IS1 transposition frequency/activity for our experimental strains, performed as previously reported by our group and others [17,33,60]. The assay was conducted on minimal M9 agar plates with 0.5% salicin (a β-glucoside) as the only carbon source. Prior to plating-day (Post-plate Day 0), these M9/Salicin plates were prepared by autoclaving a 1.68% water-agar solution, after which the appropriate amount of 10× M9 salts and 5% Salicin were added to create a final solution of 1.5% agar and 0.5% salicin. Plates were poured the same day, 25 mL of agar solution per plate. Early on plating-day, a fresh colony from each experimental strain was cultured in LB liquid media in a 37 °C water shaking bath for about 8 h. After the OD600 was measured, the cells were washed twice using 1× M9 salt (carbon source-free) and diluted to the plating concentration and applied onto agar plates (2 × 10⁷ or 2 × 10⁶ cells per plate depending on the strain). At least four plates were used for each strain in each experiment. The same experiment was repeated at least twice. The plates were then incubated in a 30 °C incubator and were examined daily for the appearance of Bgl+ colonies, with each colony representing a new Bgl+ mutation. Any colonies appearing prior to day 2 post-plating were considered to be Bgl+ cells initially applied onto the plates and thus subtracted from the subsequent measurements. The background populations (total number of Bgl cells) were determined as previously [72,73,74]. The frequency of Bgl+ mutations were determined by dividing the total Bgl+ colonies by the number of Bgl cells plated and normalized to Bgl+ mutations per 108 cells at any given time point.

4.8. Swarming Mutation (SWM+) Assay

This mutation assay was used as a secondary method to measure IS1 transposition frequencies in our experimental strains, performed following a previously documented approach [66]. On plating-day, a fresh colony from each experimental strain was cultured in LB liquid media in a 37 °C water shaking bath for about 8 h. LB soft agar (0.3% w/v) plates were prepared and were used in the same plating-day. Once ready, the culture was washed once with 1× M9 salts and diluted to an OD600 of 1.0. Three separate injections of 1.5 µL of the cell suspension were inoculated into one LB semisolid agar plate, each containing 1.5 × 10⁶ cells. At least four plates were used for each assay replication. The plates were incubated at 30 °C for 22 h. The SWM+ mutants were represented by outgrowths of motile subpopulations from the injection sites and counted.

4.9. Furazolidone Resistance Mutation (FZD+) Assay

This mutation assay required prior mutation of the nfsA gene, which was either acquired from previous studies [60] or made via P1 transduction.
This mutation assay was used as another secondary method to quantifying IS1 transposition frequencies, performed following a previously recorded approach [66]. Prior to plating-day (Post-plate Day 0), LB + FZD (6.5 μg/mL) agar plates were prepared. Cell suspensions used for plating were prepared as for Bgl+ mutation assays and were applied onto agar plates at 108 cells per plate. The plates were incubated in a 30 °C incubator and were examined daily for the appearance of FZD+ colonies, with each colony representing a new FZD+ mutation. The frequencies of FZD+ mutations were determined by dividing the total FZD+ colonies by the number of FZD cells plated and normalized to FZD+ mutations per 108 cells at any given time point.

4.10. β-Galactosidase Assay

β-galactosidase assays were conducted as previously reported [54]. Briefly, test strains were cultured in M9 glycerol minimal media. During the exponential growth phase, fives samples per strain were collected in an OD600 range of 0.2 to 1.0. The experiment was repeated at least twice. β-galactosidase activity for each sample was measured using o-nitrophenyl-β-D-galactopyranoside (β-ONPG) as the substrate. The slope of β-galactosidase activities versus the collected OD600 values for each sample represents the reporter strain activity.

4.11. Statistical Analysis

All IS1 mutation frequency data are expressed as the mean ± standard deviation (SD). Mutation frequencies were calculated in Google Sheets. Statistical significance was tested by either Welch’s or unpaired t-test (for 2 treatments) or a Welch’s or regular one-way ANOVA followed by Tukey multiple comparisons test, Games-Howell multiple comparisons test or Dunnett T3 multiple comparisons test, or a Kruskal–Wallis with Dunn’s multiple comparisons test (for ≥3 treatments) using BioRender. Details of the statistical tests used are indicated in each figure legend. All figures and figure panels were created in BioRender; https://BioRender.com. NS denotes no significance and indicates a p-value ≥ 0.05; * indicates a p-value < 0.05; ** indicates a p-value < 0.01; *** indicates a p-value < 0.001; and **** indicates a p-value < 0.0001.

Supplementary Materials

The following supporting information can be downloaded at: https://www.mdpi.com/article/10.3390/ijms26178375/s1.

Author Contributions

Conceptualization, Z.Z. and M.H.S.J.; methodology, S.S. and Z.Z.; investigation, S.S., A.H., Z.Z., T.K. and J.O.; data curation, S.S. and Z.Z.; statistical analysis, S.S.; writing—original draft preparation, S.S. and Z.Z.; writing—review and editing, Z.Z., S.S. and M.H.S.J.; supervision, Z.Z. and M.H.S.J.; funding acquisition, M.H.S.J. All authors have read and agreed to the published version of the manuscript.

Funding

This research was funded by NIH grant 1R01GM077402-04 and private contributions to M.H.S.J.

Institutional Review Board Statement

Not applicable.

Informed Consent Statement

Not applicable.

Data Availability Statement

The data presented in this study are available upon request from the corresponding authors.

Conflicts of Interest

The authors declare no conflicts of interest.

References

  1. Siguier, P.; Filée, J.; Chandler, M. Insertion Sequences in Prokaryotic Genomes. Curr. Opin. Microbiol. 2006, 9, 526–531. [Google Scholar] [CrossRef]
  2. Ooka, T.; Ogura, Y.; Asadulghani, M.; Ohnishi, M.; Nakayama, K.; Terajima, J.; Watanabe, H.; Hayashi, T. Inference of the Impact of Insertion Sequence (IS) Elements on Bacterial Genome Diversification through Analysis of Small-Size Structural Polymorphisms in Escherichia coli O157 Genomes. Genome Res. 2009, 19, 1809–1816. [Google Scholar] [CrossRef] [PubMed]
  3. Jespersen, M.G.; Hayes, A.J.; Tong, S.Y.C.; Davies, M.R. Insertion Sequence Elements and Unique Symmetrical Genomic Regions Mediate Chromosomal Inversions in Streptococcus Pyogenes. Nucleic Acids Res. 2024, 52, 13128–13137. [Google Scholar] [CrossRef]
  4. Ngan, W.Y.; Parab, L.; Bertels, F.; Gallie, J. A More Significant Role for Insertion Sequences in Large-Scale Rearrangements in Bacterial Genomes. MBio 2024, 16, e0305224. [Google Scholar] [CrossRef] [PubMed]
  5. Wan, Y.; Sabnis, A.; Mumin, Z.; Potterill, I.; Jauneikaite, E.; Brown, C.S.; Ellington, M.J.; Edwards, A.; Sriskandan, S. IS1-Related Large-Scale Deletion of Chromosomal Regions Harbouring the Oxygen-Insensitive Nitroreductase Gene NfsB Causes Nitrofurantoin Heteroresistance in Escherichia coli. Microb. Genom. 2023, 9, 001102. [Google Scholar] [CrossRef]
  6. Aubert, D.; Naas, T.; Héritier, C.; Poirel, L.; Nordmann, P. Functional Characterization of IS1999, an IS4 Family Element Involved in Mobilization and Expression of Beta-Lactam Resistance Genes. J. Bacteriol. 2006, 188, 6506–6514. [Google Scholar] [CrossRef]
  7. Whiteway, J.; Koziarz, P.; Veall, J.; Sandhu, N.; Kumar, P.; Hoecher, B.; Lambert, I.B. Oxygen-Insensitive Nitroreductases: Analysis of the Roles of NfsA and NfsB in Development of Resistance to 5-Nitrofuran Derivatives in Escherichia coli. J. Bacteriol. 1998, 180, 5529–5539. [Google Scholar] [CrossRef] [PubMed]
  8. Lipszyc, A.; Szuplewska, M.; Bartosik, D. How Do Transposable Elements Activate Expression of Transcriptionally Silent Antibiotic Resistance Genes? Int. J. Mol. Sci. 2022, 23, 8063. [Google Scholar] [CrossRef]
  9. Noel, H.R.; Petrey, J.R.; Palmer, L.D. Mobile Genetic Elements in Acinetobacter Antibiotic-Resistance Acquisition and Dissemination. Ann. N. Y. Acad. Sci. 2022, 1518, 166–182. [Google Scholar] [CrossRef]
  10. Łobocka, M.B.; Rose, D.J.; Plunkett, G., 3rd; Rusin, M.; Samojedny, A.; Lehnherr, H.; Yarmolinsky, M.B.; Blattner, F.R. Genome of Bacteriophage P1. J. Bacteriol. 2004, 186, 7032–7068. [Google Scholar] [CrossRef]
  11. Iida, S.; Meyer, J.; Arber, W. The Insertion Element IS1 Is a Natural Constituent of Coliphage P1 DNA. Plasmid 1978, 1, 357–365. [Google Scholar] [CrossRef] [PubMed]
  12. Brügger, K.; Redder, P.; She, Q.; Confalonieri, F.; Zivanovic, Y.; Garrett, R. Mobile Elements in Archaeal Genomes. FEMS Microbiol. Lett. 2002, 206, 131–141. [Google Scholar] [CrossRef] [PubMed]
  13. Prentki, P.; Teter, B.; Chandler, M.; Galas, D.J. Functional Promoters Created by the Insertion of Transposable Element ISI. J. Mol. BioE. 1986, 191, 383–393. [Google Scholar] [CrossRef]
  14. Olliver, A.; Vallé, M.; Chaslus-Dancla, E.; Cloeckaert, A. Overexpression of the Multidrug Efflux Operon AcrEF by Insertional Activation with IS1 or IS10 Elements in Salmonella Enterica Serovar Typhimurium DT204 AcrB Mutants Selected with Fluoroquinolones. Antimicrob. Agents Chemother. 2005, 49, 289–301. [Google Scholar] [CrossRef]
  15. Fan, C.; Wu, Y.-H.; Decker, C.M.; Rohani, R.; Gesell Salazar, M.; Ye, H.; Cui, Z.; Schmidt, F.; Huang, W.E. Defensive Function of Transposable Elements in Bacteria. ACS Synth. Biol. 2019, 8, 2141–2151. [Google Scholar] [CrossRef]
  16. Ton-Hoang, B.; Turlan, C.; Chandler, M. Functional Domains of the IS1 Transposase: Analysis in Vivo and in Vitro. Mol. Microbiol. 2004, 53, 1529–1543. [Google Scholar] [CrossRef] [PubMed]
  17. Kopkowski, P.W.; Zhang, Z.; Saier, M.H., Jr. The Effect of DNA—Binding Proteins on Insertion Sequence Element Transposition Upstream of the Bgl Operon in Escherichia coli. Front. Microbiol. 2024, 15, 1388522. [Google Scholar] [CrossRef]
  18. Escoubas, J.M.; Prère, M.F.; Fayet, O.; Salvignol, I.; Galas, D.; Zerbib, D.; Chandler, M. Translational Control of Transposition Activity of the Bacterial Insertion Sequence IS1. EMBO J. 1991, 10, 705–712. [Google Scholar] [CrossRef]
  19. Giedroc, D.P.; Theimer, C.A.; Nixon, P.L. Structure, Stability and Function of RNA Pseudoknots Involved in Stimulating Ribosomal Frameshifting. J. Mol. Biol. 2000, 298, 167–185. [Google Scholar] [CrossRef]
  20. Ohta, S.; Yoshimura, E.; Ohtsubo, E. Involvement of Two Domains with Helix-Turn-Helix and Zinc Finger Motifs in the Binding of IS1 Transposase to Terminal Inverted Repeats. Mol. Microbiol. 2004, 53, 193–202. [Google Scholar] [CrossRef]
  21. Zerbib, D.; Polard, P.; Escoubas, J.M.; Galas, D.; Chandler, M. The Regulatory Role of the IS1-Encoded InsA Protein in Transposition. Mol. Microbiol. 1990, 4, 471–477. [Google Scholar] [CrossRef]
  22. Siguier, P.; Gagnevin, L.; Chandler, M. The New IS1595 Family, Its Relation to IS1 and the Frontier between Insertion Sequences and Transposons. Res. Microbiol. 2009, 160, 232–241. [Google Scholar] [CrossRef] [PubMed]
  23. Grindley, N.D. IS1 Insertion Generates Duplication of a Nine Base Pair Sequence at Its Target Site. Cell 1978, 13, 419–426. [Google Scholar] [CrossRef]
  24. Hu, M.; Deonier, R.C. Comparison of IS1, IS2 and IS3 Copy Number in Escherichia coli Strains K-12, B and C. Gene 1981, 16, 161–170. [Google Scholar] [CrossRef]
  25. Schneider, D.; Duperchy, E.; Depeyrot, J.; Coursange, E.; Lenski, R.; Blot, M. Genomic Comparisons among Escherichia coli Strains B, K-12, and O157:H7 Using IS Elements as Molecular Markers. BMC Microbiol. 2002, 2, 18. [Google Scholar] [CrossRef]
  26. Karp, P.D.; Billington, R.; Caspi, R.; Fulcher, C.A.; Latendresse, M.; Kothari, A.; Keseler, I.M.; Krummenacker, M.; Midford, P.E.; Ong, Q.; et al. The BioCyc Collection of Microbial Genomes and Metabolic Pathways. Brief. Bioinform. 2019, 20, 1085–1093. [Google Scholar] [CrossRef] [PubMed]
  27. Nesmelova, I.V.; Hackett, P.B. DDE Transposases: Structural Similarity and Diversity. Adv. Drug Deliv. Rev. 2010, 62, 1187–1195. [Google Scholar] [CrossRef] [PubMed]
  28. Hickman, A.B.; Dyda, F. Mechanisms of DNA Transposition. Microbiol. Spectr. 2015, 3, MDNA3-0034–2014. [Google Scholar] [CrossRef] [PubMed]
  29. Machida, Y.; Machida, C.; Ohtsubo, H.; Ohtsubo, E. Factors Determining Frequency of Plasmid Cointegration Mediated by Insertion Sequence IS1. Proc. Natl. Acad. Sci. USA 1982, 79, 277–281. [Google Scholar] [CrossRef]
  30. Biel, S.W.; Berg, D.E. Mechanism of IS1 Transposition in E. Coli: Choice between Simple Insertion and Cointegration. Genetics 1984, 108, 319–330. [Google Scholar] [CrossRef]
  31. Shiga, Y.; Sekine, Y.; Ohtsubo, E. Transposition of IS1 Circles. Genes Cells 1999, 4, 551–561. [Google Scholar] [CrossRef] [PubMed]
  32. Chen, J.H.; Hsu, W.B.; Hwang, J.L. Two Amino Acid Residues of Transposase Contributing to Differential Transposability of IS1 Elements in Escherichia coli. J. Bacteriol. 1998, 180, 5279–5283. [Google Scholar] [CrossRef]
  33. Onstead, J.; Zhang, Z.; Huo, J.; Ord, J.W.; Smith, S.; Saier, M.H., Jr. Investigating How Genomic Contexts Impact IS5 Transposition within the Escherichia coli Genome. Microorganisms 2024, 12, 2600. [Google Scholar] [CrossRef]
  34. Curcio, M.J.; Derbyshire, K.M. The Outs and Ins of Transposition: From Mu to Kangaroo. Nat. Rev. Mol. Cell Biol. 2003, 4, 865–877. [Google Scholar] [CrossRef] [PubMed]
  35. Derbyshire, K.M.; Grindley, N.D. Replicative and Conservative Transposition in Bacteria. Cell 1986, 47, 325–327. [Google Scholar] [CrossRef]
  36. Vandecraen, J.; Chandler, M.; Aertsen, A.; Van Houdt, R. The Impact of Insertion Sequences on Bacterial Genome Plasticity and Adaptability. Crit. Rev. Microbiol. 2017, 43, 709–730. [Google Scholar] [CrossRef]
  37. Lee, E.G.; Kim, K.H. Transposition of Transposable Element IS1 in Edwardsiella Piscicida Mutant Generated by CRISPR/Cas9 along with λ-Red Recombineering System. Res. Microbiol. 2025, 176, 104297. [Google Scholar] [CrossRef]
  38. Hallet, B.; Sherratt, D.J. Transposition and Site-Specific Recombination: Adapting DNA Cut-and-Paste Mechanisms to a Variety of Genetic Rearrangements. FEMS Microbiol. Rev. 2006, 21, 157–178. [Google Scholar] [CrossRef]
  39. Turlan, C.; Chandler, M. IS1-Mediated Intramolecular Rearrangements: Formation of Excised Transposon Circles and Replicative Deletions. EMBO J. 1995, 14, 5410–5421. [Google Scholar] [CrossRef] [PubMed]
  40. Prentki, P.; Pham, M.H.; Gamas, P.; Chandler, M.; Galas, D.J. Artificial Transposable Elements in the Study of the Ends of IS1. Gene 1987, 61, 91–101. [Google Scholar] [CrossRef]
  41. Machida, Y.; Machida, C.; Ohtsubo, E. Insertion Element IS1 Encodes Two Structural Genes Required for Its Transposition. J. Mol. Biol. 1984, 177, 229–245. [Google Scholar] [CrossRef] [PubMed]
  42. Ramirez-Santos, J.; Alvarez, G.; Cisneros, E.; Gomez-Eichelmann, M.C. Distribution of Insertion Sequence IS1 in Multiple-Antibiotic Resistant Clinical Enterobacteriaceae Strains. FEMS Microbiol. Lett. 1992, 72, 189–193. [Google Scholar] [CrossRef]
  43. Ohta, S.; Tsuchida, K.; Choi, S.; Sekine, Y.; Shiga, Y.; Ohtsubo, E. Presence of a Characteristic D-D-E Motif in IS1 Transposase. J. Bacteriol. 2002, 184, 6146–6154. [Google Scholar] [CrossRef]
  44. Atkins, J.F.; Loughran, G.; Bhatt, P.R.; Firth, A.E.; Baranov, P.V. Ribosomal Frameshifting and Transcriptional Slippage: From Genetic Steganography and Cryptography to Adventitious Use. Nucleic 2016, 44, 7007–7078. [Google Scholar] [CrossRef]
  45. Vögele, K.; Schwartz, E.; Welz, C.; Schiltz, E.; Rak, B. High-Level Ribosomal Frameshifting Directs the Synthesis of IS150 Gene Products. Nucleic Acids Res. 1991, 19, 4377–4385. [Google Scholar] [CrossRef]
  46. Nagy, Z.; Chandler, M. Regulation of Transposition in Bacteria. Res. Microbiol. 2004, 155, 387–398. [Google Scholar] [CrossRef] [PubMed]
  47. Surette, M.G.; Lavoie, B.D.; Chaconas, G. Action at a Distance in Mu DNA Transposition: An Enhancer-like Element Is the Site of Action of Supercoiling Relief Activity by Integration Host Factor (IHF). EMBO J. 1989, 8, 3483–3489. [Google Scholar] [CrossRef] [PubMed]
  48. Allison, R.G.; Chaconas, G. Role of the A Protein-Binding Sites in the in Vitro Transposition of Mu DNA. A Complex Circuit of Interactions Involving the Mu Ends and the Transpositional Enhancer. J. Biol. Chem. 1992, 267, 19963–19970. [Google Scholar] [CrossRef] [PubMed]
  49. Shiga, Y.; Sekine, Y.; Kano, Y.; Ohtsubo, E. Involvement of H-NS in Transpositional Recombination Mediated by IS1. J. Bacteriol. 2001, 183, 2476–2484. [Google Scholar] [CrossRef]
  50. Sekine, Y.; Ohtsubo, E. Frameshifting Is Required for Production of the Transposase Encoded by Insertion Sequence 1. Proc. Natl. Acad. Sci. USA 1989, 86, 4609–4613. [Google Scholar] [CrossRef]
  51. Plasterk, R.H. Frameshift Control of IS1 Transposition. Trends Genet. 1991, 7, 203–204. [Google Scholar] [CrossRef]
  52. Caliskan, N.; Peske, F.; Rodnina, M.V. Changed in Translation: MRNA Recoding by -1 Programmed Ribosomal Frameshifting. Trends Biochem. Sci. 2015, 40, 265–274. [Google Scholar] [CrossRef]
  53. Harger, J.W.; Meskauskas, A.; Dinman, J.D. An “Integrated Model” of Programmed Ribosomal Frameshifting. Trends Biochem. Sci. 2002, 27, 448–454. [Google Scholar] [CrossRef]
  54. Zhou, H.; Zhang, Z.; Velo, J.; Huo, J.; Smith, S.; Ho, A.; Saier, M.H., Jr. Transcriptional Mechanism by Which IS5 Activates the FucAO Operon in Escherichia coli. Nucleic Acids Res. 2025, 53, gkaf172. [Google Scholar] [CrossRef]
  55. Sawers, R.G. Transcript Analysis of Escherichia coli K-12 Insertion Element IS5. FEMS Microbiol. Lett. 2005, 244, 397–401. [Google Scholar] [CrossRef] [PubMed]
  56. Machida, C.; Machida, Y.; Wang, H.C.; Ishizaki, K.; Ohtsubo, E. Repression of Cointegration Ability of Insertion Element IS1 by Transcriptional Readthrough from Flanking Regions. Cell 1983, 34, 135–142. [Google Scholar] [CrossRef] [PubMed]
  57. Kim, Y.J.; Park, J.H.; Kim, K.S.; Chang, J.E.; Ko, J.H.; Kim, M.H.; Chung, D.H.; Chung, T.W.; Choe, I.S.; Lee, Y.C.; et al. Sequence Analysis of the 5′-Flanking Region of the Gene Encoding Human N-Acetylglucosaminyltransferase III. Gene 1996, 170, 281–283. [Google Scholar] [CrossRef]
  58. Chaconas, G. Studies on a “Jumping Gene Machine”: Higher-Order Nucleoprotein Complexes in Mu DNA Transposition. Biochem. Cell Biol. 1999, 77, 487–491. [Google Scholar] [CrossRef]
  59. Gueguen, E.; Rousseau, P.; Duval-Valentin, G.; Chandler, M. The Transpososome: Control of Transposition at the Level of Catalysis. Trends Microbiol. 2005, 13, 543–549. [Google Scholar] [CrossRef]
  60. Humayun, M.Z.; Zhang, Z.; Butcher, A.M.; Moshayedi, A.; Saier, M.H., Jr. Hopping into a Hot Seat: Role of DNA Structural Features on IS5-Mediated Gene Activation and Inactivation under Stress. PLoS ONE 2017, 12, e0180156. [Google Scholar] [CrossRef] [PubMed]
  61. Black, J.W.; Leff, P.; Shankley, N.P. Further Analysis of Anomalous PKB Values for Histamine H2-Receptor Antagonists on the Mouse Isolated Stomach Assay. Br. J. Pharmacol. 1985, 86, 581–587. [Google Scholar] [CrossRef] [PubMed]
  62. Saier, M.H., Jr.; Kukita, C.; Zhang, Z. Transposon-Mediated Directed Mutation in Bacteria and Eukaryotes. Front. Biosci. 2017, 22, 1458–1468. [Google Scholar] [CrossRef]
  63. Madan, R.; Kolter, R.; Mahadevan, S. Mutations That Activate the Silent Bgl Operon of Escherichia coli Confer a Growth Advantage in Stationary Phase. J. Bacteriol. 2005, 187, 7912–7917. [Google Scholar] [CrossRef]
  64. Wang, X.; Wood, T.K. IS5 Inserts Upstream of the Master Motility Operon FlhDC in a Quasi-Lamarckian Way. ISME J. 2011, 5, 1517–1525. [Google Scholar] [CrossRef]
  65. Zhang, Z.; Kukita, C.; Humayun, M.Z.; Saier, M.H. Environment-Directed Activation of the Escherichia coli flhDC Operon by Transposons. Microbiology 2017, 163, 554–569. [Google Scholar] [CrossRef]
  66. Barker, C.S.; Prüss, B.M.; Matsumura, P. Increased Motility of Escherichia coli by Insertion Sequence Element Integration into the Regulatory Region of the FlhD Operon. J. Bacteriol. 2004, 186, 7529–7537. [Google Scholar] [CrossRef]
  67. Rosner, J.L.; Guyer, M.S. Transposition of IS1-LambdaBIO-IS1 from a Bacteriophage Lambda Derivative Carrying the IS1-Cat-IS1 Transposon (Tn9). Mol. Gen. Genet. 1980, 178, 111–120. [Google Scholar] [CrossRef] [PubMed]
  68. Couchoud, C.; Bertrand, X.; Valot, B.; Hocquet, D. Deciphering the Role of Insertion Sequences in the Evolution of Bacterial Epidemic Pathogens with PanISa Software. Microb. Genom. 2020, 6, e000356. [Google Scholar] [CrossRef] [PubMed]
  69. Datsenko, K.A.; Wanner, B.L. One-Step Inactivation of Chromosomal Genes in Escherichia coli K-12 Using PCR Products. Proc. Natl. Acad. Sci. USA 2000, 97, 6640–6645. [Google Scholar] [CrossRef] [PubMed]
  70. Thomason, L.C.; Costantino, N.; Court, D.L.E. Coli Genome Manipulation by P1 Transduction. Curr. Protoc. Mol. Biol. 2007, 79, 1–17. [Google Scholar] [CrossRef]
  71. Zhang, Z.; Huo, J.; Velo, J.; Zhou, H.; Flaherty, A.; Saier, M.H., Jr. Comprehensive Characterization of FucAO Operon Activation in Escherichia coli. Int. J. Mol. Sci. 2024, 25, 3946. [Google Scholar] [CrossRef] [PubMed]
  72. Zhang, Z.; Saier, M.H., Jr. A Mechanism of Transposon-Mediated Directed Mutation. Mol. Microbiol. 2009, 74, 29–43. [Google Scholar] [CrossRef] [PubMed]
  73. Zhang, Z.; Zhou, K.; Tran, D.; Saier, M. Insertion Sequence (IS) Element-Mediated Activating Mutations of the Cryptic Aromatic β-Glucoside Utilization (BglGFB) Operon Are Promoted by the Anti-Terminator Protein (BglG) in Escherichia coli. Int. J. Mol. Sci. 2022, 23, 1505. [Google Scholar] [CrossRef] [PubMed]
  74. Cairns, J.; Foster, P.L. Adaptive Reversion of a Frameshift Mutation in Escherichia coli. Genetics 1991, 128, 695–701. [Google Scholar] [CrossRef] [PubMed]
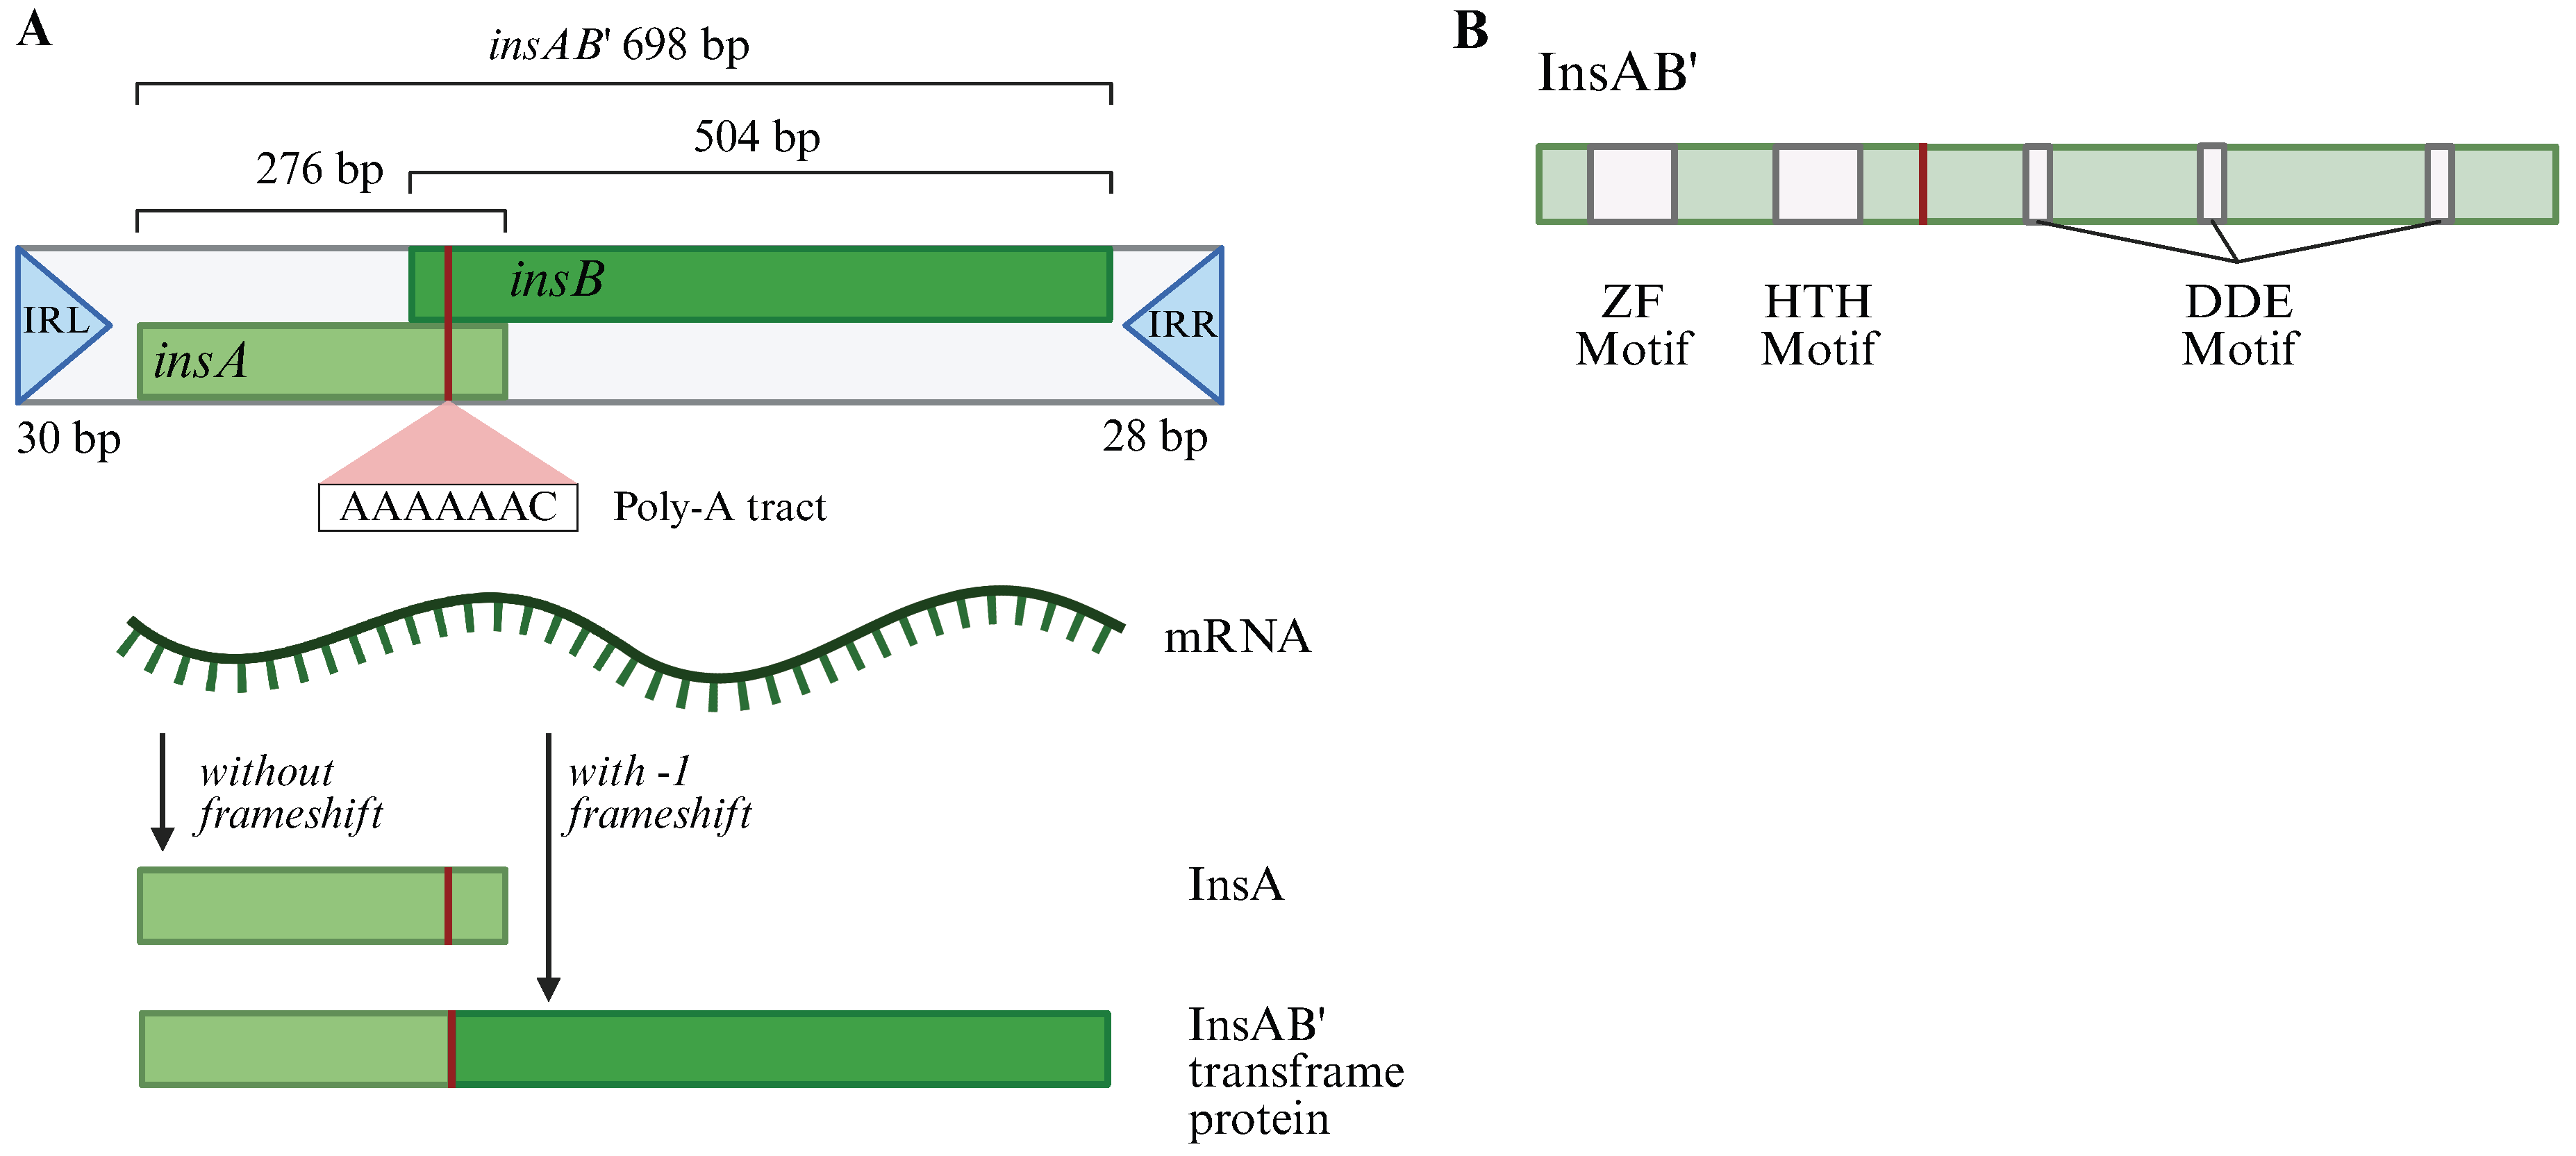
Figure 1. Schematic diagrams for an IS1 element and its encoded transposase. (A) Diagrams showing structural organization of IS1 and its transcriptional and translational products. IS1 is 768 bp long and is flanked by two inverted repeat sequences (IRL and IRR). It carries two overlapping open reading frames (insA and insB) and a transframe gene insAB’. The IS1 transcript can yield two proteins: InsA (with no -1 ribosomal frameshift at the poly-A tract) and InsAB’ (with the -1 frameshift). (B) Diagram showing organization of the IS1 transposase InsAB’. InsAB’ is 232-AA long, carries a ZF motif and an HTH motif at the N-terminus, and a DDE motif at the C-terminus. The first two of these motifs are required for InsA and InsAB’ binding to IRL and IRL while the last one is critical for catalytic activity of InsAB’. Created in BioRender Canvas. Smith, S. (2025) https://BioRender.com/0q4p31r. (accessed on 30 July 2025).
Ijms 26 08375 g001
Figure 2. Consensus-sequence IS1E and IS1A are the primary contributors to overall IS1 transposition within the genome. (A) Schematic diagram showing six IS1 elements on the chromosome of strain BW25113. Their locations (relative to position 0, and oriC and terB), orientation (relative to the nearby target genes), and percent identities to the consensus sequence are indicated. (B) All analyzed IS1-mediated Bgl+, FZD+ and SWM+ mutations were derived from IS1E and IS1A. (C) Diagrams showing all six IS1 elements in WT (left) and four IS1 elements in ∆IS1cons (right). Strain ∆IS1cons is the same as WT except that IS1E and IS1A are deleted. (D) Effect of deleting IS1A and IS1E on IS1-mediated Bgl+ mutations over time in a 14-day period (n = 8 and 7). (E) IS1 transposition is nearly abolished in strain ∆IS1cons. Both Bgl+ and FZD+ mutation assays were conducted to determine if four non-consensus sequence IS1 elements (IS1B, IS1C, IS1D and IS1F) were capable of transposition into the bglGFB and nfsB targets in a 14-day period. Created in BioRender Canvas. Smith, S. (2025) https://BioRender.com/krg9vh5. (accessed on 21 August 2025).
Ijms 26 08375 g002
Figure 3. IS1E transposes more frequently than IS1A. (A) Diagrams displaying the IS1 elements present in five strains. WT carries all six IS1 elements, with IS1E only retaining IS1E, IS1A only retaining IS1A, ∆IS1 deleted for all six IS1 elements, and IS1AE only retaining IS1A and IS1E. (B) Bgl+ mutation assays for IS1 insertion comparing IS1E, IS1A and IS1AE with WT (n = 8 or 10). (C) Bgl+ mutations over time comparing IS1E and IS1A (n = 8). (D) FZD+ mutation assays for IS1 insertion comparing IS1E, IS1A and IS1AE with WT (n = 8). Data are plotted as the mean ± SD (one-way ANOVA with Tukey multiple comparisons test or (B) one-way ANOVA with Games-Howell multiple comparisons test (D)). ns denotes no significance and indicates a p-value ≥ 0.05; ** indicates a p-value < 0.01; *** indicates a p-value < 0.001. Created in BioRender Canvas. Smith, S. (2025) https://BioRender.com/5qgrkh0. (accessed on 21 August 2025).
Ijms 26 08375 g003
Figure 4. Ribosomal frameshift plays a critical role in IS1 transposition. (A) Schematic diagram depicting the A6C motif and the altered GA2GA3C motif at IS1E. The sequences for both motifs are bolded. 1 bp (G) insertion and 1 bp (G) substitution, which eliminate the -1 frameshift requirement for the synthesis of InsAB’, are in red at the GA2GA3C motif. Three codons near the slippery sequence are separated by spaces in each motif. (B) Effect of eliminating translational regulation by modifying the A6C motif on IS1 transposition in IS1E.fs (n = 6) and IS1AE.fs (n = 4). Data are plotted as the mean ± SD (Welch’s one-way ANOVA with Dunnett T3 multiple comparison’s test. ns denotes no significance and indicates a p-value ≥ 0.05. Created in BioRender Canvas. Smith, S. (2025) https://BioRender.com/a34lvbk. (accessed on 30 July 2025).
Ijms 26 08375 g004
Figure 5. InsA overexpression significantly diminishes IS1 transposition. (A) Diagram showing the Ptet driven insA cassette at the intS locus in strains IS1E.fs-InsA, IS1AE.fs-InsA, and IS1E-InsA. InsA is over produced in these strains. (B) Effect of insA overexpression on IS1 transposition into the bglGFB (from left to right, n = 6, 4, 5, and 5). (C) Effect of insA overexpression on IS1 transposition into nfsB (from left to right, n = 8, 10, 6, and 6). (D) Diagram showing the titratable regulatory cascade introduced on the chromosome of IS1E.fs. In this cascade, TetR represses Ptet driven insA and the repression can be relieved by adding chlortetracycline (clTc), with more clTc leading to greater levels of InsA. (E) The frequencies of IS1 insertion into the bglGFB target in IS1E.fs-AR is inversely proportional to InsA levels (n = 4, 4, 4, and 5). Data are plotted as the mean ± SD (One-way ANOVA with Tukey multiple comparison’s test (E)). ns denotes no significance and indicates a p-value ≥ 0.05; ** indicates a p-value < 0.01; *** indicates a p-value < 0.001. Created in BioRender Canvas. Smith, S. (2025) https://BioRender.com/t2yd08s.(accessed on 30 July 2025).
Ijms 26 08375 g005
Figure 6. IS1Efs not only transposes more frequently but also synthesizes more IS1 transcripts than IS1Afs. (A) Schematic diagram showing genomic contexts surrounding IS1A.fs. (B) Bgl+ mutation assays comparing IS1Afs and IS1Efs for their transposition activities (n = 9 and 6, respectively). (C) Schematic diagrams showing the lacZ transcriptional reporter in strains IS1A.fs-Z and IS1E.fs-Z. Both reporters have the same PIS1 promoter and the same frameshift-induced transposase gene insAB*, but with different genomic contexts. (D) β-Galactosidase assays comparing transcription levels between IS1A.fs-Z and IS1E.fs-Z. Data are plotted as the mean SD (Welch’s t-test (B) and unpaired t-test (D)). *** indicates a p-value < 0.001; **** indicates a p-value < 0.0001. Created in BioRender Canvas. Smith, S. (2025) https://BioRender.com/r6rx2bp. (accessed on 21 August 2025).
Ijms 26 08375 g006
Figure 7. IS1 transposition is affected by genomic contexts. (A) Diagrams showing insertion of an rrnB terminator (rrnBT) upstream of IS1A in strain IS1A-T or upstream of IS1E in strain IS1E-T. (B) Upstream rrnBT insertion significantly decreases the frequencies of transposition of both native elements (IS1A and IS1E) into the bglGFB target (n = 10, 5, 8 and 7). (C) Diagrams showing rrnBT insertion upstream of IS1Afs in strain IS1A.fs-T or upstream of IS1Efs in strain IS1E.fs-T. (D) Upstream rrnBT insertion decreases the frequencies of transposition of frameshift-induced elements IS1A.fs and IS1E.fs into the bglGFB target (n = 9, 5, 6 and 6). (E) Diagram showing insertion of a kmr gene downstream of IS1Afs in strain IS1A.fs-km. (F) Effect of inserting a kmr gene downstream of IS1Afs on its transposition into the bgl target (n = 9 and 6). Data are plotted as the mean ± SD (Kruskal–Wallis test with Dunn’s multiple comparisons test (B), Welch’s one-way ANOVA with Dunnett T3 multiples comparison test (D), or Welch’s t-test (F)). ns denotes no significance and indicates a p-value ≥ 0.05; ** indicates a p-value < 0.01; *** indicates a p-value < 0.001; **** indicates a p-value < 0.0001. Created in BioRender Canvas. Smith, S. (2025) https://BioRender.com/3taenvy. (accessed on 21 August 2025).
Ijms 26 08375 g007
Figure 8. IS1 transposition mainly uses the replicative mechanism. Independent IS1 insertional mutants isolated from either Bgl+ or FZD+ mutation assays for four test strains were used to examine their transposition mechanisms (replicative vs. non-replicative). (A) IS1A insertional Bgl+ and FZD+ mutants derived from strain IS1A (retaining IS1A only). (B) IS1E insertional Bgl+ and FZD+ mutants derived from strain IS1E (retaining IS1E only). (C) IS1A or IS1E insertional Bgl+ and FZD+ mutants derived from strain IS1AE (retaining IS1A and IS1E). (D) IS1Afs or IS1Efs insertional Bgl+ mutants derived from strain IS1A.fs (retaining IS1Afs only) or from strain IS1E.fs (retaining IS1Efs only). For each of these test IS1 mutants, the presence of the original IS1 element(s) at its/their native locus indicates replicative transposition, whereas its/their absence suggests non-replicative transposition. Created in BioRender Canvas. Smith, S. (2025) https://BioRender.com/uux8oxt. (accessed on 30 July 2025).
Ijms 26 08375 g008
Disclaimer/Publisher’s Note: The statements, opinions and data contained in all publications are solely those of the individual author(s) and contributor(s) and not of MDPI and/or the editor(s). MDPI and/or the editor(s) disclaim responsibility for any injury to people or property resulting from any ideas, methods, instructions or products referred to in the content.