Article

Genome-Wide Identification of the TIFY Family in Cannabis sativa L. and Its Potential Functional Analysis in Response to Alkaline Stress and in Cannabinoid Metabolism

Institute of Industrial Crops, Heilongjiang Academy of Agricultural Sciences, Harbin 150086, China
*
Author to whom correspondence should be addressed.
Int. J. Mol. Sci. 2025, 26(17), 8171; https://doi.org/10.3390/ijms26178171
Submission received: 2 July 2025 / Revised: 16 August 2025 / Accepted: 21 August 2025 / Published: 22 August 2025
(This article belongs to the Section Molecular Genetics and Genomics)

Abstract

TIFY transcription factors play crucial regulatory roles in secondary metabolism and stress response. However, the expression patterns of the Cannabis sativa L. TIFY gene family under alkali stress, their involvement in cannabinoid metabolism, and their underlying genetic evolutionary mechanisms remain largely unexplored. In this study, we used bioinformatics approaches to conduct genome-wide identification and functional characterization of the C. sativa TIFY gene family. Fourteen TIFY genes were identified and mapped onto seven chromosomes. These genes were classified into four subfamilies: TIFY, JAZ, ZML, and PPD, with the JAZ subfamily further subdivided into five distinct branches. Collinearity analysis suggested that gene duplication events contributed to the expansion of the TIFY gene family in C. sativa. Weighted gene coexpression network analysis (WGCNA) revealed that CsJAZ2, CsJAZ3, and CsJAZ6 participated in the cannabinoid regulatory network. Cis-element analysis indicated that the promoter regions of TIFY genes were enriched in hormone- and stress-responsive elements. Furthermore, transcriptome and RT-qPCR analyses were conducted to examine gene expression patterns under alkaline stress (the RNA employed in RT-qPCR was extracted from the apical leaves of samples subjected to short-duration alkaline stress treatment). The results showed that CsJAZ5 and CsJAZ6 were downregulated, whereas CsPPD1, CsTIFY1, and CsZML1 were upregulated in response to alkali stress. In summary, CsJAZ5, CsPPD1, and CsTIFY1 may serve as candidate genes for the development of alkali-tolerant cultivars, while CsJAZ2 and CsJAZ3 may be valuable targets for enhancing cannabinoid production. This study provides important molecular insights and a theoretical basis for future research on the evolutionary dynamics and functional roles of TIFY transcription factors, particularly in stress adaptation and cannabinoid metabolism.

1. Introduction

The TIFY family comprises plant-specific transcription factors characterized by conserved TIFY motifs and is involved in a range of developmental, metabolic, hormone stimulation, and stress response processes. The gene AT4G24470 was first identified in Arabidopsis thaliana and was initially annotated to contain a ZIM domain. Subsequent studies revised this to a TIFY domain, reflecting an updated understanding of its conserved motif structure [1,2]. TIFY transcription factors are categorized into four subfamilies based on their evolutionary relationships and conserved domains: TIFY, JAZ, PPD, and ZML. The TIFY subfamily contains only the TIFY domain, the JAZ subfamily contains a C-terminal jasmonate–ZIM domain, the PPD (PEAPOD) subfamily includes an N-terminal PPD domain, and the ZML subfamily contains both CCT and GATA domains. Notably, the PPD domain remains poorly characterized and lacks a clearly defined sequence signature [3]. Following A. thaliana, TIFY genes have been identified in several plant species, including cotton (Gossypium arboretum, Gossypium raimondii, Gossypium hirsutum) [4], Vitis vinifera [5], Eriobotrya japonica [6], Manihot esculenta Crantz [7], Artemisia argyi [8], and Phalaenopsis aphrodite [9], among others. In wheat, 63 TIFY members with a large genome size were identified, while 16 TIFY genes were discovered in pomegranate [10]. The JAZ subfamily consistently emerged as the most abundant group. For example, 24 PtTIFY genes were identified in Populus trichocarpa, half of which belonged to the JAZ subfamily [11]. In Brassica napus L., 142 TIFY genes were identified [12], including 105 JAZ members, confirming the numerical dominance of this subfamily.
TIFY family members exhibit diverse tissue-specific expression patterns. In luffa, LcTIFY7 and LcTIFY13 were predominantly expressed in the reproductive organs, whereas LcTIFY11 showed higher expression in female than in male flower buds [13]. In tomato, NtTIFY1, NtTIFY4, NtTIFY18, and NtTIFY30 were preferentially expressed in roots, whereas NtTIFY7 was consistently expressed in plants inoculated with P. aquatica [14]. AtZML1 and AtZML2 are implicated in the hypocotyl growth regulation, with the AtZML1 overexpression producing elongated petioles and hypocotyls [1]. AtTIFY4a (PPD1) and AtTIFY4b (PPD2) are involved in synchronized leaf growth [15]. PPD2 forms a repressive complex with LHP1 to regulate lateral organ growth [16]. PPD2 also activates JAZ7/8 to positively regulate plant defense, promote root development, and enhance salt stress tolerance [17]. Furthermore, PPD modulates light signaling by inhibiting SPA1, thereby affecting photomorphogenesis [18]. Deletion of VmPPD has been shown to enhance grain yield via increased seed size [19]. These findings suggest that TIFY transcription factors participate in a variety of physiological pathways.
JAZ proteins represent the most abundant subgroup within the TIFY family and function as key repressors of the JA signaling pathway. In A. thaliana, 13 JAZ genes have been identified and classified into five phylogenetic groups: Group I (JAZ1/2/5/6), Group II (JAZ10), Group III (JAZ11/12), Group IV (JAZ3/4/9), and Group V (JAZ7/8/13) [20]. AtJAZ1 represses the transcription of JA-responsive genes, and elevated JA levels promote its interaction with SCFCOl1, leading to proteasomal degradation via the 26S proteasome pathway [21]. Members of Group IV (AtJAZ3/4/9) have been shown to suppress insect defense responses and alleviate JA-induced delays in flowering. Group III proteins (AtJAZ10/11/12) mitigate root growth inhibition by attenuating JA signaling [22]. AtJAZ7 plays a role in immune defense against Pseudomonas syringae by modulating ROS homeostasis, energy balance, and glucosinolate biosynthesis. In the context of F. albicans infection, JAZ7 inhibits JA overaccumulation through homo- and heterodimer formation. The overexpression of JAZ7 has also been reported to enhance drought tolerance [23,24]. In barley, HvJAZ2 acts as a negative regulator of drought tolerance by inhibiting root development, whereas jaz2 mutants exhibit the upregulation of root development-related genes, including SHR1, PLT1, PLT2, and PLT6. In maize, ZmJAZ13 was cloned and found to be highly expressed in immature embryos. Its heterologous expression in A. thaliana led to increased chlorophyll content, elevated peroxidase activity, and improved resistance to drought and salt stress [25]. In Salvia miltiorrhiza, the JA-responsive repressors SmJAZ3, SmJAZ4, and SmJAZ8 interact with SmMYC2 and SmMYB36 to modulate tanshinone accumulation in a JA-dependent manner. In tobacco cultivar TN90, 32 TIFY genes were identified from whole-genome data, among which five TIFY/JAZ genes were differentially expressed in COI1-deficient plants and were found to influence the biosynthesis of secondary metabolites [26]. In longan, DlTIFY7 negatively regulates anthocyanin biosynthesis [27]. Collectively, these findings demonstrate that TIFY transcription factors are involved in a wide range of physiological and molecular processes, including plant growth and development, flowering regulation, secondary metabolite biosynthesis, insect defense, root architecture formation, and responses to salinity and drought stress.
Soil salinization is a global environmental issue that impedes economic development. Globally, the total area of saline–alkali land has reached 1.381 billion hectares [28]. The Songnen Plain in China, with 3.43 million hectares of saline–alkali land, is one of the three major concentrated regions of saline–alkali land in the world [29]. Heilongjiang Province, located on the Songnen Plain, is one of the two provinces in China where hemp cultivation is permitted [30,31]. The area of saline–alkali land in the province accounts for 7% of its total cultivated land [32]. More importantly, as an economic crop, hemp cannot be grown on prime farmland in China, and thus is required to be planted on non-prime farmland. Non-prime farmland includes general farmland, forest land, sloping land, low-lying land, and the aforementioned saline–alkali land. However, general farmland accounts for a very small area. Therefore, hemp can typically only be grown on such lands, which are of lower quality than prime farmland [33]. Abiotic stresses such as saline–alkali stress and drought stress, which may occur in non-prime farmland, are key factors limiting the yield increase of industrial or medicinal hemp. Therefore, it is imperative to provide guidance for the breeding of stress-resistant C. sativa varieties by deeply analyzing the molecular mechanism underlying C. sativa stress resistance. Alkaline stress and salt stress disrupt the ionic homeostasis and water potential balance of plant cells, causing osmotic imbalance and ionic damage that ultimately lead to plant poisoning or even death [34]. Furthermore, the high pH stress and CO32−/HCO3 stress inherent in alkaline stress will further accelerate these processes [35]. Alkaline stress causes greater harm to the seedlings of C. sativa. Plants respond to alkaline stress through multiple signaling pathways. Signals are transmitted via a series of transcription factors (e.g., TIFY transcription factors) [10,12], which induce the production of certain protective proteins and metabolites. Among these stress-responsive metabolites in C. sativa, cannabinoids are a key type. Some studies have confirmed that TIFY transcription factors play a significant role in the response to alkaline stress. Zhu et al. found that GsTIFY10 in Glycine max can be induced by bicarbonate, salt stress, and JA, and that this gene also inhibits the transmission of JA signals. In A. thaliana, overexpression of GsTIFY10 enhances tolerance to alkaline stress during stages including seed germination, early seedling growth, and the adult plant stage [36]. Furthermore, they demonstrated that overexpression of CsJAZ2 in A. thaliana enhances tolerance to saline–alkali stress [37]. Research on the biological role of CsTIFY in the context of alkaline stress is scarce and requires further exploration.
C. sativa is an annual herbaceous species of the genus Cannabis within the Moraceae family. It has a long history of global cultivation and is widely utilized for textile, industrial, and medicinal purposes [38,39]. Cannabidiol (CBD) is one of the major cannabinoid constituents that exhibits antagonistic effects against tetrahydrocannabinol (THC) [40,41]. It has been extensively applied in modern medicine and demonstrated to possess anti-inflammatory, analgesic, antiepileptic, antiasthmatic, anticancer, sedative, and dermatological properties [42,43,44,45,46]. As a high-value medicinal compound, the enhancement of CBD and other cannabinoid yields remains a key objective [47,48]. The environment has a significant impact on cannabinoid content. As a crucial plant nutrient, nitrogen promotes plant growth and development when supplied in excess, but reduces cannabinoid production [49]. An appropriate nitrogen supply (10–30% NH4+) can support plant growth without impairing secondary metabolite production [50]. An increase in phosphorus concentration increases biomass but reduces cannabinoid concentration [51]. Salinity also affects cannabinoid accumulation: when NaCl concentration is ≤13 mM, cannabinoid content in ECs peaks at 1.8 and 3 mS·cm−1 [52]. Furthermore, during the final stage of medicinal cannabis growth, flushing the growing medium can enhance cannabinoid production [53]. Canopy-level photosynthetic photon flux density (PPFD) is an important indicator for quantifying light intensity. At a PPFD of 1800 μmol·m−2·s−1, apical inflorescence density and harvest index peak are measured [54]. Therefore, in a closed system, adding an appropriate amount of nutrients and regulating light levels properly can enhance cannabis yield, while even mild stress can promote cannabinoid production.
Although the metabolic pathways of cannabinoids have been extensively studied, their regulatory mechanisms remain poorly understood [55,56]. Alkaline stress represents one of the primary abiotic stresses that C. sativa plants encounter when cultivated on non-prime farmland [30]. Research on the mechanisms underlying alkali stress tolerance in C. sativa is also extremely limited, and the role of the C. sativa TIFY family in alkali stress response has not been reported [31]. TIFY transcription factors may participate in multiple physiological and molecular processes and are also implicated in the regulation of high-value metabolite biosynthesis, including cannabinoids. However, limited information is currently available regarding the TIFY gene family in C. sativa. Therefore, we performed a genome-wide analysis, predicted the functions of the TIFY family using public transcriptome data, and treated cannabis seedlings with alkali to investigate the expression pattern of TIFY under alkaline stress. The investigation of this gene family holds paramount significance for elucidating the mechanism underlying the alkaline stress response and the regulatory network governing cannabinoid accumulation in C. sativa. Such an understanding can provide a theoretical foundation for breeding stress-tolerant and high-cannabinoid-yielding cultivars.

2. Results

2.1. Physicochemical Properties and Evolutionary Relationship Analysis of TIFY Transcription Factors

A total of 14 TIFY genes were identified in C. sativa through simultaneous alignment using BLAST and HMM models. These genes were named sequentially, based on their order of identification. A phylogenetic tree was constructed using 14 CsTIFY proteins from C. sativa and 19 AtTIFY proteins from A. thaliana (Figure 1). In A. thaliana, TIFY transcription factors were classified into four subfamilies: JAZ, PPD, ZML, and TIFY. Correspondingly, all four subfamilies were also identified in C. sativa, comprising nine JAZ members, four ZML members, and one member each from the TIFY and PPD subfamilies. Among the identified CsTIFY proteins, CsJAZ8 possessed the shortest coding sequence (196 amino acids) and the lowest molecular weight (17,524.89 Da), whereas CsTIFY1 exhibited the longest coding sequence (442 amino acids) and the highest molecular weight (46,479.54 Da). Five members, including four ZML proteins and CsJAZ6, were predicted to be acidic, whereas the remaining proteins were classified as basic. Based on the five established JAZ groups in A. thaliana, the JAZ subfamily members in C. sativa were classified as follows: Group I (CsJAZ2 and CsJAZ7), Group II (CsJAZ4), Group III (CsJAZ6), Group IV (CsJAZ1 and CsJAZ5), and Group V (CsJAZ8).

2.2. Gene Structure and Secondary Protein Structure of TIFY Transcription Factors

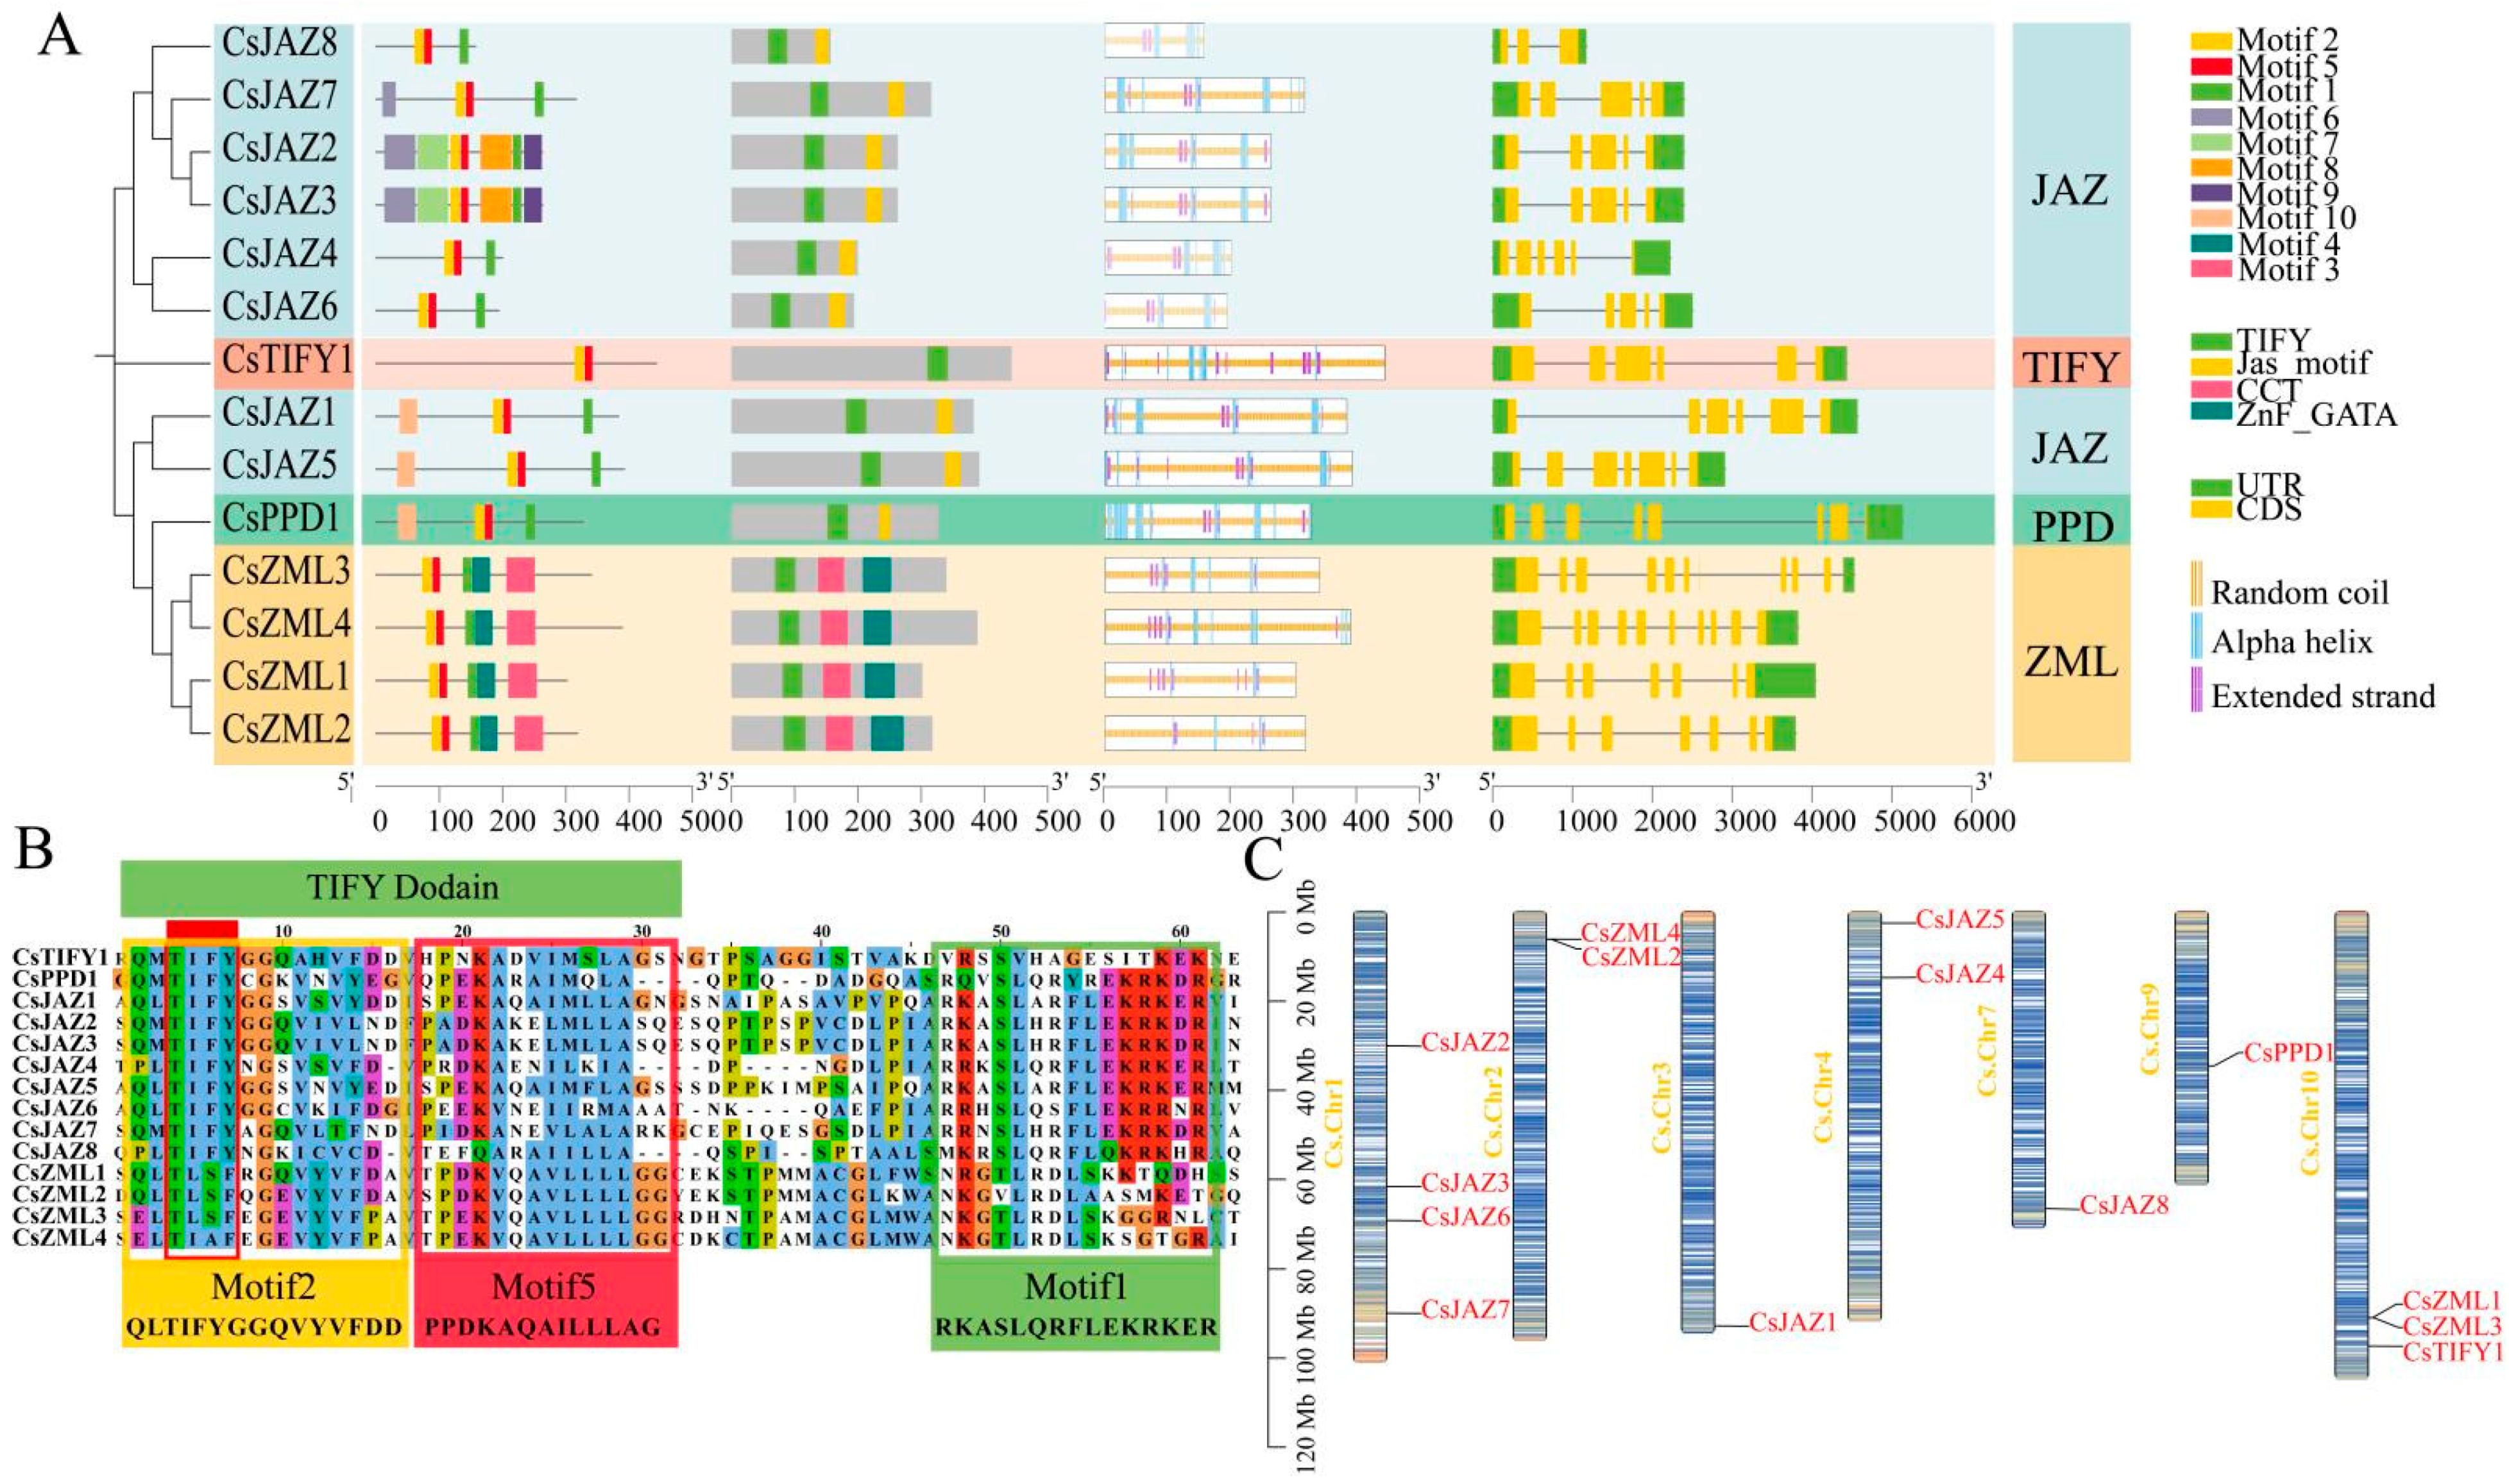
The motifs, conserved domains, and predicted secondary structures of TIFY proteins were integrated into a single figure alongside the phylogenetic tree. Gene structures of the TIFY family were mapped in conjunction with phylogenetic relationships. Motif composition, domain architecture, secondary protein structures, and exon–intron organization were displayed on the right side of the tree (Figure 2). All CsTIFY members contained motifs 1, 2, and 5, wherein motifs 2 and 5 overlapped with the conserved TIFY domain, while motif 1 corresponded to the JAS domain. The ZML subfamily exhibited distinct motifs 3 and 4, with motif 4 substituting the JAS domain by forming part of the CCT domain and motif 3 overlapping with the GATA domain. Additional motifs 7, 8, and 9 were uniquely present in CsJAZ2 and CsJAZ3, while CsJAZ1, CsJAZ5, and CsPPD1 featured motif 10. The TIFY domain represented the core conserved domain of the TIFY family and was verified in all 14 CsTIFY proteins. Within the conserved TIFY motif (QLTIFYGG), leucine and glycine residues following tyrosine were occasionally substituted by other amino acids in different subfamilies. In the ZML subfamily, substitutions were observed at positions corresponding to glutamine, isoleucine, phenylalanine, and glycine (Figure 2B). Three predominant secondary structures were predicted across the CsTIFY proteins: an alpha helix (3.79–21.78%), an extended strand (3.15–8.04%), and a random coil (73.01–93.06%) (Table 1). The maximum exon count was observed in CsZML3 and CsZML4, both containing nine exons, whereas the minimum exon number was found in CsJAZ8, which harbored only three. Notably, CsJAZ2 and CsJAZ3 exhibited highly similar sequences and nearly identical gene and protein structures(Figures S4 and S5). However, slight differences were detected in the distribution of their secondary structure elements. Multiple alpha helices and extended strands were typically observed within the TIFY domain, whereas alpha helices were predominantly present in the JAS domain. Distinct motifs were associated with specific secondary structural elements (Figure 2A).

2.3. Chromosomal Localization of TIFY Transcription Factors

Fourteen TIFY genes were unevenly distributed across seven C. sativa chromosomes. Chromosomes were visualized using a gradient color scale indicating gene density, where blue represents high-density regions and yellow denotes low-density regions (Figure 2C). Chr1 harbored the highest number of TIFY genes, with four members (CsTIFY2, CsTIFY3, CsTIFY6, and CsTIFY7). Although CsJAZ2 and CsJAZ3 exhibited high sequence similarity, their physical locations on Chr1 were widely separated. Notably, CsTIFY7 was positioned within a gene-sparse region on Chr1. Chr2 contained CsZML2 and CsZML4, which were closely located. Chr3 carried only one gene, CsJAZ1, also situated in a low gene density region. Two genes, CsJAZ4 and CsJAZ5, were identified in the upper arm of Chr4. No TIFY genes were detected on Chr5, Chr6, and Chr8. Chr7 contained CsJAZ8, whereas CsPPD1 was located near the centromere of Chr9. Chr10 harbored CsTIFY1 along with two members of the ZML subfamily, CsZML1 and CsZML3, which were positioned in close proximity.

2.4. Cis-Acting Elements of TIFY in C. sativa

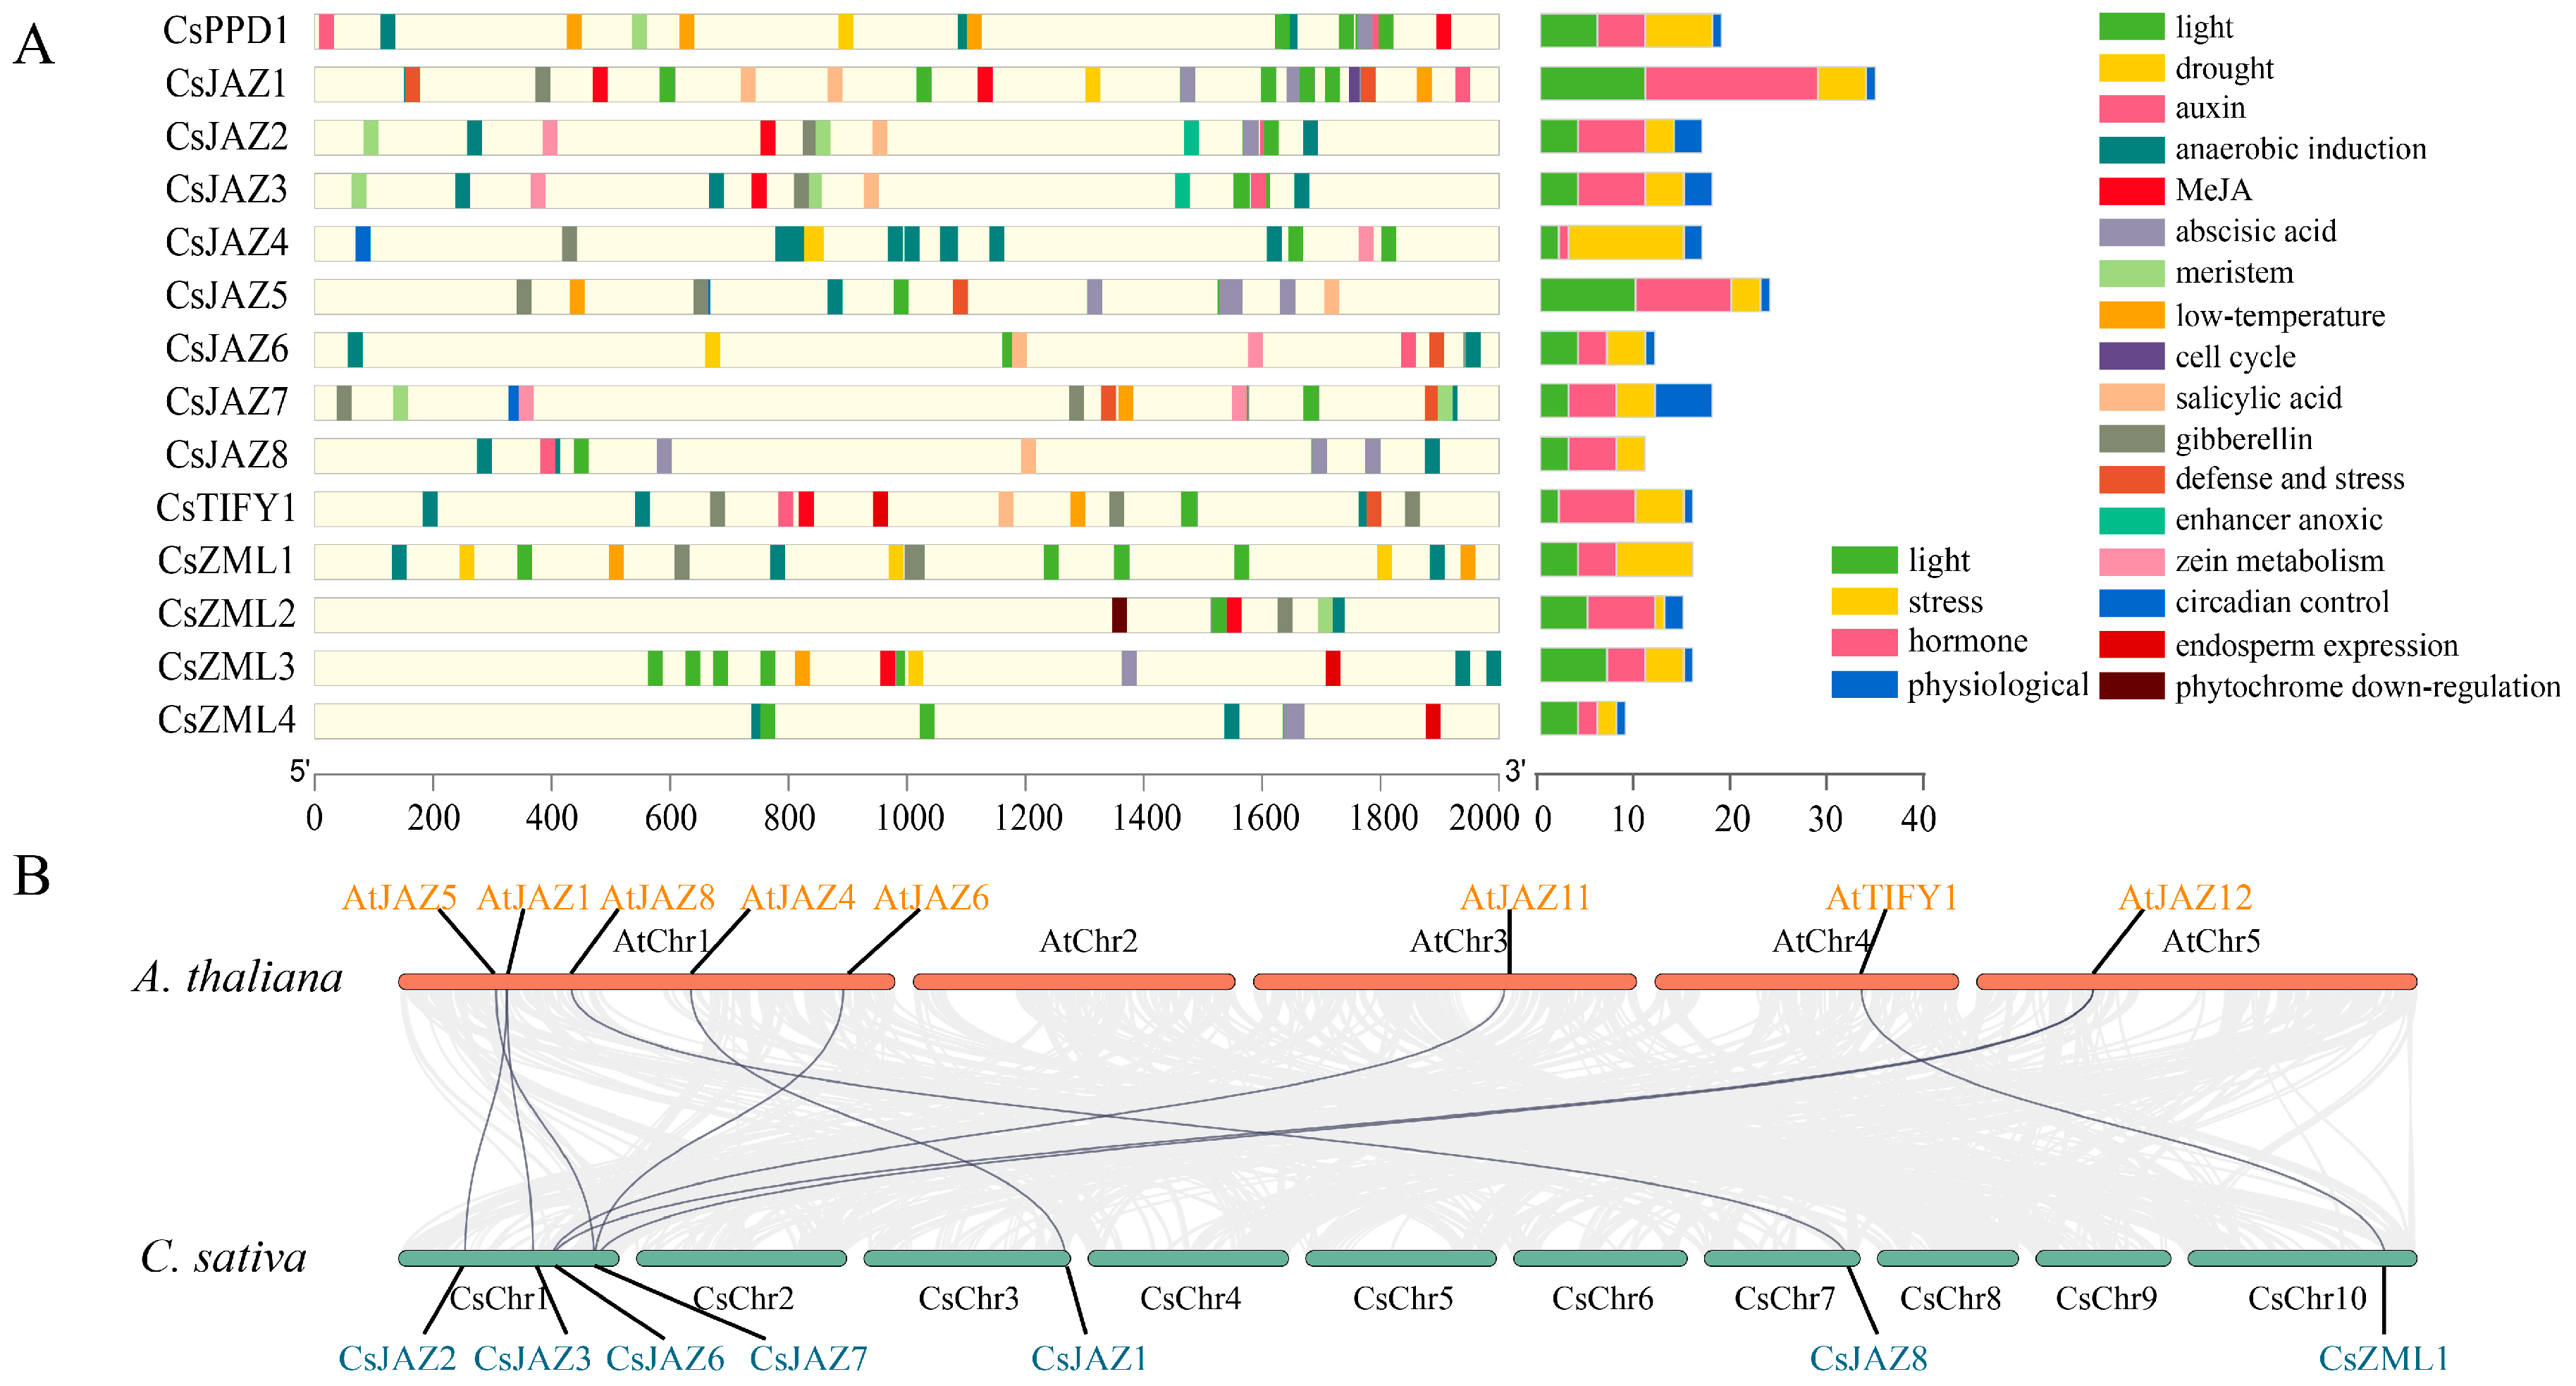
We extracted the 2000 bp sequence preceding C. sativa. The TIFY transcription factor promoter was extracted for cis-acting element prediction. After removing ambiguous or erroneous annotations, 243 cis-acting elements were identified (Figure 3A). Based on their functional classification, these elements were grouped into four categories: light-responsive, hormone-responsive, stress-responsive, and physiological regulatory elements. Among these, 86 cis-acting elements were hormone-responsive, 69 were light-responsive, 65 were stress-responsive, and 23 were related to physiological regulation. CsJAZ1 contained the highest number of cis-acting elements (35), including the greatest number of light-responsive (10) and hormone-responsive (18) elements. Notably, 10 of the hormone-responsive elements were ABA-responsive. CsZML4 possessed the fewest cis-elements (9), comprising four light-responsive elements, two ABA-responsive elements, two anaerobic-responsive elements, and one endosperm-specific element. Only three endosperm expression elements were identified in total, each located in CsZML4, CsZML3, and CsTIFY1, respectively. All TIFY genes contained hormone-responsive elements, whereas the types of hormone-responsive elements varied among genes, and no TIFY gene possessed the full complement of hormone-responsive elements.
Different CsTIFY genes exhibit varying types and numbers of adversity-responsive cis-elements. Anaerobic response elements are commonly present across CsTIFYs, with CsJAZ4 having the highest number (9). Other types of adversity-responsive elements occurred less frequently. Seven CsTIFY members (CsPPD1, CsJAZ1/5/7, and CsTIFY1) harbored low-temperature response elements. Drought-responsive elements were identified in six members: CsPPD1, CsJAZ1/4/6, and CsZML1/3. Defense response elements were detected in five members: CsJAZ1/5/6/7 and CsTIFY1. Physiological response elements were rare and appeared in only a few genes, with their types varying among members. Meristem-associated elements were found in CsPPD1, CsJAZ2/3/7, and CsZML2. Zein metabolism-related elements were enriched in the JAZ subfamily including CsJAZ2/3/4/6/7. Similarly, circadian regulatory elements were restricted to JAZ members (CsJAZ4/5/7). Endosperm expression elements were present in CsTIFY1 and CsZML3/4. Cell cycle-associated elements were exclusively identified in CsJAZ1, whereas phytochrome downregulation elements were specific to CsZML2. Notably, a hypoxia-responsive enhancer was observed only in CsJAZ2/3 and absent in all other members. The diversity and abundance of cis-acting elements suggest that TIFY transcription factors may participate in a wide range of physiological and molecular processes in C. sativa.

2.5. Collinearity and Protein Tertiary Structure of TIFY

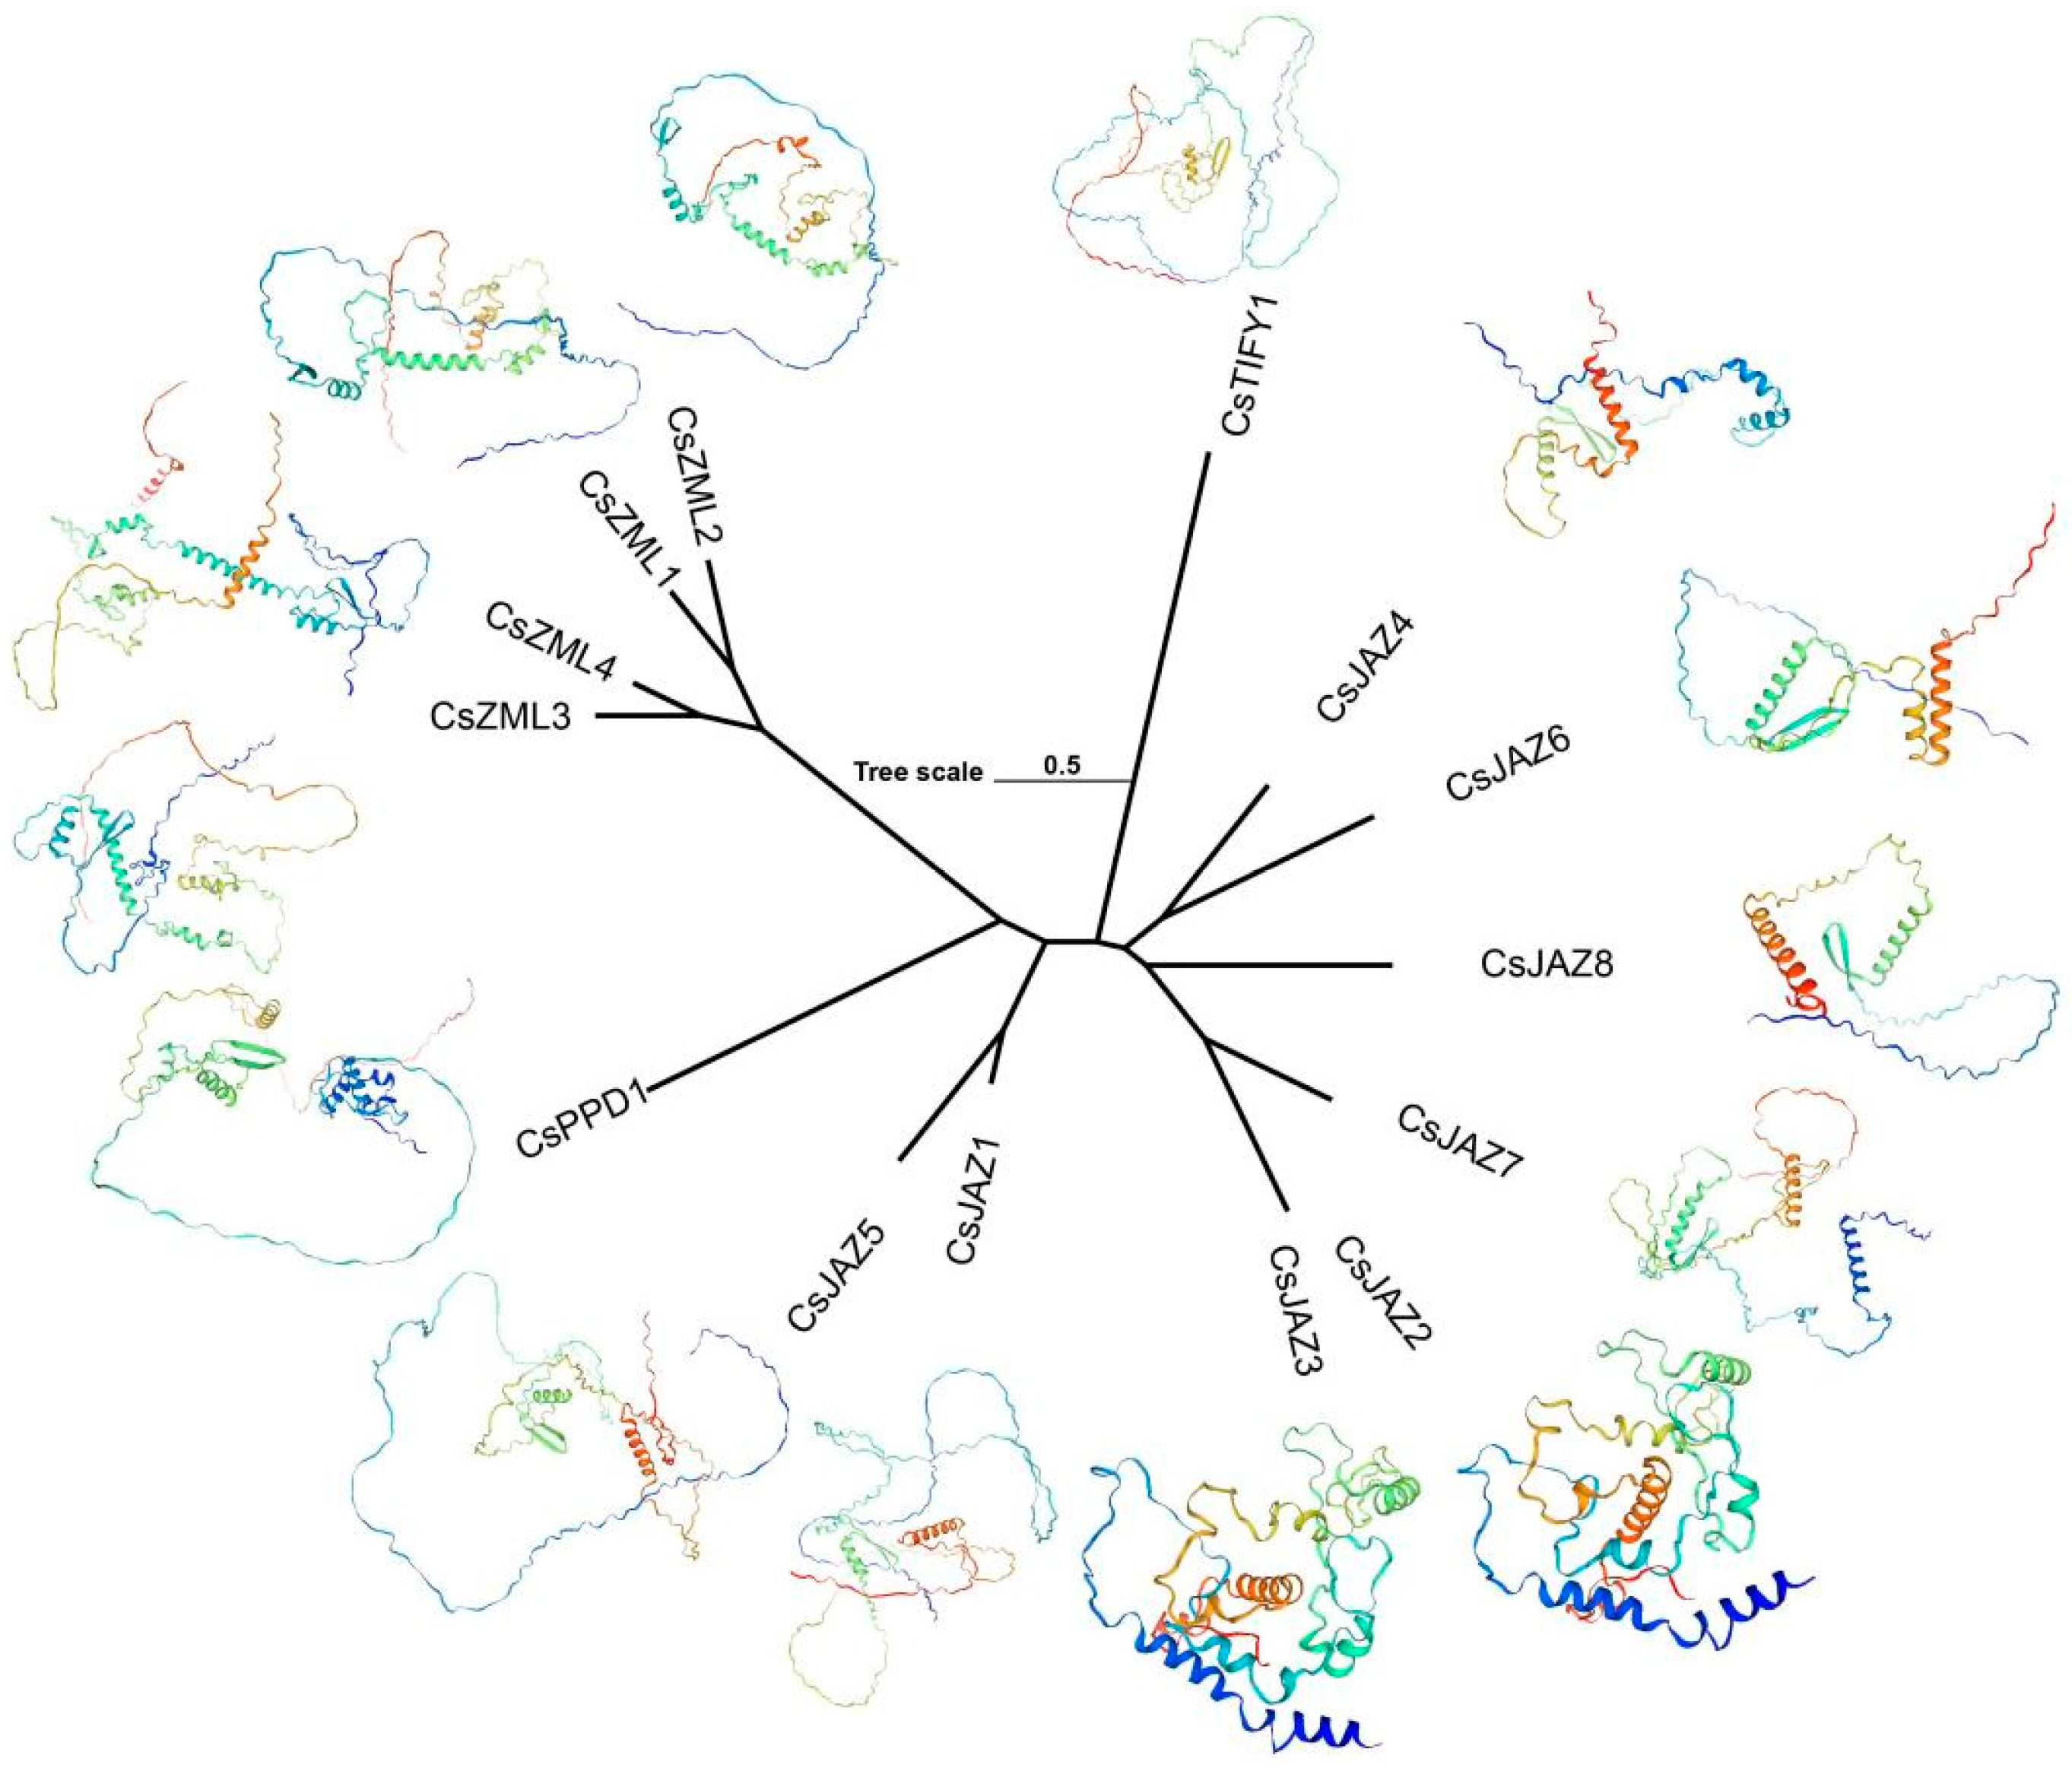
Collinearity analysis was conducted between the genomes of A. thaliana and C. sativa based on the sequences of the TIFY gene family. Ten collinear relationships were identified between the two species (Figure 3B). Among these, only three pairs exhibited one-to-one correspondence, whereas the remaining seven pairs displayed one-to-many or many-to-one relationships. Specifically, high collinearity and sequence similarity were observed in the following one-to-one pairs: CsJAZ1 with AtJAZ4, CsJAZ8 with AtJAZ8, and CsZML1 with AtTIFY1. A high degree of homology was also observed between CsJAZ2 and CsJAZ3, both of which exhibited strong similarity to AtJAZ2. In addition, CsJAZ6 showed collinearity with AtJAZ11 and AtJAZ12, whereas CsJAZ7 was collinear with AtTIFY5, AtTIFY6, and AtTIFY12. Notably, CsJAZ6, CsJAZ7, and AtTIFY12 shared high similarity and collinearity. Other CsTIFY genes displayed limited homology with their A. thaliana counterparts, whereas the alignment scores were insufficient to establish collinearity. Tertiary structure homology modeling of CsTIFY proteins was performed using the SWISS-MODEL database (Figure 4). The GMQE (Global Model Quality Estimation) values ranged from 0.45 to 0.64, supporting the credibility of the predicted structures. Among the 14 CsTIFY proteins, 9 exhibited 100% sequence identity with their templates, indicating high modeling reliability. For CsJAZ2 and CsJAZ3, which shared the high sequence similarity, the identities from homology modeling differ by only one percent (52.14%, 51.06%), respectively, with identical GMQE values of 0.58. The homology modeling identities of JAZ2 and JAZ3 were relatively low, which means that functional predictions based on homologous proteins may be prone to errors. However, their Ramachandran plots showed favorable values (84.05% and 83.27%), indicating that their spatial conformations are reasonable. Minor structural differences were observed between their three-dimensional conformations. No significant structural similarities were found among the remaining CsTIFY proteins.

2.6. Expression Patterns of TIFY Transcription Factors in Alkali Stress and Inflorescence Tissue

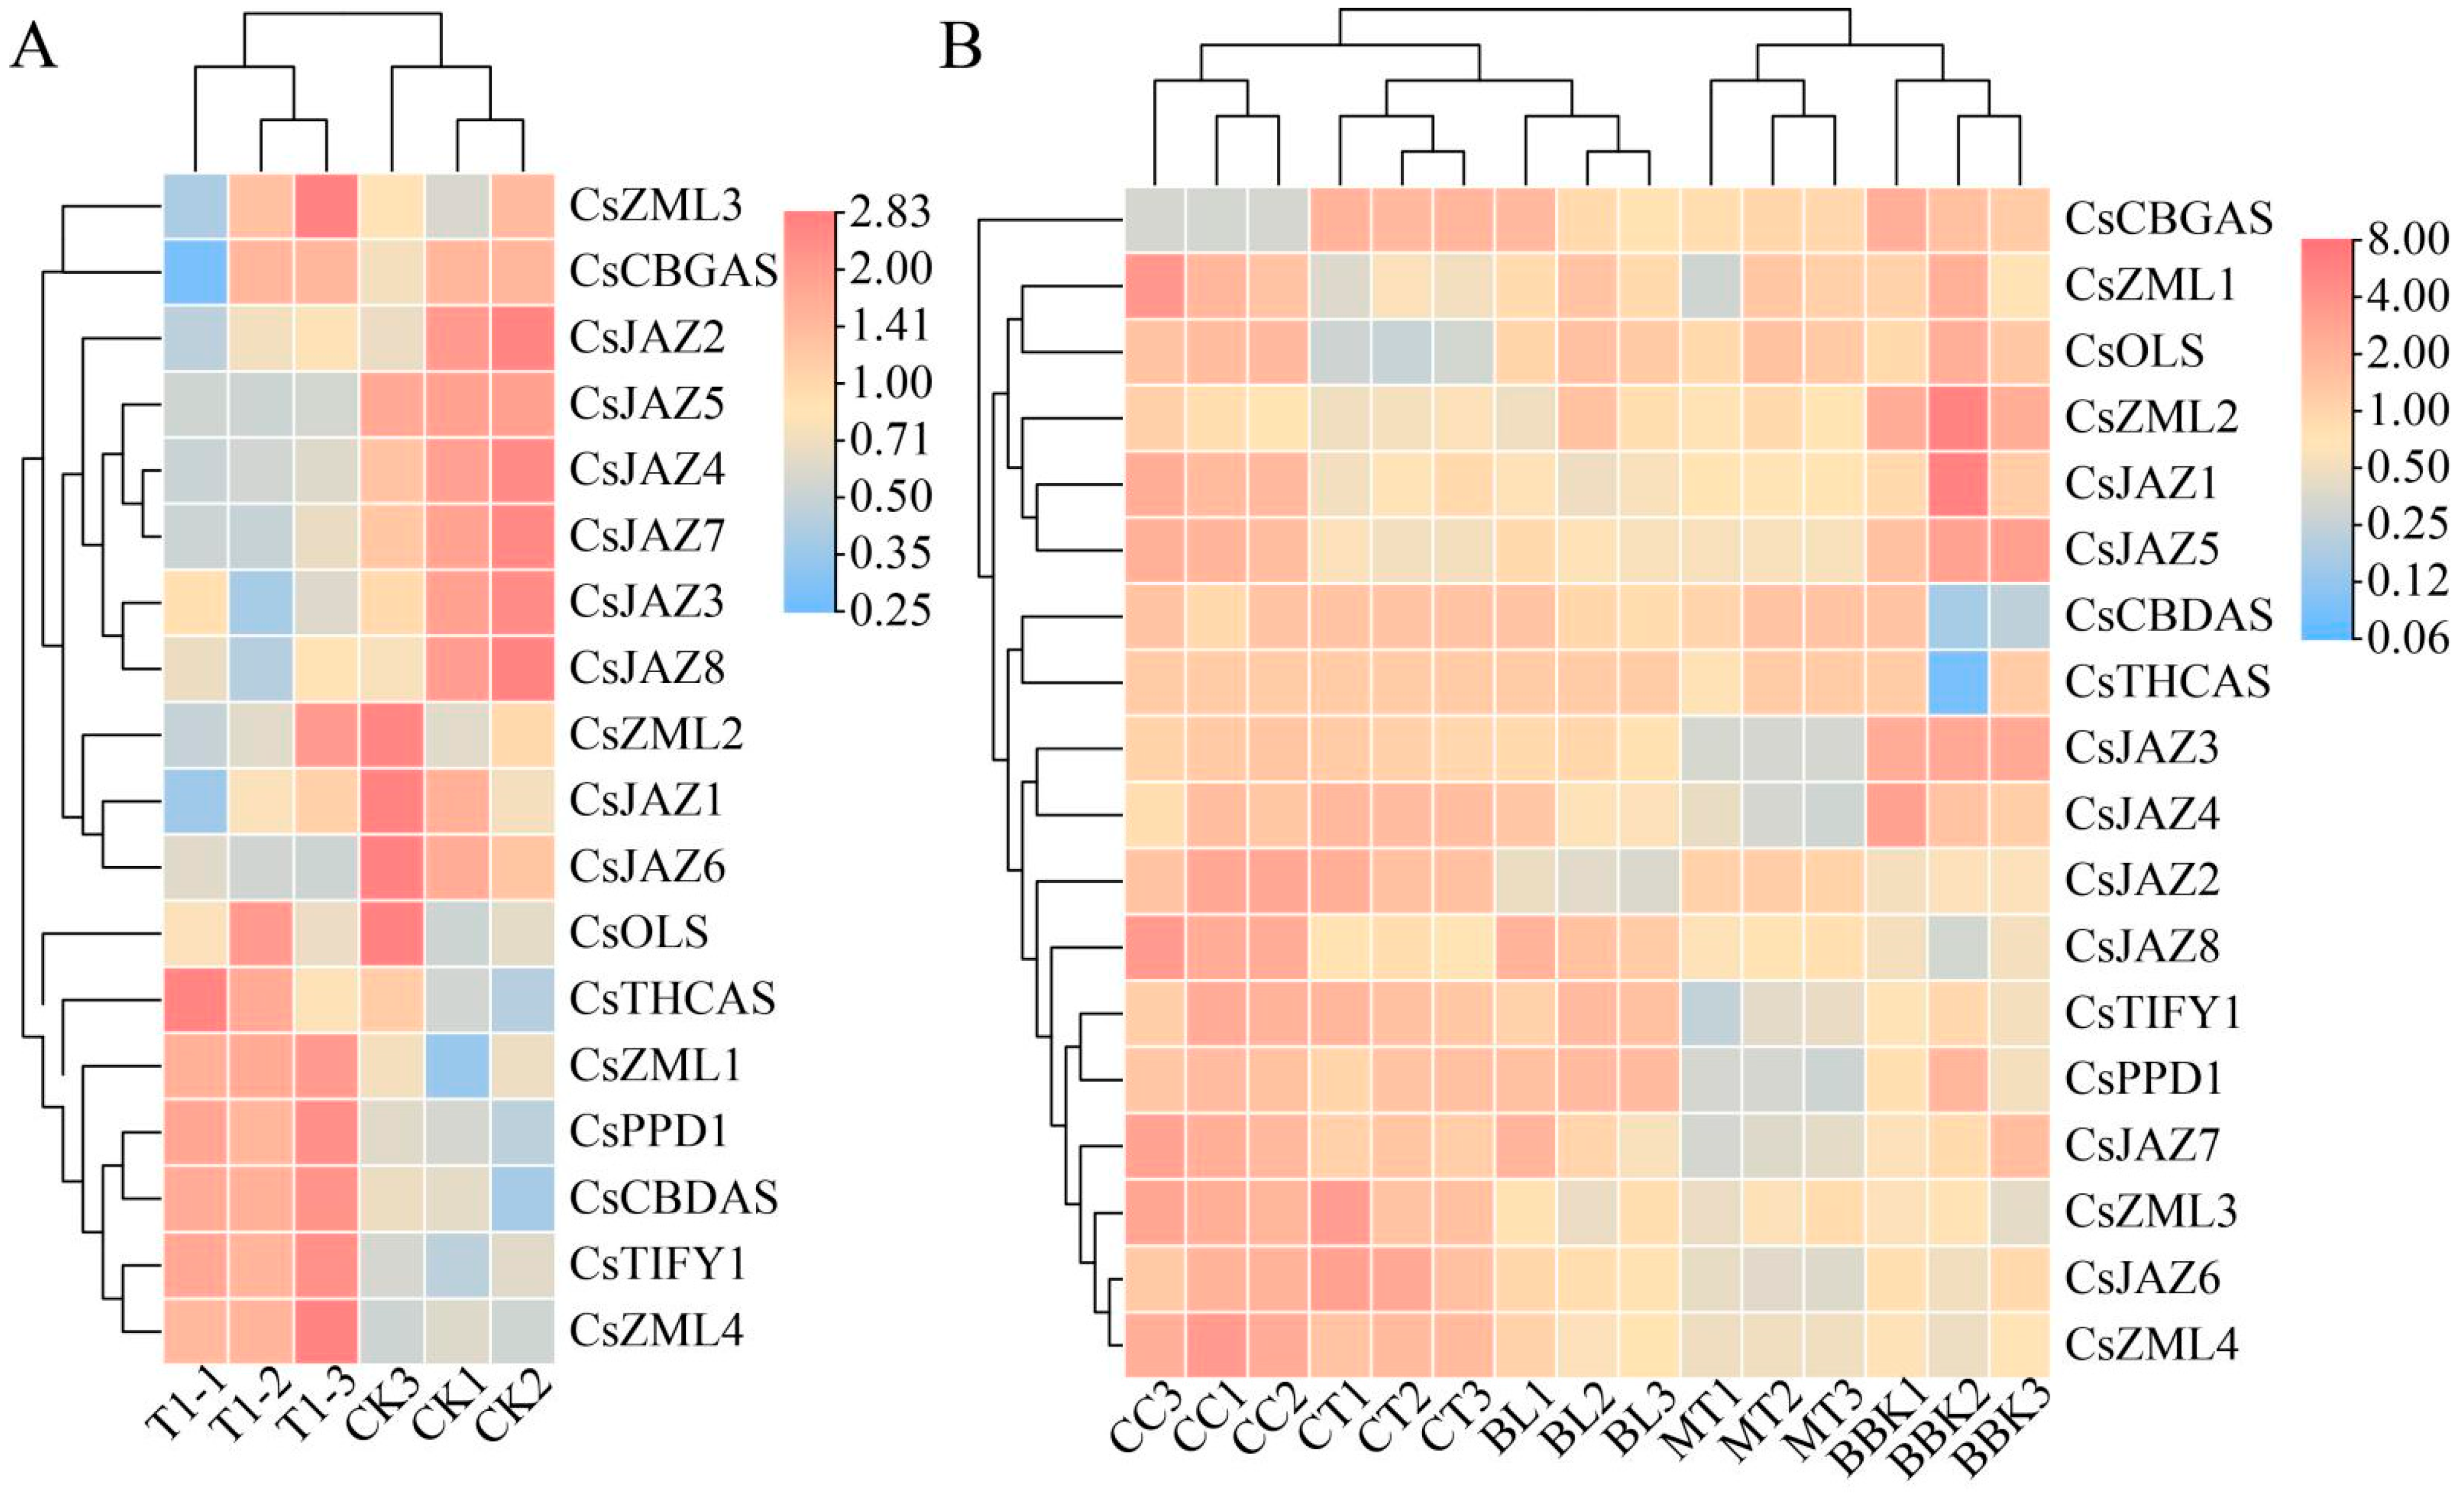
To elucidate the potential functions of TIFY genes in C. sativa, two publicly available transcriptome datasets were analyzed prior to molecular biological validation. Under alkali stress, significant differential expressions were observed in eight CsTIFY genes. Members of the JAZ subfamily, including CsJAZ4, CsJAZ5, CsJAZ6, and CsJAZ7, were significantly downregulated. In contrast, members of other subfamilies such as CsPPD1, CsTIFY1, and CsZML4 were significantly upregulated in response to stress (Figure 5A).
Additionally, inflorescence transcriptome data for C. sativa were retrieved from the GEO database. As the dataset lacked a control group, pairwise comparisons between cultivars were conducted. Transcriptome sequencing was performed on inflorescences of multiple C. sativa varieties, revealing significant differences in the expression of the TIFY family among different varieties. Specifically, the TIFY family expression levels in MT1-3 were generally lower than those in other varieties, while those in CC1-3 maintained an overall high trend. Additionally, the expression levels of CsCBDAS and CsTHCAS in BBK1-3 were lower than in other varieties, and the expression of the CsOLS gene in CT1-3 was significantly lower compared to other varieties. CsJAZ2 and CsJAZ3 emerged as transcription factors with marked variations in expression among cultivars (Figure 5B). The data used for WGCNA were derived from the inflorescence transcriptomes. Based on the transcriptomic profiles, all genes were classified into 17 coexpression modules, each assigned a distinct color. Correlation analysis between these modules and cannabinoid content was performed [57]. The results revealed a significant positive correlation between the blue module and the CBD/THC content. CsJAZ2 and CsJAZ6 were located in this module but were not identified as hub genes. The Magenta module, including CsJAZ3, exhibited a strong positive correlation with the CBG content. These findings suggest that, despite the high sequence similarity between CsJAZ2 and CsJAZ3, these two genes may play distinct physiological roles (Figure 6).

2.7. Relative Expression Levels of TIFY Under Adverse Stress and MeJA Treatment

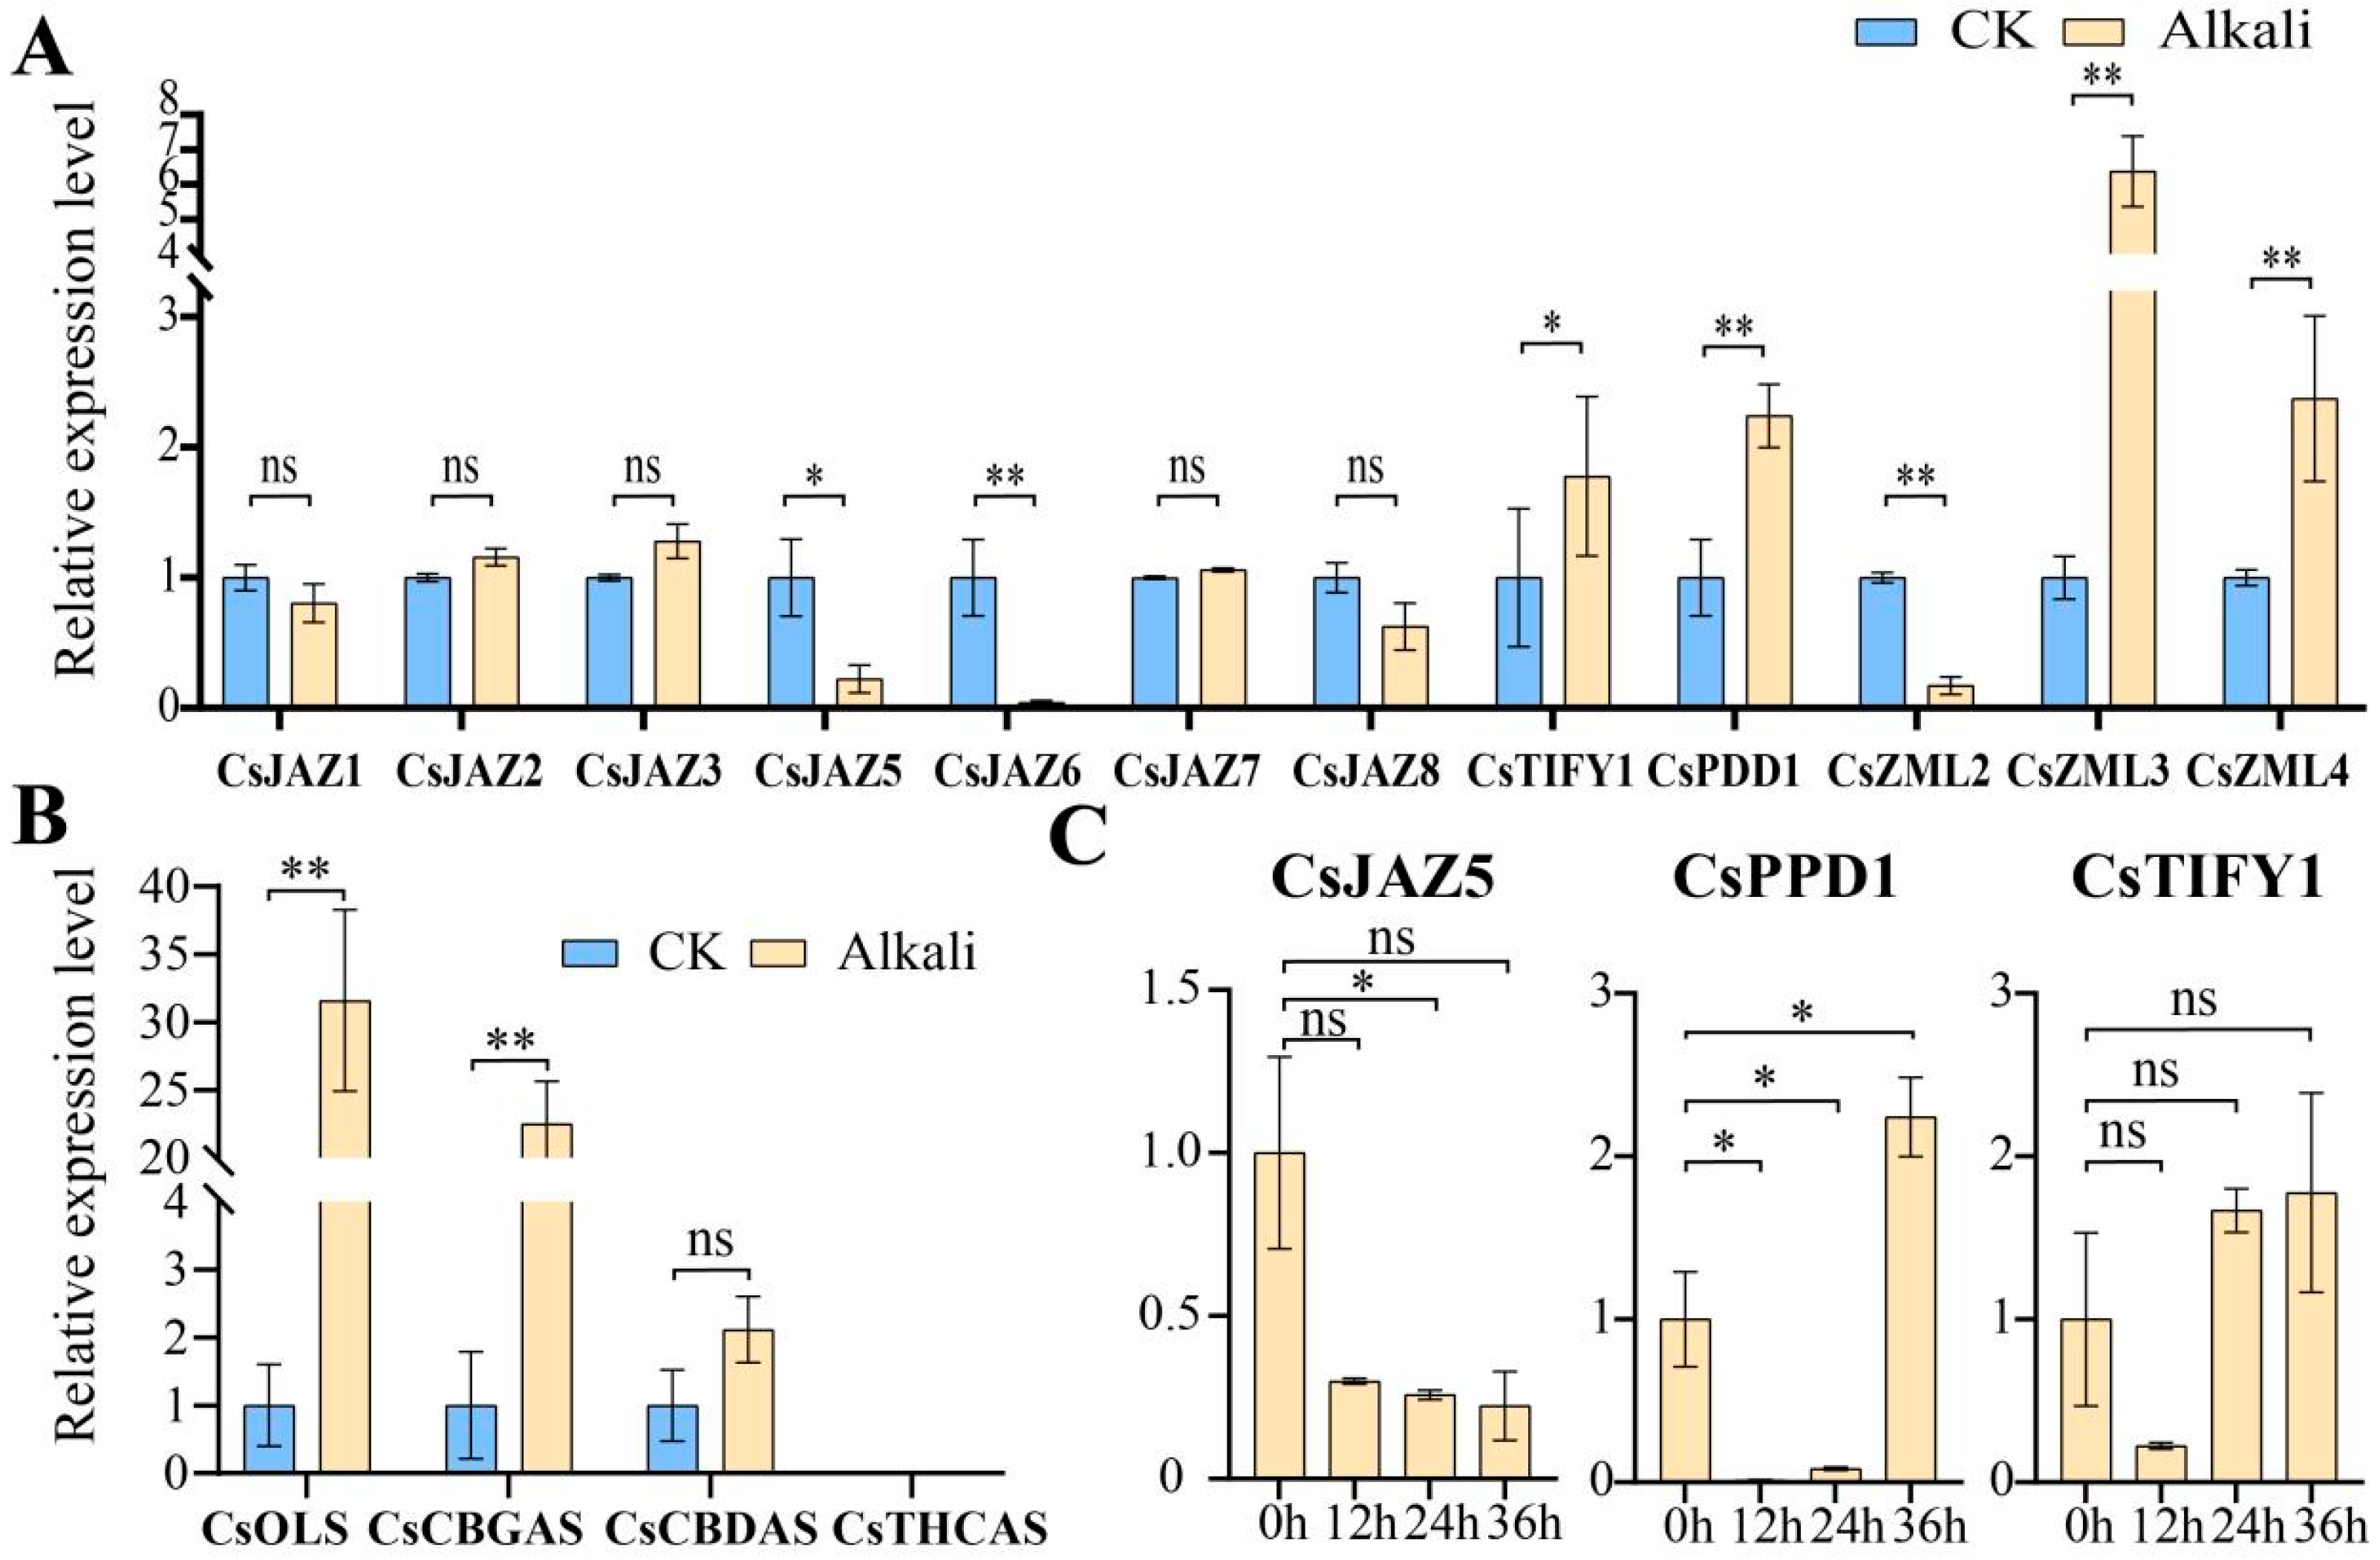
For the alkali stress condition (200 mmol/L Na2CO3), leaf samples were collected at 0, 12, 24, and 36 h, and the relative gene expression levels were quantified by RT-qPCR. Under 200 mmol/L Na2CO3 treatment, the expression levels of CsJAZ1 and CsJAZ8 were reduced, whereas CsJAZ5, CsJAZ6, and CsZML2 were significantly downregulated (Figure 7A). In contrast, the expression of CsJAZ2, CsJAZ3, and CsJAZ7 increased, as did the expression of CsPPD1, CsTIFY1, CsZML3, and CsZML4, with CsZML3 displaying a particularly significant upregulation. Under alkaline stress, both genes exhibited transient downregulation at 12 h, followed by progressive upregulation at later time points (Figure 7C). The observed divergent expression patterns among the seven JAZ subfamily members under alkaline stress suggest potential functional redundancy within this subfamily. In addition, the expression levels of four genes involved in the cannabinoid metabolic pathway (CsOLS, CsCBGAS, CsCBDAS, and CsTHCAS) were analyzed under alkali stress. The relative expression levels of CsOLS and CsCBGAS increased significantly, whereas that of CsCBDAS showed an increasing trend that was not statistically significant. Notably, CsTHCAS expression was undetectable in all biological replicates (Figure 7B).
Furthermore, based on functional prediction and transcriptome profiling, CsJAZ5, CsJAZ8, CsPPD1, and CsTIFY1 were selected for further expression analyses under three stress conditions (Figure S3B). CsJAZ8 was significantly upregulated under drought stress and exhibited a decreasing, although not statistically significant, trend under alkaline stress. CsJAZ5 was significantly downregulated under all three stress conditions, and its expression under alkaline stress displayed a gradual decline over time. CsPPD1 and CsTIFY1 shared the similar expression dynamics, showing the marked upregulation under all stress treatments (Figure S3A). To investigate the response of JAZ genes to JA signaling, the expression patterns of eight JAZ genes were examined under 50 mmol/L MeJA treatment. Except for CsJAZ1, which showed reduced expression, all other JAZ genes were upregulated. All changes were statistically significant, except for CsJAZ6, which showed no significant differences (Figure S3B).

3. Discussion

3.1. Classification of the TIFY Family in C. sativa

TIFY is a plant-specific transcription factor that was officially named by Vanholme in 2007 and subsequently categorized into four subfamilies [2]. Following its initial characterization in A. thaliana [3], the molecular biological functions of TIFY family members have been extensively investigated in various plant species. For instance, 33 TIFY genes have been identified in tobacco, comprising 20 JAZ, 4 PPD, 7 ZML, and 2 TIFY members [14]. In cassava, 28 TIFY genes have been reported, including 16 JAZ, 3 PPD, 7 ZML, and 2 TIFY genes [7]. As a key repressor of the JA signaling pathway, the JAZ subfamily constitutes a substantial portion of the TIFY family and often accounts for nearly half of its members [8]. In this study, 14 TIFY genes were identified, of which eight belonged to the JAZ subfamily, reflecting a similar trend. Initially, CsPPD1 was classified as a member of the JAZ subfamily based on the presence of a TIFY domain and a truncated JAS domain (Figure 1). However, subsequent phylogenetic analysis revealed that CsPPD1 was more closely related to the PPD subfamily in A. thaliana and clustered within the same major branch. Therefore, CsPPD1 was reclassified as a member of the PPD subfamily and renamed accordingly. In A. thaliana, the JAZ subfamily is divided into five branches, and in C. sativa, JAZ is also divided into five branches. The AtTIFYs in these branches correspond to previous studies [1,2], confirming the accuracy of the phylogenetic tree (Figure 1).

3.2. Genetic Structure and Classification of TIFY in C. sativa

The three subfamilies, JAZ, ZML, and TIFY, were clearly defined, and their domains were verified using the CDD search in NCBI. In contrast, the PPD subfamily lacks a well-defined motif and is commonly described as possessing a PPD domain at the N-terminus, which is not annotated in the major protein domain databases. Consequently, CDD search did not support the identification of the PPD domain. In a previous study, Bai et al. reported that models of the PPD domain could not be retrieved from Pfam or other databases during the analysis of TIFY families across 14 genomes [3]. Therefore, HMMER was employed to construct HMM profiles of the PPD domain for subsequent searches. Although additional PPD subfamily members were identified using this approach, the corresponding HMM model and conserved motifs have not been published. Thus, the structural and functional characteristics of the PPD domain remain unclear.
After SMART validation, the PPD domain of CsPPD1 was not identified. However, two low-complexity regions were predicted at positions 94–106 aa and 280–296 aa. Motif analysis indicated that CsJAZ1, CsJAZ5, and CsPPD1 contained an N-terminal Motif10, corresponding to the base sequence “YFKGKGMQWPFSNKVSALPQLJSFKAPQD”. These results suggest that the sequences within the PPD subfamily have the potential for further investigation to elucidate the PPD domain. Comprehensive genome data related to C. sativa have just been released. We will further explore the characteristics of the PPD subfamily using higher-quality comprehensive genome data [58]. Interestingly, Motif2/5 was identified as a conserved element within the TIFY domain, whereas Motif1 was identified as a conserved element of the JAS domain (sequence: RKASLQRFLEKRKER). These motifs constituted the fundamental structural components of the TIFY family and were detected in nearly all TIFY transcription factors (with CsTIFY1 containing only Motif2/5). Motif2 itself harbored a highly conserved TIFY motif of 15 amino acids (QLTIFYGGQVYVFDD), whereas Motif5 immediately contiguous with Motif2 encompassed 13 amino acids (PPDKAQAILLLAG). Both motifs spanned almost the entire TIFY domain. Within the ZML subfamily, Motif1 did not participate in JAS domain formation, whereas it constituted the CCT domain in conjunction with Motif4, with the JAS and CCT domains sharing similar N-terminal sequences. Additionally, Motif3 overlapped with the GATA domain, effectively covering its core structure of the GATA domain and comprising a long motif of 46 amino acids (Figure 2A–C).
The conserved motif represents a critical structural feature required for transcription factor functionality, and the activity of JAZ proteins is primarily dependent on the presence of the JAS domain. The JAZ family in C. sativa exhibits a relatively conserved structure, suggesting its essential role in JA signaling. CsJAZ2 and CsJAZ3 constituted a unique gene pair, demonstrating nearly identical gene sequences, conserved motifs, and protein structures with only minor variations(Figures S4 and S5). These two genes are located at different positions on Chr1 and may have originated from transposable element activity. Moreover, CsJAZ2 and CsJAZ3 were found to exhibit distinct physiological and molecular functions.

3.3. Cis-Acting Elements of the TIFY Family

To facilitate visualization of the quantity and classification of cis-acting elements, a position map of cis-acting elements was integrated with a stacked bar chart (Figure 3A). Owing to the distinct chromosomal distributions of TIFY members, substantial variation was observed in both the type and number of cis-acting elements within their promoter regions. These elements are categorized into four functional classes: light-responsive, stress-responsive, hormone-responsive, and physiologically regulatory. Light-responsive elements were found to be ubiquitously distributed in the promoter regions of all CsTIFY genes, reflecting the essential role of photoreception in plant autotrophic growth [59]. Notably, clusters of densely localized light-responsive elements were detected in specific members. For instance, the six photoresponsive elements in CsPPD1 were concentrated near the 3′ end, consistent with the established role of PPD in regulating leaf and organ development [15,16,18]. Dense light-responsive elements may contribute to photomorphogenic regulation. CsJAZ1 and CsJAZ5 possessed the highest number of light-responsive elements (more than 10), predominantly located in the central region of the promoter. Similarly, the promoter region of the Artemisia argyi JAZ family has been shown to be enriched with light-responsive elements and may be subject to light-mediated regulation [8]. The seven light-responsive elements in CsZML3 are primarily situated near the 5′ end. Other CsTIFY members exhibited fewer photoresponsive elements. This observation is consistent with the findings of Zhao et al., who reported a relatively high abundance of ABA-responsive elements in the TIFY family of Fagopyrum tataricum [60]. In grape, TIFY transcription factors have been confirmed to respond to MeJA and ABA but not to SA or Eth [5]. CsTIFYs are predicted to contain anaerobic induction elements, whereas other stress-responsive elements are relatively scarce. Notably, CsJAZ2 and CsJAZ3 contain anaerobic response enhancers, which may function under hypoxic conditions, such as flooding. The diversity of cis-acting elements suggests that CsTIFY possess a broad range of potential molecular biological functions.

3.4. Homology of the TIFY Family in C. sativa and A. thaliana

A. thaliana AT4G24470 (AtTIFY1) was the first member of the TIFY family to be annotated, initially designated as ZIM. Subsequent studies led to the identification and functional investigation of additional TIFY members [1,2]. However, functional characterization of TIFY transcription factors in C. sativa remains limited, and their biological roles require further elucidation. In early phylogenetic analyses, AtZML1/2 and AtTIFY1 were clustered together, indicating a close evolutionary relationship (Figure 1). In this study, AtTIFY1 clustered more closely with the ZML subfamily, whereas CsTIFY1 exhibited close phylogenetic proximity to AtTIFY8 (Figure 1). Moreover, CsZML1 demonstrated both phylogenetic relatedness and collinearity with AtTIFY1 (Figure 3B). Notably, CsZML1 was significantly downregulated in response to Leptosphaeria and Mucor infection, suggesting its potential role in pathogen defense. Whether CsZML1 performs functions analogous to those of AtZML, such as regulation of hypocotyl elongation and photomorphogenesis [15], remains to be determined. In addition to CsZML1, several members of the JAZ subfamily (CsJAZ1/2/3/6/7/8) exhibited collinearity with A. thaliana JAZ genes. Among them, CsJAZ8 was collinear with AtJAZ8 and positioned in close proximity to the phylogenetic tree alongside AtJAZ7 and AtJAZ13 (Figure 1). In the study by Yan et al. [61], JAZ8 was shown to form a complex with JAV1 and WRKY51 to suppress JA biosynthesis and maintain low JA levels. Upon herbivory, phosphorylation-induced degradation of the JAV1–JAZ8–WRKY51 complex via the 26S proteasome promotes JA accumulation, enabling effective insect defense responses. CsJAZ8 may perform a comparable role in insect defense. Notably, JAZ13 is the only member of the A. thaliana JAZ family not classified within the TIFY family [62]. No homologous transcription factor with high similarity to JAZ13 was identified in C. sativa. However, CsJAZ8 was co-clustered with AtJAZ13 in the JAZ V branch (Figure 1).

3.5. Function Prediction of TIFY Transcription Factors

Under alkali stress, CsJAZ4, CsJAZ5, CsJAZ6, and CsJAZ7 were significantly downregulated (Figure 5A), which may alleviate the repression of the JA signaling pathway and thereby facilitate the activation of downstream biological processes involved in stress response. Concurrently, significant upregulation of CsPPD1, CsTIFY1, and CsZML4 may indicate the involvement in alternative physiological regulatory pathways. In A. thaliana, PPD and ZML genes were implicated in leaf expansion, petiole elongation, and lateral organ development [1,16]. The TIFY family exhibits significant differences in expression among various C. sativa varieties. Specifically, the TIFY family in MT1-3 shows lower expression levels compared to other varieties, and the total cannabinoid content is also the lowest. In contrast, the TIFY family in CC1-3 maintains an overall high expression trend, with its cannabinoid content remaining at a high level (Table S3). In BBK1-3, the expression levels of CsCBDAS and CsTHCAS are lower than those in other varieties, yet its total cannabinoid content is moderate. For CT1-3, the expression of the CsOLS gene is significantly lower than that in other varieties, and its total cannabinoid content is at the bottom (Table S3). The above findings are consistent with those of other studies, which have demonstrated that the expression of cannabinoid metabolism-related genes does not exhibit a direct proportional relationship with cannabinoid content. Instead, the accumulation of precursor substances shows a positive correlation with the increase in cannabinoid content [63,64]. In the present study, we observed a strong correlation between the TIFY family and the cannabinoid metabolic pathway. To further validate this association, we performed a WGCNA analysis, which confirmed that the JAZ2/3/6 genes may be involved in the regulatory network of the cannabinoid metabolic pathway (Figure 6). We will conduct further research to explore in depth their roles in the metabolism of cannabinoids.
To systematically explore the biological functions of TIFY, we extended our analysis to additional high-quality transcriptome datasets (Table S1). We characterized TIFY expression patterns across diverse tissue origins and treatment conditions, allowing for a comprehensive assessment of its functional roles in different physiological and experimental settings. C. sativa is a dioecious species, and sex-specific gene expression differences have been observed [65]. Notably, CsJAZ6 was significantly upregulated in female plants, whereas CsZML3 was significantly downregulated in male plants, suggesting its potential role in floral organ development and sex differentiation (Figure S2A). In the dataset evaluating the effects of Trichoderma hamatum on drought tolerance in C. sativa (Figure S2B), only CsZML1 exhibited significant downregulation in both CON vs. T and CON vs. TDRT comparisons. Compared with other adverse conditions, the TIFY family plays a relatively minor role in drought stress. Following Sclerotinia sclerotiorum infection, significant downregulation of CsZML1, CsPPD1, and CsJAZ6 was observed between 72 and 168 h post-inoculation. Following Sclerotinia sclerotiorum infection, significant downregulation of CsZML1, CsPPD1, and CsJAZ6 was observed between 72 and 168 h post-inoculation. In A. thaliana, PPD and ZML genes were implicated in leaf expansion, petiole elongation, and lateral organ development [1,16]. The downregulation of these transcription factors may reflect pathogen-driven modulation of host growth strategies, possibly enhancing disease tolerance through energy redistribution and attenuation of JA-mediated defense suppression [21,22] (Figure S2C).

3.6. RT-qPCR Analysis of Cannabinoid Metabolism Genes

To validate the results of the WGCNA-based association analysis, we examined the relative expression levels of four genes involved in different steps of the cannabinoid metabolic pathway [66,67] (CsOLS, CsCBGAS, CsCBDAS, and CsTHCAS). Among these, CsOLS (olivetol synthase) is a synthetase of the precursor substance olivetol [63], responsible for catalyzing the conversion of hexanoyl–CoA and malonyl–CoA to olivetol. This enzyme plays a pivotal role in initiating this pathway [68,69]. CsCBGAS (CsPT) is a key rate-limiting enzyme that catalyzes the conversion of olivetolic acid (OAC) and geranyl diphosphate (GPP) to cannabigerolic acid (CBGA), a precursor for the biosynthesis of various cannabinoids [70]. Additionally, CsCBDAS and CsTHCAS encode synthases responsible for producing CBDA and THCA, respectively [71,72]. Under alkali stress, the relative expression levels of CsOLS and CsCBGAS were significantly upregulated, indicating that the cannabinoid metabolic pathway is activated in response to stress. These results are consistent with previous findings that stress promotes the synthesis of secondary metabolites.
Although CsCBDAS expression was detectable, the actual (pre-normalized) expression level was very low, and no statistically significant difference was observed after normalization. Additionally, CsTHCAS expression remained undetectable in repeated experiments (Figure 7B). To reduce experimental variability, all RT-qPCR samples, including those for cannabinoid pathway genes, were collected from the same batch of seedlings. However, cannabinoid biosynthesis primarily occurs in the glandular hairs of leaves, and the number and maturity of glandular hairs in seedlings are considerably lower than those in inflorescence tissues [73,74]. Therefore, the lack of significant CsCBDAS expression may be attributed to the developmental stage and density of the sampled glandular hairs. However, the upregulated expression of CsCBDAS remained evident, suggesting that its expression may be pronounced in female flowers.
For legal compliance, the hemp selected in this study was a low-THC variety with a THC content far below 0.3%, meeting the national standards in both China and the United States [75,76]. The absence of detectable CsTHCAS expression may be attributed to the gradual loss of CsTHCAS genes during long-term breeding of low-THC cultivars. In the WGCNA analysis, the expression of CsJAZ2/6 was highly correlated with CBD and THC levels. Under alkaline stress, CsJAZ2 expression exhibited an upward trend, though the change was not statistically significant, whereas CsJAZ6 expression was significantly downregulated. These results suggest that the regulatory roles of CsJAZ2 and CsJAZ6 in the cannabinoid biosynthetic network are complex. Additionally, CsJAZ3 was positively correlated with the CBG levels, which was consistent with the RT-qPCR results showing an upregulation trend. Future studies should focus on elucidating the functional relationships between these genes. Furthermore, cannabinoid metabolism varies across different developmental stages, and we will continue to investigate these variations. Collectively, our findings support the presence of both positive and negative correlations between TIFY transcription factors and cannabinoid metabolism, paralleling their known roles in secondary metabolism regulation in other plant species [26,27].

3.7. RT-qPCR Analysis of TIFY Transcription Factors

To validate the function and transcriptomic analyses of TIFY family genes, RT-qPCR experiments were performed, yielding relative expression level data. Neither CsJAZ4 nor CsZML1 was detected in the repeated stress response assays, suggesting the potential spatiotemporal specificity of their expression. Notably, CsJAZ2 exhibited consistently high expression levels under both CK and alkaline stress conditions, significantly exceeding those of the other genes. However, CsJAZ2 was not significantly different after normalization. This indicates a possible role in baseline physiological growth. CsJAZ2 shared high homology with AtJAZ1 known to form transcriptional complexes involved in organ development in A. thaliana [22,77]. Therefore, CsJAZ2 may perform analogous molecular functions. A pronounced reduction in CsJAZ6 expression was observed under alkaline stress, corroborating its significant downregulation in the transcriptome dataset. This downregulation may mitigate the suppression of JA signaling, thereby enabling a more robust stress response [60]. Similarly, the decreasing expression trend of CsJAZ5 aligned well with transcriptomic observations. Conversely, CsPPD1, CsTIFY1, and CsZML4 were significantly upregulated in both RT-qPCR and transcriptome analyses. In cassava, MePPD, MeTIFY and MeZML also showed an upregulation trend under stress [7], similar to the above results. These genes may contribute to growth modulation and energy reallocation during stress adaptation 23. Additionally, we observed that CsJAZ2/3/7, which are clustered within the JAZ I clade, exhibited upregulated expression under both alkali stress and MeJA treatment (Figure 7A, Figure S3A). The secondary and tertiary structural similarities of CsJAZ2/3/7 (Figure 4), along with their co-localization on chromosome Chr1, suggest potential functional redundancy.
Additionally, to test whether C. sativa JAZ genes could respond to JA, we sprayed 50 mmol/L MeJA and verified the gene expression levels. Except for CsJAZ6, the expression levels of the other seven JAZ genes showed very significant differences. Among them, the expression of CsJAZ1 showed a downward trend, while that of CsJAZ2/3/4/5/7/8 showed an upward trend. These results confirm that C. sativa JAZ genes are able to respond to JA signals, and a similar trend in response to JA signals was also verified in VvJAZ and BnaJAZ [5,12]. During the alkali treatment, we simultaneously conducted drought and salt–alkali treatments and selected several key genes for investigation. These genes exhibited consistent expression trends in both transcriptome profiles and RT-qPCR analyses (Figure S3B). Notably, CsJAZ8 expression was undetectable in the salt–alkaline treatment group, suggesting that other regulatory factors might have inhibited its transcription. Under drought stress, CsJAZ8 expression increased significantly, showing a highly significant difference, whereas it trended downward under alkaline stress with no significant change. These findings indicate that CsJAZ8 may play a crucial role in mediating drought stress responses. Multiple studies have also confirmed that JAZ is involved in the drought response [78]. CsJAZ5 was significantly downregulated under both salt–alkaline and drought stresses, particularly in the former, implying its major function in salt–alkaline tolerance. CsPPD1 and CsTIFY1 displayed similar expression patterns under stress, with varying degrees of upregulation. Specifically, CsPPD1 showed the most significant response to salt–alkaline stress (highly significant difference), while CsTIFY1 exhibited the greatest change under drought conditions. Additionally, we analyzed the dynamic expression profiles of CsJAZ5, CsPPD1, and CsTIFY1 from 0 to 36 h under alkaline stress. CsJAZ5 expression decreased gradually over time, whereas CsPPD1 and CsTIFY1 showed a pattern of initial decrease followed by increase, confirming that alkali stress tolerance involves complex regulatory mechanisms. A notable observation is that, in other studies [7,79], members of the TIFY family also exhibited an expression pattern characterized by an initial decrease followed by an increase. This phenomenon can be attributed to several factors: due to functional redundancy within gene families, different family members may regulate distinct physiological processes (e.g., altering water conductivity, modifying tissue structure, or protecting enzyme activity). As stress intensifies gradually, one protective mechanism may become ineffective, while another related family member is strongly induced. Furthermore, regulatory mechanisms such as transcription factor phosphorylation and negative feedback loops may also influence the results obtained from RT-qPCR [80]. This fluctuating expression pattern reflects a complex physiological and molecular process, which we plan to explore through physiological and biochemical experiments in our subsequent research. As inhibitors of JA signaling, JAZ typically exhibit low expression under adverse conditions to facilitate JA-mediated defense responses. In contrast, subfamilies such as PPD, TIFY, and ZML often upregulate their expression to modulate plant physiological adjustments during stress [81,82]. Thus, this study explores the expression dynamics of the TIFY family under adverse environmental conditions. Notably, overexpression of CsJAZ2 in Glycine soja has been demonstrated to enhance plant tolerance to salt–alkaline conditions. CsTIFYs have a rich expression pattern in response to alkaline stress, and they have the potential to improve salt–alkaline tolerance through overexpression [36].

4. Materials and Methods

4.1. Genome-Wide Identification of TIFY Transcription Factors in C. sativa

Whole-genome sequences of A. thaliana (GCF_000001735.4) and C. sativa. (GCF_900626175.2) were downloaded from NCBI (https://www.ncbi.nlm.nih.gov/datasets/genome/, accessed on 15 August 2024). The TIFY gene family sequences in A. thaliana, including JAZ13, were retrieved from NCBI (https://www.ncbi.nlm.nih.gov/gene/?term=TIFY, accessed on 15 August 2024). The Hidden Markov Model (HMM) profiles of conserved domains within the TIFY family were obtained from InterPro (https://www.ebi.ac.uk/interpro/, accessed on 15 August 2024), including the TIFY domain (PF06200), jasmonate domain (PF09425), and the CCT domain (PF06230). Subsequently, both “BLAST” (E-value < 1 × 10⁻⁵; NumofHits = 500; NumofAlignments = 250) and “Simple HMM Search” in TBtools (v2.154) [83] were used for sequence comparison. The intersection of the results from both methods was retained for further analysis. Preliminary domain verification was conducted using the Batch CDD Search tool (https://www.ncbi.nlm.nih.gov/Structure/bwrpsb/bwrpsb.cgi, accessed on 15 August 2024), and sequences lacking the required conserved domains were excluded. Genes with qualified domain structures were retained, and the final protein sequences of the C. sativa TIFY gene family were obtained.

4.2. Physicochemical Property Prediction, Chromosome Localization, and Evolutionary Analysis of TIFY Transcription Factor

ExPASy (https://web.expasy.org/protparam, accessed on 16 August 2024) was used to predict the physicochemical properties of protein sequences. Upon inputting each sequence, the number of amino acids, molecular weight, isoelectric point (pI), instability index, and grand average of hydropathicity (GRAVY) were obtained. Chromosome localization was visualized using the GTF/GFF-based location visualization tool in TBtools. Multiple sequence alignment of the protein sequences was conducted using MUSCLE Wrapper in TBtools (maximum iteration = 16, maximum hours = 0). The aligned sequences were subsequently trimmed using trimAL Wrapper in TBtools to remove excessively long regions. The trimming pattern selected was ML_AUTOMATED1. The resulting processed sequences were then used to construct a phylogenetic tree using the FastTree GUI Wrapper in TBtools. Final visualization and beautification of the phylogenetic tree were performed using TVBOT (https://www.chiplot.online/tvbot.html, accessed on 16 August 2024) [84].

4.3. Gene Structure and Collinearity Analysis of TIFY Transcription Factors

MEME (https://meme-suite.org/meme/tools/meme, accessed on 20 August 2024) was used to predict the conserved motifs within the TIFY protein family, with 10 motifs. The conserved motif patterns of CsTIFY proteins were subsequently visualized using Jalview Simple Launcher in TBtools to illustrate their shared and divergent features. The secondary and tertiary structures of TIFY proteins were predicted using NPS@SOPMA (https://npsa.lyon.inserm.fr, accessed on 5 September 2024) and SWISS-MODEL (https://swissmodel.expasy.org, accessed on 5 September 2024), respectively. During secondary structure prediction, the proportions of alpha helices, extended strands, and random coils were recorded and compiled in the same dataset, along with physicochemical properties and gene information. For collinearity analysis, the genome and annotation files of A. thaliana and C. sativa were inputted into the One Step MCScanX module in TBtools to generate whole-genome collinear blocks. The resulting collinearity data, along with the corresponding gene names, were then visualized using the Dual Synteny Plot function in TBtools.

4.4. Cis-Acting Element Prediction of TIFY Transcription Factors

The promoter sequences (2000 bp upstream) of CsTIFY genes were extracted using the GTF/GFF3 Extract function and submitted to PlantCARE (https://bioinformatics.psb.ugent.be/webtools/plantcare/html/, accessed on 21 February 2025) for cis-acting element prediction. Duplicate and erroneous entries were removed from the cis-element dataset, followed by the classification and quantification of the elements associated with each gene. A stacked bar chart illustrating the number of cis-acting elements was generated using GraphPad Prism 8.0 and subsequently merged with positional plots using Adobe Illustrator 2024. All combined figures presented in the article were finalized using Adobe Illustrator 2024.

4.5. Expression Patterns of CsTIFYs in Gender Differences and Adverse Stress

To preliminarily investigate the molecular functions of CsTIFY genes, two high-quality transcriptome datasets were downloaded from the NCBI GEO database (https://www.ncbi.nlm.nih.gov/geo/, accessed on 21 February 2025; PRJNA672722, PRJNA498707; Supplementary Table S1). PRJNA672722 represented the C. sativa transcriptomic data under alkaline stress. PRJNA498707 contains transcriptomic data derived from the glandular trichomes of female C. sativa flowers. Because of the comprehensive sample size and phenotypic data available in PRJNA498707, this dataset was selected for WGCNA. The remaining dataset was excluded from WGCNA because of its insufficient sample size. WGCNA was conducted using the WGCNA Shiny plugin in TBtools, following the protocol described by Wang et al. [85]. The expression data for CsTIFY genes were extracted from the aforementioned transcriptome datasets, and a gene expression heatmap was generated using the HeatMap function in TBtools.

4.6. Stress Treatment and RNA Extraction

In this study, the hemp variety we used was Longdama 6 (LDM6), which is a type of high-CBD medicinal hemp. Additionally, the THC content of LDM6 is significantly lower than 0.3%. The seeds were harvested from Kangjin town, Heilongjiang (126°48′ E, 46°11′ N), China. The seeds were sown in pots, with the following cultivation conditions: the temperature maintained at 25 °C, humidity maintained at 65%, and a light/dark cycle of 16 h of light followed by 8 h of darkness [86]. Eight-week-old plants of similar size were selected and divided into several groups. One group was subjected to alkaline treatment, where the plants were irrigated with a 200 mmol/L Na2CO3 solution (alkaline treatment group), while the other group received the same volume of water (control group). Apical leaf samples were collected 36 h after treatment and cryopreserved. Additionally, for the alkaline stress treatment, leaf samples were collected at 0, 12, 24, and 36 h and stored at −80 °C for further analysis. Total RNA was extracted from frozen leaf tissues using the Total RNA Extractor (Trizol) kit. Reverse transcription was performed using Maxima Reverse Transcriptase (Thermo Scientific, Shanghai, China) following the manufacturer’s instructions.

4.7. Primer Design and RT-qPCR Analysis

The CDS of CsTIFYs was obtained from the genome, and specific primers were designed using PRIMER PREMIER 6.0. The parameters were set as follows: a primer length of 18–24 bp, GC content of 40–60%, melting temperature of 55–60 °C, and amplicon length of 120–260 bp (Table S2). In addition to the 14 TIFY genes, we designed four primers, each corresponding to a gene involved in cannabinoid metabolic pathways (CsOLS, CsCBGAS, CsCBDAS, and CsTHCAS). Based on the method described by Guo et al. [87], CsEF1α was used as the internal reference gene. RT-qPCR was performed using the 2× SGExcel FastSYBR Mixture (Sangon, Shanghai, China) on a Thermo Fisher Scientific 7500 Real-Time PCR System (ABI 7500 Software). Each 20 μL reaction consisted of the recommended reagent mixture, and the thermal cycling program was set as follows: initial denaturation at 95 °C for 3 min and 40 cycles of 95 °C for 15 s and 60 °C for 45 s, followed by a melt curve analysis. All reactions were performed in triplicate. Relative gene expression levels were calculated using the 2−∆∆Ct method [88] and statistically analyzed using IBM SPSS Statistics version 26.0. The experimental design is illustrated in Figure S1.

5. Conclusions

TIFY transcription factors are known to play critical regulatory roles in secondary metabolism and stress responses. Although members of the TIFY family have been identified and functionally characterized in numerous crop species, limited information is available regarding TIFY transcription factors in C. sativa. In this study, 14 TIFY transcription factors were identified using bioinformatics approaches combined with transcriptomic data. These members were classified into four subgroups exhibiting distinct differences in gene structures, protein features, and predicted functions. Among them, the JAZ subfamily acted as a key suppressor of JA signaling. Consistent expression patterns between transcriptome datasets and RT-qPCR experiments confirmed the involvement of CsJAZ5/6, CsPPD1, and CsTIFY1 in alkaline stress responses and cannabinoid metabolism. Moreover, CsJAZ2/3/6 were implicated in the regulatory network of cannabinoids and warrant further investigation. However, the precise molecular mechanisms linking TIFY transcription factors to cannabinoid production remain largely unexplored. Future research should focus on elucidating the physiological functions of CsJAZ5/6, CsPPD1, and CsTIFY1 in stress adaptation and cannabinoid accumulation. This study provides a foundational dataset supporting the potential involvement of TIFY transcription factors in the alkaline stress response and cannabinoid metabolism in C. sativa.

Supplementary Materials

The following supporting information can be downloaded at: https://www.mdpi.com/article/10.3390/ijms26178171/s1. Reference [57] is cited in the Supplementary Materials.

Author Contributions

Y.Z. performed bioinformatics analysis and wrote the original draft. B.Y. and Y.S. downloaded the base data and preprocessed them. L.Z. and M.Z. provided guidance on the topic of the manuscript and conducted data processing. Y.F. and N.Z. reviewed and corrected the manuscript. All authors have read and agreed to the published version of the manuscript.

Funding

This research was funded by the Heilongjiang Province agricultural science and technology innovation span project (CX23GG04).

Acknowledgments

The authors would like to thank all the reviewers who participated in the review of this manuscript.

Conflicts of Interest

The authors declare no conflict of interest.

References

  1. Shikata, M.; Matsuda, Y.; Ando, K.; Nishii, A.; Takemura, M.; Yokota, A.; Kohchi, T. Characterization of Arabidopsis ZIM, a member of a novel plant-specific GATA factor gene family. J. Exp. Bot. 2004, 55, 631–639. [Google Scholar] [CrossRef]
  2. Vanholme, B.; Grunewald, W.; Bateman, A.; Kohchi, T.; Gheysen, G. The tify family previously known as ZIM. Trends Plant Sci. 2007, 12, 239–244. [Google Scholar] [CrossRef]
  3. Bai, Y.; Meng, Y.; Huang, D.; Qi, Y.; Chen, M. Origin and evolutionary analysis of the plant-specific TIFY transcription factor family. Genomics 2011, 98, 128–136. [Google Scholar] [CrossRef]
  4. Zhao, G.; Song, Y.; Wang, C.; Butt, H.I.; Wang, Q.; Zhang, C.; Yang, Z.; Liu, Z.; Chen, E.; Zhang, X.; et al. Genome-wide identification and functional analysis of the TIFY gene family in response to drought in cotton. Mol. Genet. Genom. 2016, 291, 2173–2187. [Google Scholar] [CrossRef] [PubMed]
  5. Zhang, Y.; Gao, M.; Singer, S.D.; Fei, Z.; Wang, H.; Wang, X. Genome-wide identification and analysis of the TIFY gene family in grape. PLoS ONE 2012, 7, e44465. [Google Scholar] [CrossRef] [PubMed]
  6. Li, X.; Wen, K.; Zhu, L.; Chen, C.; Yin, T.; Yang, X.; Zhao, K.; Zi, Y.; Zhang, H.; Luo, X.; et al. Genome-wide identification and expression analysis of the Eriobotrya japonica TIFY gene family reveals its functional diversity under abiotic stress conditions. BMC Genom. 2024, 25, 468. [Google Scholar] [CrossRef] [PubMed]
  7. Zheng, L.; Wan, Q.; Wang, H.; Guo, C.; Niu, X.; Zhang, X.; Zhang, R.; Chen, Y.; Luo, K. Genome-wide identification and expression of TIFY family in cassava (Manihot esculenta Crantz). Front. Plant Sci. 2022, 13, 1017840. [Google Scholar] [CrossRef]
  8. Lian, C.; Zhang, B.; Li, J.; Yang, H.; Liu, X.; Ma, R.; Zhang, F.; Liu, J.; Yang, J.; Lan, J.; et al. Genome-wide identification, characterization and expression pattern analysis of TIFY family members in Artemisia argyi. BMC Genom. 2024, 25, 925. [Google Scholar] [CrossRef]
  9. Guan, Y.; Zhang, Q.; Li, M.; Zhai, J.; Wu, S.; Ahmad, S.; Lan, S.; Peng, D.; Liu, Z.J. Genome-Wide Identification and Expression Pattern Analysis of TIFY Family Genes Reveal Their Potential Roles in Phalaenopsis aphrodite Flower Opening. Int. J. Mol. Sci. 2024, 25, 5422. [Google Scholar] [CrossRef]
  10. Ebel, C.; BenFeki, A.; Hanin, M.; Solano, R.; Chini, A. Characterization of wheat (Triticum aestivum) TIFY family and role of Triticum Durum TdTIFY11a in salt stress tolerance. PLoS ONE 2018, 13, e0200566. [Google Scholar] [CrossRef]
  11. Wang, Y.; Pan, F.; Chen, D.; Chu, W.; Liu, H.; Xiang, Y. Genome-wide identification and analysis of the Populus trichocarpa TIFY gene family. Plant Physiol. Biochem. 2017, 115, 360–371. [Google Scholar] [CrossRef]
  12. He, X.; Kang, Y.; Li, W.; Liu, W.; Xie, P.; Liao, L.; Huang, L.; Yao, M.; Qian, L.; Liu, Z.; et al. Genome-wide identification and functional analysis of the TIFY gene family in the response to multiple stresses in Brassica napus L. BMC Genom. 2020, 21, 736. [Google Scholar] [CrossRef]
  13. Liu, T.; Liu, Z.; Ban, Q.; Zhou, L.; Cui, Q. Cloning and tissue expression analysis of TIFY genes in Luffa cylindrica. Acta Bot. Boreali-Occident. Sin. 2024, 44, 1752–1759. [Google Scholar]
  14. Zhang, H.; Liu, Z.; Geng, R.; Ren, M.; Cheng, L.; Liu, D.; Jiang, C.; Wen, L.; Xiao, Z.; Yang, A. Genome-wide identification of the TIFY gene family in tobacco and expression analysis in response to Ralstonia solanacearum infection. Genomics 2024, 116, 110823. [Google Scholar] [CrossRef] [PubMed]
  15. White, D.W. PEAPOD regulates lamina size and curvature in Arabidopsis. Proc. Natl. Acad. Sci. USA 2006, 103, 13238–13243. [Google Scholar] [CrossRef] [PubMed]
  16. Zhu, Y.; Luo, X.; Liu, X.; Wu, W.; Cui, X.; He, Y.; Huang, J. Arabidopsis PEAPODs function with LIKE HETEROCHROMATIN PROTEIN1 to regulate lateral organ growth. J. Integr. Plant Biol. 2020, 62, 812–831. [Google Scholar] [CrossRef] [PubMed]
  17. Xu, X.; Wen, T.; Ren, A.; Li, D.; Dawood, M.; Wu, J.; Zhao, G. Gossypium arboreum PPD2 facilitates root architecture development to increase plant resilience to salt stress. Physiol. Plant. 2024, 176, e14473. [Google Scholar] [CrossRef]
  18. White, D.W.R. PEAPOD repressors modulate and coordinate developmental responses to light intensity in Arabidopsis. New Phytol. 2022, 235, 1470–1485. [Google Scholar] [CrossRef]
  19. Naito, K.; Takahashi, Y.; Chaitieng, B.; Hirano, K.; Kaga, A.; Takagi, K.; Ogiso-Tanaka, E.; Thavarasook, C.; Ishimoto, M.; Tomooka, N. Multiple organ gigantism caused by mutation in VmPPD gene in blackgram (Vigna mungo). Breed. Sci. 2017, 67, 151–158. [Google Scholar] [CrossRef]
  20. Chini, A.; Fonseca, S.; Fernández, G.; Adie, B.; Chico, J.M.; Lorenzo, O.; García-Casado, G.; López-Vidriero, I.; Lozano, F.M.; Ponce, M.R.; et al. The JAZ family of repressors is the missing link in jasmonate signalling. Nature 2007, 448, 666–671. [Google Scholar] [CrossRef]
  21. Thines, B.; Katsir, L.; Melotto, M.; Niu, Y.; Mandaokar, A.; Liu, G.; Nomura, K.; He, S.Y.; Howe, G.A.; Browse, J. JAZ repressor proteins are targets of the SCF(COI1) complex during jasmonate signalling. Nature 2007, 448, 661–665. [Google Scholar] [CrossRef] [PubMed]
  22. Liu, B.; Seong, K.; Pang, S.; Song, J.; Gao, H.; Wang, C.; Zhai, J.; Zhang, Y.; Gao, S.; Li, X.; et al. Functional specificity, diversity, and redundancy of Arabidopsis JAZ family repressors in jasmonate and COI1-regulated growth, development, and defense. New Phytol. 2021, 231, 1525–1545. [Google Scholar] [CrossRef]
  23. Zhang, T.; Meng, L.; Kong, W.; Yin, Z.; Wang, Y.; Schneider, J.D.; Chen, S. Quantitative proteomics reveals a role of JAZ7 in plant defense response to Pseudomonas syringae DC3000. J. Proteom. 2018, 175, 114–126. [Google Scholar] [CrossRef]
  24. Thatcher, L.F.; Cevik, V.; Grant, M.; Zhai, B.; Jones, J.D.; Manners, J.M.; Kazan, K. Characterization of a JAZ7 activation-tagged Arabidopsis mutant with increased susceptibility to the fungal pathogen Fusarium oxysporum. J. Exp. Bot. 2016, 67, 2367–2386. [Google Scholar] [CrossRef] [PubMed]
  25. Zhang, S.; Zheng, D.; Gao, Y.; She, M.; Wu, Z.; Lu, Y.; Zhang, Z. The TIFY transcription factor ZmJAZ13 enhances plant tolerance to drought and salt stress by interacting with ZmbHLH161 and ZmA0A1D6GLB9. Plant Sci. 2025, 352, 112388. [Google Scholar] [CrossRef] [PubMed]
  26. Ju, F.; Wang, J.; Xu, K.; Xu, Q.; Liu, X.; Tian, T.; Du, Z.; Wang, J.; Liao, Z.; Wang, B.; et al. Genome-wide insights into the nomenclature, evolution and expression of tobacco TIFY/JAZ genes. Planta 2025, 261, 103. [Google Scholar] [CrossRef]
  27. Qing, H.; Wu, Z.; Mo, X.; Wei, J.; Shi, Y.; Guo, H.; Xu, J.; Ding, F.; Zhang, S. Genome-Wide Identification of the TIFY Family in Longan and Their Potential Functional Analysis in Anthocyanin Synthesis. Biology 2025, 14, 364. [Google Scholar] [CrossRef]
  28. Yang, F.; Wang, Z.; Ma, H.; Yang, F.; Tian, C.; An, F. Research and integrated demonstration of ecological amelioration techniques of saline-sodic land in northeast China. Acta Ecol. Sin. 2016, 36, 7054–7058. [Google Scholar] [CrossRef]
  29. Lin, J.; Song, G.; Zhang, Y. Regionalization planning for prevention and control of saline-alkali land based on a landscape ecology risk pattern theory: A case study in Lindian County, Heilongjiang Province. Acta Ecol. Sin. 2018, 38, 5509–5518. [Google Scholar] [CrossRef]
  30. Xia, N.; Wang, Y.; Xu, H.; Sun, Y.; Yuan, Y.; Cheng, L.; Jiang, P.; Li, M. Demarcation of Prime Farmland Protection Areas around a Metropolis Based on High-Resolution Satellite Imagery. Sci. Rep. 2016, 6, 37634. [Google Scholar] [CrossRef]
  31. Cao, K.; Sun, Y.F.; Zhang, X.; Zhao, Y.; Bian, J.; Zhu, H.; Wang, P.; Gao, B.; Sun, X.; Hu, M.; et al. The miRNA-mRNA regulatory networks of the response to NaHCO3 stress in industrial hemp (Cannabis sativa L.). BMC Plant Biol. 2023, 23, 509. [Google Scholar] [CrossRef]
  32. Cao, K.; Sun, Y.F.; Han, C.W.; Zhang, X.O.; Zhao, Y.; Jiang, Y.; Jiang, Y.Z.; Sun, X.L.; Guo, Y.X.; Wang, X.N. The transcriptome of saline-alkaline resistant industrial hemp (Cannabis sativa L.) exposed to NaHCO3 stress. Ind. Crops Products 2021, 170, 113766. [Google Scholar] [CrossRef]
  33. Lv, Z.; Niu, L.; Hao, J. A Review of Research on China′s Prime Farmland. Jiangsu Agric. Sci. 2017, 45, 24–27. [Google Scholar]
  34. Zhang, P.; Duo, T.; Wang, F.; Zhang, X.; Yang, Z.; Hu, G. De novo transcriptome in roots of switchgrass (Panicum virgatum L.) reveals gene expression dynamic and act network under alkaline salt stress. BMC Genom. 2021, 22, 82. [Google Scholar] [CrossRef]
  35. Jiao, Y.; Xie, R.J.; Jia, H.M. Identification of Potential Pathways of Morella cerifera Seedlings in Response to Alkali Stress via Transcriptomic Analysis. Plants 2022, 11, 1053. [Google Scholar] [CrossRef]
  36. Zhu, D.; Bai, X.; Chen, C.; Chen, Q.; Cai, H.; Li, Y.; Ji, W.; Zhai, H.; Lv, D.; Luo, X.; et al. GsTIFY10, a novel positive regulator of plant tolerance to bicarbonate stress and a repressor of jasmonate signaling. Plant Mol. Biol. 2011, 77, 285–297. [Google Scholar] [CrossRef] [PubMed]
  37. Zhu, D.; Cai, H.; Luo, X.; Bai, X.; Deyholos, M.K.; Chen, Q.; Chen, C.; Ji, W.; Zhu, Y. Over-expression of a novel JAZ family gene from Glycine soja, increases salt and alkali stress tolerance. Biochem. Biophys. Res. Commun. 2012, 426, 273–279. [Google Scholar] [CrossRef] [PubMed]
  38. Van Bakel, H.; Stout, J.M.; Cote, A.G.; Tallon, C.M.; Sharpe, A.G.; Hughes, T.R.; Page, J.E. The draft genome and transcriptome of Cannabis sativa. Genome Biol. 2011, 12, R102. [Google Scholar] [CrossRef] [PubMed]
  39. Haiden, S.R.; Apicella, P.V.; Ma, Y.; Berkowitz, G.A. Overexpression of CsMIXTA, a Transcription Factor from Cannabis sativa, Increases Glandular Trichome Density in Tobacco Leaves. Plants 2022, 11, 1519. [Google Scholar] [CrossRef]
  40. Elsohly, M.A.; Slade, D. Chemical constituents of marijuana: The complex mixture of natural cannabinoids. Life Sci. 2005, 78, 539–548. [Google Scholar] [CrossRef]
  41. Apicella, P.V.; Sands, L.B.; Ma, Y.; Berkowitz, G.A. Delineating genetic regulation of cannabinoid biosynthesis during female flower development in Cannabis sativa. Plant Direct 2022, 6, e412. [Google Scholar] [CrossRef] [PubMed]
  42. Wieckiewicz, G.; Stokłosa, I.; Stokłosa, M.; Gorczyca, P.; Pudlo, R. Cannabidiol (CBD) in the Self-Treatment of Depression-Exploratory Study and a New Phenomenon of Concern for Psychiatrists. Front. Psychiatry 2022, 13, 837946. [Google Scholar] [CrossRef] [PubMed]
  43. Dahlgren, M.K.; Lambros, A.M.; Smith, R.T.; Sagar, K.A.; El-Abboud, C.; Gruber, S.A. Clinical and cognitive improvement following full-spectrum, high-cannabidiol treatment for anxiety: Open-label data from a two-stage, phase 2 clinical trial. Commun. Med. 2022, 2, 139. [Google Scholar] [CrossRef] [PubMed]
  44. Roebuck, A.J.; Greba, Q.; Onofrychuk, T.J.; McElroy, D.L.; Sandini, T.M.; Zagzoog, A.; Simone, J.; Cain, S.M.; Snutch, T.P.; Laprairie, R.B.; et al. Dissociable changes in spike and wave discharges following exposure to injected cannabinoids and smoked cannabis in Genetic Absence Epilepsy Rats from Strasbourg. Eur. J. Neurosci. 2022, 55, 1063–1078. [Google Scholar] [CrossRef]
  45. Bonn-Miller, M.O.; Sisley, S.; Riggs, P.; Yazar-Klosinski, B.; Wang, J.B.; Loflin, M.J.E.; Shechet, B.; Hennigan, C.; Matthews, R.; Emerson, A.; et al. The short-term impact of 3 smoked cannabis preparations versus placebo on PTSD symptoms: A randomized cross-over clinical trial. PLoS ONE 2021, 16, e0246990. [Google Scholar] [CrossRef]
  46. Wang, B.; Li, D.; Fiselier, A.; Kovalchuk, I.; Kovalchuk, O. New AKT-dependent mechanisms of anti-COVID-19 action of high-CBD Cannabis sativa extracts. Cell Death Discov. 2022, 8, 110. [Google Scholar] [CrossRef]
  47. Borroto Fernandez, E.; Peterseil, V.; Hackl, G.; Menges, S.; de Meijer, E.; Staginnus, C. Distribution of Chemical Phenotypes (Chemotypes) in European Agricultural Hemp. (Cannabis sativa L.) Cultivars. J. Forensic Sci. 2020, 65, 715–721. [Google Scholar] [CrossRef]
  48. Zubcevic, K.; Petersen, M.; Bach, F.W.; Heinesen, A.; Enggaard, T.P.; Almdal, T.P.; Holbech, J.V.; Vase, L.; Jensen, T.S.; Hansen, C.S.; et al. Oral capsules of tetra-hydro-cannabinol (THC), cannabidiol (CBD) and their combination in peripheral neuropathic pain treatment. Eur. J. Pain 2023, 27, 492–506. [Google Scholar] [CrossRef]
  49. Saloner, A.; Bernstein, N. Nitrogen supply affects cannabinoid and terpenoid profile in medical cannabis (Cannabis sativa L.). Ind. Crops Prod. 2021, 167, 113516. [Google Scholar] [CrossRef]
  50. Saloner, A.; Bernstein, N. Nitrogen Source Matters: High NH4/NO3 Ratio Reduces Cannabinoids, Terpenoids, and Yield in Medical Cannabis. Front. Plant Sci. 2022, 13, 830224. [Google Scholar] [CrossRef]
  51. Shiponi, S.; Bernstein, N. The Highs and Lows of P Supply in Medical Cannabis: Effects on Cannabinoids, the Ionome, and Morpho-Physiology. Front. Plant Sci. 2021, 12, 657323. [Google Scholar] [CrossRef] [PubMed]
  52. Baas, R.; Wijnen, D. Salinity effects on yield and nutrient uptake in Cannabis sativa L. In XXXI International Horticultural Congress (IHC2022): International Symposium on Innovative Technologies and Production; ISHS Acta Horticulturae: Leuven, Belgium, 2023; Volume 1377, pp. 785–792. [Google Scholar]
  53. Saloner, A.; Sade, Y.; Bernstein, N. To flush or not to flush: Does flushing the growing media affect cannabinoid and terpenoid production in cannabis? Ind. Crops Prod. 2024, 220, 119157. [Google Scholar] [CrossRef]
  54. Rodriguez-Morrison, V.; Llewellyn, D.; Zheng, Y. Cannabis Yield, Potency, and Leaf Photosynthesis Respond Differently to Increasing Light Levels in an Indoor Environment. Front Plant Sci. 2021, 12, 646020. [Google Scholar] [CrossRef] [PubMed]
  55. Booth, J.K.; Page, J.E.; Bohlmann, J. Terpene synthases from Cannabis sativa. PLoS ONE 2017, 12, e0173911. [Google Scholar] [CrossRef]
  56. Booth, J.K.; Yuen, M.M.S.; Jancsik, S.; Madilao, L.L.; Page, J.E.; Bohlmann, J. Terpene Synthases and Terpene Variation in Cannabis sativa. Plant Physiol. 2020, 184, 130–147. [Google Scholar] [CrossRef]
  57. Zager, J.J.; Lange, I.; Srividya, N.; Smith, A.; Lange, B.M. Gene Networks Underlying Cannabinoid and Terpenoid Accumulation in Cannabis. Plant Physiol. 2019, 180, 1877–1897. [Google Scholar] [CrossRef]
  58. Lynch, R.C.; Padgitt-Cobb, L.K.; Garfinkel, A.R.; Knaus, B.J.; Hartwick, N.T.; Allsing, N.; Aylward, A.; Bentz, P.C.; Carey, S.B.; Mamerto, A.; et al. Domesticated cannabinoid synthases amid a wild mosaic cannabis pangenome. Nature 2025, 643, 1001–1010. [Google Scholar] [CrossRef]
  59. Li, J.; Terzaghi, W.; Deng, X.W. Genomic basis for light control of plant development. Protein Cell 2012, 3, 106–116. [Google Scholar] [CrossRef]
  60. Zhao, Z.; Meng, G.; Zamin, I.; Wei, T.; Ma, D.; An, L.; Yue, X. Genome-Wide Identification and Functional Analysis of the TIFY Family Genes in Response to Abiotic Stresses and Hormone Treatments in Tartary Buckwheat (Fagopyrum tataricum). Int. J. Mol. Sci. 2023, 24, 10916. [Google Scholar] [CrossRef]
  61. Yan, C.; Fan, M.; Yang, M.; Zhao, J.; Zhang, W.; Su, Y.; Xiao, L.; Deng, H.; Xie, D. Injury Activates Ca2+/Calmodulin-Dependent Phosphorylation of JAV1-JAZ8-WRKY51 Complex for Jasmonate Biosynthesis. Mol. Cell 2018, 70, 136–149. [Google Scholar] [CrossRef]
  62. Thireault, C.; Shyu, C.; Yoshida, Y.; St Aubin, B.; Campos, M.L.; Howe, G.A. Repression of jasmonate signaling by a non-TIFY JAZ protein in Arabidopsis. Plant J. 2015, 82, 669–679. [Google Scholar] [CrossRef] [PubMed]
  63. Sng, B.J.R.; Jeong, Y.J.; Leong, S.H.; Jeong, J.C.; Lee, J.; Rajani, S.; Kim, C.Y.; Jang, I.C. Genome-wide identification of cannabinoid biosynthesis genes in non-drug type Cannabis (Cannabis sativa L.) cultivar. J. Cannabis Res. 2024, 6, 35. [Google Scholar] [CrossRef] [PubMed]
  64. Sun, X. Research Progress on Cannabinoids in Cannabis (Cannabis sativa L.) in China. Molecules 2023, 28, 3806. [Google Scholar] [CrossRef] [PubMed]
  65. Szalata, M.; Dreger, M.; Zielińska, A.; Banach, J.; Szalata, M.; Wielgus, K. Simple Extraction of Cannabinoids from Female Inflorescences of Hemp (Cannabis sativa L.). Molecules 2022, 27, 5868. [Google Scholar] [CrossRef]
  66. Fulvio, F.; Paris, R.; Montanari, M.; Citti, C.; Cilento, V.; Bassolino, L.; Moschella, A.; Alberti, I.; Pecchioni, N.; Cannazza, G.; et al. Analysis of Sequence Variability and Transcriptional Profile of Cannabinoid synthase Genes in Cannabis sativa L. Chemotypes with a Focus on Cannabichromenic acid synthase. Plants 2021, 10, 1857. [Google Scholar] [CrossRef]
  67. Welling, M.T.; Liu, L.; Kretzschmar, T.; Mauleon, R.; Ansari, O.; King, G.J. An extreme-phenotype genome-wide association study identifies candidate cannabinoid pathway genes in Cannabis. Sci. Rep. 2020, 10, 18643. [Google Scholar] [CrossRef]
  68. Stout, J.M.; Boubakir, Z.; Ambrose, S.J.; Purves, R.W.; Page, J.E. The hexanoyl-CoA precursor for cannabinoid biosynthesis is formed by an acyl-activating enzyme in Cannabis sativa trichomes. Plant J. 2012, 71, 353–365. [Google Scholar] [CrossRef]
  69. Park, S.H.; Pauli, C.S.; Gostin, E.L.; Staples, S.K.; Seifried, D.; Kinney, C.; Vanden Heuvel, B.D. Effects of short-term environmental stresses on the onset of cannabinoid production in young immature flowers of industrial hemp (Cannabis sativa L.). J. Cannabis Res. 2022, 4, 1. [Google Scholar] [CrossRef]
  70. Laverty, K.U.; Stout, J.M.; Sullivan, M.J.; Shah, H.; Gill, N.; Holbrook, L.; Deikus, G.; Sebra, R.; Hughes, T.R.; Page, J.E.; et al. A physical and genetic map of Cannabis sativa identifies extensive rearrangements at the THC/CBD acid synthase loci. Genome Res. 2019, 29, 146–156. [Google Scholar] [CrossRef]
  71. Taura, F.; Morimoto, S.; Shoyama, Y. Purification and characterization of cannabidiolic-acid synthase from Cannabis sativa L. Biochemical analysis of a novel enzyme that catalyzes the oxidocyclization of cannabigerolic acid to cannabidiolic acid. J. Biol. Chem. 1996, 271, 17411–17416. [Google Scholar] [CrossRef]
  72. Zirpel, B.; Kayser, O.; Stehle, F. Elucidation of structure-function relationship of THCA and CBDA synthase from Cannabis sativa L. J. Biotechnol. 2018, 284, 17–26. [Google Scholar] [CrossRef]
  73. Rodziewicz, P.; Loroch, S.; Marczak, Ł.; Sickmann, A.; Kayser, O. Cannabinoid synthases and osmoprotective metabolites accumulate in the exudates of Cannabis sativa L. glandular trichomes. Plant Sci. 2019, 284, 108–116. [Google Scholar] [CrossRef] [PubMed]
  74. Mahlberg, P.G.; Kim, E.S. Accumulation of Cannabinoids in Glandular Trichomes of Cannabis (Cannabaceae). J. Ind. Hemp 2004, 9, 15–36. [Google Scholar] [CrossRef]
  75. Wilson, W.B.; Yarberry, A.J.; Goldman, S. Chromatographic interferences potentially inflating the levels of Δ9-THC in Cannabis Sativa plant samples and possible solutions. J. Chromatogr. A 2025, 1748, 465871. [Google Scholar] [CrossRef] [PubMed]
  76. Timoteo Junior, A.A.; Oswald, I.W. Optimized guidelines for feminized seed production in high-THC Cannabis cultivars. Front. Plant Sci. 2024, 15, 1384286. [Google Scholar] [CrossRef]
  77. Wu, S.; Hu, C.; Zhu, C.; Fan, Y.; Zhou, J.; Xia, X.; Shi, K.; Zhou, Y.; Foyer, C.H.; Yu, J. The MYC2-PUB22-JAZ4 module plays a crucial role in jasmonate signaling in tomato. Mol. Plant 2024, 17, 598–613. [Google Scholar] [CrossRef]
  78. Gupta, A.; Bhardwaj, M.; Tran, L.P. JASMONATE ZIM-DOMAIN Family Proteins: Important Nodes in Jasmonic Acid-Abscisic Acid Crosstalk for Regulating Plant Response to Drought. Curr. Protein Pept. Sci. 2021, 22, 759–766. [Google Scholar] [CrossRef]
  79. Li, X.; Bashir, A.; Yang, H.; Abbas, A.; Li, Y.; Zeng, X.; Zhu, L.; Shi, Q.; Tursunniyaz, M.; Zhang, L. Genome-Wide Analysis and Expression Profiling of the JAZ Gene Family in Response to Abiotic Stress in Alfalfa. Int. J. Mol. Sci. 2025, 26, 4684. [Google Scholar] [CrossRef]
  80. Cui, J.; Jiang, X.; Li, Y.; Zhang, L.; Zhang, Y.; Wang, X.; He, F.; Li, M.; Zhang, T.; Kang, J. Genome-Wide Identification, Phylogenetic, and Expression Analysis of Jasmonate ZIM-Domain Gene Family in Medicago sativa L. Int. J. Mol. Sci. 2024, 25, 10589. [Google Scholar] [CrossRef]
  81. Liu, Y.L.; Zheng, L.; Jin, L.G.; Liu, Y.X.; Kong, Y.N.; Wang, Y.X.; Yu, T.F.; Chen, J.; Zhou, Y.B.; Chen, M.; et al. Genome-Wide Analysis of the Soybean TIFY Family and Identification of GmTIFY10e and GmTIFY10g Response to Salt Stress. Front Plant Sci. 2022, 13, 845314. [Google Scholar] [CrossRef]
  82. Li, G.; Manzoor, M.A.; Chen, R.; Zhang, Y.; Song, C. Genome-wide identification and expression analysis of TIFY genes under MeJA, cold and PEG-induced drought stress treatment in Dendrobium huoshanense. Physiol. Mol. Biol. Plants 2024, 30, 527–542. [Google Scholar] [CrossRef] [PubMed]
  83. Chen, C.; Wu, Y.; Li, J.; Wang, X.; Zeng, Z.; Xu, J.; Liu, Y.; Feng, J.; Chen, H.; He, Y.; et al. TBtools-II: A “one for all, all for one” bioinformatics platform for biological big-data mining. Mol. Plant 2023, 16, 1733–1742. [Google Scholar] [CrossRef] [PubMed]
  84. Xie, J.; Chen, Y.; Cai, G.; Cai, R.; Hu, Z.; Wang, H. Tree Visualization By One Table (tvBOT): A web application for visualizing, modifying and annotating phylogenetic trees. Nucleic Acids Res. 2023, 51, W587–W592. [Google Scholar] [CrossRef] [PubMed]
  85. Wang, X.; Liang, S.; Yang, W.; Yu, K.; Liang, F.; Zhao, B.; Zhu, X.; Zhou, C.; Mur, L.A.J.; Roberts, J.A.; et al. MetMiner: A user-friendly pipeline for large-scale plant metabolomics data analysis. J. Integr. Plant Biol. 2024, 66, 2329–2345. [Google Scholar] [CrossRef]
  86. Yuan, H.; Si, H.; Ye, Y.; Ji, Q.; Wang, H.; Zhang, Y. Arbuscular Mycorrhizal Fungi-Mediated Modulation of Physiological, Biochemical, and Secondary Metabolite Responses in Hemp (Cannabis sativa L.) under Salt and Drought Stress. J. Fungi 2024, 10, 283. [Google Scholar] [CrossRef]
  87. Guo, R.; Guo, H.; Zhang, Q.; Guo, M.; Xu, Y.; Zeng, M.; Lv, P.; Chen, X.; Yang, M. Evaluation of reference genes for RT-qPCR analysis in wild and cultivated Cannabis. Biosci. Biotechnol. Biochem. 2018, 82, 1902–1910. [Google Scholar] [CrossRef]
  88. Schmittgen, T.D.; Livak, K.J. Analyzing real-time PCR data by the comparative C(T) method. Nat. Protoc. 2008, 3, 1101–1108. [Google Scholar] [CrossRef]
Figure 1. Phylogenetic tree of TIFY in C. sativa and A. thaliana.
Ijms 26 08171 g001
Figure 2. Gene structure and chromosomal localization of the TIFY family in C. sativa. (A) Gene structure and secondary protein structure. (B) Conserved motifs. (C) Chromosomal localization.
Ijms 26 08171 g002
Figure 3. Cis-acting elements and collinearity analysis of TIFY in C. sativa. (A) Cis-acting elements. (B) Collinearity analysis.
Ijms 26 08171 g003
Figure 4. Protein structure of TIFY in C. sativa.
Ijms 26 08171 g004
Figure 5. The expression pattern of C. sativa TIFY in the presence of alkali stress and in inflorescence tissue. (A) Differential expression of TIFY in C. sativa under alkali stress. T–CK1–3: control group (0 mmol/L NaHCO3); T–1–3: alkali treatment group (100 mmol/L). (B) Differential expression of TIFY in C. sativa inflorescence tissue. BBK1-3: Black Berry Kush; BL1-3: Black Lime; CT1-3: Canna Tsu; CC1-3: Cherry Chem; MT1-3: Mama Thai.
Ijms 26 08171 g005
Figure 6. WGCNA of TIFY in C. sativa. (A) WGCNA modularity analysis of the C. sativa genome. (B) Association analysis between gene modules and cannabinoids.
Ijms 26 08171 g006
Figure 7. Relative expression levels of TIFY in C. sativa. under different treatments. (A) Relative expression level of CsTIFYs under alkaline stress. (B) Relative expression of 4 genes involved in cannabinoid metabolic pathways under alkaline stress. (C) Relative expression levels of CsJAZ5, CsPPD1, and CsTIFY1 under alkali stress at 0, 12, 24, and 36 h. * represents p < 0.05; ** represents p < 0.01; ns represents p > 0.05.
Ijms 26 08171 g007
Table 1. Detailed information on 14 CsTIFY genes in C. sativa and their encoded proteins.
NameGene IDNumber of Amino Acid/Amino AcidMolecular Weight/kDapIInstability IndexGRAVYAlpha HelixExtended StrandRandom Coil
CsPPD1LOC11572311632635,518.608.0653.57−0.72821.78%5.21%73.01%
CsJAZ1LOC11571124138240,204.849.3553.22−0.38710.73%4.71%84.55%
CsJAZ2LOC11570681726228,721.449.1651.54−0.52814.89%5.73%79.39%
CsJAZ3LOC11570622626228,672.379.1850.96−0.53713.36%6.11%80.53%
CsJAZ4LOC11571214519922,310.319.0458.72−0.45914.57%8.04%77.39%
CsJAZ5LOC11571418939142,034.538.7449.53−0.2957.67%5.63%86.70%
CsJAZ6LOC11570551219321,190.965.8375.37−0.5779.84%7.77%82.38%
CsJAZ7LOC11570712231534,251.278.9349.35−0.68812.38%4.13%83.49%
CsJAZ8LOC11569697615617,524.899.1663.53−0.55217.31%6.41%76.28%
CsTIFY1LOC11569914244246,479.549.1351.16−0.5876.56%7.01%86.43%
CsZML1LOC11569769630132,461.796.2138.01−0.6544.32%6.98%88.70%
CsZML2LOC11571970631733,897.485.5734.85−0.6563.79%3.15%93.06%
CsZML3LOC11569770733937,386.455.0143.30−0.7037.67%4.13%88.20%
CsZML4LOC11571851938842,163.764.7549.51−0.5427.47%4.12%88.40%
Disclaimer/Publisher’s Note: The statements, opinions and data contained in all publications are solely those of the individual author(s) and contributor(s) and not of MDPI and/or the editor(s). MDPI and/or the editor(s) disclaim responsibility for any injury to people or property resulting from any ideas, methods, instructions or products referred to in the content.