Abstract
Renal cell carcinoma (RCC) has a well-established propensity to form grossly visible tumour thrombi; however a comprehensive understanding of the underlying mechanisms is still lacking. The epithelial–mesenchymal transition (EMT) has been implicated in the progression of many carcinomas, including RCC; however, its exact role in the formation of venous tumour thrombi remains unclear. This study aims to explore the involvement of the EMT in venous invasion in RCC. In 14 patients with WHO/ISUP grade 2/3 clear cell RCC with venous invasion, the expression of main EMT markers (the miR-200 family, miR-205, SNAI1/2, TWIST1, ZEB2, and CDH1) was analyzed by qPCR in the selected tumour regions—the tumour centre (TC), the tumour periphery (TP), the venous tumour thrombus (VTT)—and compared to the corresponding non-neoplastic kidney tissue (N). Expression of E-cadherin, N-cadherin, and ZEB2 was analyzed immunohistochemically. The miR-200 family was downregulated in all areas examined compared to the corresponding N. When comparing the VTT with the TC, upregulation of miR-200c and miR-429 was observed. CDH1 was downregulated when the TP was compared with N, while SNAI2 was downregulated in all tumour regions. There was a strong correlation between the expression of all members of the miR-200 family. Our results demonstrate the presence of distinct molecular signatures between the selected ccRCC regions. The upregulation of two miRNAs in the VTT compared to the TC and their correlation with CDH1 expression could indicate a reversal of the EMT towards a more epithelial cell state in the VTT.
1. Introduction
Clear cell renal cell carcinoma (ccRCC) is the most common subtype of renal cell carcinoma (RCC) and usually manifests in the 6th–7th decade of life [1,2]. The main prognostic factors are the WHO/ISUP (World Health Organization/International Society of Urological Pathology) nuclear grade and the TNM stage [3]. The WHO/ISUP grade is based on nucleolar prominence and cell pleomorphism, while the tumour stage is determined by the tumour extent (T), lymph node spread (N), and presence of metastasis (M). Most patients are diagnosed with organ-confined disease; however up to 30% of newly diagnosed patients already have metastatic disease. In addition, 30% of initially non-metastatic RCCs eventually develop distant metastases [4]. The prognosis of metastatic RCC is dismal, with a 5-year overall survival of 15% [5]. Despite the immense progress in the field of immunotherapy [6] and targeted therapies [7], metastatic ccRCC remains notoriously resistant to treatment options [8,9]. ccRCC most commonly metastasises to the lung, bone, and liver while also having a propensity to metastasise to unusual anatomical locations [10,11,12]. Unlike other types of carcinomas [13], lymphatic invasion is not the primary route of metastasis in ccRCC. Instead, ccRCC typically invades through veins, often with grossly evident tumour thrombi (TTs) extending into the renal vein and its branches at the renal sinus [14]. Interestingly, not all ccRCC patients with vascular invasion will develop metastases [15]. In order to disseminate, tumour cells must first gain access to the lymphatic or blood vasculature, survive and migrate through lymphovascular channels, and eventually extravasate at distant locations to form metastatic masses.
In carcinomas, the induction of the epithelial–mesenchymal transition (EMT) is strongly associated with tumour invasion. Through the EMT, cells lose their epithelial (E) characteristics and gain mesenchymal (M) traits, becoming spindle, motile cells that express mesenchymal cadherins (N-cadherins) [16]. The EMT is a dynamic, highly plastic process, which generates cells co-expressing E and M markers. These cells undergo the so-called partial EMT (pEMT) and exhibit a mixed, hybrid, E/M phenotype with enhanced invasive potential [17,18]. Indeed, increasing evidence shows that the acquisition of a limited set of mesenchymal features with retention of certain epithelial features (i.e., pEMT) generates cancer cells with greater invasive and metastatic properties than the full EMT [19]. The reverse process, the mesenchymal–epithelial transition (MET), seems to enable metastatic colonization through the re-differentiation of tumour cells, allowing the formation of secondary tumour masses [20,21]. A variety of EMT transcription factors (EMT-TFs) [22], microRNAs (miRNAs) [23], and epigenetic mechanisms [24] can regulate the EMT/MET. Our previous study supports the notion that a partial EMT, particularly miR-200 downregulation, is implicated in the progression of ccRCC to sarcomatoid RCC [25].
We therefore hypothesized that a partial EMT might also be involved in vascular invasion of ccRCC. In the present study, we analyzed several EMT markers to elucidate the possible role and degree of EMT activation in renal vein invasion of ccRCC.
2. Results
2.1. Patients, Tissue Samples, and Follow-Up
In total we analyzed 59 tissue samples from 14 patients with ccRCC with invasion into the renal vein. The gender and age of patients as well as the TNM stage and tumour characteristics are listed in Table 1.

Table 1.
Patients’ characteristics.
Follow-up data were available for 12 patients. Four patients were primarily diagnosed with metastatic RCC. One of them is still alive at the time of writing the manuscript, while the other three died 1, 3 and 4 years after their diagnosis, respectively. Of the eight patients who initially presented with localized disease, all eventually developed metastatic disease, with a median time to metastasis of 1.4 years. Five patients are still alive at the time of writing, while the remaining three patients died on average 4 years after their RCC diagnosis. As all cases were metastatic, no correlation analysis was performed with the expression of miRNAs and mRNAs.
2.2. Morphology and Immunohistochemical Expression of EMT-Related Markers
E-cadherin staining was preserved in all samples of non-neoplastic renal tissue. Membranous, circumferential E-cadherin staining was present in Bowman’s capsule, distal tubules, and collecting ducts, while N-cadherin staining was expressed in proximal tubules and the thin limb of the loop of Henle.
In the tumour centre (TC), membranous expression of N-cadherin was strong in 71% of the cases, whereas the expression of E-cadherin was reduced in 64% of the cases. ZEB2 staining was absent in all TC samples. In the tumour periphery (TP), E-cadherin expression was decreased in 79% of the samples and ranged from moderate to weak to absent, while strong N-cadherin expression was maintained in half of the cases. ZEB2 was focally expressed in a minority of TP samples (14%). In a venous tumour thrombus (VTT), E-cadherin staining was reduced in 64% of the cases and ranged from moderate to weak, while strong expression was maintained in five samples. The decrease in N-cadherin expression was most pronounced in the VTT compared to the TC and TP, as strong expression was present in only 42% of the cases. ZEB2 expression was absent in all VTT samples. The results are shown in Table 2 and Figure 1 and Figure 2.
Table 2.
Immunohistochemical expression of E-cadherin, N-cadherin, and ZEB2 in the selected regions expressed as the number of cases showing strong (+++), moderate (++), weak (+), or no (−) reaction. N, non-neoplastic kidney; TC, tumour centre; TP, tumour periphery; VTT, venous tumour thrombus.
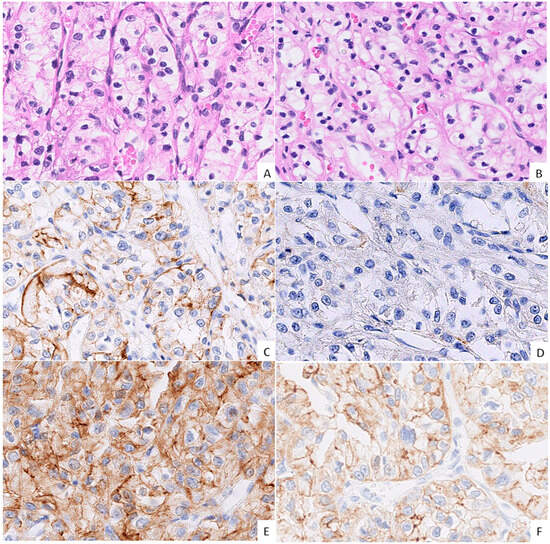
Figure 1.
Morphology and immunohistochemical expression (IHC) of cadherins in the tumour centre (TC) and the tumour periphery (TP). ((A,B); H&E, 40× magnification, grade 2 ccRCC) Morphologically indistinguishable TC (A) and TP (B) regions of the same tumour; classical ccRCC morphology of epithelioid cells with clear cytoplasm forming nests and cords with a well-vascularized stroma. ((C,E); IHC, 40× magnification, grade 3 ccRCC) The TC showing moderate, uneven membranous E-cadherin expression (C), with similar co-expression of N-cadherin (E). ((D,F); IHC, 40× magnification, grade 3 ccRCC) The TP shows negative E-cadherin expression (D), while N-cadherin expression is of moderate intensity (F).
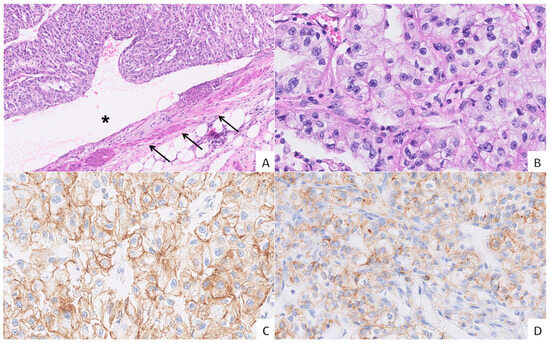
Figure 2.
Vascular invasion in grade 3 ccRCC and the expression of cadherins. ((A), H&E, 10× magnification) A venous tumour thrombus (VTT) occluding the lumen (asterisk) of a renal vein (arrows). ((B), H&E, 40× magnification) The VTT showing an epithelioid morphology with abundant optically clear cytoplasm, round nuclei, and punctate nucleoli. ((C), IHC, 40× magnification) Moderate to strong membranous E-cadherin expression in tumour cells. ((D), IHC, 40× magnification) Moderate membranous N-cadherin expression in the majority of tumour cells.
2.3. Quality Control of Isolated RNA and the Expression of Reference Genes
All samples passed the initial quality control and showed successful amplification of 100 bp long fragments of the house-keeping gene GAPDH (Cq < 35). We used suggested reference genes (RGs) for miRNAs (miR-28, miR-103a-3p, and miR-106a-5p) and mRNAs (ACTB, B2M, HPRT1, RPL13, and SDHA) as previously described [25]. All successfully amplified RGs for both miRNAs (three reference miRNAs) and mRNAs (five RGs) were stably expressed in 12 out of 14 ccRCCs and the corresponding non-neoplastic kidneys. Two cases showed high variability in the RGs of mRNAs/miRNAs and were omitted from further analyses.
2.4. Expression of miRNAs
2.4.1. Expression of the miR-200 Family and miR-205 in the Tumour Centre, Tumour Periphery, and Renal Vein Tumour Thrombus Compared to a Non-Neoplastic Kidney
When compared to adjacent non-neoplastic renal cortical tissue, statistical analysis showed statistically significant downregulation of the miR-200 family in the TC (p < 0.001 for miR-141 and miR-200a/b; p = 0.001 for miR-200c and miR-429), in the TP (p = 0.034 for miR-141; p = 0.003 for miR-200a and miR-429; p = 0.001 for miR-200b; p = 0.006 for miR-200c), and in the VTT (p = 0.002 for miR-141 and miR-200c; p = 0.001 for miR-200a/b and miR-429). miR-205 did not show a statistically significant change in expression. Results are summarized in Figure 3 and Table S1.
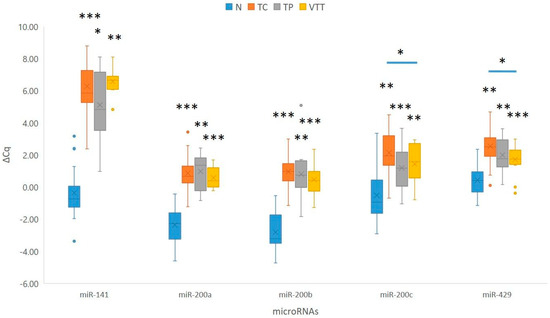
Figure 3.
Expression of the miR-200 family in the TC, TP, and VTT in comparison to the corresponding normal renal cortex (N). *, p < 0.05; **, p < 0.01; ***, p < 0.001; Cq, quantitation cycle; ΔCq, delta Cq; N, normal renal cortex; TC, tumour centre; TP, tumour periphery; VTT, venous tumour thrombus.
2.4.2. Expression of the miR-200 Family and miR-205 in the Renal Vein Tumour Thrombus Compared to the Tumour Centre and Tumour Periphery
When compared to the TP, none of the analyzed miRNAs showed statistically significant deregulation of miRNAs in the VTT. However, miR-200a showed borderline upregulation in the VTT when compared to the TP (p = 0.06). When the VTT was compared to the TC, two of the analyzed miRNAs showed statistically significant upregulation in the VTT (p = 0.031 for miR-200c and p = 0.020 for miR-429). Furthermore, we observed statistically borderline up-regulation of miR-141 (p = 0.05) at the TP when compared to the TC. Results are summarized in Figure 3.
2.5. Expression of EMT-TFs and E-Cadherin in the Tumour Centre, Tumour Periphery, and Renal Vein Tumour Thrombus Compared to a Corresponding Non-Neoplastic Kidney
When compared to adjacent non-neoplastic renal cortical tissue, statistical analysis showed significant downregulation of CDH1 in the TP (p = 0.028) and borderline downregulation in the TC and VTT (p = 0.053 and p = 0.066, respectively). While SNAI1 showed a borderline significant change in expression, SNAI2 showed statistically significant downregulation in all locations, namely the TC, TP and VTT (p = 0.015, p = 0.008, and p = 0.021, respectively). Moreover, TWIST1 was borderline downregulated in the TC (p = 0.05) and significantly downregulated in the VTT (p = 0.025), with no significant change in expression in the TP. Results are summarized in Figure 4 and Table S1. When EMT-TFs and E-cadherin in the VTT were compared either to the tumour centre or tumour periphery, no significant change in expression was observed in any analyzed mRNA.
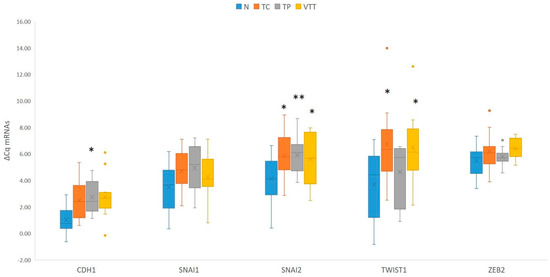
Figure 4.
Expression of EMT-TFs and CDH1 in the TC, TP and VTT in comparison to the corresponding normal renal cortex (N). *, p < 0.05; **, p < 0.01; CDH1, the gene encoding E-cadherin; Cq, quantitation cycle; ΔCq, delta Cq; N, normal renal cortex; TC, tumour centre; TP, tumour periphery; VTT, venous tumour thrombus.
2.6. Correlation Between the miR-200 Family, Its Targets E-Cadherin, and EMT-TFs
As expected, we observed a strong to very strong correlation between expressions of all members of the miR-200 family (rs > 0.69, p < 0.001). However, miR-200a/b/c and miR-429 also showed a weak correlation with the expression of CDH1 (rs > 0.29, p < 0.05). Moreover, CDH1 showed a moderate correlation with SNAI2 (rs = 0.46, p < 0.001), and SNAI1 showed a moderate correlation with SNAI2 and TWIST1 (rs = 0.60, p < 0.001; rs = 0.43, p = 0.004, respectively); SNAI2 showed a weak correlation with TWIST1 and ZEB2 (rs = 0.33, p = 0.033; rs = 0.360, p = 0.013). Results are summarized in Figure 5.
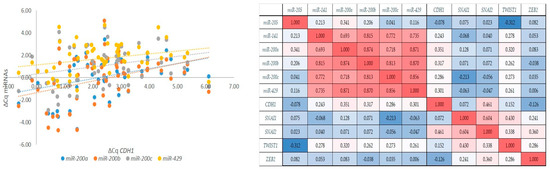
Figure 5.
Correlations between markers of the EMT. Correlations between the expression of the miR-200 family and the expression of CDH1 (left); a graphical correlation matrix between EMT markers (right). Legend: CDH1, the gene encoding E-cadherin; Cq, quantitation cycle; ΔCq, delta Cq; red colour, positive correlation; blue colour, negative correlation (intensity of red and blue increases with number increasing or decreasing towards 1 or −1, respectively).
3. Discussion
Although renal vein invasion is a recognized adverse prognostic factor for the survival of RCC patients, there is relatively little research on this topic. A recent bibliometric analysis of the literature on RCC with VTTs has shown an upward trend in this area of research over the past decade [26]. However, research has mainly focused on prognostic significance, surgical management of venous tumour thrombi, and, more recently, immune checkpoint inhibitor therapies. The molecular mechanisms underlying venous invasion are therefore still poorly understood. In the present study, we analyzed the expression of various EMT-associated markers to investigate their potential role during venous invasion of ccRCC. When investigating the expression of the miR-200 family, we first observed a downregulation of all members in all investigated areas, namely in the centre of the tumour, the periphery of the tumour, and in the renal vein tumour thrombus, when compared to the corresponding renal cortical tissue. Surprisingly, when comparing the expression of miR-200 in the VTT with the expression in the tumour itself, an upregulation of miR-200c and miR-429 was observed in the VTT compared to the TC. In addition, SNAI2 was downregulated in all examined areas. Second, we observed downregulation of CDH1 in the TP and downregulation of TWIST1 in the VTT and TC.
We observed no morphological differences in tumour cells between the TC, TP, and VTT. In all regions, the tumour cells consistently exhibited an epithelial morphology with no morphological evidence of a shift towards a spindled morphology. This finding aligns with previous reports on vascular invasion [27,28,29]. The nuclear grade in the TP and TC matched the tumour grade in the corresponding VTT in all cases. Interestingly, recent studies found discrepancies between the nuclear grade of the main tumour mass and the VTT in ccRCC [14,30]. Indeed, the VTT was not always composed of cells with the highest nuclear grade, suggesting that a higher nuclear grade may not correlate with the degree of invasiveness. In addition, the nuclear grade in the VTT and not the overall tumour nuclear grade seems to be the most robust predictor of time to metastasis [14].
When evaluating E-cadherin and N-cadherin expression immunohistochemically, there was a notable decrease in E-cadherin expression in the TC, compared to its expression in the proximal tubules of a normal kidney, while N-cadherin expression remained mostly strong. The VTT showed almost identical E-cadherin expression profiles as the TC, while N-cadherin expression was decreased compared to the TC. The decrease in E-cadherin expression was most pronounced in the TP, while N-cadherin expression in the TP was similar to that in the VTT. ZEB2 was focally expressed in 14% of TP samples, while being negative in the remainder of TPs and all TC and VTT samples. These diverse cadherin signatures between the analyzed regions implicate the possibility of the occurrence of distinct hybrid states on the EMT-MET spectrum in the same tumour, ranging from a more mesenchymal phenotype (i.e., TP) to an epithelial phenotype (i.e., VTT). Hybrid or partial EMT states may enable tumour cells to acquire motility while retaining the benefits of tumour cell cohesion, enabling invasion in the form of cell clusters in a process called collective invasion. It has been shown that collective metastasis enables tumour cells to colonize secondary sites more efficiently, resist cell death, and evade the immune system compared to single-cell invasion [31]. Indeed, a number of studies have shown that the so-called leading cells in collective cell migration occupy a hybrid-EMT state as they express some, but not all, of the hallmark EMT transcription factors in combination with typical epithelial markers. However, the composition of EMT transcriptional programmes expressed by leading cells varies widely between cancer types and subtypes [32].
There was a strong correlation between the expression of all members of the miR-200 family, suggesting their cooperative action during the EMT and MET [33]. The expression of miR-200c and miR-429 was upregulated in the VTT compared to the TC. The miR-200 family has a broad physiological role; however, it mainly serves to maintain the overall epithelial phenotype in cells by inhibiting ZEB1 and ZEB2. In several carcinomas, the miR-200 family is downregulated, allowing the activation of the EMT process, which enables tumour cells to obtain invasive and metastatic properties [34]. During venous invasion, tumour cells breach the vascular wall, enter the blood circulation, and form tumour clusters [35]. ccRCC has an established propensity to invade renal veins in the form of large and oftentimes macroscopically visible VTTs [8], consistent with collective metastasis [31]. The upregulation of two of the analyzed members of the miR-200 family in the VTT compared to the TC could indicate the transition of VTT cells towards the MET. Indeed, the tumour cells in the VTT maintain a strikingly epithelioid morphology, with no evidence of spindling, which corroborates other studies on collective cell migration in tumours (reviewed in [31,36]). The MET is believed to participate in the establishment and stabilization of distant metastases by allowing cancerous cells to regain epithelial properties at metastatic sites. However, it has already been suggested in a previous study that the MET is an early event in the metastatic process [37]. A recent study using integrative transcriptome and proteome analyses of RCC with a VTT found KLF4 to be one of the differentially expressed genes in the VTT compared to a primary tumour [38]. KLF4 belongs to a group of recently described MET transcription factors (MET-TFs) that promote epithelization by direct transcriptional repression of mesenchymal markers and by establishing mutual bidirectional inhibitory circuits with EMT-TFs [39].
Among miR-200 family members, miR-200b/c act as key switches between EMT differentiation and proliferation. miR-429, on the other hand, in addition to its role in the EMT, appears to be critical for the regulation of cellular adaptation to hypoxia. A recent study by Zheng et al. [40] showed that in endometriosis, an estrogen-dependent disorder similar to malignant tumours regarding biological behaviour, miR-429 facilitates proliferation, migration, and invasiveness of endometrial stromal cells by modulating the HIF1A inhibitor-mediated HIF1A/VEGF signalling pathway. The molecular alterations in the VHL/HIF pathway are well documented in ccRCC. Loss of the tumour suppressive role of the VHL protein (pVHL) leads to accumulation and constitutive activation of hypoxia inducible factor 1α (HIF-1α), which is responsible for the metabolic switch that allows survival of cells in the hypoxic environment [41,42]. Increased levels of HIF-1α are usually associated with a worse prognosis [43]. It is possible that in venous invasion of RCC, miR-429 not only has a role in EMT regulation but is also a crucial modulator of HIF signalling. Indeed, several studies have shown that miR-429 regulates HIF-1α expression in endothelial cells [44,45,46]. Additionally, Xu et al. demonstrated that miR-429 negatively regulates the VEGF pathway in hypoxia-induced retinal neovascularization, highlighting its significance in this process [47]. Ge et al. further provided evidence that HIF-1α is a target gene of miR-429 in amniotic cells [45]. Additionally, Ye et al. identified miR-429 as a regulator of the VEGFA pathway in ovarian cancer tissue, highlighting its potential as a future diagnostic and therapeutic biomarker [48]. Furthermore, Zhu et al. confirmed that miR-429 targets the 3′-UTR of proline-hydroxylase-2 (PHD2) mRNA, demonstrating that inhibition of miR-429 significantly increased PHD2 mRNA levels while decreasing HIF-1α levels [49]. Taken together, these results provide evidence of a negative feedback loop between miR-429 and the HIF1A pathway as well as its involvement in the VEGF pathway.
Among EMT-TFs SNAI2 showed significant downregulation in all the analyzed compartments, namely the TC, TP, and VTT compared to N. This is in contrast to our previous study where no significant differences in EMT-TF expression were found between normal renal tissue and low-stage RCC [25]. However, our results are in line with the study by Mikami et al., showing that SNAI2 protein expression levels negatively correlate with the pathological tumour stage, suggesting that SNAI2 was downregulated in advanced RCCs [50]. Additionally, TWIST1 was significantly downregulated in the VTT and showed borderline downregulation in the TC compared to N. TWIST1, a basic helix-loop-helix transcriptional factor expressed in various types of carcinomas, is a key player in tumour metastasis by inducing the EMT [51]. Elevated TWIST1 expression in primary tumours is frequently linked to a poor prognosis and increased metastatic potential. Studies have found that higher levels of TWIST1 correlate with more aggressive diseases, earlier relapse, and a greater likelihood of distant metastasis [52,53,54]. A report by Tsai et al. also indicated that turning off TWIST1 reversed the EMT process, leading to the subsequent occurrence of the MET, enabling colonization and the formation of metastases [55]. Furthermore, a study by Yang et al. on human hypopharingeal and lung carcinoma cell lines with HIF-1α overexpression showed that small interfering RNAs (siRNAs) can repress TWIST1, causing a shift towards the MET with the switch from mesenchymal (N) to epithelial (E) cadherin expression [56]. The downregulation of TWIST1 in the VTT along with preserved E-cadherin expression and a reduction in N-cadherin expression could indicate a transition towards the MET during venous invasion. Taken together, these results indicate an important role of TWIST1 as a regulator of epithelial plasticity during cancer metastasis.
There are several advantages and limitations of our study. The main advantage is the use of the punching technique, which allowed us to obtain tumour samples at the locations of interest, as determined by microscopic analysis. Comparing different locations within the same tumour (i.e., TC and TP) and matching VTT from the same patient is important for evaluating the expression of miRNAs, as their expression can be tissue-specific and is also influenced by gender and age [57]. The limitation of our study is the small number of patients, thus limiting the statistical power. However, only samples that successfully passed the initial quality control and samples with stable expression of the RGs were selected for further analysis, which limited the number of included samples. Nevertheless, tumours were quite homogeneous in terms of primary tumour stages and grades. As all cases were metastatic, the expression of EMT markers in correlation with clinical outcomes was therefore not possible. To the best of our knowledge, this is the first study comparing the expression of different EMT markers in distinct regions of ccRCC with a venous tumour thrombus.
In summary, this study demonstrates heterogeneity in the expression of EMT markers between different tumour regions, indicating subtle differences in cell states in the EMT-MET spectrum. These hybrid intermediate states could confer phenotypic plasticity to cells, enabling invasion and tumour progression. As the EMT is a highly complex process, our results may contribute to the understanding of the intricate mechanisms associated with tumour thrombus formation and metastasis initiation in ccRCC. Further studies focusing on the analysis of single cells and larger EMT marker panels are needed to further explore the process of venous invasion in ccRCC. miRNAs have emerged as promising therapeutic targets, as modulating their expression may offer a powerful approach in limiting disease progression [58]. In addition, the prevention or reversing the effects of EMT is increasingly regarded as a promising strategy in the development of novel cancer therapies [59]. However, this remains challenging due to potential serious and unpredictable side effects. While anti-EMT interventions may suppress the migratory and invasive properties of primary tumours, they may also promote the MET, thereby facilitating metastatic colonization. Therefore, studying the expression patterns of EMT-TFs and their regulatory mRNAs across different tumour types and stages may help in guiding more effective and context-specific therapeutic strategies.
4. Materials and Methods
4.1. Patients and Tissue Samples
This retrospective analysis included 14 patients diagnosed with renal cell carcinoma exhibiting invasion of the renal vein, all of whom underwent surgical treatment between 2017 and 2022. None of the patients had received chemotherapy, radiotherapy, or renal artery embolization prior to their surgical intervention. TNM staging was conducted according to the most recent TNM classification for renal tumours [60]. Following nephrectomy, the resection specimens were processed in accordance with standard protocols. The specimens were fixed in 10% buffered formalin for 24 h, after which representative samples were taken from both the tumour and the macroscopically normal renal cortex. The tissue samples were then embedded in paraffin (formalin-fixed paraffin-embedded, FFPE), sliced into sections 3–4 µm thick, and stained with haematoxylin and eosin. All slides were re-evaluated by a pathologist specializing in urologic pathology (J.J). Representative slides were chosen from the tumour centre (TC), tumour periphery (TP), renal vein tumour thrombus (VTT), and adjacent non-neoplastic renal cortical tissue (N). Corresponding paraffin blocks for all slides were retrieved from the archives of the Institute of Pathology, Faculty of Medicine, University of Ljubljana. Using a microneedle puncture technique, the tissue for molecular studies was acquired from the paraffin blocks utilizing a 0.6 mm needle, obtaining 3–5 tissue cores from each TC, TP, VTT, and N. Figure 6 represents the punching technique. A more detailed representation is available in one of our previous studies [61].
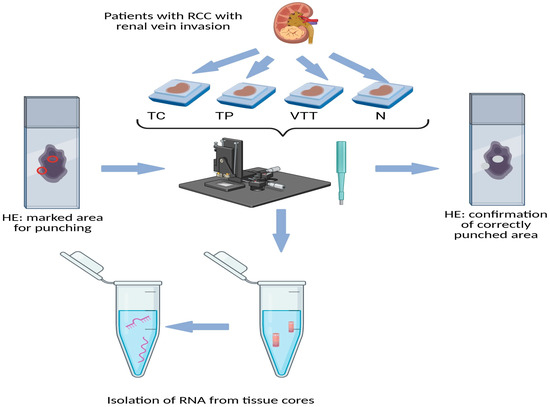
Figure 6.
Schematic representation of obtaining tissue cores (punching technique) from FFPE tissue of RCC. Legend: HE, haematoxylin and eosin; N, morphologically normal renal tissue; RCC, renal cell carcinoma; TC, tumour centre; TP, tumour periphery; VTT, venous tumour thrombus; red circle on the left slide, marked punching area; white spots on right slide, confirmation of correctly punched area.
4.2. Immunohistochemistry
FFPE tissue blocks were sectioned into 4 µm thick slices for immunohistochemical staining. All reagents were sourced from Ventana (Tucson, AZ, USA). Commercially available antibodies for E-cadherin (Dako, Santa Clara, CA, USA, M3612, clone KS 20.8, dilution: 1:20), N-cadherin (Abcam, Cambridge, UK, AB225719, dilution: 1:30), and ZEB2 (Abcam, Cambridge UK, AB223688, dilution: 1:250) were utilized. Deparaffinization, antigen retrieval, and staining were conducted using the BenchMark XT automatic immunostainer (Ventana, Tucson, AZ, USA) with ultraVIEW for E-cadherin and the OptiVIEW detection system for N-cadherin and ZEB2. Appropriate positive and negative internal tissue controls were implemented to ensure accurate immunohistochemical evaluation. A semi-quantitative method was applied to assess the extent of staining (negative, 0; <30%, +; 30–60%, ++; >60%, +++) and the staining pattern (nuclear, cytoplasmic, or membranous). IHC staining results were assessed by two pathologists (T.Č. and J.J.). To minimize inter-observer variability, appropriate negative and positive reaction controls were employed, and strict adherence to the established scoring system and cut-off values was maintained. In challenging cases, which constituted a small fraction of the analyzed samples, a consensus was reached through mutual viewing and scoring of the slides.
4.3. RNA Isolation from FFPE Tissue Samples
For RNA isolation, 3–5 microneedle punches (0.6 mm) were performed at each site on the FFPE blocks. To confirm the accuracy of the obtained tissue cores, additional slides were prepared from the punched FFPE blocks, stained with HE, and evaluated (Figure 6). Total RNA was manually isolated using the MagMAX FFPE DNA/RNA Ultra kit (Thermo Fisher Scientific, Austin, TX, USA), following the manufacturer’s instructions, with one modification for protease digestion, which was performed overnight. The reagents used were from Thermo Fisher Scientific (Austin, TX, USA), except for ethanol (Merck KGaA, Darmstadt, Germany) and the deparaffinization solution (Xylene; Sigma-Aldrich; Merck KGaA, Darmstadt, Germany). The concentration and purity of the RNA isolates were measured using a NanoDrop-One machine (Thermo Fisher Scientific; Foster City, CA, USA) at wavelengths of 230, 260, and 280 nm.
For quality control, reverse transcription (RT) was conducted as outlined in Section 4.5.1, followed by the amplification of GAPDH (Hs_GAPDH_vb.1_SG, 100 bp, Qiagen, Venlo, The Netherlands) utilizing SybrGreen technology through quantitative real-time PCR (qPCR). All samples included in the study underwent this initial quality control assessment. Samples that did not amplify (Cq < 35) were excluded from further analysis.
4.4. Analysis of Expression of the miR-200 Family
4.4.1. Reverse Transcription (RT) of miRNAs
Isolated RNA was transcribed into cDNA using the miRCURY LNA RT Kit (Qiagen; Hilden, Germany) according to the manufacturer’s instructions. The successful reverse transcription (RT) was validated by the addition of spike-in RNA (UniSp6) followed by its quantification. The 10 µL reaction master mix consisted of 2 µL of the 5× miRCURY RT Reaction Buffer, 1 µL of the 10× miRCURY RT Enzyme Mix, 0.5 µL of UniSp6 Spike-in, and 6.5 µL of total RNA (10 ng). The reaction was carried out under the following conditions: incubation at 42 °C for 60 min, followed by heat inactivation at 95 °C for 5 min and immediate cooling to 4 °C.
4.4.2. Quantitative Real-Time PCR (qPCR)
qPCR utilizing SYBR Green technology was conducted to evaluate the expression levels of the miR-200 family. Amplification efficiency was obtained from a prior publication [25]. For quantification, qPCR was performed using a pre-designed mixture of primers specific to miRNA expression. The miRCURY LNA SYBR GREEN Kit (Qiagen; Venlo, The Netherlands) was employed to analyze the selected miRNAs, namely miR-141, miR-200a, miR-200b, miR-200c, miR-205, and miR-429, relative to the geometric mean of the reference miRNAs suggested by other authors (miR-28, miR-103a-3p, and miR-106a-5p) [54]. In brief, 3 µL of diluted (1:60) cDNA was added to a 10 µL reaction volume containing 1 µL of 10× miRCURY LNA miRNA PCR Primer Assay, 5 µL of SybrGreen MasterMix, and 1 µL of PCR-grade H2O. The thermal cycling conditions included an initial denaturation process at 95 °C for 2 min, followed by 40 cycles of denaturation at 95 °C for 10 s and annealing and amplification at 56 °C for 1 min, concluding with a melting curve analysis on a Rotor Gene Q. All qPCR reactions were conducted in duplicates.
4.5. Analysis of the Expression of EMT-Related Genes
4.5.1. Reverse Transcription (RT) for mRNAs
For the reverse transcription of isolated mRNA, the OneTaq ® RT-PCR Kit (New England Biolabs, Ipswich, MA, USA) was utilized, employing a combination of random hexamers and oligo-dT primers as per the manufacturer’s protocol. The maximum quantity of RNA was used in a total 10 µL RT reaction, which included 1 µL of random hexamers incubated for 5 min at 70 °C. Subsequently, 5 µL of the reaction mix and 1 µL of the enzyme mix were added, followed by incubation at 25 °C for 5 min, 42 °C for 1 h, and a final step at 80 °C for 5 min.
4.5.2. Quantitative Real-Time PCR (qPCR) and Probes
The TaqMan-based approach (Thermo Fisher Scientific, Waltham, MA, USA) was employed for the qPCR methodology. A pre-designed mixture of primers and probes was utilized for the expression analysis of mRNAs relative to the selected RGs, chosen based on their suitability for normalizing mRNA levels in FFPE tissue samples from patients with RCC [62]. Five RGs were selected, ACTB (Hs01060665_g1), HPRT1 (Hs02800695_m1), RPL13A (Hs03043885_g1), SDHA (Hs00188166_m1), and B2M (Hs 99999907_m1), as previously described [25]. Prior to qPCR amplification, efficiencies were obtained from earlier studies [25].
The expression analyses involved 10 µL reactions that included 5.0 µL of FastStart ™ PCR Master mix (Roche Diagnostics, Basel, Switzerland), 0.5 µL of the TaqMan probe, and 4.5 µL of cDNA (1.5 ng/reaction). The cycling protocol consisted of 50 °C for 2 min, 95 °C for 10 min, followed by 40 cycles of 95 °C for 15 s and 62 °C for 1 min. We analyzed the expression of the E-cadherin gene (CDH1) (Hs01023895_m1), SNAI1 (Hs00195591_m1), SNAI2 (Hs00161904_m1), TWIST1 (Hs01675818_s1), and ZEB2 (Hs01095318_m1) in relation to RGs that were successfully amplified and consistently expressed across all samples analyzed. The amplicon length for all analyzed mRNAs, the gene of interest, and RGs was maintained below 100 bp according to initial quality control with GAPDH. Notably, TWIST2 (Hs00382379_m1) and ZEB1 (Hs03680599_m1), two EMT transcription factors, were excluded due to their unsuccessful amplification in our previous study.
4.6. Statistical Analysis
Results were expressed as relative gene expression using the ΔCq method. All Cq values were corrected for PCR efficiencies, and the expression of the gene of interest (CqGOI) was calculated relative to a geometric mean of reference genes (CqRG) to yield ∆Cq. For comparing miRNA expression differences between paired samples (e.g., TC and TP), the ∆Cq values and the Wilcoxon rank test were employed. Spearman’s rank-order correlation was used for all correlations and associations. Statistical analysis (including power analysis) was conducted using SPSS version 27 (SPSS Inc., Chicago, IL, USA), with differences deemed statistically significant at p-values < 0.05.
Supplementary Materials
The following supporting information can be downloaded at: https://www.mdpi.com/article/10.3390/ijms26167951/s1.
Author Contributions
Conceptualization, J.J. and E.B.; methodology, J.J. and E.B.; software, E.B.; validation, J.J.; formal analysis, E.B.; investigation, T.Č. and E.B.; resources, E.B. and J.J.; data curation, E.B.; writing—original draft preparation, T.Č.; writing—review and editing, J.J.; visualization, T.Č. and E.B.; supervision, J.J.; project administration, J.J. and E.B.; funding acquisition, E.B. and J.J. All authors have read and agreed to the published version of the manuscript.
Funding
This work was supported by the Slovenian Research and Innovation Agency (ARIS), grant number P3–0054.
Institutional Review Board Statement
The study was conducted in accordance with The Code of Ethics of the World Medical Association (Declaration of Helsinki) for experiments involving humans and was approved by the National Medical Ethics Committee of Ministry of Health, Republic of Slovenia (protocol code 0120-96/2020/3, date of approval: 1 April 2020).
Informed Consent Statement
Patient consent was waived due to the following reason. The present study is retrospective, observational, and performed on tissue samples that were obtained during routine diagnostic/therapeutic procedures, consisting of either surgical excision or resection. Therefore, enough tissue was available for routine analysis as well as research. Moreover, the tissue is still available for any additional analysis in the future. Our State Ethical Committee does not require informed consent from patients in such studies. However, the informed consent of patients was obtained before the routine procedure.
Data Availability Statement
The raw data supporting the conclusions of this article will be made available by the authors upon request.
Conflicts of Interest
The authors declare no conflicts of interest. The Slovenian Research and Innovation Agency had no role in the design of the study; in the collection, analyses, or interpretation of data; in the writing of the manuscript; or in the decision to publish the results.
Abbreviations
The following abbreviations are used in this manuscript:
| ccRCC | Clear cell renal cell carcinoma |
| CDH1 | Gene encoding E-cadherin |
| EMT | Epithelial–mesenchymal transition |
| FFPE | Formalin-fixed paraffin-embedded |
| HIF1A | Hypoxia-inducible factor 1-alpha |
| MET | Mesenchymal–epithelial transition |
| miRNA | MicroRNA |
| N | Non-neoplastic kidney tissue |
| pEMT | partial EMT |
| RCC | Renal cell carcinoma |
| TC | Tumour centre |
| TF | Transcription factor |
| TP | Tumour periphery |
| VEGF | Vascular endothelial growth factor |
| VTT | Venous tumour thrombus |
References
- Siegel, R.L.; Miller, K.D.; Wagle, N.S.; Jemal, A. Cancer statistics, 2023. CA Cancer J. Clin. 2023, 73, 17–48. [Google Scholar] [CrossRef]
- Sung, H.; Ferlay, J.; Siegel, R.L.; Laversanne, M.; Soerjomataram, I.; Jemal, A.; Bray, F. Global Cancer Statistics 2020: GLOBOCAN Estimates of Incidence and Mortality Worldwide for 36 Cancers in 185 Countries. CA Cancer J. Clin. 2021, 71, 209–249. [Google Scholar] [CrossRef]
- Greene, F.L.; Page, D.L.; Fleming, I.D.; Fritz, A.G.; Balch, C.M.; Haller, D.G.; Morrow, M. (Eds.) AJCC Cancer Staging Manual, 8th ed; Springer: New York, NY, USA, 2017. [Google Scholar]
- Osawa, T.; Takeuchi, A.; Kojima, T.; Shinohara, N.; Eto, M.; Nishiyama, H. Overview of current and future systemic therapy for metastatic renal cell carcinoma. Jpn. J. Clin. Oncol. 2019, 49, 395–403. [Google Scholar] [CrossRef]
- Dillekås, H.; Rogers, M.S.; Straume, O. Are 90% of deaths from cancer caused by metastases? Cancer Med. 2019, 8, 5574–5576. [Google Scholar] [CrossRef]
- Albiges, L.; Tannir, N.M.; Burotto, M.; McDermott, D.; Plimack, E.R.; Barthélémy, P.; Porta, C.; Powles, T.; Donskov, F.; George, S.; et al. First-line Nivolumab plus Ipilimumab Versus Sunitinib in Patients Without Nephrectomy and With an Evaluable Primary Renal Tumor in the CheckMate 214 Trial. Eur. Urol. 2022, 81, 266–271. [Google Scholar] [CrossRef]
- Tran, J.; Ornstein, M.C. Clinical Review on the Management of Metastatic Renal Cell Carcinoma. JCO Oncol. Pract. 2022, 18, 187–196. [Google Scholar] [CrossRef]
- Chen, Z.; Yang, F.; Ge, L.; Qiu, M.; Liu, Z.; Liu, C.; Tian, X.; Zhang, S.; Ma, L. Outcomes of renal cell carcinoma with associated venous tumor thrombus: Experience from a large cohort and short time span in a single center. BMC Cancer 2021, 21, 766. [Google Scholar] [CrossRef] [PubMed]
- Makhov, P.; Joshi, S.; Ghatalia, P.; Kutikov, A.; Uzzo, R.G.; Kolenko, V.M. Resistance to Systemic Therapies in Clear Cell Renal Cell Carcinoma: Mechanisms and Management Strategies. Mol. Cancer Ther. 2018, 17, 1355–1364. [Google Scholar] [CrossRef] [PubMed]
- Dudani, S.; de Velasco, G.; Wells, J.C.; Gan, C.L.; Donskov, F.; Porta, C.; Fraccon, A.; Pasini, F.; Lee, J.L.; Hansen, A.; et al. Evaluation of Clear Cell, Papillary, and Chromophobe Renal Cell Carcinoma Metastasis Sites and Association With Survival. JAMA Netw. Open 2021, 4, e2021869. [Google Scholar] [CrossRef] [PubMed]
- Bianchi, M.; Sun, M.; Jeldres, C.; Shariat, S.F.; Trinh, Q.D.; Briganti, A.; Tian, Z.; Schmitges, J.; Graefen, M.; Perrotte, P.; et al. Distribution of metastatic sites in renal cell carcinoma: A population-based analysis. Ann. Oncol. 2012, 23, 973–980. [Google Scholar] [CrossRef]
- Sountoulides, P.; Metaxa, L.; Cindolo, L. Atypical presentations and rare metastatic sites of renal cell carcinoma: A review of case reports. J. Med. Case Rep. 2011, 5, 429. [Google Scholar] [CrossRef]
- Fujimoto, N.; Dieterich, L.C. Mechanisms and Clinical Significance of Tumor Lymphatic Invasion. Cells 2021, 10, 2585. [Google Scholar] [CrossRef]
- Kim, K.; Zhou, Q.; Christie, A.; Stevens, C.; Ma, Y.; Onabolu, O.; Chintalapati, S.; McKenzie, T.; Tcheuyap, V.T.; Woolford, L.; et al. Determinants of renal cell carcinoma invasion and metastatic competence. Nat. Commun. 2021, 12, 5760. [Google Scholar] [CrossRef]
- Quencer, K.B.; Friedman, T.; Sheth, R.; Oklu, R. Tumor thrombus: Incidence, imaging, prognosis and treatment. Cardiovasc. Diagn. Ther. 2017, 7, S165–S177. [Google Scholar] [CrossRef]
- Thiery, J.P.; Acloque, H.; Huang, R.Y.; Nieto, M.A. Epithelial-mesenchymal transitions in development and disease. Cell 2009, 139, 871–890. [Google Scholar] [CrossRef] [PubMed]
- Aiello, N.M.; Kang, Y. Context-dependent EMT programs in cancer metastasis. J. Exp. Med. 2019, 216, 1016–1026. [Google Scholar] [CrossRef] [PubMed]
- Li, W.; Kang, Y. Probing the Fifty Shades of EMT in Metastasis. Trends Cancer 2016, 2, 65–67. [Google Scholar] [CrossRef]
- Liao, T.T.; Yang, M.H. Hybrid Epithelial/Mesenchymal State in Cancer Metastasis: Clinical Significance and Regulatory Mechanisms. Cells 2020, 9, 623. [Google Scholar] [CrossRef]
- Bakir, B.; Chiarella, A.M.; Pitarresi, J.R.; Rustgi, A.K. EMT, MET, Plasticity, and Tumor Metastasis. Trends Cell Biol. 2020, 30, 764–776. [Google Scholar] [CrossRef]
- Rodriguez, F.J.; Lewis-Tuffin, L.J.; Anastasiadis, P.Z. E-cadherin’s dark side: Possible role in tumor progression. Biochim. Biophys. Acta 2012, 1826, 23–31. [Google Scholar] [CrossRef]
- Nieto, M.A.; Huang, R.Y.; Jackson, R.A.; Thiery, J.P. EMT: 2016. Cell 2016, 166, 21–45. [Google Scholar] [CrossRef] [PubMed]
- Park, S.M.; Gaur, A.B.; Lengyel, E.; Peter, M.E. The miR-200 family determines the epithelial phenotype of cancer cells by targeting the E-cadherin repressors ZEB1 and ZEB2. Genes Dev. 2008, 22, 894–907. [Google Scholar] [CrossRef] [PubMed]
- Georgakopoulos-Soares, I.; Chartoumpekis, D.V.; Kyriazopoulou, V.; Zaravinos, A. EMT Factors and Metabolic Pathways in Cancer. Front. Oncol. 2020, 10, 499. [Google Scholar] [CrossRef] [PubMed]
- Čugura, T.; Boštjančič, E.; Uhan, S.; Hauptman, N.; Jeruc, J. Epithelial-mesenchymal transition associated markers in sarcomatoid transformation of clear cell renal cell carcinoma. Exp. Mol. Pathol. 2024, 138, 104909. [Google Scholar] [CrossRef]
- Xu, J.; Lee, W.; Yang, S.; Gao, S.; Ye, Y.; Deng, G.; Zhang, W.; Di, J. Bibliometric analysis of renal cell carcinoma with venous tumor thrombus. Int. J. Med. Sci. 2024, 21, 2094–2108. [Google Scholar] [CrossRef]
- Almagro, J.; Messal, H.A.; Elosegui-Artola, A.; van Rheenen, J.; Behrens, A. Tissue architecture in tumor initiation and progression. Trends Cancer 2022, 8, 494–505. [Google Scholar] [CrossRef]
- Brabletz, S.; Schuhwerk, H.; Brabletz, T.; Stemmler, M.P. Dynamic EMT: A multi-tool for tumor progression. EMBO J. 2021, 40, e108647. [Google Scholar] [CrossRef]
- Cheung, K.J.; Ewald, A.J. A collective route to metastasis: Seeding by tumor cell clusters. Science 2016, 352, 167–169. [Google Scholar] [CrossRef]
- Wu, Z.; Chen, H.; Chen, Q.; Ge, S.; Yu, N.; Campi, R.; Gómez Rivas, J.; Autorino, R.; Rouprêt, M.; Psutka, S.P.; et al. Prognostic Significance of Grade Discrepancy Between Primary Tumor and Venous Thrombus in Nonmetastatic Clear-cell Renal Cell Carcinoma: Analysis of the REMEMBER Registry and Implications for Adjuvant Therapy. Eur. Urol. Oncol. 2024, 7, 112–121. [Google Scholar] [CrossRef]
- Yamamoto, A.; Doak, A.E.; Cheung, K.J. Orchestration of Collective Migration and Metastasis by Tumor Cell Clusters. Annu. Rev. Pathol. 2023, 18, 231–256. [Google Scholar] [CrossRef]
- Doran, B.R.; Moffitt, L.R.; Wilson, A.L.; Stephens, A.N.; Bilandzic, M. Leader Cells: Invade and Evade-The Frontline of Cancer Progression. Int. J. Mol. Sci. 2024, 25, 10554. [Google Scholar] [CrossRef] [PubMed]
- Gregory, P.A.; Bert, A.G.; Paterson, E.L.; Barry, S.C.; Tsykin, A.; Farshid, G.; Vadas, M.A.; Khew-Goodall, Y.; Goodall, G.J. The miR-200 family and miR-205 regulate epithelial to mesenchymal transition by targeting ZEB1 and SIP1. Nat. Cell Biol. 2008, 10, 593–601. [Google Scholar] [CrossRef]
- Klicka, K.; Grzywa, T.M.; Mielniczuk, A.; Klinke, A.; Włodarski, P.K. The role of miR-200 family in the regulation of hallmarks of cancer. Front. Oncol. 2022, 12, 965231. [Google Scholar] [CrossRef] [PubMed]
- Massagué, J.; Obenauf, A.C. Metastatic colonization by circulating tumour cells. Nature 2016, 529, 298–306. [Google Scholar] [CrossRef] [PubMed]
- Friedl, P.; Locker, J.; Sahai, E.; Segall, J.E. Classifying collective cancer cell invasion. Nat. Cell Biol. 2012, 14, 777–783. [Google Scholar] [CrossRef]
- Gunasinghe, N.P.; Wells, A.; Thompson, E.W.; Hugo, H.J. Mesenchymal-epithelial transition (MET) as a mechanism for metastatic colonisation in breast cancer. Cancer Metastasis Rev. 2012, 31, 469–478. [Google Scholar] [CrossRef]
- Shi, X.; Pang, Q.; Nian, X.; Jiang, A.; Shi, H.; Liu, W.; Gan, X.; Gao, Y.; Yang, Y.; Ji, J.; et al. Integrative transcriptome and proteome analyses of clear cell renal cell carcinoma develop a prognostic classifier associated with thrombus. Sci. Rep. 2023, 13, 9778. [Google Scholar] [CrossRef]
- Akhmetkaliyev, A.; Alibrahim, N.; Shafiee, D.; Tulchinsky, E. EMT/MET plasticity in cancer and Go-or-Grow decisions in quiescence: The two sides of the same coin? Mol. Cancer 2023, 22, 90. [Google Scholar] [CrossRef]
- Zheng, R.; Liu, Y.; Lei, Y.; Yue, Y. Upregulated microRNA-429 confers endometrial stromal cell dysfunction by targeting HIF1AN and regulating the HIF1A/VEGF pathway. Open Med. 2023, 18, 20230775. [Google Scholar] [CrossRef]
- Roviello, G.; De Gennaro, I.; Vascotto, I.; Venturi, G.; D’Angelo, A.; Winchler, C.; Guarino, A.; Cacioppo, S.; Modesti, M.; Mela, M.M.; et al. Hypoxia-Inducible Factor in Renal Cell Carcinoma: From Molecular Insights to Targeted Therapies. Genes 2025, 16, 6. [Google Scholar] [CrossRef]
- Bacigalupa, Z.A.; Rathmell, W.K. Beyond glycolysis: Hypoxia signaling as a master regulator of alternative metabolic pathways and the implications in clear cell renal cell carcinoma. Cancer Lett. 2020, 489, 19–28. [Google Scholar] [CrossRef]
- Fan, Y.; Li, H.; Ma, X.; Gao, Y.; Chen, L.; Li, X.; Bao, X.; Du, Q.; Zhang, Y.; Zhang, X. Prognostic Significance of Hypoxia-Inducible Factor Expression in Renal Cell Carcinoma: A PRISMA-compliant Systematic Review and Meta-Analysis. Medicine 2015, 94, e1646. [Google Scholar] [CrossRef]
- Bartoszewska, S.; Kochan, K.; Piotrowski, A.; Kamysz, W.; Ochocka, R.J.; Collawn, J.F.; Bartoszewski, R. The hypoxia-inducible miR-429 regulates hypoxia-inducible factor-1α expression in human endothelial cells through a negative feedback loop. FASEB J. 2015, 29, 1467–1479. [Google Scholar] [CrossRef]
- Ge, L.; Wang, Y.; Cao, Y.; Li, G.; Sun, R.; Teng, P.; Wang, Y.; Bi, Y.; Guo, Z.; Yuan, Y.; et al. MiR-429 improved the hypoxia tolerance of human amniotic cells by targeting HIF-1α. Biotechnol. Lett. 2018, 40, 1477–1486. [Google Scholar] [CrossRef] [PubMed]
- Janaszak-Jasiecka, A.; Bartoszewska, S.; Kochan, K.; Piotrowski, A.; Kalinowski, L.; Kamysz, W.; Ochocka, R.J.; Bartoszewski, R.; Collawn, J.F. miR-429 regulates the transition between Hypoxia-Inducible Factor (HIF)1A and HIF3A expression in human endothelial cells. Sci. Rep. 2016, 6, 22775. [Google Scholar] [CrossRef] [PubMed]
- Xu, H.; Yang, B.; Ren, Z.; Wu, D.; Hu, A.; Hu, J. miR-429 negatively regulates the progression of hypoxia-induced retinal neovascularization by the HPSE-VEGF pathway. Exp. Eye Res. 2022, 223, 109196. [Google Scholar] [CrossRef] [PubMed]
- Ye, G.; Feng, S.; Yang, Y.; Cao, Z.; Zhang, B.; Wang, F. Establishment and Comprehensive Analysis of Underlying microRNA-mRNA Interactive Networks in Ovarian Cancer. J. Oncol. 2022, 2022, 5120342. [Google Scholar] [CrossRef]
- Zhu, Q.; Hu, J.; Wang, L.; Wang, W.; Wang, Z.; Li, P.L.; Boini, K.M.; Li, N. Inhibition of microRNA-429 in the renal medulla increased salt sensitivity of blood pressure in Sprague Dawley rats. J. Hypertens. 2017, 35, 1872–1880. [Google Scholar] [CrossRef]
- Mikami, S.; Katsube, K.; Oya, M.; Ishida, M.; Kosaka, T.; Mizuno, R.; Mukai, M.; Okada, Y. Expression of Snail and Slug in renal cell carcinoma: E-cadherin repressor Snail is associated with cancer invasion and prognosis. Lab. Investig. 2011, 91, 1443–1458. [Google Scholar] [CrossRef]
- Yang, J.; Mani, S.A.; Donaher, J.L.; Ramaswamy, S.; Itzykson, R.A.; Come, C.; Savagner, P.; Gitelman, I.; Richardson, A.; Weinberg, R.A. Twist, a master regulator of morphogenesis, plays an essential role in tumor metastasis. Cell 2004, 117, 927–939. [Google Scholar] [CrossRef]
- Harada, K.; Miyake, H.; Kusuda, Y.; Fujisawa, M. Expression of epithelial-mesenchymal transition markers in renal cell carcinoma: Impact on prognostic outcomes in patients undergoing radical nephrectomy. BJU Int. 2012, 110, E1131–E1137. [Google Scholar] [CrossRef]
- Ohba, K.; Miyata, Y.; Matsuo, T.; Asai, A.; Mitsunari, K.; Shida, Y.; Kanda, S.; Sakai, H. High expression of Twist is associated with tumor aggressiveness and poor prognosis in patients with renal cell carcinoma. Int. J. Clin. Exp. Pathol. 2014, 7, 3158–3165. [Google Scholar]
- Rasti, A.; Madjd, Z.; Abolhasani, M.; Mehrazma, M.; Janani, L.; Saeednejad Zanjani, L.; Asgari, M. Cytoplasmic expression of Twist1, an EMT-related transcription factor, is associated with higher grades renal cell carcinomas and worse progression-free survival in clear cell renal cell carcinoma. Clin. Exp. Med. 2018, 18, 177–190. [Google Scholar] [CrossRef]
- Tsai, J.H.; Donaher, J.L.; Murphy, D.A.; Chau, S.; Yang, J. Spatiotemporal regulation of epithelial-mesenchymal transition is essential for squamous cell carcinoma metastasis. Cancer Cell 2012, 22, 725–736. [Google Scholar] [CrossRef] [PubMed]
- Yang, M.H.; Wu, M.Z.; Chiou, S.H.; Chen, P.M.; Chang, S.Y.; Liu, C.J.; Teng, S.C.; Wu, K.J. Direct regulation of TWIST by HIF-1alpha promotes metastasis. Nat. Cell Biol. 2008, 10, 295–305. [Google Scholar] [CrossRef] [PubMed]
- Sheinerman, K.; Tsivinsky, V.; Mathur, A.; Kessler, D.; Shaz, B.; Umansky, S. Age- and sex-dependent changes in levels of circulating brain-enriched microRNAs during normal aging. Aging 2018, 10, 3017–3041. [Google Scholar] [CrossRef] [PubMed]
- Martino, M.T.D.; Tagliaferri, P.; Tassone, P. MicroRNA in cancer therapy: Breakthroughs and challenges in early clinical applications. J. Exp. Clin. Cancer Res. 2025, 44, 126. [Google Scholar] [CrossRef]
- Huang, Y.; Hong, W.; Wei, X. The molecular mechanisms and therapeutic strategies of EMT in tumor progression and metastasis. J. Hematol. Oncol. 2022, 15, 129. [Google Scholar] [CrossRef]
- Raspollini, M.R.; Moch, H.; Tan, P.H.; Amin, M.B.; Turajlic, S. (Eds.) Chapter 2: Tumours of the kidney. In WHO Classification of Tumors Editorial Board. Urinary and Male Genital Tumours, 5th ed.; WHO Classification of Tumours Series; International Agency for Research on Cancer: Lyon, France, 2022; Volume 8. Available online: https://publications.iarc.fr/610 (accessed on 2 March 2025).
- Pavlič, A.; Urh, K.; Boštjančič, E.; Zidar, N. Analyzing the invasive front of colorectal cancer—By punching tissue block or laser capture microdissection? Pathol. Res. Pract. 2023, 248, 154727. [Google Scholar] [CrossRef]
- Glenn, S.T.; Jones, C.A.; Liang, P.; Kaushik, D.; Gross, K.W.; Kim, H.L. Expression profiling of archival renal tumors by quantitative PCR to validate prognostic markers. Biotechniques 2007, 43, 639–640. [Google Scholar] [CrossRef]
Disclaimer/Publisher’s Note: The statements, opinions and data contained in all publications are solely those of the individual author(s) and contributor(s) and not of MDPI and/or the editor(s). MDPI and/or the editor(s) disclaim responsibility for any injury to people or property resulting from any ideas, methods, instructions or products referred to in the content. |
© 2025 by the authors. Licensee MDPI, Basel, Switzerland. This article is an open access article distributed under the terms and conditions of the Creative Commons Attribution (CC BY) license (https://creativecommons.org/licenses/by/4.0/).