

Monocyte Distribution Width for Sepsis Diagnosis in the Emergency Department and Intensive Care Unit: A Systematic Review and Meta-Analysis


Abstract
1. Introduction
2. Materials and Methods
2.1. Study Selection, Data Extraction, and Quality Assessment
2.2. Statistical Analysis
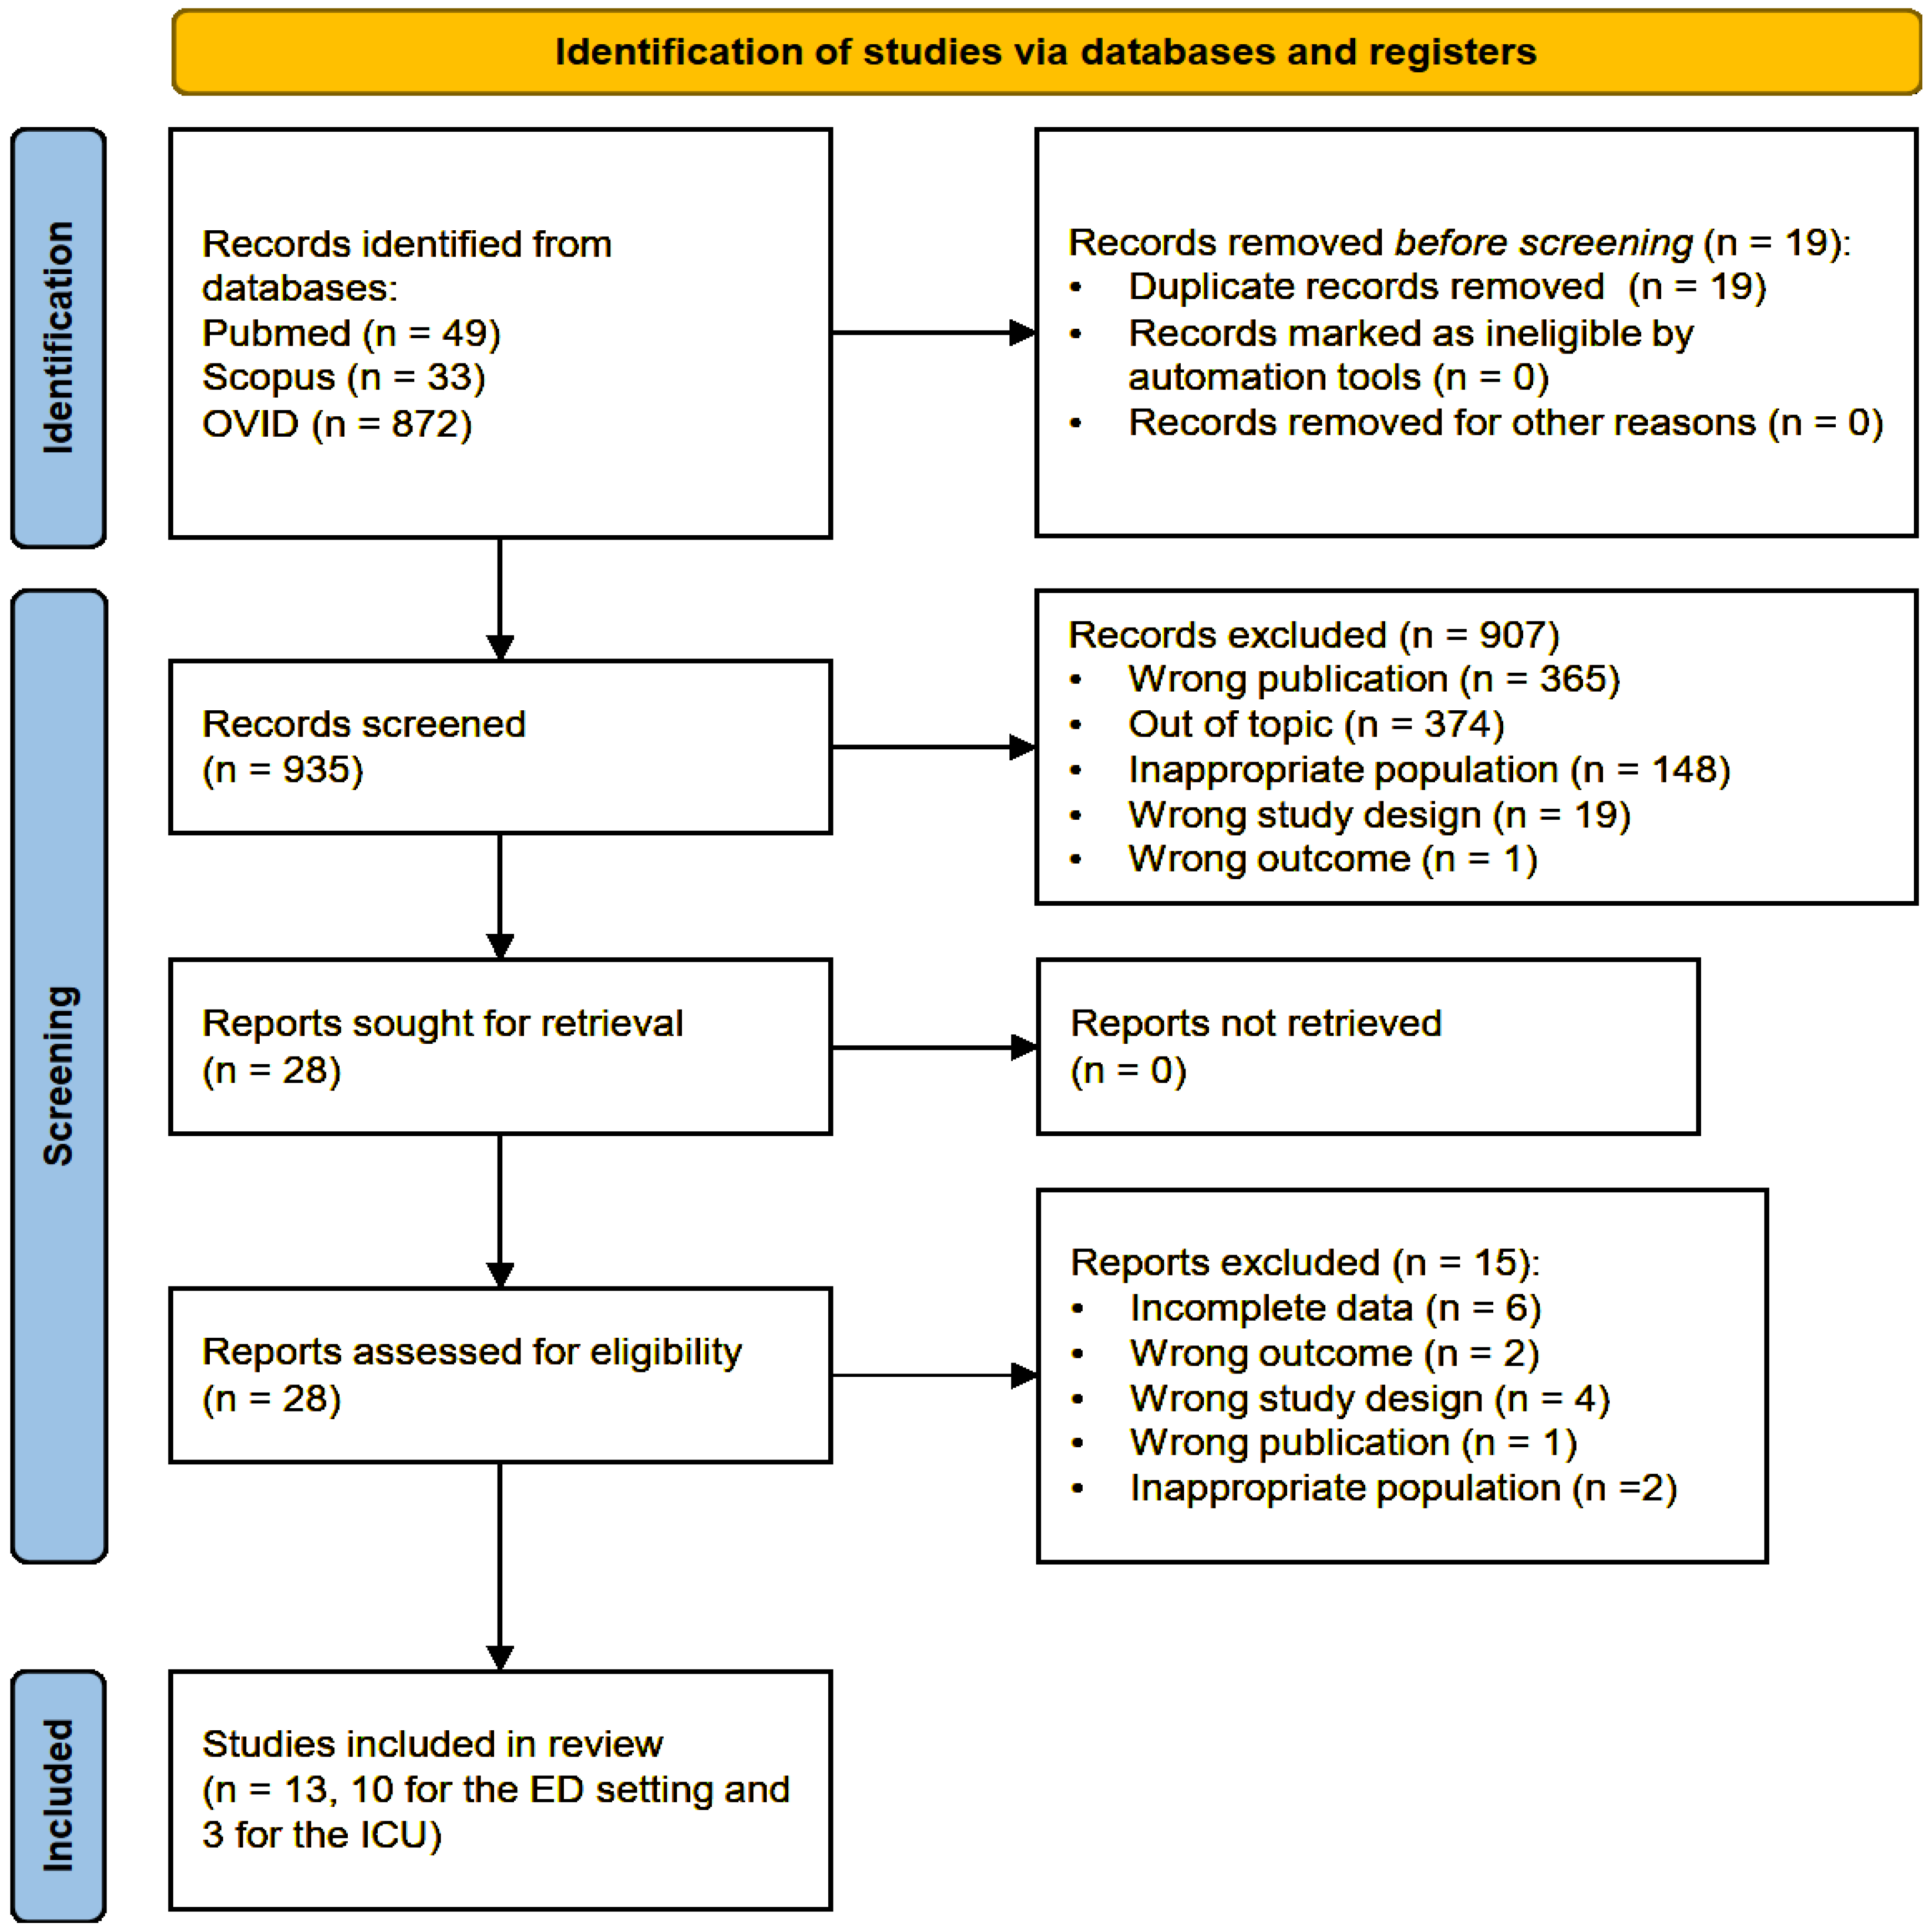
3. Results
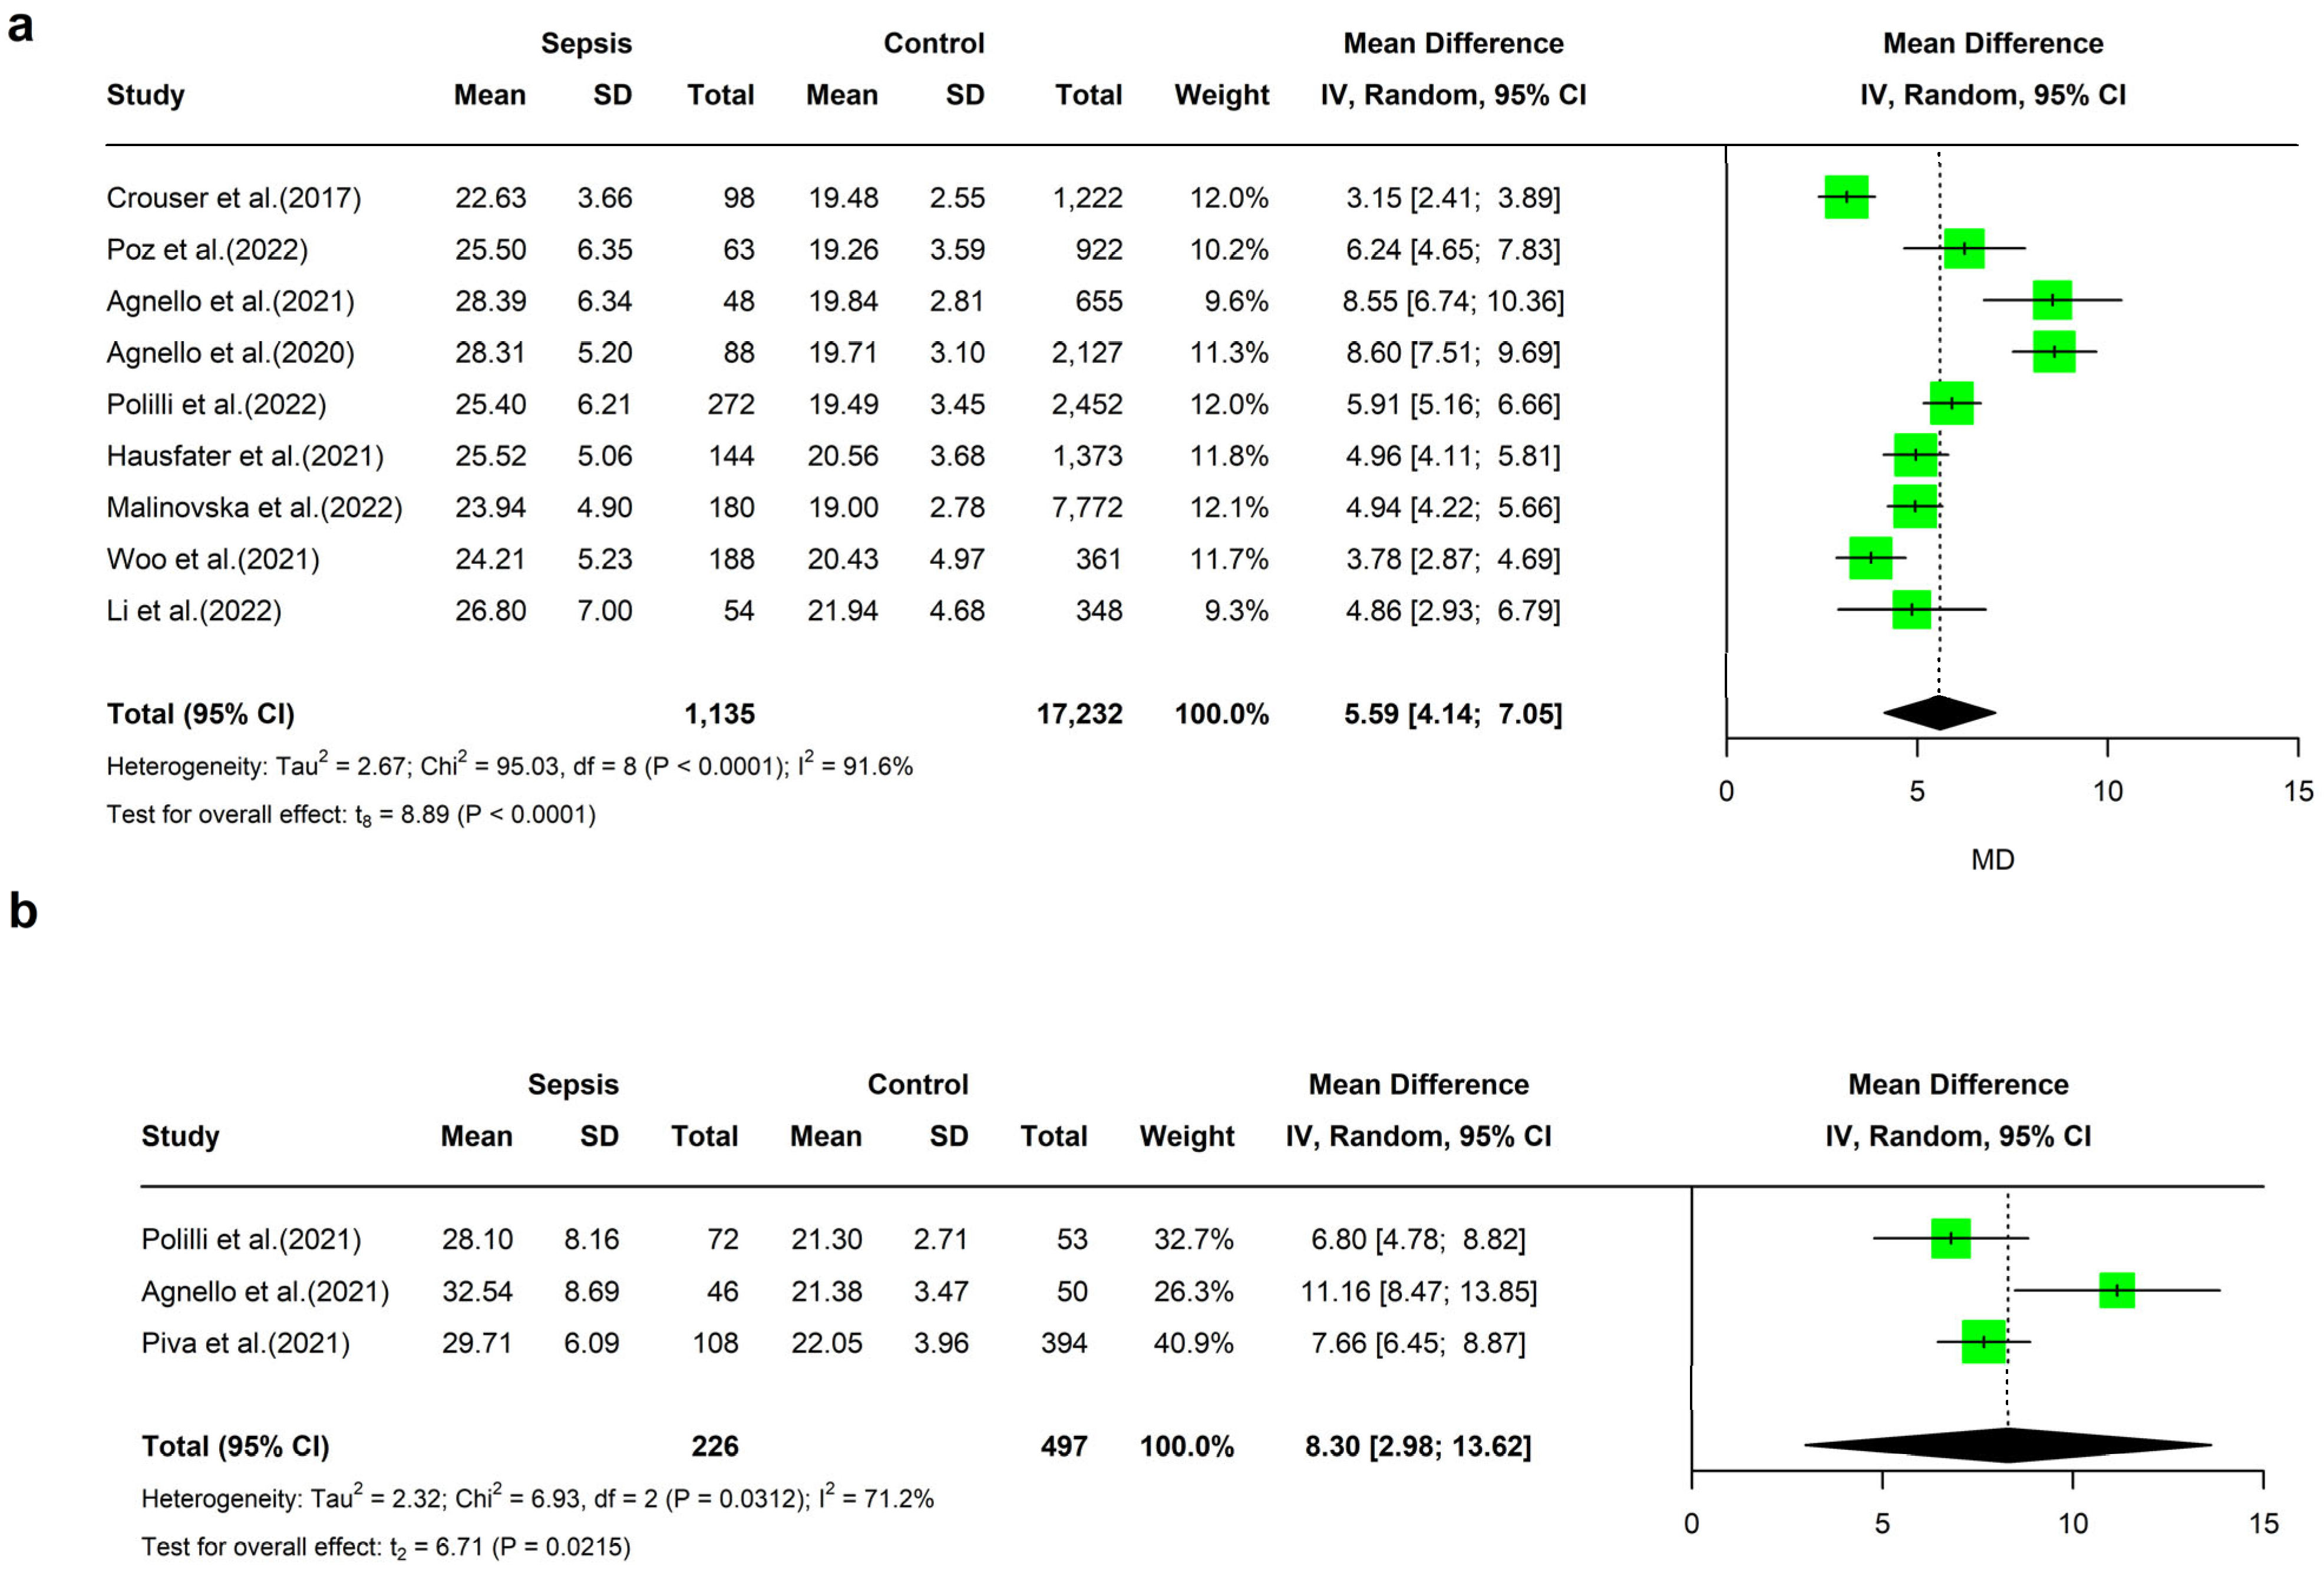
4. Meta-Analyses of MDW Values
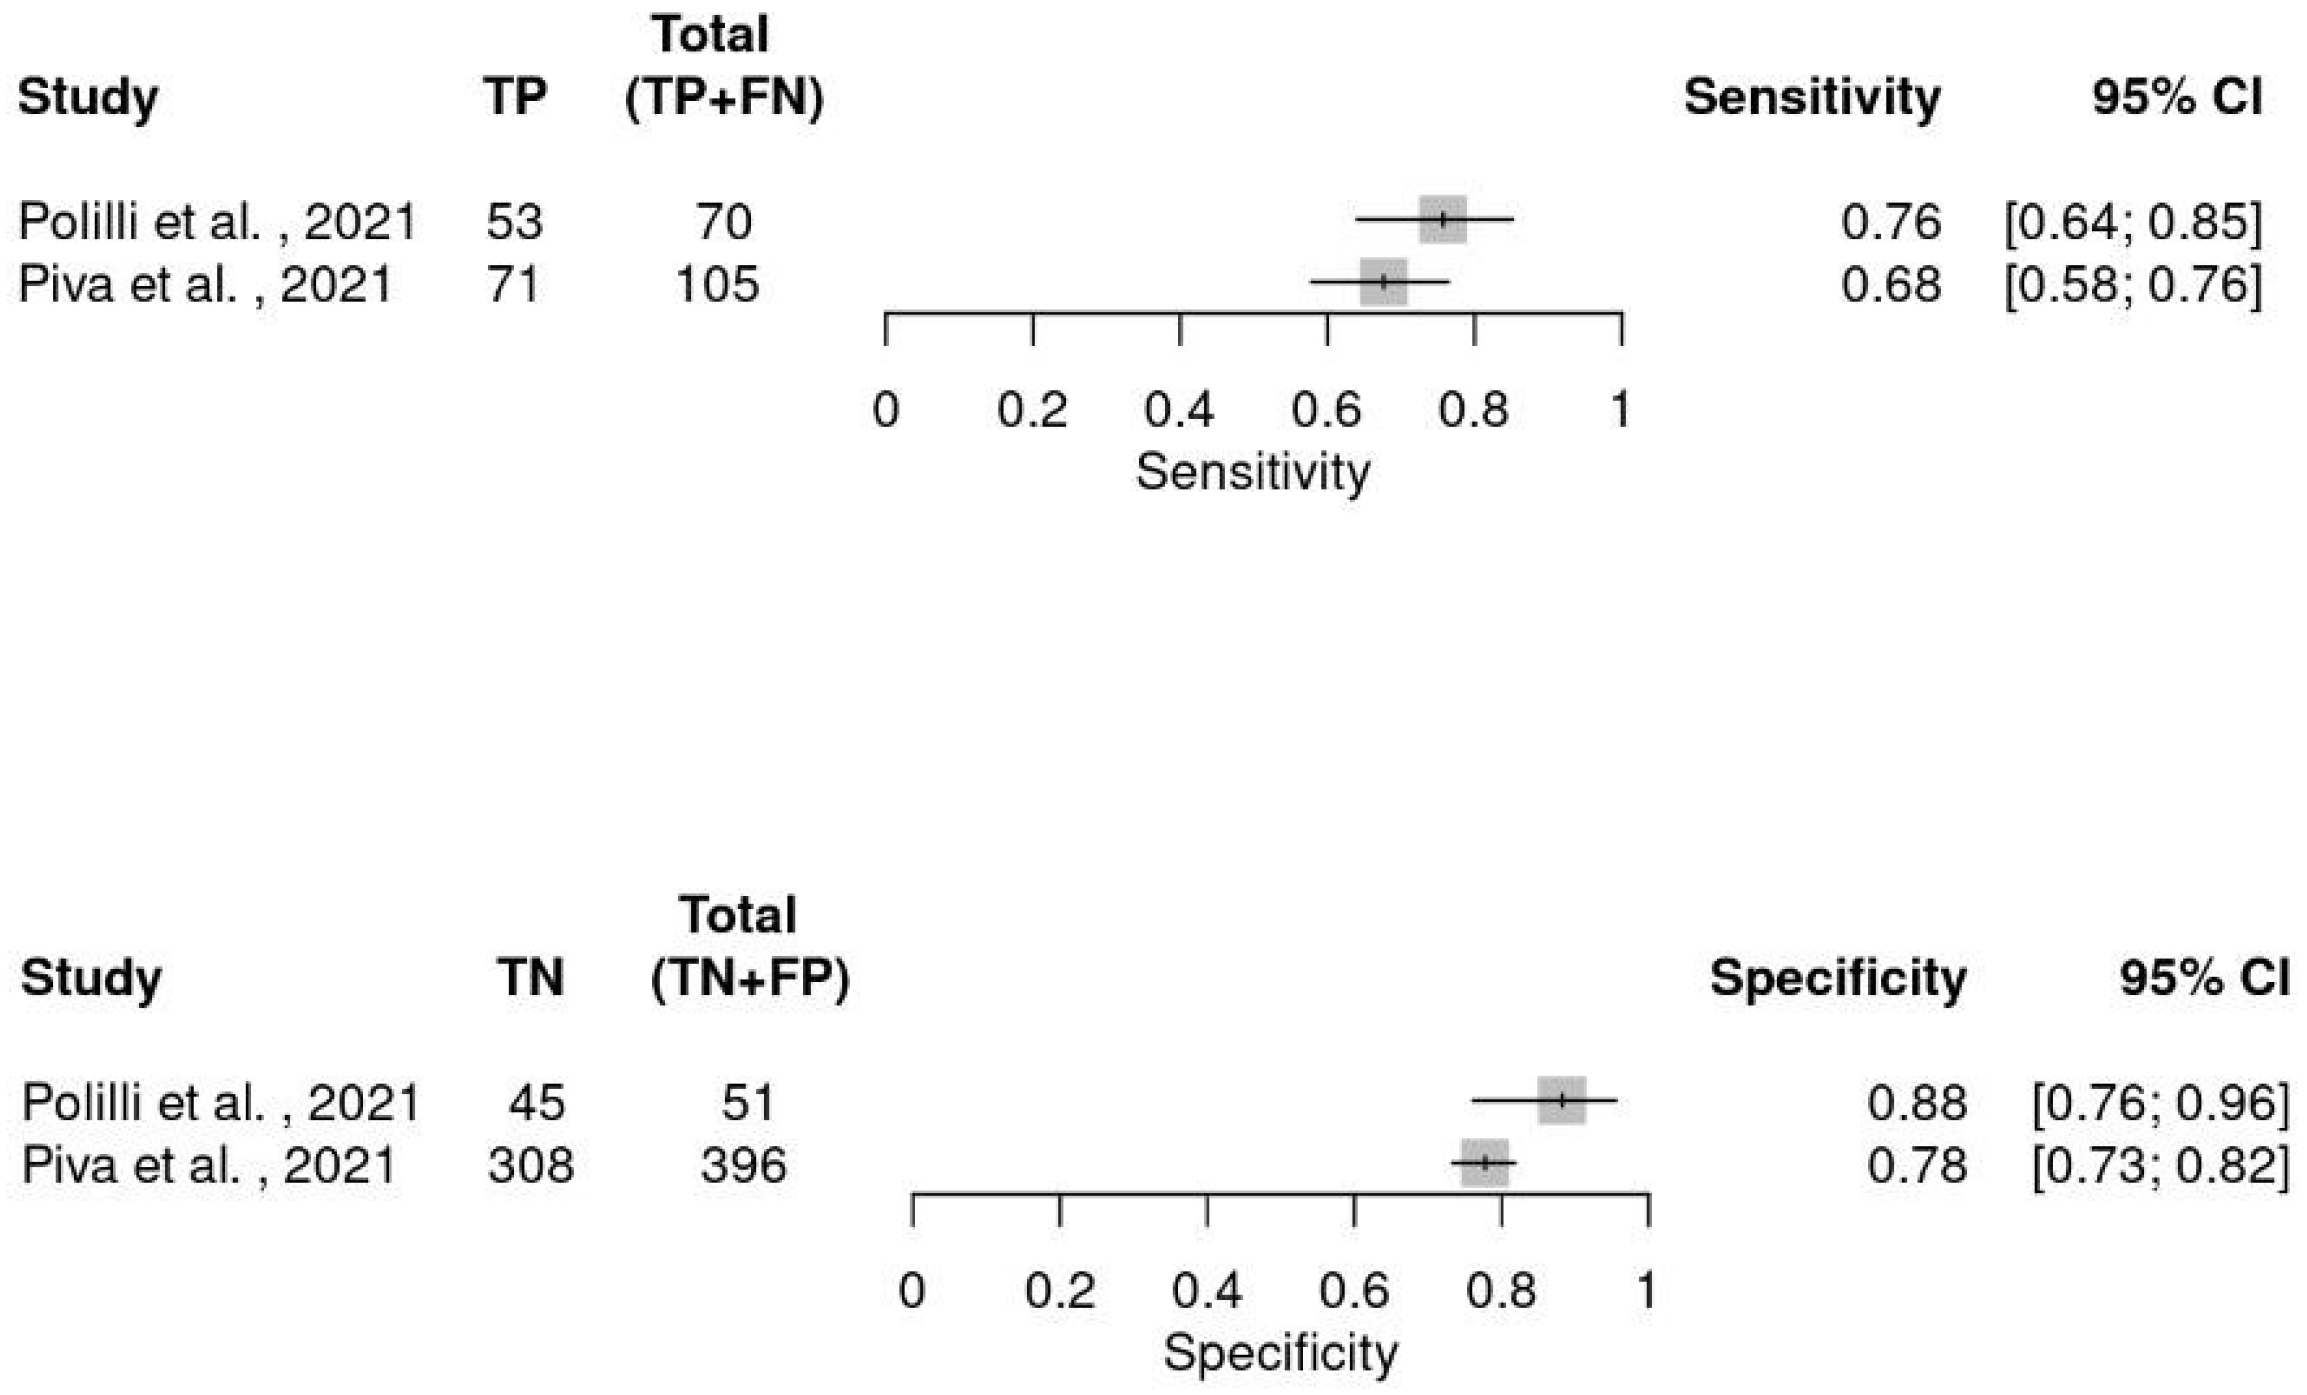
5. Diagnostic Meta-Analysis
6. Investigation of Heterogeneity
7. Subgroup Analysis and Meta Regression
7.1. Diagnostic Criteria
7.2. Cut Point of MDW
7.3. Sepsis Prevalence
7.4. Sample Size
7.5. Anticoagulants
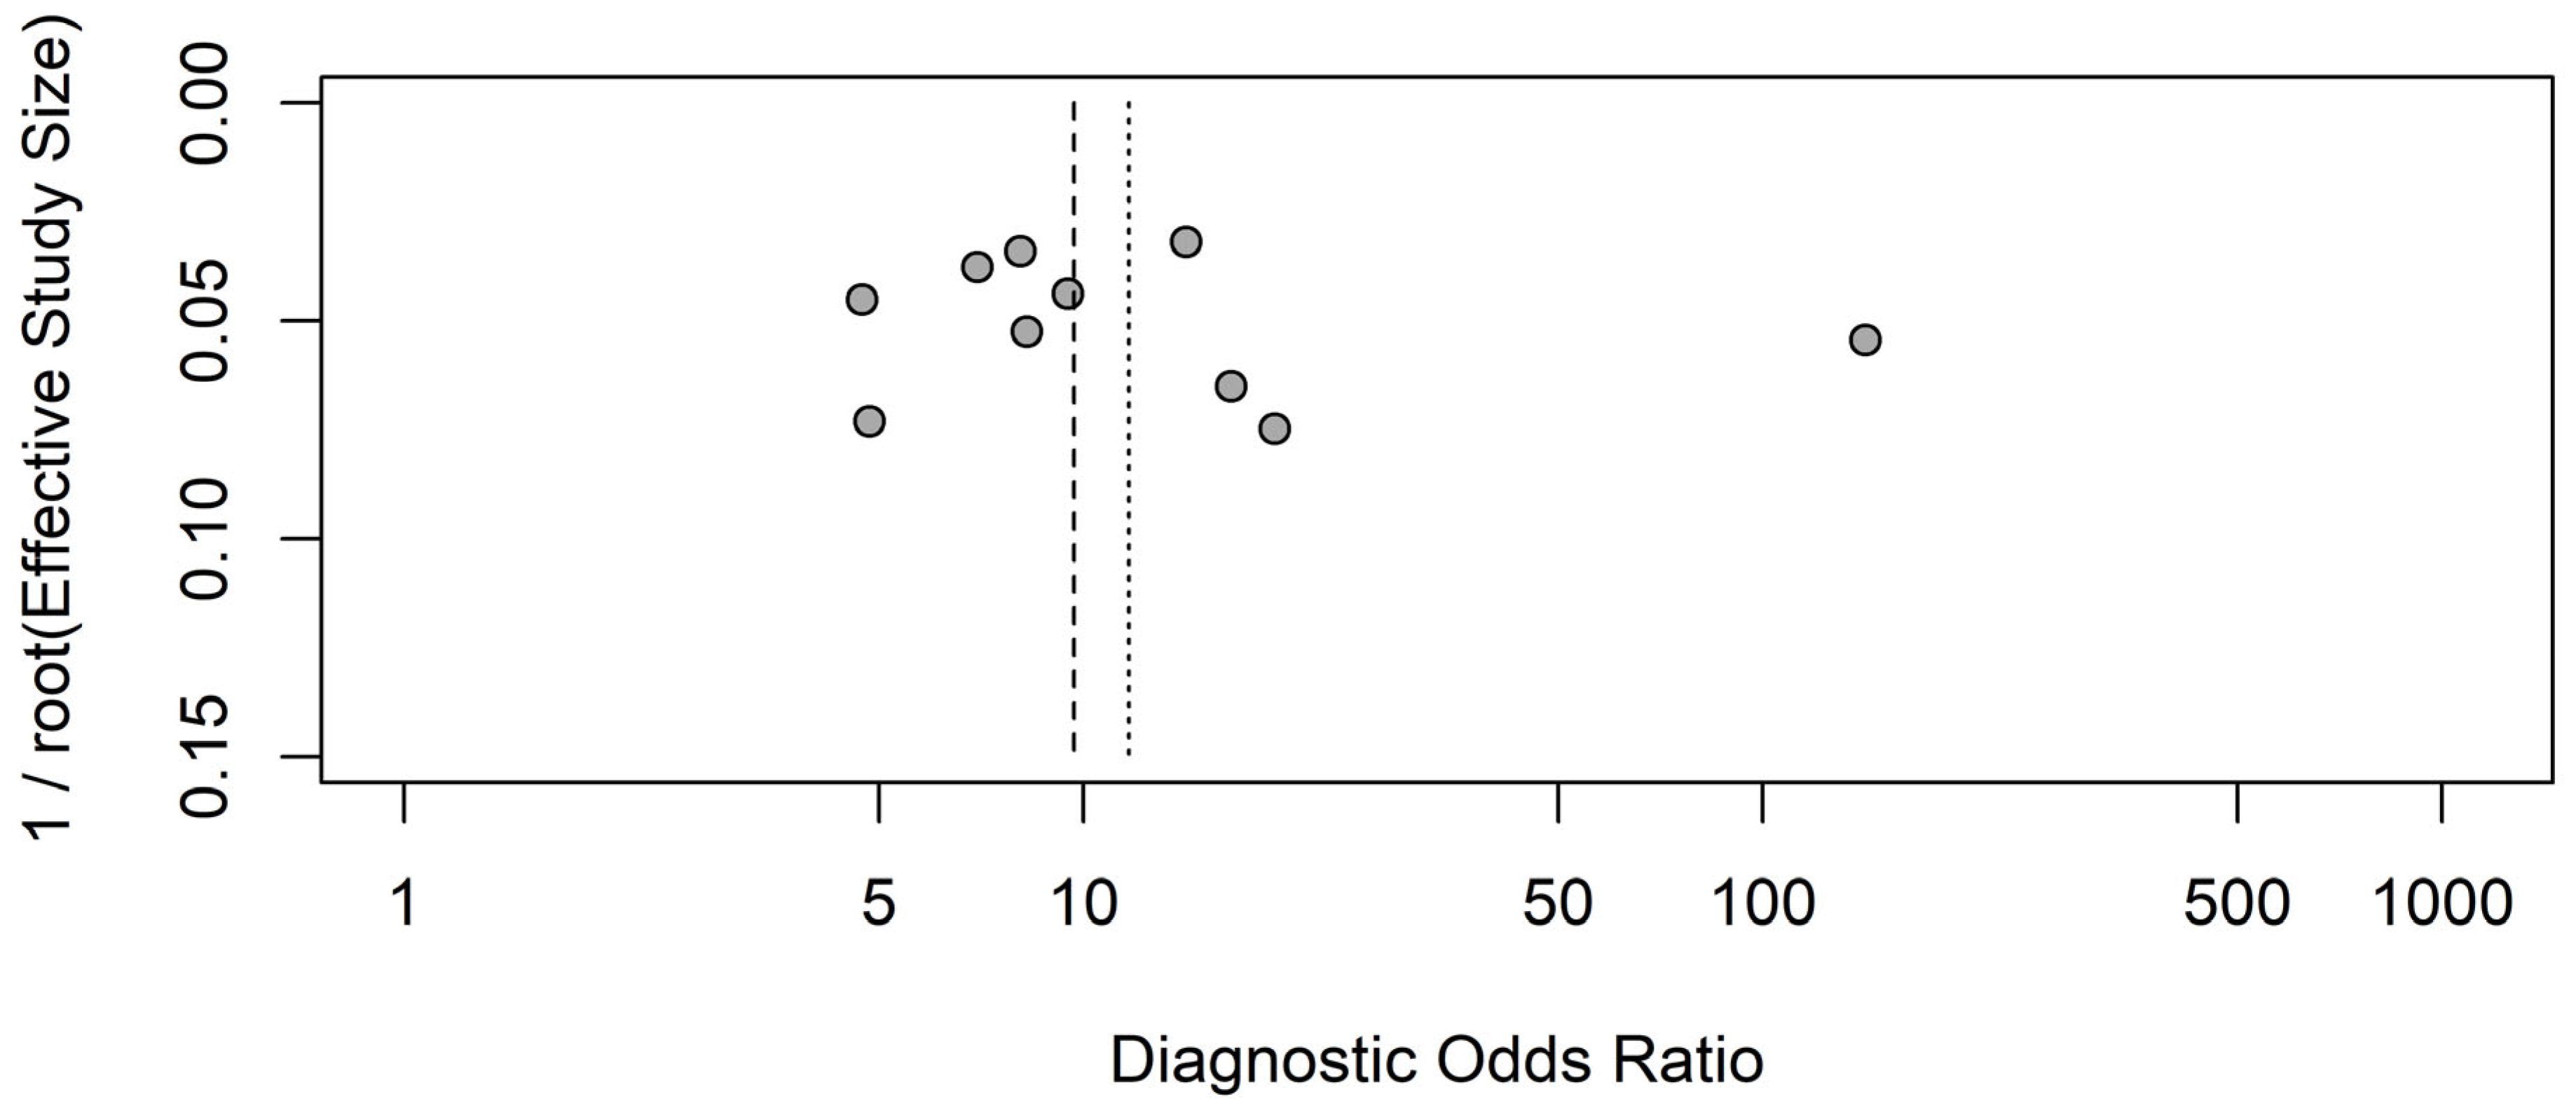
8. Publication Bias
9. Discussion
10. Strengths and Weaknesses of the Review
11. Agreement and Disagreement with Other Studies
12. Conclusions
Supplementary Materials
Author Contributions
Funding
Acknowledgments
Conflicts of Interest
References
- Fleischmann-Struzek, C.; Rudd, K. Challenges of assessing the burden of sepsis. Med. Klin. Intensivmed. Notfallmedizin 2023, 118, 68–74. [Google Scholar] [CrossRef]
- Rudd, K.E.; Johnson, S.C.; Agesa, K.M.; Shackelford, K.A.; Tsoi, D.; Kievlan, D.R.; Colombara, D.V.; Ikuta, K.S.; Kissoon, N.; Finfer, S.; et al. Global, regional, and national sepsis incidence and mortality, 1990–2017: Analysis for the Global Burden of Disease Study. Lancet 2020, 395, 200–211. [Google Scholar] [CrossRef]
- Jayaprakash, N.; Sarani, N.; Nguyen, H.B.; Cannon, C. State of the art of sepsis care for the emergency medicine clinician. J. Am. Coll. Emerg. Physicians Open 2024, 5, e13264. [Google Scholar] [CrossRef] [PubMed]
- Yinger, K.; Bernas-Maley, M.; Bhatia, V. Utilization of a Visit-Based Sepsis Assessment to Prevent Hospital Readmissions. Home Healthc. Now 2020, 38, 131–137. [Google Scholar] [CrossRef] [PubMed]
- Glickman, S.W.; Cairns, C.B.; Otero, R.M.; Woods, C.W.; Tsalik, E.L.; Langley, R.J.; van Velkinburgh, J.C.; Park, L.P.; Glickman, L.T.; Fowler, V.G., Jr.; et al. Disease Progression in Hemodynamically Stable Patients Presenting to the Emergency Department with Sepsis. Acad. Emerg. Med. Off. J. Soc. Acad. Emerg. Med. 2010, 17, 383–390. [Google Scholar] [CrossRef] [PubMed]
- Capp, R.; Horton, C.L.; Takhar, S.S.; Ginde, A.A.; Peak, D.A.; Zane, R.; Marill, K.A. Predictors of patients who present to the emergency department with sepsis and progress to septic shock between 4 and 48 hours of emergency department arrival. Crit. Care Med. 2015, 43, 983–988. [Google Scholar] [CrossRef]
- Bennett, S.R. Sepsis in the intensive care unit. Surgery 2015, 33, 565–571. [Google Scholar]
- Wang, L.; Zhou, K.H.; Chen, W.; Yu, Y.; Feng, S.F. Epidemiology and risk factors for nosocomial infection in the respiratory intensive care unit of a teaching hospital in China: A prospective surveillance during 2013 and 2015. BMC Infect. Dis. 2019, 19, 145. [Google Scholar] [CrossRef]
- Bolanaki, M.; Winning, J.; Slagman, A.; Lehmann, T.; Kiehntopf, M.; Stacke, A.; Neumann, C.; Reinhart, K.; Möckel, M.; Bauer, M. Biomarkers Improve Diagnostics of Sepsis in Adult Patients With Suspected Organ Dysfunction Based on the Quick Sepsis-Related Organ Failure Assessment (qSOFA) Score in the Emergency Department. Crit. Care Med. 2024, 52, 887–899. [Google Scholar] [CrossRef]
- Zhang, N.; Liu, Y.; Yang, C.; Li, X. Review of the Predictive Value of Biomarkers in Sepsis Mortality. Emerg. Med. Int. 2024, 2024, 2715606. [Google Scholar] [CrossRef]
- Zuo, L.; Li, X.; Wang, L.; Yuan, H.; Liao, Z.; Zhou, S.; Wu, J.; Guan, X.; Liu, Y. Heparin-binding protein as a biomarker for the diagnosis of sepsis in the intensive care unit: A retrospective cross-sectional study in China. BMJ Open 2024, 14, e078687. [Google Scholar] [CrossRef]
- Martinez-Iribarren, A.; Tejedor, X.; Sala Sanjaume, À.; Leis, A.; Doladé Botias, M.; Morales-Indiano, C. Performance evaluation of the new hematology analyzer UniCel DxH 900. Int. J. Lab. Hematol. 2021, 43, 623–631. [Google Scholar] [CrossRef]
- Tsuboi, H.; Segawa, S.; Yagishita, M.; Toko, H.; Honda, F.; Kitada, A.; Miki, H.; Ohyama, A.; Hagiwara, S.; Kondo, Y.; et al. Activation mechanisms of monocytes/macrophages in adult-onset Still disease. Front. Immunol. 2022, 13, 953730. [Google Scholar] [CrossRef]
- Polilli, E.; Frattari, A.; Esposito, J.E.; Stanziale, A.; Giurdanella, G.; Di Iorio, G.; Carinci, F.; Parruti, G. Monocyte distribution width (MDW) as a new tool for the prediction of sepsis in critically ill patients: A preliminary investigation in an intensive care unit. BMC Emerg. Med. 2021, 21, 147. [Google Scholar] [CrossRef]
- Agnello, L.; Iacona, A.; Maestri, S.; Lo Sasso, B.; Giglio, R.V.; Mancuso, S.; Ciaccio, A.M.; Vidali, M.; Ciaccio, M. Independent Validation of Sepsis Index for Sepsis Screening in the Emergency Department. Diagnostics 2021, 11, 1292. [Google Scholar] [CrossRef] [PubMed]
- Wu, J.; Li, L.; Luo, J. Diagnostic and Prognostic Value of Monocyte Distribution Width in Sepsis. J. Inflamm. Res. 2022, 15, 4107–4117. [Google Scholar] [CrossRef] [PubMed]
- U.S. Food & Drug Administration. 510(k) Substantial Equivalence Determination Decision Summary. 2019. Available online: https://www.accessdata.fda.gov/cdrh_docs/reviews/K181599.pdf (accessed on 15 June 2025).
- Agnello, L.; Vidali, M.; Lo Sasso, B.; Giglio, R.V.; Gambino, C.M.; Scazzone, C.; Ciaccio, A.M.; Bivona, G.; Ciaccio, M. Monocyte distribution width (MDW) as a screening tool for early detecting sepsis: A systematic review and meta-analysis. Clin. Chem. Lab. Med. CCLM 2022, 60, 786–792. [Google Scholar] [CrossRef]
- Malinovska, A.; Hernried, B.; Lin, A.; Badaki-Makun, O.; Fenstermacher, K.; Ervin, A.M.; Ehrhardt, S.; Levin, S.; Hinson, J.S. Monocyte Distribution Width as a Diagnostic Marker for Infection: A Systematic Review and Meta-analysis. CHEST 2023, 164, 101–113. [Google Scholar] [CrossRef]
- Huang, Y.H.; Chen, C.J.; Shao, S.C.; Li, C.H.; Hsiao, C.H.; Niu, K.Y.; Yen, C.C. Comparison of the Diagnostic Accuracies of Monocyte Distribution Width, Procalcitonin, and C-Reactive Protein for Sepsis: A Systematic Review and Meta-Analysis. Crit. Care Med. 2023, 51, e106–e114. [Google Scholar] [CrossRef]
- Motawea, K.R.; S Rozan, S.; Elsayed Talat, N.; H Elhalag, R.; Mohammed Reyad, S.; Chebl, P.; Swed, S.; Sawaf, B.; Hadeel Alfar, H.; Farwati, A.; et al. Comparison of monocyte distribution width and Procalcitonin as diagnostic markers for sepsis: Meta-analysis of diagnostic test accuracy studies. PLoS ONE 2023, 18, e0288203. [Google Scholar] [CrossRef]
- Eisinger, G.J.; Hosler, Q.; Crouser, E.D.; Herman, D.D. Diagnostic Performance of Monocyte Distribution Width for the Detection of Sepsis: A Systematic Review and Meta-Analysis. J. Am. Coll. Emerg. Physicians Open 2025, 6, 100073. [Google Scholar] [CrossRef] [PubMed]
- Corporation for Digital Scholarship. Zotero (5.0.96.2). Available online: https://www.zotero.org/ (accessed on 15 June 2025).
- Ouzzani, M.; Hammady, H.; Fedorowicz, Z.; Elmagarmid, A. Rayyan—A web and mobile app for systematic reviews. Syst. Rev. 2016, 5, 210. [Google Scholar] [CrossRef] [PubMed]
- Hozo, S.P.; Djulbegovic, B.; Hozo, I. Estimating the mean and variance from the median, range, and the size of a sample. BMC Med. Res. Methodol. 2005, 5, 13. [Google Scholar] [CrossRef] [PubMed]
- Wan, X.; Wang, W.; Liu, J.; Tong, T. Estimating the sample mean and standard deviation from the sample size, median, range and/or interquartile range. BMC Med. Res. Methodol. 2014, 14, 135. [Google Scholar] [CrossRef]
- Higgins, J.P.T.; Li, T.; Deeks, J.J. Chapter 6: Choosing Effect Measures and Computing Estimates of Effect. In Cochrane Handbook for Systematic Reviews of Interventions; Version 6.5; Cochrane: London, UK, 2024; Available online: www.cochrane.org/authors/handbooks-and-manuals/handbook/current/chapter-06 (accessed on 15 June 2025).
- Whiting, P.F.; Rutjes, A.W.S.; Westwood, M.E.; Mallett, S.; Deeks, J.J.; Reitsma, J.B.; Leeflang, M.M.G.; Sterne, J.A.C.; Bossuyt, P.M.M.; QUADAS-2 Group. QUADAS-2: Strumento per valutare la qualità degli studi di accuratezza diagnostica. Evidence 2016, 8, e1000131. [Google Scholar]
- Leeflang, M.M.; Bossuyt, P.M.; Irwig, L. Diagnostic test accuracy may vary with prevalence: Implications for evidence-based diagnosis. J. Clin. Epidemiol. 2009, 62, 5–12. [Google Scholar] [CrossRef]
- IntHout, J.; Ioannidis, J.P.; Borm, G.F.; Goeman, J.J. Small studies are more heterogeneous than large ones: A meta-meta-analysis. J. Clin. Epidemiol. 2015, 68, 860–869. [Google Scholar] [CrossRef]
- Sammut-Powell, C.; Reynard, C.; Allen, J.; McDermott, J.; Braybrook, J.; Parisi, R.; Lasserson, D.; Body, R.; CONDOR steering committee. Examining the effect of evaluation sample size on the sensitivity and specificity of COVID-19 diagnostic tests in practice: A simulation study. Diagn. Progn. Res. 2022, 6, 12. [Google Scholar] [CrossRef]
- Wang, X.; Piantadosi, S.; Le-Rademacher, J.; Mandrekar, S.J. Statistical Considerations for Subgroup Analyses. J. Thorac. Oncol. 2021, 16, 375–380. [Google Scholar] [CrossRef]
- Cole, T.J. Too many digits: The presentation of numerical data. Arch. Dis. Child. 2015, 100, 608–609. [Google Scholar] [CrossRef]
- Plana, M.N.; Arevalo-Rodriguez, I.; Fernández-García, S.; Soto, J.; Fabregate, M.; Pérez, T.; Roqué, M.; Zamora, J. Meta-DiSc 2.0: A web application for meta-analysis of diagnostic test accuracy data. BMC Med. Res. Methodol. 2022, 22, 306. [Google Scholar] [CrossRef] [PubMed]
- Migliavaca, C.B.; Stein, C.; Colpani, V.; Munn, Z.; Falavigna, M.; Prevalence Estimates Reviews—Systematic Review Methodology Group (PERSyst). Quality assessment of prevalence studies: A systematic review. J. Clin. Epidemiol. 2020, 127, 59–68. [Google Scholar] [CrossRef] [PubMed]
- Higgins, J.P.T.; Thompson, S.G.; Deeks, J.J.; Altman, D.G. Measuring inconsistency in meta-analyses. BMJ 2003, 327, 557–560. [Google Scholar] [CrossRef]
- Deeks, J.J.; Higgins, J.P.T.; Altman, D.G.; McKenzie, J.E.; Veroniki, A.A. Chapter 10: Analysing Data and Undertaking Meta-Analyses. In Cochrane Handbook for Systematic Reviews of Diag-nostic Test Accuracy; Version 6.5; Cochrane: London, UK, 2024; Available online: www.cochrane.org/authors/handbooks-and-manuals/handbook/current/chapter-10 (accessed on 15 June 2025).
- Chu, H.; Guo, H.; Zhou, Y. Bivariate random effects meta-analysis of diagnostic studies using generalized linear mixed models. Med. Decis. Mak. 2010, 30, 499–508. [Google Scholar]
- Reitsma, J.B.; Glas, A.S.; Rutjes, A.W.S.; Scholten, R.J.P.M.; Bossuyt, P.M.; Zwinderman, A.H. Bivariate analysis of sensitivity and specificity produces informative summary measures in diagnostic reviews. J. Clin. Epidemiol. 2005, 58, 982–990. [Google Scholar] [CrossRef]
- Chu, H.; Cole, S.R. Bivariate meta-analysis of sensitivity and specificity with sparse data: A generalized linear mixed model approach. J. Clin. Epidemiol. 2006, 59, 1331–1332. [Google Scholar] [CrossRef]
- Leeflang, M.M.; Deeks, J.J.; Rutjes, A.W.; Reitsma, J.B.; Bossuyt, P.M. Bivariate meta-analysis of predictive values of diagnostic tests can be an alternative to bivariate meta-analysis of sensitivity and specificity. J. Clin. Epidemiol. 2012, 65, 1088–1097. [Google Scholar] [CrossRef]
- Plana, M.N.; Pérez, T.; Zamora, J. New measures improved the reporting of heterogeneity in diagnostic test accuracy reviews: A metaepidemiological study. J. Clin. Epidemiol. 2021, 131, 101–112. [Google Scholar] [CrossRef]
- R Core Team. R: A Language and Environment for Statistical Computing. 2021. Available online: https://www.R-project.org/ (accessed on 15 June 2025).
- Harbord, R.M.; Whiting, P. Metandi: Meta-analysis of Diagnostic Accuracy Using Hierarchical Logistic Regression. Stata J. 2009, 9, 211–229. [Google Scholar] [CrossRef]
- Page, M.J.; McKenzie, J.E.; Bossuyt, P.M.; Boutron, I.; Hoffmann, T.C.; Mulrow, C.D.; Shamseer, L.; Tetzlaff, J.M.; Akl, E.A.; Brennan, S.E.; et al. The PRISMA 2020 statement: An updated guideline for reporting systematic reviews. BMJ 2021, 372, n71. [Google Scholar] [CrossRef]
- Polilli, E.; Sozio, F.; Frattari, A.; Persichitti, L.; Sensi, M.; Posata, R.; Di Gregorio, M.; Sciacca, A.; Flacco, M.E.; Manzoli, L.; et al. Comparison of Monocyte Distribution Width (MDW) and Procalcitonin for early recognition of sepsis. PLoS ONE 2020, 15, e0227300. [Google Scholar] [CrossRef]
- Özer, A.; Tak, S.; Demirtaş, H.; Yıldırım, A.K.; Şimşek, E.; Oktar, G.L.; Kaya, Z. The Role of Monocyte Distribution Width in the Early Prediction of Sepsis in Patients Undergoing Cardiovascular Surgery: A Cross-Sectional Study. Medicina 2024, 60, 1558. [Google Scholar] [CrossRef]
- Piva, E.; Zuin, J.; Pelloso, M.; Tosato, F.; Fogar, P.; Plebani, M. Monocyte distribution width (MDW) parameter as a sepsis indicator in intensive care units. Clin. Chem. Lab. Med. 2021, 59, 1307–1314. [Google Scholar] [CrossRef] [PubMed]
- Agnello, L.; Sasso, B.L.; Giglio, R.V.; Bivona, G.; Gambino, C.M.; Cortegiani, A.; Ciaccio, A.M.; Vidali, M.; Ciaccio, M. Monocyte distribution width as a biomarker of sepsis in the intensive care unit: A pilot study. Ann. Clin. Biochem. 2021, 58, 70–73. [Google Scholar] [CrossRef] [PubMed]
- Hausfater, P.; Robert Boter, N.; Morales Indiano, C.; Cancella de Abreu, M.; Marin, A.M.; Pernet, J.; Quesada, D.; Castro, I.; Careaga, D.; Arock, M.; et al. Monocyte distribution width (MDW) performance as an early sepsis indicator in the emergency department: Comparison with CRP and procalcitonin in a multicenter international European prospective study. Crit. Care 2021, 25, 227. [Google Scholar] [CrossRef]
- Crouser, E.D.; Parrillo, J.E.; Seymour, C.; Angus, D.C.; Bicking, K.; Tejidor, L.; Magari, R.; Careaga, D.; Williams, J.; Closser, D.R.; et al. Improved Early Detection of Sepsis in the ED with a Novel Monocyte Distribution Width Biomarker. Chest 2017, 152, 518–526. [Google Scholar] [CrossRef]
- Poz, D.; Crobu, D.; Sukhacheva, E.; Rocchi, M.B.L.; Anelli, M.C.; Curcio, F. Monocyte distribution width (MDW): A useful biomarker to improve sepsis management in Emergency Department. Clin. Chem. Lab. Med. 2022, 60, 433–440. [Google Scholar] [CrossRef]
- Agnello, L.; Bivona, G.; Vidali, M.; Scazzone, C.; Giglio, R.V.; Iacolino, G.; Iacona, A.; Mancuso, S.; Ciaccio, A.M.; Lo Sasso, B.; et al. Monocyte distribution width (MDW) as a screening tool for sepsis in the Emergency Department. Clin. Chem. Lab. Med. 2020, 58, 1951–1957. [Google Scholar] [CrossRef]
- Polilli, E.; Di Iorio, G.; Silveri, C.; Angelini, G.; Anelli, M.C.; Esposito, J.E.; D’Amato, M.; Parruti, G.; Carinci, F. Monocyte Distribution Width as a predictor of community acquired sepsis in patients prospectively enrolled at the Emergency Department. BMC Infect. Dis. 2022, 22, 849. [Google Scholar] [CrossRef]
- Singla, N.; Jandial, A.; Sharma, N.; Sharma, N.; Bhatia, M.; Behera, A. Monocyte Distribution Width (MDW) as an Early Investigational Marker for the Diagnosis of Sepsis in an Emergency Department of a Tertiary Care Hospital in North India. Cureus 2022, 14, e30302. [Google Scholar] [CrossRef]
- Malinovska, A.; Hinson, J.S.; Badaki-Makun, O.; Hernried, B.; Smith, A.; Debraine, A.; Toerper, M.; Rothman, R.E.; Kickler, T.; Levin, S. Monocyte distribution width as part of a broad pragmatic sepsis screen in the emergency department. J. Am. Coll. Emerg. Physicians Open 2022, 3, e12679. [Google Scholar] [CrossRef]
- la Woo, A.; Oh, D.K.; Park, C.J.; Hong, S.B. Monocyte distribution width compared with C-reactive protein and procalcitonin for early sepsis detection in the emergency department. PLoS ONE 2021, 16, e0250101. [Google Scholar]
- Li, C.H.; Seak, C.J.; Chaou, C.H.; Su, T.H.; Gao, S.Y.; Chien, C.Y.; Ng, C.J. Comparison of the diagnostic accuracy of monocyte distribution width and procalcitonin in sepsis cases in the emergency department: A prospective cohort study. BMC Infect. Dis. 2022, 22, 26. [Google Scholar] [CrossRef] [PubMed]
- McDonagh, M.; Peterson, K.; Raina, P.; Chang, S.; Shekelle, P. Avoiding Bias in Selecting Studies. In Methods Guide for Effectiveness and Comparative Effectiveness Reviews; Agency for Healthcare Research and Quality (US): Rockville, MD, USA, 2008. Available online: https://www.ncbi.nlm.nih.gov/books/NBK126701/ (accessed on 15 June 2025).
- Llitjos, J.F.; Carrol, E.D.; Osuchowski, M.F.; Bonneville, M.; Scicluna, B.P.; Payen, D.; Randolph, A.G.; Witte, S.; Rodriguez-Manzano, J.; François, B.; et al. Enhancing sepsis biomarker development: Key considerations from public and private perspectives. Crit. Care 2024, 28, 238. [Google Scholar] [CrossRef] [PubMed]
- Laínez Martínez, S.; Del Castillo, J.G. Usefulness of monocyte distribution width (MDW) as a sepsis biomarker. Rev. Esp. Quimioter. 2022, 35, 2–5. [Google Scholar] [CrossRef]
- Vincent, J.L.; Rello, J.; Marshall, J.; Silva, E.; Anzueto, A.; Martin, C.D.; Moreno, R.; Lipman, J.; Gomersall, C.; Sakr, Y.; et al. International study of the prevalence and outcomes of infection in intensive care units. JAMA 2009, 302, 2323–2329. [Google Scholar] [CrossRef]
- Liu, A.C.; Patel, K.; Vunikili, R.D.; Johnson, K.W.; Abdu, F.; Belman, S.K.; Glicksberg, B.S.; Tandale, P.; Fontanez, R.; Mathew, O.K.; et al. Sepsis in the era of data-driven medicine: Personalizing risks, diagnoses, treatments and prognoses. Brief. Bioinform. 2020, 21, 1182–1195. [Google Scholar] [CrossRef]
- He, Y.; Ong, J.; Tan, T.T.; Goh, B.K.P.; Ong, S.G.K. SIRS Triggered by Acute Right Ventricular Function, Mimicked Septic Shock. J. Crit. Care Med. 2019, 5, 149–156. [Google Scholar] [CrossRef]
- Singer, M.; Deutschman, C.S.; Seymour, C.W.; Shankar-Hari, M.; Annane, D.; Bauer, M.; Bellomo, R.; Bernard, G.R.; Chiche, J.D.; Coopersmith, C.M.; et al. The Third International Consensus Definitions for Sepsis and Septic Shock (SEPSIS-3). JAMA 2016, 315, 801–810. [Google Scholar] [CrossRef]
- Evans, L.; Rhodes, A.; Alhazzani, W.; Antonelli, M.; Coopersmith, C.M.; French, C.; Machado, F.R.; Mcintyre, L.; Ostermann, M.; Prescott, H.C.; et al. Surviving sepsis campaign: International guidelines for management of sepsis and septic shock 2021. Intensive Care Med. 2021, 47, 1181–1247. [Google Scholar] [CrossRef]
- Klompas, M.; Rhee, C. Revising sepsis definitions to better target and tailor sepsis care. Clin. Infect. Dis. 2025, 10, ciaf187. [Google Scholar] [CrossRef]
- Lopez-Molina, M.; Ganduxé, X.T.; Iribarren, A.M.; Espinosa, M.; Torres, S.; Sala, M.; Fernandez, C.; Abadia, C.; LLopis, M.A.; Morales-Indiano, C. Influence of K2-EDTA and K3-EDTA tubes for monocyte distribution width measurement. Clin. Chim. Acta. 2019, 493, S384. [Google Scholar] [CrossRef]
- Xavier Moore, J.; Donnelly, J.P.; Griffin, R.; Safford, M.M.; Howard, G.; Baddley, J.; Wang, H.E. Community characteristics and regional variations in sepsis. Int. J. Epidemiol. 2017, 46, 1607–1617. [Google Scholar] [CrossRef]
- Perry, H.M.; Roccella, E.J. Conference report on stroke mortality in the southeastern United States. Hypertension 1998, 31, 1206–1215. [Google Scholar] [CrossRef]
- Luo, J.; Jiang, W.; Weng, L.; Peng, J.; Hu, X.; Wang, C.; Liu, G.; Huang, H.; Du, B. Usefulness of qSOFA and SIRS scores for detection of incipient sepsis in general ward patients: A prospective cohort study. J. Crit. Care 2019, 51, 13–18. [Google Scholar] [CrossRef]


| Variables | Estimate |
|---|---|
| Studies | 9 |
| Number of diseased | 1135 |
| Number of non-diseased | 17,232 |
| Total patients | 18,367 |
| Prevalence | 0.06 |
| Sensitivity (95%CI) | 0.8 (0.75–0.85) |
| Specificity (95%CI) | 0.76 (0.66–0.83) |
| DOR (95%CI) | 12.51 (6.85–22.87) |
| LR+ (95%CI) | 3.28 (2.26–4.75) |
| LR− (95%CI) | 0.26 (0.2–0.35) |
| FPR (95%CI) | 0.24 (0.17–0.34) |
| Variable | SEPSIS-2 | SEPSIS-3 | MDW < 21 | MDW ≥ 21 | Prevalence < 7% | Prevalence ≥ 7% | Sample Size < 1320 | Sample Size ≥ 1320 | K2-EDTA | K3-EDTA |
|---|---|---|---|---|---|---|---|---|---|---|
| Number of studies | 5 | 4 | 5 | 4 | 4 | 5 | 4 | 5 | 4 | 4 |
| Sensitivity (95%CI) | 0.81 (0.74–0.87) | 0.79 (0.71–0.85) | 0.8 (0.73–0.85) | 0.81 (0.73–0.87) | 0.84 (0.78–0.89) | 0.77 (0.71–0.82) | 0.81 (0.73–0.87) | 0.8 (0.73–0.85) | 0.81 (0.74–0.87) | 0.81 (0.73–0.87) |
| Specificity (95%CI) | 0.83 (0.76–0.88) | 0.64 (0.52–0.74) | 0.66 (0.56–0.75) | 0.85 (0.77–0.9) | 0.81 (0.69–0.89) | 0.70 (0.57–0.82) | 0.7 (0.54–0.82) | 0.8 (0.69–0.88) | 0.66 (0.53–0.76) | 0.85 (0.77–0.9) |
| DOR (95%CI) | 20.8 (10.87–39.85) | 6.6 (3.29–13.31) | 7.62 (4.01–14.47) | 23.4 (11.34–48.3) | 23.0 (10.7–49.2) | 7.9 (4.1–15.1) | 9.87 (4.05–24.09) | 15.35 (7.06–33.35) | 8.29 (3.93–17.48) | 23.38 (10.97–49.87) |
| LR+ (95%CI) | 4.76 (3.23–7.01) | 2.17 (1.55–3.06) | 2.34 (1.71–3.2) | 5.28 (3.42–8.17) | 4.47 (2.65–7.55) | 2.59 (1.72–3.89) | 2.67 (1.64–4.34) | 3.92 (2.4–6.4) | 2.36 (1.64–3.4) | 5.28 (3.33–8.39) |
| LR- (95%CI) | 0.23 (0.16–0.33) | 0.33 (0.22–0.49) | 0.31 (0.21–0.45) | 0.23 (0.15–0.33) | 0.19 (0.13–0.28) | 0.33 (0.24–0.44) | 0.27 (0.17–0.43) | 0.26 (0.18–0.36) | 0.29 (0.19–0.44) | 0.23 (0.15–0.33) |
| FPR (95%CI) | 0.17 (0.12–0.24) | 0.36 (0.26–0.48) | 0.34 (0.25–0.44) | 0.15 (0.1–0.23) | 0.19 (0.11–0.30) | 0.3 (0.19–0.43) | 0.3 (0.19–0.46) | 0.2 (0.13–0.31) | 0.34 (0.24–0.47) | 0.15 (0.1–0.23) |
| Variable | Estimate (95%CI) | p |
|---|---|---|
| Relative sensitivity level SEPSIS-3 vs. SEPSIS-2 | 0.98 (0.87–1.099) | 0.684 |
| Relative specificity level SEPSIS-3 vs. SEPSIS-2 | 0.77 (0.63–0.93) | 0.012 |
| Global test comparison | 0.042 | |
| Relative sensitivity level ≥ 21 vs. <21 | 1.02 (0.9–1.14) | 0.80 |
| Relative specificity level ≥ 21 vs. <21 | 1.28 (1.09–1.51) | 0.009 |
| Global test comparison | 0.033 | |
| Relative sensitivity level ≥ 7% vs. <7% | 0.91 (0.83–1.01) | 0.084 |
| Relative specificity level ≥ 7% vs. <7% | 0.87 (0.70–1.07) | 0.191 |
| Global test comparison | 0.115 | |
| Relative sensitivity level ≥ 1320 vs. <1320 | 0.98 (0.87–1.1) | 0.759 |
| Relative specificity level ≥ 1320 vs. <1320 | 1.14 (0.91–1.44) | 0.249 |
| Global test comparison | 0.436 | |
| Relative sensitivity level K3 vs. K2 | 1 (0.89–1.12) | 0.933 |
| Relative specificity level K3 vs. K2 | 1.29 (1.06–1.56) | 0.017 |
| Global test comparison | 0.049 |
Disclaimer/Publisher’s Note: The statements, opinions and data contained in all publications are solely those of the individual author(s) and contributor(s) and not of MDPI and/or the editor(s). MDPI and/or the editor(s) disclaim responsibility for any injury to people or property resulting from any ideas, methods, instructions or products referred to in the content. |
© 2025 by the authors. Licensee MDPI, Basel, Switzerland. This article is an open access article distributed under the terms and conditions of the Creative Commons Attribution (CC BY) license (https://creativecommons.org/licenses/by/4.0/).
Share and Cite
Esposito, J.E.; D’Amato, M.; Parruti, G.; Polilli, E. Monocyte Distribution Width for Sepsis Diagnosis in the Emergency Department and Intensive Care Unit: A Systematic Review and Meta-Analysis. Int. J. Mol. Sci. 2025, 26, 7444. https://doi.org/10.3390/ijms26157444
Esposito JE, D’Amato M, Parruti G, Polilli E. Monocyte Distribution Width for Sepsis Diagnosis in the Emergency Department and Intensive Care Unit: A Systematic Review and Meta-Analysis. International Journal of Molecular Sciences. 2025; 26(15):7444. https://doi.org/10.3390/ijms26157444
Chicago/Turabian StyleEsposito, Jessica Elisabetta, Milena D’Amato, Giustino Parruti, and Ennio Polilli. 2025. "Monocyte Distribution Width for Sepsis Diagnosis in the Emergency Department and Intensive Care Unit: A Systematic Review and Meta-Analysis" International Journal of Molecular Sciences 26, no. 15: 7444. https://doi.org/10.3390/ijms26157444
APA StyleEsposito, J. E., D’Amato, M., Parruti, G., & Polilli, E. (2025). Monocyte Distribution Width for Sepsis Diagnosis in the Emergency Department and Intensive Care Unit: A Systematic Review and Meta-Analysis. International Journal of Molecular Sciences, 26(15), 7444. https://doi.org/10.3390/ijms26157444