1. Introduction
GWAS is a powerful tool for identifying the genetic variations associated with complex traits in natural populations. It leverages the principle of linkage disequilibrium (LD) to systematically analyze large-scale genotypic and phenotypic data, enabling the precise localization of loci influencing target traits. Two key parameters frequently used to characterize LD are r
2 and D’, which capture distinct aspects of gene linkage. Specifically, r
2 reflects the combined effects of mutation and recombination, and D’ emphasizes historical recombination events [
1]. Among both parameters, r
2 is considered more objective in assessing the degree to which markers are associated with quantitative trait loci (QTL) and is widely employed as an index for measuring LD between molecular markers in GWAS.
Both D’ and r
2 range from 0 to 1, with higher values indicating stronger LD between allelic loci [
2,
3,
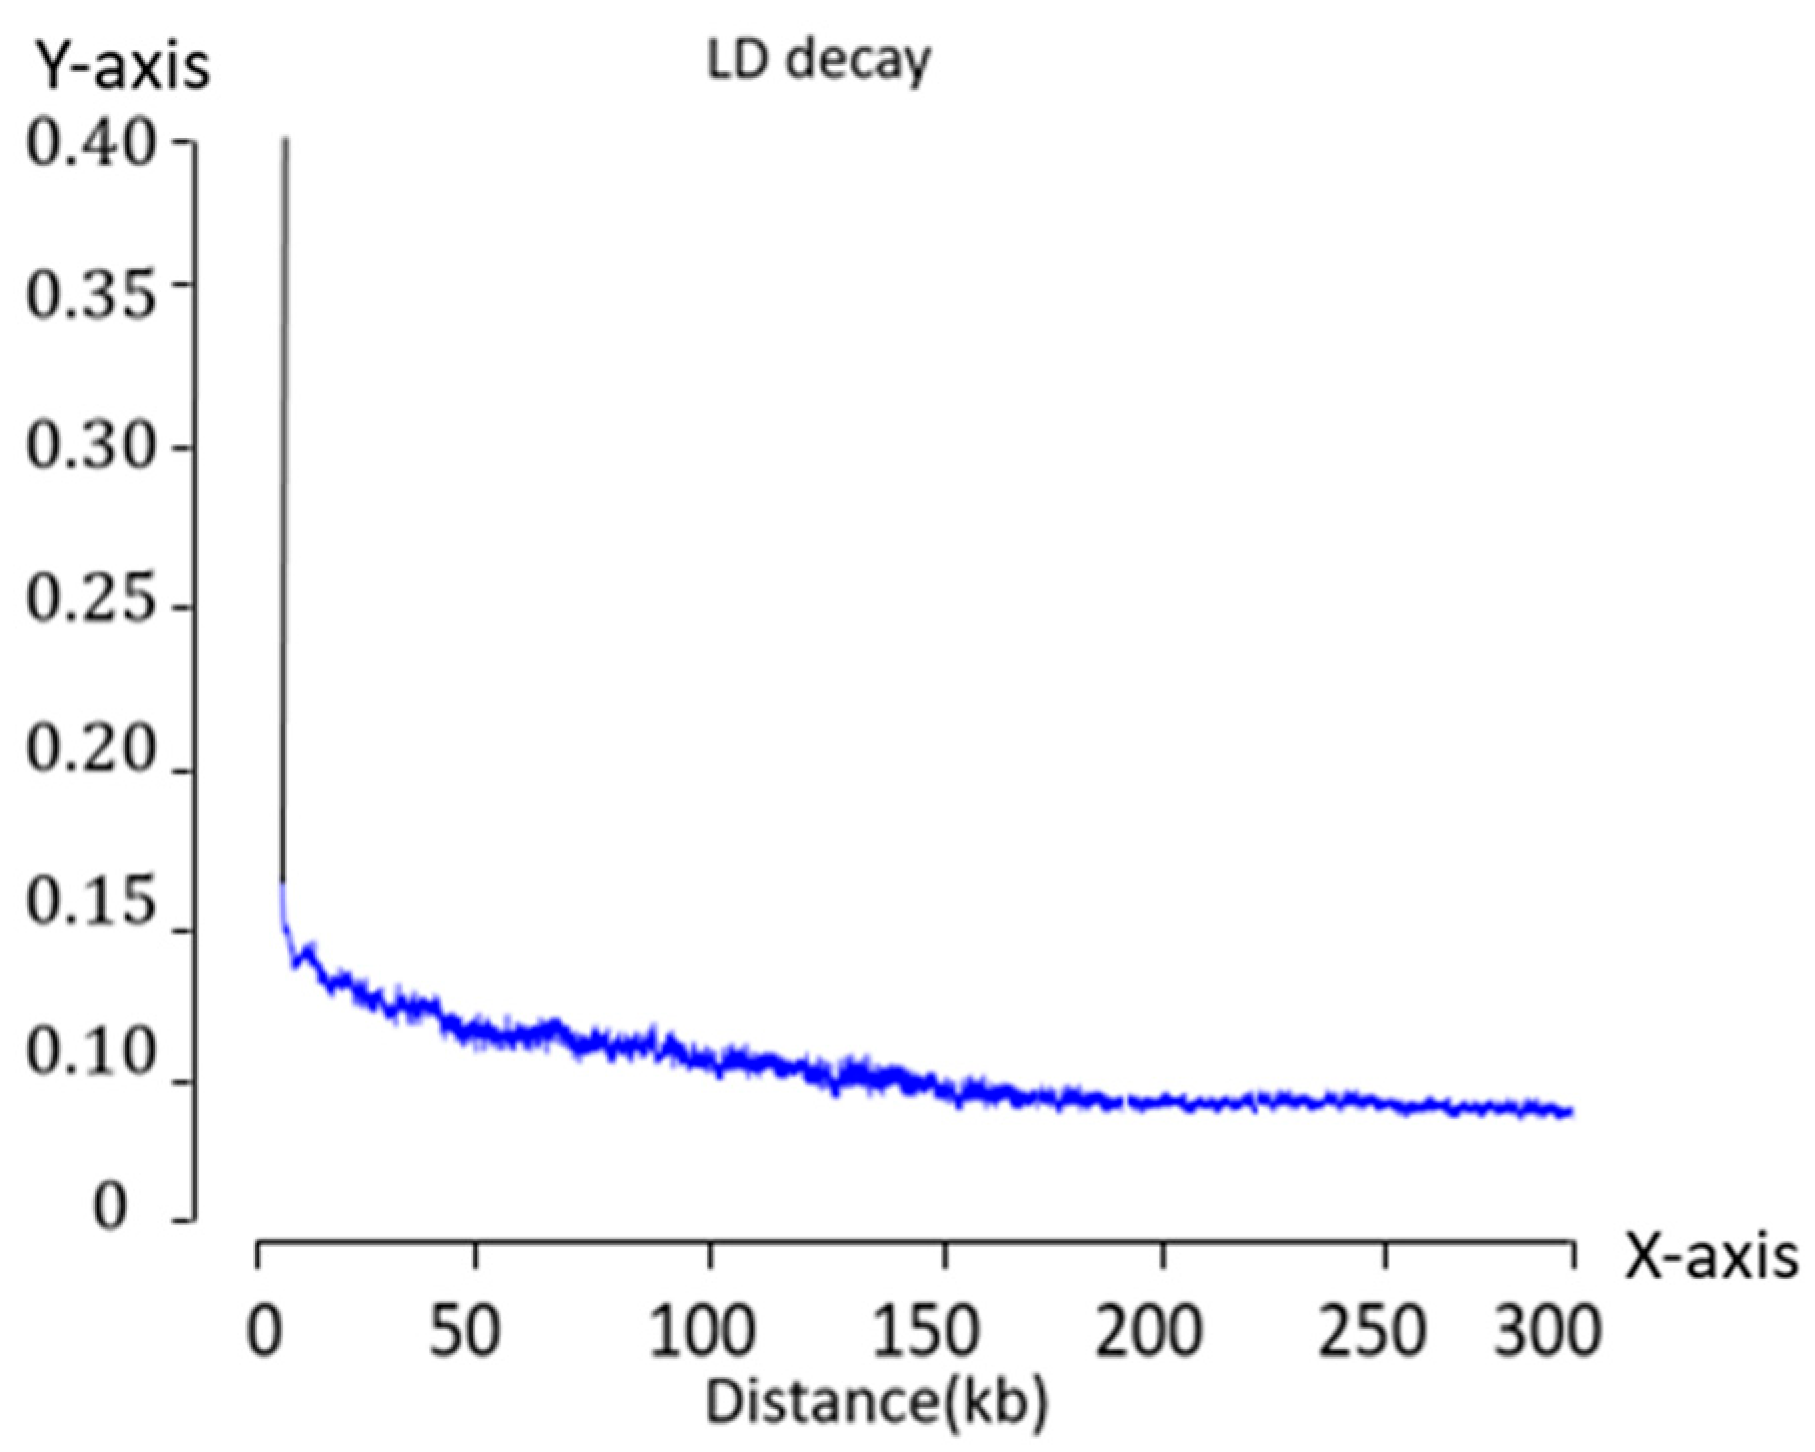
4]. The overall level of LD within a genome is commonly characterized by the LD decay distance, which denotes the physical distance over which LD declines below a given threshold. This parameter is critical in GWAS study design as it determines the marker density required for effective and accurate locus detection. Notably, LD decay distances vary markedly across species. For instance,
Arabidopsis thaliana exhibits an LD decay distance of approximately 250 kb, wheat up to 5 Mb [
5,
6], and
Drosophila less than 1 kb [
7]. Significant differences in LD decay were also observed among subpopulations within a single species. In maize, elite inbred lines exhibit an LD decay distance of approximately 100 kb, whereas landraces and genetically diverse inbred lines show much shorter decay distances of approximately 1–1.5 kb [
8,
9,
10].
Wang et al. (2023) [
11] conducted GWAS on i-traits using 228 maize self-crosses, identifying 4945 SNPs, 2603 genetic loci, and 1974 corresponding candidate genes associated with agronomic traits. Through functional validation via gene mutation analysis, they confirmed that the candidate gene
ZmVATE regulated plant height-related traits in maize. Che et al. (2024) [
12] measured the plant height across 132 wheat varieties under four distinct environmental conditions. Utilizing the wheat 35 K SNP microarray and a mixed linear model (MLM), they performed GWAS and demonstrated that plant height variation was significantly influenced by environmental factors. A total of 22 SNP loci were significantly associated with plant height, of which 7 were repeatedly detected under two to three environmental conditions and were classified as stable association loci. A homology-based functional analysis of 265 genes located within 1 Mb upstream and downstream of these loci led to the identification of seven candidate genes potentially involved in plant height development.
Qian et al. (2024) [
13] constructed an association panel of 580 maize inbred lines with broad genetic diversity and used 31,826 genome-wide SNP markers to perform GWAS on plant height and ear height, based on three years of phenotypic data and BLUE. They identified 58 significant SNPs under four environmental conditions, including 6 co-localized loci, 3 associated with plant height, and 4 with ear height. Within a 440 kb window flanking the co-localized markers, 76 genes were identified, of which 66 had known functions. Gene annotation and GO enrichment analyses highlighted seven candidate genes with strong potential roles in controlling plant and ear height, including
Zm00001d042611, which encodes GA20ox3, a gene previously confirmed to regulate plant height in maize. Zhou et al. (2016) [
14] employed the Tuck 478 × Qi 319 hybrid population and detected 14 QTLs associated with the plant height and another 14 with the ear height. After further refinement, they identified two major candidate genes,
GRMZM2G325907 and
GRMZM2G108892, with significant effects on both traits. Paciorek et al. (2022) [
15] reported that reduced expression levels of
ZmGA20ox3 and
ZmGA20ox5 resulted in a decreased plant height in maize.
Despite the rapid development of fresh maize, its popularity and research attention remain limited compared with common maize, and GWAS on its genetic basis are still relatively scarce. In this study, phenotypic characterization was combined with genome-wide SNP markers to perform GWAS with the objective of identifying loci significantly associated with yield-related traits in fresh maize and screening the corresponding candidate genes.
3. Discussion
Ear and grain traits in maize are regulated by complex gene networks and are highly susceptible to environmental influences [
16]. In a study by Yang et al. (2023) [
17], GWAS was conducted using 201 maize inbred lines, identifying 21 stably associated SNP loci across traits, such as plant height, ear height, and number of tassel branches, specifically, 10 SNPs for plant height, 5 for ear height, and 6 for tassel branch number. Similarly, Qian et al. (2024) [
13] analyzed 580 genetically diverse inbred lines and identified 58 significant SNPs across four environments, including 6 co-localized loci, with 3 associated with plant height and 4 with ear height. Wang et al. (2016) [
18] reported 206 trait-associated SNPs from a GWAS on 201 inbred lines. In this study, a GWAS of 259 genetically distinct fresh maize inbred lines identified candidate genes involved in flowering traits (e.g., pollen-shedding and silking), plant architecture, and yield components. GWAS remains an indispensable tool for dissecting the genetic architecture of complex traits and elucidating the influence of genotypic variation on phenotypes. The targeted mining of functional SNPs related to kernel row number and kernel count per row, and further candidate gene validation, laid a theoretical foundation for advancing the genetic understanding of maize yield-related traits.
Qi et al. (2025) [
19] identified 13 SNP loci significantly associated with flowering-stage traits in the GWAS conducted over two consecutive years. These loci were distributed across chromosomes 1, 2, 3, 4, 5, 8, and 9 in maize. Notably, marker 1-19655896 on chromosome 1 was consistently detected at two critical flowering stages, including tassel emergence and pollen dispersal, which suggested its potential role in reproductive timing. Based on these associations, 18 candidate genes were further screened, 10 of which were successfully annotated. Specifically,
Zm00001d032633 encodes the phytoalexin N-methyltransferase,
Zm00001d043842 encodes a GPI-anchoring protein,
Zm00001d013415 encodes the receptor-like protein kinase TMK, and
Zm00001d010489 encodes the calmodulin-binding protein, all of which may participate in the signaling and developmental processes relevant to maize flowering. The identification of these potential candidate genes offers a robust theoretical foundation for breeding new maize varieties with optimized flowering periods and can be expected to drive significant progress in varietal selection and improvement. In maize, the pollen dispersal period corresponded to the stage when the male tassel released pollen, whereas the silking period referred to the emergence of female silk from the husk to receive pollen. Precise synchronization between these two stages is critical for successful pollination and fertilization. Successful fertilization and subsequent seed formation can only occur when pollen dispersal and silk emergence are precisely synchronized. If the two processes are not synchronized, particularly earlier dispersal than silk emergence, pollen may lose its viability. On the other hand, if silk emergence occurs before pollen dispersal, the silks may become excessively elongated and prone to interference with pollination, which can result in a reduced fruit set rate and ultimately affect corn yield. The identification of functional SNPs associated with pollen dispersal and silk emergence, along with the functional validation of candidate genes, could provide a theoretical foundation for genetic research on fresh maize.
According to Ma et al. (2023) [
20], a total of 11 SNP loci associated with maize ear length were identified using seven multi-environment genome-wide association study (MGWAS) methods. These loci were located on chromosomes 1, 2, 5, 6, 7, 8, and 10. Zhao et al. (2019) [
21] employed the composite interval mapping (CIM) method and detected 62 loci associated with spikelet traits under a single environmental condition, as well as 38 loci under drought stress. Both ear length and diameter were strongly correlated with maize yield. Generally, longer ears and thicker ear diameters correspond to increased ear volume, which provides more space for grain development, thereby enhancing the number of kernels and kernel weight per ear and improving the overall yield potential. Studies focusing on ear length and diameter can elucidate the mechanisms underlying yield formation in various maize genotypes and offer a theoretical foundation for high-yield breeding. The identification of functional SNPs related to these traits, along with the subsequent functional validation of candidate genes, can contribute significantly to the genetic improvement and yield enhancement of fresh maize.
Candidate genes refer to the genes localized in specific chromosomal regions that are hypothesized to influence phenotypic traits. Although the functional expression of many candidate genes remains unclear, ongoing studies have focused on their protein products [
22]. These genes may function as structural, regulatory, or metabolic pathway-related genes that affect phenotypic development [
23]. Numerous genes have been shown to be closely associated with traits such as plant height, ear height, and number of tassel branches in maize, playing significant roles in these developmental processes [
24,
25,
26,
27,
28,
29,
30,
31,
32,
33,
34,
35,
36,
37,
38,
39,
40]. These genes are typically involved in hormone biosynthesis, signal transduction, cellular division and growth, transcriptional regulation, and metabolism. Based on the analysis of LD decay distance, each SNP locus was used as a reference point, and a 3 kb region upstream and downstream of its physical position was defined as the candidate gene search region. Using this query range, a search was conducted for protein-coding genes in the maize B73 genome (version V5) using MaizeGDB, and 63 candidate genes were identified. These functional genes are mainly involved in the regulation of plant growth, material metabolism, or environmental adaptation. Their roles include binding to the promoter regions of target genes to regulate gene expression; participating in the signal transduction, localization, and functional regulation of membrane proteins; involvement in nitrogen metabolism, nutrient partitioning, and utilization in plants; the regulation of abscisic acid levels; the modulation of stress-responsive gene expression to enhance stress resistance; and functioning as transcription factors in regulating the expression of genes related to biosynthetic processes.
4. Materials and Methods
4.1. Materials
A total of 259 fresh maize inbred lines with desirable agronomic traits were collected from various regions across China and used as the experimental population. Field trials were conducted at two locations over two consecutive years. Eight phenotypic traits, such as ear height, kernel row number, ear length, kernels per row, pollen-shedding period, silking stage, ear diameter, and plant height, were recorded for all 259 lines.
In 2023, 259 fresh maize samples were cultivated from June to September at Mizhou Seed Industry, Zhucheng, Weifang, Shandong Province, China (longitude 119°0′–119°43′ E, latitude 35°42′–36°21′ N). The average temperature during this period was approximately 25 °C, with the total precipitation reaching 500 mm. In 2024, the same 259 fresh maize samples were cultivated from June to September at the same location. During this period in 2024, the average temperature was 26 °C and the precipitation totaled 490 mm.
Parallel trials were conducted at the Pingdu experimental site in Qingdao, Shandong Province (36°47′ N, 119°58′ E). The average temperature during the period of June to September in 2023 was approximately 25 °C, accompanied by 470 mm of precipitation. In 2024, the same experimental design was repeated at the same site, the same period in 2024 recorded an average temperature of 26 °C and a precipitation level of 450 mm.
4.2. Methods
4.2.1. Whole Genome Sequencing and SNP Marker Development
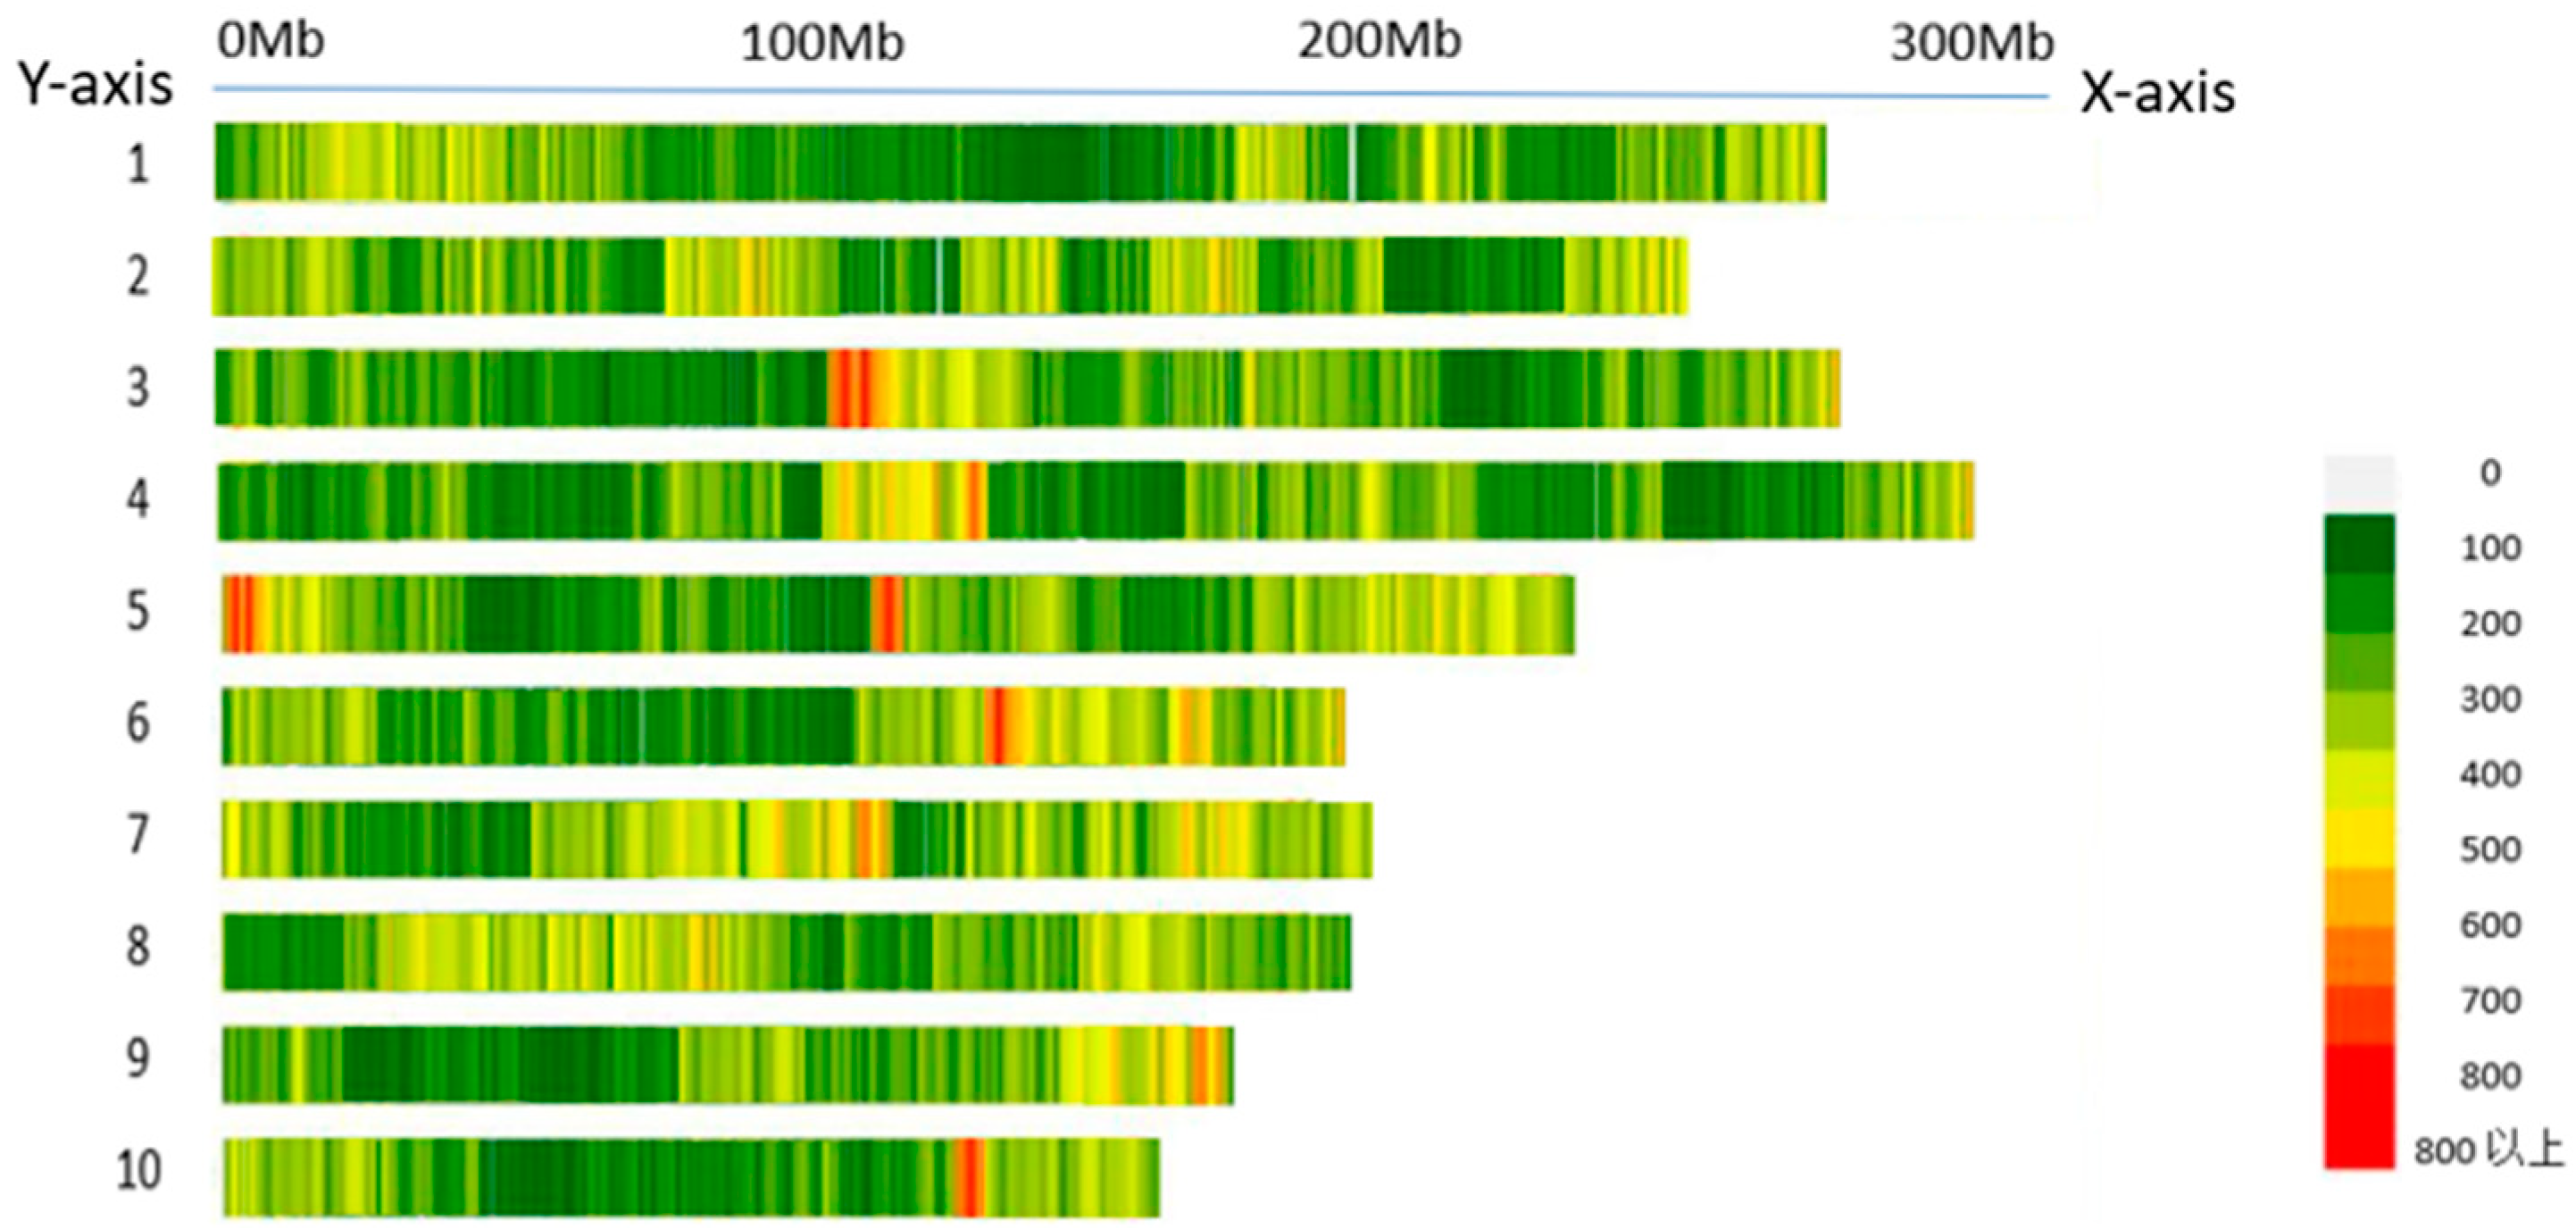
Population genotyping was performed using targeted sequencing-based genotyping and targeted sequencing (GBTS). The resulting SNP data were further filtered using the PLINK software, with a minimum allele frequency (MAF) threshold of ≥0.05 and a missing data rate cutoff of ≤10%. After quality control, 225,863 high-quality SNP loci were retained for subsequent analyses.
4.2.2. GWAS Analytical and Phenotypic Statistical Methods
The filtered SNP loci were used as the genotypic data and combined with the phenotypic data of the inbred lines for GWAS using a mixed linear model (MLM) implemented in TASSEL 5.0. The significance thresholds for association were adjusted using the Bonferroni correction method (0.01/N and 0.05/N, where N represents the total number of SNP markers), and the corresponding threshold lines were determined based on the corrected P-values.
The descriptive statistical analysis of phenotypic traits, including mean, standard deviation, coefficient of variation, range, skewness, and kurtosis, was performed using Python 3.11.
4.2.3. LD
The genome-wide LD among multiple polymorphic loci is commonly evaluated using the r2 statistic, which quantifies the degree of LD between two loci on a scale from 0 to 1. A value of 0 indicates no LD, whereas a value of 1 represents complete LD. This value reflects the deviation between the observed co-occurrence frequency of the two alleles and the expected frequency under random association. Based on the genotype distributions within a population, an LD decay curve can be constructed in which r2 can be used to visualize the extent and decline of LD across physical distances.
4.2.4. GWAS
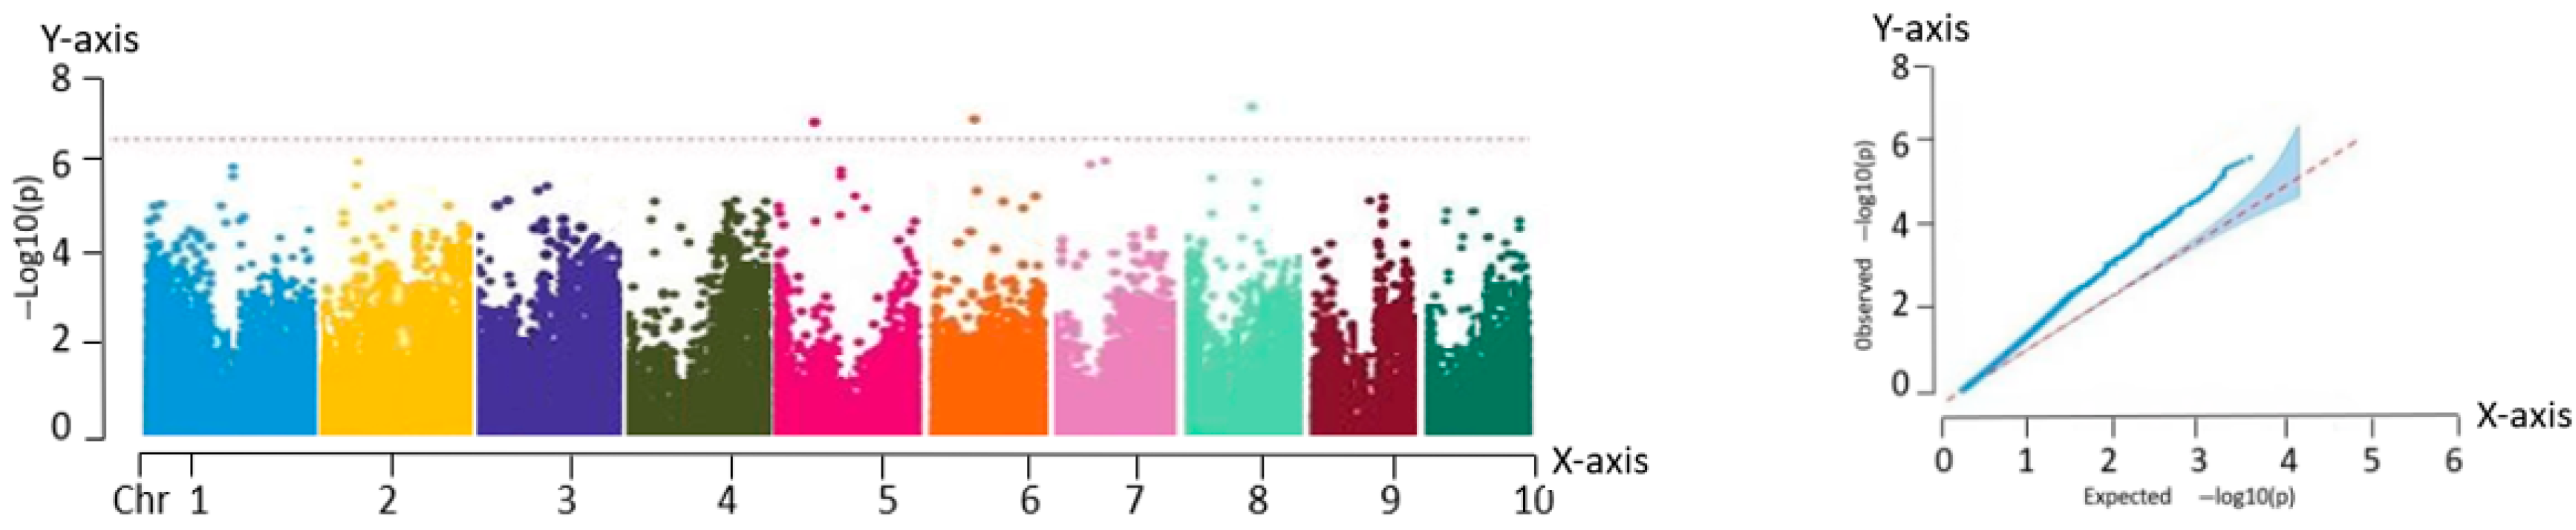
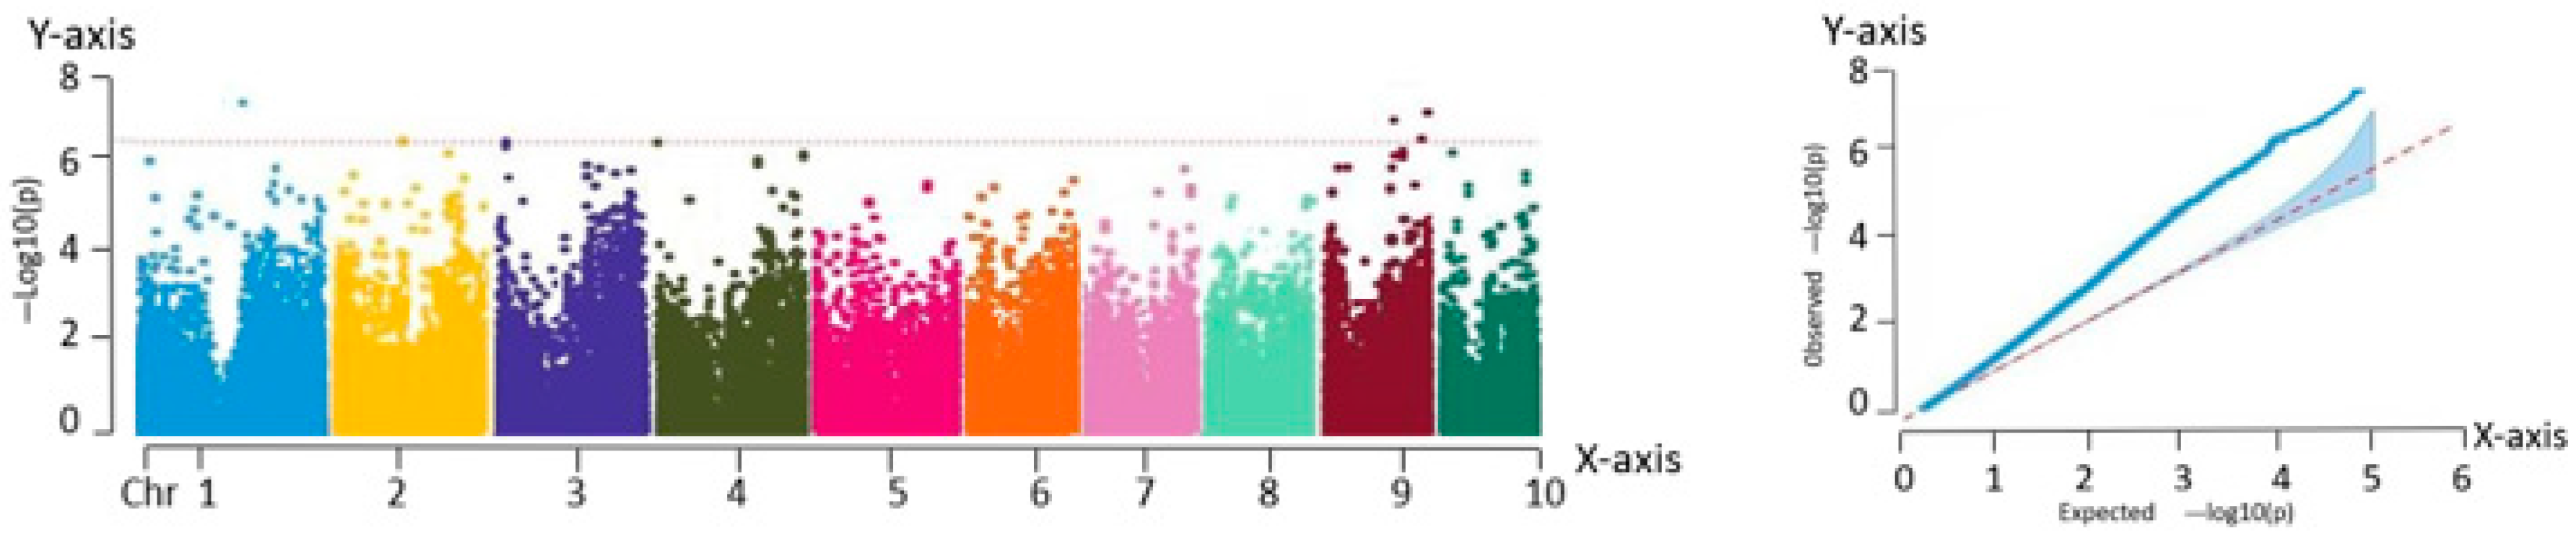
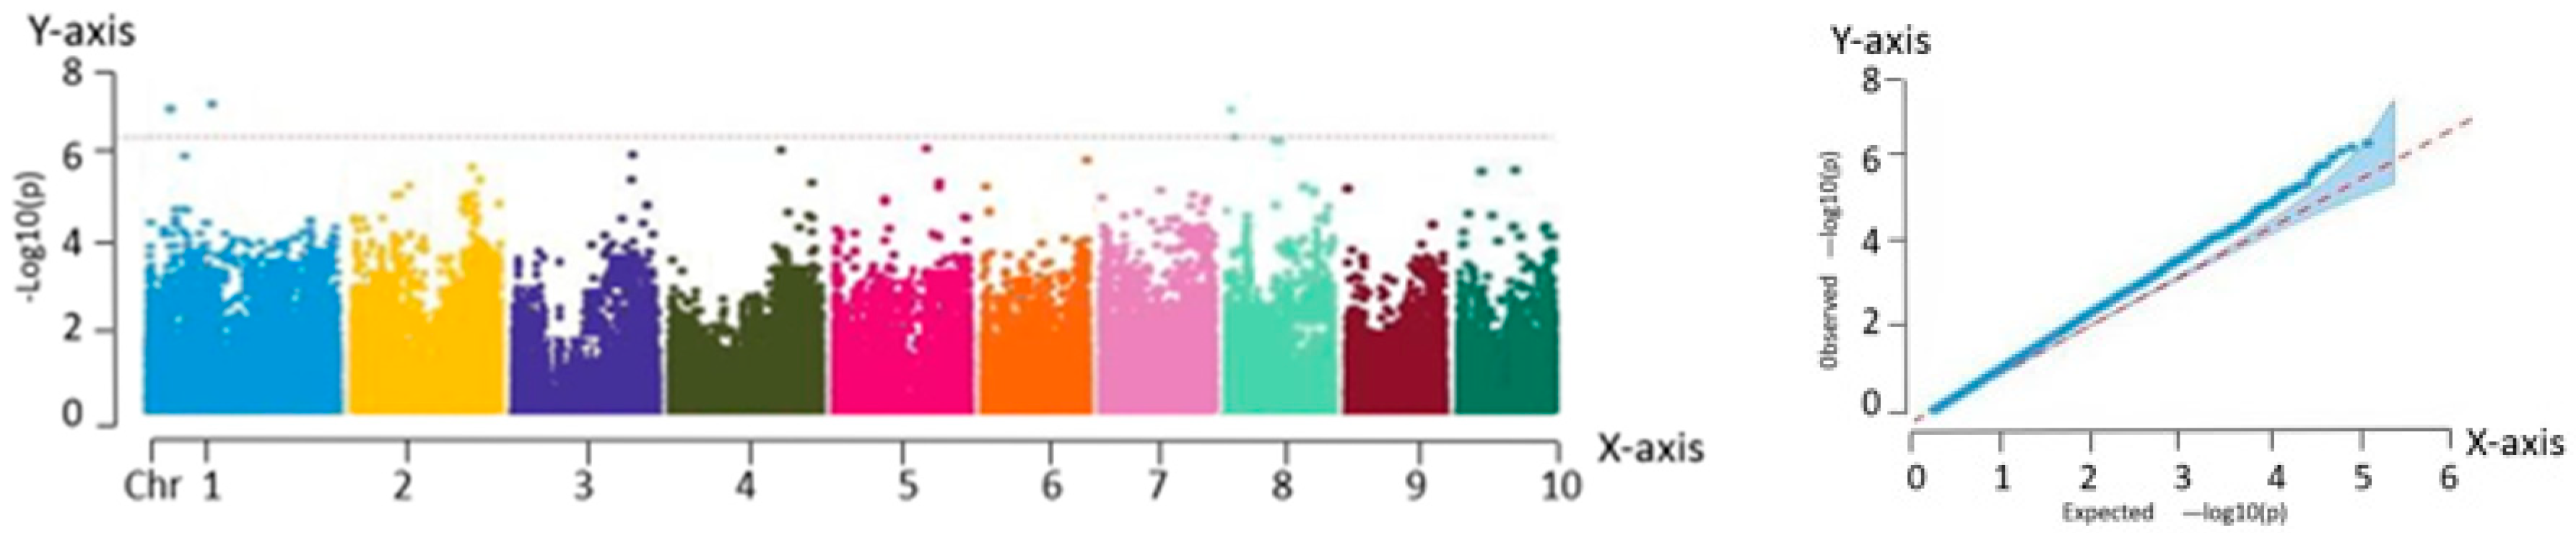
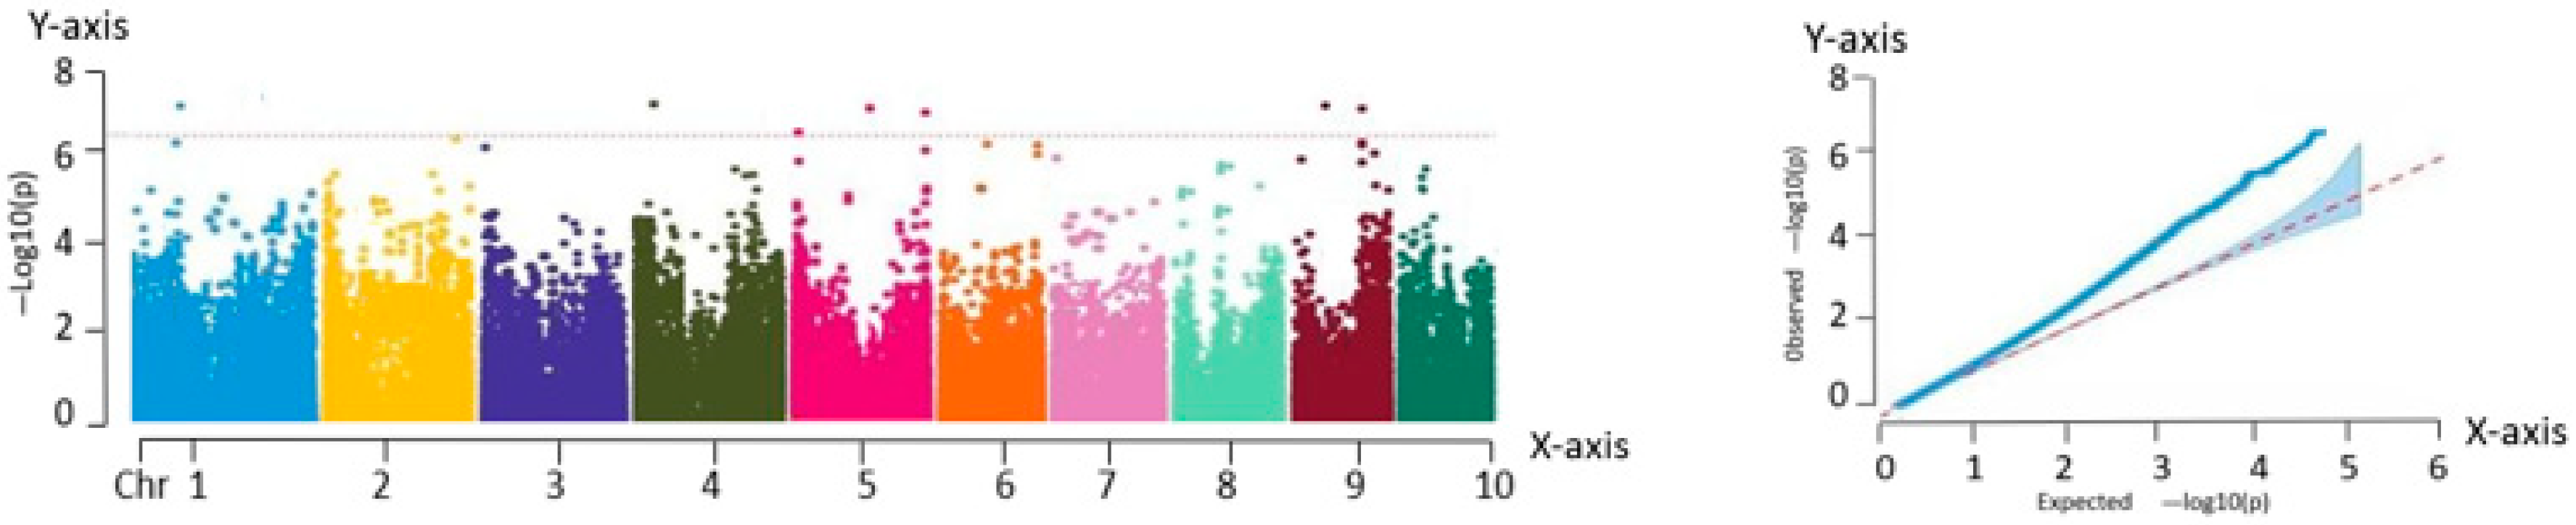
Association analysis, also known as LD analysis, is a statistical approach for characterizing the relationship between genetic variants and phenotypic traits. This method enables the identification of genetic loci that are significantly associated with specific traits using statistical testing. Based on high-quality variant loci filtered using PLINK, a total of 225,863 SNP markers were retained. GWAS was performed for eight phenotypic traits across 259 fresh maize inbred lines using the MLM implemented in TASSEL. To visualize the association results, Manhattan plots were generated using the qqman package in R, showing the chromosomal distribution of the significant SNP loci. In parallel, QQ plots were constructed to evaluate the fit between observed and expected P-value distributions. In the QQ plot, the SNPs aligned along the diagonal in the lower left region indicate model consistency, while the SNPs deviating above the diagonal in the upper right corner represent loci with significantly stronger associations than expected.
4.2.5. Candidate Gene Prediction and Functional Annotation
To interpret the results of LD decay distance, the physical interval corresponding to an r
2 value of 0.15 was identified both upstream and downstream of each significant SNP locus. This interval was defined as the candidate region for gene identification. Using the MaizeGDB database (
www.maizegdb.org/gbrowse) and incorporating information on the chromosomal location of each SNP, protein-coding genes within these regions were retrieved. All annotations were based on the B73 maize reference genome version V5, which ultimately resulted in the identification of candidate genes associated with the respective phenotypic traits.
5. Conclusions
The GWAS of 259 fresh maize inbred lines identified 82 significant SNPs, of which 75 were associated with plant architecture traits and 7 with flowering time characteristics. These loci were significantly correlated with key agronomic traits including anthesis date (pollen-shedding), silking date, and plant type attributes.
In this study, eight major phenotypic traits were evaluated across the 259 inbred lines. An MLM was employed to conduct GWAS, resulting in the identification of 82 trait-associated SNPs. From these, 63 candidate genes with functional annotations were screened, and 11 core candidate genes were identified using multi-trait association analysis. These 11 genes exhibited highly significant associations (p < 0.0001) and explained 7.21% to 12.78% of the phenotypic variation. They were distributed on chromosomes 1, 3, 4, 5, 6, and 9. Functional predictions indicated that these genes were likely involved in key biological processes, including phytohormone signaling, metabolic regulation, structural maintenance, and stress response pathways.


