
Variations in Circulating Tumor Microenvironment-Associated Proteins in Non-Muscle Invasive Bladder Cancer Induced by Mitomycin C Treatment

 , ,
, ,  and
and
Abstract
1. Introduction
2. Results
2.1. Incubation of PtNPs (2.40 ± 0.30 nm) with HS Samples: Ex Vivo Formation and Comprehensive Characterization of the PC
2.2. Quantitative Analysis of the Protein Corona-Coated PtNPs by SWATH-MS Before the Chemotherapy Instillation of MMC (t0) and Three (t3) and Six Months (t6) After Treatment
2.3. Differentially Expressed Proteins in the Blood Serum of Control Patients and NMIBC Patients Before the Chemotherapy Instillation of MMC (t0)
2.4. The Biological Role of the NMIBC-Related Proteins Identified in the PtNP–Protein Corona Before the Chemotherapy Instillation of MMC (t0)
2.5. Comparison of the Differentially Expressed Proteins in the Blood Serum of Control and NMIBC Patients Before Treatment (t0) and Three (t1) and Six Months (t2) After the Chemotherapy Instillation of MMC
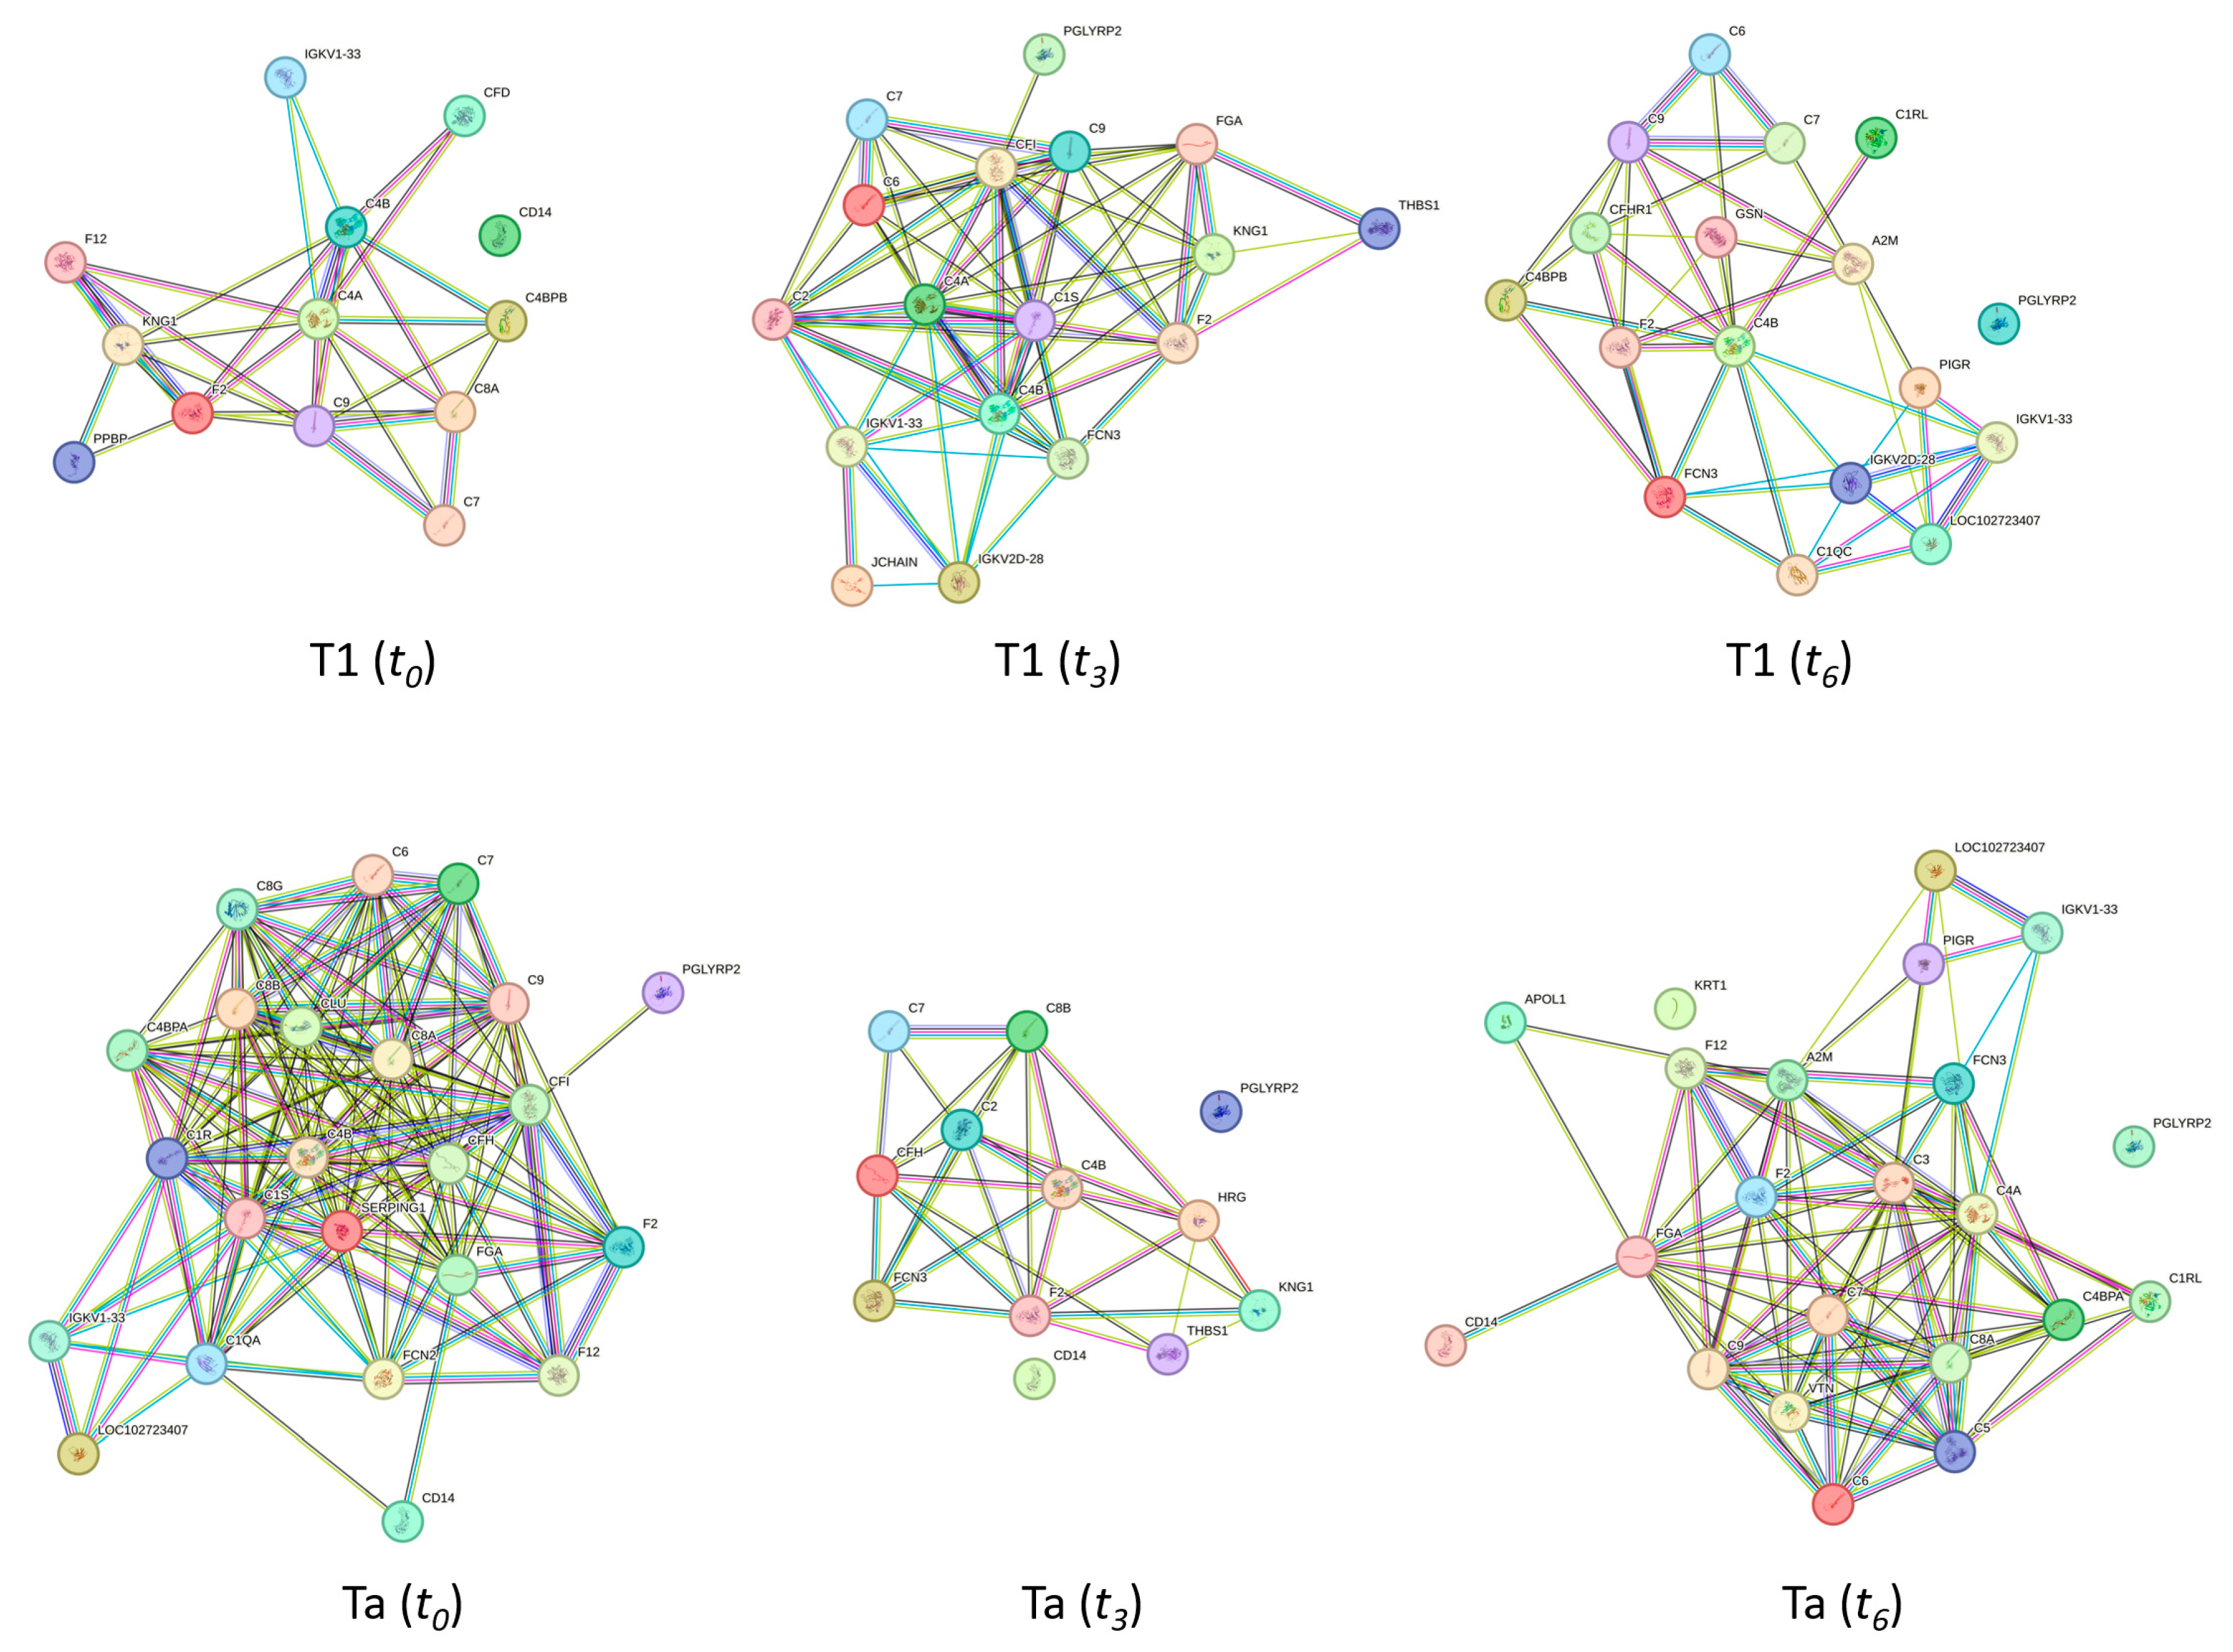
2.6. The Biological Role of the NMIBC-Related Proteins Identified in the PtNP–Protein Corona Before (t0) and After (t3 and t6) the Chemotherapy Instillation of MMC
3. Discussion
4. Materials and Methods
4.1. Patient Study Group and Biological Samples
4.2. Chemicals and Reagents
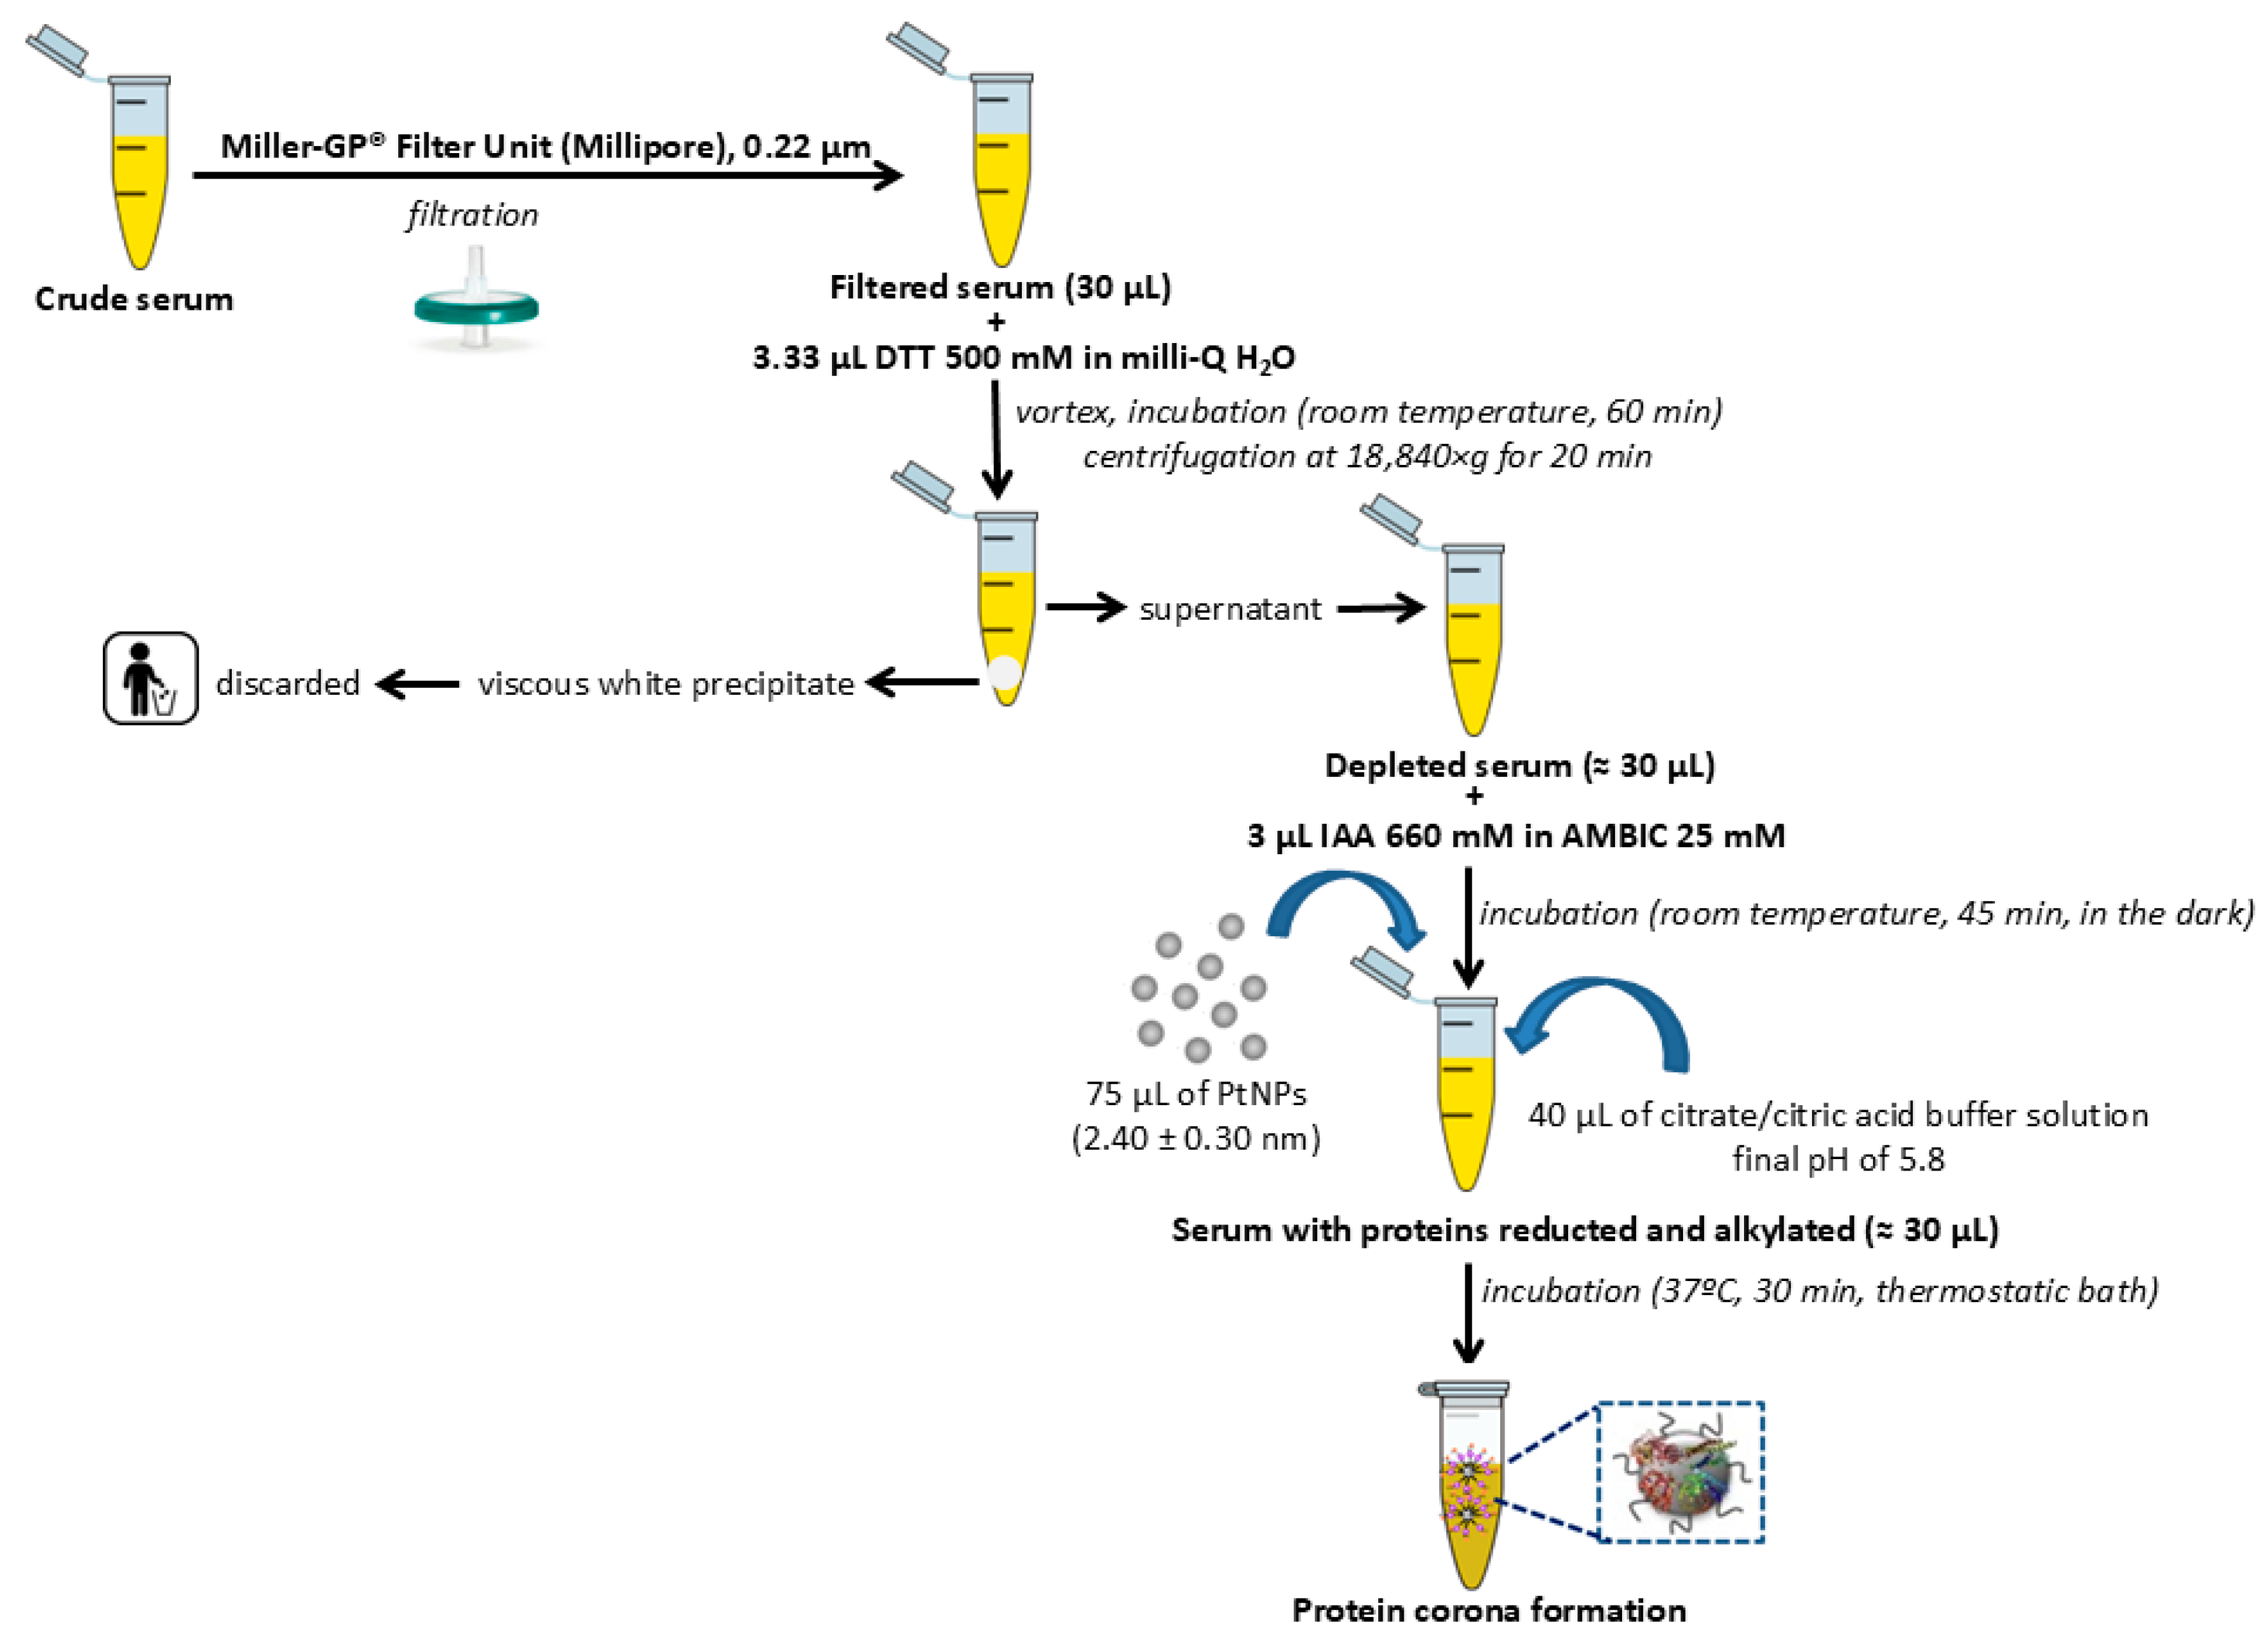
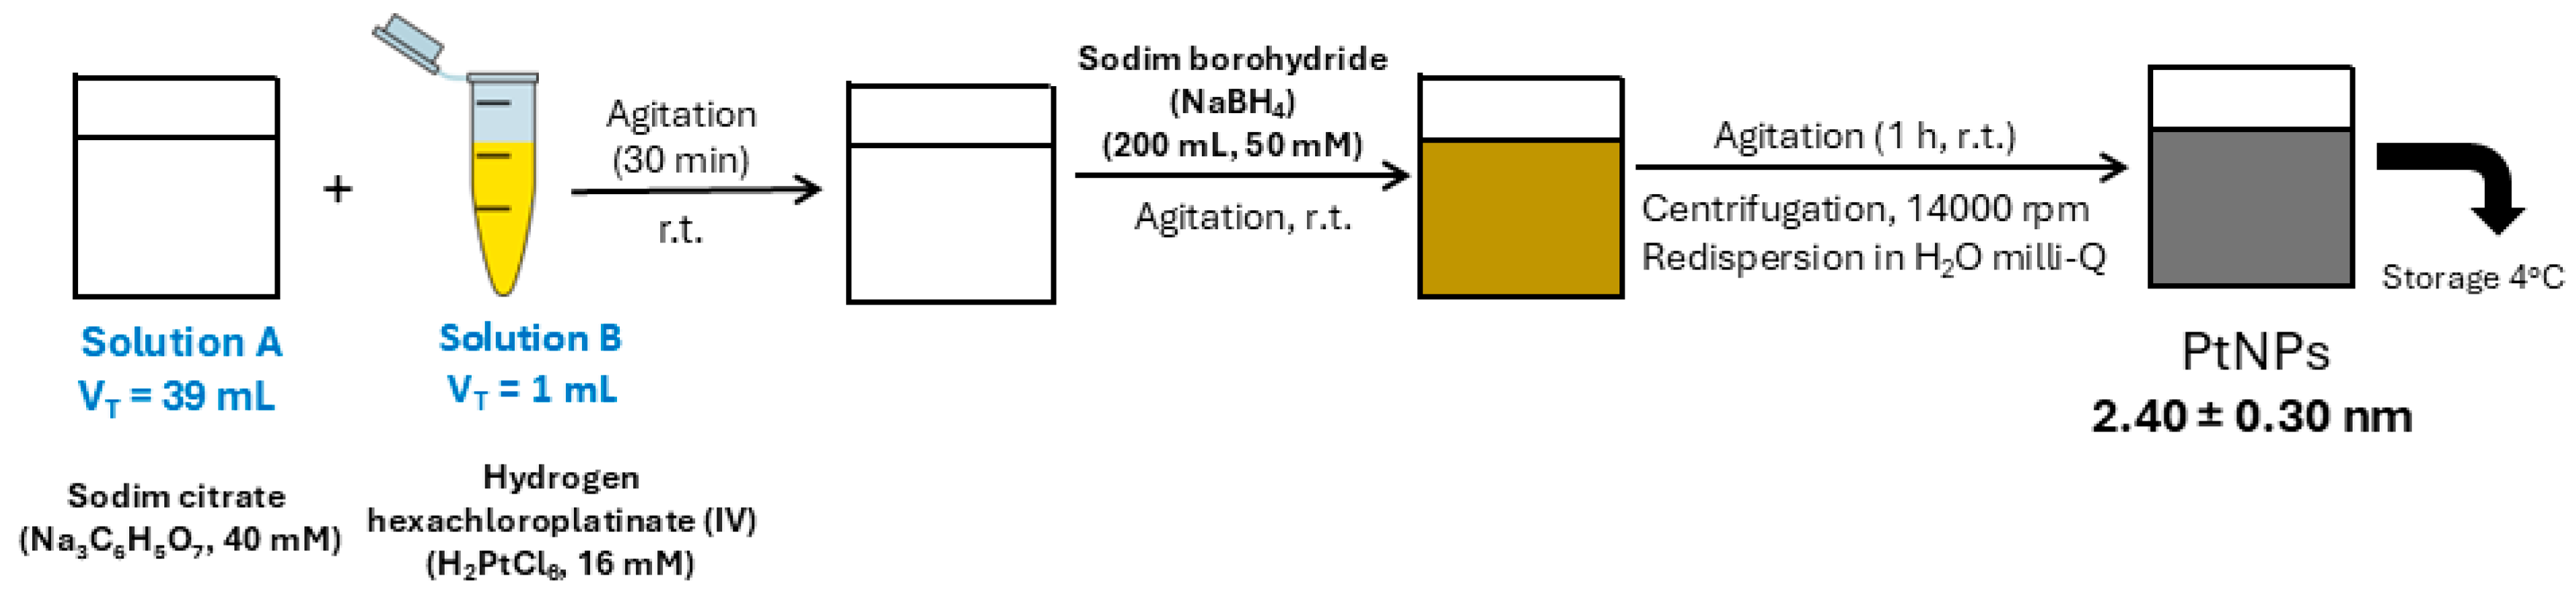
4.3. Synthesis of Citrate-Coated PtNPs (2.40 ± 0.30 nm) and Ex Vivo Protein Corona Formation
4.4. Depletion of Multiple Highly Abundant Proteins in Serum Samples
4.5. Isolation of Low-Abundance Proteins: Ex Vivo Protein Corona Formation
4.6. Quantification of the Proteins Presented in the Corona-Coated PtNPs by SWATH-MS
4.7. Protein Functional Interaction Network Analysis
5. Conclusions
Supplementary Materials
Author Contributions
Funding
Institutional Review Board Statement
Informed Consent Statement
Data Availability Statement
Acknowledgments
Conflicts of Interest
Abbreviations
| CIS | Carcinoma in situ |
| DDA | Data-dependent acquisition |
| DIA | Data-independent acquisition |
| DLS | Dynamic light scattering |
| DTT | Dithiothreitol |
| HC | Healthy controls |
| HS | Human serum |
| IAA | Iodoacetic acid |
| LC-MS/MS | Liquid chromatography–tandem mass spectrometry |
| MDSCs | Myeloid-derived suppressor cells |
| MIBC | Muscle-invasive bladder cancer |
| MS | Mass spectrometry |
| NMIBC | Non-muscle invasive bladder cancer |
| PC | Protein corona |
| PPI | Protein–protein interaction |
| PtNPs | Platinum nanoparticles |
| SDS-PAGE | Sodium dodecyl sulfate–polyacrylamide gel electrophoresis |
| SWATH-MS | Sequential window acquisition of all theoretical mass spectra |
| TAMs | Tumor-associated macrophages |
| TEM | Transmission electron microscopy |
| TURBT | Transurethral resection of the bladder tumor |
References
- Sung, H.; Ferlay, J.; Siegel, R.L.; Laversanne, M.; Soerjomataram, I.; Jemal, A.; Bray, F. Global Cancer Statistics 2020: GLOBOCAN Estimates of Incidence and Mortality Worldwide for 36 Cancers in 185 Countries. CA Cancer J. Clin. 2021, 71, 209–249. [Google Scholar] [CrossRef] [PubMed]
- Babjuk, M.; Burger, M.; Capoun, O.; Cohen, D.; Compérat, E.M.; Dominguez Escrig, J.L.; Gontero, P.; Liedberg, F.; Masson-Lecomte, A.; Mostafid, A.H.; et al. European Association of Urology Guidelines on Non-muscle-invasive Bladder Cancer (Ta, T1, and Carcinoma in Situ). Eur. Urol. 2022, 81, 75–94. [Google Scholar] [CrossRef]
- Jiang, L.-J.; Guo, S.-B.; Huang, Z.-Y.; Li, X.-L.; Jin, X.-H.; Huang, W.-J.; Tian, X.-P. PHB promotes bladder cancer cell epithelial-mesenchymal transition via the Wnt/β-catenin signaling pathway. Pathol. Res. Pract. 2023, 247, 154536. [Google Scholar] [CrossRef]
- Jiang, L.-J.; Guo, S.-B.; Zhou, Z.-H.; Li, Z.-Y.; Zhou, F.-J.; Yu, C.-P.; Li, M.; Huang, W.-J.; Liu, Z.-W.; Tian, X.-P. Snai2-mediated upregulation of NADSYN1 promotes bladder cancer progression by interacting with PHB. Clin. Transl. Med. 2024, 14, e1555. [Google Scholar] [CrossRef]
- Scilipoti, P.; Ślusarczyk, A.; Angelis, M.; Soria, F.; Pradere, B.; Krajewski, W.; D’Andrea, D.; Mari, A.; Giudice, F.; Pichler, R.; et al. European Association of Urology Young Academic Urologists Urothelial Carcinoma Working Group. The Role of Mitomycin C in Intermediate-risk Non-muscle-invasive Bladder Cancer: A Systematic Review and Meta-analysis. Eur. Urol. Oncol. 2024, 7, 1293–1302. [Google Scholar] [CrossRef]
- Volpato, M.; Seargent, J.; Loadman, P.M.; Phillips, R.M. Formation of DNA interstrand cross-links as a marker of Mitomycin C bioreductive activation and chemosensitivity. Eur. J. Cancer 2005, 41, 1331–1338. [Google Scholar] [CrossRef]
- O’Brien, R.M.; Cannon, A.; Reynolds, J.V.; Lysaght, J.; Lynam-Lennon, N.; Lynam-Lennon, N. Complement in Tumourigenesis and the Response to Cancer Therapy. Cancers 2021, 13, 1209. [Google Scholar] [CrossRef] [PubMed]
- Oresta, B.; Pozzi, C.; Hurle, R.; Lazzeri, M.; Faccani, C.; Colombo, P.; Elefante, G.; Casale, P.; Guazzoni, G.; Rescigno, M. MP63-17 Mitomycin C triggers immunogenic cell death in bladder cancer cells. J. Urol. 2019, 101, e903. [Google Scholar] [CrossRef]
- Wolters, D.A.; Washburn, M.P.; Yates, J.R. An automated multidimensional protein identification technology for shotgun proteomics. Anal. Chem. 2001, 73, 5683–5690. [Google Scholar] [CrossRef]
- Capello, M.; Katayama, H.; Hanash, S.M. Proteomic Profiling of the Tumor Microenvironment. Methods Mol. Biol. 2022, 2435, 157–167. [Google Scholar] [PubMed]
- Urbiola-Salvador, V.; Miroszewska, D.; Jabłońska, A.; Qureshi, T.; Chen, Z. Proteomics approaches to characterize the immune responses in cancer. BBA-Mol. Cell Res. 2022, 1869, 11926. [Google Scholar] [CrossRef]
- Beckabir, W.; Wobker, S.E.; Damrauer, J.S.; Midkiff, B.; De la Cruz, G.; Makarov, V.; Flick, L.; Woodcock, M.G.; Grivas, P.; Bjurlin, M.A.; et al. Spatial Relationships in the Tumor Microenvironment Demonstrate Association with Pathologic Response to Neoadjuvant Chemoimmunotherapy in Muscle-invasive Bladder Cancer. Eur. Urol. 2024, 85, 242–253. [Google Scholar] [CrossRef]
- Feng, C.; Wang, X.; Tao, Y.; Xie, Y.; Lai, Z.; Li, Z.; Hu, J.; Tang, S.; Pan, L.; He, L.; et al. Single-Cell Proteomic Analysis Dissects the Complexity of Tumor Microenvironment in Muscle Invasive Bladder Cancer. Cancers 2021, 13, 5440. [Google Scholar] [CrossRef] [PubMed]
- Gillet, L.C.; Navarro, P.; Tate, S.; Röst, H.; Selevsek, N.; Reiter, L.; Bonner, R.; Aebersold, R. Targeted data extraction of the MS/MS spectra generated by data-independent acquisition: A new concept for consistent and accurate proteome analysis. Mol. Cell. Proteom. 2012, 11, O111.016717. [Google Scholar] [CrossRef] [PubMed]
- Anjo, S.I.; Santa, C.; Manadas, B. SWATH-MS as a tool for biomarker discovery: From basic research to clinical applications. Proteomics 2017, 17, 1600278. [Google Scholar] [CrossRef] [PubMed]
- Min, L.; Zhu, S.; Wei, R.; Zhao, Y.; Liu, S.; Li, P.; Zhang, S. Integrating SWATH-MS Proteomics and Transcriptome Analysis Identifies CHI3L1 as a Plasma Biomarker for Early Gastric Cancer. Mol. Ther.-Oncolytics 2020, 17, 257–266. [Google Scholar] [CrossRef]
- Chang, Q.; Chen, Y.; Yin, J.; Wang, T.; Dai, Y.; Wu, Z.; Guo, Y.; Wang, L.; Zhao, Y.; Yuan, H.; et al. Comprehensive Urinary Proteome Profiling Analysis Identifies Diagnosis and Relapse Surveillance Biomarkers for Bladder Cancer. J. Proteome Res. 2024, 23, 2241–2252. [Google Scholar] [CrossRef]
- Blanco-Pintos, T.; Regueira-Iglesias, A.; Relvas, M.; Alonso-Sampedro, M.; Chantada-Vázquez, M.P.; Balsa-Castro, C.; Tomás, I. Using SWATH-MS to identify new molecular biomarkers in gingival crevicular fluid for detecting periodontitis and its response to treatment. J. Clin. Periodontol. 2024, 51, 1342–1358. [Google Scholar] [CrossRef]
- Kim, J.; Jin, P.; Yang, W.; Kim, W.J. Proteomic profiling of bladder cancer for precision medicine in the clinical setting: A review for the busy urologist. Investig. Clin. Urol. 2020, 61, 539–554. [Google Scholar] [CrossRef]
- Zhang, Q.; Faca, V.; Hanash, S. Mining the plasma proteome for disease applications across seven logs of protein abundance. J. Proteome Res. 2011, 10, 46–50. [Google Scholar] [CrossRef]
- Jia, L.; Lu, Y.; Shao, J.; Liang, X.J.; Xu, Y. Nanoproteomics: A new sprout from emerging links between nanotechnology and proteomics. Trends Biotechnol. 2013, 31, 99–107. [Google Scholar] [CrossRef]
- Chantada-Vázquez, M.P.; Castro López, A.; Bravo, S.B.; Vázquez-Estévez, S.; Acea-Nebril, B.; Núñez, C. Proteomic analysis of the bio-corona formed on the surface of (Au, Ag, Pt)-nanoparticles in human serum. Colloids Surf. B Biointerfaces 2019, 177, 141–148. [Google Scholar] [CrossRef]
- Chantada-Vázquez, M.D.P.; Castro López, A.; García Vence, M.; Vázquez-Estévez, S.; Acea-Nebril, B.; Calatayud, D.G.; Jardiel, T.; Bravo, S.B.; Núñez, C. Proteomic investigation on bio-corona of Au, Ag and Fe nanoparticles for the discovery of triple negative breast cancer serum protein biomarkers. J. Proteom. 2020, 212, 103581. [Google Scholar] [CrossRef]
- Chantada-Vázquez, M.D.P.; García-Vence, M.; Vázquez-Estévez, S.; Bravo, S.B.; Núñez, C. Identification of a Profile of Neutrophil-Derived Granule Proteins in the Surface of Gold Nanoparticles after Their Interaction with Human Breast Cancer Sera. Nanomaterials 2020, 10, 1223. [Google Scholar] [CrossRef] [PubMed]
- Chantada-Vázquez, M.D.P.; López, A.C.; García-Vence, M.; Acea-Nebril, B.; Bravo, S.B.; Núñez, C. Protein corona gold nanoparticles fingerprinting reveals a profile of blood coagulation proteins in the serum of Her2-overexpressing breast cancer patients. Int. J. Mol. Sci. 2020, 21, 8449. [Google Scholar] [CrossRef] [PubMed]
- García-Vence, M.; Chantada-Vázquez, M.D.P.; Cameselle-Teijeiro, J.M.; Bravo, S.B.; Núñez, C. A Novel nanoproteomic approach for the identification of molecular targets associated with thyroid tumors. Nanomaterials 2020, 10, 2370. [Google Scholar] [CrossRef]
- Blanco-Gómez, B.; López-Cortés, R.; Casas-Nebra, F.J.; Vázquez-Estévez, S.; Pérez-Fentes, D.; Chantada-Vázquez, M.D.P.; Bravo, S.B.; Núñez, C. Detection of Circulating Serum Protein Biomarkers of Non-Muscle Invasive Bladder Cancer after Protein Corona-Silver Nanoparticles Analysis by SWATH-MS. Nanomaterials 2021, 11, 2384. [Google Scholar] [CrossRef]
- Chantada-Vázquez, M.D.P.; Conde-Amboage, M.; Graña-López, L.; Vázquez-Estévez, S.; Bravo, S.B.; Núñez, C. Circulating Proteins Associated with Response and Resistance to Neoadjuvant Chemotherapy in HER2-Positive Breast Cancer. Cancers 2022, 14, 1087. [Google Scholar] [CrossRef]
- Lai, Z.W.; Yan, Y.; Caruso, F.; Nice, E.C. Emerging techniques in proteomics for probing nano-bio interactions. ACS Nano 2012, 6, 10438–10448. [Google Scholar] [CrossRef] [PubMed]
- Jeyaraj, M.; Gurunathan, S.; Qasim, M.; Kang, M.-H.; Kim, J.-H. A Comprehensive Review on the Synthesis, Characterization, and Biomedical Application of Platinum Nanoparticles. Nanomaterials 2019, 9, 1719. [Google Scholar] [CrossRef]
- Wu, G.-W.; He, S.-B.; Peng, H.; Deng, H.-H.; Liu, A.-L.; Lin, X.-H.; Xia, X.-H.; Chen, W. Citrate-capped platinum nanoparticle as a smart probe for ultrasensitive mercury sensing. Anal. Chem. 2014, 86, 10955–10960. [Google Scholar] [CrossRef] [PubMed]
- Dobrovolskaia, M.A.; Patri, A.K.; Zheng, J.; Clogston, J.D.; Ayub, N.; Aggarwal, P.; Neun, B.W.; Hall, J.B.; McNeil, S.E. Interaction of colloidal gold nanoparticles with human blood: Effects on particle size and analysis of plasma protein binding profiles. Nanomedicine 2009, 5, 106–117. [Google Scholar] [CrossRef] [PubMed]
- García-Álvarez, R.; Hadjidemetriou, M.; Sánchez-Iglesias, A.; Liz-Marzán, L.M.; Kostarelos, K. In vivo formation of protein corona on gold nanoparticles: The effect of size and shape. Nanoscale 2018, 10, 1256–1264. [Google Scholar] [CrossRef]
- Wang, C.; Li, A.; Yang, S.; Qiao, R.; Zhu, X.; Zhang, J. CXCL5 promotes mitomycin C resistance in non-muscle invasive bladder cancer by activating EMT and NF-κB pathway. Biochem. Biophys. Res. Commun. 2018, 498, 862–868. [Google Scholar] [CrossRef]
- Zhang, C.-J.; Shen, Z.-J.; Pan, C.-W.; Zhong, S.; Li, T.; Zhang, M.-G. Engagement of integrinβ1 induces resistance of bladder cancer cells to mitomycin-C. Urology 2012, 79, 638–643. [Google Scholar] [CrossRef]
- Vallo, S.; Rutz, J.; Kautsch, M.; Winkelmann, R.; Michaelis, M.; Wezel, F.; Bartsch, G.; Haferkamp, A.; Rothweiler, F.; Blaheta, R.A.; et al. Blocking integrin β1 decreases adhesion in chemoresistant urothelial cancer cell lines. Oncol. Lett. 2017, 14, 5513–5518. [Google Scholar] [CrossRef]
- Sarma, J.V.; Ward, P.A. The complement system. Cell Tissue Res. 2011, 343, 227–235. [Google Scholar] [CrossRef]
- Markiewski, M.M.; DeAngelis, R.A.; Benencia, F.; Ricklin-Lichtsteiner, S.K.; Koutoulaki, A.; Gerard, C.; Coukos, G.; Lambris, J.D. Modulation of the antitumor immune response by complement. Nat. Immunol. 2008, 9, 1225–1235. [Google Scholar] [CrossRef]
- Merle, N.S.; Roumenina, L.T. The complement system as a target in cancer immunotherapy. Eur. J. Immunol. 2024, 54, e2350820. [Google Scholar] [CrossRef]
- Lee, K.S.W.; Zhang, Q.; Suwa, T.; Clark, H.; Olcina, M.M. The role of the complement system in the response to cytotoxic therapy. Semin. Immunol. 2025, 77, 101927. [Google Scholar] [CrossRef] [PubMed]
- Kolev, M.; Das, M.; Gerber, M.; Baver, S.; Deschatelets, P.; Markiewski, M.M. Inside-Out of Complement in Cancer. Front. Immunol. 2022, 13, 931273. [Google Scholar] [CrossRef]
- Revel, M.; Merle, N.S. Local and Cell-intrinsic complement: The new player in cancer progression. Semin. Immunol. 2025, 79, 101976. [Google Scholar] [CrossRef] [PubMed]
- Ajona, D.; Ortiz-Espinosa, S.; Pio, R.; Lecanda, F. Complement in Metastasis: A Comp in the Camp. Front. Immunol. 2019, 10, 669. [Google Scholar] [CrossRef] [PubMed]
- Sharma, S.; Dubinett, S. Inhibiting C5a/C5aR axis reduces myeloid-derived suppressor cells and enhances PD-1 blockade therapy in lung cancer. Transl. Cancer Res. 2017, 6, S944–S948. [Google Scholar] [CrossRef]
- Liu, H.; Wang, Z.; Zhou, Y.; Yang, Y. MDSCs in breast cancer: An important enabler of tumor progression and an emerging therapeutic target. Front. Immunol. 2023, 14, 1199273. [Google Scholar] [CrossRef]
- Kourtzelis, I.; Rafail, S. The dual role of complement in cancer and its implication in anti-tumor therapy. Ann. Transl. Med. 2016, 4, 265. [Google Scholar] [CrossRef] [PubMed]
- Macor, P.; Capolla, S.; Tedesco, F. Complement as a Biological Tool to Control Tumor Growth. Front. Immunol. 2018, 9, 2203. [Google Scholar] [CrossRef] [PubMed]
- Patel, B.; Silwal, A.; Eltokhy, M.A.; Gaikwad, S.; Curcic, M.; Patel, J.; Prasad, S. Deciphering CD59: Unveiling Its Role in Immune Microenvironment and Prognostic Significance. Cancers 2024, 16, 3699. [Google Scholar] [CrossRef]
- Couves, E.C.; Gardner, S.; Voisin, T.B.; Bickel, J.K.; Stansfeld, P.J.; Tate, E.W.; Bubeck, D. Structural basis for membrane attack complex inhibition by CD59. Nat. Commun. 2023, 14, 890. [Google Scholar] [CrossRef]
- Rutkowski, M.J.; Sughrue, M.E.; Kane, A.J.; Mills, S.A.; Parsa, A.T. Cancer and the Complement Cascade. Mol. Cancer Res. 2010, 8, 1453–1465. [Google Scholar] [CrossRef]
- Towner, L.D.; Wheat, R.A.; Hughes, T.R.; Morgan, B.P. Complement Membrane Attack and Tumorigenesis. J. Biol. Chem. 2016, 291, 14927–14938. [Google Scholar] [CrossRef]
- Vlaicu, S.I.; Tatomir, A.; Rus, V.; Rus, H. Role of C5b-9 and RGC-32 in Cancer. Front. Immunol. 2019, 10, 1054. [Google Scholar] [CrossRef] [PubMed]
- Oliveira-Tore, C.F.; Moraes, A.G.; Plácido, H.M.B.S.; Signorini, N.M.D.L.; Fontana, P.D.; Godoy, T.P.B.; Boldt, A.B.W.; Messias, I. Non-canonical extracellular complement pathways and the complosome paradigm in cancer: A scoping review. Front. Immunol. 2025, 16, 1519465. [Google Scholar] [CrossRef]
- Gunji, Y.; Gorelik, E. Role of fibrin coagulation in protection of murine tumor cells from destruction by cytotoxic cells. Cancer Res. 1988, 48, 5216–5221. [Google Scholar]
- Moreno, P. Exploring the Complex Interactions of Immunity, Coagulation, and Tumor Cells. J. Thromb. Circ. 2024, 10, 265. [Google Scholar]
- Wahab, R.; Hasan, M.M.; Azam, Z.; Grippo, P.J.; Al-Hilal, T.A. The role of coagulome in the tumor immune microenvironment. Adv. Drug. Deliv. Rev. 2023, 200, 115027. [Google Scholar] [CrossRef]
- Beitia, M.; Romano, P.; Larrinaga, G.; Solano-Iturri, J.D.; Salis, A.; Damonte, G.; Bruzzone, M.; Ceppi, M.; Profumo, A. The Activation of Prothrombin Seems to Play an Earlier Role than the Complement System in the Progression of Colorectal Cancer: A Mass Spectrometry Evaluation. Diagnostics 2020, 10, 1077. [Google Scholar] [CrossRef]
- Alexander, E.T.; Gilmour, S.K. Immunomodulatory role of thrombin in cancer progression. Mol. Carcinog. 2022, 61, 527–536. [Google Scholar] [CrossRef]
- Cantrell, R.; Palumbo, J.S. The thrombin-inflammation axis in cancer progression. Thromb. Res. 2020, 191 (Suppl. S1), S117–S122. [Google Scholar] [CrossRef] [PubMed]
- Sinitsky, M.Y.; Kutikhin, A.G.; Tsepokina, A.V.; Shishkova, D.K.; Asanov, M.A.; Yuzhalin, A.E.; Minina, V.I.; Ponasenko, A.V. Mitomycin C induced genotoxic stress in endothelial cells is associated with differential expression of proinflammatory cytokines. Mutat. Res. Genet. Toxicol. Environ. Mutagen. 2020, 858–860, 503252. [Google Scholar] [CrossRef] [PubMed]
- Adams, G.N.; Rosenfeldt, L.; Frederick, M.; Miller, W.; Waltz, D.; Kombrinck, K.; McElhinney, K.E.; Flick, M.J.; Monia, B.P.; Revenko, A.S.; et al. Colon Cancer Growth and Dissemination Relies upon Thrombin, Stromal PAR-1, and Fibrinogen. Cancer Res. 2015, 75, 4235–4243. [Google Scholar] [CrossRef]
- Yang, Y.; Stang, A.; Schweickert, P.G.; Lanman, N.A.; Paul, E.N.; Monia, B.P.; Revenko, A.S.; Palumbo, J.S.; Mullins, E.S.; Elzey, B.D.; et al. Thrombin Signaling Promotes Pancreatic Adenocarcinoma through PAR-1–Dependent Immune Evasion. Cancer Res. 2019, 79, 3417–3430. [Google Scholar] [CrossRef]
- Reddel, C.J.; Tan, C.W.; Chen, V.M. Thrombin Generation and Cancer: Contributors and Consequences. Cancers 2019, 11, 100. [Google Scholar] [CrossRef]
- Brierley, J.D.; Gospodarowicz, M.K.; Wittekind, C. TNM Classification of Malignant Tumors, 8th ed.; UICC International Union Against Cancer; Wiley-Blackwell and UICC: New York, NY, USA, 2017. [Google Scholar]
- Soukup, V.; Capoun, O.; Cohen, D.; Hernández, V.; Babjuk, M.; Burger, M.; Compérat, E.; Gontero, P.; Lam, T.; MacLennan, S.; et al. Prognostic performance and reproducibility of the 1973 and 2004/2016 World Health Organization grading classification systems in non-muscle-invasive bladder cancer: A European association of urology non-muscle-invasive bladder cancer guidelines panel systematic review. Eur. Urol. 2017, 72, 801–813. [Google Scholar] [PubMed]
- Kang, M.; Jeong, C.W.; Kwak, C.; Kim, H.H.; Ku, J.H. Single, immediate postoperative instillation of chemotherapy in non-muscle invasive bladder cancer: A systematic review and network meta-analysis of randomized clinical trials using different drugs. Oncotarget 2016, 7, 45479. [Google Scholar] [CrossRef]
- Sylvester, R.J.; Oosterlinck, W.; Witjes, J.A. The schedule and duration of intravesical chemotherapy in patients with non-muscle-invasive bladder cancer: A systematic review of the published results of randomized clinical trials. Eur. Urol. 2008, 53, 709. [Google Scholar] [CrossRef] [PubMed]
- Sylvester, R.J.; Oosterlinck, W.; Holmang, S.; Sydes, M.R.; Birtle, A.; Gudjonsson, S.; De Nunzio, C.; Okamura, K.; Kaasinen, E.; Solsona, E.; et al. Systematic Review and Individual Patient Data Meta-analysis of Randomized Trials Comparing a Single Immediate Instillation of Chemotherapy After Transurethral Resection with Transurethral Resection Alone in Patients with Stage pTa-pT1 Urothelial Carcinoma of the Bladder: Which Patients Benefit from the Instillation? Eur. Urol. 2016, 69, 231. [Google Scholar]
- Tolley, D.A.; Parmar, M.K.; Grigor, K.M.; Lallemand, G.; Benyon, L.L.; Fellows, J.; Freedman, L.S.; Grigor, K.M.; Hall, R.R.; Hargreave, T.B.; et al. The effect of intravesical mitomycin C on recurrence of newly diagnosed superficial bladder cancer: A further report with 7 years of follow up. J. Urol. 1996, 155, 1233–1238. [Google Scholar] [CrossRef] [PubMed]
- Solsona, E.; Iborra, I.; Ricos, J.V.; Monrós, J.L.; Casanova, J.; Dumont, R. Effectiveness of a single immediate mitomycin C instillation in patients with low-risk superficial bladder cancer: Short and long-term followup. J. Urol. 1999, 161, 1120–1123. [Google Scholar] [CrossRef]
- Barghi, M.R.; Rahmani, M.R.; Moghaddam, S.M.H.; Jahanbin, M. Immediate intravesical instillation of mitomycin C after transurethral resection of bladder tumor in patients with low-risk superficial transitional cell carcinoma of bladder. Urol. Oncol. 2006, 3, 220–224. [Google Scholar]
- Oddens, J.R.; van der Meijden, A.P.; Sylvester, R. One immediate postoperative instillation of chemotherapy in low risk Ta, T1 bladder cancer patients. Is it always safe? Eur. Urol. 2004, 46, 336–338. [Google Scholar] [CrossRef]
- Racioppi, M.; Porreca, A.; Foschi, N.; Delicato, G.; Destito, A.; D’Addessi, A. Bladder perforation: A potential risk of early endovesical chemotherapy with mitomycin C. Urol. Int. 2005, 75, 373–375. [Google Scholar] [CrossRef]
- Holmang, S.; Johansson, S.L. Stage Ta-T1 bladder cancer: The relationship between findings at first followup cystoscopy and subsequent recurrence and progression. J. Urol. 2002, 167, 1634. [Google Scholar] [CrossRef] [PubMed]
- Soukup, V.; Babjuk, M.; Bellmunt, J.; Dalbagni, G.; Giannarini, G.; Hakenberg, O.W.; Herr, H.; Lechevallier, E.; Ribal, M.J. Follow-up after surgical treatment of bladder cancer: A critical analysis of the literature. Eur. Urol. 2012, 62, 290–302. [Google Scholar] [CrossRef] [PubMed]
- Solsona, E.; Iborra, I.; Dumont, R.; Rubio-Briones, J.; Casanova, J.; Almenar, S. The 3-month clinical response to intravesical therapy as a predictive factor for progression in patients with high risk superficial bladder cancer. J. Urol. 2000, 164, 685–689. [Google Scholar] [CrossRef]
- Pursiheimo, A.; Vehmas, A.P.; Afzal, S.; Suomi, T.; Chand, T.; Strauss, L.; Poutanen, M.; Rokka, A.; Corthals, G.L.; Elo, L.L. Optimization of Statistical Methods Impact on Quantitative Proteomics Data. J. Proteome Res. 2015, 14, 4118–4126. [Google Scholar] [CrossRef] [PubMed]
- McCarthy, D.J.; Smyth, G.K. Testing significance relative to a fold-change threshold is a TREAT. Bioinformatics 2009, 25, 765–771. [Google Scholar] [CrossRef]
- Gao, Y.; Wang, X.; Sang, Z.; Li, Z.; Liu, F.; Mao, J.; Yan, D.; Zhao, Y.; Wang, H.; Li, P.; et al. Quantitative proteomics by SWATH-MS reveals sophisticated metabolic reprogramming in hepatocellular carcinoma tissues. Sci. Rep. 2017, 7, 45913. [Google Scholar] [CrossRef]
- Wu, J.X.; Song, X.; Pascovici, D.; Zaw, T.; Care, N.; Krisp, C.; Molloy, M.P. SWATH Mass Spectrometry Performance Using Extended Peptide MS/MS Assay Libraries. Mol. Cell. Proteom. 2016, 15, 2501–2514. [Google Scholar] [CrossRef]
- Szklarczyk, D.; Franceschini, A.; Wyder, S.; Forslund, K.; Heller, D.; Huerta-Cepas, J.; Simonovic, M.; Roth, A.; Santos, A.; Tsafou, K.P.; et al. STRING v10: Protein-protein interaction networks, integrated over the tree of life. Nucleic Acids Res. 2015, 43, D447–D452. [Google Scholar] [CrossRef]


| SWATH-MS Analysis | ||||||
|---|---|---|---|---|---|---|
| Comparison | Protein Number (p-Value ≤ 0.05) | |||||
| Total | Upregulated | Downregulated | Specific | Upregulated | Downregulated | |
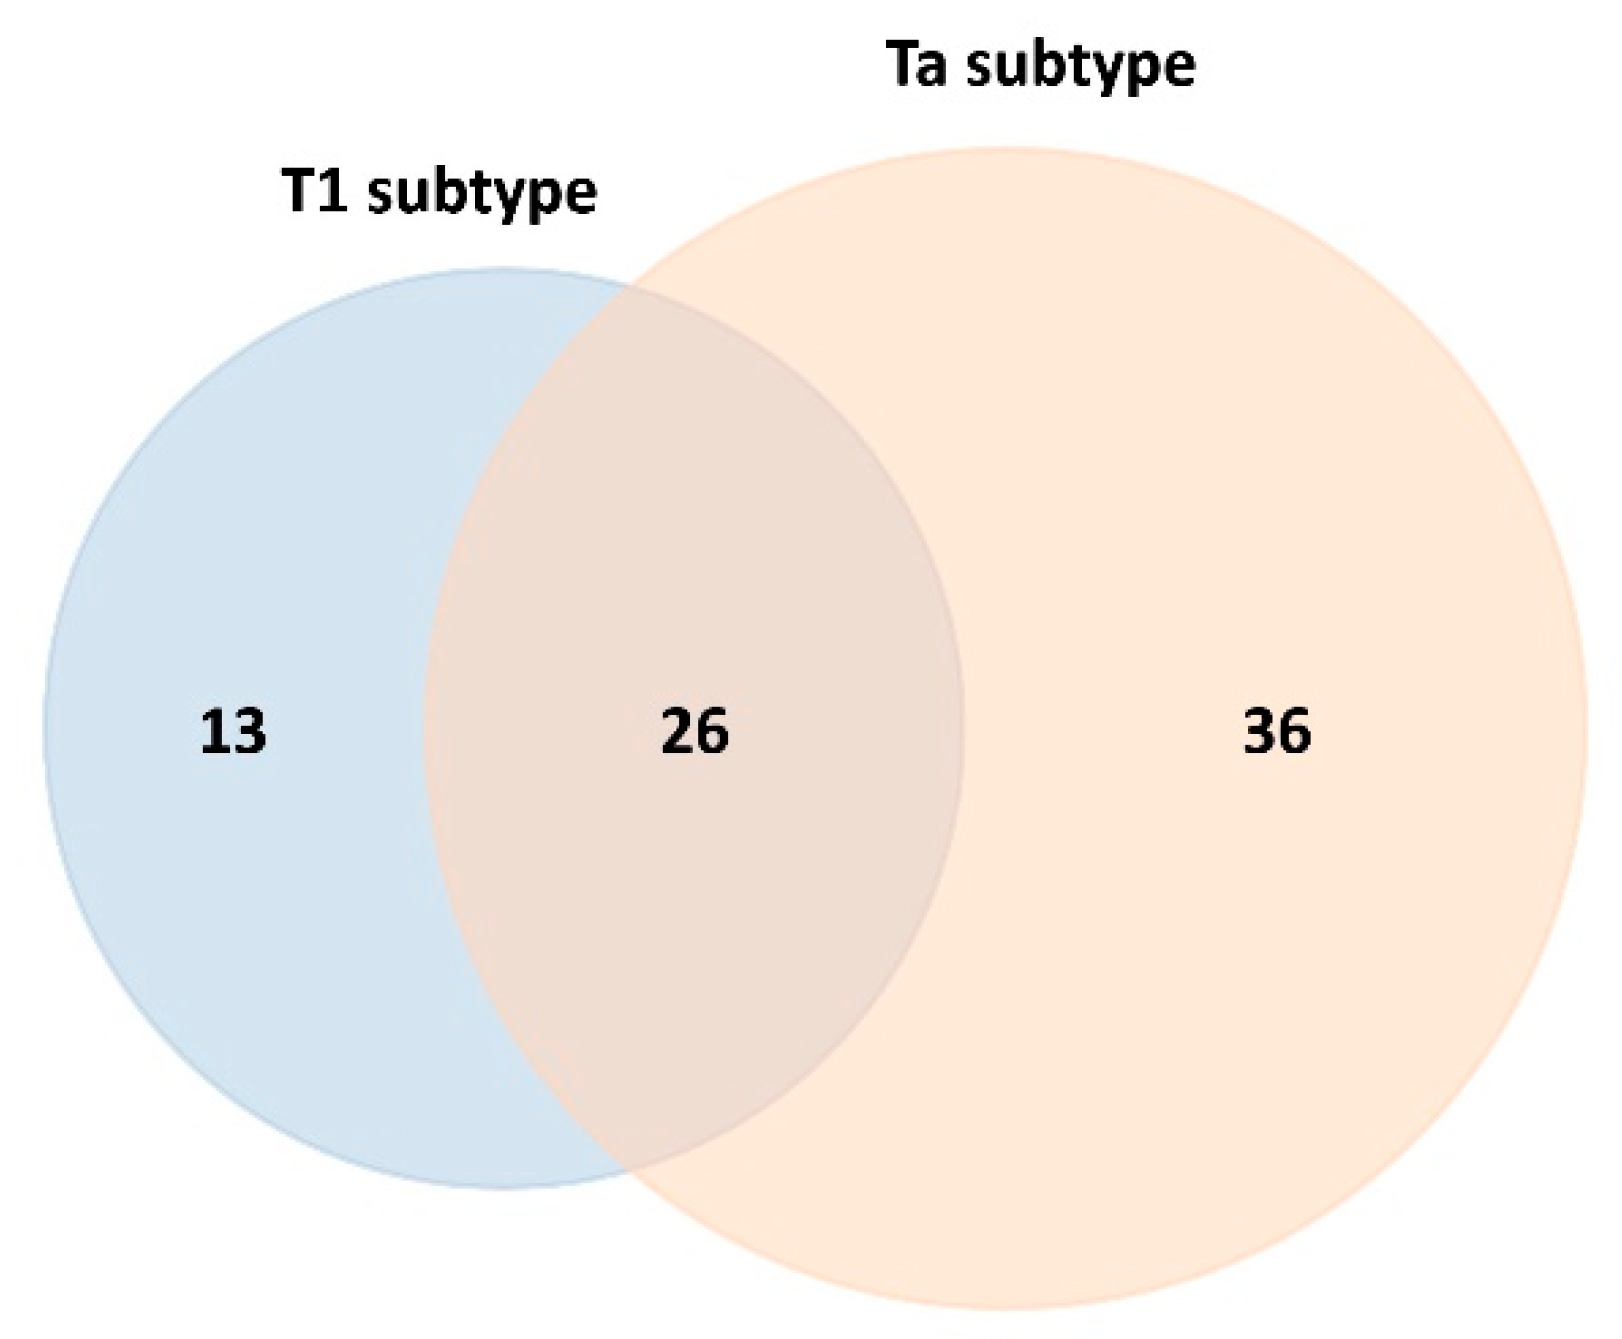
| Controls vs. T1 (t0) | 39 | 25 | 14 | 13 | 4 | 9 |
| Controls vs. Ta (t0) | 62 | 53 | 9 | 36 | 32 | 4 |
| Protein Name | UniProt Name | Entry Name | Gene | p-Value | Fold Change |
|---|---|---|---|---|---|
| Apolipoprotein F | APOF_HUMAN | Q13790 | APOF | 0.000103989 | 1.665948906 ↓ |
| Corticosteroid-binding globulin | CBG_HUMAN | P08185 | SERPINA6 | 0.041311857 | 1.515496886 ↓ |
| Complement C4-A | CO4A_HUMAN | P0C0L4 | C4A | 0.002227848 | 1.502657707 ↓ |
| Isoform 8 of Fibronectin | FINC_HUMAN | P02751-8 | FN1 | 0.039387727 | 1.481744201 ↓ |
| Kininogen-1 | KNG1_HUMAN | P01042 | KNG1 | 0.014135446 | 1.458320785 ↓ |
| Actin, alpha skeletal muscle | ACTS_HUMAN | P68133 | ACTA1 | 0.041111751 | 1.430556317 ↓ |
| Platelet basic protein | CXCL7_HUMAN | P02775 | PPBP | 0.025008068 | 1.394373864 ↓ |
| Insulin-like growth factor-binding protein complex acid-labile subunit | ALS_HUMAN | P35858 | IGFALS | 0.021533015 | 1.298009336 ↓ |
| Carboxypeptidase N catalytic chain | CBPN_HUMAN | P15169 | CPN1 | 0.015062263 | 1.237521967 ↓ |
| Retinol-binding protein 4 | RET4_HUMAN | P02753 | RBP4 | 0.027874902 | 0.772212849 ↑ |
| C4b-binding protein beta chain | C4BPB_HUMAN | P20851 | C4BPB | 0.024672132 | 0.741162008 ↑ |
| Complement factor D | CFAD_HUMAN | P00746 | CFD | 0.002342061 | 0.668694759 ↑ |
| Beta-2-glycoprotein 1 | APOH_HUMAN | P02749 | APOH | 0.004627905 | 0.658459944 ↑ |
| Protein Name | UniProt Name | Entry Name | Gene | p-Value | Fold Change |
|---|---|---|---|---|---|
| Alpha-2-antiplasmin | A2AP_HUMAN | P08697 | SERPINF2 | 0.001182738 | 1.389732364 ↓ |
| Inter-alpha-trypsin inhibitor heavy chain H1 | ITIH1_HUMAN | P19827 | ITIH1 | 0.009336781 | 1.318100921 ↓ |
| N-acetylmuramoyl-L-alanine amidase | PGRP2_HUMAN | Q96PD5 | PGLYRP2 | 0.001225049 | 1.278550088 ↓ |
| Plasma protease C1 inhibitor | IC1_HUMAN | P05155 | SERPING1 | 0.021531122 | 1.234863507 ↓ |
| Complement component C8 gamma chain | CO8G_HUMAN | P07360 | C8G | 0.044083487 | 0.829472852 ↑ |
| Inter-alpha-trypsin inhibitor heavy chain H3 | ITIH3_HUMAN | Q06033 | ITIH3 | 0.029254319 | 0.814153389 ↑ |
| Clusterin | CLUS_HUMAN | P10909 | CLU | 0.028873097 | 0.809816668 ↑ |
| Plasma kallikrein | KLKB1_HUMAN | P03952 | KLKB1 | 0.016935903 | 0.805823665 ↑ |
| Complement factor I | CFAI_HUMAN | P05156 | CFI | 0.006682648 | 0.798543082 ↑ |
| Complement C1r subcomponent | C1R_HUMAN | P00736 | C1R | 0.013070458 | 0.781890253 ↑ |
| Fibulin-1 | FBLN1_HUMAN | P23142 | FBLN1 | 0.026800704 | 0.755595485 ↑ |
| Complement component C8 beta chain | CO8B_HUMAN | P07358 | C8B | 0.004474085 | 0.754214062 ↑ |
| Complement factor H | CFAH_HUMAN | P08603 | CFH | 0.0148658 | 0.73302824 ↑ |
| Complement component C6 | CO6_HUMAN | P13671 | C6 | 0.001270663 | 0.724031596 ↑ |
| Ficolin-2 | FCN2_HUMAN | Q15485 | FCN2 | 0.002023702 | 0.718023722 ↑ |
| Complement C1s subcomponent | C1S_HUMAN | P09871 | C1S | 0.000559089 | 0.706962239 ↑ |
| Immunoglobulin heavy variable 3-7 | HV307_HUMAN | P01780 | IGHV3-7 | 0.040274746 | 0.700272395 ↑ |
| Fibrinogen alpha chain | FIBA_HUMAN | P02671 | FGA | 0.00059264 | 0.682746455 ↑ |
| C4b-binding protein alpha chain | C4BPA_HUMAN | P04003 | C4BPA | 0.006654364 | 0.682409349 ↑ |
| Vitamin D-binding protein | VTDB_HUMAN | P02774 | GC | 0.001673796 | 0.680683345 ↑ |
| Complement C1q subcomponent subunit A | C1QA_HUMAN | P02745 | C1QA | 0.024744531 | 0.601772102 ↑ |
| Inter-alpha-trypsin inhibitor heavy chain H4 | ITIH4_HUMAN | Q14624 | ITIH4 | 0.033591359 | 0.591696152 ↑ |
| Apolipoprotein A-II | APOA2_HUMAN | P02652 | APOA2 | 0.026952051 | 0.560283714 ↑ |
| Immunoglobulin kappa variable 3-15 | KV315_HUMAN | P01624 | IGKV3-15 | 0.008510234 | 0.551467615 ↑ |
| Immunoglobulin kappa variable 3-11 | KV311_HUMAN | P04433 | IGKV3-11 | 0.049717499 | 0.547425329 ↑ |
| Immunoglobulin heavy variable 3-49 | HV349_HUMAN | A0A0A0MS15 | IGHV3-49 | 0.003041479 | 0.544537673 ↑ |
| Immunoglobulin gamma-1 heavy chain | IGG1_HUMAN | P0DOX5 | - | 0.011576288 | 0.54073804 ↑ |
| Immunoglobulin lambda variable 3-21 | LV321_HUMAN | P80748 | IGLV3-21 | 0.007386661 | 0.521460119 ↑ |
| Immunoglobulin lambda variable 3-25 | LV325_HUMAN | P01717 | IGLV3-25 | 0.001154538 | 0.519943515 ↑ |
| Immunoglobulin heavy variable 4-38-2 | HVD82_HUMAN | P0DP08 | IGHV4-38-2 | 0.004802612 | 0.499908822 ↑ |
| Immunoglobulin lambda-1 light chain | IGL1_HUMAN | P0DOX8 | - | 0.005825155 | 0.46809937 ↑ |
| Immunoglobulin kappa light chain | IGK_HUMAN | P0DOX7 | - | 0.006108806 | 0.461940604 ↑ |
| Ceruloplasmin | CERU_HUMAN | P00450 | CP | 0.007023379 | 0.452233625 ↑ |
| Immunoglobulin kappa variable 2-24 | KV224_HUMAN | A0A0C4DH68 | IGKV2-24 | 0.000204301 | 0.41995504 ↑ |
| Hemoglobin subunit beta | HBB_HUMAN | P68871 | HBB | 0.008588367 | 0.177953493 ↑ |
| Hemoglobin subunit alpha | HBA_HUMAN | P69905 | HBA1; HBA2 | 0.007764131 | 0.166807835 ↑ |
| SWATH-MS Analysis | |||||||
|---|---|---|---|---|---|---|---|
| Comparison | Protein Number (p-Value ≤ 0.05) | ||||||
| Total | Upregulated | Downregulated | Common | Specific | Upregulated | Downregulated | |
| Controls vs. T1 (t0) | 39 | 25 | 14 | 9 | 15 | 10 | 5 |
| Controls vs. T1 (t3) | 49 | 35 | 14 | 13 | 10 | 3 | |
| Controls vs. T1 (t6) | 62 | 47 | 15 | 21 | 18 | 3 | |
| Controls vs. Ta (t0) | 62 | 53 | 9 | 13 | 22 | 18 | 4 |
| Controls vs. Ta (t3) | 43 | 19 | 24 | 16 | 5 | 11 | |
| Controls vs. Ta (t6) | 60 | 51 | 9 | 18 | 18 | 0 | |
| Immune Response Proteins | |||||||
|---|---|---|---|---|---|---|---|
| Name | Gene | T1 Subtype | Ta Subtype | ||||
| t0 | t3 | t6 | t0 | t3 | t6 | ||
| Alpha-2-macroglobulin | A2M | - | - | ↑ | - | - | ↑ |
| Apolipoprotein L1 | APOL1 | - | - | - | - | - | ↑ |
| Clusterin | CLU | - | - | - | ↑ | - | - |
| Coagulation factor XII | F12 | ↑ | - | - | ↑ | - | ↑ |
| Complement C1q subcomponent subunit A | C1QA | - | - | - | ↑ | - | - |
| Complement C1q subcomponent subunit C | C1QC | - | - | ↓ | - | - | - |
| Complement C1r subcomponent | C1R | - | - | - | ↑ | - | - |
| Complement C1r subcomponent-like protein | C1RL | - | - | ↑ | - | - | ↑ |
| Complement C1s subcomponent | C1S | - | ↑ | - | ↑ | - | - |
| Complement C2 | C2 | - | ↓ | - | - | ↓ | - |
| Complement C3 | C3 | - | - | - | - | - | ↑ |
| Complement C4-A | C4A | ↓ | ↓ | - | - | - | ↑ |
| Complement C4-B | C4B | ↑ | ↓ | ↓ | ↑ | ↓ | - |
| C4b-binding protein alpha chain | C4BPA | - | - | - | ↑ | - | ↑ |
| C4b-binding protein beta chain | C4BPB | ↑ | - | ↓ | - | - | - |
| Complement C5 | C5 | - | - | - | - | - | ↑ |
| Complement component C6 | C6 | - | ↑ | ↑ | ↑ | - | ↑ |
| Complement component C7 | C7 | ↑ | ↑ | ↑ | ↑ | ↑ | ↑ |
| Complement component C8 alpha chain | C8A | ↑ | - | - | ↑ | - | ↑ |
| Complement component C8 beta chain | C8B | - | - | - | ↑ | ↓ | - |
| Complement component C8 gamma chain | C8G | - | - | - | ↑ | - | - |
| Complement component C9 | C9 | ↑ | ↑ | ↑ | ↑ | - | ↑ |
| Complement factor D | CFD | ↑ | - | - | - | - | |
| Complement factor I | CFI | - | ↑ | - | ↑ | - | - |
| Complement factor H | CFH | - | - | - | ↑ | ↓ | - |
| Complement factor H-related protein 1 | CFHR1 | - | - | ↑ | - | - | - |
| Fibrinogen alpha chain | FGA | - | ↑ | - | ↑ | - | ↑ |
| Ficolin-2 | FCN2 | - | - | - | ↑ | - | - |
| Ficolin-3 | FCN3 | - | ↓ | ↓ | - | ↓ | ↓ |
| Gelsolin | GSN | - | - | ↑ | - | - | - |
| Immunoglobulin heavy variable 4-38-2 | IGHV4-38-2 | - | - | ↑ | ↑ | - | ↑ |
| Immunoglobulin J chain | JCHAIN | - | ↑ | - | - | - | - |
| Immunoglobulin kappa variable 1-33 | IGKV1-33 | ↑ | ↑ | ↑ | ↑ | - | ↑ |
| Immunoglobulin kappa variable 2D-28 | IGKV2D-28 | - | ↑ | ↑ | - | - | - |
| Histidine-rich glycoprotein | HRG | - | - | - | - | ↑ | - |
| Keratin, type II cytoskeletal 1 | KRT1 | - | - | - | - | - | ↑ |
| Kininogen-1 | KNG1 | ↓ | ↓ | - | - | ↓ | - |
| Monocyte differentiation antigen CD14 | CD14 | ↑ | - | - | ↑ | ↑ | ↑ |
| N-acetylmuramoyl-L-alanine amidase | PGLYRP2 | - | ↓ | ↓ | ↓ | ↓ | ↓ |
| Plasma protease C1 inhibitor | SERPING1 | - | - | - | ↓ | - | - |
| Platelet basic protein | PPBP | ↓ | - | - | - | - | - |
| Polymeric immunoglobulin receptor | PIGR | - | - | ↑ | - | - | ↑ |
| Prothrombin | F2 | ↓ | ↓ | ↓ | ↓ | ↓ | ↓ |
| Thrombospondin-1 | THBS1 | - | ↑ | - | - | ↑ | - |
| Vitronectin | VTN | - | - | - | - | - | ↑ |
Disclaimer/Publisher’s Note: The statements, opinions and data contained in all publications are solely those of the individual author(s) and contributor(s) and not of MDPI and/or the editor(s). MDPI and/or the editor(s) disclaim responsibility for any injury to people or property resulting from any ideas, methods, instructions or products referred to in the content. |
© 2025 by the authors. Licensee MDPI, Basel, Switzerland. This article is an open access article distributed under the terms and conditions of the Creative Commons Attribution (CC BY) license (https://creativecommons.org/licenses/by/4.0/).
Share and Cite
Gómez, B.B.; Casas-Nebra, F.J.; Pérez-Fentes, D.; Bravo, S.B.; Rodríguez-Silva, L.; Núñez, C. Variations in Circulating Tumor Microenvironment-Associated Proteins in Non-Muscle Invasive Bladder Cancer Induced by Mitomycin C Treatment. Int. J. Mol. Sci. 2025, 26, 7413. https://doi.org/10.3390/ijms26157413
Gómez BB, Casas-Nebra FJ, Pérez-Fentes D, Bravo SB, Rodríguez-Silva L, Núñez C. Variations in Circulating Tumor Microenvironment-Associated Proteins in Non-Muscle Invasive Bladder Cancer Induced by Mitomycin C Treatment. International Journal of Molecular Sciences. 2025; 26(15):7413. https://doi.org/10.3390/ijms26157413
Chicago/Turabian StyleGómez, Benito Blanco, Francisco Javier Casas-Nebra, Daniel Pérez-Fentes, Susana B. Bravo, Laura Rodríguez-Silva, and Cristina Núñez. 2025. "Variations in Circulating Tumor Microenvironment-Associated Proteins in Non-Muscle Invasive Bladder Cancer Induced by Mitomycin C Treatment" International Journal of Molecular Sciences 26, no. 15: 7413. https://doi.org/10.3390/ijms26157413
APA StyleGómez, B. B., Casas-Nebra, F. J., Pérez-Fentes, D., Bravo, S. B., Rodríguez-Silva, L., & Núñez, C. (2025). Variations in Circulating Tumor Microenvironment-Associated Proteins in Non-Muscle Invasive Bladder Cancer Induced by Mitomycin C Treatment. International Journal of Molecular Sciences, 26(15), 7413. https://doi.org/10.3390/ijms26157413