Article

Preliminary Study on the Geochemical Characterization of Viticis Fructus Cuticular Waxes: From Latitudinal Variation to Origin Authentication

1
Guangdong Provincial Key Laboratory of Applied Botany, South China Botanical Garden, Chinese Academy of Sciences, Guangzhou 510650, China
2
Jiangxi Key Laboratory for Sustainable Utilization of Chinese Materia Medica Resources, Lushan Botanical Garden, Chinese Academy of Sciences, Jiujiang 332900, China
3
Lushan Xinglin Institute for Medicinal Plants, Jiujiang Xinglin Key Laboratory for Traditional Chinese Medicines, Lushan, Jiujiang 332900, China
4
School of Life Sciences, Nanchang University, Nanchang 330031, China
*
Authors to whom correspondence should be addressed.
These authors contributed equally to this work.
Int. J. Mol. Sci. 2025, 26(15), 7293; https://doi.org/10.3390/ijms26157293
Submission received: 16 June 2025 / Revised: 22 July 2025 / Accepted: 23 July 2025 / Published: 28 July 2025
(This article belongs to the Section Biochemistry)

Abstract

Viticis Fructus (VF), a fruit known for its unique flavor profile and various health benefits, demonstrates substantial quality variations depending on its area of production. Traditional methods of production area verification based on internal compound analysis are hampered by a number of technical limitations. This investigation systematically characterized the cuticular wax composition of VF sample from a diverse variety of production areas. Quantitative analyses were conducted to evaluate the spatial distribution patterns of the wax constituents. Significant regional variations were observed: Anhui sample exhibited the highest total wax content (21.39 μg/cm2), with n-alkanes dominating at 76.67%. High-latitude regions showed elevated triterpenoid acid levels, with maslinic acid (0.53 μg/cm2) and ursolic acid (0.34 μg/cm2) concentrations exceeding those of their low-latitude counterparts by four- and three-fold, respectively. Altitudinal influence manifested in long-chain alcohol accumulation, as triacontanol reached 0.87 μg/cm2 in high-altitude sample. Five key biomarkers demonstrated direct quality correlations: eicosanoic acid, n-triacontane, dotriacontanol, β-amyrin, and α-amyrin. This study established three novel origin identification protocols: single-component quantification, multi-component wax profiling, and wax ratio analysis. This work not only reveals the latitudinal dependence of VF wax composition, but also provides a scientific framework for geographical authentication. Our findings advance wax-based quality evaluation methodologies for fruit products, offering practical solutions for production area verification challenges in food raw materials.

1. Introduction

Viticis Fructus (VF), the dried ripe fruit of Vitex rotundifolia L. f. and Vitex trifolia L. (family Lamiaceae), is a traditional raw food material that is well-known for its unique flavor profile and various health benefits [1]. It has been widely used in daily diets to alleviate symptoms such as colds, headaches, migraines, and eye pain [2,3,4,5]. Modern pharmacological research has identified key flavonoids in VF, such as vitexin, which exhibits analgesic, anti-inflammatory, and antitumor activities, while rutin has been found to possess vasodilatory effects [6,7]. Additionally, due to its distinctive aroma, VF is commonly used as a food additive and flavoring agent, enhancing the taste of various dishes. In China, South Korea, and Japan, VF is also processed into tea, which is highly regarded for its unique fragrance and notable health benefits [8].
Both Vitex rotundifolia L. f. and Vitex trifolia L. are highly adaptable, being capable of thriving in challenging environments. These species can endure drought, alkalinity, high temperatures, and short-term frost [9]. They prefer sunny conditions and grow well in tropical and subtropical regions, particularly in coarse sandy soils, rocky terrains, and sandy grasslands. They are typically found near water bodies, such as beaches, lakesides, and riverbanks, where sunlight is abundant [10]. In China, they are primarily distributed across the provinces of Anhui, Shandong, Zhejiang, Jiangxi, Yunnan, and Hainan. Additionally, Vitex species are found in Japan, India, Myanmar, Thailand, Vietnam, Malaysia, Australia, and New Zealand [11].
The quality of VF varies significantly due to natural environmental factors, including climate, soil composition, and water quality [10,12,13]. These variations influence its chemical composition, affecting the levels of volatile oils, flavonoids, triterpenoids, sesquiterpenes, fatty acids, alkaloids, steroids, amino acids, and other bioactive compounds [14,15,16]. These constituents, alongside their distinctive flavor characteristics, directly contribute to their antitumor, antipyretic, analgesic, anti-inflammatory, antibacterial, antihypertensive, and antioxidant activities [17,18].
Current research on VF commonly utilizes gas chromatography–mass spectrometry (GC-MS) to analyze chemical profiles across different production areas, with a primary focus on casticin, one of its most significant metabolites [19,20,21]. Figure 1 presents the casticin content of VF sample from various production areas. The results indicate that there is no clear monotonic correlation between casticin levels and the latitude of the production area.
The main bioactive components of VF, such as casticin, are plant secondary metabolites. Their synthesis is highly influenced by growth stage, plant health, and climatic conditions, leading to significant temporal and individual variations that can reduce the reliability of production area discrimination. These metabolites are located inside the fruit and are susceptible to sample processing (e.g., drying, oxidation, variations in extraction solvents), potentially introducing analytical errors. Moreover, differences between various producing areas may primarily manifest in content rather than composition, making it difficult to establish a distinct “fingerprint” for identification purposes. Consequently, relying solely on casticin content to determine the production area of VF is challenging [22,23].
Cuticular wax is a lipid secreted by the outer layer of plant epidermal cells, primarily consisting of long-chain fatty acids, primary alcohols, and esters [24,25,26,27]. These waxes form a protective layer on the plant cuticula, shielding them from physical and chemical damage, minimizing water loss, and providing resistance against UV radiation, extreme temperature fluctuations, and various diseases and pests [28,29,30,31]. Due to genetic and environmental variations, plants from different production areas exhibit distinct wax composition profiles. As a result, the wax composition of the plant cuticula is species-specific, with variations in both the types and proportions of the components [32,33,34]. Although environmental variations may slightly affect wax thickness or content, the relative proportions of key components are more strongly influenced by geographical origin and are less prone to short-term fluctuations. Crucially, wax composition—including carbon chain distribution and branching patterns—reflects long-term environmental adaptation, thereby serving as a robust indicator of region-specific ecological traits. Furthermore, non-destructive detection methods are typically employed during wax analysis, minimizing experimental errors. For numerous plants (grapes, tea leaves, and Chinese medicinal herbs), surface wax has demonstrated high efficacy in discriminating production areas due to its environmentally linked chemical signature [35,36,37,38,39]. Compared to secondary metabolites like casticin in VF, surface wax exhibits higher chemical stability, lower susceptibility to environmental fluctuations, and greater compositional diversity [40,41]. As a result, it provides a more consistent representation of geographical traits, making it a more accurate marker for production area identification [42].
This study investigates the wax composition of VF from different production regions, examining its relationship with environmental factors. The primary objective is to accurately determine the production area of VF. A total of 22 wax components were identified across major production areas. Among these, specific waxes from extreme production regions—Shandong (high latitude) and Yunnan (high altitude)—were highlighted, facilitating the identification of VF from these locations. Furthermore, correlations were established between the content of key wax components (hentriacontane, n-tritriacontane, n-pentatriacontane, dotriacontane, and n-tetratriacontane) and the latitude of other major production areas. Based on these correlations, three identification methods were developed: the multi-component wax method, the single-component wax method, and the wax ratio method. These approaches provide a comprehensive framework for analyzing the relationship between VF wax composition and latitude, enabling the precise identification of VF from unknown production areas.
Additionally, this study explored the relationship between wax components and internal metabolite compounds, identifying key waxes (eicosanoic acid, n-triacontane, dotriacontanol, beta-amyrin, and alpha-amyrin) that are directly correlated with VF quality. The findings from this study offer a scientific foundation for the rapid, accurate, and minimally invasive identification of VF production areas. Moreover, this research reveals the intrinsic connection between cuticular wax composition and production area, promoting the application of wax analysis in the quality assessment of fruit products.

2. Results and Discussion

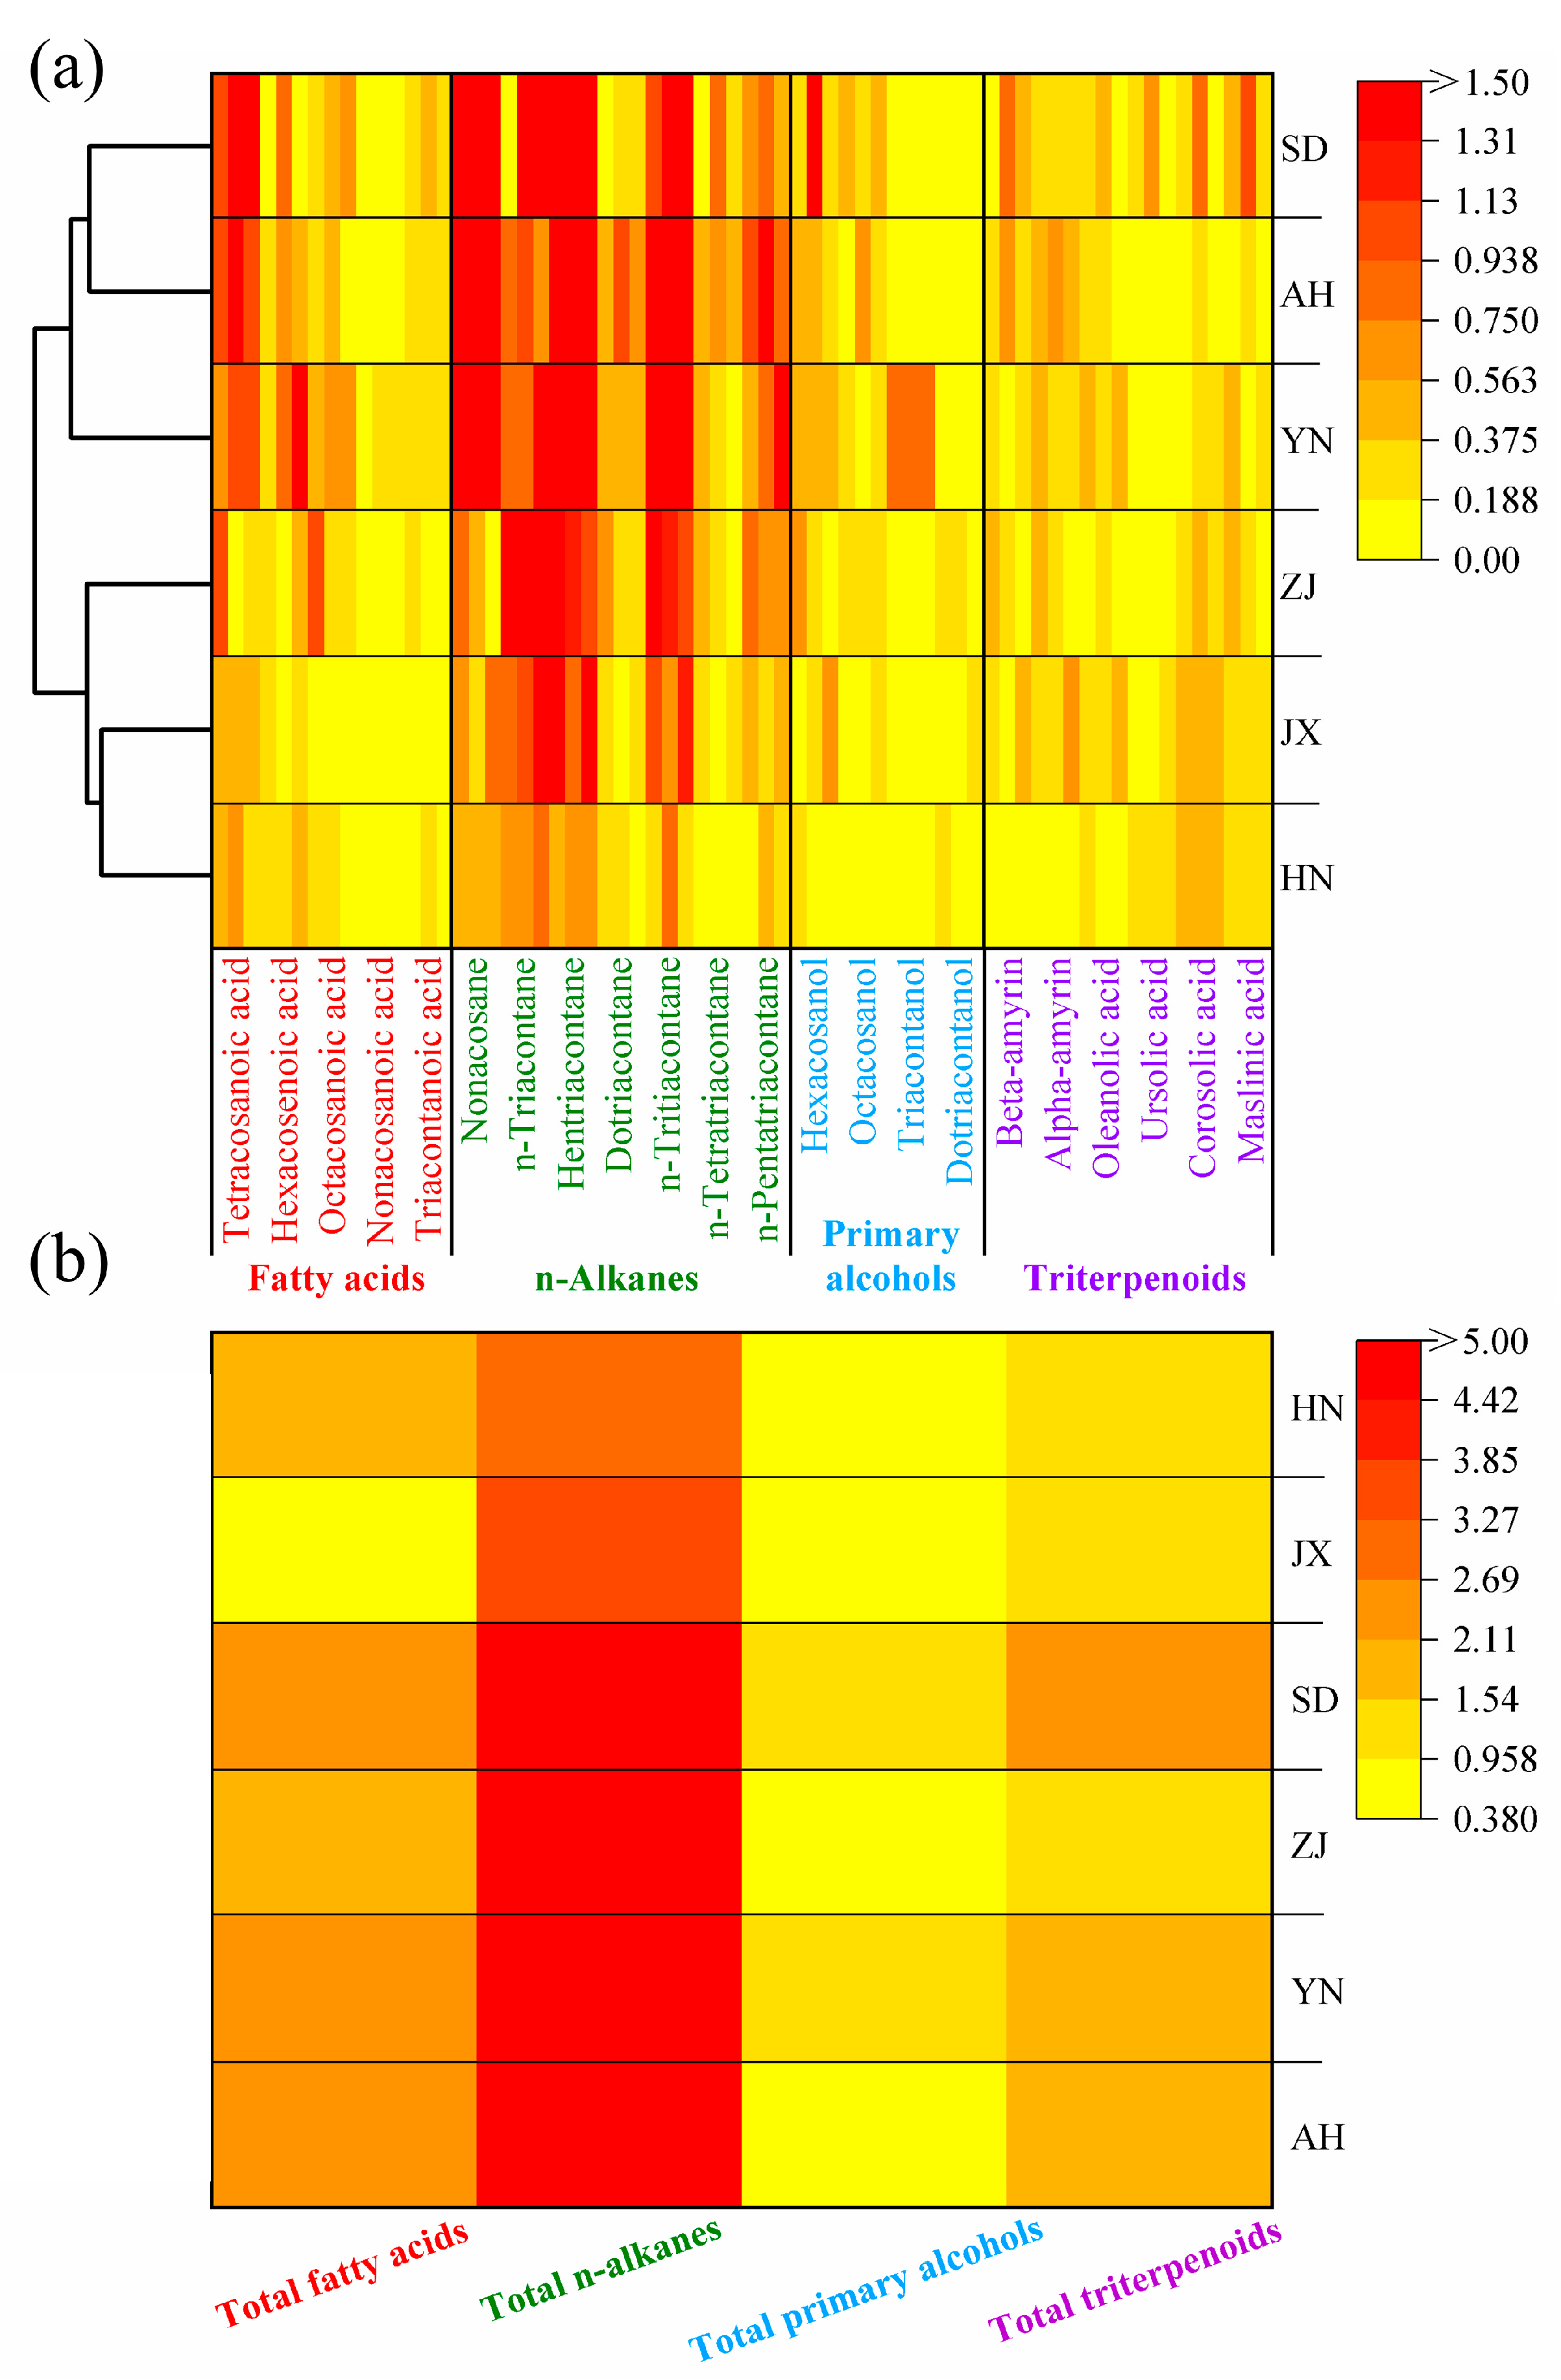
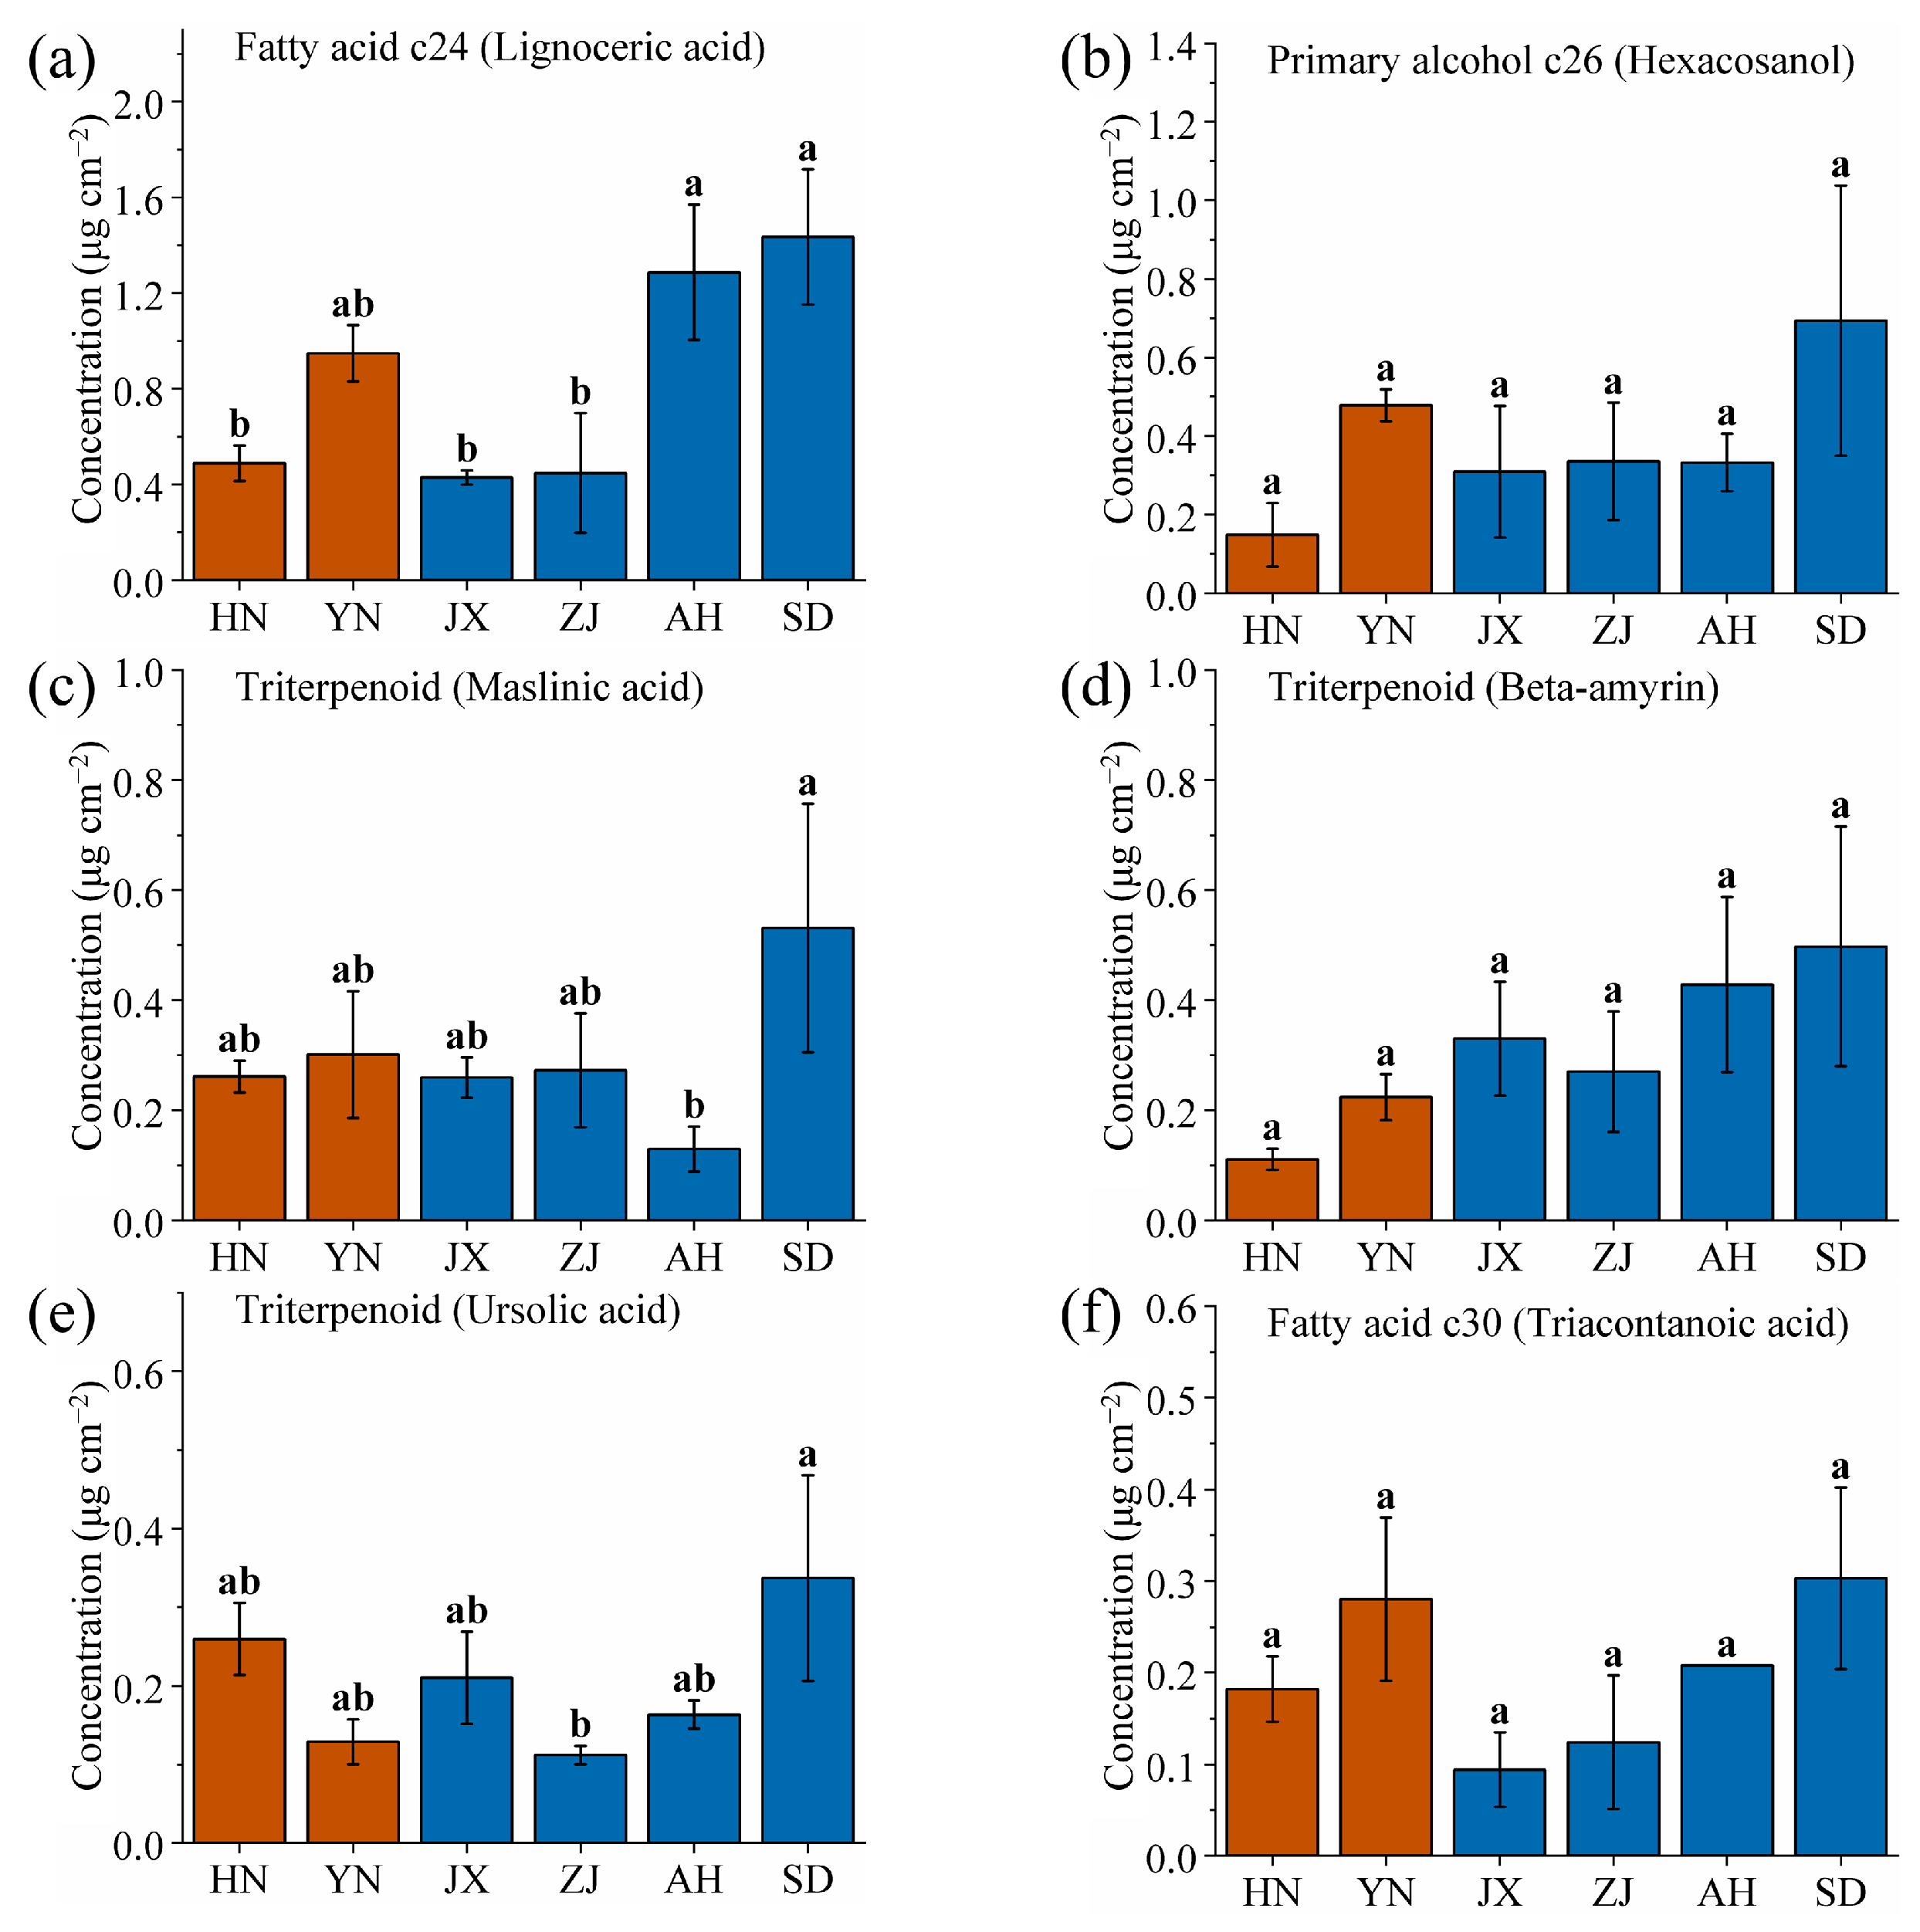
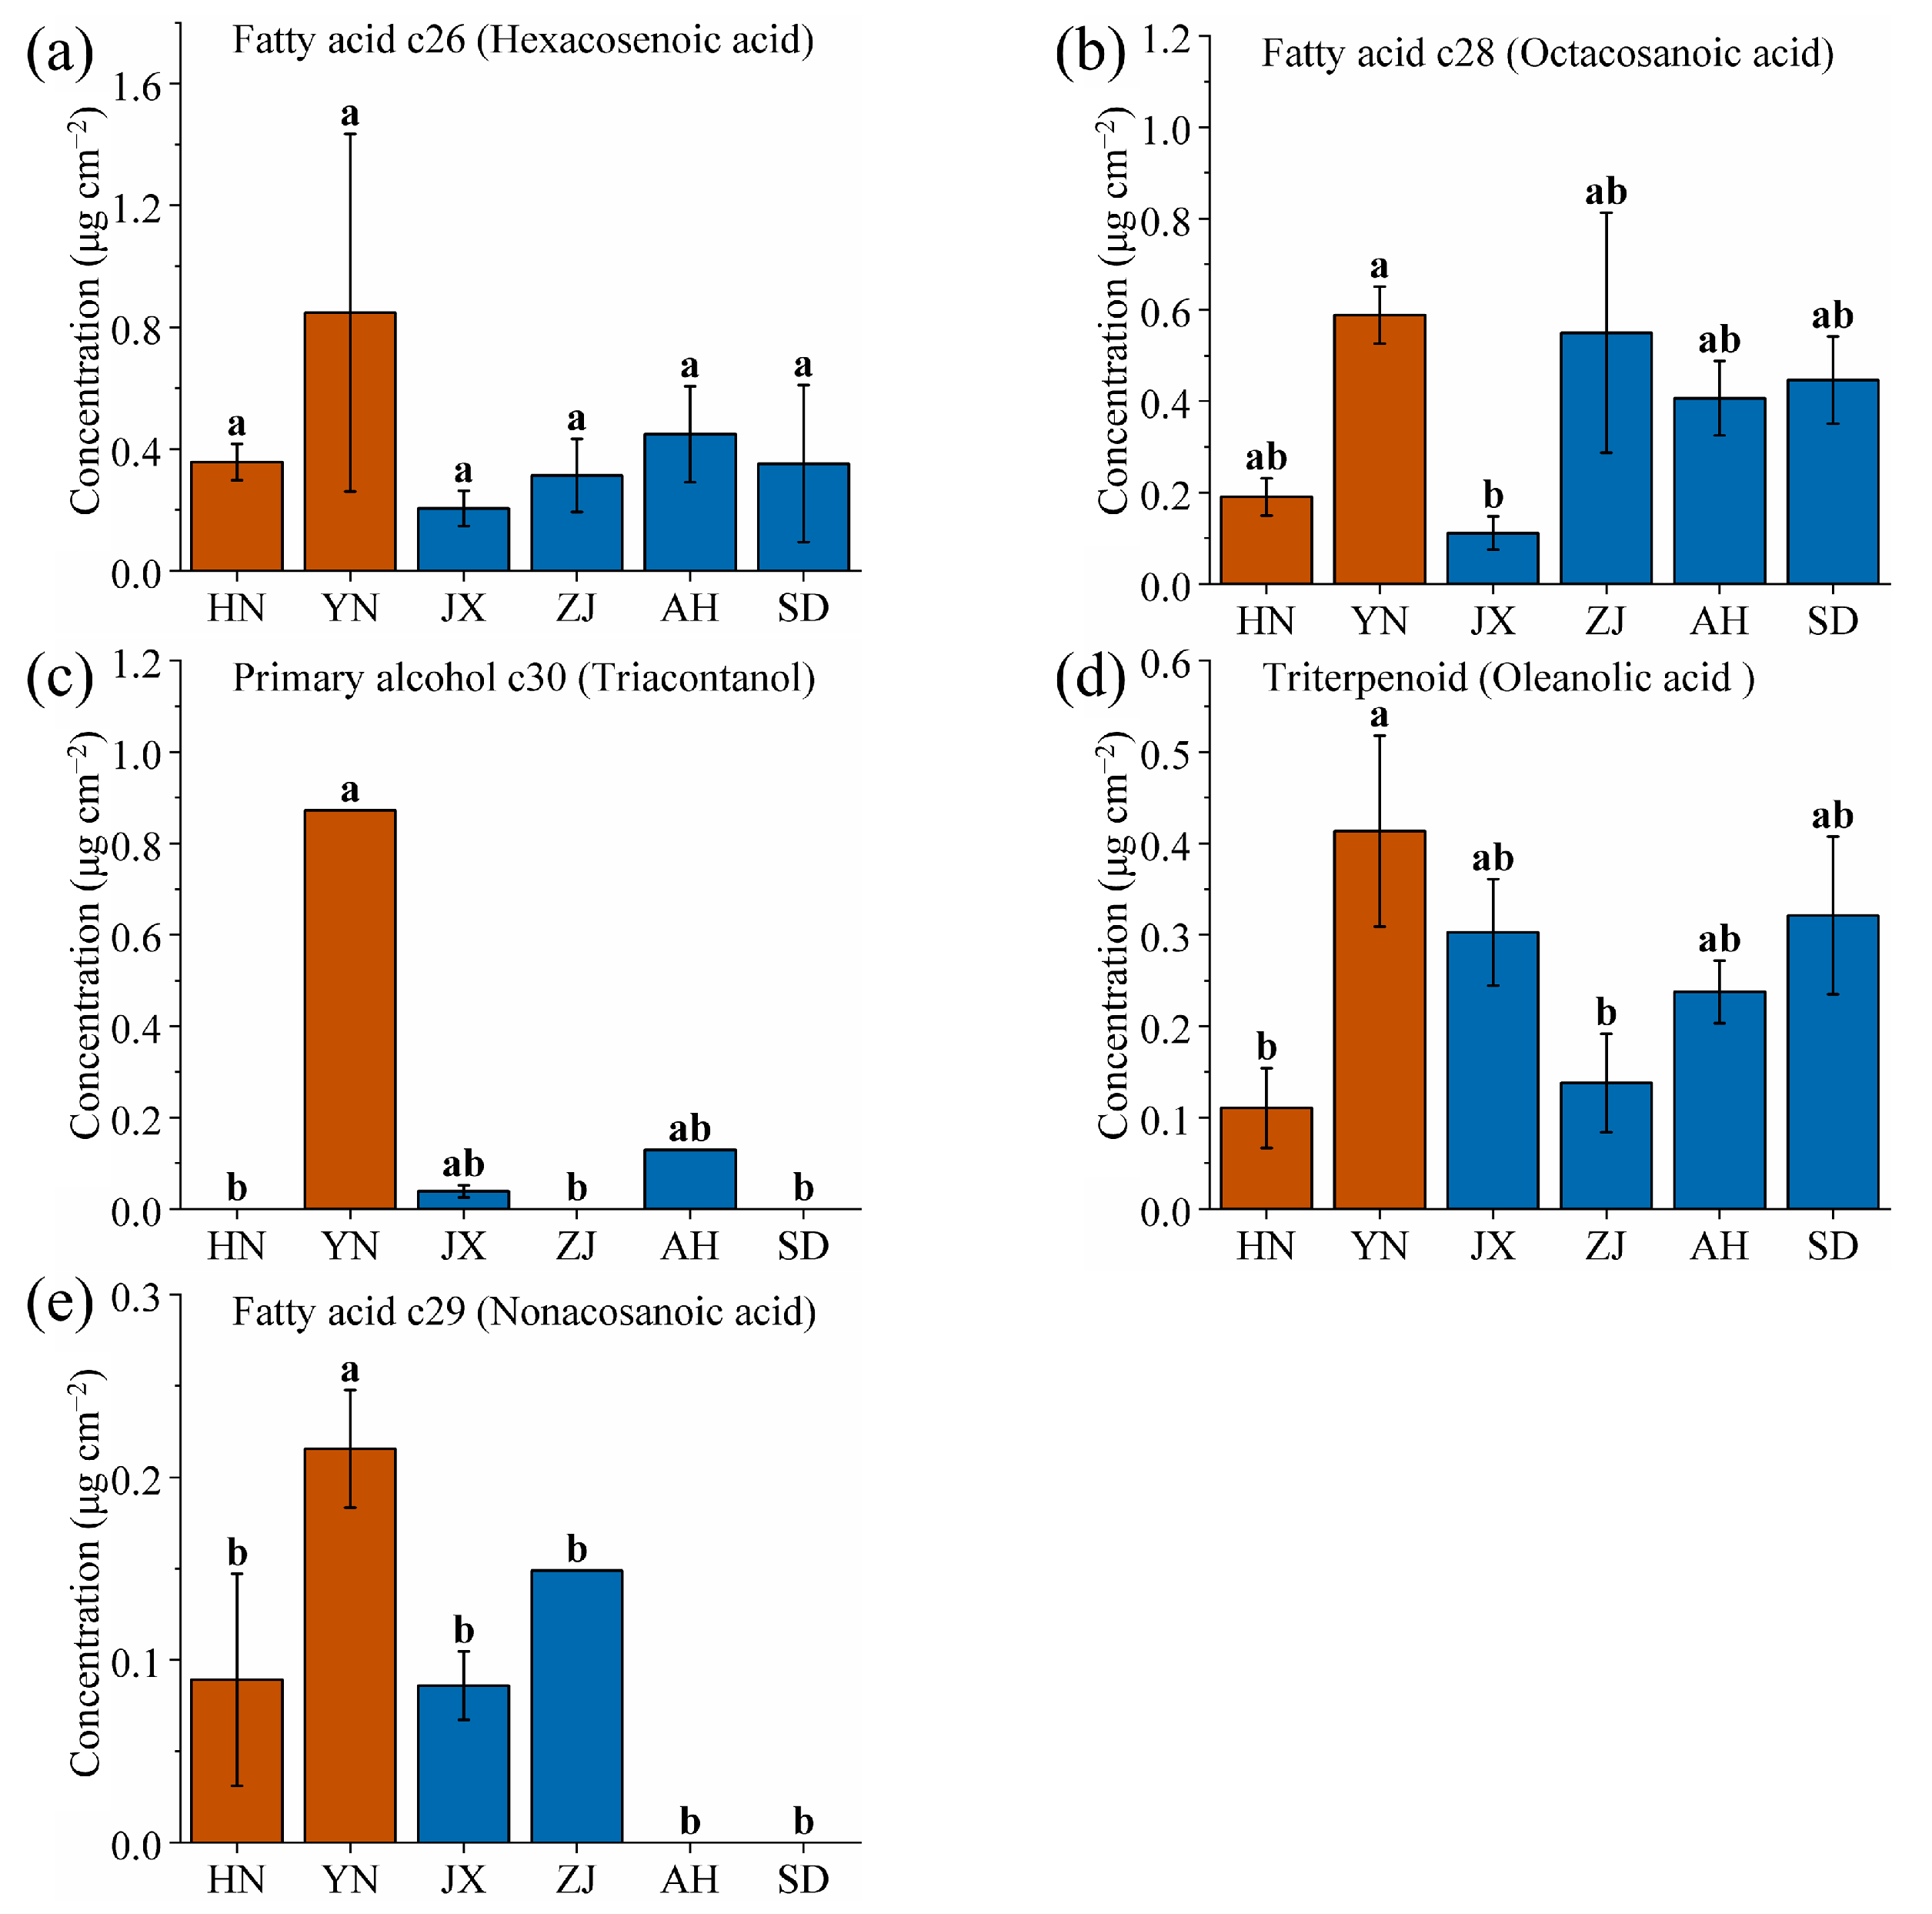
2.1. Chemical Composition and Content Analysis of VF Cuticular Waxes

Cuticular wax was extracted from VF sample collected from various production areas and analyzed using GC-MS. The wax components were identified by comparing the obtained spectra with the NIST database (Figure 2). Fatty acids, n-alkanes, primary alcohols, and triterpenoids were screened. Based on their content levels, twenty-two wax components were selected for further analysis, as detailed in Table 1.
Based on the GC-MS results and the cuticular area measurements of VF, wax content from various production areas was obtained. A heat-map was generated to visually present the data (Figure 3a). The wax content ranged from low to high, with color blocks transitioning from light yellow to deep red. The overall color for HN was the lightest, indicating the lowest wax content, followed by JX, ZJ, YN, SD, and AH. The total wax content from AH was 21.39 μg/cm2, approximately 3.3 times higher than HN (6.42 μg/cm2). The low wax content from HN is attributed to its tropical monsoon climate and low latitude, which are less favorable for wax accumulation on VF (Figure 4).
The low wax content in HN aligns with its tropical monsoon climate (24~26 °C annual temperature, 2000~2500 mm annual precipitation; Table 2). High humidity and temperatures in HN may downregulate wax biosynthesis pathways, as cuticular waxes primarily function to prevent water loss under arid conditions [43,44,45,46]. The laterite and red soils in HN (pH 5.0~6.5) are acidic and nutrient-leached, which may further limit the allocation of resources to wax synthesis, as plants prioritize growth over stress-resistant wax production in such high-resource (water, temperature) environments [47,48].
In contrast, AH showed the highest wax content, likely due to its cooler climate (15~17 °C) and intermediate precipitation (1300–1500 mm) [49,50]. The yellow-brown and paddy soils in AH (pH 5.5~7.0) are more neutral and fertile, providing sufficient nutrients for wax biosynthesis. The moderate precipitation creates a balance: plants need to retain water without excessive wax accumulation, but the cooler temperatures slow metabolic rates, allowing for longer-term wax deposition. This environment explains why AH had the highest n-alkane content (16.4 μg/cm2, 76.67% of total wax), as n-alkanes are key structural components for reducing transpiration in temperate climates with seasonal moisture variation.
The YN area, despite being at a relatively low latitude (25.02° N), diverged from other low-latitude sites (e.g., HN) due to its high altitude (1600~1900 m). The volcanic ash soil in YN is rich in minerals (e.g., silica, potassium), which may enhance enzyme activity in wax biosynthesis. The cooler temperatures (14–16 °C) at high altitudes, combined with intense UV radiation, likely induce the synthesis of UV-protective wax components, explaining its distinct wax profile compared to HN [51,52,53].
Cluster analysis of the wax content across all areas revealed that JX and HN clustered together, while SD and AH formed another group. SD and AH share similar latitudinal positions and environmental conditions, which explains the similarity in their wax component content. Interestingly, the classification of JX and HN into the same group does not align with their latitudinal relationship. Although YN is geographically closer to HN, it did not cluster with HN. This discrepancy is likely due to the higher altitude of YN, which creates unique climatic conditions that increase wax accumulation on the VF cuticle.
To further visualize the content of wax categories, a heat-map was created for four primary categories (Figure 3b). The darkest color block corresponded to n-alkanes, indicating that n-alkanes had the highest content among all wax categories. In AH, which had the highest total wax content, n-alkanes measured 16.4 μg/cm2, accounting for 76.67% of the total wax. In contrast, the content of n-alkanes from HN, YN, JX, ZJ, and SD were 2.75, 10.10, 5.00, 6.42, and 10.50 μg/cm2, respectively, accounting for 42.8%, 61.8%, 54.9%, 61.8%, and 63.0% of the total wax content from each area (Table 3).

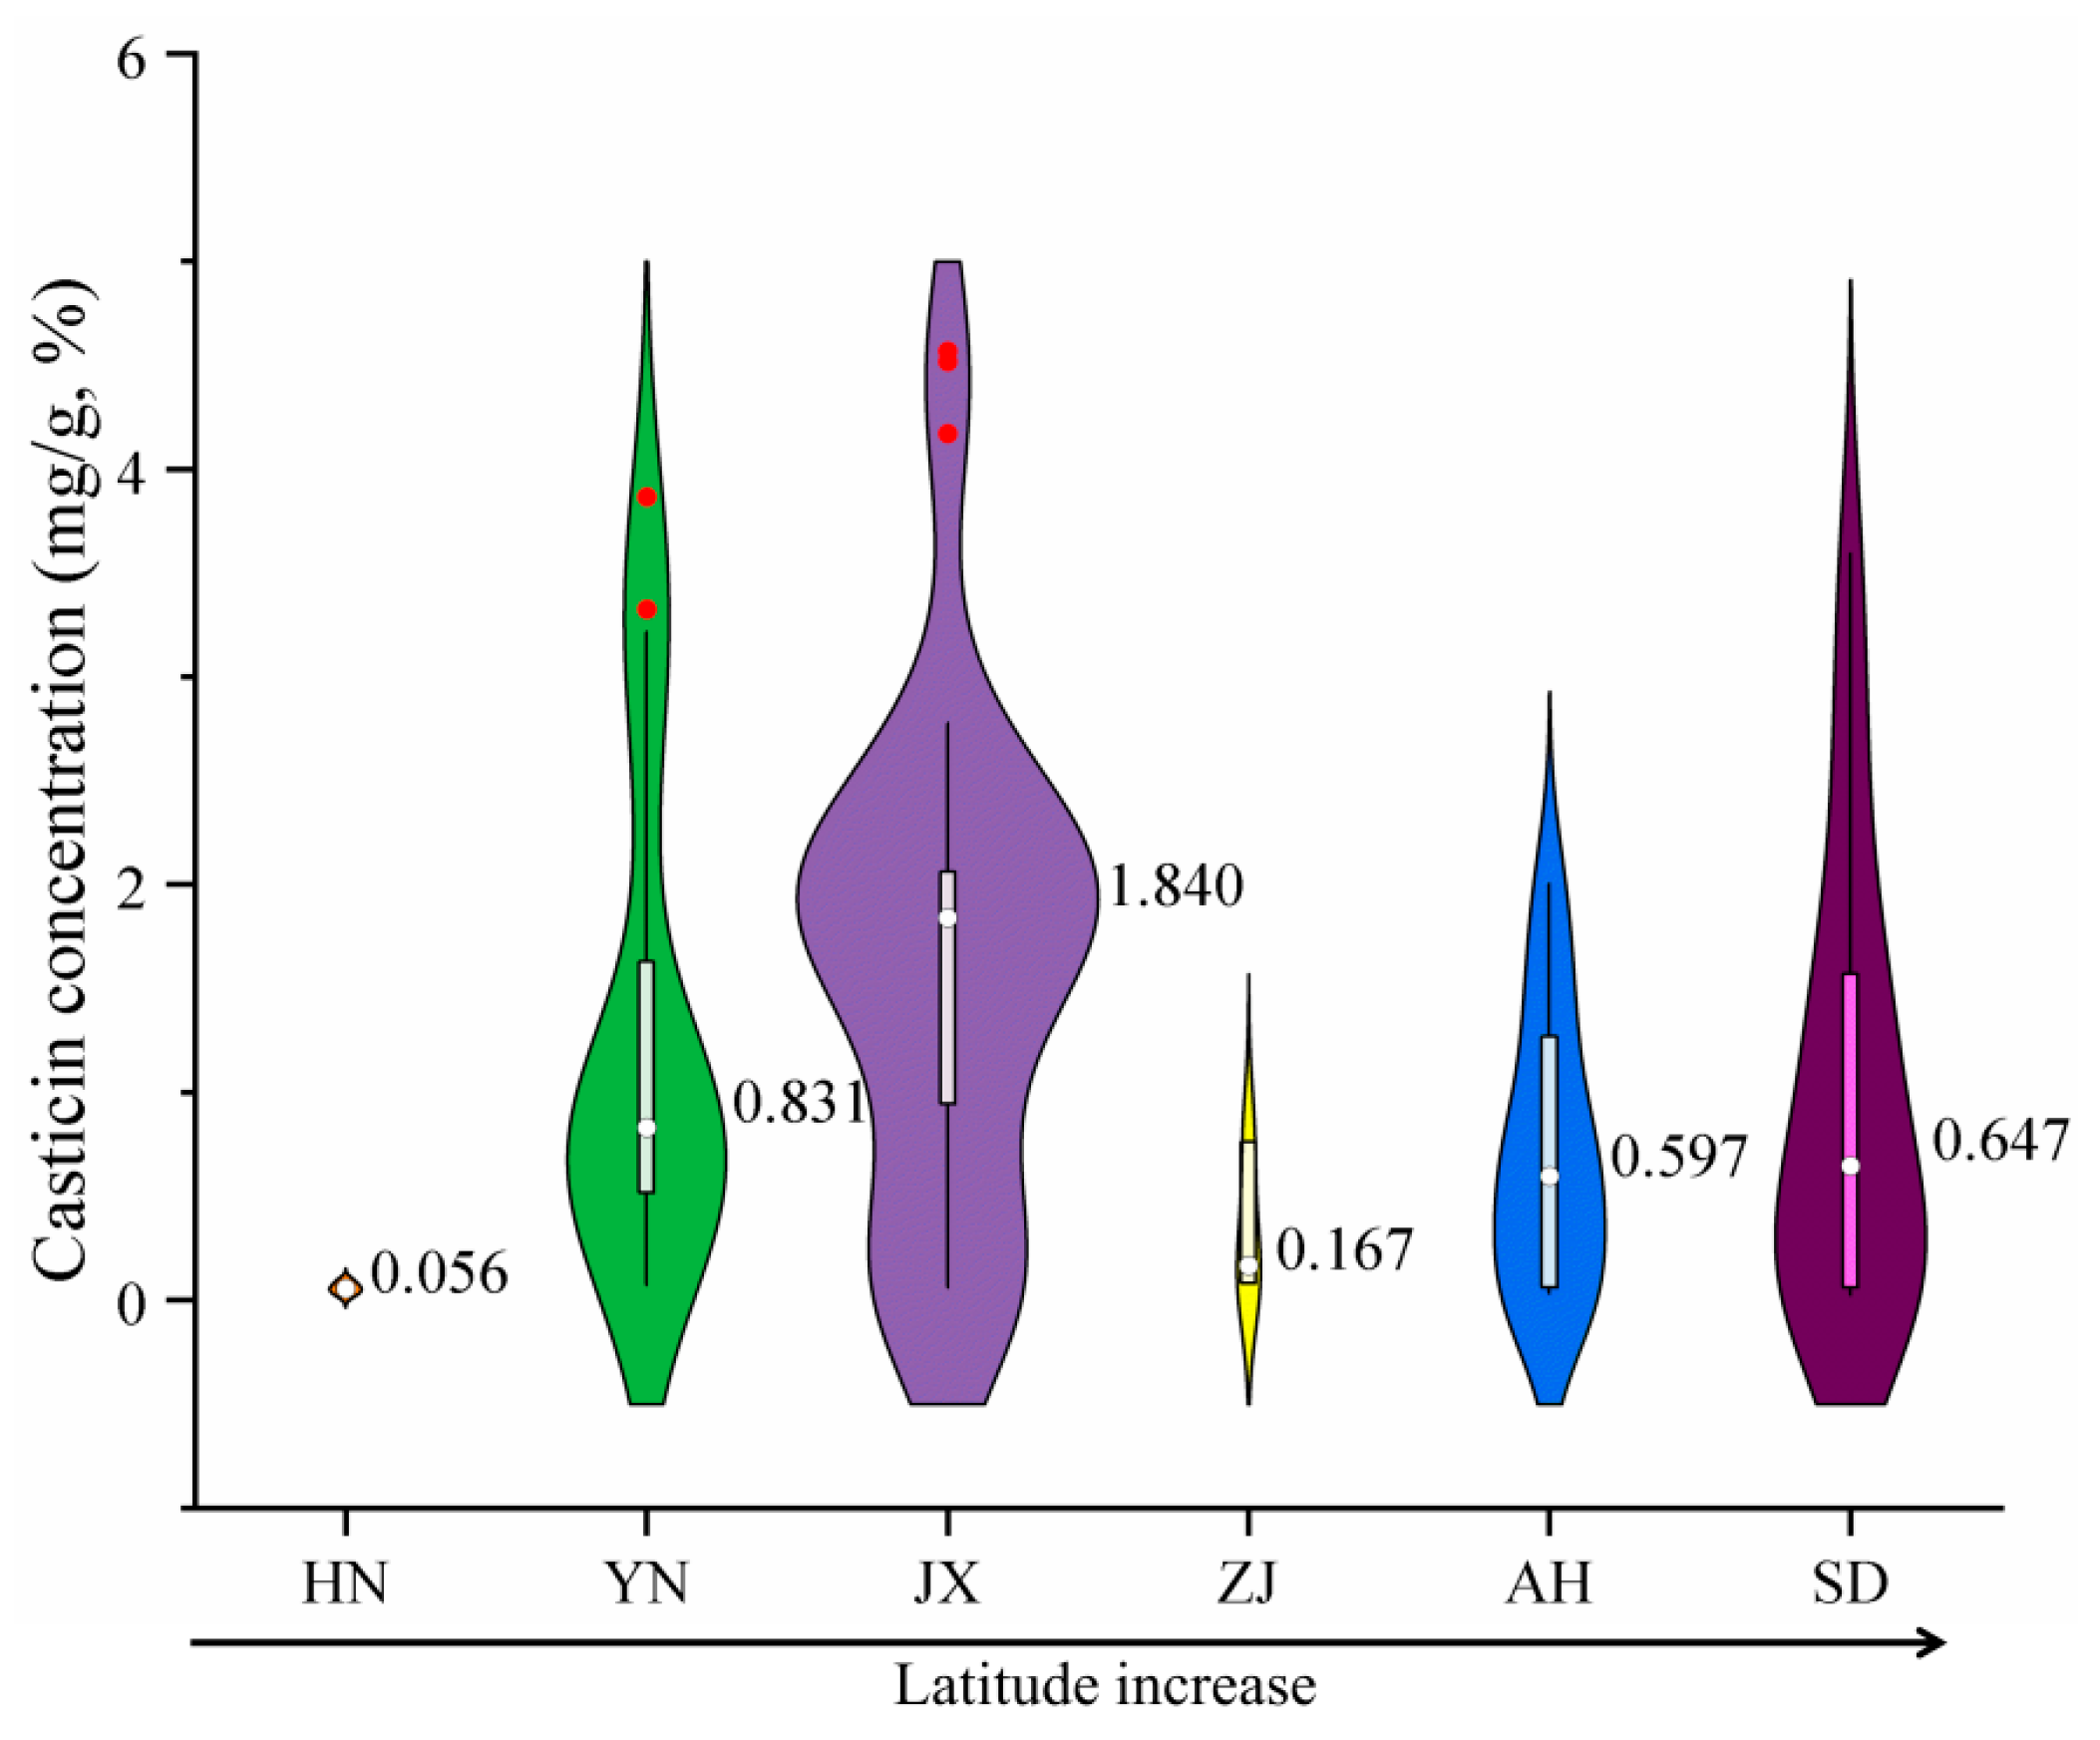
2.2. Special Production Area Priority Identification and Screening of VF

Figure 5a–e present column charts illustrating the content of five kinds of n-alkane wax on the cuticle of VF from various production areas (significance analysis as shown in Table S1). The figures are arranged in descending order based on wax content. The horizontal axis indicates increasing latitude from left to right, with deep brown columns representing dried fruits of Vitex trifolia L. and deep blue columns representing dried fruits of Vitex rotundifolia L. f. Among all wax components, hentriacontane exhibits the highest content. Across all areas, the average content of hentriacontane is 17.6%, which is notably high. The area with the highest hentriacontane content is AH (6.18 mg/cm2), accounting for 28.88% of the total wax content. In contrast, the area with the lowest hentriacontane content is HN (0.58 mg/cm2), accounting for 9.00% of the total wax content. The content from AH is approximately ten times higher than that from HN, highlighting a significant difference between these two areas (Table 4).
For other high-content waxes such as n-tritriacontane, n-pentatriacontane, dotriacontane, and n-tetratriacontane, AH consistently exhibits the highest content, with values of 3.67, 1.35, 0.72, and 0.53 mg/cm2, respectively, accounting for 17.17%, 6.31%, 3.38%, and 2.47% of the total waxes. Conversely, HN consistently exhibits the lowest content, with values of 0.50, 0.23, 0.19, and 0.10 mg/cm2, respectively, accounting for 7.85%, 3.60%, 2.94%, and 1.59% of the total wax content from that area (Table 4).
The ranking of the wax content across various production areas demonstrates similarities, particularly from HN, JX, ZJ, and AH. From these four areas, wax content exhibits a monotonic correlation with latitude. However, YN and SD are quite special. The main reason is the high altitude of the YN area, in contrast to the relatively low altitudes of the other production areas. Additionally, SD is located in northern China and is characterized by a temperate monsoon climate, which results in less precipitation and sunlight compared to the other areas [54,55,56]. The growth environments of Vitex rotundifolia L. f. and Vitex trifolia L. from YN and SD differ significantly from the other four areas, leading to variations in the synthesis and accumulation of waxes on VF. Consequently, this study proposes a method to identify VF from YN and SD. If VFs from YN and SD are present, they will be prioritized for identification and marking. If VF from YN or SD are not present, further identification will be based on the monotonic correlation between wax content and latitude. To achieve this goal, this study aims to find the specific wax components that distinguish VF grown in YN and SD.
This study identified six wax components with the highest content in SD: lignoceric acid, hexacosanol, maslinic acid, beta-amyrin, ursolic acid, and triacontanoic acid. The aim was to identify SD-specific wax components to aid in prioritizing identification of the SD production area (Figure 6, significance analysis as shown in Table S2). Among these six components, three are triterpenoids, suggesting that high-latitude, low-precipitation environments favor the synthesis and accumulation of triterpenoid waxes by VF. Meanwhile, the brown soil in SD (pH 6.5~7.5) is alkaline, which may upregulate genes involved in triterpenoid biosynthesis. Triterpenoids act as antioxidants and stress protectants, playing critical roles in plant adaption to cold winters (frost-free period 200~220 days) and drought conditions (low precipitation) [57,58,59]. The low humidity and large temperature fluctuations in SD further select for triterpenoids, which stabilize cell membranes under thermal stress [60,61]. The contents of lignoceric acid, hexacosanol, beta-amyrin, and triacontanoic acid from SD did not differ significantly from other areas, and they were therefore not considered SD-specific wax components (Figure 6a,b,d,f). In contrast, the content of maslinic acid and ursolic acid from SD showed significant differences compared to other areas (Figure 6c,e). The maslinic acid content was 0.53 mg/cm2, four times higher than that of AH (0.13 mg/cm2), while the ursolic acid content from SD was 0.34 mg/cm2, three times higher than that of the lowest area, ZJ (0.11 mg/cm2). Thus, maslinic acid and ursolic acid can be used as SD-specific wax components for identifying fruit from the SD area.
Additionally, the five wax components with the highest content from YN were identified: hexacosenoic acid, octacosanoic acid, triacontanol, oleanolic acid, and nonacosanoic acid (Figure 7, significance analysis as shown in Table S3). Among these, three are fatty acids, suggesting that high-altitude environments favor the synthesis and accumulation of fatty acid waxes by VF. Among these components, the triacontanol content from YN showed a highly significant difference compared to the other five areas (Figure 7c). High-altitude environments are characterized by strong UV radiation and large diurnal temperature ranges. Triacontanol, with its long carbon chain, enhances the cuticular barrier’s ability to reflect UV radiation and reduce water loss, adapting to YN volcanic ash soil (which drains quickly, increasing drought stress) and lower atmospheric pressure (accelerating transpiration) [51,62]. The volcanic ash soil in YN (pH 5.5~6.8) provides optimal conditions for alcohol-forming enzymes, further promoting triacontanol synthesis. Specifically, the triacontanol content of VF from YN was 0.87 mg/cm2, a value that was undetectable in that from HN, ZJ, and SD, and only 0.04 and 0.13 mg/cm2 in that from JX and AH, respectively. Therefore, triacontanol can be used as a specific wax component for prioritizing the identification of the YN area.
Based on these findings, precise identification can be achieved between the YN and SD regions, which exhibit significant geographical differences. For VF from an unknown production area, the detection of triacontanol, maslinic acid, and ursolic acid waxes should be prioritized. If the triacontanol content exceeds 0.26 ± 0.05 μg/cm2, it can be identified as coming from the YN production area. Similarly, if the maslinic acid and ursolic acid contents exceed 0.53 ± 0.23 μg/cm2 and 0.26 ± 0.05 μg/cm2, respectively, the sample can be identified as coming from the SD production area.

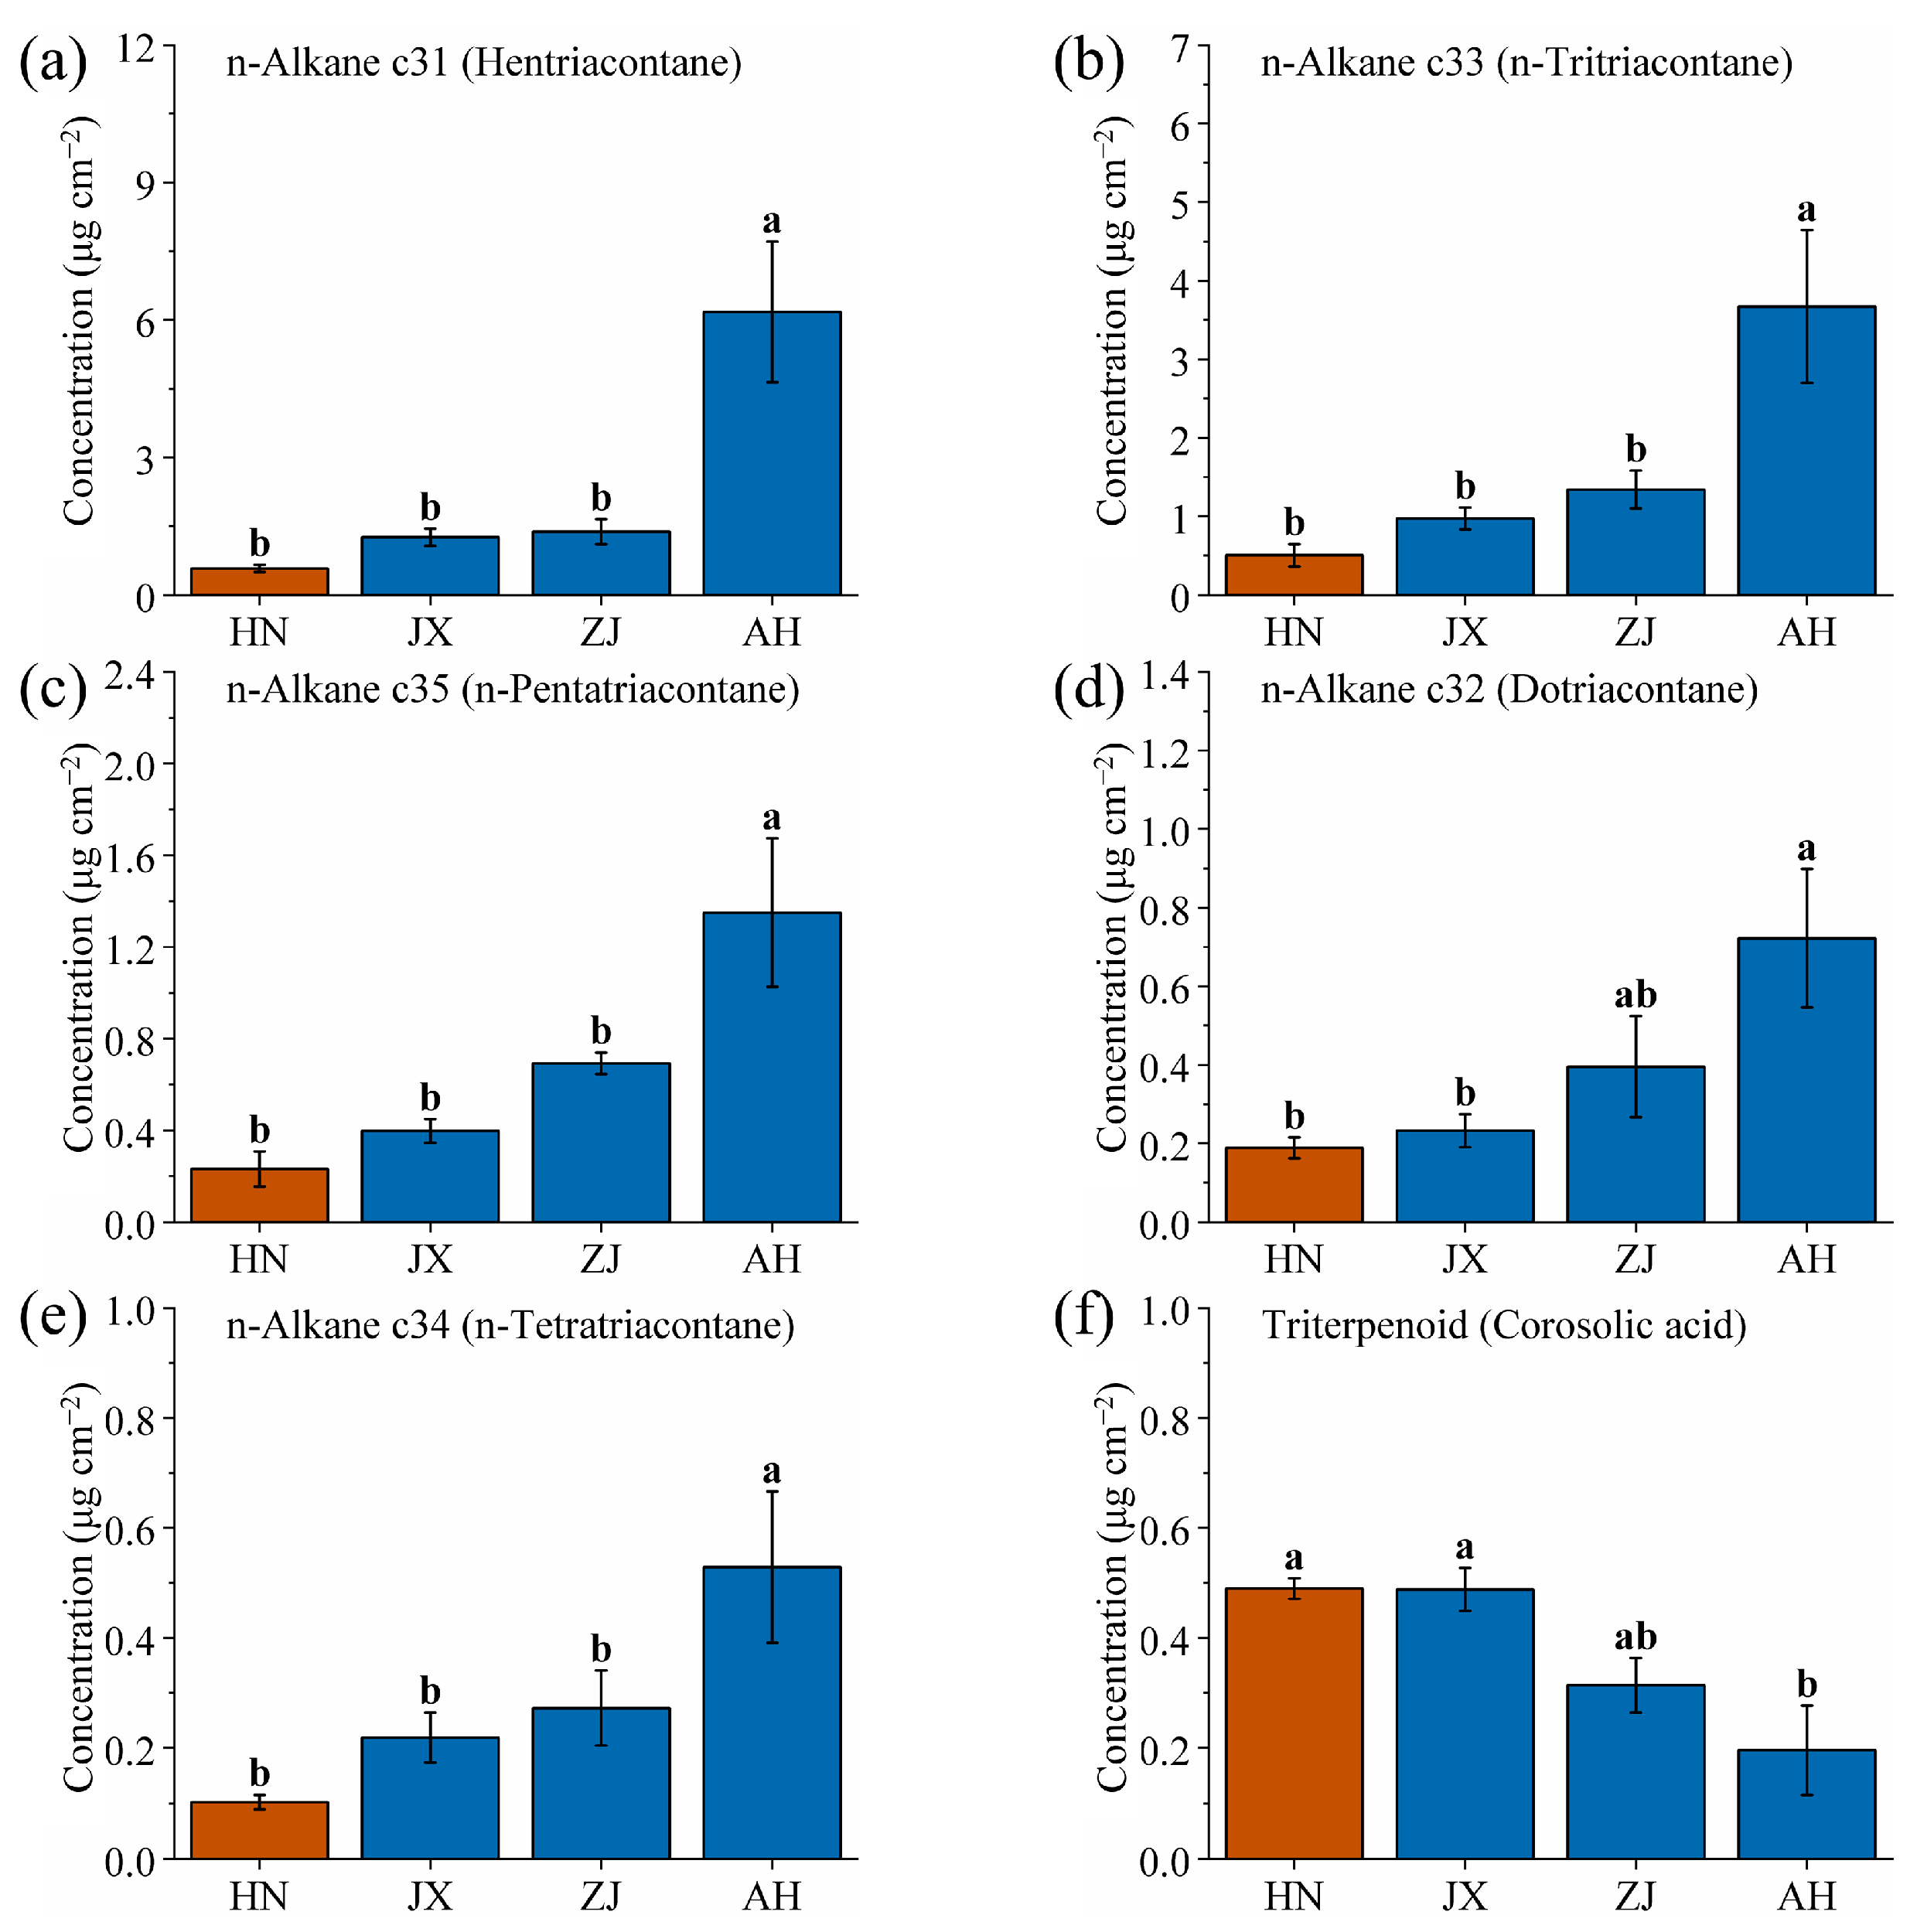
2.3. Search for the Relationship Between VF Production Area and Latitude

After identifying the SD and YN production areas, this study plotted the n-alkane wax content of VF from the HN, JX, ZJ, and AH production areas in a column chart (Figure 8). The horizontal axis and color block representations are consistent with those of Figure 6. As the value on the horizontal axis increases, the content of n-alkane waxes also increases. Specifically, the content of hentriacontane, n-tritriacontane, n-pentatriacontane, dotriacontane, and n-tetratriacontane of VF increases monotonically with latitude across these production areas. HN (19.25° N) has a tropical climate (24~26 °C) and acidic laterite soil, leading to low n-alkane production—high temperatures accelerate transpiration, but excessive wax would trap heat, so plants minimize n-alkanes [44]. JX (27.12° N) and ZJ (28.97° N) have subtropical climates (17~19 °C, 1400~1600 mm precipitation) with red soil (pH 4.5~6.0). Moderate temperatures and rainfall here balance wax synthesis: n-alkanes increase to reduce water loss during seasonal dry periods but remain lower than in higher latitudes. AH (30.53° N), with a temperate climate (15~17 °C) and neutral soil, has the highest n-alkane content, as cooler temperatures reduce the risk of overheating, allowing plants to invest more in n-alkanes for winter water retention [63]. Additionally, the uniform increase in n-alkane wax content with latitude across different production areas may be related to the co-evolution of VF [64].
Furthermore, an inverse relationship was observed between the triterpenoid corosolic acid and the five n-alkane wax components (Figure 8f). The content of triterpenoid corosolic acid decreases with increasing latitude. This trend is likely due to a direct correlation between synthesis and conversion of n-alkanes and triterpenoids in the wax biosynthesis pathway of VF, where the synthesis of n-alkane waxes may inhibit synthesis of corosolic acid, or vice versa [65,66,67]. This trade-off reflects environmental adaptation: in high-latitude areas (e.g., AH), plants prioritize n-alkanes for physical protection (water retention, cold resistance) due to moderate precipitation, while in low-latitude areas (e.g., HN), higher corosolic acid levels combat oxidative stress from high humidity and UV radiation, as the need for chemical defense outweighs physical barrier reinforcement.
The monotonic correlation between the wax components (hentriacontane, n-tritriacontane, n-pentatriacontane, dotriacontane, n-tetratriacontane, and corosolic acid) of VF and the latitude of the production area is crucial for establishing a model that links wax content with latitude. This model can facilitate determination of the latitude and production area of VF by analyzing the wax content.

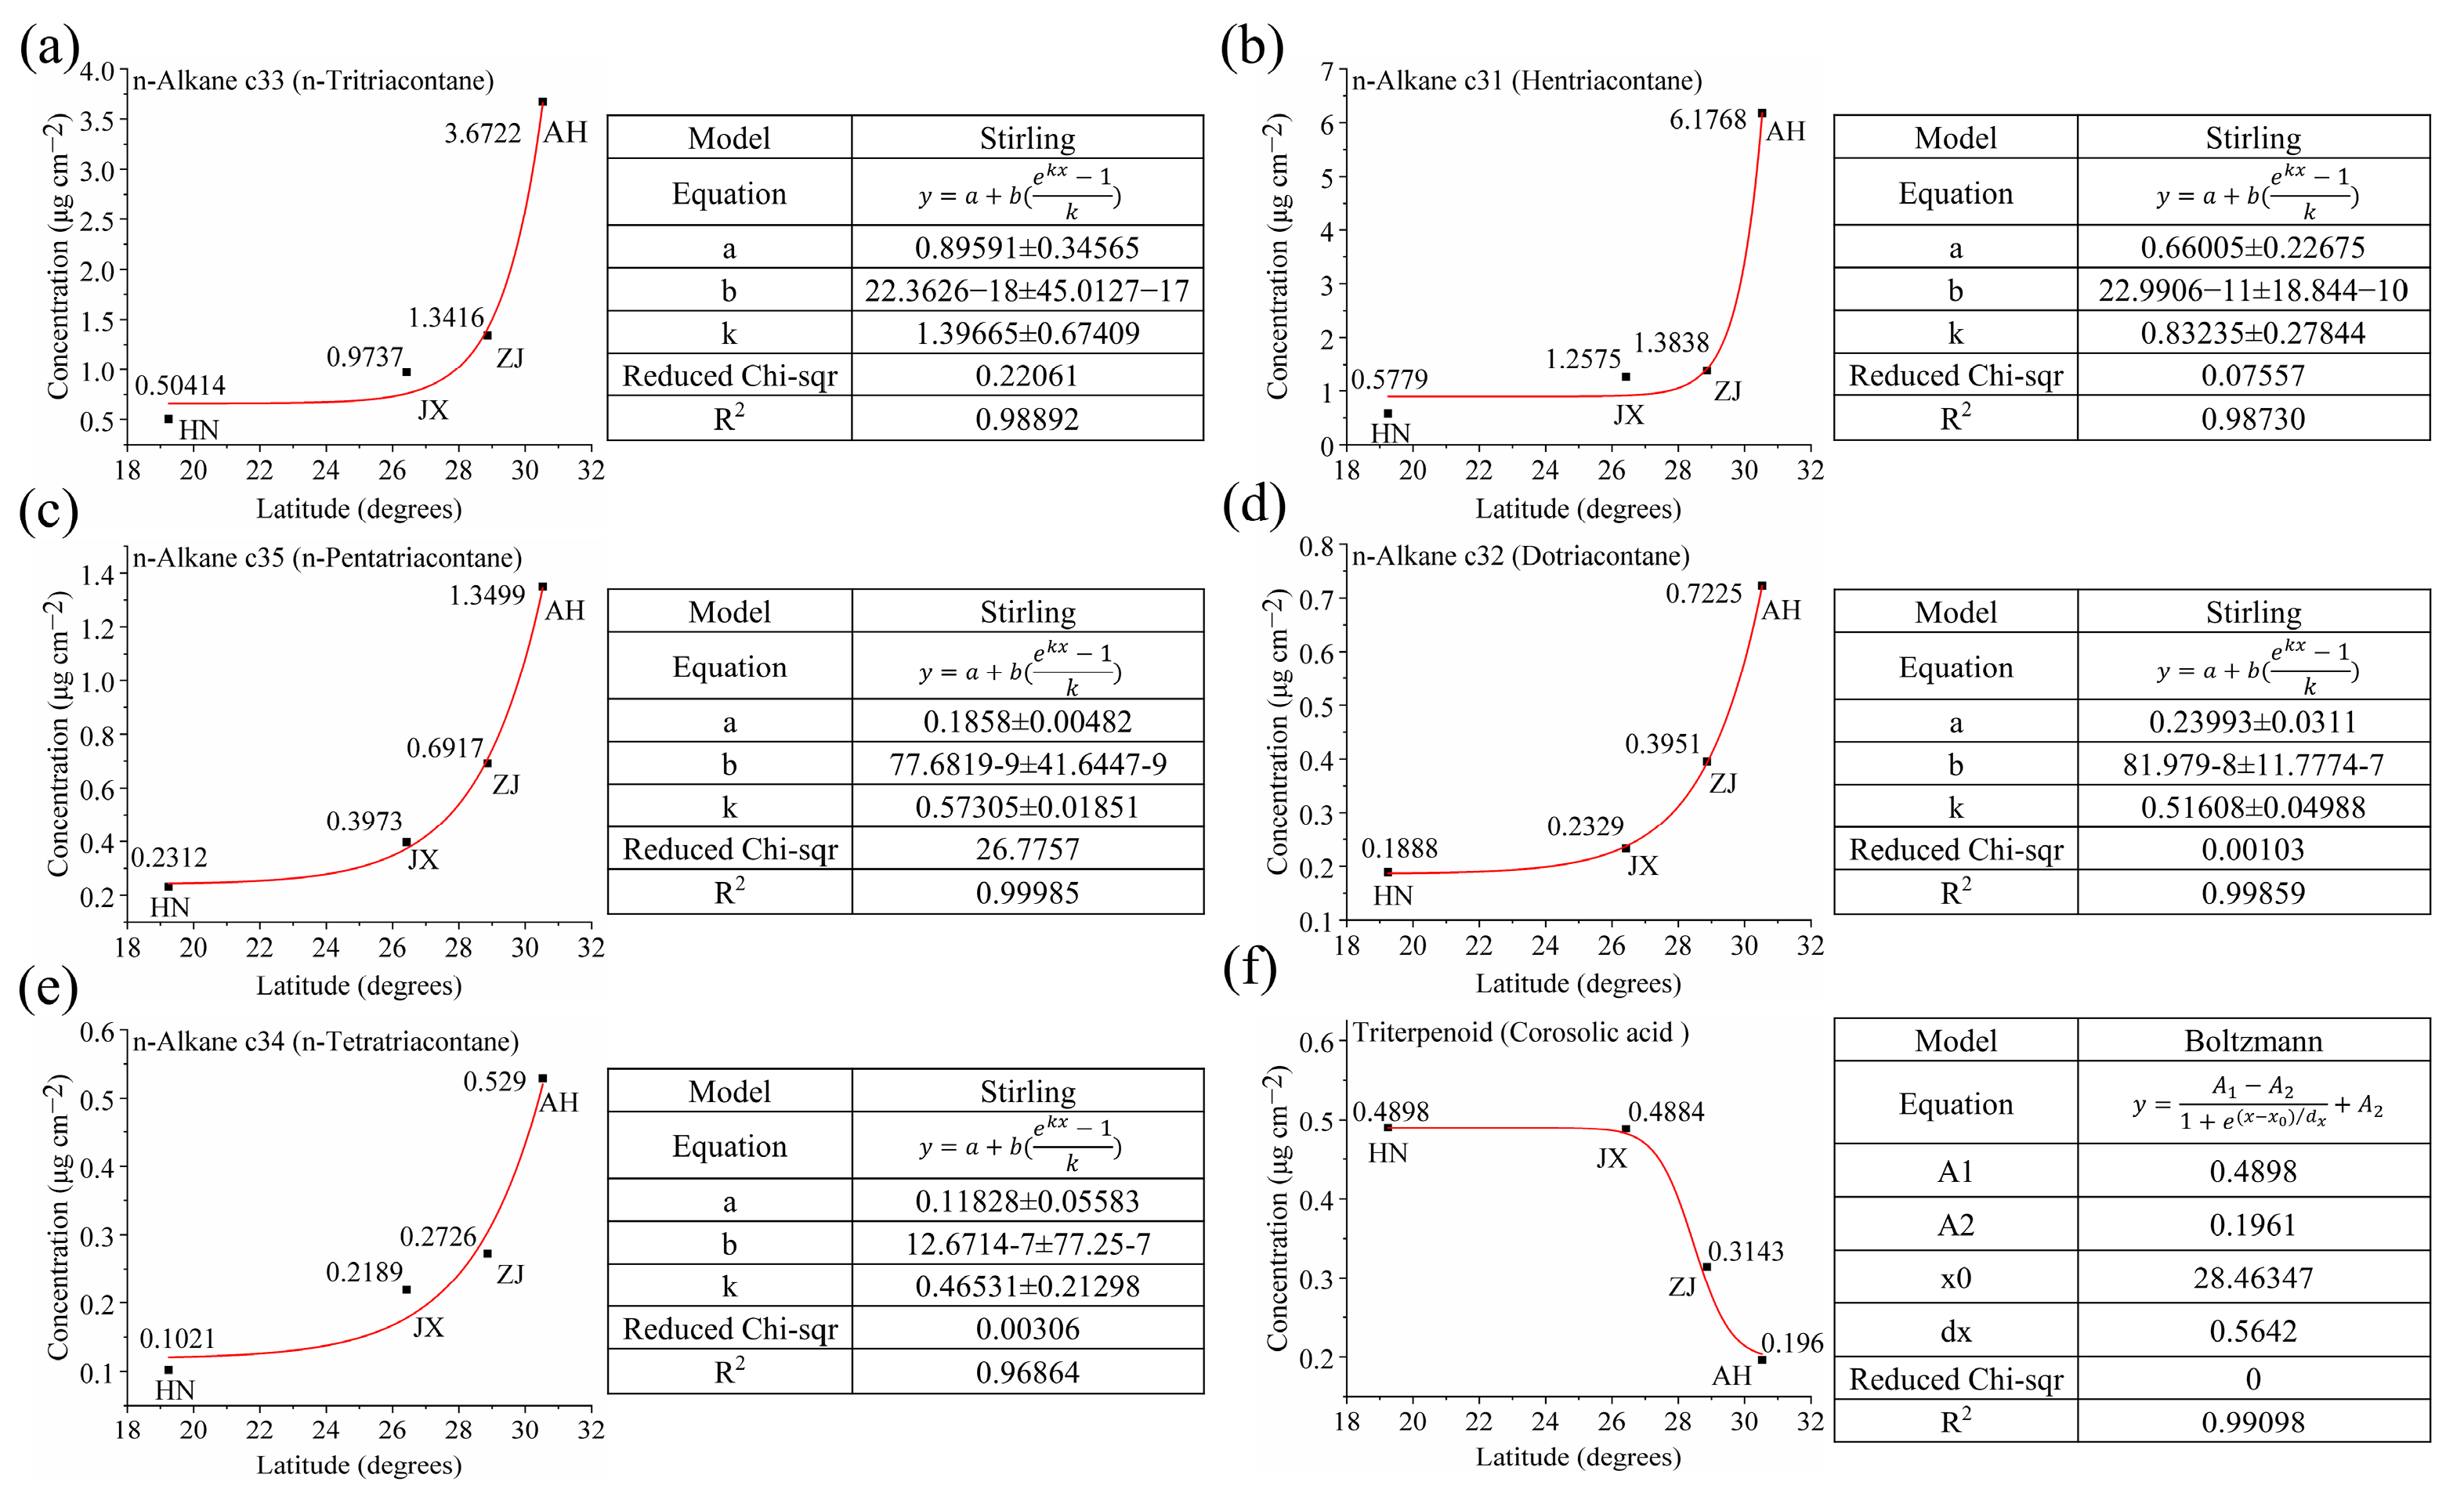
2.4. Establishment of a Model of the Relationship Between Single-Component Waxes and Latitude That Can Be Used to Identify the VF Production Area

In this study, Origin 2024 was used to perform non-linear fitting of the six wax components (hentriacontane, n-tritriacontane, n-pentatriacontane, dotriacontane, n-tetratriacontane, and corosolic acid) against latitude (Figure 9).
Non-linear exponential models were selected over linear or polynomial fits based on the biological context of wax accumulation, which often follows saturation kinetics. Environmental factors act as “signals” to activate wax biosynthesis enzymes (e.g., fatty acid elongases), functioning analogously to the “substrate” component in saturation kinetics. When environmental stress at higher latitudes exceeds a threshold level, the activity of these enzymes stabilizes, resulting in diminished acceleration of wax accumulation and ultimately exhibiting characteristic saturation phenomena. Additionally, residual analysis confirmed that exponential models minimized heteroscedasticity and improved R2 values compared to linear alternatives.
The fitting process was iterated until the R2 value reached its maximum, or up to 1000 iterations, to ensure accuracy. The resulting regression equations for the six wax components are as follows:
y 1 = 0.89591 + ( 22.3626 18 ) ( e x p 1.39665 x 1 ) / 1.39665
y 2 = 0.66005 + ( 22.9906 11 ) ( e x p 0.83235 x 1 ) / 0.83235
y 4 = 0.1858 + ( 77.6819 9 ) ( e x p 0.57305 x 1 ) / 0.57305
y 3 = 0.23992 + ( 81.979 8 ) ( e x p 0.51608 x 1 ) / 0.51608
y 5 = 0.11828 + ( 12.6714 7 ) ( e x p 0.46531 x 1 ) / 0.46531
y 6 = 0.2937 / ( 1 + e x p ( x 28.46347 ) / 0.5642 ) + 0.1961
x represents the latitude of the VF production area, and y16 represent the wax content of hentriacontane, n-tritriacontane, n-pentatriacontane, dotriacontane, n-tetratriacontane, and corosolic acid, respectively. The R2 values of regression Equations (1)~(6) are 0.98892, 0.98730, 0.99859, 0.99985, 0.96864, and 0.99098, respectively, indicating that the model accurately fits the data.
Furthermore, we transpose the model’s x and y, resulting in the following equations:
y = 0.716 I n ( ( 1.22513 1.39665 x 1 ) / 22.3626 )
y = 1.20142 I n ( ( 0.54939 0.83235 x 2 ) / 22.9906 )
y = 1.93768 I n ( ( 0.12382 0.51608 x 3 ) / 81.979 )
y = 1.74505 I n ( ( 0.10647 0.57305 x 4 ) / 77.6819 )
y = 2.1491 I n ( ( 0.05503 0.46531 x 5 ) / 12.6714 )
y = 0.5642 I n ( 1 0.2937 / ( x 6 0.1961 ) ) + 28.46347
x16 represent the wax contents of hentriacontane, n-tritriacontane, n-pentatriacontane, dotriacontane, n-tetratriacontane, and corosolic acid to be determined for identification of the VF production area, while y represents the latitude of the VF production area.
For the VF from an unknown production area, if it is not identified as originating from SD or YN, the wax contents are analyzed individually according to models (7)~(12) [63,68,69]. By measuring any of the wax components (hentriacontane, n-tritriacontane, n-pentatriacontane, dotriacontane, n-tetratriacontane, or corosolic acid), the content of the wax component is substituted into the relevant model to predict the latitude of the production area. Combining these latitude data allows for accurate identification of the VF production area.

2.5. Establishment of a Model of the Relationship Between Multi-Component Waxes and Latitude That Can Be Used to Identify the VF Production Area

In addition, R Studio (4.4.1 version) was utilized to perform global fitting on the content of five wax components (hentriacontane, n-tritriacontane, n-pentatriacontane, dotriacontane, and n-tetratriacontane) to facilitate identification and verification of the VF production area based on multi-component wax profiles.
The content of five wax components (hentriacontane, n-tritriacontane, n-pentatriacontane, dotriacontane, and n-tetratriacontane) was plotted in a scatter matrix, where a1 represents hentriacontane, a2 represents n-tritriacontane, a3 represents n-pentatriacontane, a4 represents dotriacontane, and a5 represents n-tetratriacontane. The data exhibit good normal distribution, and latitude positively correlates with wax content. After fitting the data, the final R2 value obtained was 0.6943, indicating relatively low model accuracy. Significance analysis identified a group of variables that negatively impacted prediction of the dependent variable, contributing to large fitting errors. To improve model accuracy, a heat-map was used to visualize the correlation between the data and latitude, helping to identify and exclude data groups that negatively affected the model (Figure 10a). The weakest correlation was observed between a3 and latitude, as indicated by the lightest color block. Additionally, PCA was performed on all subsets of the five wax components (Figure 10b). The PCA results showed that the combinations closest to the blue line (slope of 1) were a1-a2-a4-a5 and a1-a2-a3-a4-a5, further confirming that a3 differs significantly from the other data groups. This suggests that removing the a3 data would enhance the regression model’s accuracy.
After removing the a3 data, the a1, a2, a4, and a5 data were assessed. The final R2 obtained was 0.7375, indicating that removing the a3 data helps improve the accuracy of the regression model. Therefore, the regression model relating the wax content of VF to the latitude of the production area can be obtained.
y = 18.773 6.797 x 1 + 14.581 x 2 36.341 x 4 + 49.22 x 5
x15 represent the content of hentriacontane, n-tritriacontane, n-pentatriacontane, dotriacontane, and n-tetratriacontane, respectively, and y represents the latitude of the VF production area. According to this model, identification of the VF production area can be achieved using multi-component waxes.
For VF from unknown production areas, after identifying the specific production areas and confirming that the sample are not classified as being from SD or YN, multi-component wax analysis based on model (15) can be performed. The wax components (hentriacontane, n-tritriacontane, n-pentatriacontane, dotriacontane, and n-tetratriacontane) are detected from the unknown sample, and their contents are substituted into model (15) to estimate the latitude of the production area. By combining latitude data, the production area of the VF can be accurately determined.

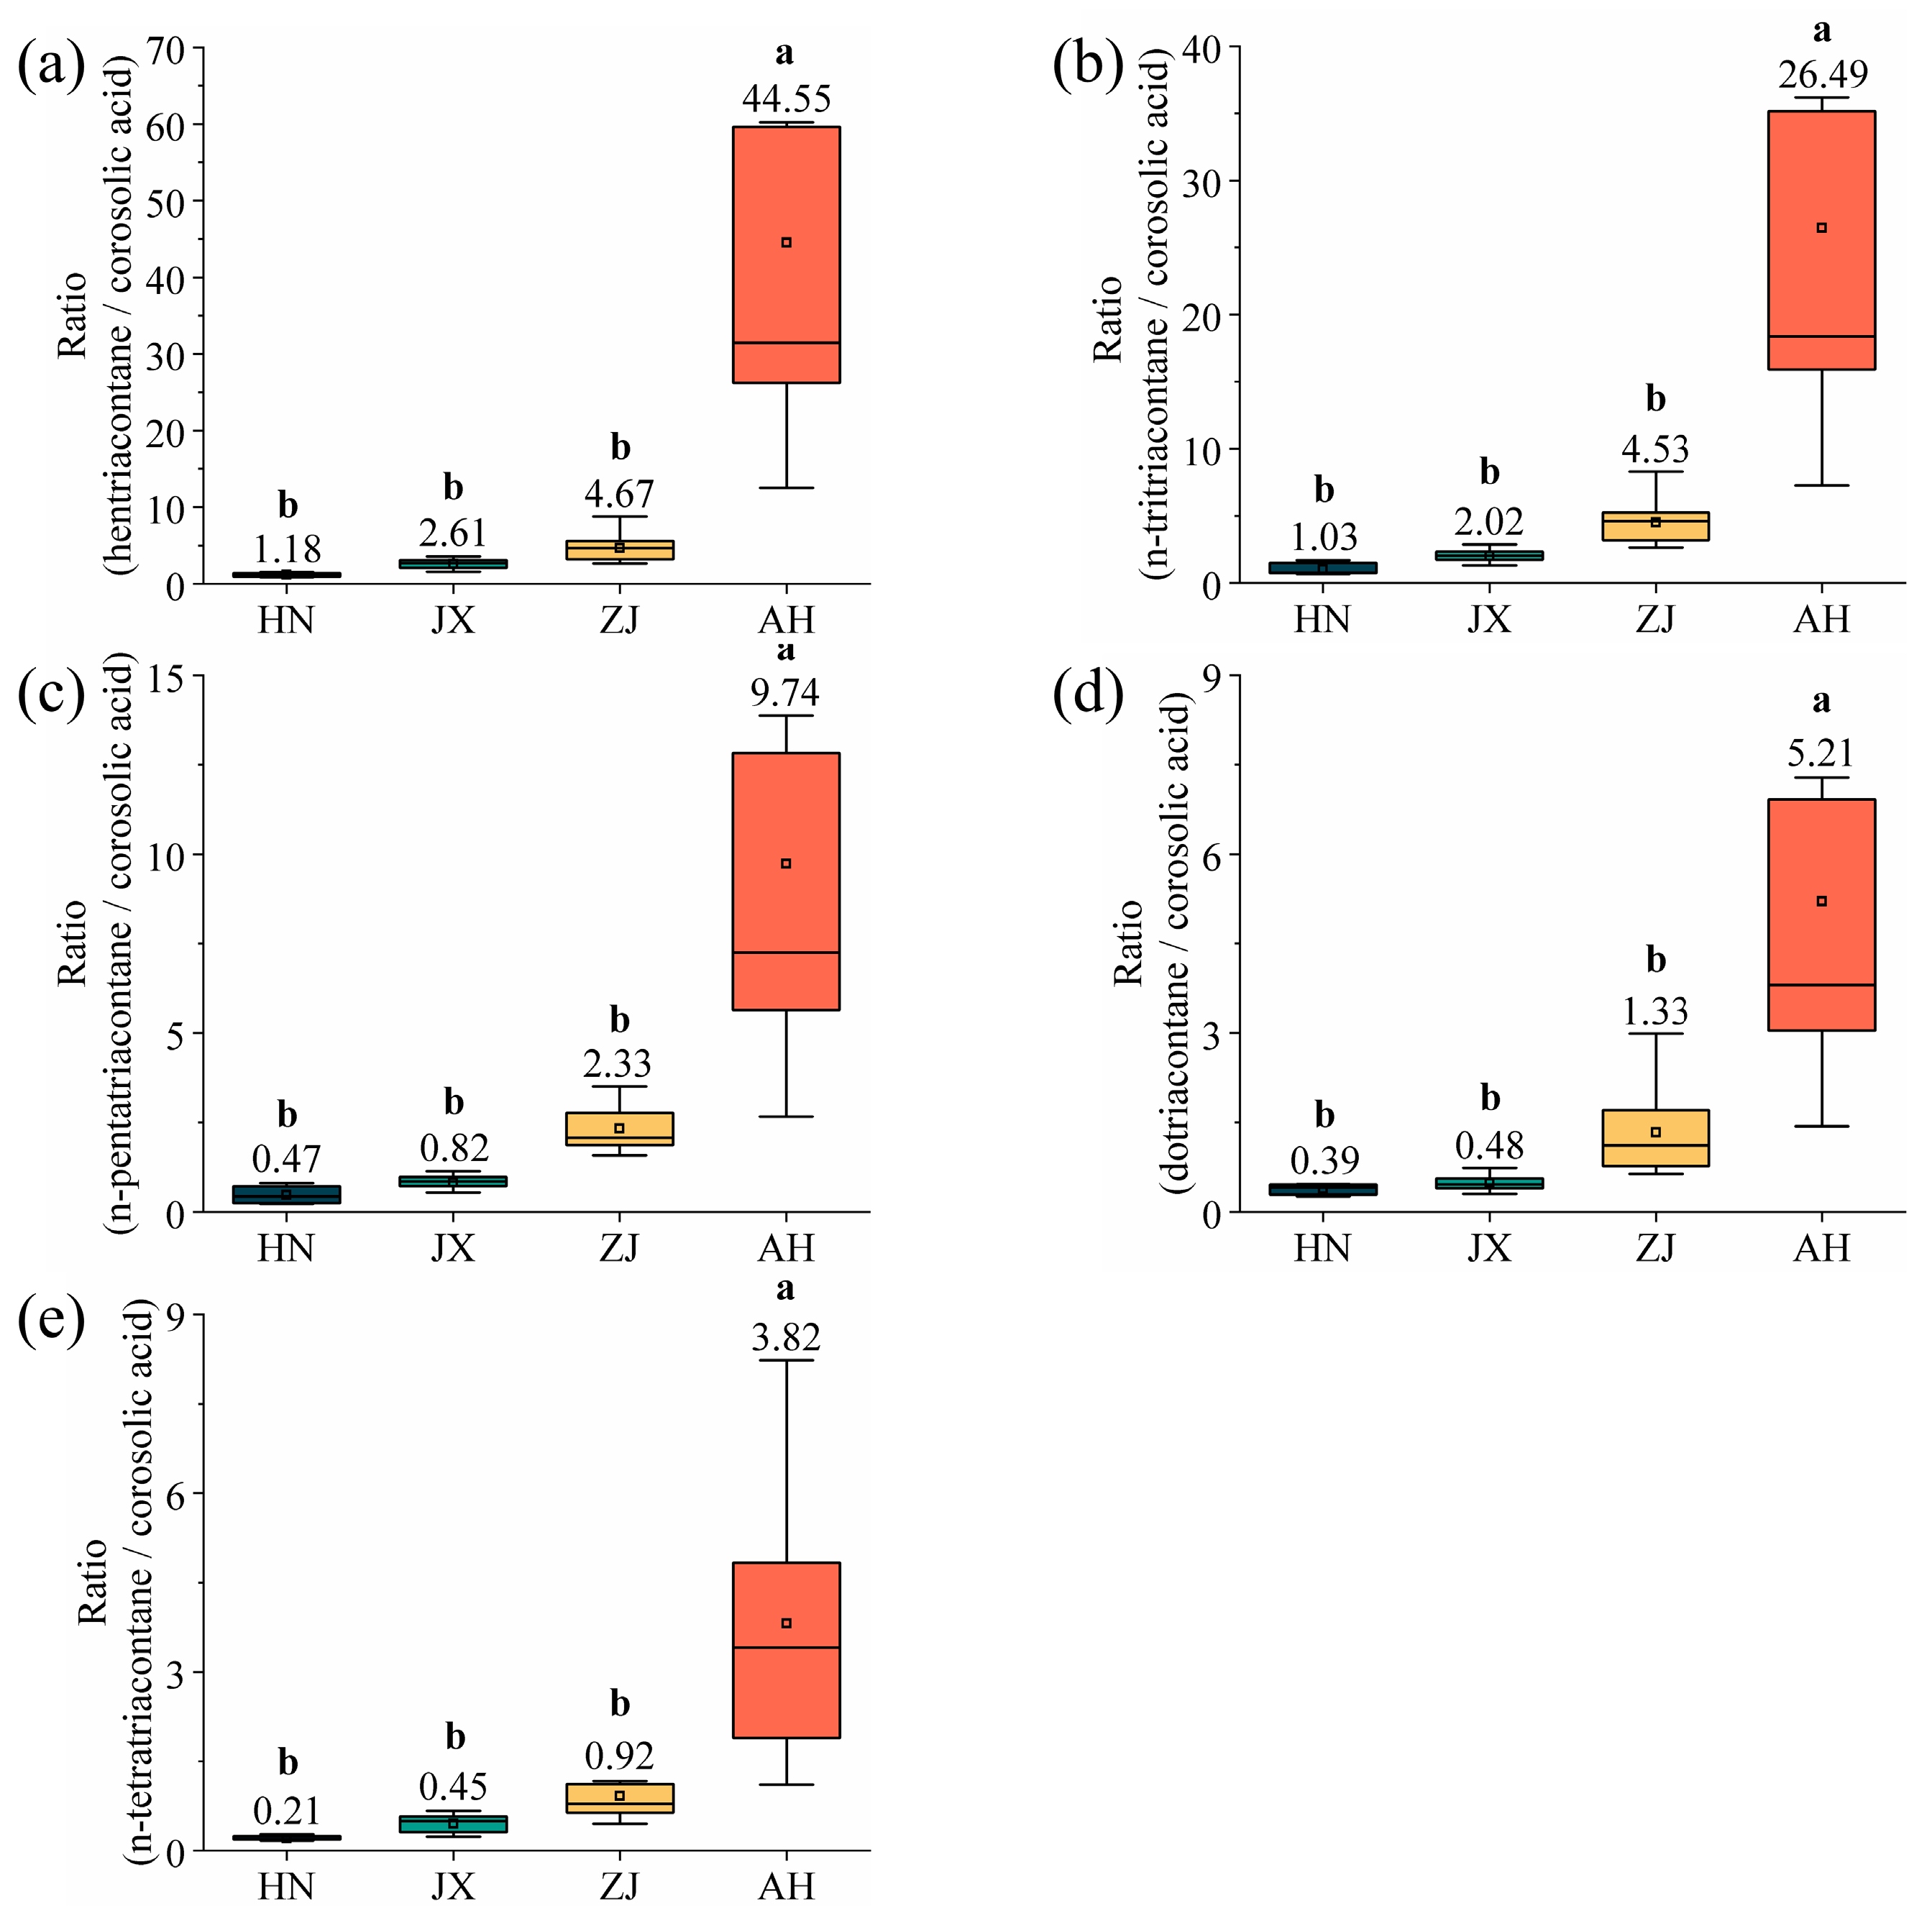
2.6. Identification of the Production Area of VF Using the Multi-Component Wax Ratio

This study calculates the ratio of the wax components (hentriacontane, n-tritriacontane, n-pentatriacontane, dotriacontane, and n-tetratriacontane), whose contents increase monotonically with latitude, relative to corosolic acid, whose content decreases monotonically with latitude (Figure 11). This ratio is employed to more accurately determine the VF production area from multiple perspectives. The results reveal significant differences in the wax (hentriacontane, n-tritriacontane, n-pentatriacontane, dotriacontane, and n-tetratriacontane)-to-corosolic acid ratio among VF sample from various production areas, establishing it as an effective auxiliary method for production area identification. For VF from unknown production areas, i.e., not classified as SD or YN, the contents of hentriacontane, n-tritriacontane, n-pentatriacontane, dotriacontane, n-tetratriacontane, and corosolic acid can be detected to determine its production area. The formula is as follows:
k 1 5 = x 1 5 / y
x15 represent the hentriacontane, n-tritriacontane, n-pentatriacontane, dotriacontane and n-tetratriacontane content, y represents the corosolic acid content, and k15 represent the ratio of multiple-component waxes.
The production area of VF can be determined based on the values of k1, k2, k3, k4, and k5. When k1 is 1.18 ± 0.06, k2 is 1.03 ± 0.05, k3 is 0.47 ± 0.02, k4 is 0.39 ± 0.02, and k5 is 0.21 ± 0.01, the production area is identified as HN. If k1 is 2.61 ± 0.13, k2 is 2.02 ± 0.10, k3 is 0.82 ± 0.04, k4 is 0.48 ± 0.02, and k5 is 0.45 ± 0.02, the production area is determined to be JX. When k1 is 4.67 ± 0.23, k2 is 4.53 ± 0.23, k3 is 2.33 ± 0.12, k4 is 1.33 ± 0.07, and k5 is 0.92 ± 0.05, the production area corresponds to ZJ. Lastly, when k1 is 44.55 ± 2.23, k2 is 26.49 ± 1.32, k3 is 9.74 ± 0.49, k4 is 5.21 ± 0.26, and k5 is 3.82 ± 0.19, the production area is identified as AH.

2.7. Investigate the Relationship Between Cuticular Waxes and VF Quality by Internal Metabolites

Using LC-MS, a total of 2786 metabolites were identified in the internal metabolism of VF. Based on previous research on the medicinal compounds of VF and other commonly used Chinese medicines, 10 classes of compounds with notable pharmacological effects and flavors were selected (phenols, quinolines and derivatives, flavonoids, isoflavonoids, coumarins and derivatives, morphinans, 3,4-dihydrocoumarins, organic acids, protopine alkaloids, and protoberberine alkaloids and derivatives), amounting to 93 components (Table S4). Previous studies have shown that VF from JX is of the highest quality among all production areas. Consequently, 19 metabolites from the JX production area were further screened from the 93, and they had significantly higher levels than those from other sources, marked as M1–M19 (highlighted in yellow in Table S4).
A correlation heat-map analysis was conducted to assess the relationship between the high-content metabolites from the JX source and the wax components (Figure 12). The horizontal data indicate that the wax components—eicosanoic acid, n-triacontane, dotriacontanol, beta-amyrin, and alpha-amyrin—are represented by larger and darker circles, suggesting a strong positive correlation with the metabolites. Specifically, the higher the content of these wax components of VF, the higher the content of the primary medicinal compounds within the fruit.
Additionally, we combine the vertical data with five wax components—hentriacontane, n-tritriacontane, n-pentatriacontane, dotriacontane, and n-tetratriacontane—that show a monotonic correlation with latitude, and these components are highlighted in red (Figure 12). The results reveal that metabolite M6 (myricetin) exhibits the strongest positive correlation with these five wax components, which also show distinct latitude-dependent distribution patterns.
Further analysis reveals that the strong correlation between cuticular waxes and internal metabolites may arise from both shared metabolic precursors and the plant’s environmental adaptation needs. The significant positive correlation between n-triacontane and myricetin (M6) (Figure 12) is likely due to their common precursor, acetyl-CoA. In high-latitude areas, plants synthesize long-chain waxes by utilizing acetyl-CoA to enhance the fatty acid elongation pathway, while concurrently upregulating the phenylpropanoid pathway to promote flavonoid biosynthesis [70,71,72,73]. n-Triacontane reinforces the cuticular barrier to mitigate UV radiation damage, whereas myricetin acts as an intracellular antioxidant to scavenge reactive oxygen, forming a synergistic “external barrier—internal scavenging” mechanism to better adapt to high-latitude conditions characterized by intense UV radiation and winter cold stress [74,75]. In contrast, low-latitude plants exhibit lower cuticular wax content but higher flavonoid levels, likely due to preferential resource allocation to internal antioxidants for oxidative stress defense rather than extensive wax production in hot, humid climates. Meanwhile, soil pH also influences this balance, with neutral soils (typical of high-latitude areas) promoting triterpenoid-associated metabolites more efficiently than acidic soils (common in low-latitude areas) [76].
Moreover, the association of hentriacontane, n-tritriacontane, n-pentatriacontane, dotriacontane, and n-tetratriacontane with multiple bioactive metabolites suggests that these wax components may function as signaling molecules to activate downstream metabolic pathways. Previous studies have demonstrated that triterpenoids can coordinately regulate both wax biosynthesis and flavonoid accumulation through modulation of the MYB transcription factor family [77,78]. This coordinated mechanism likely represents an adaptive strategy developed by Vitex trifolia L. and Vitex rotundifolia L. f. during long-term geographic expansion, whereby synergistic adjustments in cuticular waxes and internal metabolites optimize adaptation efficiency across diverse climatic zones.

3. Materials and Methods

3.1. Reagents

Chloroform was purchased from General-Reagent (Shanghai, China). Pyridine, tetracosane, anhydrous sodium sulfate, N,O-Bis (trimethylsilyl) trifluoroacetamide (BSTFA), and 2-chloro-L-phenylalanine were obtained from Aladdin (Shanghai, China). Acetonitrile and methanol were sourced from Thermo (Loughborough, UK), while formic acid was supplied by TCL (Shanghai, China), and ammonium formate was supplied by Sigma (Shanghai, China). Nitrogen gas was procured from Liufang Industrial Gas Co., Ltd. (Suzhou, China).

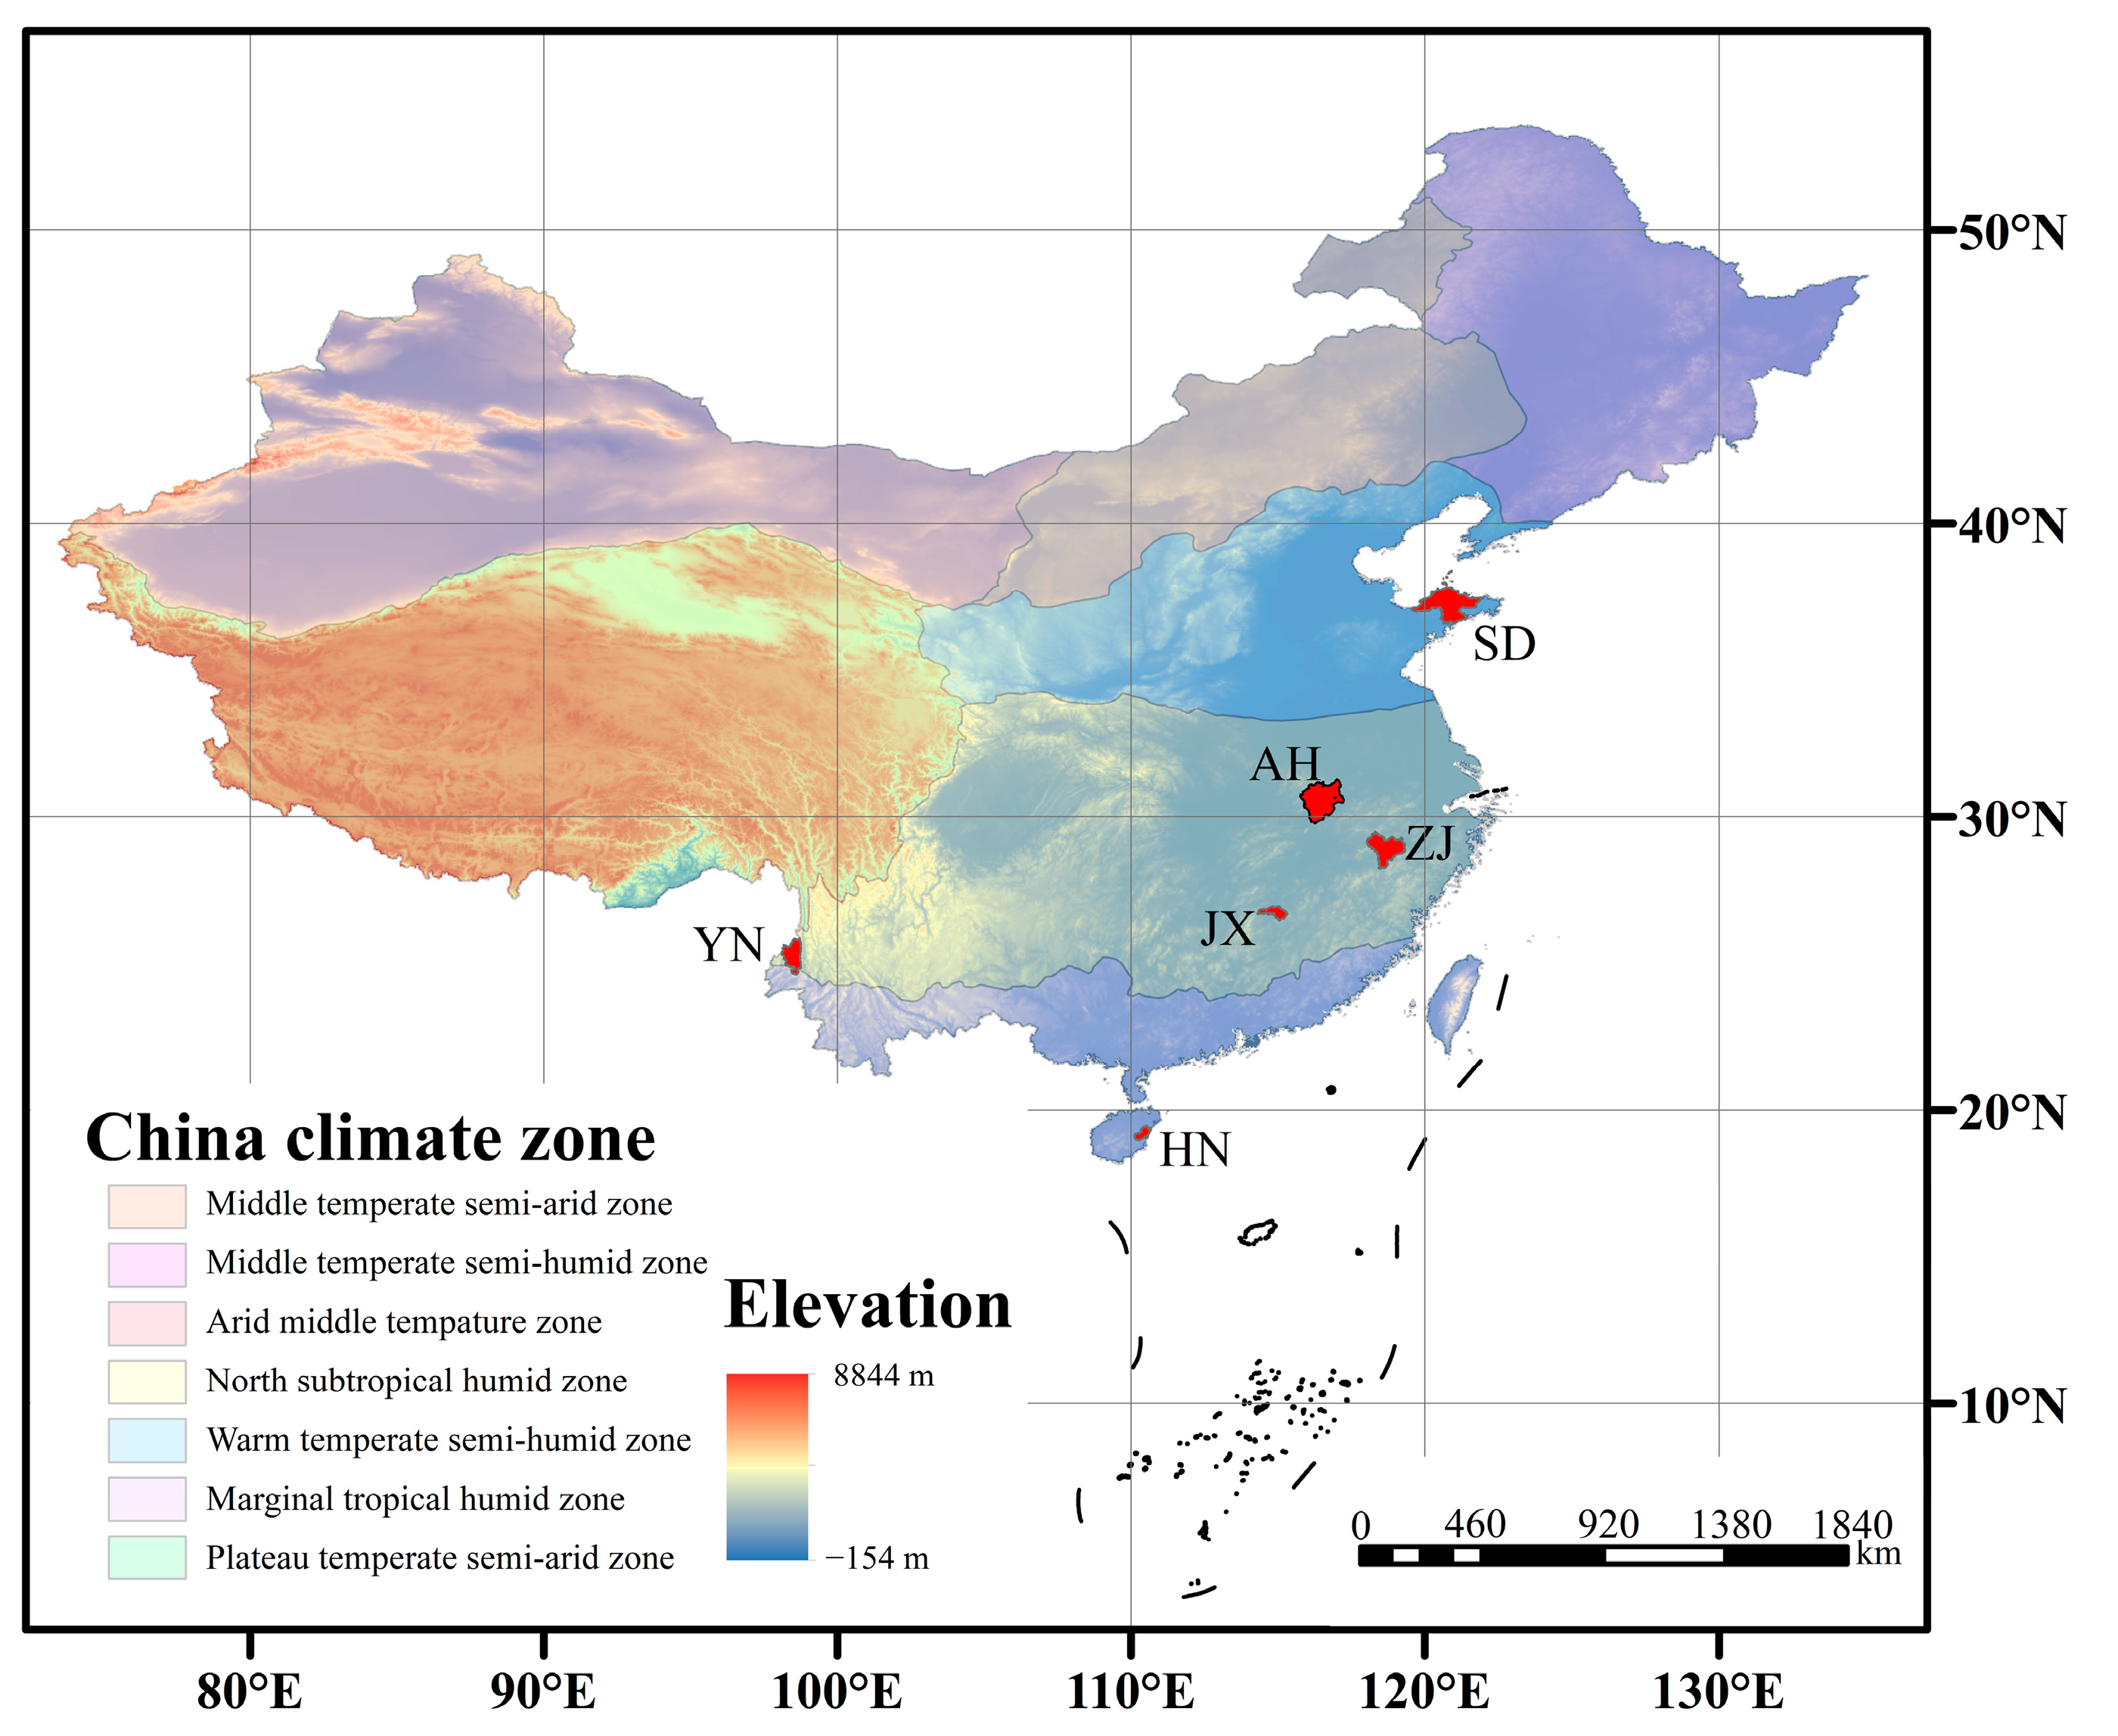
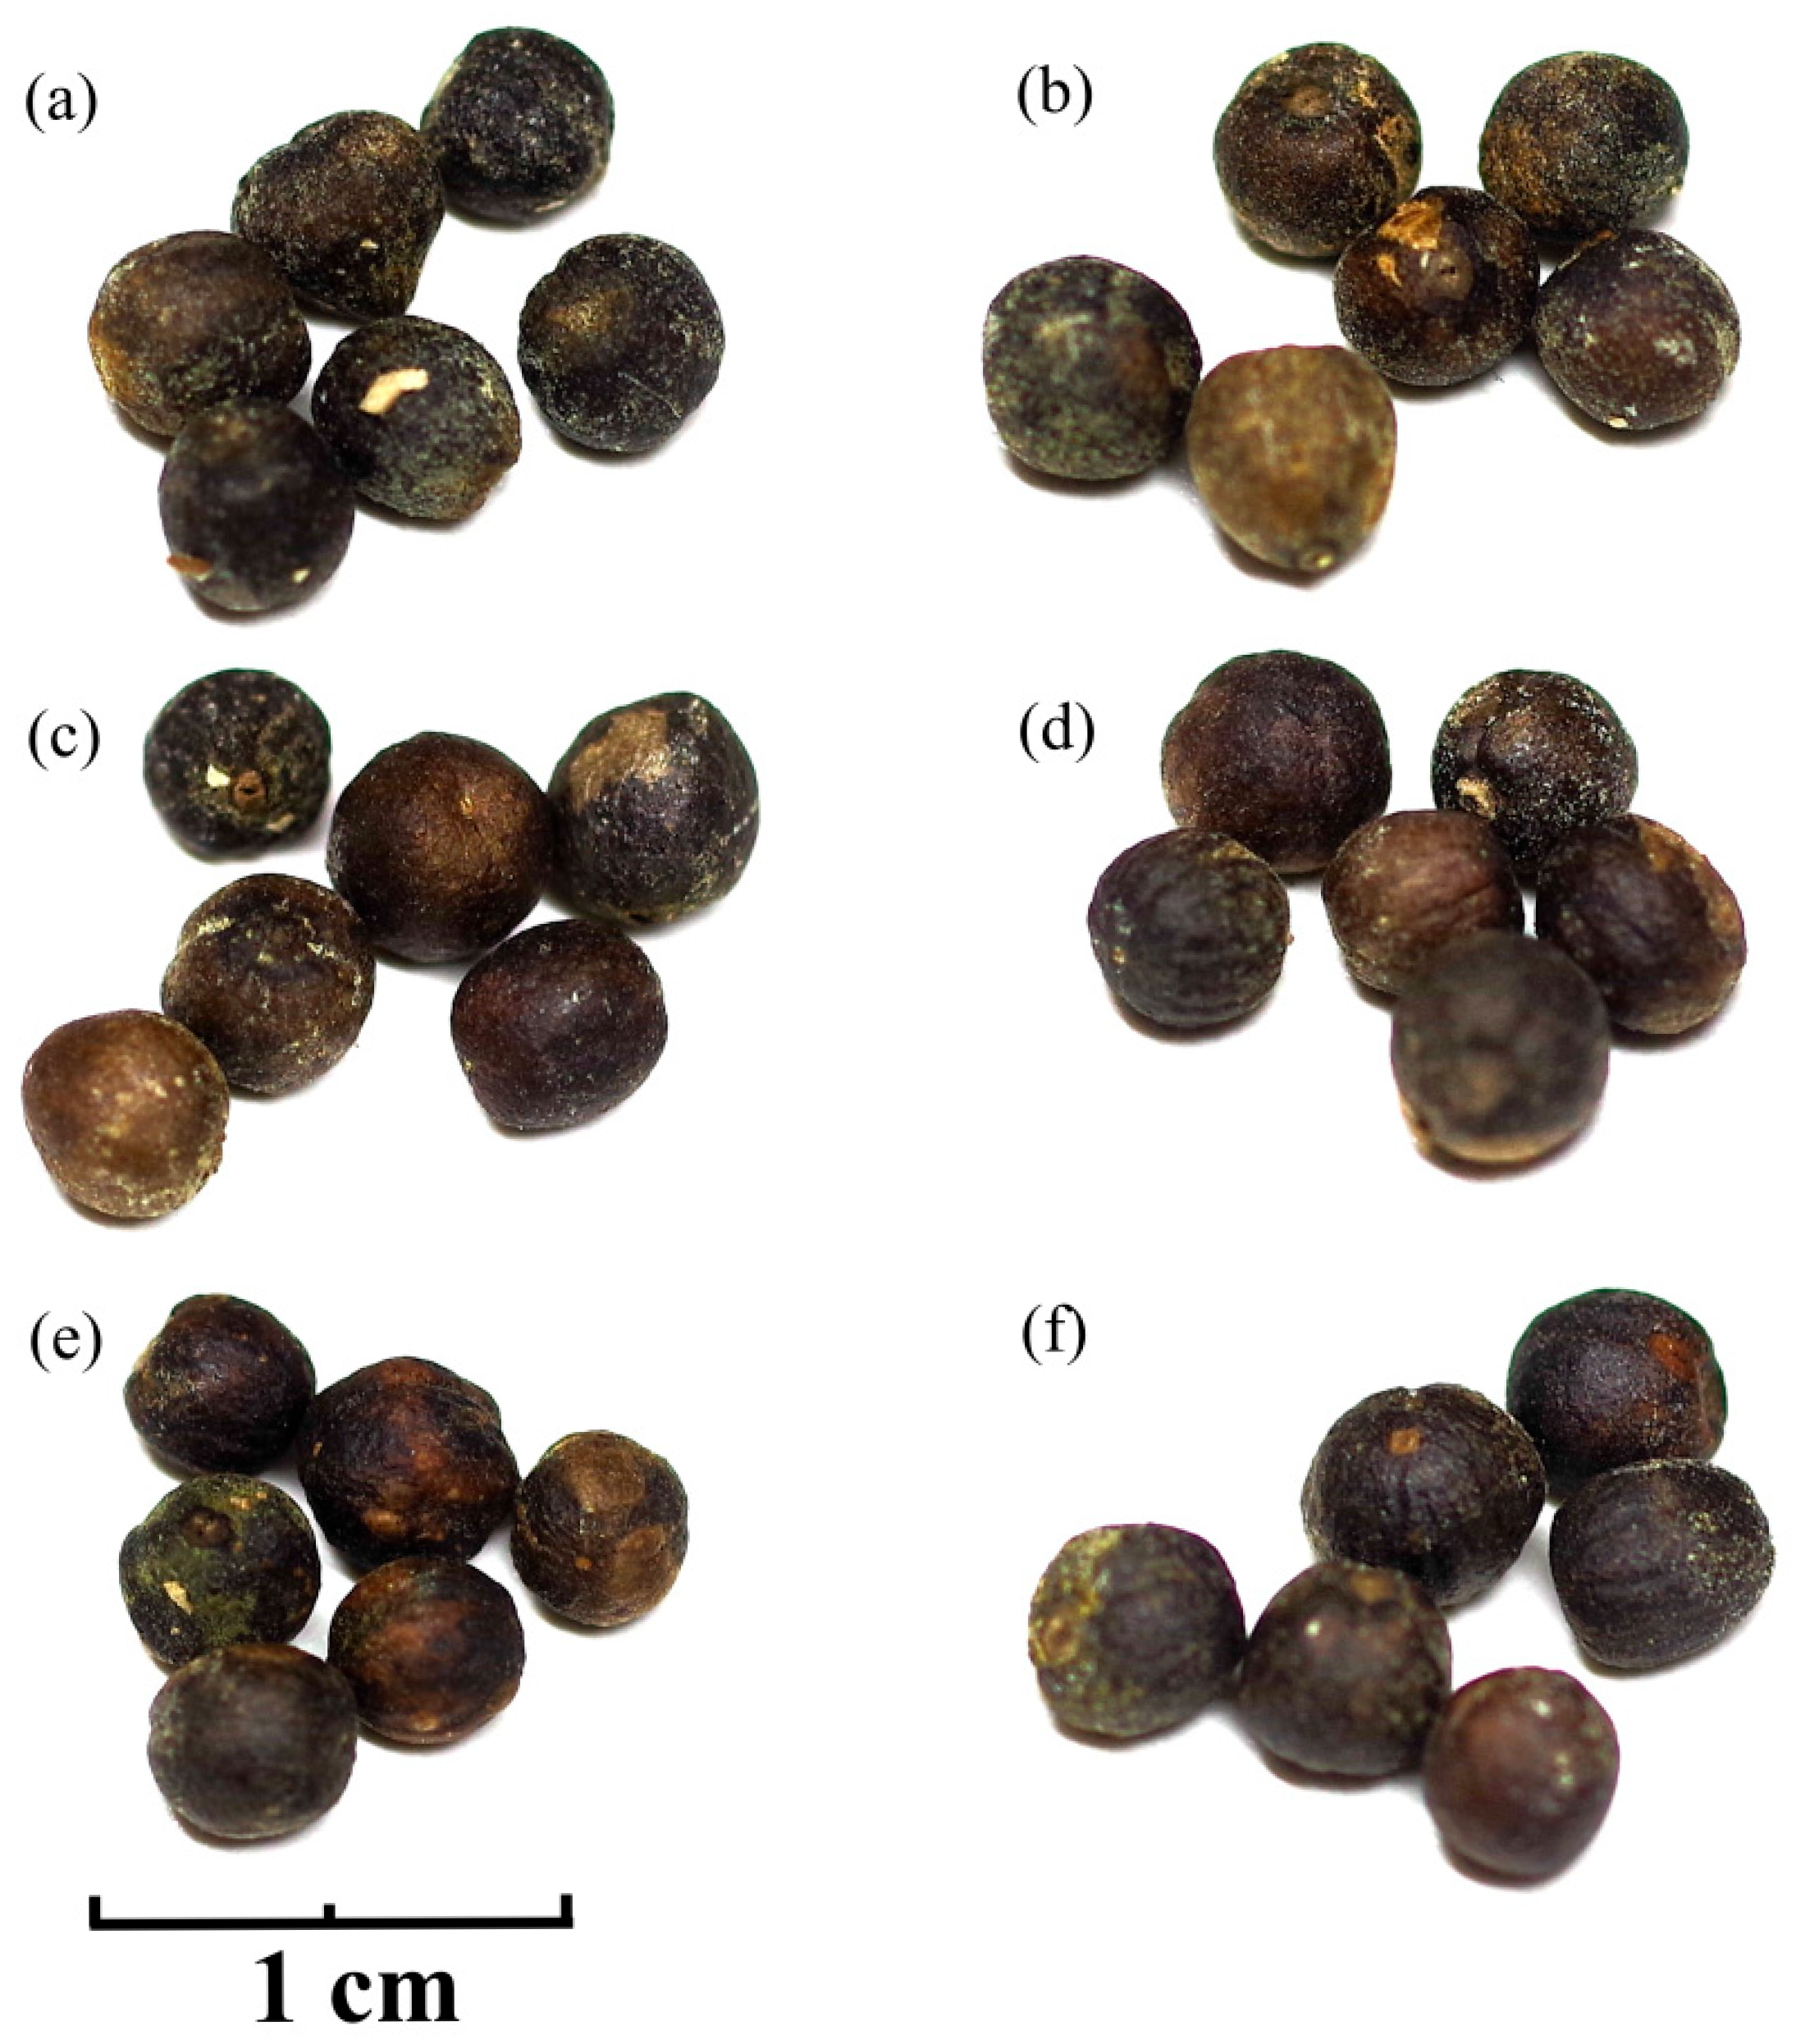
3.2. Selection of VF Sample for Cuticular Wax Extraction

VF was harvested from six major production areas in China: Qionghai City, Hainan Province (from Vitex trifolia L. in mid-June 2024), Tengchong City, Yunnan Province (from Vitex trifolia L. in early July 2024), Ji’an City, Jiangxi Province (from Vitex rotundifolia L. f. in mid-July 2024), Quzhou City, Zhejiang Province (from Vitex rotundifolia L. f. in late July 2024), Anqing City, Anhui Province (from Vitex rotundifolia L. f. in early August 2024), and Yantai City, Shandong Province (from Vitex rotundifolia L. f. in mid-August 2024). The plants from these production areas had been growing in stable environments for several years, yielding medium-sized VF. Sample from these areas were labeled as HN, YN, JX, ZJ, AH, and SD, respectively (Figure 13).
Soil and climate indicators of the different sampling sites as shown in Table 2. The latitude and altitude data were sourced from Google Earth (https://earth.google.com, accessed on 5 July 2025). The soil type and soil pH data were obtained from the Institute of Soil Science, Chinese Academy of Sciences (http://issas.cas.cn, accessed on 5 July 2025) and World Soil Information (ISRIC)—SoilGrids (https://soilgrids.org, accessed on 5 July 2025). The climate data were derived from China Meteorological Data Network (http://data.cma.cn, accessed on 6 July 2025) and National Climate Center (http://cmdp.ncc-cma.net, accessed on 6 July 2025).
After harvesting, the VF sample were dried at 45 °C and stored in a cool environment. Each batch was divided into three subgroups, with six undamaged fruits selected from each subgroup for cuticular wax extraction. The diameter of each VF was measured using a caliper (both transverse and longitudinal diameters were recorded three times each) to calculate the cuticular area based on a spherical model.
For wax extraction, each subgroup was immersed in 6 mL of chloroform for 2 min. Anhydrous sodium sulfate (1 g) was added to the extract, and impurities were removed using neutral filter paper. The extract was then dried with nitrogen gas to obtain the dried wax. The dried wax was dissolved and derivatized in pyridine and N,O-Bis (trimethylsilyl) trifluoroacetamide (BSTFA) at 70 °C for 30 min. Finally, the sample was diluted with chloroform and analyzed using GC-MS [79].

3.3. GC-MS Detection of Wax Extracts

GC-MS analysis was performed using a gas chromatograph equipped with a mass spectrometric detector (m/z 50–750, MSD 5975; Agilent Technologies, Santa Clara, USA) and a capillary column (30 m × 0.32 mm, DB-1 ms, 0.1 μm film; J&W Scientific, Agilent Technologies, Santa Clara, USA). A 1 μL aliquot of each sample was injected into the system. The chromatographic temperature program was set as follows: an initial temperature of 50 °C, held for 2 min, followed by a ramp of 40 °C/min to 200 °C, held for 2 min, increased at 3 °C/min to 320 °C, and maintained at 320 °C for 30 min [80,81,82].
Retention times were compared and evaluated using the Wiley 10th/National Institute of Standards and Technology (NIST) 2017 Mass Spectral Library and LipidWeb data (https://www.lipidhome.co.uk, accessed on 12 October 2024). Peak intensity signals were segmented and normalized based on internal standards, with an RSD > 0.3. After normalization, redundant signals were removed, and peak merging was performed to generate a refined data matrix [83]. The obtained GC-MS data were then used to determine the wax content. This information, combined with the measured cuticular area, was utilized to calculate the wax content per unit cuticular area for wax scales from different production areas. The formula is as follows:
s = 4 Π r 2
c = m / ( s 1 + s 2 + s 3 + s 4 + s 5 + s 6 )
where r represents the average value of the transverse and longitudinal diameter of the VF (cm), s represents the cuticular area of the VF (cm2), s16 represent the cuticular areas of six VF in each group (cm2), m represents the mass of wax components in different groups (μg), and c represents the wax concentration per unit cuticular area of the VF—that is, the wax content on the cuticle of the VF (μg/cm2).

3.4. Internal Metabolomics LC-MS Detection of VF

Quantitative VF sample were placed in a 2 mL centrifuge tube, followed by the addition of 600 µL of methanol and 2-chloro-L-phenylalanine (4 ppm). The mixture was stirred thoroughly to ensure proper pre-treatment. The pre-treated sample was then transferred to a tissue grinder and homogenized for 1 min at a frequency of 55 Hz. After resting at room temperature for 15 min, the sample was centrifuged at 12,000 rpm for 10 min. The resulting supernatant was filtered through a 0.22 μm membrane to obtain the final liquid sample for analysis. The prepared sample was subsequently analyzed using liquid chromatography–mass spectrometry (LC-MS, Thermo Fisher Scientific, Waltham, MA, USA) [84,85].
LC analysis was performed using a Vanquish UHPLC System (Chromeleon, version: 7.3.2, Thermo Fisher Scientific, Waltham, USA). Chromatographic separation was conducted on an ACQUITY UPLC® HSS T3 column (2.1 × 100 mm, 1.8 µm; Waters, Milford, MA, USA) maintained at 40 °C. The flow rate was set at 0.3 mL/min, with an injection volume of 2 μL.
For LC-ESI (+)-MS analysis, the mobile phase consisted of (B2) 0.1% formic acid in acetonitrile (v/v) and (A2) 0.1% formic acid in water (v/v). The gradient program was as follows: 0~1 min, 8% B2; 1~8 min, 8~98% B2; 8~10 min, 98% B2; 1~10.1 min, 98~8% B2; 10.1~12 min, 8% B2.
For LC-ESI (−)-MS analysis, the mobile phase consisted of (B3) acetonitrile and (A3) 5 mM ammonium formate. The gradient conditions were as follows: 0~1 min, 8% B3; 1~8 min, 8~98% B3; 8~10 min, 98% B3; 10~10.1 min, 98~8% B3; 10.1~12 min, 8% B3 [86].
Metabolite detection was performed using an Orbitrap Exploris 120 mass spectrometer (Thermo Fisher Scientific, Waltham, USA) equipped with an electrospray ionization (ESI) source. Simultaneous MS1 and MS/MS data acquisition was conducted in Full MS-ddMS2 mode (data-dependent MS/MS). The parameters were as follows: sheath gas pressure: 40 arb; auxiliary gas flow: 10 arb; spray voltage: 3.50 kV (ESI+) and −2.50 kV (ESI−); capillary temperature: 325 °C; MS1 scan range: m/z 100~1000; MS1 resolving power: 60,000 FWHM; number of data-dependent scans per cycle: 4; MS/MS resolving power: 15,000 FWHM; normalized collision energy: 30%; dynamic exclusion time: automatic [87].

3.5. Statistical Analysis

Three biological replicates were conducted for each group, and the results were expressed as the mean and standard deviation. Group differences were analyzed by one-way analysis of variance (ANOVA) followed by Duncan’s HSD post hoc test (p < 0.05) to control for multiple comparisons, ensuring robust identification of latitude-dependent wax variations.
For wax composition analysis, single-component wax nonlinear regression modeling was conducted using Origin 2024. Multi-component wax analysis involved a scatter matrix plot, principal component analysis (PCA) through subset regression, and linear regression modeling, all performed using R Studio (4.4.1 version).

4. Conclusions

This study establishes that VF cuticular waxes serve as robust chemotaxonomic markers for both geographical authentication and quality prediction. The pronounced latitudinal variations in wax composition reflect adaptive responses to climatic stressors, with high-latitude regions favoring waterproofing n-alkanes and high-altitude sites synthesizing UV-protective triacontanol. Crucially, the eicosanoic acid, n-triacontane, dotriacontanol, alpha/beta-amyrin wax components correlated strongly with internal bioactive metabolites, validating waxes as dual biomarkers for production area and pharmacological potency.
Our developed authentication models—single-component, multi-component, and wax ratio methods—achieved high accuracy in discriminating production areas. Mechanistically, the inverse relationship between n-alkanes and corosolic acid suggests a trade-off in carbon allocation between physical barrier formation and oxidative stress defense. This adaptive strategy aligns with ecological gradients, where low-latitude plants prioritize chemical defenses, while temperate cultivars invest in cuticular waterproofing.
This study resolves the persistent challenge of VF production area authentication by demonstrating that cuticular waxes serve as stable “environmental adaptation fingerprints,” overcoming the limitations of traditional metabolite-based methods. The developed biomarkers and protocols provide a transformative framework for geographical authentication and quality assessment of medicinal plants, enabling more precise agriculture and standardized herbal product development.

Supplementary Materials

The following supporting information can be downloaded at: https://www.mdpi.com/article/10.3390/ijms26157293/s1.

Author Contributions

Y.L.: conceptualization, investigation, and writing—original draft; M.G.: conceptualization and formal analysis; L.H.: investigation and data curation; J.Y.: software and writing—original draft; J.X.: formal analysis and data curation; M.R.: formal analysis; Y.W.: conceptualization, investigation, and project administration; C.C.: formal analysis, writing—original draft, writing—review and editing, conceptualization, supervision, and funding acquisition; S.Z.: conceptualization, data curation, writing—original draft, writing—review and editing, funding acquisition, and supervision. All authors have read and agreed to the published version of the manuscript.

Funding

This research was funded by Jiangxi Province Double Thousand Talent-Leader of Natural Science Project (grant number: jxsq2023101038), Jiangxi Province Urgently Overseas Talent Project (grant number: 2022BCJ25027), The Key Research Projects in Jiangxi Province (grant number: 20223BBH8007 & 20232BBG70014), Jiujiang Xinglin Key Laboratory for Traditional Chinese Medicines (grant number: S2024ZDSYS037), Natural Science Foundation of Jiujiang (grant number: S2024KXJJ0001), The Key Research Project in Jiujiang (grant number: S2023ZDYFN796), Special Project of Lushan Botanical Garden (grant number: 2023ZWZX12), Jiangxi Provincial Natural Science Foundation (grant number: 20242BAB25341), and Youth Innovation Promotion Association CAS (grant number: 2015286).

Institutional Review Board Statement

Not applicable.

Informed Consent Statement

Not applicable.

Data Availability Statement

The data presented in this study are available on request from the corresponding author due to privacy.

Conflicts of Interest

The authors declare no conflict of interest.

References

  1. Le, D.D.; Han, S.; Ahn, J.; Yu, J.; Kim, C.-K.; Lee, M. Analysis of Antioxidant Phytochemicals and Anti-Inflammatory Effect from Vitex rotundifolia L. f. Antioxidants 2022, 11, 454. [Google Scholar] [CrossRef]
  2. Ong, H.G.; Kim, Y.D. Quantitative ethnobotanical study of the medicinal plants used by the Ati Negrito indigenous group in Guimaras island, Philippines. J. Ethnopharmacol. 2014, 157, 228–242. [Google Scholar] [CrossRef]
  3. Xavier, T.F.; Kannan, M.; Lija, L.; Auxillia, A.; Rose, A.K.F.; Sen, S. Ethnobotanical study of Kani tribes in Thoduhills of Kerala, South India. J. Ethnopharmacol. 2014, 152, 78–90. [Google Scholar] [CrossRef]
  4. Feng, J.; Li, M.; Wei, Q.; Li, S.; Song, S.; Hua, Z. Unconjugated bilirubin induces pyroptosis in cultured rat cortical astrocytes. J. Neuroinflammation 2018, 15, 23. [Google Scholar] [CrossRef]
  5. Zhao, Y.-Y.; Guo, L.; Cao, L.-J.; Zhang, J.; Yin, Z.-Q. A new iridoid glycoside from the fruits of Vitex rotundifolia. J. Asian Nat. Prod. Res. 2017, 19, 2491–2496. [Google Scholar] [CrossRef]
  6. Joshi, A.R.; Joshi, K. Indigenous knowledge and uses of medicinal plants by local communities of the Kali Gandaki Watershed Area, Nepal. J. Ethnopharmacol. 2000, 73, 175–183. [Google Scholar] [CrossRef]
  7. Rani, A.; Sharma, A. The Genus Vitex: A Review. Pharmacogn. Rev. 2013, 7, 188–198. [Google Scholar] [CrossRef]
  8. Mottaghipisheh, J.; Kamali, M.; Doustimotlagh, A.H.; Nowroozzadeh, M.H.; Rasekh, F.; Hashempur, M.H.; Iraji, A. A comprehensive review of ethnomedicinal approaches, phytochemical analysis, and pharmacological potential of Vitex trifolia L. Front. Pharmacol. 2024, 15, 1322083. [Google Scholar] [CrossRef]
  9. Gentallan, R.P., Jr.; Madayag, R.E.; Bartolome, M.C.B.; Alvaran, B.B.S.; Magtoltol, J.B.; Quiñones, K.J.O.; Coronado, N.B.; Altoveros, N.C.; Borromeo, T.H.; Endonela, L.E.; et al. Towards the establishment of “lagundi” (Vitex trifolia s. l.) reference germplasm from the Philippines: An agro-morphological and phytochemical evaluation of native genotypes. Ind. Crops Prod. 2014, 208, 117758. [Google Scholar] [CrossRef]
  10. Li, B.; Cantino, P.D.; Olmstead, R.G.; Bramley, G.L.; Xiang, C.-L.; Ma, Z.-H.; Tan, Y.-H.; Zhang, D.-X. A large-scale chloroplast phylogeny of the Lamiaceae sheds new light on its subfamilial classification. Sci. Rep. 2016, 6, 34343. [Google Scholar] [CrossRef]
  11. Yan, C.X.; Wei, Y.W.; Li, H.; Xu, K.; Zhai, R.X.; Meng, D.C.; Fu, X.J.; Ren, X. Vitex rotundifolia L. f. and Vitex trifolia L.: A review on their traditional medicine, phytochemistry, pharmacology. J. Ethnopharmacol. 2023, 308, 116273. [Google Scholar] [CrossRef]
  12. Musa, N.; Banerjee, S.; Maspalma, G.A.; Usman, L.U.; Hussaini, B. Assessment of the phytochemical, antioxidant and larvicidal activity of essential oil extracted from Simpleleaf Chastetree [Vitex trifolia] leaves obtained from Ganye Local Government, Adamawa State-Nigeria. Mater. Today 2021, 49, 3435–3438. [Google Scholar] [CrossRef]
  13. Mustarichie, R.; Sumiwi, S.A.; Hanifah, A.T. ED50 from anti-inflammatory properties of Vitex trifolia L. ethanol extract. Natl. J. Physiol. Pharm. Pharmacol. 2018, 8, 719–725. [Google Scholar] [CrossRef]
  14. Nwodo, N.; Okoye, F.; Lai, D.; Debbab, A.; Kaiser, M.; Brun, R.; Proksch, P. Evaluation of the in vitro trypanocidal activity of methylated flavonoid constituents of Vitex simplicifolia leaves. BMC Complement. Altern. Med. 2015, 15, 82. [Google Scholar] [CrossRef]
  15. Sathiamoorthy, B.; Gupta, P.; Kumar, M.; Chaturvedi, A.K.; Shukla, P.K.; Maurya, R. New antifungal flavonoid glycoside from Vitex negundo. Bioorg. Med. Chem. Lett. 2007, 17, 239–242. [Google Scholar] [CrossRef]
  16. Garbi, M.I.; Osman, E.E.; Abdallah, E.T.; Kabbashi, A.S.; Salam, H.A.A. Cytotoxicity of Vitex trifolia leaf extracts on MCF-7 and Vero cell lines. J. Sci. Innov. Res. 2015, 4, 89–93. [Google Scholar] [CrossRef]
  17. Rana, G. Inhibition efficiency of a newly isolated flavonoid compound from Vitex negundo L. leaves against cattle-endosymbiont Setaria cervi: Phytomedicine for lymphatic filariasis. Parasite Epidemiol. Control 2018, 3, 88–95. [Google Scholar] [CrossRef]
  18. Matsui, M.; Kumar-Roine, S.; Darius, H.T.; Chinain, M.; Laurent, D.; Pauillac, S. Characterisation of the anti-inflammatory potential of Vitex trifolia L. (Labiatae), a multipurpose plant of the Pacific traditional medicine. J. Ethnopharmacol. 2009, 126, 427–433. [Google Scholar] [CrossRef]
  19. Chokpaisarn, J.; Paduka, W.; Sotthibandhu, D.S.; Phoopha, S.; Limsuwan, S.; Maneenoon, K.; Mahaprom, K.; Chaiwong, K. Evaluation of biological properties and phytochemical profile of Vitex trifolia L. extract and its infused oil as a value-added product for health promotion. South Afr. J. Bot. 2024, 169, 543–552. [Google Scholar] [CrossRef]
  20. Zahid, H.; Rizwani, G.H.; Ishaqe, S. Phytopharmacological Review on Vitex agnus-castus: A Potential Medicinal Plant. Chin. Herb. Med. 2016, 8, 24–29. [Google Scholar] [CrossRef]
  21. Eha, B.; Jannavi, R.; Sukumaran, P. Phyto-pharmacological and Biological Aspects of Vitex negundo Medicinal Plant—A Review. J. Pharm. Res. Int. 2021, 33, 17–32. [Google Scholar] [CrossRef]
  22. Chan, E.W.C.; Wong, S.K.; Chan, H.T. Casticin from Vitex species: A short review on its anticancer and anti-inflammatory properties. J. Integr. Med. 2018, 16, 147–152. [Google Scholar] [CrossRef]
  23. Wee, H.N.; Neo, S.Y.; Singh, D.; Yew, H.-C.; Qiu, Z.-Y.; Tsai, X.-R.C.; How, S.-Y.; Yip, K.-Y.C.; Tan, C.-H.; Koh, H.-L. Effects of Vitex trifolia L. leaf extracts and phytoconstituents on cytokine production in human U937 macrophages. BMC Complement. Med. Ther. 2020, 20, 91. [Google Scholar] [CrossRef]
  24. Li, S.; Zhang, X.; Huang, H.; Yin, M.; Jenks, M.A.; Kosma, D.K.; Yang, P.; Yang, X.; Zhao, H.; Lü, S. Deciphering the core shunt mechanism in Arabidopsis cuticular wax biosynthesis and its role in plant environmental adaptation. Nat. Plants 2025, 11, 165–175. [Google Scholar] [CrossRef]
  25. Kosma, D.K.; Bourdenx, B.; Bernard, A.; Parsons, E.P.; Lu, S.; Joubès, J.; Jenks, M.A. The impact of water deficiency on leaf cuticle lipids of Arabidopsis. Plant Physiol. 2009, 151, 1918–1929. [Google Scholar] [CrossRef]
  26. Bernard, A.; Joubès, J. Arabidopsis cuticular waxes: Advances in synthesis, export and regulation. Prog. Lipid Res. 2013, 52, 110–129. [Google Scholar] [CrossRef]
  27. Lee, S.B.; Suh, M.C. Advances in the understanding of cuticular waxes in Arabidopsis thaliana and crop species. Plant Cell Rep. 2015, 34, 557–572. [Google Scholar] [CrossRef]
  28. Riederer, M.; Schreiber, L. Protecting against water loss: Analysis of the barrier properties of plant cuticles. J. Exp. Bot. 2001, 52, 2023–2032. [Google Scholar] [CrossRef]
  29. Kim, H.; Yu, S.-I.; Jung, S.H.; Lee, B.-H.; Suh, M.C. The F-Box Protein SAGL1 and ECERIFERUM3 Regulate Cuticular Wax Biosynthesis in Response to Changes in Humidity in Arabidopsis. Plant Cell 2019, 31, 2223–2240. [Google Scholar] [CrossRef]
  30. Lewandowska, M.; Keyl, A.; Feussner, I. Wax biosynthesis in response to danger: Its regulation upon abiotic and biotic stress. New Phytol. 2020, 227, 698–712. [Google Scholar] [CrossRef]
  31. Buschhaus, C.; Jetter, R. Composition differences between epicuticular and intracuticular wax substructures: How do plants seal their epidermal cuticulars? J. Exp. Bot. 2011, 62, 841–853. [Google Scholar] [CrossRef]
  32. Wang, Q.; Liu, Y.; Wu, X.; Wang, L.; Li, J.; Wan, M.; Jia, B.; Ye, Z.; Liu, L.; Tang, X.; et al. Characterization of the PbrLACS2 in pear and role in wax biosynthesis in Arabidopsis. Plant Biotechnol. J. 2025, 21, 3. [Google Scholar] [CrossRef]
  33. Suresh, K.; Zeisler-Diehl, V.; Schreiber, L. Comparing anatomy, chemical composition, and water permeability of suberized organs in five plant species: Wax makes the difference. Planta 2022, 256, 60. [Google Scholar] [CrossRef]
  34. Wang, Y.; Su, S.; Chen, G.; Mao, H.; Jiang, Y. Relationship Between Cuticular Waxes and Storage Quality Parameters of Korla Pear Under Different Storage Methods. J. Plant Growth Regul. 2021, 40, 1152–1165. [Google Scholar] [CrossRef]
  35. Dimopoulos, N.; Tindjau, R.; Wong, D.C.J.; Matzat, T.; Haslam, T.; Song, C.; Gambetta, G.A.; Kunst, L.; Castellarin, S.D. Drought stress modulates cuticular wax composition of the grape berry. J. Exp. Bot. 2020, 71, 3126–3141. [Google Scholar] [CrossRef]
  36. Zuo, H.; Si, X.; Li, P.; Li, J.; Chen, Z.; Li, P.; Chen, C.; Liu, Z.; Zhao, J. Dynamic change of tea (Camellia sinensis) leaf cuticular wax in white tea processing for contribution to tea flavor formation. Food Res. Int. 2023, 163, 112182. [Google Scholar] [CrossRef]
  37. Chen, M. The Tea Plant Leaf Cuticle: From Plant Protection to Tea Quality. Front. Plant Sci. 2021, 12, 751547. [Google Scholar] [CrossRef]
  38. Chen, M.; Zhu, X.; Zhang, Y.; Du, Z.; Chen, X.; Kong, X.; Sun, W.; Chen, C. Drought stress modify cuticle of tender tea leaf and mature leaf for transpiration barrier enhancement through common and distinct modes. Sci. Rep. 2020, 10, 6696. [Google Scholar] [CrossRef]
  39. He, Y.; Gao, J.; Guo, N.; Guo, Y. Variations of leaf cuticular waxes among C3 and C4 Gramineae herbs. Chem. Biodivers. 2016, 13, 1460–1468. [Google Scholar] [CrossRef]
  40. Zhu, Y.; Guan, M.; Jia, Q.; Wang, G.; Pan, L.; Li, Y. Degradation mechanism of cuticular wax composition and surface properties of bamboo culm during storage. Ind. Crops Prod. 2024, 214, 118558. [Google Scholar] [CrossRef]
  41. Xue, D.; Zhang, X.; Lu, X.; Chen, G.; Chen, Z.-H. Molecular and evolutionary mechanisms of cuticular wax for plant drought tolerance. Front. Plant Sci. 2017, 8, 621. [Google Scholar] [CrossRef]
  42. Li, Y.; Liu, J.; Li, J.; Xiao, H.; Xu, Y.; Fan, S.; Xie, Z.; Guo, M.; Yang, J.; Jing, X.; et al. Chemical characterization and discovery of novel quality markers in Citrus aurantium L. fruit from traditional cultivation areas in China using GC–MS-based cuticular waxes analysis. Food Chem. 2023, 20, 100890. [Google Scholar] [CrossRef]
  43. Schuster, A.C.; Burghardt, M.; Alfarhan, A.; Bueno, A.; Hedrich, R.; Leide, J.; Thomas, J.; Riederer, M. Effectiveness of cuticular transpiration barriers in a desert plant at controlling water loss at high temperatures. AoB Plants 2016, 8, plw027. [Google Scholar] [CrossRef]
  44. Bueno, A.; Alfarhan, A.; Arand, K.; Burghardt, M.; Deininger, A.-C.; Hedrich, R.; Leide, J.; Seufert, P.; Staiger, S.; Riederer, M. Effects of temperature on the cuticular transpiration barrier of two desert plants with water-spender and water-saver strategies. J. Exp. Bot. 2019, 70, 1613–1625. [Google Scholar] [CrossRef]
  45. Shepherd, T.; Griffiths, D.W. The effects of stress on plant cuticular waxes. New Phytol. 2006, 171, 469–499. [Google Scholar] [CrossRef]
  46. Rao, I.M.; Zeigler, R.S.; Vera, R.; Sarkarung, S. Selection and breeding for acid-soil tolerance in crops. BioScience 1993, 43, 454–465. [Google Scholar] [CrossRef]
  47. Schultz, J.C.; Appel, H.M.; Ferrieri, A.P.; Arnold, T.M. Flexible resource allocation during plant defense responses. Front. Plant Sci. 2013, 4, 324. [Google Scholar] [CrossRef]
  48. Kidd, P.S.; Proctor, J. Why plants grow poorly on very acid soils: Are ecologists missing the obvious? J. Exp. Bot. 2001, 52, 791–799. [Google Scholar] [CrossRef]
  49. Shi-zhen, L. Characteristics of some types of paddy soil in Northeast China. In Proceedings of Symposium on Paddy Soils; Springer: Berlin/Heidelberg, Germany, 1981; pp. 680–685. [Google Scholar] [CrossRef]
  50. Bi, X.; Chu, H.; Fu, M.; Xu, D.; Zhao, W.; Zhong, Y.; Wang, M.; Li, K.; Zhang, Y. Distribution characteristics of organic carbon (nitrogen) content, cation exchange capacity, and specific surface area in different soil particle sizes. Sci. Rep. 2023, 13, 12242. [Google Scholar] [CrossRef]
  51. Steinmüller, D.; Tevini, M. Action of ultraviolet radiation (UV-B) upon cuticular waxes in some crop plants. Planta 1985, 164, 557–564. [Google Scholar] [CrossRef]
  52. Tevini, M.; Steinmüller, D. Influence of light, UV-B radiation, and herbicides on wax biosynthesis of cucumber seedlings. J. Plant Physiol. 1987, 131, 111–121. [Google Scholar] [CrossRef]
  53. Zhang, X.; Li, J.; Wen, X.; Wang, X.-B.; Shen, D.-P.; Ding, L.-W.; He, J. UV-B induced expression of wax synthesis gene LbCYP96A15 in leaves of goji plants (Lycium barbarum) to improve powdery mildew resistance. Chem. Biol. Technol. Agric. 2025, 12, 43. [Google Scholar] [CrossRef]
  54. Acharya, K.P.; De Frenne, P.; Brunet, J.; Chabrerie, O.; Cousins, S.A.O.; Diekmann, M.; Hermy, M.; Kolb, A.; Lemke, I.; Plue, J.; et al. Latitudinal variation of life-history traits of an exotic and a native impatiens species in Europe. Acta Oecologica 2017, 81, 40–47. [Google Scholar] [CrossRef]
  55. Malizia, A.; Blundo, C.; Carilla, J.; Acosta, O.O.; Cuesta, F.; Duque, A.; Aguirre, N.; Aguirre, Z.; Ataroff, M.; Baez, S.; et al. Elevation and latitude drives structure and tree species composition in Andean forests: Results from a large-scale plot network. PLoS ONE 2020, 15, e0231553. [Google Scholar] [CrossRef]
  56. Shen, P.; Jiang, X.; Zhang, J.; Wang, J.; Raj, R.; Li, G.; Ge, H.; Wang, W.; Yu, B.; Zhang, J. Isolation and microbial transformation of tea sapogenin from seed pomace of Camellia oleifera with anti-inflammatory effects. Chin. J. Nat. Med. 2024, 22, 280–288. [Google Scholar] [CrossRef]
  57. Davidyants, E.S. Triterpene glycosides as plant growth regulators: Application potential and prospects (A review). Russ. J. Bioorganic Chem. 2024, 50, 2730–2752. [Google Scholar] [CrossRef]
  58. Saleem, S.; Mushtaq, N.U.; Shah, W.H.; Rasool, A.; Hakeem, K.R.; Rehman, R.U. Beneficial role of phytochemicals in oxidative stress mitigation in plants. In Antioxidant Defense in Plants; Aftab, T., Hakeem, K.R., Eds.; Springer: Berlin/Heidelberg, Germany, 2022; pp. 435–451. [Google Scholar] [CrossRef]
  59. Grassmann, J. Terpenoids as plant antioxidants. Vitam. Horm. 2005, 72, 505–535. [Google Scholar] [CrossRef]
  60. Cai, Y.; Xu, C.; Zheng, T.; Zuo, Z. Thermal protection function of camphor on Cinnamomum camphora cell membrane by acting as a signaling molecule. Plant Physiol. Biochem. 2023, 198, 107672. [Google Scholar] [CrossRef]
  61. Liu, B.; Zhang, L.; Rusalepp, L.; Kaurilind, E.; Sulaiman, H.Y.; Püssa, T.; Niinemets, Ü. Heat priming improved heat tolerance of photosynthesis, enhanced terpenoid and benzenoid emission and phenolics accumulation in Achillea millefolium. Plant Cell Environ. 2021, 44, 2365–2385. [Google Scholar] [CrossRef]
  62. Long, L.M.; Patel, H.P.; Cory, W.C.; Stapleton, A.E. The maize epicuticular wax layer provides UV protection. Funct. Plant Biol. 2003, 30, 75–81. [Google Scholar] [CrossRef]
  63. Wu, H.; Liu, L.; Chen, Y.; Liu, T.; Jiang, Q.; Wei, Z.; Li, C.; Wang, Z. Tomato SlCER1-1 catalyzes the synthesis of wax alkanes which increases the drought tolerance and fruit storability. Hortic. Res. 2022, 9, uhac004. [Google Scholar] [CrossRef]
  64. Kong, L.; Liu, Y.; Zhi, P.; Wang, X.; Xu, B.; Gong, Z.; Chang, C. Origins and Evolution of Cuticle Biosynthetic Machinery in Land Plants. Plant Physiol. 2020, 184, 1998–2010. [Google Scholar] [CrossRef]
  65. Pathak, N.; Negi, A.S. Plant based steroidal and triterpenoid sapogenins: Chemistry on diosgenin and biological aspects. Eur. J. Med. Chem. 2024, 279, 116915. [Google Scholar] [CrossRef]
  66. Rodler, C.; Schinnerl, J.; Schalamun, M.; Hinterdobler, W.; Brecker, L. Diosgenin and solasodine-based saponins and sapogenines—Effects of structural modifications on Panagrellus redivivus, Spodoptera littoralis and Trichoderma reesei. Results Chem. 2025, 13, 101994. [Google Scholar] [CrossRef]
  67. Mortici, C. Best estimates of the generalized Stirling formula. Appl. Math. Comput. 2010, 215, 4044–4048. [Google Scholar] [CrossRef]
  68. He, T.-X. Generalized Stirling Numbers and Generalized Stirling Functions. arXiv 2011, arXiv:1106.5251. [Google Scholar] [CrossRef]
  69. Filbet, F.; Russo, G. Accurate numerical methods for the Boltzmann equation. In Modeling and Computational Methods for Kinetic Equations. Modeling and Simulation in Science, Engineering and Technology; Degond, P., Pareschi, L., Russo, G., Eds.; Birkhäuser: Boston, MA, USA, 2004. [Google Scholar] [CrossRef]
  70. Kunst, L.; Samuels, A.L. Biosynthesis and secretion of plant cuticular wax. Prog. Lipid Res. 2003, 42, 51–80. [Google Scholar] [CrossRef]
  71. Yang, X.; Huang, H.; Wang, Z.; Haslam, T.M.; Kunst, L.; Wang, P.; Zhao, H.; Lü, S.; Ma, C. Acetyl-CoA carboxylase1 influences ECERIFERUM2 activity to mediate the synthesis of very-long-chain fatty acid past C28. Plant Physiol. 2025, 197, kiae253. [Google Scholar] [CrossRef]
  72. Cassagne, C.; Lessire, R.; Bessoule, J.-J.; Moreau, P.; Creach, A.; Schneider, F.; Sturbois, B. Biosynthesis of very long chain fatty acids in higher plants. Prog. Lipid Res. 1994, 33, 55–69. [Google Scholar] [CrossRef]
  73. de Perez Souza, L.; Garbowicz, K.; Brotman, Y.; Tohge, T.; Fernie, A.R. The acetate pathway supports flavonoid and lipid biosynthesis in Arabidopsis. Plant Physiol. 2020, 182, 857–869. [Google Scholar] [CrossRef]
  74. Wang, Z.H.; Kang, K.A.; Zhang, R.; Piao, M.J.; Jo, S.H.; Kim, J.S.; Kang, S.S.; Lee, J.S.; Park, D.H.; Hyun, J.W. Myricetin suppresses oxidative stress-induced cell damage via both direct and indirect antioxidant action. Environ. Toxicol. Pharmacol. 2010, 29, 12–18. [Google Scholar] [CrossRef]
  75. Xie, H.-J.; Mou, W.-S.; Lin, F.-R.; Xu, J.-H.; Lei, Q.-F.; Fang, W.-J. Radical scavenging activity of myricetin. Acta Phys. -Chim. Sin. 2013, 29, 1421–1432. [Google Scholar] [CrossRef]
  76. Rogowska, A.; Szakiel, A. Enhancement of phytosterol and triterpenoid production in plant hairy root cultures—Simultaneous stimulation or competition? Plants 2021, 10, 2028. [Google Scholar] [CrossRef]
  77. Zhang, Y.-L.; Zhang, C.-L.; Wang, G.-L.; Wang, Y.-X.; Qi, C.-H.; Zhao, Q.; You, C.-X.; Li, Y.-Y.; Hao, Y.-J. The R2R3 MYB transcription factor MdMYB30 modulates plant resistance against pathogens by regulating cuticular wax biosynthesis. BMC Plant Biol. 2019, 19, 362. [Google Scholar] [CrossRef]
  78. Falginella, L.; Andre, C.M.; Legay, S.; Lin-Wang, K.; Dare, A.P.; Deng, C.; Rebstock, R.; Plunkett, B.J.; Guo, L.; Cipriani, G.; et al. Differential regulation of triterpene biosynthesis induced by an early failure in cuticle formation in apple. Hortic. Res. 2021, 8, 75. [Google Scholar] [CrossRef]
  79. Leide, J.; Hildebrandt, U.; Reussing, K.; Riederer, M.; Vogg, G. The developmental pattern of tomato fruit wax accumulation and its impact on cuticular transpiration barrier properties: Effects of a deficiency in a β-ketoacyl-coenzyme A synthase (LeCER6). Plant Physiol. 2007, 144, 1667–1679. [Google Scholar] [CrossRef]
  80. Ghafari, A.T.; Jahidin, A.H.; Zakaria, Y.; Hasan, M.H. Phytochemical Screening and High-performance Thin-layer Chromatography Quantification of Vitex trifolia Leaves Hydro-alcoholic Extract: Potential Anti-inflammatory Properties. J. Pharm. Res. Int. 2021, 33, 111–121. [Google Scholar] [CrossRef]
  81. Huang, H.; Wang, L. Alteration of cuticular morphologies and chemical composition of cuticle in response to chilling injury in papaya (Carica papaya L.) after harvest. Food Chem. 2023, 416, 135751. [Google Scholar] [CrossRef]
  82. Rafiq, M.; Javaid, A.; Kanwal, A.; Anwar, A.; Khan, I.H.; Kanwal, Q.; Cheng, C. GC-MS analysis and antifungal potential of flower extract of Acacia nilotica subsp. Indica against Macrophomina phaseolina. Microb. Pathog. 2024, 194, 106819. [Google Scholar] [CrossRef]
  83. Jetter, R.; Kunst, L.; Samuels, A.L. Composition of Plant Cuticular Waxes. In Plant Cuticles: An Integrated Functional Approach; Riederer, M., Müller, C., Eds.; Garland Science: New York, NY, USA, 2006; Chapter 4. [Google Scholar] [CrossRef]
  84. Vasilev, N.; Boccard, J.; Lang, G.; Grömping, U.; Fischer, R.; Goepfert, S.; Rudaz, S.; Schillberg, S. Structured plant metabolomics for the simultaneous exploration of multiple factors. Sci. Rep. 2016, 6, 37390. [Google Scholar] [CrossRef]
  85. Rafiq, M.; Shoaib, A.; Javaid, A.; Parveen, S.; Hassan, M.A.; Nawaz, H.H.; Cheng, C. Application of Asteraceae biomass and biofertilizers to improve potato crop health by controlling black scurf disease. Front. Plant Sci. 2024, 15, 1437702. [Google Scholar] [CrossRef]
  86. Dunn, W.B.; Broadhurst, D.; Begley, P.; Zelena, E.; Francis-McIntyre, S.; Anderson, N.; Brown, M.; Knowles, J.D.; Halsall, A.; Haselden, J.N.; et al. Human Serum Metabolome (HUSERMET) Consortium. Procedures for large-scale metabolic profiling of serum and plasma using gas chromatography and liquid chromatography coupled to mass spectrometry. Nat. Protoc. 2011, 6, 1060–1083. [Google Scholar] [CrossRef]
  87. Want, E.J.; Masson, P.; Michopoulos, F.; Wilson, I.D.; Theodoridis, G.; Plumb, R.S.; Shockcor, J.; Loftus, N.; Holmes, E.; Nicholson, J.K. Global metabolic profiling of animal and human tissues via UPLC-MS. Nat. Protoc. 2013, 8, 17–32. [Google Scholar] [CrossRef]
Figure 1. Internal casticin content of VF collected in Hainan, Yunnan, Jiangxi, Zhejiang, Anhui, and Shandong Provinces (in the violin plot, the width of the violin represents the density of the data, thin lines indicate 95% confidence intervals, white bar-shaped regions indicate interquartile ranges, red dots indicate outliers, and white dots indicate means).
Ijms 26 07293 g001
Figure 2. GC-MS chromatogram of VF wax (red represents fatty acids, green represents n-alkanes, blue represents primary alcohols, and purple represents triterpenoids).
Ijms 26 07293 g002
Figure 3. (a) Wax content heat-map of VF cuticular waxes from different production areas (left side shows clustering groups). (b) Wax content heat-map of the four main categories of VF cuticular waxes from different production areas.
Ijms 26 07293 g003
Figure 4. Schematic diagram of climate zones and altitudes from different VF production areas (the red patch indicates the area of the city where the production area is located).
Ijms 26 07293 g004
Figure 5. Comparison of (a) hentriacontane, (b) n-tritriacontane, (c) n-pentatriacontane, (d) dotriacontane, and (e) n-tetratriacontane wax contents of VF from six production areas (HN, YN, JX, ZJ, AH and SD). Different lowercase letters indicate significant differences, p < 0.05, Duncan’s HSD test.
Ijms 26 07293 g005
Figure 6. Comparison of (a) lignoceric acid, (b) hexacosanol, (c) maslinic acid, (d) beta-amyrin, (e) ursolic acid, and (f) triacontanoic acid wax contents of VF from six production areas (HN, YN, JX, ZJ, AH, and SD). Different lowercase letters indicate significant differences, p < 0.05, Duncan’s HSD test.
Ijms 26 07293 g006
Figure 7. Comparison of (a) hexacosenoic acid, (b) octacosanoic acid, (c) triacontanol, (d) oleanolic acid, and (e) nonacosanoic acid wax contents of VF from six production areas (HN, YN, JX, ZJ, AH and SD). Different lowercase letters indicate significant differences, p < 0.05, Duncan’s HSD test.
Ijms 26 07293 g007
Figure 8. Comparison of (a) hentriacontane, (b) n-tritriacontane, (c) n-pentatriacontane, (d) dotriacontane, (e) n-tetratriacontane, and (f) corosolic acid wax contents of VF from four production areas (HN, JX, ZJ and AH). Different lowercase letters indicate significant differences, p < 0.05, Duncan’s HSD test.
Ijms 26 07293 g008
Figure 9. Fitting curves of (a) hentriacontane, (b) n-tritriacontane, (c) n-pentatriacontane, (d) dotriacontane, (e) n-tetratriacontane, and (f) corosolic acid waxes to latitude.
Ijms 26 07293 g009
Figure 10. (a) Correlation heat-map of the content of five kinds of n-alkanes waxes with latitude. (b) PCA plot for all subsets of the five kinds of n-alkanes waxes.
Ijms 26 07293 g010
Figure 11. Wax ratio of (a) hentriacontane/corosolic acid, (b) n-tritriacontane/corosolic acid, (c) n-pentatriacontane/corosolic acid, (d) dotriacontane/corosolic acid, and (e) n-tetratriacontane/corosolic acid. Different lowercase letters indicate significant differences, p < 0.05, Duncan’s HSD test.
Ijms 26 07293 g011
Figure 12. Correlation heat-map between metabolites and cuticular wax of VF.
Ijms 26 07293 g012
Figure 13. Optical photos of VF from various production areas, (a) HN, (b) YN, (c) JX, (d) ZJ, (e) AH, and (f) SD.
Ijms 26 07293 g013
Table 1. Wax constituents identified in VF extracts, their retention times (min), and their relative contents from each production area sample (HN, YN, JX, ZJ, AH, and SD). Note: The lowercase letters following percent value indicate the significance of its difference compared to other production areas. p < 0.05, Duncan’s HSD test.
Retention
Times (min)
WaxesHNYNJXZJAHSD
(%)SDCV(%)SDCV(%)SDCV(%)SDCV(%)SDCV(%)SDCV
14.738Fatty acid c24 (Lignoceric acid)8.017 ab0.0050.0676.190 abc0.0130.2144.722 bc0.0190.3924.351 c0.0180.4096.162 abc0.0060.1028.688 a0.0100.118
15.664n-Alkane c29 (Nonacosane)7.816 c0.0040.05711.119 b0.0170.1546.754 c0.0180.2634.680 c0.0210.43914.636 ab0.0090.06215.323 a0.0100.067
16.522Primary alcohol c26 (Hexacosanol)2.439 a0.0140.5923.119 a0.0070.2123.404 a0.0160.4733.260 a0.0090.2711.592 a0.0060.3724.202 a0.0130.316
17.108n-Alkane c30 (n-Triacontane)10.905 bc0.0210.1958.086 bc0.0330.40914.381 ab0.0220.15318.009 a0.0710.3944.248 c0.0090.2168.850 bc0.0500.571
17.805Fatty acid c26 (Hexacosenoic acid)5.855 a0.0170.2965.534 a0.0350.6282.258 a0.0040.1963.041 a0.0270.8772.150 a0.0070.3032.133 a0.0130.623
18.680n-Alkane c31 (Hentriacontane)9.482 d0.0120.13122.007 b0.0090.04113.852 c0.0250.18013.451 c0.0080.05729.579 a0.0130.04320.125 b0.0110.052
19.623Primary alcohol c28 (Octacosanol)1.719 a0.0020.1291.444 a0.0020.1201.791 a0.0020.1212.166 a0.0080.3551.515 a0.0100.6351.711 a0.0181.068
20.243n-Alkane c32 (Dotriacontane)3.099 a0.0030.0913.154 a0.0030.1022.565 ab0.0020.0653.841 a0.0040.1113.460 a0.0030.0901.684 b0.0070.393
20.421Beta-amyrin1.818 b0.0020.0941.461 b0.0030.2183.635 b0.0050.1472.625 ab0.0090.3412.052 b0.0040.2023.014 ab0.0090.288
20.931Alpha-amyrin2.172 b0.0010.0522.185 b0.0070.2994.432 a0.0120.2732.593 b0.0090.3652.274 b0.0030.1521.785 b0.0090.531
21.093Fatty acid c28 (Octacosanoic acid)3.125 ab0.0050.1443.844 a0.0090.2211.226 b0.0020.1365.344 a0.0170.3131.298 b0.0090.7102.703 ab0.0100.367
21.959n-Alkane c33 (n-Tritiacontane)8.272 d0.0170.20914.553 b0.0100.06610.726 c0.0130.12213.041 bc0.0100.07917.585 a0.0100.06011.216 c0.0070.066
22.630Fatty acid c29 (Nonacosanoic acid)1.463 a0.0070.4751.407 a0.0060.4360.946 a0.0010.0471.448 a0.0050.3190 a00 a0
22.936Primary alcohol c30 (Triacontanol)0 a05.695 a0.0270.4660.430 a0.0010.1670 a00.620 a0.0040.6630 a0
23.395n-Alkane c34 (n-Tetratriacontane)1.676 a0.0030.1601.530 a0.0090.5582.412 a0.0040.1832.651 a0.0020.0822.533 a0.0120.4622.496 a0.0080.318
23.726Fatty acid c30 (Triacontanoic acid)2.987 a0.0010.0321.831 a0.0090.4661.038 a0.0070.6721.206 a0.0050.4530.996 a0.0070.6631.835 a0.0090.517
24.525Oleanolic acid1.812 ab0.0080.4342.700 ab0.0090.3163.334 a0.0050.1411.340 ab0.0100.7451.138 b0.0040.3901.945 ab0.0100.531
25.213Ursolic acid4.262 a0.0040.0910.842 d0.0030.3592.317 b0.0020.1061.090 cd0.0040.3310.783 d0.0030.3632.042 bc0.0080.389
25.493n-Alkane c35 (n-Pentatriacontane)3.795 b0.0110.2875.679 ab0.0210.3724.377 ab0.0060.1466.724 a0.0160.2316.464 ab0.0050.0813.731 ab0.0150.401
27.226Primary alcohol c32 (Dotriacontanol)2.351 a0.0060.2520.424 b0.0020.4061.859 a0.0030.1541.774 a0.0030.1760 b00 b0
28.033Maslinic acid4.282 a0.0070.1521.967 bc0.0110.5392.856 ab0.0050.1662.648 abc0.0050.2060.620 c0.0020.2563.218 ab0.0120.359
28.356Corosolic acid8.036 a0.0060.0771.157 d0.0050.3895.380 b0.0100.1903.055 c0.0150.4890.939 d0.0030.2682.694 cd0.0110.417
“—” indicates that the data were not detected.
Table 2. Soil and climate indicators (environmental factors) of the different sampling sites.
Production AreasAverage LatitudeAverage Altitude
(m)
Soil TypesSoil pHAnnual Average Temperature
(°C)
Annual Average
Precipitation
(mm)
Frost-Free Period
(days)
Qionghai City
Hainan Province
19.25° N10~50Laterite soil
Red soil
5.0~6.524~262000~2500365
Tengchong City
Yunnan Province
25.02° N1600~1900Red soil
Volcanic ash soil
5.5~6.814~161400~1600270~300
Ji’an City
Jiangxi Province
27.12° N50~200Red soil
Paddy soil
4.5~6.017~191400~1600280~300
Quzhou City
Zhejiang Province
28.97° N50~150Red soil
Yellow soil
5.0~6.516~181500~1800250~280
Anqing City
Anhui Province
30.53° N20~100Yellow-brown soil
Paddy soil
5.5~7.015~171300~1500240~260
Yantai City
Shandong Province
37.52° N10~100Brown soil
Brown soil
6.5~7.511~13550~700200~220
Table 3. The contents and percentages of each primary wax class (fatty acid, n-alkane, primary alcohol, and triterpenoid) from each production area sample (HN, YN, JX, ZJ, AH, and SD). Note: The lowercase letters following content mean value indicate the significance of its difference compared to other production areas. p < 0.05, Duncan’s HSD test.
HNYNJXZJAHSD
ContentMeanSD(%)MeanSD(%)MeanSD(%)MeanSD(%)MeanSD(%)MeanSD(%)
μg/cm2
Total fatty acids1.59 a0.2526.062.60 a1.0416.961.41 a0.6415.491.75 a1.0017.052.45 a1.0111.722.64 a1.1615.96
Total n-alkanes2.75 a0.5045.0410.13 abc2.3866.135.00 bc1.5555.076.42 bc1.7562.4016.22 a7.0077.6610.47 ab5.5663.43
Total primary alcohols0.40 a0.186.511.01 a0.486.600.68 a0.397.480.74 a0.297.200.59 a0.442.810.98 a0.355.91
Total triterpenoids1.36 a0.1722.381.58 a0.4210.311.99 a0.6721.961.37 a0.4713.351.63 a0.647.812.43 a1.3914.70
Total6.09 b 15.31 ab 9.08 b 10.29 b 20.88 a 16.51 ab
Table 4. All wax component contents from each production area sample (HN, YN, JX, ZJ, AH, and SD). Note: The lowercase letters following content mean value indicate the significance of its difference compared to other production areas. p < 0.05, Duncan’s HSD test.
ClassificationContentHNYNJXZJAHSD
μg/cm2MeanSD(%)MeanSD(%)MeanSD(%)MeanSD(%)MeanSD(%)MeanSD(%)
FattyTetracosanoic
acid
0.37 a0.206.010.16 a0.081.010.51 a0.535.630.27 a0.132.600.37 a0.171.740.20 a0.081.21
Lignoceric
acid
0.49 b0.137.900.95 ab0.205.780.43 b0.054.710.45 b0.434.311.29 a0.496.021.43 a0.498.64
Hexacosenoic
acid
0.36 a0.105.770.85 a0.835.170.21 a0.102.250.31 a0.213.010.45 a0.272.100.35 a0.452.12
acidsOctacosanoic
acid
0.19 ab0.073.080.59 a0.113.590.11 b0.061.220.55 ab0.465.290.27 ab0.251.270.45 ab0.172.69
Nonacosanoic
acid
0.09 b0.081.440.22 a0.051.320.09 b0.030.940.15 b1.430 b00 b0
Triacontanoic acid0.18 a0.052.940.28 a0.131.710.09 a0.061.030.12 a0.131.190.21 a0.970.30 a0.141.82
n-AlkanesNonacosane0.48 b0.087.701.70 ab0.2910.390.61 b0.246.730.48 b0.394.643.06 a1.3814.292.53 a1.2115.23
n-Triacontane0.66 a0.0910.751.24 a0.817.561.31 a0.6714.331.85 a0.4217.840.89 a0.184.151.46 a1.318.80
Hentriacontane0.58 c0.149.343.37 b0.5720.571.26 bc0.3313.801.38 bc0.4713.326.18 a2.6628.883.32 b1.5020.00
Dotriacontane0.19 b0.053.050.48 ab0.042.950.23 b0.072.560.40 b0.223.800.72 a0.313.380.28 b0.161.67
n-Tritriacontane0.50 c0.258.152.23 ab0.4513.600.97 bc0.2410.691.34 bc0.4212.923.67 a1.6817.171.85 bc0.9611.15
n-Tetratriacontane0.10 b0.021.650.23 ab0.161.430.22 ab0.082.400.27 ab0.122.630.53 a0.192.470.41 ab0.342.48
n-Pentatriacontane0.23 c0.133.740.87 ab0.505.310.40 bc0.094.360.69 bc0.086.661.35 a0.566.310.62 bc0.213.71
PrimaryHexacosanol0.15 a0.142.400.48 a0.072.920.31 a0.293.390.34 a0.263.230.33 a0.131.550.69 a0.604.18
Octacosanol0.10 a0.041.690.22 a0.041.350.16 a0.041.780.22 a0.012.140.32 a0.451.480.28 a0.251.70
alcoholsTriacontanol0 b00.87 a5.320.04 ab0.020.430 b00.13 ab0.600 b0
Dotriacontanol0.14 a0.052.320.06 b0.400.17 a0.061.850.18 a0.041.760 b00 b0
TriterpenoidsBeta-amyrin0.11 a0.031.790.22 a0.071.370.33 a0.183.620.27 a0.192.600.43 a0.282.000.50 a0.383.00
Alpha-amyrin0.13 b0.032.140.33 ab0.122.040.40 a0.214.420.27 ab0.162.570.47 a0.132.220.29 ab0.031.77
Oleanolic acid0.11 b0.081.790.41 a0.182.520.30 ab0.103.320.14 b0.091.330.24 ab0.061.110.32 ab0.151.93
Ursolic acid0.26 ab0.084.200.13 ab0.050.790.21 ab0.102.310.11 b0.021.080.16 ab0.030.760.34 a0.232.03
Corosolic acid0.49 a0.037.920.18 b0.091.080.49 a0.075.360.31 ab0.093.030.20 b0.140.920.44 ab0.302.68
Maslinic acid0.26 ab0.054.220.30 ab0.201.840.26 ab0.062.850.27 ab0.182.620.13 b0.070.600.53 a0.393.20
Total6.18 b16.39 ab9.11 b10.39 b21.39 a16.61 ab
“—” indicates that the data were not detected.
Disclaimer/Publisher’s Note: The statements, opinions and data contained in all publications are solely those of the individual author(s) and contributor(s) and not of MDPI and/or the editor(s). MDPI and/or the editor(s) disclaim responsibility for any injury to people or property resulting from any ideas, methods, instructions or products referred to in the content.

