Article

Acquired Radioresistance Through Adaptive Evolution with Gamma Radiation as Selection Pressure: Increased Expression and Induction of Anti-Stress Genes

1
Division of Radiation Life Science, Institute for Integrated Radiation and Nuclear Science, Kyoto University, 2-1010, Asashiro-nishi, Kumatori-cho, Sennan-gun 590-0494, Osaka, Japan
2
Department of Radiation Research, Advanced Science Research Center, Okayama University, 2-5-1, Shikata-cho, Kita-ku, Okayama-shi 700-8558, Okayama, Japan
*
Author to whom correspondence should be addressed.
Int. J. Mol. Sci. 2025, 26(15), 7275; https://doi.org/10.3390/ijms26157275
Submission received: 11 March 2025 / Revised: 15 July 2025 / Accepted: 17 July 2025 / Published: 28 July 2025
(This article belongs to the Section Molecular Genetics and Genomics)

Abstract

Elucidating the mechanisms of radioresistance in highly radiotolerant organisms can provide valuable insights into the adaptation and evolution of organisms. However, research has been limited on many naturally occurring radioresistant organisms due to a lack of information regarding their genetic and biochemical characteristics and the difficulty of handling them experimentally. To address this, we conducted an experiment on adaptive evolution using gamma radiation as the selection pressure to generate evolved Escherichia coli with gamma radiation resistance approximately one order of magnitude greater than that of wild-type E. coli. Gene expressions in all wild-type and evolved radioresistant E. coli in the presence or absence of gamma irradiation were analyzed and compared using RNA sequencing. Under steady-state conditions, the genes involved in survival, cell recovery, DNA repair, and response following stress exposure were upregulated in evolved E. coli compared with those in wild-type E. coli. Furthermore, the evolved E. coli induced these genes more efficiently following gamma irradiation and greater DNA repair activity than that in the wild-type E. coli. Our results indicate that an increased steady-state expression of various anti-stress genes, including DNA repair-related genes, and their highly efficient induction under irradiation are responsible for the remarkable radioresistance of evolved E. coli.

1. Introduction

Organisms have evolved to adapt to diverse environments. Certain species survive in environments characterized by extreme temperatures, salt concentrations, acidity, and alkalinity [1,2,3,4,5,6]. Elucidating the adaptation mechanisms of such species to harsh conditions is expected to provide valuable insights into biological evolution and organismal diversity. Among organisms that can tolerate adverse conditions, certain bacteria are highly resistant to ionizing radiation [7]. Understanding the mechanisms underlying the remarkable radioresistance of these bacteria is of great interest in the context of organismal adaptation.
Studies on radioresistant bacteria have mainly focused on Deinococcus radiodurans, the first reported radioresistant bacterial species [8]. Various indicators have been used to compare the radioresistance of organisms, with the 37% survival dose—defined as the radiation dose that reduces an organism’s survival rate to 37%—being one of the most commonly used [7]. The 37% survival gamma radiation dose in D. radiodurans can reach 7 kGy, over 1000 times greater than that in humans [9]. The mechanisms suggested to drive radioresistance in D. radiodurans include high DNA repair activity through mechanisms common to bacteria and specific to D. radiodurans, a high antioxidant capacity conferred by low-molecular-weight substances, such as carotenoids and enzymes such as superoxide dismutase and catalase, high concentrations of protein-protective Mn ions in the cytosol, and suppressed diffusion of damaged genomic DNA through aggregated nucleoid structures [7,10,11,12]. However, a consensus on the primary driver of resistance remains elusive.
Radioresistant bacteria other than D. radiodurans, such as Rubrobacter radiotolerans and Kineococcus radiotolerans, have also been isolated from natural environments [7] and are extensively and randomly distributed across the phylogenetic tree [13]. Thus, studies focusing solely on the genus Deinococcus are unlikely to provide a complete picture of the mechanisms of radioresistance in these bacteria. However, conducting experimental research on these organisms is particularly challenging due to the limited knowledge of the genetic and biochemical characteristics of various naturally occurring radioresistant bacteria and the difficulties in handling such species.
Laboratory adaptive evolution studies using Escherichia coli, a model organism with well-documented genetic and biochemical characteristics, represent a valuable research strategy for elucidating phenotypes such as radioresistance [14,15,16]. However, these studies have mainly focused on phenotypic changes and mutations in structural genes, with little progress made on changes in gene expression [17,18]. This has also been observed in evolutionary studies of E. coli subjected to ionizing radiation [19,20,21,22,23,24,25]. Therefore, in the present study, we generated radioresistant E. coli through an adaptive evolution experiment with gamma radiation as the selection pressure and analyzed the expression of all genes to clarify the basis of radioresistance and associated evolutionary mechanisms. Our findings showed differentially regulated stress resistance genes in radioresistant E. coli, thus implicating these genes as drivers of radioresistance.

2. Results

2.1. Generation of Radioresistant E. coli via Adaptive Evolution

To generate radioresistant E. coli, cells were cultured in an Luria–Bertani (LB) medium at 37 °C until the early log phase. The culture was resuspended in phosphate-buffered saline (PBS) and irradiated with a 1% survival dose of gamma radiation. Subsequently, the irradiated E. coli were cultured in an LB medium, and their sensitivity to gamma radiation was evaluated via a colony formation assay. The selection procedure was repeated 20 times. Figure 1a shows the relationship between the absorbed dose and the surviving fraction of gamma-irradiated wild-type E. coli. Based on this survival curve, the 1% survival dose for gamma radiation for wild-type E. coli was 240 Gy. The 1% survival dose for the E. coli population obtained after 20 selections was 1900 Gy (Figure 1b). Thus, the adaptive evolution experiment yielded an evolved E. coli population 7.9 times more resistant to gamma radiation than the wild-type. Figure 1c shows the relationship between the number of selection cycles and the 1% survival dose. For up to five cycles of selection, no substantial change was observed in the resistance of E. coli to gamma radiation. However, after the sixth cycle, the E. coli radioresistance gradually increased. If only a limited number of genetic changes were involved in the evolution, radioresistance would be expected to increase in a stepwise manner with increasing selection cycles [21]. The gradual increase in radioresistance in the present experiment indicates that multiple genetic changes, including gene expression, were involved in this adaptive evolution.

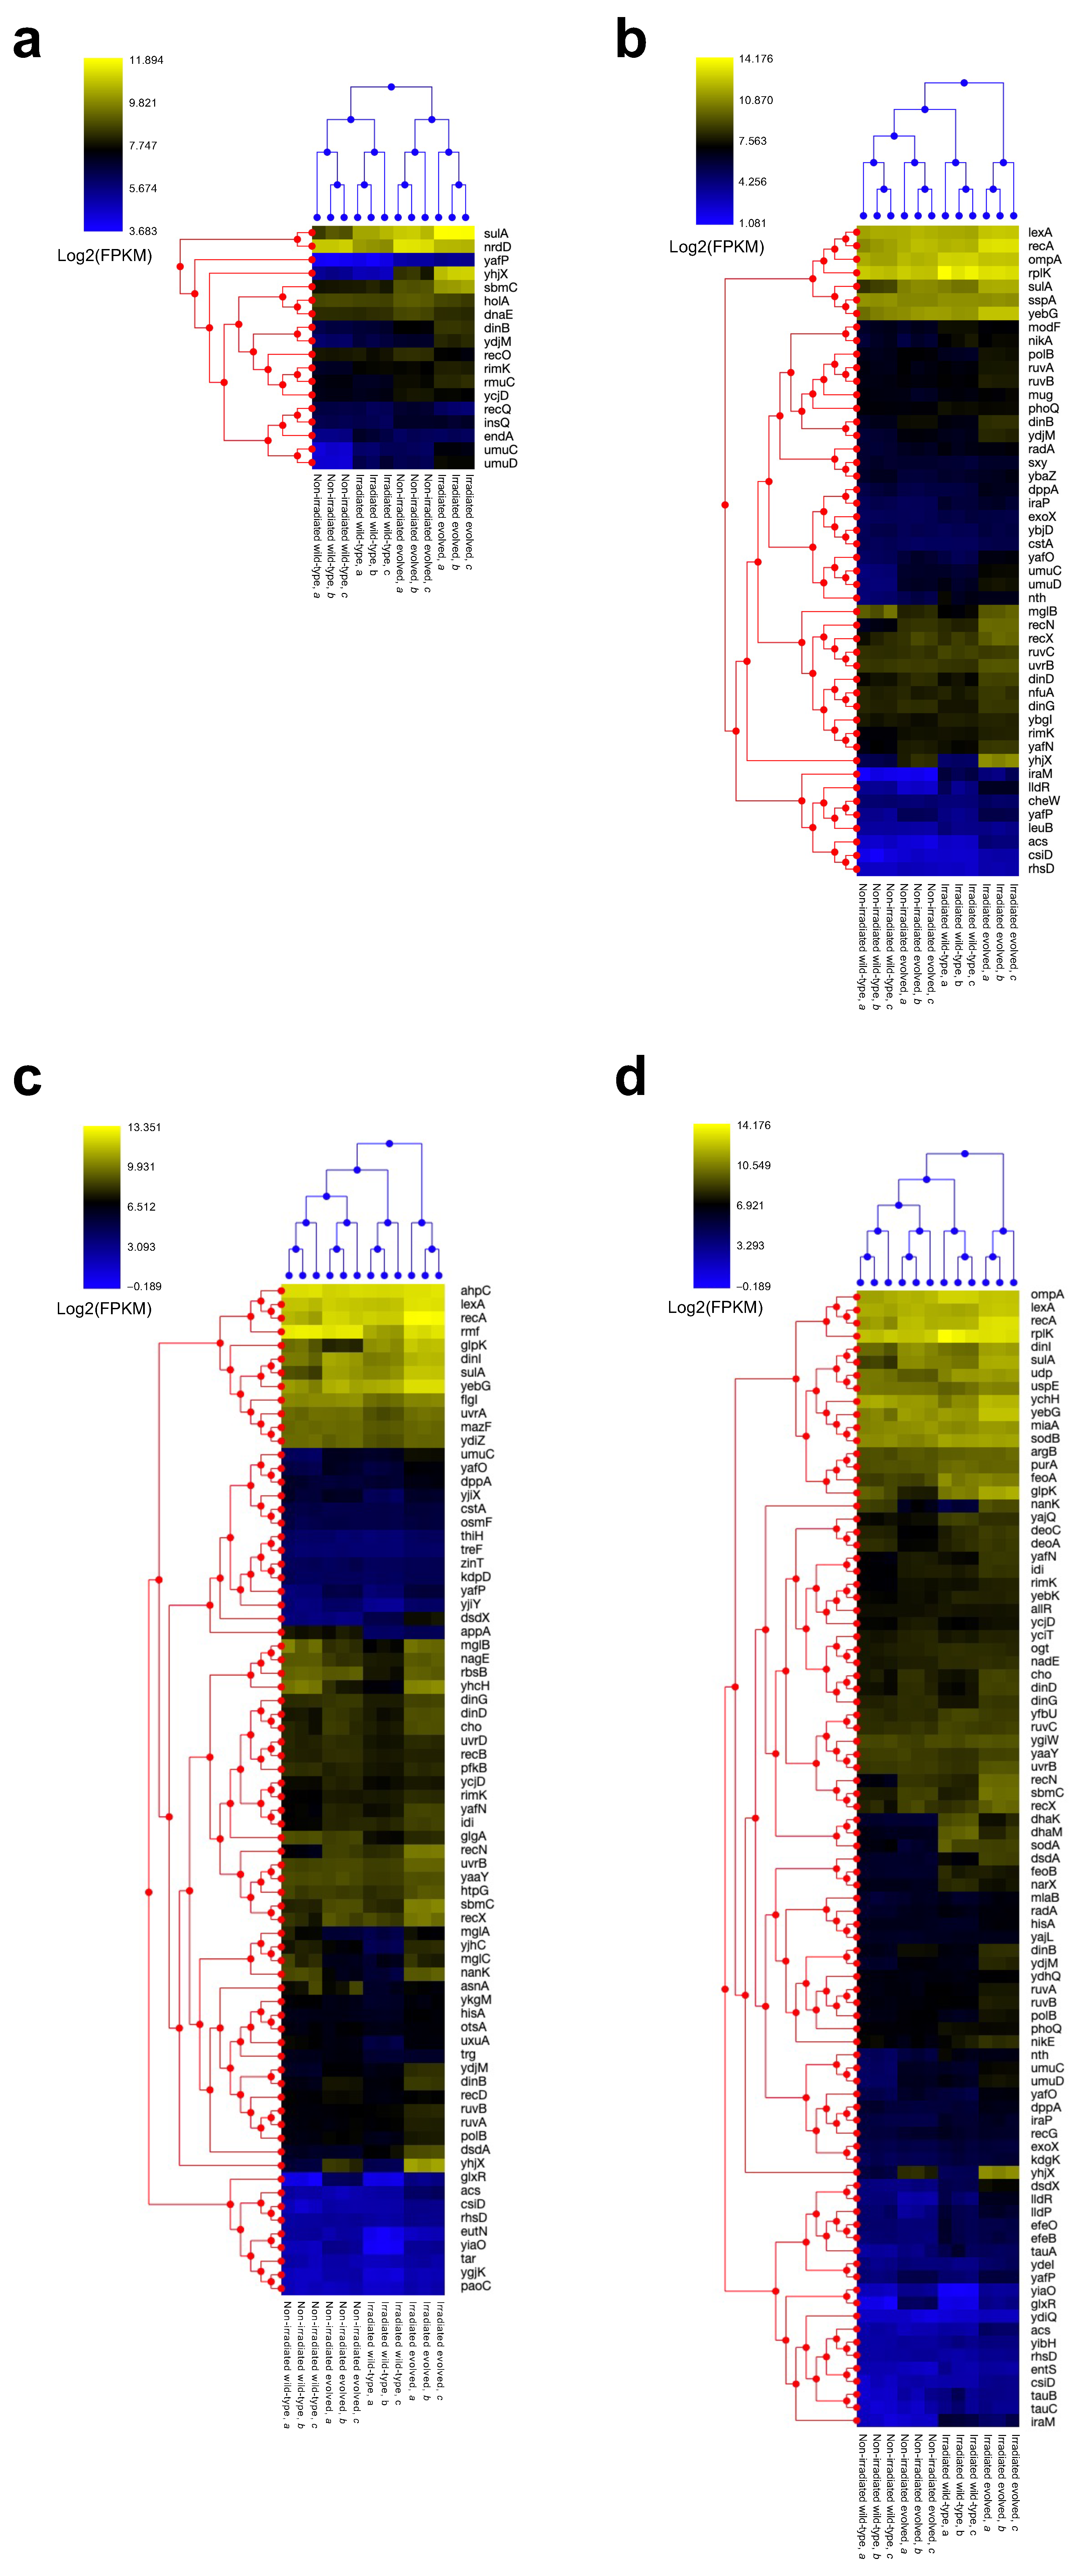
2.2. Alterations in Steady-State Gene Expression Through Evolution

As noted above, multiple genetic changes were involved in the radioresistance acquired through adaptive evolution. Therefore, it is crucial to analyze and compare the expression of all genes in the wild-type and evolved radioresistant E. coli populations under various conditions to elucidate the mechanisms involved in the radioresistant phenotype. We used RNA sequencing (RNA-seq) to analyze the steady-state gene expression in the wild-type and evolved radioresistant E. coli. We also analyzed the gene expression in these cells after irradiation with a 33% survival dose of gamma radiation (65 Gy for wild-type and 420 Gy for evolved E. coli) to clarify their responses to irradiation. The cell populations compared in this study and the treatment conditions are summarized in Figure 2.
Initially, gene expression was compared between non-irradiated wild-type and evolved E. coli (Figure 2, Comparison 1). Figure 3a (left panel) shows the considerable gene expression differences between the two groups using a volcano plot. Significantly differentially expressed genes (DEGs) were identified using Welch’s t-test and multiple testing corrections using the Benjamini–Hochberg method. A total of 115 upregulated and 56 downregulated genes were noted in the evolved compared with wild-type E. coli (Figure 3a, right panel).
The results of the gene ontology (GO) analysis of these significant DEGs are summarized in Figure 4 and Supplementary Table S1. Significantly enriched terms, including SOS response, DNA repair, response to stimuli, and DNA metabolism, were present in Annotation Cluster 1 (2.43 enrichment score) and Annotation Cluster 2 (1.72 enrichment score). Thus, at steady state, the genes involved in survival, cell recovery, DNA repair, and response following stress exposure were upregulated in the evolved, compared with wild-type, E. coli. The results of the GO analysis for the significantly downregulated genes are summarized in Supplementary Figure S1. At steady state, the genes involved in metabolism and redox were downregulated via evolution compared with wild-type E. coli.
Significant DEGs were also subjected to Kyoto Encyclopedia of Genes and Genomes (KEGG) pathway analysis. At steady state, the genes involved in metabolism-related pathways were upregulated in the evolved compared with wild-type E. coli (Supplementary Figure S2). Downregulated genes were not significantly enriched in any KEGG pathway terms. These results highlight the differences in steady-state gene expression between wild-type and evolved E. coli. Furthermore, the genes involved in survival, cell recovery, DNA repair, and response following stress exposure (hereafter referred to as “anti-stress genes”) were significantly upregulated in evolved E. coli.

2.3. Gamma Irradiation-Induced Gene Expression Changes in Wild-Type E. coli

Gene expression was compared between non-gamma-irradiated and gamma-irradiated wild-type E. coli (Figure 2, Comparison 2). Figure 3b shows gene expression changes in wild-type E. coli after gamma irradiation at a 33% survival dose. In total, 457 genes were significantly upregulated, and 755 genes were significantly downregulated by gamma irradiation. The results of the GO analysis for the significantly upregulated genes are summarized in Supplementary Figure S3. No significant enrichment of anti-stress genes was observed among those upregulated by gamma irradiation. In contrast, gamma irradiation upregulated the genes involved in metabolism, ribosome, redox, GTP, and translation. The GO analysis results for the significantly downregulated genes are summarized in Supplementary Figure S4. The genes involved in metabolism, phosphorylation, transport, redox, isomerization, and respiration were downregulated in wild-type E. coli following gamma irradiation.
The KEGG pathway analysis indicated that the genes involved in pathways related to metabolism, ribosome, and RNA polymerase were upregulated in gamma-irradiated wild-type E. coli (Supplementary Figure S5). In contrast, the downregulated genes were implicated in metabolism, phosphorylation, the two-component system, and chemotaxis (Supplementary Figure S6). These results show that gamma irradiation altered gene expression in wild-type E. coli. However, no significant differential regulation of anti-stress genes was observed.

2.4. Gamma Irradiation-Induced Gene Expression Changes in Evolved E. coli

Gene expressions were compared between irradiated and non-irradiated evolved E. coli (Figure 2, Comparison 3). Figure 3c shows the gene expression changes in the evolved E. coli after gamma irradiation at a 33% survival dose. A total of 787 and 901 genes were significantly upregulated and downregulated, respectively. The results of the GO analysis for the significantly upregulated genes are summarized in Supplementary Figure S7. SOS response, DNA repair, and response to stimuli were the GO terms in Annotation Cluster 3 (4.16 enrichment score). Thus, the anti-stress genes were enriched among the upregulated DEGs in the evolved E. coli subjected to gamma irradiation. Other enriched terms included metabolism, respiration, redox, metal clustering, ion binding, cytochrome, ribosome, antioxidant, RNA binding, and transport. The GO results for the significantly downregulated genes are summarized in Supplementary Figure S8. Downregulated DEGs were enriched in transport, RNA, ribosome, redox, respiration, metabolism, and membrane structure.
The KEGG pathway analysis indicated that the genes related to metabolism, ribosome, and transport pathways were enriched among those upregulated in the gamma-irradiated evolved E. coli (Supplementary Figure S9). In addition, downregulated DEGs were implicated in mismatch repair, DNA replication, metabolism, and homologous recombination (Supplementary Figure S10). These results show that gamma irradiation significantly induced anti-stress genes in the evolved E. coli.

2.5. Changes in Effect of Gamma Irradiation on Gene Expression Alteration Through Evolution

Gene expressions were compared between the gamma-irradiated wild-type and evolved E. coli (Figure 2, Comparison 4). Figure 3d shows the differences in gene expression. Compared with the gamma-irradiated wild-type E. coli, 518 genes were significantly upregulated, and 173 genes were significantly downregulated in gamma-irradiated evolved E. coli. The results of the GO analysis for the significantly upregulated genes are summarized in Figure 5 and Supplementary Table S2. Upregulated DEGs were significantly enriched for the SOS response, DNA repair, and response to stimuli GO terms in Annotation Cluster 1 (7.25 enrichment score). Thus, anti-stress genes were enriched among those upregulated in the evolved E. coli compared with wild-type E. coli exposed to gamma irradiation. The upregulated DEGs were also enriched in metabolism, isomerization, redox, respiration, transport, motility, and ion binding. The results of the GO analysis for the significantly downregulated genes in gamma-irradiated evolved versus wild-type E. coli are summarized in Supplementary Figure S11. These genes were enriched for RNA and transport.
KEGG pathway analysis revealed the enrichment of upregulated DEGs in the pathways related to metabolism and flagellar structure (Supplementary Figure S12). The analysis for downregulated genes did not detect any significant pathways. These results highlight distinct gamma irradiation-induced gene expression changes between the wild-type and evolved E. coli. Furthermore, the expression levels of anti-stress genes in evolved E. coli under gamma irradiation were higher than those in wild-type E. coli, indicating that the induction efficiency of the anti-stress genes was higher in evolved E. coli than in wild-type E. coli.

2.6. Effects of Evolution and Gamma Irradiation on Gene Expression Changes

Gene expression was also compared between the non-gamma-irradiated wild-type and gamma-irradiated evolved E. coli (Figure 2, Comparison 5). Figure 3e shows the gene expression differences between the gamma-irradiated evolved versus non-gamma-irradiated wild-type E. coli. A total of 758 and 684 genes were significantly upregulated and downregulated, respectively, in gamma-irradiated evolved E. coli.
The results of the GO analysis for the significantly upregulated DEGs are summarized in Supplementary Figure S13. The GO terms for SOS response, DNA repair, and response to stimuli were present in Annotation Cluster 1 (4.70 enrichment score). Thus, anti-stress genes were enriched among the upregulated DEGs in the gamma-irradiated evolved compared with non-gamma-irradiated wild-type E. coli. The upregulated genes were also involved in metabolism, ribosome, redox, respiration, cytochrome, metal cluster, and quorum sensing. The results of the GO analysis for the significantly downregulated genes are summarized in Supplementary Figure S14. The genes involved in metabolism, ion binding, redox, respiration, transport, membrane structure, and RNA were enriched in the genes whose expression was decreased in gamma-irradiated evolved compared with non-gamma-irradiated wild-type E. coli.
The KEGG pathway analysis indicated that upregulated DEGs were involved in pathways related to metabolism, transport, and ribosome (Supplementary Figure S15), whereas the downregulated DEGs were implicated in metabolism and the two-component system (Supplementary Figure S16). Taken together, these results confirm that the expression of anti-stress genes was significantly increased in gamma-irradiated evolved compared with non-gamma-irradiated wild-type E. coli.

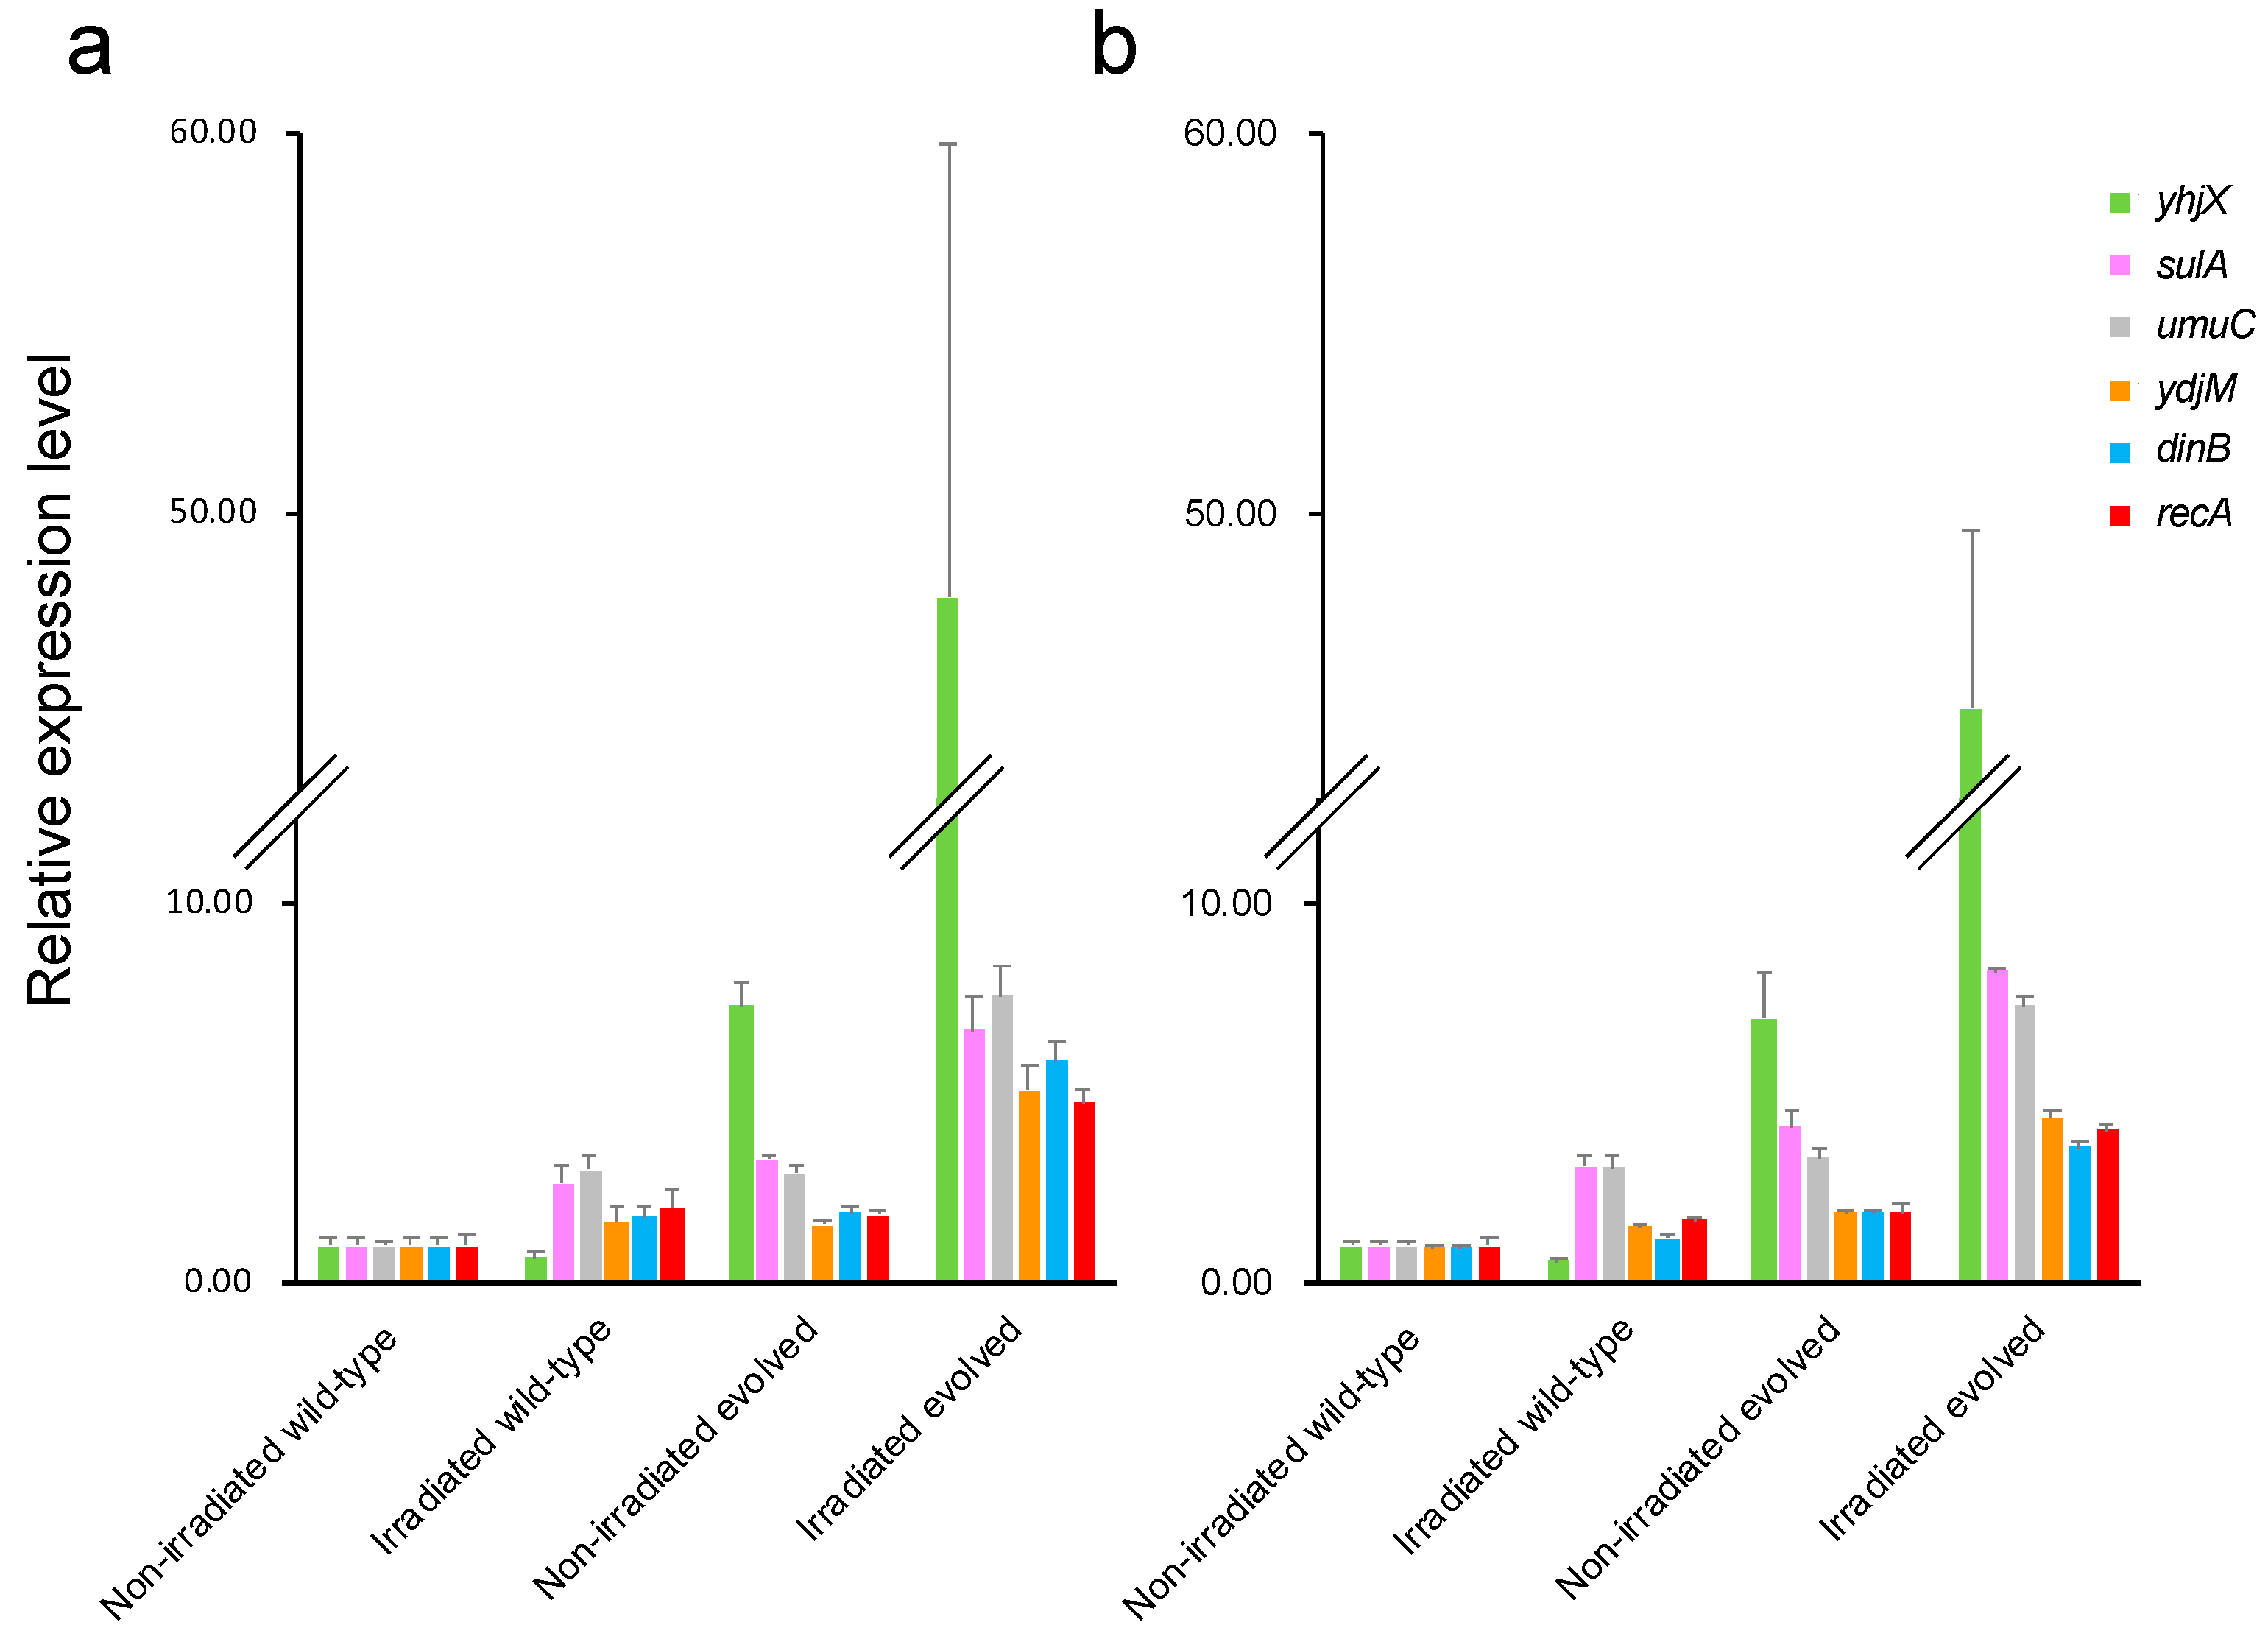
2.7. Changes in Expression Levels of Anti-Stress Genes Induced by Evolution and Gamma Irradiation

As described above, the GO and KEGG pathway analyses revealed qualitative changes in the expression of anti-stress genes. To analyze the changes in the expression levels of these anti-stress genes quantitatively, we performed hierarchical clustering and quantitative real-time reverse transcription polymerase chain reaction (qRT-PCR) analyses.
First, a hierarchical clustering analysis was performed on the expression levels of the genes enriched in the GO analysis of the DEGs upregulated in non-gamma-irradiated evolved versus non-gamma-irradiated wild-type E. coli (Figure 2; Comparison 1, Figure 6a). Three samples within the target group formed clusters. The distance between the non-gamma-irradiated and the gamma-irradiated wild-type E. coli sample clusters was small, as was that between the non-gamma-irradiated and gamma-irradiated evolved E. coli clusters.
Next, a hierarchical clustering analysis was performed on the expression levels of the genes belonging to Annotation Cluster 3 in the GO analysis of the DEGs upregulated in gamma-irradiated versus non-gamma-irradiated evolved E. coli (Figure 2; Comparison 3, Figure 6b). Three samples within the target group formed clusters. The non-gamma-irradiated wild-type E. coli sample cluster was closest to that of the non-gamma-irradiated evolved E. coli samples. The second-smallest distance was found for the gamma-irradiated wild-type E. coli sample cluster, whereas that from the gamma-irradiated evolved E. coli samples was the largest.
Next, we performed a hierarchical clustering analysis on the expression levels of the genes belonging to Annotation Cluster 1 in the GO analysis of the upregulated DEGs in gamma-irradiated evolved versus wild-type E. coli (Figure 2; Comparison 4, Figure 6c). Three samples within the target group formed clusters. The cluster of non-gamma-irradiated wild-type E. coli samples had the smallest distance from that of the non-gamma-irradiated evolved E. coli samples, followed by the cluster of gamma-irradiated wild-type E. coli samples, whereas the largest distance was from the cluster of gamma-irradiated evolved E. coli.
Finally, we performed a hierarchical clustering analysis on the expression levels of the genes belonging to Annotation Cluster 1 in the GO analysis for the DEGs whose expression was increased in gamma-irradiated evolved versus non-gamma-irradiated wild-type E. coli (Figure 2; Comparison 5, Figure 6d). Again, the three samples formed clusters. The non-gamma-irradiated wild-type E. coli sample cluster was the closest to that of the non-gamma-irradiated evolved E. coli samples, followed by the gamma-irradiated wild-type E. coli sample cluster, whereas the largest distance was noted for the gamma-irradiated evolved E. coli samples. These results indicated the following ranking regarding anti-stress gene expression: non-gamma-irradiated wild-type E. coli < gamma-irradiated wild-type E. coli ≈ non-gamma-irradiated evolved E. coli < gamma-irradiated evolved E. coli.
We used qRT-PCR to quantify the expression levels in each sample of the five genes that were analyzed among all comparison groups in the hierarchical clustering analysis, which differed the most between the non-gamma-irradiated wild-type and the gamma-irradiated evolved E. coli (yhjX, sulA, umuC, ydjM, and dinB), as well as those of recA, which has a critical function in DNA double-strand break repair. Figure 7 shows the expression levels determined via qRT-PCR and RNA-seq, which were in good agreement, validating the results obtained via the latter method. The expression levels of these genes ranked as follows among the groups: non-gamma-irradiated wild-type E. coli < gamma-irradiated wild-type E. coli ≈ non-gamma-irradiated evolved E. coli < gamma-irradiated evolved E. coli. Anti-stress genes exhibited pronounced upregulation in evolved versus wild-type E. coli, with a further increase after induction under gamma irradiation.

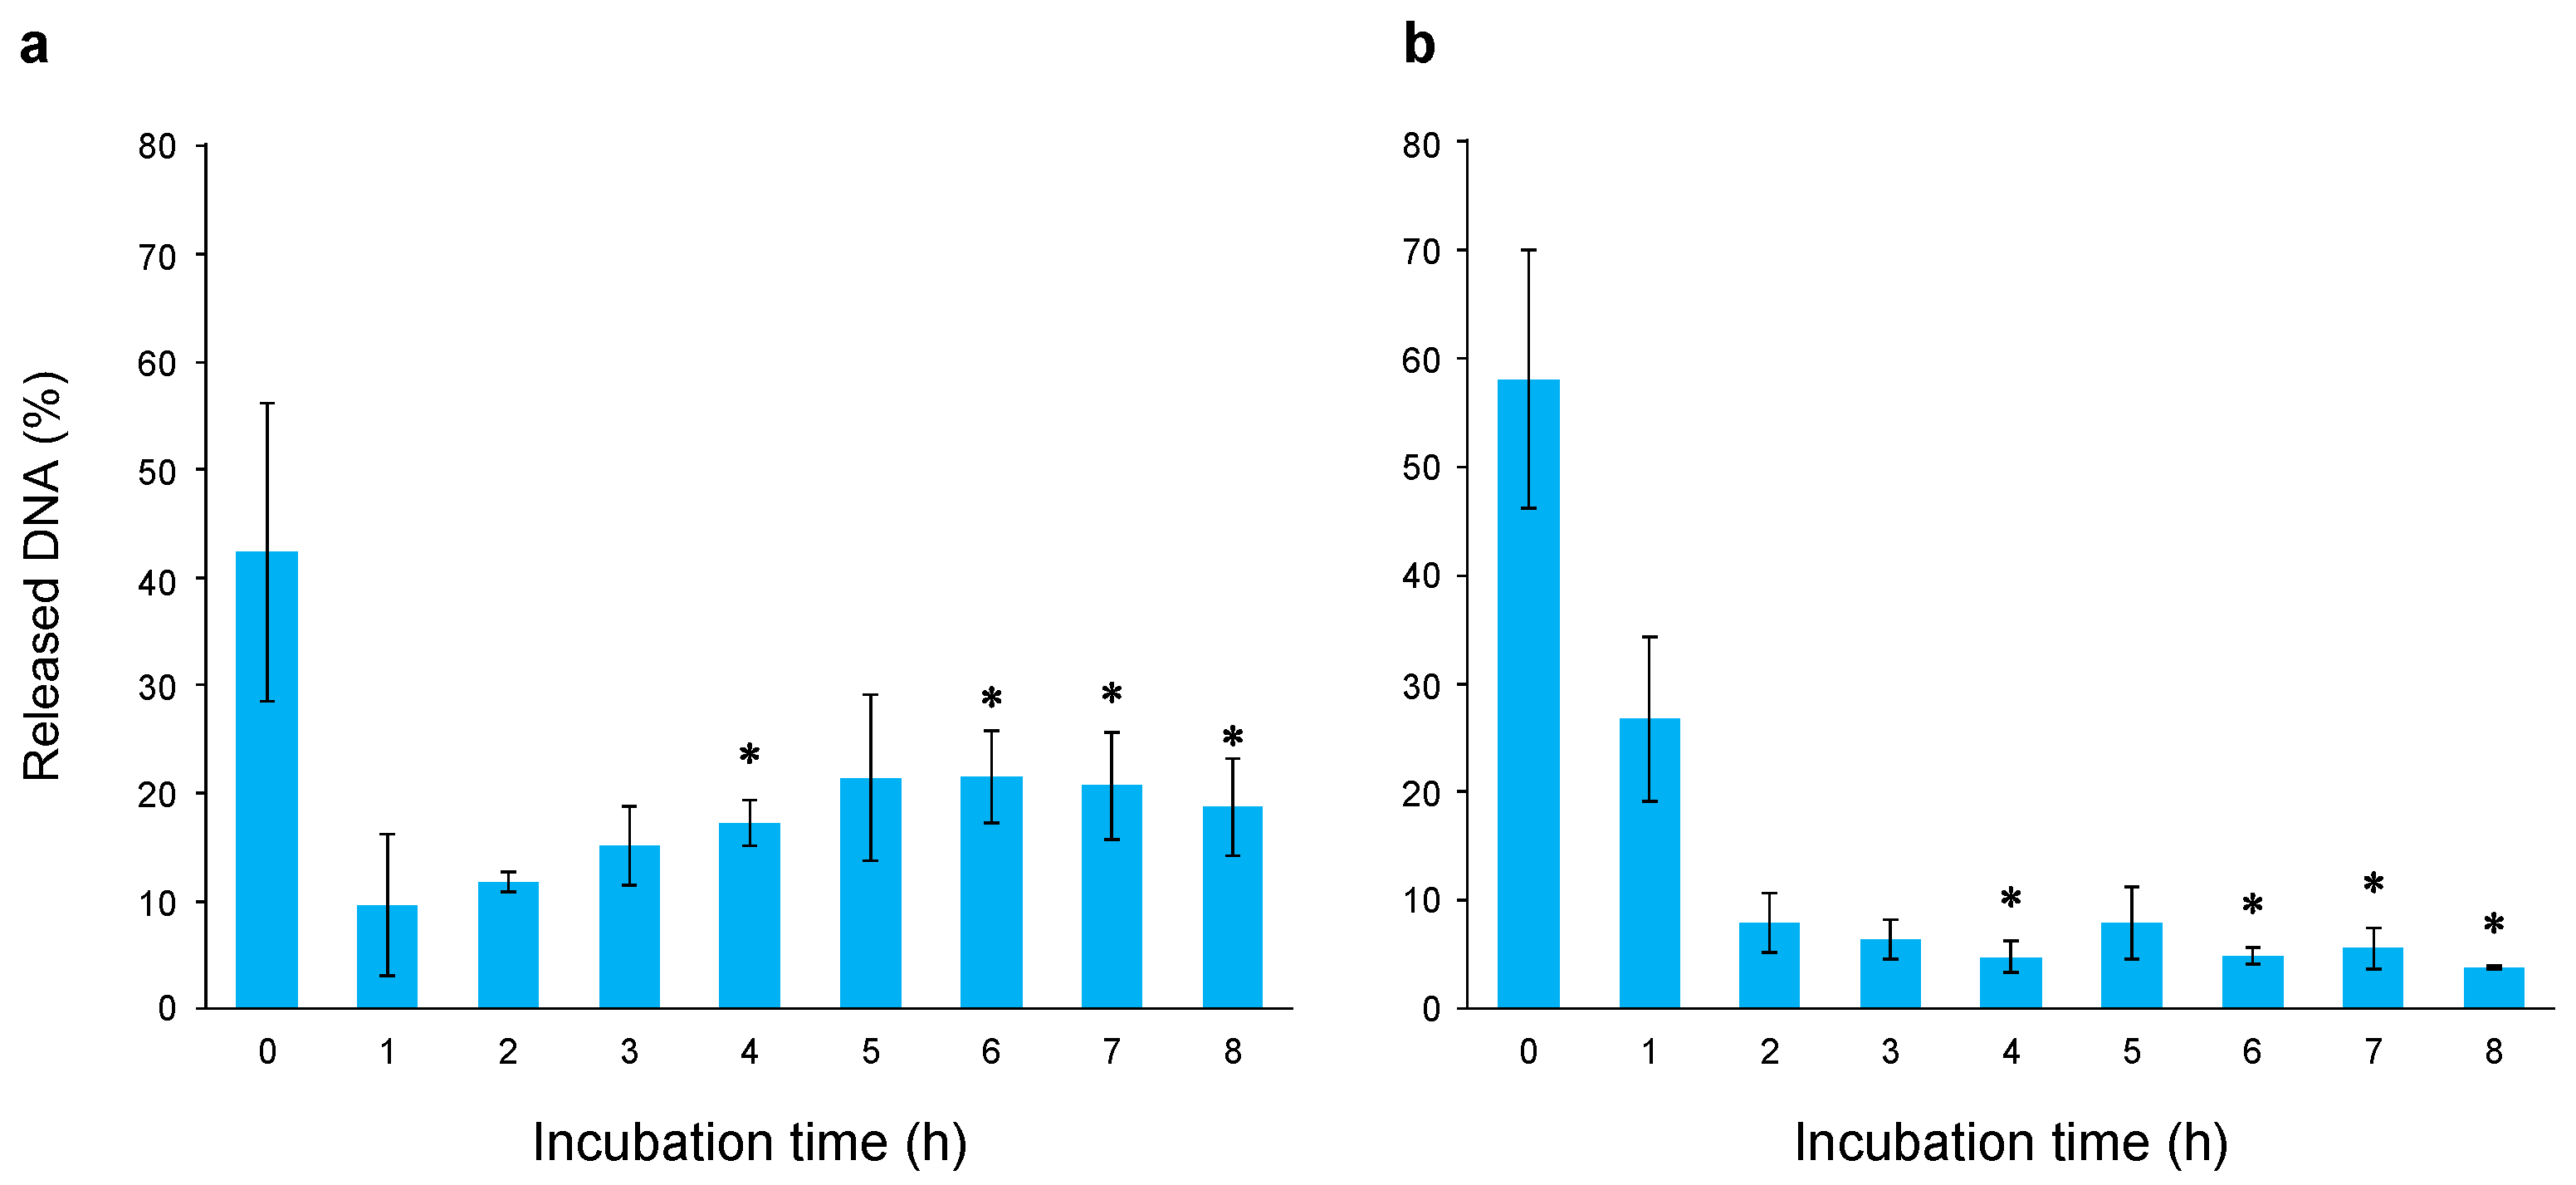
2.8. Comparison of Protective and Repair Activities Against Gamma Irradiation-Induced Genomic DNA Damage Between Wild-Type and Evolved E. coli

Genomic DNA damage is the main cause of radiation-induced cell death [26]. To assess whether an enhanced protective capacity of genomic DNA is involved in the high radioresistance of evolved E. coli, we compared genomic DNA damage in wild-type and evolved E. coli irradiated with 0–400 Gy of gamma radiation using the static field gel electrophoresis (SFGE) method. The degree of DNA double-strand breaks (DNA damage) was evaluated based on the proportion of DNA released from the well to the total amount of DNA electrophoresed (hereafter referred to as the “proportion”). No significant difference in the degree of DNA double-strand breaks induced by gamma irradiation was observed between the wild-type and evolved E. coli (Supplementary Figure S17), indicating a lack of evidence of enhanced DNA protection in evolved E. coli.
We then examined the possibility that the enhanced repair capacity of genomic DNA conferred high radioresistance in the evolved E. coli. Wild-type and evolved E. coli were irradiated with 2.5 kGy of gamma radiation, followed by shaking incubation of each cell in an LB medium at 37 °C. The incubated cells were aliquoted every hour for 0–8 h, and the degree of double-strand breaks in genomic DNA was evaluated using the SFGE method. No logarithmic growth occurred in any of the cells after up to 8 h of incubation (Supplementary Figure S18), showing that changes in the degree of DNA double-strand breaks were not attributable to cell proliferation. Figure 8 shows the differences between the wild-type and evolved E. coli at different incubation times after gamma irradiation. At 4–8 h of incubation (except for 5 h), the proportion of evolved E. coli was significantly lower than that of wild-type E. coli (p < 0.05). For example, the proportion of evolved E. coli at 8 h of incubation was 3.9%, whereas that of wild-type E. coli was 18.7%. In evolved E. coli, the proportion after 1 h of incubation was significantly decreased compared with that at 0 h (p < 0.05). In wild-type E. coli, there was no significant difference between the proportions at 0 h and after 1 h of incubation. These results show that the DNA double-strand break repair activity of evolved E. coli was significantly upregulated compared with that of wild-type E. coli, indicating enhanced DNA repair as the basis of high radioresistance in evolved E. coli.

3. Discussion

In the present study, we performed an adaptive evolution experiment with gamma radiation as the selection pressure and generated an evolved radioresistant E. coli population that was 7.9 times more resistant to gamma radiation than wild-type E. coli. Our subsequent analyses revealed the following: (1) Steady-state gene expression differed between wild-type and evolved E. coli. The genes involved in survival, cell recovery, DNA repair, and response following stress exposure (anti-stress genes) were significantly upregulated in evolved E. coli compared with wild-type E. coli. (2) The effect of gamma irradiation on gene expression differed between wild-type and evolved E. coli. The induction efficiency of anti-stress genes by gamma irradiation in the evolved E. coli was greater than that in wild-type E. coli. (3) The steady-state expression levels of anti-stress genes were increased in the evolved compared with the wild-type E. coli, with further induction by gamma irradiation. (4) Enhanced DNA repair activity was primarily involved in the high radioresistance of the evolved E. coli. These results indicate that the increased steady-state expression of numerous anti-stress genes and their highly efficient induction by gamma irradiation are, at least in part, responsible for the radioresistance of the evolved E. coli. Our study offers insights into the molecular basis of radioresistance, biological defense mechanisms, and their evolution in bacteria and other organisms. These findings may contribute to applied research regarding evolution in response to external stress, such as elucidating the mechanism of emergence of radioresistant cells during radiotherapy and the mechanism of evolution of drug-resistant microorganisms.
Several studies have analyzed radioresistant E. coli generated via adaptive evolution experiments using electromagnetic ionizing radiation (gamma and X-radiation) as the selection pressure [19,20,21,22,23]. Recently, electron beams have also been employed as a selection pressure, triggering a molecular response mechanism distinct from that in response to electromagnetic ionizing radiation [24,25]. However, studies on the radioresistance of evolved E. coli have mainly focused on the phenotypic changes and mutations in structural genes. In the present study, we comprehensively analyzed gene expression changes in E. coli that evolved radioresistance under gamma radiation and found striking differences compared with wild-type E. coli. Byrne et al. previously analyzed the expression profiles of evolved radioresistant E. coli generated through an adaptive evolution experiment with gamma radiation and reported little change in the steady-state expression profile of evolved versus wild-type E. coli [22]. However, they only analyzed two clonal populations. In our study, gene expression was analyzed in the evolved E. coli population. Evolution can be defined as a phenomenon in which the characteristics of a population change over generations [27]. This definition highlights the importance of analyzing genetic changes in the entire evolved population. Therefore, various studies have explored gene expression in cell populations subjected to adaptive evolution [14,17,18,28]. We believe that this difference in experimental approach underpins the discrepancies between our findings and those of Byrne et al. [22]. Organisms respond to external stresses such as radiation in various ways [29]. Thus, irradiation-induced gene expression could provide valuable insights into the radioresistance mechanism of evolved E. coli. To the best of our knowledge, this is the first study to comprehensively analyze post-irradiation gene expression changes in radioresistant E. coli generated by adaptive evolution.
Anti-stress genes are induced by damaging stimuli, such as DNA damage, as observed during the SOS response. Survival and cell recovery after irradiation through processes such as DNA repair are promoted by genes that include recA, recB, recO, recQ, ruvA, and uvrA; cell division inhibition by sulA; and translesion replication mediated via dinB, umuC, and umuD. Furthermore, genes such as dinB, umuC, and umuD likely serve as mutators, increasing the diversity and fitness of the population. The gradual increase in radioresistance after six cycles of selection (Figure 1c) indicates that genetic changes affecting mutation rates may have occurred at this point, promoting a pronounced subsequent increase in population fitness, i.e., radioresistance.
In addition to gene expression changes directly involved in survival, cell recovery, DNA repair, and response following stress exposure, we also observed considerable changes in the expression of genes involved in metabolism, redox, and transport. In the radioresistant bacterium D. radiodurans, the inhibition of protein oxidation by the regulation of the redox state through accumulated intracellular Mn ions and by low-molecular-weight antioxidant metabolites contributes to radioresistance [30,31,32,33]. Furthermore, we previously demonstrated that antioxidants, such as specialized carotenoid molecules, are involved in the radioresistance of several radioresistant bacteria, owing to their antioxidant activity [34,35,36,37,38]. Irradiation-induced protein oxidation in one isolate of evolved radioresistant E. coli generated via an adaptive evolution experiment with electron beams was lower than that in wild-type E. coli [25]. Moreover, metabolic changes may contribute to increased radioresistance in E. coli generated through an adaptive evolution experiment with gamma radiation [23]. In our study, changes in the expression of these genes may have optimized the intracellular environment for survival, cell recovery, DNA repair, and biomolecular protection after irradiation through the regulation of metabolism, ion concentration, redox, and antioxidant activity.
A KEGG pathway enrichment analysis of the genes downregulated in gamma-irradiated compared with non-gamma-irradiated evolved E. coli revealed enrichment in the pathways related to mismatch repair (Supplementary Figure S10). This downregulation of mismatch repair-related genes, along with changes in dinB, umuC, and umuD expression, may increase the mutation rate and thus promote population fitness. The KEGG analysis also revealed the enrichment of genes belonging to homologous recombination-related pathways (Supplementary Figure S10). Their expression levels were decreased in gamma-irradiated compared with non-gamma-irradiated evolved E. coli (Supplementary Figure S19a). However, a GO analysis indicated increased DNA repair gene expression (Supplementary Figure S7). Gamma irradiation upregulated the expression levels of many genes involved in homologous recombination repair, including recA, recN, ruvA, and ruvB, in evolved E. coli (Figure 6b). Furthermore, the expression levels of all homologous recombination genes, highlighted by the KEGG pathway analysis, increased in non-gamma-irradiated evolved versus wild-type E. coli (Supplementary Figure S19b). These results indicate that gamma irradiation induced the downregulation of several homologous recombination-associated genes, which were already upregulated at a steady state in evolved E. coli (compared with wild-type E. coli). Thus, the optimization of the balance of expression of homologous recombination-associated genes in evolved E. coli may contribute to its high homologous recombination repair activity.
This study also compared gene expression between evolved E. coli irradiated with 65 Gy of gamma radiation (33% survival dose in wild-type E. coli) and non-gamma-irradiated evolved E. coli. This comparison revealed no significant DEGs. Considering that the expression of many genes in wild-type E. coli was significantly altered by 65 Gy of gamma irradiation (Figure 3b), our findings highlight striking differences in the effect of gamma irradiation on gene expression between the wild-type and evolved E. coli. Evolved E. coli is likely able to maintain homeostasis even under 65 Gy of gamma irradiation by relying on anti-stress genes that are already upregulated in the steady state. This may also represent an overall optimization of gene expression for environmental adaptation.
Although these alterations in gene expression are thought to be driven by changes in the genomic sequence, the possibility that they are caused by epigenetic changes cannot be completely discarded. To clarify the mechanism of gene expression regulation at the transcriptional level, all genomic sequences, focusing on the transcription regulatory region, between wild-type and evolved E. coli, should be compared, and an epigenetic analysis using long-read sequencing or other methods should be performed. In addition, a proteome analysis should be performed to examine the possibility of regulation at the post-transcriptional level. An analysis of the mutations detected by genome sequencing and the activity of DNA repair enzymes with mutations would also provide valuable information for elucidating radioresistance in evolved E. coli. A kinetic analysis of gene expression after gamma irradiation will be useful for elucidating the stress response of evolved E. coli. An analysis of the resistance of evolved E. coli to stresses other than gamma irradiation, such as various types of radiation and oxidative stress, may provide additional insight into the evolution of stress resistance in organisms. How the phenotype acquired by evolved E. coli affects its fitness under natural conditions is important in the process of further evolution, and it is desirable to clarify it by culturing evolved E. coli and wild-type E. coli under competitive conditions.
Even when evolution proceeds under the same selection pressure, ultimately resulting in equivalent phenotypes, different molecular mechanisms of evolution are expected to act on different populations owing to stochastic effects. In adaptive evolution experiments with an electron beam as the selection pressure, several evolved E. coli lineages have been identified via mutation analysis, following unique evolutionary paths [24,25]. In the present study, we analyzed changes in gene expression and DNA repair activity in evolved E. coli populations resulting from a single adaptive evolution experiment. Although the analysis of evolutionary mechanisms in a single population can reveal one aspect of the mechanism under specific selection pressures, this approach fails to recapitulate the diversity of potentially involved evolutionary mechanisms. Therefore, further adaptive evolution experiments should be conducted to generalize the evolutionary mechanisms driving radioresistance and the biological defenses driven by changes in gene expression in bacteria and other organisms.
Gene expression changes and their overall optimization are thought to play an important role in phenotypic evolution [18,39,40]. The present study revealed that radioresistant E. coli evolved under radiation as the selection pressure exhibited increased steady-state expression and highly efficient induction of anti-stress genes, including cell recovery and DNA repair genes, in addition to the accumulation of mutations. These results indicate that increased expression and induction efficiency of many anti-stress genes can greatly enhance radioresistance and bioprotective activity in bacteria and other organisms. Furthermore, alterations in the expression of various genes likely contribute to the evolution of defense systems against radiation and other stresses during early evolutionary stages. To provide a more precise explanation of the basic radioresistance and biological defense of bacteria and other organisms and the evolutionary mechanisms involved, replicated adaptive evolution experiments with multiple populations should be conducted, and the number of generations subjected to selection should be increased. Moreover, phenotypes, such as radioresistance, and gene expression in evolving populations at each evolutionary stage should be analyzed to clarify the effects of gene expression changes on the phenotype.

4. Materials and Methods

4.1. Sensitivity of E. coli Cells to Gamma Irradiation

E. coli K-12 MG1655, which was stored in our laboratory and has never been exposed to radiation, was used in this study [41]. E. coli was cultured in an LB medium (Lennox L Broth, L7275) (Sigma-Aldrich, St. Louis, MO, USA) at 37 °C with shaking (200 rpm) until the early log phase was reached. One milliliter of the culture was centrifuged at 4000× g for 10 min at 20 °C. The supernatant was removed, and 1 mL of PBS was added to suspend the E. coli. The E. coli suspension was irradiated with an appropriate dose of gamma radiation at 22 Gy/min at 20 ± 3 °C. Gamma irradiation was performed at the Co-60 Gamma-ray Irradiation Facility of the Institute for Integrated Radiation and Nuclear Science, Kyoto University. The irradiated E. coli suspension was appropriately diluted with PBS, and the diluted solution was plated on LB agar plates. After the plates were incubated at 37 °C for 12 h, the generated colonies were counted, and the surviving fraction was calculated to obtain a survival curve (colony formation assay).

4.2. Adaptive Evolution Experiment with Gamma Radiation as Selection Pressure

E. coli was cultured in an LB medium at 37 °C with shaking (200 rpm) until the early log phase. The culture was diluted with PBS and plated on LB agar plates. The plates were incubated at 37 °C for 12 h, and one of the resulting colonies was selected for subsequent experiments.
The procedure described hereafter was repeated 20 times. E. coli was cultured in LB medium at 37 °C with shaking (200 rpm) until the early log phase. One milliliter of the culture was centrifuged at 4000× g for 10 min at 20 °C. The supernatant was removed, and 1 mL of PBS was added to suspend the E. coli. The E. coli suspension (approximately 2 × 10⁸ cells) was irradiated with a 1% survival dose of gamma radiation obtained from the survival curve at 22 Gy/min at 20 ± 3 °C. The irradiated E. coli suspension was added to 100 mL of LB medium, and the cells were cultured at 37 °C with shaking (200 rpm) until the early stationary phase. Glycerol stocks of the resulting E. coli population were prepared, and their resistance to gamma radiation was analyzed based on colony formation.

4.3. Preparation of Cells for Gene Expression Analysis

E. coli was cultured in an LB medium at 37 °C with shaking (200 rpm) until the early log phase. Twenty milliliters of the culture were centrifuged at 2000× g for 20 min at 20 °C. The supernatant was removed, and 5 mL of PBS was added to suspend the E. coli. The E. coli suspension was irradiated with 0, 65, and 420 Gy of gamma radiation at 22 Gy/min at 20 ± 3 °C. The irradiated E. coli suspension was added to 200 mL of LB medium and incubated at 37 °C for 2 h with shaking (200 rpm). After incubation, the E. coli suspension was immediately cooled on ice and centrifuged at 4000× g for 10 min at 4 °C. The supernatant was then removed to obtain cell pellets.

4.4. Analysis of Gene Expression via RNA-Seq

Total RNA was extracted from E. coli pellets using RNAiso Plus (Takara Bio Inc., Kusatsu, Japan). The extracted RNA was purified using NucleoSpin RNA Clean-up XS (Macherey-Nagel, Düren, Germany). RNA concentrations were measured using a NanoDrop 1000 spectrophotometer (Thermo Fisher Scientific, Waltham, MA, USA). The quality of the prepared RNA was confirmed using an Agilent 2100 Bioanalyzer (Agilent Technologies, Santa Clara, CA, USA). The rRNA was removed from purified RNA using the Ribo-Zero Magnetic Kit (Gram-Negative Bacteria) (Illumina, San Diego, CA, USA). Sequencing libraries were prepared using the TruSeq Stranded mRNA Sample Prep Kit (Illumina). These procedures were performed in an RNase-free environment. The quality of the sequencing library was confirmed using an Agilent 2100 Bioanalyzer. A sequence analysis of the libraries was performed using a NovaSeq 6000 (Illumina), NovaSeq 6000 S4 Reagent Kit (Illumina), and NovaSeq Xp 4-Lane Kit (Illumina). The sequence depth was 3000 ×, and the read length was 2 × 150 bp. Read sequences were mapped to the GCF_000005845.2 E. coli K-12 reference genome (ftp://ftp.ncbi.nlm.nih.gov/genomes/all/GCF/000/005/845/GCF accessed on 22 August 2018) using STAR ver. 2.5.3a [42]. Fragments per kilobase of transcript per million mapped fragments (FPKMs) were calculated using Genedata Profiler Genome ver. 11.0.8 (Genedata, Basel, Switzerland). All kits, equipment, and software were used according to the manufacturer’s instructions. To exclude noise, gene data with FPKM values < 1 for all samples among the comparisons were filtered and removed [43]. The obtained FPKMs were used to compare gene expressions. DEGs were identified via Welch’s t-test and multiple testing corrections using the Benjamini–Hochberg method [44]. Genes with q < 0.05 were considered significant DEGs.

4.5. GO, KEGG Pathway, and Hierarchical Clustering Analyses

DEGs were subjected to GO and KEGG pathway enrichment analyses using Database for Annotation, Visualization and Integrated Discovery (DAVID) ver. 6.8 [45]. Functional annotation clustering in GO analysis was performed in FAT mode for the biological process, cellular component, and molecular function categories. A modified Fisher’s exact test was used to assess significance in the DAVID analyses, and comparisons with p < 0.05 or Enrichment Score ≥ 1.3 were considered significantly different. A hierarchical clustering analysis of the gene expressions among samples was performed using WebMeV [46].

4.6. qRT-PCR Analysis

Total RNA from the cells was prepared as described for RNA-seq. The resulting total RNA was reverse-transcribed using a SuperScript VILO cDNA Synthesis Kit (Thermo Fisher Scientific). The resulting cDNA was amplified using TaqMan PreAmp Master Mix (Thermo Fisher Scientific). Real-time PCR was performed using amplified cDNA, TaqMan Universal Master Mix II, no UNG (Thermo Fisher Scientific), a Custom TaqMan Gene Expression Assay for each gene (Thermo Fisher Scientific), a BioMark 48.48 Dynamic Array (Standard BioTools Inc., South San Francisco, CA, USA), and a real-time PCR system/BioMark System (Standard BioTools). All kits and equipment were used according to the manufacturer’s instructions. Assay IDs, primer sequences, and probe sequences for each Custom TaqMan Gene Expression Assay are summarized in Supplementary Table S3. The temperature cycle for the real-time PCR was 50 °C for 2 min and 95 °C for 10 min, followed by 40 cycles of 95 °C for 15 s and 60 °C for 1 min. Relative gene expression levels were calculated via the 2−ΔΔCt method (ABI User Bulletin #2) [47] using gyrA [Entrez Gene ID: 946614] as the internal reference gene [48]. PCR template concentrations were prepared to enable quantification via the 2−ΔΔCt method such that the amplification efficiencies among the compared genes were equivalent.

4.7. Analysis of DNA Protective Activity

E. coli was cultured in an LB medium at 37 °C with shaking (200 rpm) until the early log phase. One milliliter of the culture was centrifuged at 4000× g for 10 min at 4 °C. The supernatant was removed, and 1 mL of PBS was added to suspend the E. coli. The E. coli suspension was irradiated with 0, 50, 100, 200, and 400 Gy gamma radiation at 22 Gy/min on ice. The irradiated E. coli suspension was centrifuged at 4000× g for 10 min at 4 °C, and the supernatant was removed to obtain cell pellets. The degree of double-strand breaks in the genomic DNA (degree of DNA damage) in the resulting cells was evaluated using the SFGE method [49] as follows: E. coli cells (5 × 10⁷ CFU) were embedded in 1% agarose gel plugs (SeaPlaque GTG agarose; Cambrex Corporation, East Rutherford, NJ, USA). The plugs were shake-incubated in a lysis solution (1% Sarcosyl, FUJIFILM Wako Pure Chemical Corporation, Osaka, Japan; 0.2% Proteinase K, FUJIFILM Wako Pure Chemical Corporation; 50 mM Tris-HCl [pH 7.5], and 25 mM EDTA) at 50 °C and 150 rpm for 16 h. The plugs were washed four times (2 h per wash) in TE buffer (10 mM Tris-HCl (pH 8.0) and 1 mM EDTA) and inserted into wells of 0.6% agarose gel (pulsed-field certified agarose) (Bio-Rad Laboratories, Hercules, CA, USA). The gels were electrophoresed in TBE buffer (89 mM Tris, 89 mM boric acid, and 2 mM EDTA) at a constant current of 17 mA/gel for 20 h using an electrophoresis apparatus AE-6111 (ATTO Corporation, Tokyo, Japan). The gels were stained with ethidium bromide (2.5 µg/mL; FUJIFILM Wako Pure Chemical Corporation) in a TBE buffer and then washed twice with autoclaved water (5 h per wash). Gel images were captured under a UV transilluminator using an E-graph AE-9000 (ATTO) gel-imaging system. The proportion of the amount of DNA released from the well via fragmentation to the total amount of DNA electrophoresed was analyzed using the image analysis software ImageJ ver. 1.53 (https://imagej.net/ij/index.html accessed on 8 February 2022).

4.8. Analysis of Cell Proliferation After Gamma Irradiation

E. coli was cultured in an LB medium at 37 °C with shaking (200 rpm) until the early log phase. Twelve milliliters of the culture were centrifuged at 2000× g for 20 min at 4 °C. The supernatant was removed, and 12 mL of PBS was added to suspend the E. coli. The E. coli suspension was irradiated with 2.5 kGy of gamma radiation at 22 Gy/min on ice. The irradiated E. coli suspension was centrifuged at 2000× g for 20 min at 4 °C. The supernatant was removed, and 12 mL LB medium was added to resuspend the cells. The resuspension was incubated at 37 °C with shaking (200 rpm). From 0 to 10 h, 1 mL of the E. coli suspension was aliquoted at the appropriate times, and the turbidity (optical density) was measured at 600 nm.

4.9. Analysis of DNA Repair Activity

E. coli was cultured in an LB medium at 37 °C with shaking (200 rpm) until the early log phase. Twelve milliliters of the culture were centrifuged at 2000× g for 20 min at 4 °C. The supernatant was removed, and 12 mL of PBS was added to suspend the E. coli. The E. coli suspension was irradiated with 2.5 kGy of gamma radiation at 22 Gy/min on ice. The irradiated E. coli suspension was centrifuged at 2000× g for 20 min at 4 °C. The supernatant was removed; 12 mL LB medium was added to resuspend the cells. And the resuspension was incubated at 37 °C with shaking (200 rpm). Every hour from 0 to 8 h, 1 mL of the E. coli suspension was aliquoted, centrifuged at 4000× g for 10 min at 4 °C, and the supernatant was removed to obtain cell pellets. The degree of double-strand breaks in the genomic DNA was evaluated using the SFGE method.

4.10. Statistics and Reproducibility

Unless otherwise noted, the experiments in this study were performed with three biological replicates. A two-sided Welch’s t-test was used to assess significant differences between the two comparison groups, and p < 0.05 indicated a significant difference. Data are presented as the mean ± standard deviation.

Supplementary Materials

The following supporting information can be downloaded at https://www.mdpi.com/article/10.3390/ijms26157275/s1.

Author Contributions

T.S.: Conceptualization, Methodology, Investigation, Writing—original draft, Supervision, Project administration, Funding acquisition. H.T.: Investigation, Resources, Writing—review and editing. All authors have read and agreed to the published version of the manuscript.

Funding

This work was supported by the Japan Society for the Promotion of Science (JSPS) KAKENHI, grant number JP20K12160.

Institutional Review Board Statement

Not applicable.

Informed Consent Statement

Not applicable.

Data Availability Statement

The original data presented in the study are openly available in the DNA Data Bank of Japan (DDBJ) Genomic Expression Archive (GEA) with the Experiment Accession ID E-GEAD-660.

Conflicts of Interest

The authors declare no conflicts of interest. The funder had no role in the design of the study; in the collection, analyses, or interpretation of data; in the writing of the manuscript; or in the decision to publish the results.

Abbreviations

The following abbreviations are used in this manuscript:
LB mediumLuria–Bertani medium
PBSphosphate-buffered saline
RNA-seqRNA sequencing
DEGsdifferentially expressed genes
GOgene ontology
KEGGKyoto Encyclopedia of Genes and Genomes
qRT-PCRquantitative real-time reverse transcription polymerase chain reaction
SFGEstatic field gel electrophoresis
FPKMsfragments per kilobase of transcript per million mapped fragments
DAVIDDatabase for Annotation, Visualization and Integrated Discovery
CFUColony-forming unit

References

  1. Horikoshi, K. Alkaliphiles: Some Applications of Their Products for Biotechnology. Microbiol. Mol. Biol. Rev. 1999, 63, 735–750. [Google Scholar] [CrossRef]
  2. Baker-Austin, C.; Dopson, M. Life in acid: pH homeostasis in acidophiles. Trends Microbiol. 2007, 15, 165–171. [Google Scholar] [CrossRef] [PubMed]
  3. Falb, M.; Müller, K.; Königsmaier, L.; Oberwinkler, T.; Horn, P.; von Gronau, S.; Gonzalez, O.; Pfeiffer, F.; Bornberg-Bauer, E.; Oesterhelt, D. Metabolism of halophilic archaea. Extremophiles 2008, 12, 177–196. [Google Scholar] [CrossRef]
  4. Takai, K.; Nakamura, K. Archaeal diversity and community development in deep-sea hydrothermal vents. Curr. Opin. Microbiol. 2011, 14, 282–291. [Google Scholar] [CrossRef]
  5. Sarethy, I.P.; Saxena, Y.; Kapoor, A.; Sharma, M.; Sharma, S.K.; Gupta, V.; Gupta, S. Alkaliphilic bacteria: Applications in industrial biotechnology. J. Ind. Microbiol. Biotechnol. 2011, 38, 769–790. [Google Scholar] [CrossRef]
  6. Zhang, C.; Phillips, A.P.R.; Wipfler, R.L.; Olsen, G.J.; Whitaker, R.J. The essential genome of the crenarchaeal model Sulfolobus islandicus. Nat. Commun. 2018, 9, 4908. [Google Scholar] [CrossRef] [PubMed]
  7. Pavlopoulou, A.; Savva, G.D.; Louka, M.; Bagos, P.G.; Vorgias, C.E.; Michalopoulos, I.; Georgakilas, A.G. Unraveling the mechanisms of extreme radioresistance in prokaryotes: Lessons from nature. Mutat. Res. Rev. Mutat. Res. 2016, 767, 92–107. [Google Scholar] [CrossRef]
  8. Anderson, A.W.; Nordan, H.C.; Cain, R.F.; Parrish, G.; Duggan, D. Studies on a Radio-Resistant Micrococcus I. Isolation, Morphology, Cultural Characteristics and Resistance to Gamma Radiation. Food Technol. 1956, 10, 575–578. [Google Scholar]
  9. Moseley, B.E.; Copland, H.J. Isolation and properties of a recombination-deficient mutant of Micrococcus radiodurans. J. Bacteriol. 1975, 121, 422–428. [Google Scholar] [CrossRef] [PubMed]
  10. Blasius, M.; Sommer, S.; Hübscher, U. Deinococcus radiodurans: What belongs to the survival kit? Crit. Rev. Biochem. Mol. Biol. 2008, 43, 221–238. [Google Scholar] [CrossRef]
  11. Ishino, Y.; Narumi, I. DNA repair in hyperthermophilic and hyperradioresistant microorganisms. Curr. Opin. Microbiol. 2015, 25, 103–112. [Google Scholar] [CrossRef]
  12. Lim, S.; Jung, J.H.; Blanchard, L.; de Groot, A. Conservation and diversity of radiation and oxidative stress resistance mechanisms in Deinococcus species. FEMS Microbiol. Rev. 2019, 43, 19–52. [Google Scholar] [CrossRef]
  13. Cox, M.M.; Battista, J.R. Deinococcus radiodurans—the consummate survivor. Nat. Rev. Microbiol. 2005, 3, 882–892. [Google Scholar] [CrossRef]
  14. Fong, S.S.; Joyce, A.R.; Palsson, B.Ø. Parallel adaptive evolution cultures of Escherichia coli lead to convergent growth phenotypes with different gene expression states. Genome Res. 2005, 15, 1365–1372. [Google Scholar] [CrossRef] [PubMed]
  15. Herring, C.D.; Raghunathan, A.; Honisch, C.; Patel, T.; Applebee, M.K.; Joyce, A.R.; Albert, T.J.; Blattner, F.R.; van den Boom, D.; Cantor, C.R.; et al. Comparative genome sequencing of Escherichia coli allows observation of bacterial evolution on a laboratory timescale. Nat. Genet. 2006, 38, 1406–1412. [Google Scholar] [CrossRef] [PubMed]
  16. Barrick, J.E.; Yu, D.S.; Yoon, S.H.; Jeong, H.; Oh, T.K.; Schneider, D.; Lenski, R.E.; Kim, J.F. Genome evolution and adaptation in a long-term experiment with Escherichia coli. Nature 2009, 461, 1243–1247. [Google Scholar] [CrossRef]
  17. Dhar, R.; Sägesser, R.; Weikert, C.; Yuan, J.; Wagner, A. Adaptation of Saccharomyces cerevisiae to saline stress through laboratory evolution. J. Evol. Biol. 2011, 24, 1135–1153. [Google Scholar] [CrossRef]
  18. Ying, B.-W.; Matsumoto, Y.; Kitahara, K.; Suzuki, S.; Ono, N.; Furusawa, C.; Kishimoto, T.; Yomo, T. Bacterial transcriptome reorganization in thermal adaptive evolution. BMC Genom. 2015, 16, 802. [Google Scholar] [CrossRef] [PubMed]
  19. Erdman, I.E.; Thatcher, F.S.; MacQueen, K.F. Studies on the Irradiation of Microorganisms in Relation to Food Preservation: II. Irradiation Resistant Mutants. Can. J. Microbiol. 1961, 7, 207–215. [Google Scholar] [CrossRef]
  20. Ewing, D. The Directed Evolution of Radiation Resistance in E. coli. Biochem. Biophys. Res. Commun. 1995, 216, 549–553. [Google Scholar] [CrossRef]
  21. Harris, D.R.; Pollock, S.V.; Wood, E.A.; Goiffon, R.J.; Klingele, A.J.; Cabot, E.L.; Schackwitz, W.; Martin, J.; Eggington, J.; Durfee, T.J.; et al. Directed Evolution of Ionizing Radiation Resistance in Escherichia coli. J. Bacteriol. 2009, 191, 5240–5252. [Google Scholar] [CrossRef]
  22. Byrne, R.T.; Klingele, A.J.; Cabot, E.L.; Schackwitz, W.S.; Martin, J.A.; Martin, J.; Wang, Z.; Wood, E.A.; Pennacchio, C.; Pennacchio, L.A.; et al. Evolution of extreme resistance to ionizing radiation via genetic adaptation of DNA repair. eLife 2014, 3, e01322. [Google Scholar] [CrossRef] [PubMed]
  23. Bruckbauer, S.T.; Trimarco, J.D.; Henry, C.; Wood, E.A.; Battista, J.R.; Cox, M.M. A variant of the Escherichia coli anaerobic transcription factor FNR exhibiting diminished promoter activation function enhances ionizing radiation resistance. PLoS ONE 2019, 14, e0199482. [Google Scholar] [CrossRef] [PubMed]
  24. Bruckbauer, S.T.; Trimarco, J.D.; Martin, J.; Bushnell, B.; Senn, K.A.; Schackwitz, W.; Lipzen, A.; Blow, M.; Wood, E.A.; Culberson, W.S.; et al. Experimental Evolution of Extreme Resistance to Ionizing Radiation in Escherichia coli after 50 Cycles of Selection. J. Bacteriol. 2019, 201, e00784-18. [Google Scholar] [CrossRef] [PubMed]
  25. Bruckbauer, S.T.; Martin, J.; Minkoff, B.B.; Veling, M.T.; Lancaster, I.; Liu, J.; Trimarco, J.D.; Bushnell, B.; Lipzen, A.; Wood, E.A.; et al. Physiology of Highly Radioresistant Escherichia coli After Experimental Evolution for 100 Cycles of Selection. Front. Microbiol. 2020, 11, 582590. [Google Scholar] [CrossRef]
  26. Hall, J.; Giaccia, A. Molecular Mechanisms of DNA and Chromosome Damage and Repair in Radiobiology for the Radiologist, 7th ed.; Lippincott Williams & Wilkin: Philadelphia, PA, USA, 2012; pp. 12–34. [Google Scholar]
  27. Hall, B.; Hallgrímsson, B. Before Darwin in Strickberger’s Evolution, 4th ed.; Jones & Bartlett Publishers: Boston, MA, USA, 2008; pp. 2–19. [Google Scholar]
  28. Kawai, K.; Kanesaki, Y.; Yoshikawa, H.; Hirasawa, T. Identification of metabolic engineering targets for improving glycerol assimilation ability of Saccharomyces cerevisiae based on adaptive laboratory evolution and transcriptome analysis. J. Biosci. Bioeng. 2019, 128, 162–169. [Google Scholar] [CrossRef]
  29. Maslowska, K.H.; Makiela-Dzbenska, K.; Fijalkowska, I.J. The SOS system: A complex and tightly regulated response to DNA damage. Environ. Mol. Mutagen. 2019, 60, 368–384. [Google Scholar] [CrossRef]
  30. Daly, M.J.; Gaidamakova, E.K.; Matrosova, V.Y.; Vasilenko, A.; Zhai, M.; Venkateswaran, A.; Hess, M.; Omelchenko, M.V.; Kostandarithes, H.M.; Makarova, K.S.; et al. Accumulation of Mn(II) in Deinococcus radiodurans Facilitates Gamma-Radiation Resistance. Science 2004, 306, 1025–1028. [Google Scholar] [CrossRef]
  31. Daly, M.J.; Gaidamakova, E.K.; Matrosova, V.Y.; Vasilenko, A.; Zhai, M.; Leapman, R.D.; Lai, B.; Ravel, B.; Li, S.-M.W.; Kemner, K.M.; et al. Protein Oxidation Implicated as the Primary Determinant of Bacterial Radioresistance. PLOS Biol. 2007, 5, e92. [Google Scholar] [CrossRef]
  32. Daly, M.J. Death by protein damage in irradiated cells. DNA Repair 2012, 11, 12–21. [Google Scholar] [CrossRef]
  33. de Toledo Arruda-Neto, J.D.; Righi, H.; Cabrera Gomez, J.G.; Ferreira da Silva, L.; Drigo, E.; da Costa Lemos, A.C. Radioresistance and radiosensitivity: A biophysical approach on bacterial cells robustness. Theory Biosci. 2023, 142, 13–28. [Google Scholar] [CrossRef]
  34. Saito, T.; Terato, H.; Yamamoto, O. Pigments of Rubrobacter radiotolerans. Arch. Microbiol. 1994, 162, 414–421. [Google Scholar] [CrossRef]
  35. Saito, T.; Miyabe, Y.; Ide, H.; Yamamoto, O. Hydroxyl radical scavenging ability of bacterioruberin. Radiat. Phys. Chem. 1997, 50, 267–269. [Google Scholar] [CrossRef]
  36. Saito, T.; Ohyama, Y.; Ide, H.; Ohta, S.; Yamamoto, O. A carotenoid pigment of the radioresistant bacterium Deinococcus radiodurans. Microbios 1998, 95, 79–90. [Google Scholar]
  37. Terato, H.; Suzuki, K.; Nishioka, N.; Okamoto, A.; Shimazaki-Tokuyama, Y.; Inoue, Y.; Saito, T. Characterization and Radio-resistant Function of Manganese Superoxide Dismutase of Rubrobacter radiotolerans. J. Radiat. Res. 2011, 52, 735–742. [Google Scholar] [CrossRef] [PubMed]
  38. Saito, T.; Fujii, N. Effects of carotenoids on damage of biological lipids induced by gamma irradiation. Radiat. Phys. Chem. 2014, 98, 57–63. [Google Scholar] [CrossRef]
  39. López-Maury, L.; Marguerat, S.; Bähler, J. Tuning gene expression to changing environments: From rapid responses to evolutionary adaptation. Nat. Rev. Genet. 2008, 9, 583–593. [Google Scholar] [CrossRef]
  40. Ishikawa, A.; Kusakabe, M.; Yoshida, K.; Ravinet, M.; Makino, T.; Toyoda, A.; Fujiyama, A.; Kitano, J. Different contributions of local- and distant-regulatory changes to transcriptome divergence between stickleback ecotypes. Evolution 2017, 71, 565–581. [Google Scholar] [CrossRef]
  41. Salem, A.M.H.; Nakano, T.; Takuwa, M.; Matoba, N.; Tsuboi, T.; Terato, H.; Yamamoto, K.; Yamada, M.; Nohmi, T.; Ide, H. Genetic Analysis of Repair and Damage Tolerance Mechanisms for DNA-Protein Cross-Links in Escherichia coli. J. Bacteriol. 2009, 191, 5657–5668. [Google Scholar] [CrossRef]
  42. Dobin, A.; Davis, C.A.; Schlesinger, F.; Drenkow, J.; Zaleski, C.; Jha, S.; Batut, P.; Chaisson, M.; Gingeras, T.R. STAR: Ultrafast universal RNA-seq aligner. Bioinformatics 2013, 29, 15–21. [Google Scholar] [CrossRef]
  43. Yendrek, C.R.; Ainsworth, E.A.; Thimmapuram, J. The bench scientist’s guide to statistical analysis of RNA-Seq data. BMC Res. Notes 2012, 5, 506. [Google Scholar] [CrossRef]
  44. Benjamini, Y.; Hochberg, Y. Controlling the False Discovery Rate: A Practical and Powerful Approach to Multiple Testing. J. R. Stat. Soc. Ser. B 1995, 57, 289–300. [Google Scholar] [CrossRef]
  45. Huang, D.W.; Sherman, B.T.; Lempicki, R.A. Systematic and integrative analysis of large gene lists using DAVID bioinformatics resources. Nat. Protoc. 2009, 4, 44–57. [Google Scholar] [CrossRef]
  46. Wang, Y.E.; Kutnetsov, L.; Partensky, A.; Farid, J.; Quackenbush, J. WebMeV: A Cloud Platform for Analyzing and Visualizing Cancer Genomic Data. Cancer Res. 2017, 77, e11–e14. [Google Scholar] [CrossRef] [PubMed]
  47. Ben-Shahar, Y.; Robichon, A.; Sokolowski, M.B.; Robinson, G.E. Influence of Gene Action Across Different Time Scales on Behavior. Science 2002, 296, 741–744. [Google Scholar] [CrossRef] [PubMed]
  48. Said-Salman, I.H.; Jebaii, F.A.; Yusef, H.H.; Moustafa, M.E. Global gene expression analysis of Escherichia coli K-12 DH5α after exposure to 2.4 GHz wireless fidelity radiation. Sci. Rep. 2019, 9, 14425. [Google Scholar] [CrossRef] [PubMed]
  49. Kudo, K.; Ito, H.; Ihara, S.; Terato, H. Oxidative DNA damage caused by pulsed discharge with cavitation on the bactericidal function. J. Phys. D Appl. Phys. 2015, 48, 365401. [Google Scholar] [CrossRef]
Figure 1. Increased Escherichia coli radioresistance through adaptive evolution experiment with gamma radiation as selection pressure. Survival curve of (a) gamma-irradiated wild-type E. coli and (b) gamma-irradiated E. coli populations after 20 selection cycles in adaptive evolution experiment. Horizontal axis shows absorbed dose of gamma radiation, and vertical axis shows surviving fraction. Surviving fractions are shown as mean ± standard deviation (SD) from five independent experiments; (c) Changes in radioresistance of E. coli as adaptive evolution experiment progressed. Horizontal axis shows number of selection cycles, and vertical axis shows 1% survival dose.
Ijms 26 07275 g001
Figure 2. Comparison of cell populations and treatment conditions.
Ijms 26 07275 g002
Figure 3. Comparison of gene expression between cell populations. Gene expression differences between (a) non-gamma-irradiated evolved and non-gamma-irradiated wild-type E. coli; (b) gamma-irradiated wild-type and non-gamma-irradiated wild-type E. coli; (c) gamma-irradiated evolved and non-gamma-irradiated evolved E. coli; (d) gamma-irradiated evolved and gamma-irradiated wild-type E. coli; (e) gamma-irradiated evolved and non-gamma-irradiated wild-type E. coli. Left panels: volcano plots for each comparison. Horizontal axis shows changes in gene expression (fold change value), and vertical axis shows significance of changes in individual genes (p-value). Genes with −log10(p-value) > 1.3 are given in color. Red, genes with increased expression; blue, genes with decreased expression. Right panels: number of genes with significantly increased or decreased expression in each comparison with corresponding proportions. Significantly differentially expressed genes (DEGs) were identified using Welch’s t-test and multiple testing corrections using Benjamini–Hochberg method (q < 0.05). Red, upregulated genes; blue, downregulated genes.
Ijms 26 07275 g003
Figure 4. Gene ontology (GO) analysis of genes significantly upregulated in non-gamma-irradiated evolved E. coli compared with those in non-gamma-irradiated wild-type E. coli. Vertical axis shows Annotation Cluster number, enrichment score for each Annotation Cluster, and GO terms present in each Annotation Cluster. Horizontal axis shows p-value for each GO term. Gene counts are shown in parentheses to right of bars.
Ijms 26 07275 g004
Figure 5. GO analysis of genes significantly upregulated in gamma-irradiated evolved E. coli compared with those in gamma-irradiated wild-type E. coli. Vertical axis shows Annotation Cluster number, enrichment score for each Annotation Cluster, and GO terms present in each Annotation Cluster. Horizontal axis shows p-value for each GO term. Gene counts are shown in parentheses to right of bars.
Ijms 26 07275 g005
Figure 6. Heat map of hierarchical clustering analysis. Color pattern changes from blue to yellow with increasing gene expression; hierarchical clustering analysis of expression levels of genes (a) enriched in GO analysis for upregulated DEGs in non-gamma-irradiated evolved compared with non-gamma-irradiated wild-type E. coli; (b) belonging to Annotation Cluster 3 from GO analysis for upregulated DEGs in gamma-irradiated evolved compared with non-gamma-irradiated evolved E. coli; (c) belonging to Annotation Cluster 1 from GO analysis for upregulated DEGs in gamma-irradiated evolved compared with gamma-irradiated wild-type E. coli; (d) belonging to Annotation Cluster 1 from GO analysis for upregulated DEGs in gamma-irradiated evolved compared with non-gamma-irradiated wild-type E. coli. Horizontal axis shows samples. The letters a, b, and c shown after the sample names denote distinct samples derived from three biological replicates. Vertical axis shows genes. The node points on the red and blue dendrograms are indicated by dots.
Ijms 26 07275 g006
Figure 7. Quantification of expression levels of anti-stress genes. (a) Quantification via quantitative real-time reverse transcription polymerase chain reaction (qRT-PCR); (b) quantification via RNA sequencing (RNA-seq). Horizontal axis shows samples, and vertical axis shows relative expression levels of each gene. Green, pink, gray, orange, blue, and red bars indicate expression levels of yhjX, sulA, umuC, ydjM, dinB, and recA, respectively.
Ijms 26 07275 g007
Figure 8. Repair of genomic DNA after gamma irradiation. (a) Changes in degree of DNA damage relative to incubation time in wild-type E. coli; (b) changes in degree of DNA damage relative to incubation time in evolved E. coli. Cells irradiated with 2.5 kGy of gamma radiation were shake-incubated in Luria–Bertani (LB) medium at 37 °C. Incubated cells were aliquoted every hour for 0–8 h, and the degree of double-strand breaks in genomic DNA was evaluated using the SFGE method. Horizontal axis shows incubation time, and vertical axis shows proportion of DNA released from well to total amount of DNA. * Samples with significantly different proportions of released DNA relative to total amount of DNA between wild-type and evolved E. coli (p < 0.05).
Ijms 26 07275 g008
Disclaimer/Publisher’s Note: The statements, opinions and data contained in all publications are solely those of the individual author(s) and contributor(s) and not of MDPI and/or the editor(s). MDPI and/or the editor(s) disclaim responsibility for any injury to people or property resulting from any ideas, methods, instructions or products referred to in the content.

