
A Comparative Analysis and Limited Phylogenetic Implications of Mitogenomes in Infraorder-Level Diptera


Abstract
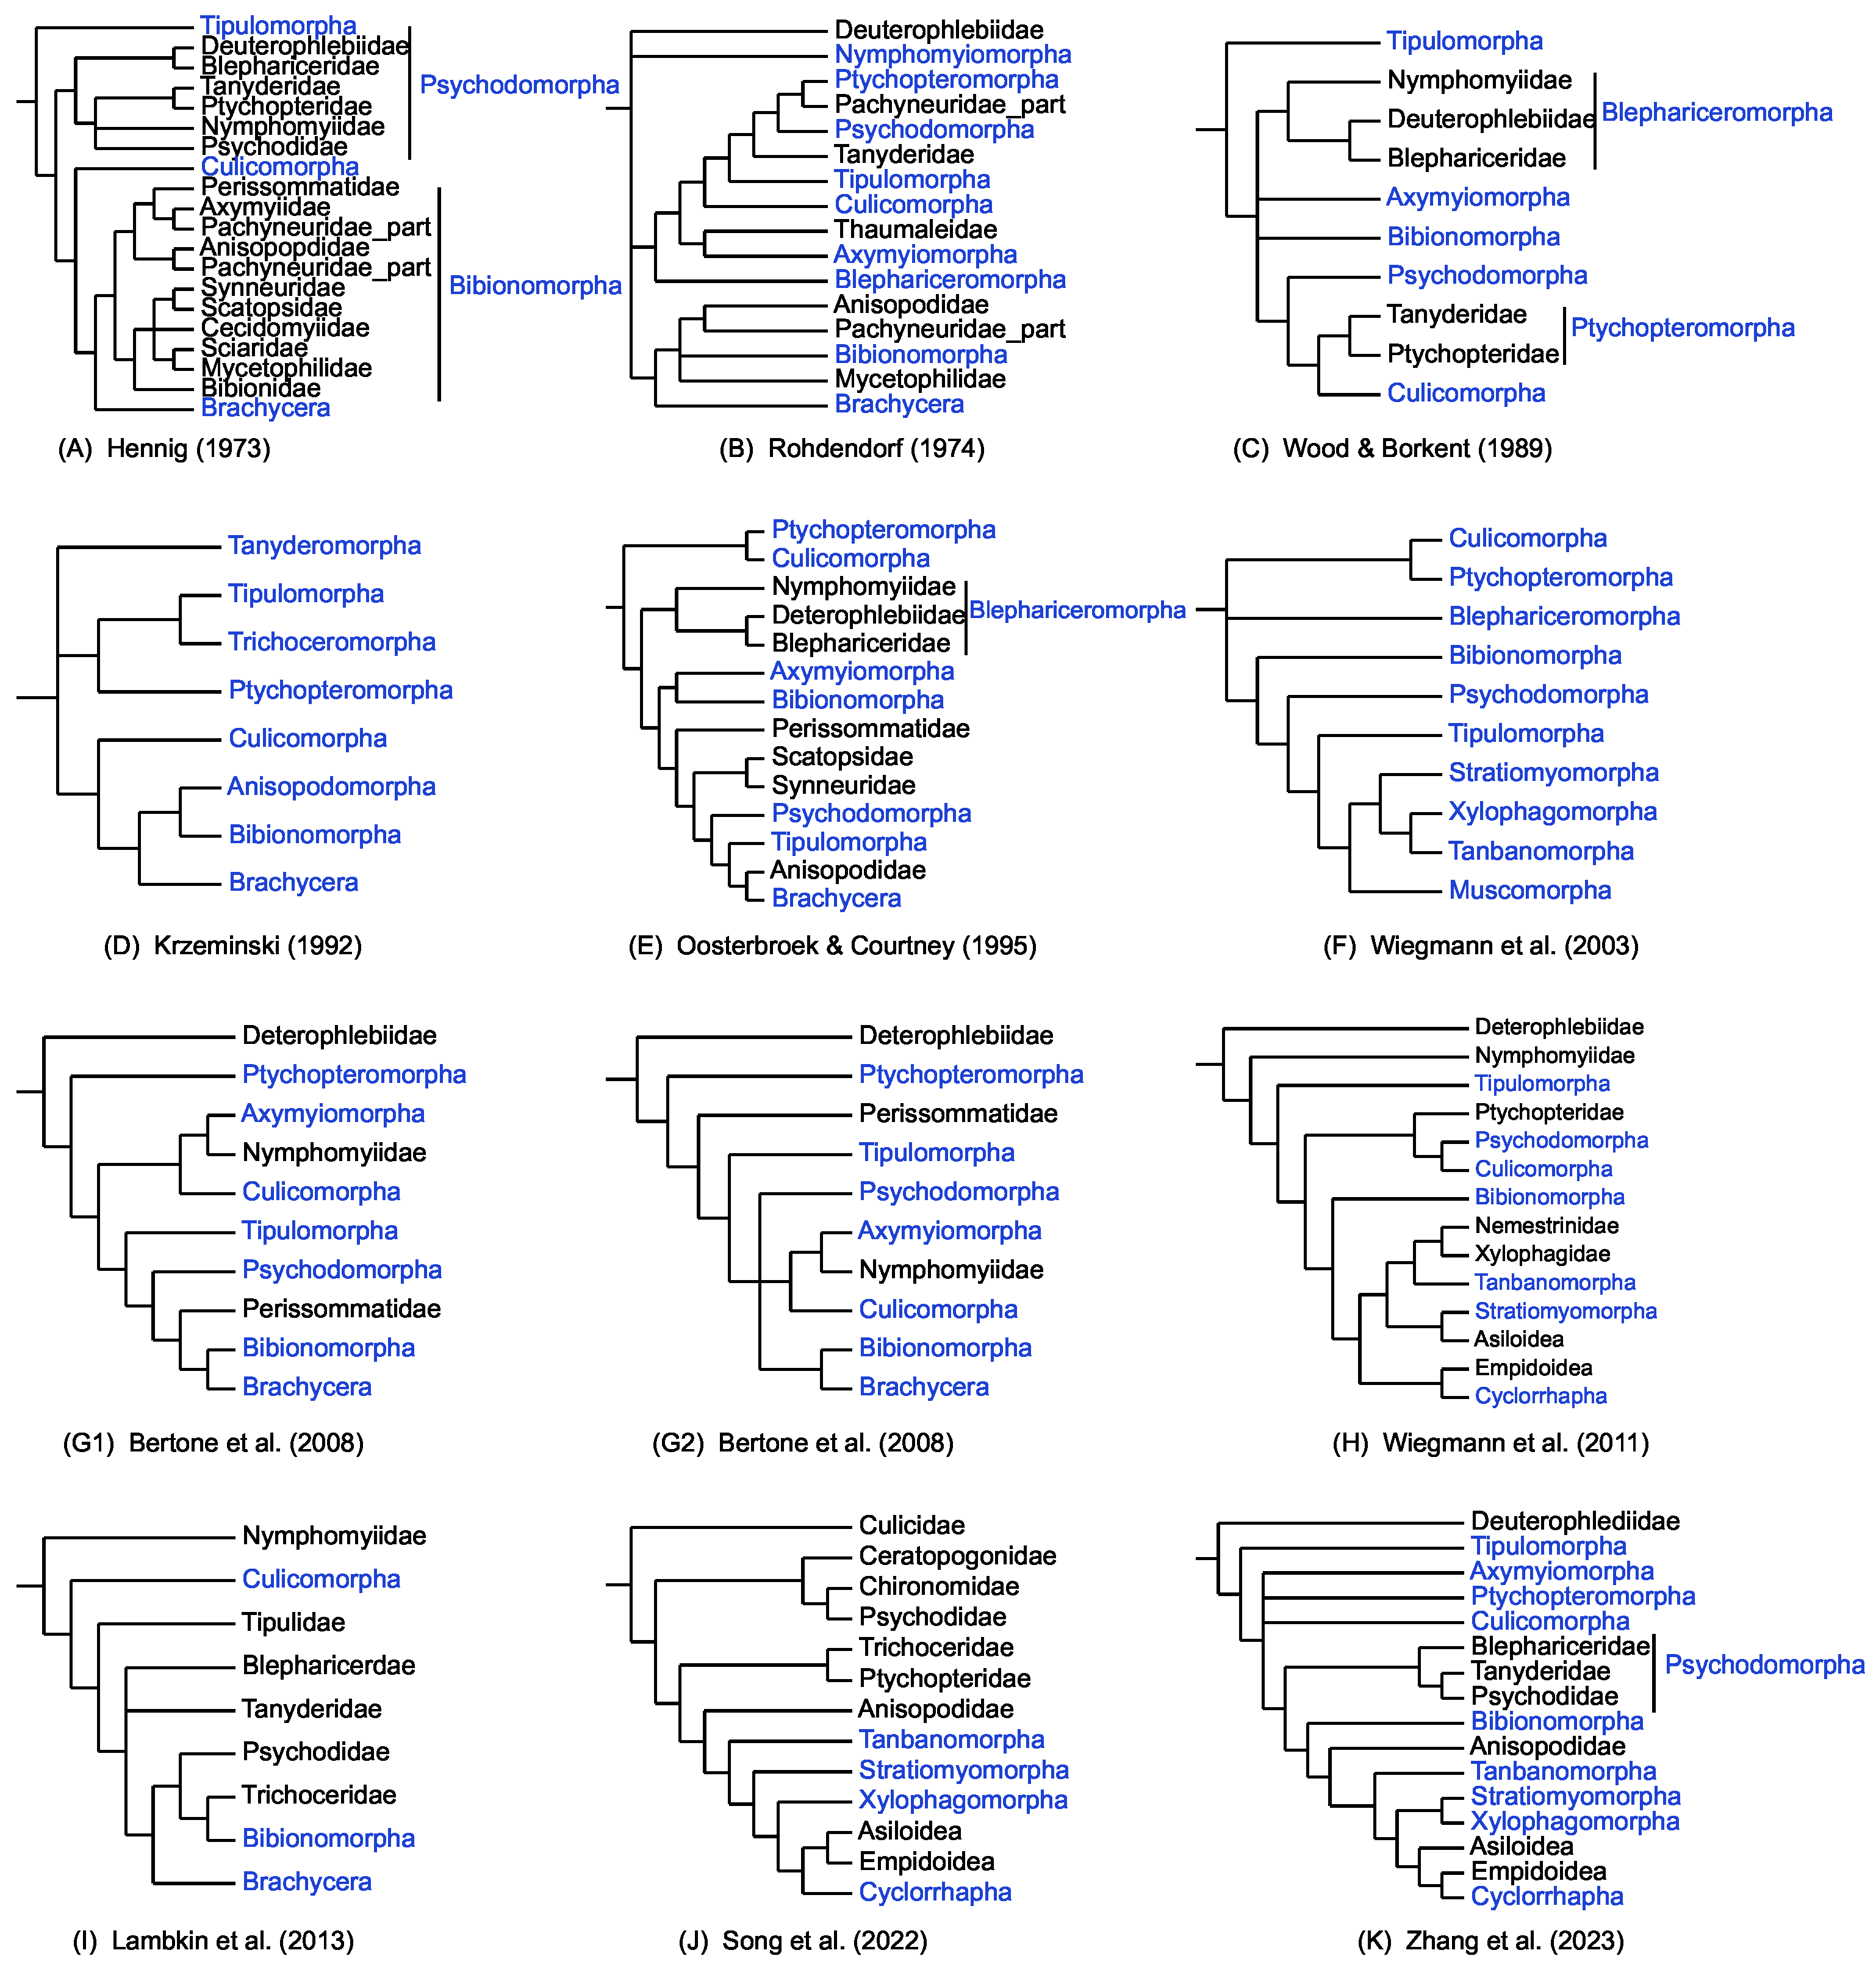
1. Introduction
2. Results
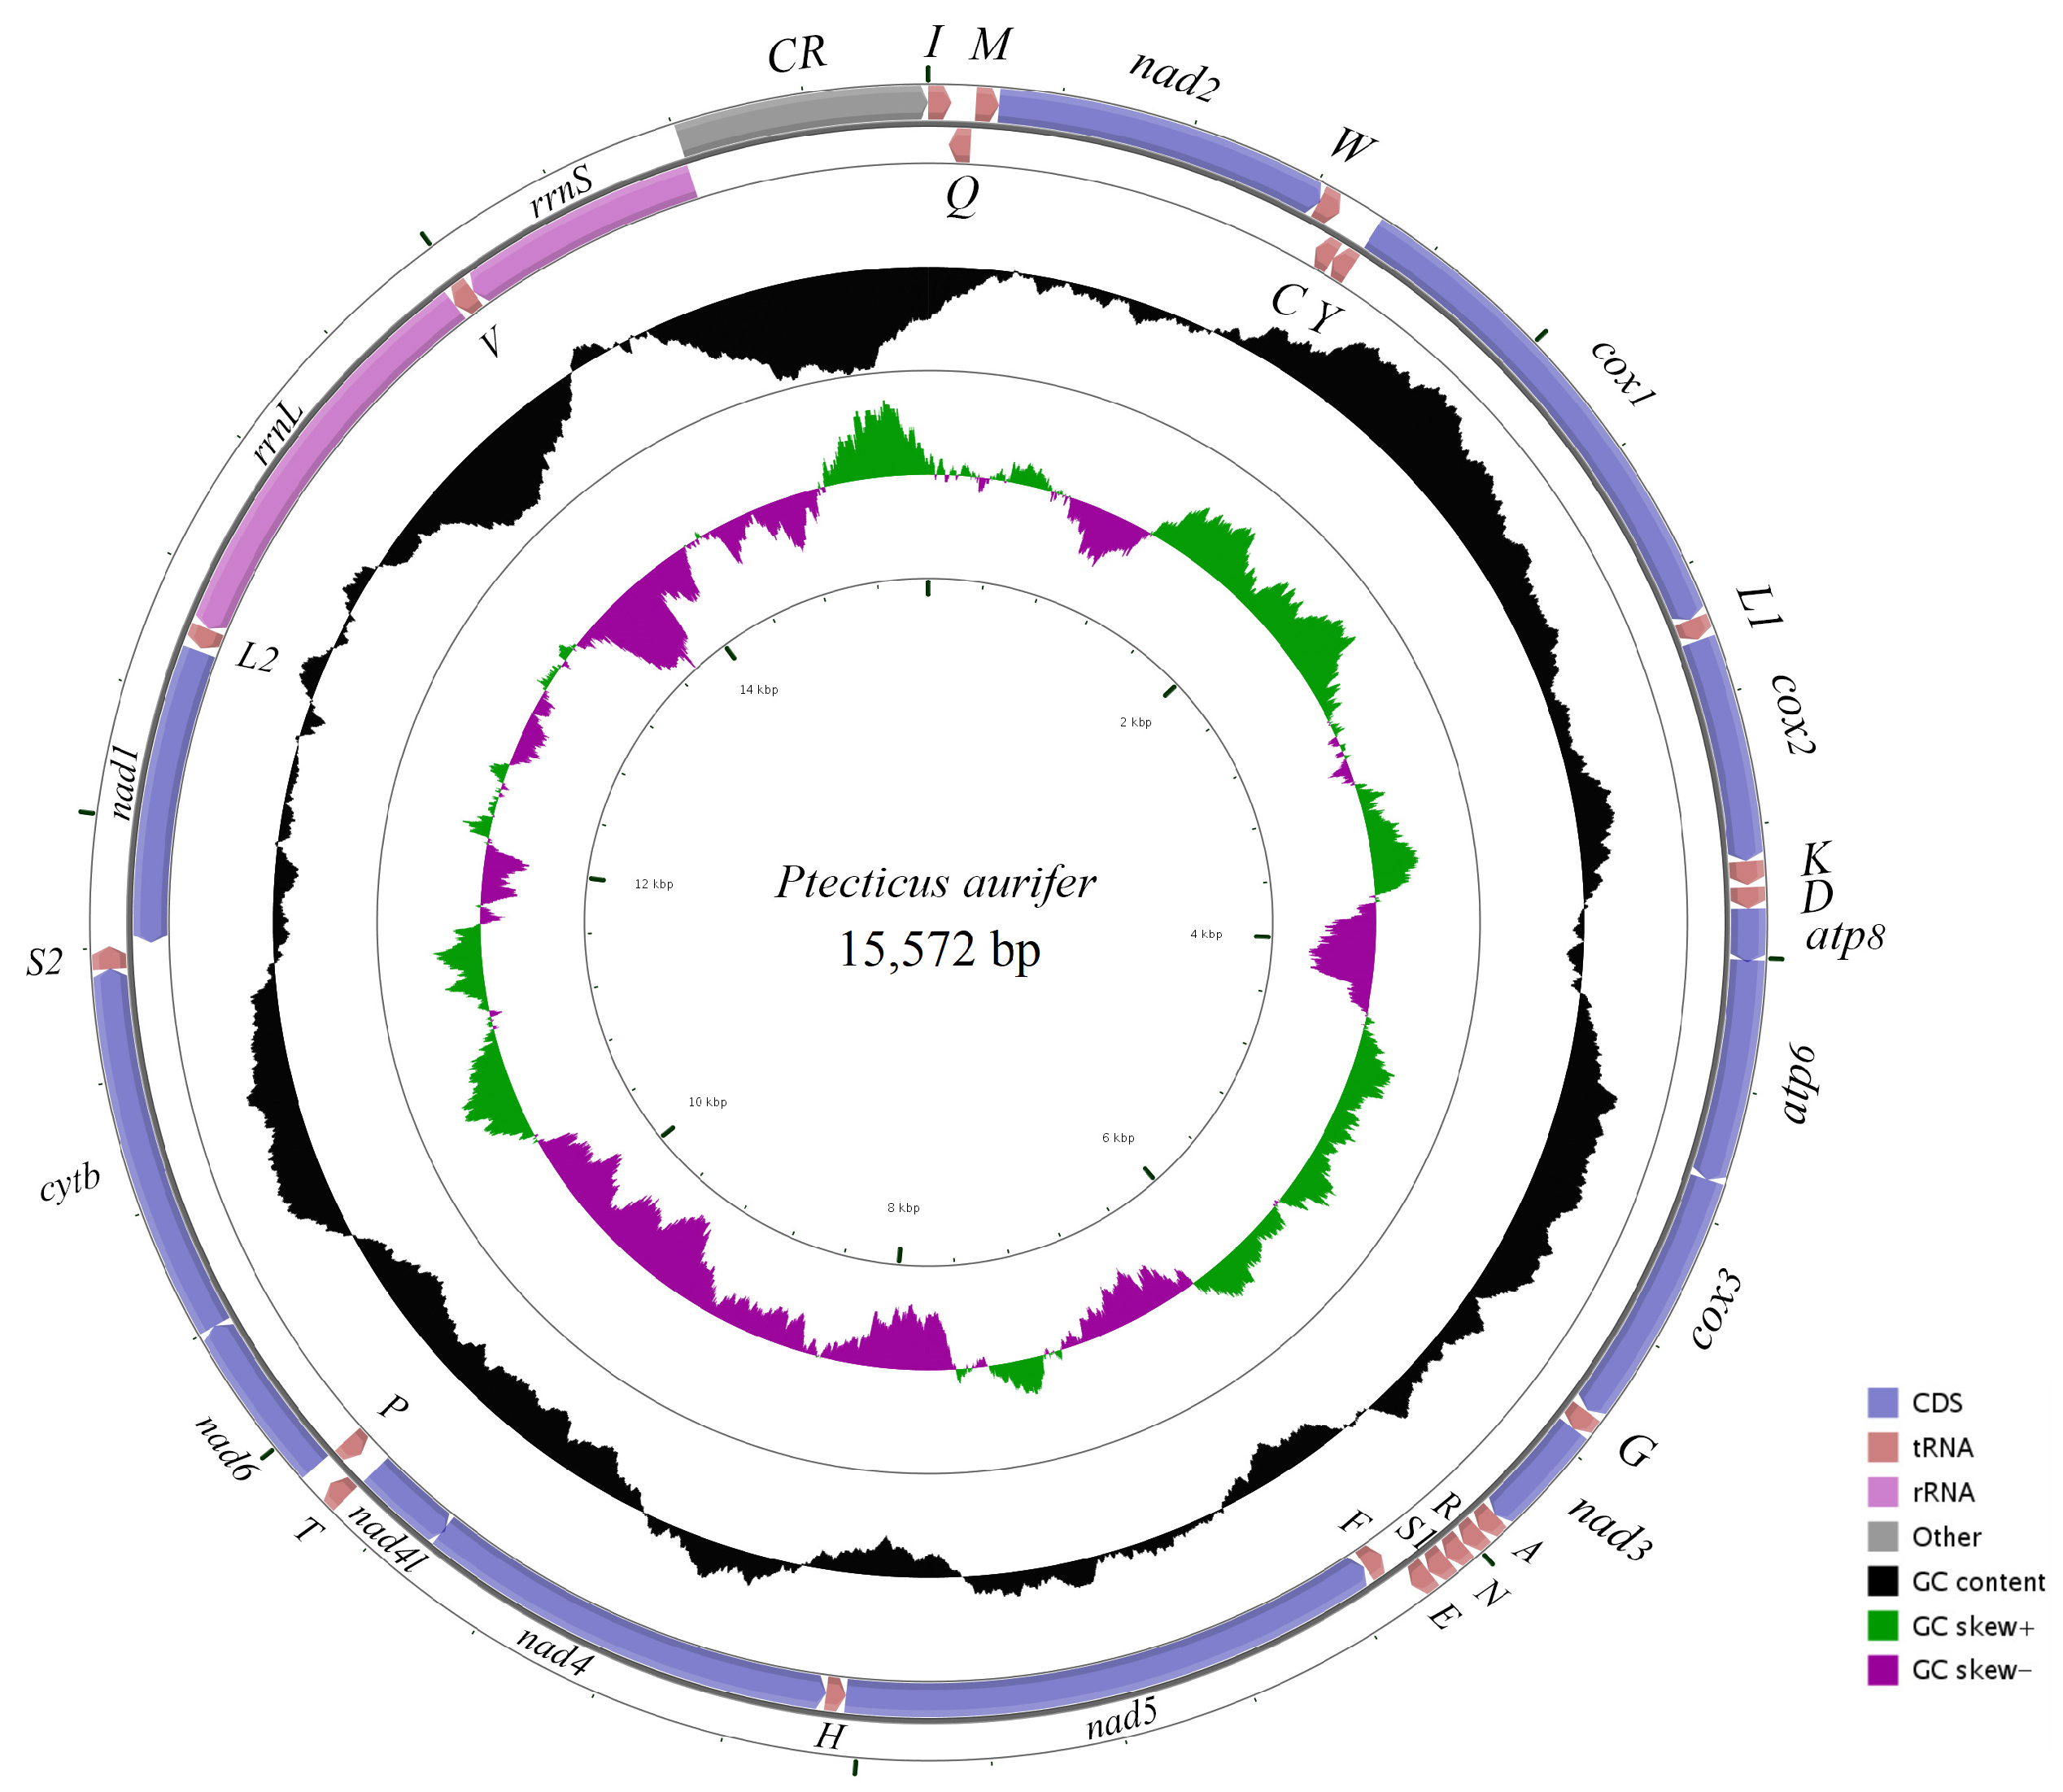
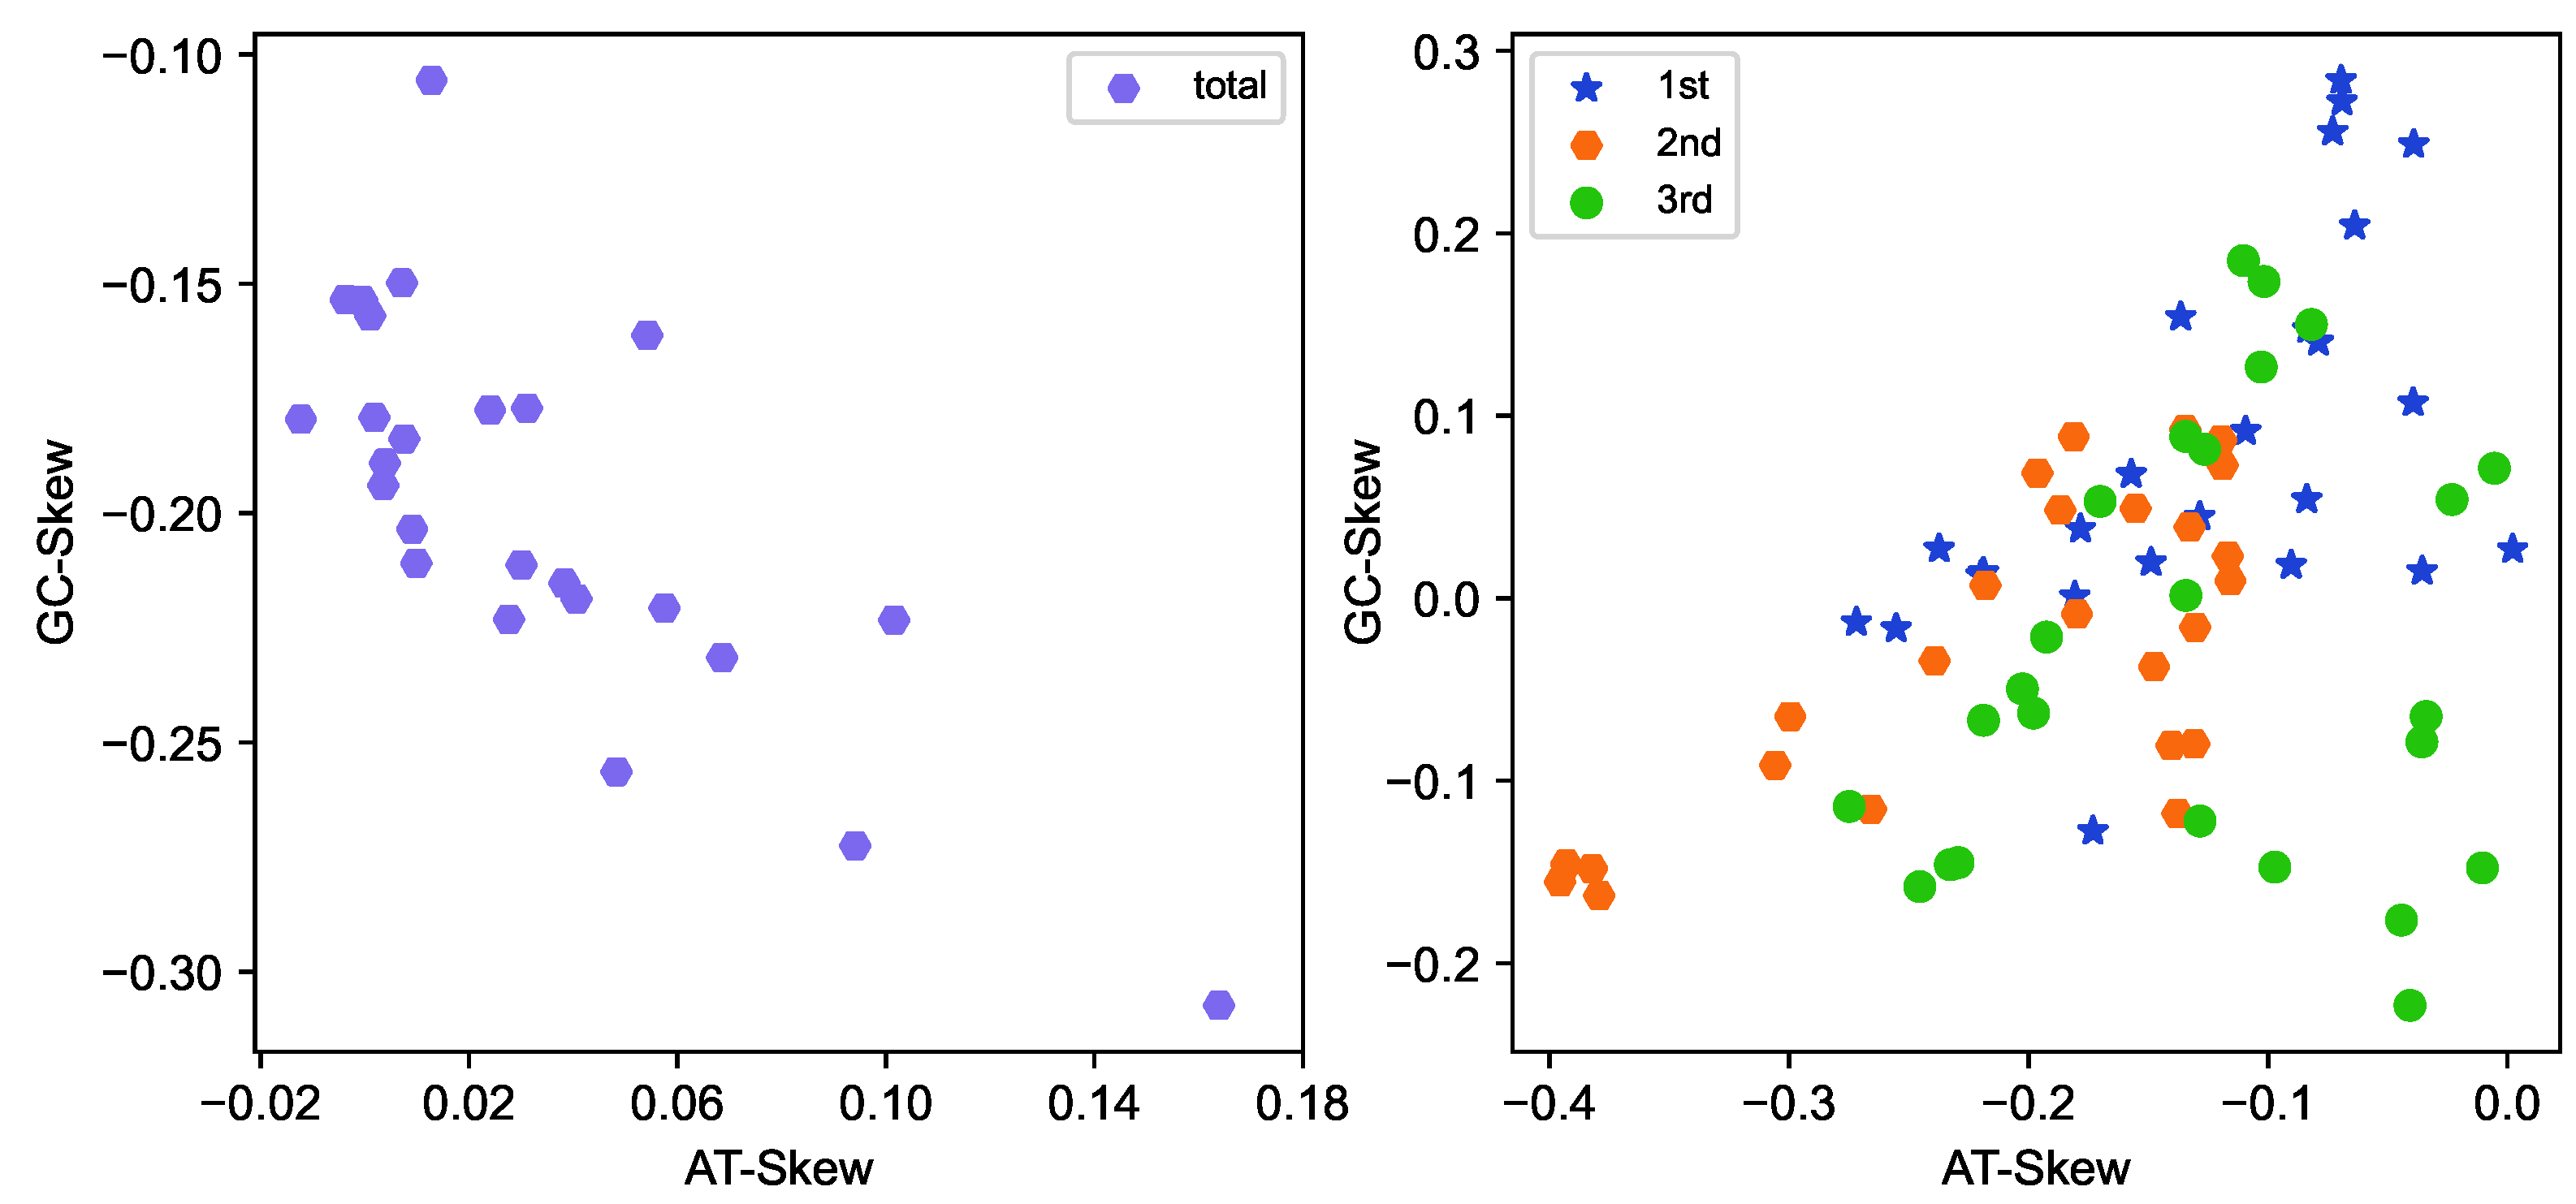
2.1. General Features of 25 Mitogenomes
2.2. Phylogenetic Inference
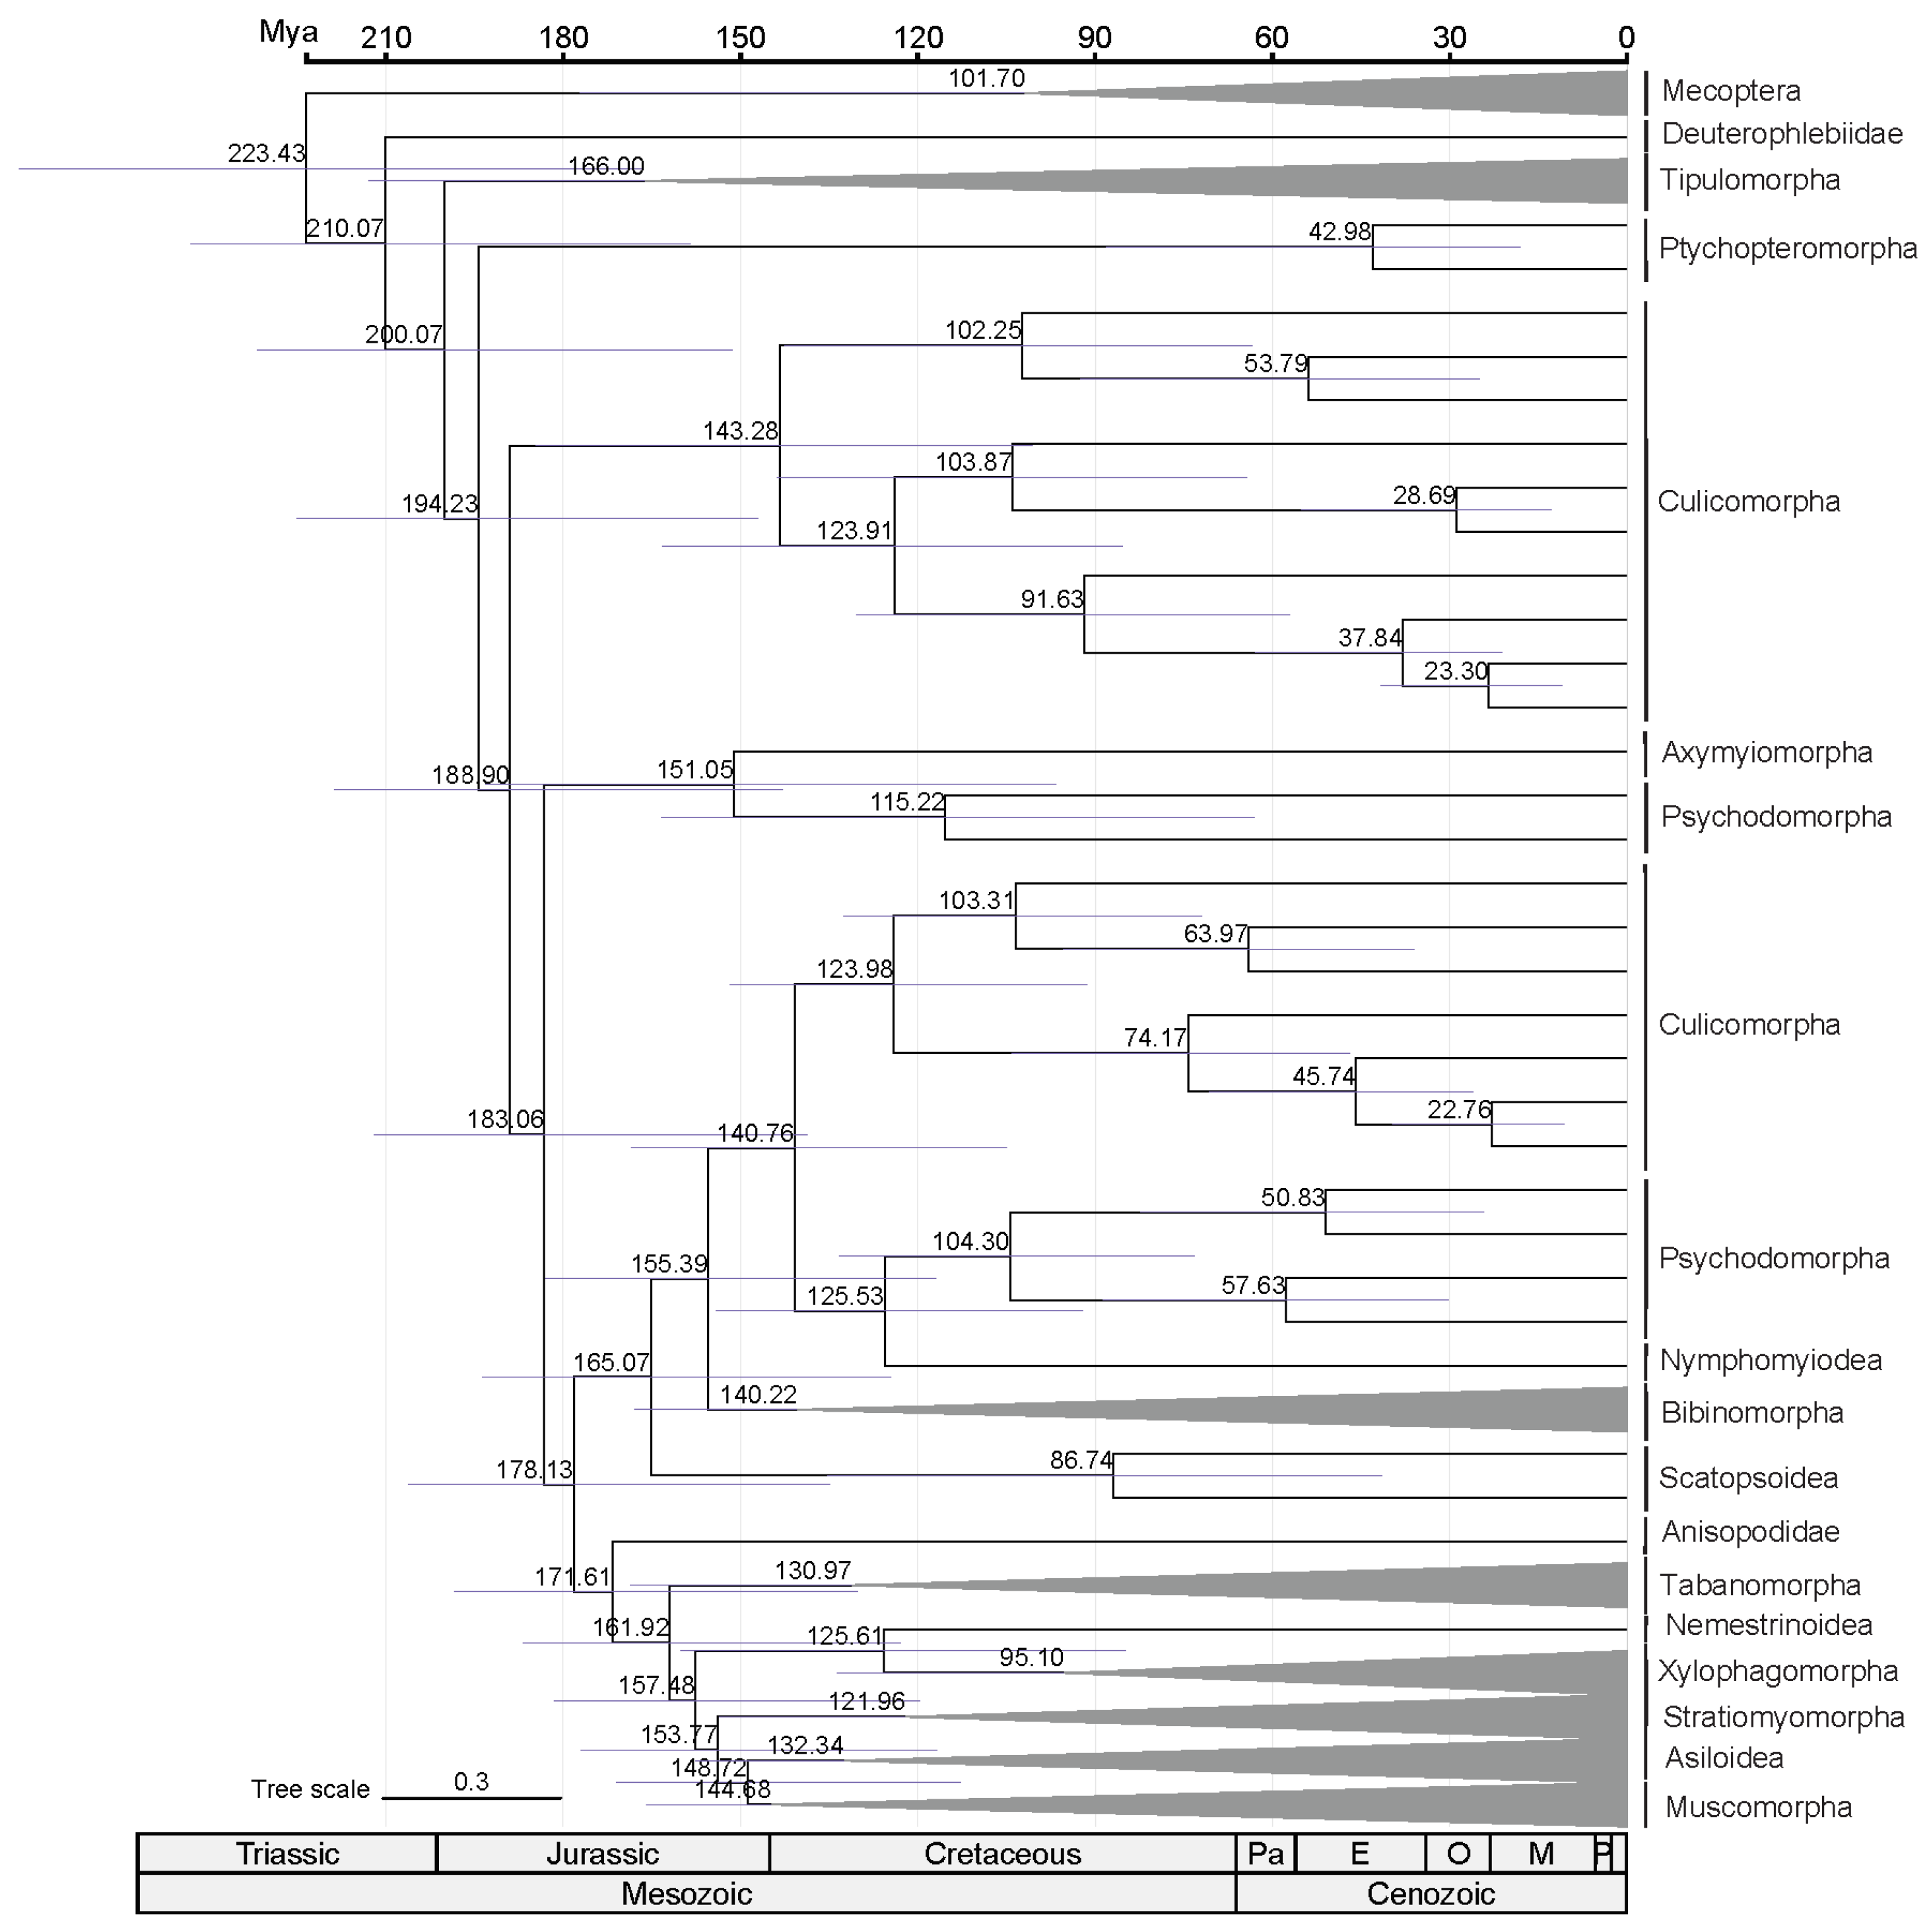
2.3. Divergence Time Estimation
3. Discussion
4. Materials and Methods
4.1. Sample Collection and DNA Extraction
4.2. Sequencing, Assembly, Annotation and Compositional Analysis
4.3. Sequence Retrieval, Matrix Generation and Bioinformatic Analysis
4.4. Phylogenetic Analyses and Tree Calibration
5. Conclusions
Supplementary Materials
Author Contributions
Funding
Institutional Review Board Statement
Informed Consent Statement
Data Availability Statement
Acknowledgments
Conflicts of Interest
References
- Gerhardt, R.R.; Hribar, L.J. Flies (Diptera). In Medical and Veterinary Entomology; Mullen, G.R., Durden, L.A., Eds.; Academic Press: Cambridge, MA, USA, 2019; pp. 171–190. [Google Scholar]
- Foster, W.A.; Walker, E.D. Mosquitoes (Culicidae). In Medical and Veterinary Entomology; Mullen, G.R., Durden, L.A., Eds.; Academic Press: Cambridge, MA, USA, 2019; pp. 261–325. [Google Scholar]
- Ollerton, J.; Dötterl, S.; Ghorpadé, K.; Heiduk, A.; Liede-Schumann, S.; Masinde, S.; Meve, U.; Peter, C.I.; Prieto-Benítez, S.; Punekar, S.; et al. Diversity of Diptera families that pollinate Ceropegia (Apocynaceae) trap flowers: An update in light of new data and phylogenetic analyses. Flora 2017, 234, 233–244. [Google Scholar] [CrossRef]
- Stireman, J.O., III; Cerretti, P.; O’Hara, J.E.; Blaschke, J.D.; Moulton, J.K. Molecular phylogeny and evolution of world Tachinidae (Diptera). Mol. Phylogen. Evol. 2019, 139, 106358. [Google Scholar] [CrossRef]
- Yeates, D.K.; Wiegmann, B.M. Congruence and controversy: Toward a higher-level phylogeny of Diptera. Annu. Rev. Entomol. 1999, 44, 397–428. [Google Scholar] [CrossRef]
- Yeates, D.K.; Wiegmann, B.M. The Evolutionary Biology of Flies; Columbia University Press: New York, NY, USA, 2005. [Google Scholar]
- Wiegmann, B.M.; Yeates, D.K. Phylogeny of Diptera. In Manual of Afrotropical Diptera; Kirk-Spriggs, A.H., Sinclair, B.J., Eds.; South African National Biodiversity Institute: Pretoria, South Africa, 2017; Volume 1, pp. 253–265. [Google Scholar]
- Lambkin, C.L.; Sinclair, B.J.; Pape, T.; Courtney, G.W.; Skevington, J.H.; Meier, R.; Yeates, D.K.; Blagoderov, V.; Wiegmann, B.M. The phylogenetic relationships among infraorders and superfamilies of Diptera based on morphological evidence. Syst. Entomol. 2013, 38, 164–179. [Google Scholar] [CrossRef]
- Hennig, W. Diptera (Zweiflügler). In Handbuch der Zoologie; De Gruyter Academic Press: Berlin, Germany, 1973; Volume 4, pp. 1–337. [Google Scholar]
- Friedrich, M.; Tautz, D. Evolution and phylogeny of the Diptera: A molecular phylogenetic analysis using 28S rDNA sequences. Syst. Biol. 1997, 46, 674–698. [Google Scholar] [CrossRef] [PubMed]
- Amorim, D.d.S.; Yeates, D.K. Pesky gnats: Ridding dipteran classification of the Nematocera. Studia Dipterologica 2006, 13, 3–9. [Google Scholar]
- Zhang, X.; Yang, D.; Kang, Z.H. New data on the mitochondrial genome of Nematocera (lower Diptera): Features, structures and phylogenetic implications. Zool. J. Linn. Soc. 2023, 197, 229–245. [Google Scholar] [CrossRef]
- Bertone, M.A.; Courtney, G.W.; Wiegmann, B.M. Phylogenetics and temporal diversification of the earliest true flies (Insecta: Diptera) based on multiple nuclear genes. Syst. Entomol. 2008, 33, 668–687. [Google Scholar] [CrossRef]
- Starỳ, J. Phylogeny of Tipulomorpha—An endless issue. Acta Mus. Siles. Sci. Natur. 2021, 69, 277–281. [Google Scholar] [CrossRef]
- Kang, Z.H.; Zhang, X.; Ding, S.M.; Tang, C.F.; Wang, Y.Y.; de Jong, H.; Cameron, S.L.; Wang, M.Q.; Yang, D. Transcriptomes of three species of Tipuloidea (Diptera, Tipulomorpha) and implications for phylogeny of Tipulomorpha. PLoS ONE 2017, 12, e0173207. [Google Scholar] [CrossRef]
- Zhang, X.; Kang, Z.H.; Mao, M.; Li, X.K.; Cameron, S.L.; de Jong, H.; Wang, M.Q.; Yang, D. Comparative Mt genomics of the Tipuloidea (Diptera: Nematocera: Tipulomorpha) and its implications for the phylogeny of the Tipulomorpha. PLoS ONE 2016, 11, e0158167. [Google Scholar] [CrossRef]
- Schneeberg, K.; Beutel, R.G. The adult head structures of Tipulomorpha (Diptera, Insecta) and their phylogenetic implications. Acta Zool. 2011, 92, 316–343. [Google Scholar] [CrossRef]
- Zhang, X.; Kang, Z.H.; Ding, S.M.; Wang, Y.Y.; Borkent, C.; Saigusa, T.; Yang, D. Mitochondrial genomes provide insights into the phylogeny of Culicomorpha (Insecta: Diptera). Int. J. Mol. Sci. 2019, 20, 747. [Google Scholar] [CrossRef]
- Wood, D.M.; Borkent, A. Phylogeny and classification of the Nematocera. In Manual of Nearctic Diptera; McAlpine, J.F., Wood, D.M., Eds.; Agriculture Canada Monograph: Ottawa, ON, Canada, 1989; Volume 3, pp. 1333–1370. [Google Scholar]
- Rohdendorf, B. The Historical Development of Diptera; University of Alberta: Edmonton, AB, Canada, 1974; Volume 3. [Google Scholar]
- Wiegmann, B.M.; Trautwein, M.D.; Winkler, I.S.; Barr, N.B.; Kim, J.W.; Lambkin, C.; Bertone, M.A.; Cassel, B.K.; Bayless, K.M.; Heimberg, A.M.; et al. Episodic radiations in the fly tree of life. Proc. Natl. Acad. Sci. USA 2011, 108, 5690–5695. [Google Scholar] [CrossRef]
- Wiegmann, B.M.; Yeates, D.K.; Thorne, J.L.; Kishino, H. Time flies, a new molecular time-scale for brachyceran fly evolution without a clock. Syst. Biol. 2003, 52, 745–756. [Google Scholar] [CrossRef]
- Song, N.; Xi, Y.Q.; Yin, X.M. Phylogenetic relationships of Brachycera (Insecta: Diptera) inferred from mitochondrial genome sequences. Zool. J. Linn. Soc. 2022, 196, 720–739. [Google Scholar] [CrossRef]
- Oosterbroek, P.; Courtney, G. Phylogeny of the nematocerous families of Diptera (Insecta). Zool. J. Linn. Soc. 1995, 115, 267–311. [Google Scholar] [CrossRef]
- Yeates, D.K. Relationships of extant lower Brachycera (Diptera): A quantitative synthesis of morphological characters. Zool. Scr. 2002, 31, 105–121. [Google Scholar] [CrossRef]
- Shin, S.; Bayless, K.M.; Winterton, S.L.; Dikow, T.; Lessard, B.D.; Yeates, D.K.; Wiegmann, B.M.; Trautwein, M.D. Taxon sampling to address an ancient rapid radiation: A supermatrix phylogeny of early brachyceran flies (Diptera). Syst. Entomol. 2018, 43, 277–289. [Google Scholar] [CrossRef]
- Blagoderov, V.; Grimaldi, D.A.; Fraser, N.C. How time flies for flies: Diverse Diptera from the Triassic of Virginia and early radiation of the order. Am. Mus. Novit. 2007, 2007, 1–39. [Google Scholar] [CrossRef]
- Grimaldi, D.; Engel, M.S. Evolution of the Insects; Cambridge University Press: Cambrige, UK, 2005. [Google Scholar]
- Zhang, Q.Q.; Wang, B. Evolution of lower brachyceran flies (Diptera) and their adaptive radiation with angiosperms. Front. Plant Sci. 2017, 8, 631. [Google Scholar] [CrossRef]
- Krzeminski, W. The oldest Polyneura (Diptera) and their importance to the phylogeny of the group. Acta Zool. Cracoviensia 1992, 35, 45–52. [Google Scholar]
- Cameron, S.L. Insect mitochondrial genomics: Implications for evolution and phylogeny. Annu. Rev. Entomol. 2014, 59, 95–117. [Google Scholar] [CrossRef]
- Ding, Y.R.; Yan, Z.T.; Si, F.L.; Li, X.D.; Mao, Q.M.; Asghar, S.; Chen, B. Mitochondrial genes associated with pyrethroid resistance revealed by mitochondrial genome and transcriptome analyses in the malaria vector Anopheles sinensis (Diptera: Culicidae). Pest. Manag. Sci. 2020, 76, 769–778. [Google Scholar] [CrossRef]
- Song, F.; Li, H.; Jiang, P.; Zhou, X.; Liu, J.P.; Sun, C.H.; Vogler, A.P.; Cai, W.Z. Capturing the phylogeny of Holometabola with mitochondrial genome data and Bayesian site-heterogeneous mixture models. Genome Biol. Evol. 2016, 8, 1411–1426. [Google Scholar] [CrossRef]
- Li, H.; Shao, R.F.; Song, N.; Song, F.; Jiang, P.; Li, Z.H.; Cai, W.Z. Higher-level phylogeny of paraneopteran insects inferred from mitochondrial genome sequences. Sci. Rep. 2015, 5, 8527. [Google Scholar] [CrossRef]
- Li, H.; Leavengood, J.M., Jr.; Chapman, E.G.; Burkhardt, D.; Song, F.; Jiang, P.; Liu, J.; Zhou, X.; Cai, W.Z. Mitochondrial phylogenomics of Hemiptera reveals adaptive innovations driving the diversification of true bugs. Proc. R. Soc. B 2017, 284, 20171223. [Google Scholar] [CrossRef] [PubMed]
- Song, S.N.; Tang, P.; Wei, S.J.; Chen, X.X. Comparative and phylogenetic analysis of the mitochondrial genomes in basal hymenopterans. Sci. Rep. 2016, 6, 20972. [Google Scholar] [CrossRef] [PubMed]
- Mao, M.; Gibson, T.; Dowton, M. Higher-level phylogeny of the Hymenoptera inferred from mitochondrial genomes. Mol. Phylogen. Evol. 2015, 84, 34–43. [Google Scholar] [CrossRef]
- Tang, P.; Zhu, J.C.; Zheng, B.Y.; Wei, S.J.; Sharkey, M.; Chen, X.X.; Vogler, A.P. Mitochondrial phylogenomics of the Hymenoptera. Mol. Phylogen. Evol. 2019, 131, 8–18. [Google Scholar] [CrossRef] [PubMed]
- Timmermans, M.J.; Dodsworth, S.; Culverwell, C.L.; Bocak, L.; Ahrens, D.; Littlewood, D.T.; Pons, J.; Vogler, A.P. Why barcode? High-throughput multiplex sequencing of mitochondrial genomes for molecular systematics. Nucleic Acids Res. 2010, 38, e197. [Google Scholar] [CrossRef]
- Timmermans, M.J.; Lees, D.C.; Simonsen, T.J. Towards a mitogenomic phylogeny of Lepidoptera. Mol. Phylogen. Evol. 2014, 79, 169–178. [Google Scholar] [CrossRef]
- Ghanavi, H.R.; Twort, V.; Hartman, T.J.; Zahiri, R.; Wahlberg, N. The (non) accuracy of mitochondrial genomes for family-level phylogenetics in Erebidae (Lepidoptera). Zool. Scr. 2022, 51, 695–707. [Google Scholar] [CrossRef]
- Song, N.; Cai, W.Z.; Li, H. Insufficient power of mitogenomic data in resolving the auchenorrhynchan monophyly. Zool. J. Linn. Soc. 2018, 183, 776–790. [Google Scholar] [CrossRef]
- Cameron, S.L.; Lambkin, C.L.; Barker, S.C.; Whiting, M.F. A mitochondrial genome phylogeny of Diptera: Whole genome sequence data accurately resolve relationships over broad timescales with high precision. Syst. Entomol. 2007, 32, 40–59. [Google Scholar] [CrossRef]
- Sinclair, B.J.; Borkent, A.; Wood, D.M. The male genital tract and aedeagal components of the Diptera with a discussion of their phylogenetic significance. Zool. J. Linn. Soc. 2007, 150, 711–742. [Google Scholar] [CrossRef]
- Woodley, N. Phylogeny and calssification of the “Orthorrhaphous” Brachycera. In Manual of Nearctic Diptera; McAlpine, J.F., Ed.; Biosystematics Research Centre (formerly Institute): Ottawa, ON, USA, 1989; Volume 3, pp. 1371–1395. [Google Scholar]
- Narayanan Kutty, S.; Wong, W.H.; Meusemann, K.; Meier, R.; Cranston, P.S. A phylogenomic analysis of Culicomorpha (Diptera) resolves the relationships among the eight constituent families. Syst. Entomol. 2018, 43, 434–446. [Google Scholar] [CrossRef]
- Krzeminski, W.; Krzeminska, E. Triassic Diptera: Descriptions, revisions and phylogenetic relations. Acta Zool. Cracoviensia 2003, 46, 153–184. [Google Scholar]
- Shcherbakov, D.E.; Lukashevich, E.D.; Blagoderov, V.A. Triassic Diptera and initial radiation of the order. Int. J. Dipterol. Res. 1995, 6, 75–115. [Google Scholar]
- Grimaldi, D. The co-radiations of pollinating insects and angiosperms in the Cretaceous. Ann. Mo. Bot. Gard. 1999, 86, 373–406. [Google Scholar] [CrossRef]
- Bankevich, A.; Nurk, S.; Antipov, D.; Gurevich, A.A.; Dvorkin, M.; Kulikov, A.S.; Lesin, V.M.; Nikolenko, S.I.; Pham, S.; Prjibelski, A.D.; et al. SPAdes: A new genome assembly algorithm and its applications to single-cell sequencing. J. Comput. Biol. 2012, 19, 455–477. [Google Scholar] [CrossRef] [PubMed]
- Dierckxsens, N.; Mardulyn, P.; Smits, G. Novoplasty: De novo assembly of organelle genomes from whole genome data. Nucleic Acids Res. 2017, 45, e18. [Google Scholar]
- Kearse, M.; Moir, R.; Wilson, A.; Stones-Havas, S.; Cheung, M.; Sturrock, S.; Buxton, S.; Cooper, A.; Markowitz, S.; Duran, C.; et al. Geneious Basic: An integrated and extendable desktop software platform for the organization and analysis of sequence data. Bioinformatics 2012, 28, 1647–1649. [Google Scholar] [CrossRef]
- Grant, J.R.; Arantes, A.S.; Stothard, P. Comparing thousands of circular genomes using the CGView Comparison Tool. BMC Genom. 2012, 13, 202. [Google Scholar] [CrossRef]
- Curtis, C.; Schreck, C.E.; Sharma, V. Mosquitos and other biting Diptera. In Vector Control: Methods for Use by Individuals and Communities; Rozendaal, J.A., Ed.; World Health Organization: Geneva, Switzerland, 1997; pp. 7–28. [Google Scholar]
- Perna, N.T.; Kocher, T.D. Patterns of nucleotide composition at fourfold degenerate sites of animal mitochondrial genomes. J. Mol. Evol. 1995, 41, 353–358. [Google Scholar] [CrossRef] [PubMed]
- Katoh, K.; Standley, D.M. MAFFT multiple sequence alignment software version 7: Improvements in performance and usability. Mol. Biol. Evol. 2013, 30, 772–780. [Google Scholar] [CrossRef] [PubMed]
- Talavera, G.; Castresana, J. Improvement of phylogenies after removing divergent and ambiguously aligned blocks from protein sequence alignments. Syst. Biol. 2007, 56, 564–577. [Google Scholar] [CrossRef]
- Xiang, C.Y.; Gao, F.; Jakovlić, I.; Lei, H.P.; Hu, Y.; Zhang, H.; Zou, H.; Wang, G.T.; Zhang, D. Using PhyloSuite for molecular phylogeny and tree-based analyses. Imeta 2023, 2, e87. [Google Scholar] [CrossRef]
- Zhang, D.; Gao, F.; Jakovlić, I.; Zou, H.; Zhang, J.; Li, W.X.; Wang, G.T. PhyloSuite: An integrated and scalable desktop platform for streamlined molecular sequence data management and evolutionary phylogenetics studies. Mol. Ecol. Resour. 2020, 20, 348–355. [Google Scholar] [CrossRef]
- Rozas, J.; Ferrer-Mata, A.; Sánchez-DelBarrio, J.C.; Guirao-Rico, S.; Librado, P.; Ramos-Onsins, S.E.; Sánchez-Gracia, A. DnaSP 6: DNA sequence polymorphism analysis of large data sets. Mol. Biol. Evol. 2017, 34, 3299–3302. [Google Scholar] [CrossRef]
- Xia, X.; Xie, Z. DAMBE: Software package for data analysis in molecular biology and evolution. J. Hered. 2001, 92, 371–373. [Google Scholar] [CrossRef]
- Wong, T.K.; Kalyaanamoorthy, S.; Meusemann, K.; Yeates, D.K.; Misof, B.; Jermiin, L.S. A minimum reporting standard for multiple sequence alignments. NAR Genom. Bioinf. 2020, 2, lqaa024. [Google Scholar] [CrossRef]
- Kück, P.; Meid, S.A.; Groß, C.; Wägele, J.W.; Misof, B. AliGROOVE–visualization of heterogeneous sequence divergence within multiple sequence alignments and detection of inflated branch support. BMC Biol. 2014, 15, 294. [Google Scholar] [CrossRef]
- Minh, B.Q.; Schmidt, H.A.; Chernomor, O.; Schrempf, D.; Woodhams, M.D.; Von Haeseler, A.; Lanfear, R. IQ-TREE 2: New models and efficient methods for phylogenetic inference in the genomic era. Mol. Biol. Evol. 2020, 37, 2461, Erratum in Mol. Biol. Evol. 2020, 37, 1530–1534. [Google Scholar] [CrossRef]
- Anisimova, M.; Gil, M.; Dufayard, J.F.; Dessimoz, C.; Gascuel, O. Survey of branch support methods demonstrates accuracy, power, and robustness of fast likelihood-based approximation schemes. Syst. Biol. 2011, 60, 685–699. [Google Scholar] [CrossRef]
- Minh, B.Q.; Hahn, M.W.; Lanfear, R. New methods to calculate concordance factors for phylogenomic datasets. Mol. Biol. Evol. 2020, 37, 2727–2733. [Google Scholar] [CrossRef] [PubMed]
- Krzemiński, W.; Kania-Klosok, I.; Krzemińska, E.; Ševčík, J.; Soszyńska-Maj. Fossils Shed a New Light on the Diversity and Disparity of the Family Limoniidae (Diptera, Nematocera). Insects 2021, 12, 206. [Google Scholar] [CrossRef]
- Li, X.K.; Teasdale, L.C.; Bayless, K.M.; Ellis, A.G.; Wiegmann, B.M.; Lamas, C.J.E.; Lambkin, C.L.; Evenhuis, N.L.; Nicholls, J.A.; Hartley, D.; et al. Phylogenomics reveals accelerated late Cretaceous diversification of bee flies (Diptera: Bombyliidae). Cladistics 2021, 37, 276–297. [Google Scholar] [CrossRef] [PubMed]
- Grimaldi, D. Diverse orthorrhaphan Flies (Insecta, Diptera, Brachycera) in Amber from the Cretaceous of Myanmar; American Museum of Natural History: New York, NY, USA, 2016. [Google Scholar]
- Krzeminski, W.; Krzeminska, E.; Papier, F. Grauvogelia arzvilleriana sp. n.-the oldest Diptera species [Lower-Middle Triassic of France]. Acta Zool. Cracoviensia 1994, 37, 95–99. [Google Scholar]
- Yang, Z.H. PAML 4: Phylogenetic analysis by maximum likelihood. Mol. Biol. Evol. 2007, 24, 1586–1591. [Google Scholar] [CrossRef]
- Zhou, T.; Xu, K.D.; Zhao, F.; Liu, W.Y.; Li, L.Z.; Hua, Z.Y.; Zhou, X. itol.toolkit accelerates working with iTOL (Interactive Tree of Life) by an automated generation of annotation files. Bioinformatics 2023, 39, btad339. [Google Scholar] [CrossRef] [PubMed]

| Family | Species | Length (bp) | A Content (A%) | T Content (T%) | G Content (G%) | GC Content (GC%) | AT- Skew | GC- Skew | Accession No |
|---|---|---|---|---|---|---|---|---|---|
| Tipulidae | Holorusia flava flava | 16,557 | 38.80 | 38.10 | 9.20 | 23.10 | 0.0091 | −0.2035 | MT511104 |
| Antocha sp. | 15,578 | 40.00 | 35.90 | 10.10 | 24.10 | 0.0540 | −0.1618 | MT511110 | |
| Limoniidae | Conosia irrorata | 15,374 | 40.20 | 37.80 | 8.70 | 22.00 | 0.0307 | −0.2091 | MT511115 |
| Hexatoma sp. | 15,883 | 39.00 | 36.90 | 9.40 | 24.20 | −0.0277 | −0.2231 | MT511103 | |
| Keroplatidae | Keroplatidae sp. | 15,879 | 40.60 | 33.10 | 10.70 | 26.30 | 0.1018 | −0.1863 | MT511114 |
| Stratiomyidae | Ptecticus aurifer | 15,572 | 38.00 | 37.80 | 9.70 | 24.10 | 0.0026 | −0.1950 | MT511124 |
| Asilidae | Clephydroneura sp. | 15,714 | 40.70 | 29.30 | 10.40 | 30.00 | 0.1629 | −0.3067 | MT424762 |
| Tabanus sp. | 15,991 | 39.20 | 38.90 | 8.90 | 22.00 | 0.0038 | −0.1909 | MT511107 | |
| Tabanidae | Atylotus sinensis | 15,319 | 38.80 | 38.80 | 9.50 | 22.40 | 0.0000 | −0.1518 | MT511118 |
| Tabanidae sp. | 15,648 | 40.10 | 35.50 | 9.40 | 24.40 | 0.0608 | −0.2300 | MT511116 | |
| Homoneura sp. | 16,208 | 38.60 | 38.00 | 9.60 | 23.50 | 0.0078 | −0.1830 | MT511108 | |
| Lauxaniidae | Homoneura sp. | 16,284 | 38.90 | 38.30 | 9.70 | 22.80 | 0.0078 | −0.1490 | MT511111 |
| Lauxaniidae sp. | 16,279 | 31.90 | 41.80 | 12.60 | 26.30 | −0.1343 | −0.0418 | MT511112 | |
| Celyphidae | Spaniocelyphus sp. | 15,342 | 37.60 | 38.50 | 9.80 | 23.90 | −0.0118 | −0.1799 | MT511119 |
| Syrphidae | Phytomia zonata | 15,537 | 40.80 | 38.40 | 8.60 | 20.80 | 0.0303 | −0.1731 | MT511105 |
| Asarkina porcina | 15,477 | 40.40 | 40.70 | 80.00 | 18.90 | −0.0037 | −0.1534 | MT511106 | |
| Melanostoma sp. | 15,610 | 41.00 | 40.00 | 8.50 | 19.00 | 0.0123 | −0.1053 | MT511120 | |
| Microdon sp. | 15,770 | 42.00 | 38.10 | 7.40 | 19.90 | 0.0487 | −0.2563 | MT511101 | |
| Calliphoridae | Chrysomya megacephala | 15,908 | 39.50 | 37.60 | 9.40 | 22.90 | 0.0246 | −0.1790 | MT511113 |
| Sarcophagidae | Blepharipa sp. | 15,835 | 41.40 | 38.40 | 7.90 | 20.20 | 0.0376 | −0.2178 | MT511109 |
| Tachinidae | Tachinidae sp. | 16,291 | 40.90 | 37.70 | 8.40 | 21.50 | 0.0407 | −0.2186 | MT511123 |
| Tephritidae | Zeugodacus depressus | 16,546 | 39.70 | 32.60 | 10.20 | 28.10 | 0.0982 | −0.2740 | MT477832 |
| Platystomatidae | Loxoneura sp. | 15,307 | 39.90 | 32.50 | 10.70 | 27.60 | 0.1022 | −0.2246 | MT511102 |
| Empididae | Hercostomus potanini | 15,633 | 38.70 | 34.50 | 10.40 | 26.70 | 0.0574 | −0.2210 | MT511125 |
| Bombyliidae | Systropus daiyunshanus | 16,585 | 39.60 | 34.50 | 9.90 | 25.80 | 0.0688 | −0.2326 | MT511117 |
Disclaimer/Publisher’s Note: The statements, opinions and data contained in all publications are solely those of the individual author(s) and contributor(s) and not of MDPI and/or the editor(s). MDPI and/or the editor(s) disclaim responsibility for any injury to people or property resulting from any ideas, methods, instructions or products referred to in the content. |
© 2025 by the authors. Licensee MDPI, Basel, Switzerland. This article is an open access article distributed under the terms and conditions of the Creative Commons Attribution (CC BY) license (https://creativecommons.org/licenses/by/4.0/).
Share and Cite
Yuan, H.; Chen, B. A Comparative Analysis and Limited Phylogenetic Implications of Mitogenomes in Infraorder-Level Diptera. Int. J. Mol. Sci. 2025, 26, 7222. https://doi.org/10.3390/ijms26157222
Yuan H, Chen B. A Comparative Analysis and Limited Phylogenetic Implications of Mitogenomes in Infraorder-Level Diptera. International Journal of Molecular Sciences. 2025; 26(15):7222. https://doi.org/10.3390/ijms26157222
Chicago/Turabian StyleYuan, Huan, and Bin Chen. 2025. "A Comparative Analysis and Limited Phylogenetic Implications of Mitogenomes in Infraorder-Level Diptera" International Journal of Molecular Sciences 26, no. 15: 7222. https://doi.org/10.3390/ijms26157222
APA StyleYuan, H., & Chen, B. (2025). A Comparative Analysis and Limited Phylogenetic Implications of Mitogenomes in Infraorder-Level Diptera. International Journal of Molecular Sciences, 26(15), 7222. https://doi.org/10.3390/ijms26157222