Article

Unveiling Adulteration in Herbal Markets: MassARRAY iPLEX Assay for Accurate Identification of Plumbago indica L.

by
Kannika Thongkhao
1,2,
Aekkhaluck Intharuksa
3,* and
Ampai Phrutivorapongkul
3
1
School of Languages and General Education, Walailak University, Nakhon Si Thammarat 80160, Thailand
2
Herbology Research Center, Walailak University, Nakhon Si Thammarat 80160, Thailand
3
Department of Pharmaceutical Sciences, Faculty of Pharmacy, Chiang Mai University, Chiang Mai 50200, Thailand
*
Author to whom correspondence should be addressed.
Int. J. Mol. Sci. 2025, 26(15), 7168; https://doi.org/10.3390/ijms26157168
Submission received: 5 June 2025 / Revised: 13 July 2025 / Accepted: 22 July 2025 / Published: 24 July 2025
(This article belongs to the Section Molecular Pharmacology)

Abstract

The root of Plumbago indica L. is commercially available in herbal markets in both crude and powdered forms. P. indica root is a key ingredient in numerous polyherbal formulations. However, P. indica has two closely related species, P. zeylanica L. and P. auriculata Lam. Since only P. indica is traditionally used in Thai polyherbal products, adulteration with other species could potentially compromise the therapeutic efficacy and overall effectiveness of these formulations. To address this issue, a MassARRAY iPLEX assay was developed to accurately identify and differentiate P. indica from its closely related species. Five single nucleotide polymorphism (SNP) sites—positions 18, 112, 577, 623, and 652—within the internal transcribed spacer (ITS) region were selected as genetic markers for species identification. The assay demonstrated high accuracy in identifying P. indica and was capable of detecting the species at DNA concentrations as low as 0.01 ng/µL. Additionally, the assay successfully identified P. zeylanica in commercial crude drug samples, highlighting potential instances of adulteration. Furthermore, it was able to distinguish P. indica in mixed samples containing P. indica, along with either P. zeylanica or P. auriculata. The developed MassARRAY iPLEX assay proves to be a reliable and effective molecular tool for authenticating P. indica raw materials. Its application holds significant potential for ensuring the integrity of herbal products by preventing misidentification and adulteration.

Graphical Abstract

1. Introduction

Plumbago indica L. (Indian leadwort or Jettamoon Pleung Daeng in Thai) is a medicinal plant belonging to the Plumbaginaceae family (Figure 1A–C). It has been widely utilized in traditional medical systems, including Ayurvedic, Chinese, and Thai traditional medicine. The roots and leaves of P. indica have been traditionally used for their therapeutic properties, including digestive stimulation, anti-inflammatory effects, anthelmintic activity, diaphoretic properties, and expectorant benefits [1]. Scientific evidence suggests that the ethanolic extract of P. indica exhibits strong genotoxic effects and suppresses the cell cycle in human lymphocytes [2]. Similar to other species in the Plumbaginaceae family, the roots of P. indica contain plumbagin (5-hydroxy-2-methyl-1,4-naphthoquinone), which is the primary bioactive compound among several other phytochemicals present in the plant. Plumbagin plays a crucial role in anti-inflammatory, antibacterial, antioxidant, and anticancer activities. Its antioxidant and anti-inflammatory properties have shown promising potential for the treatment of neurodegenerative and cardiovascular diseases [3]. The roots of P. indica (Figure 1C,D) are highly valued in the pharmaceutical and natural medicine industries due to the pharmacological properties of plumbagin, which influence the market dynamics, utilization, and pricing of herbal raw materials [1]. P. indica is a key component in various polyherbal medicinal formulations, including “Ya Benchakun,” “Ya Fai Pralaikan,” “Ya Fai Ha Kong,” and “Ya Lueat Ngam”—all of which are recorded in the National List of Essential Medicines in Thailand. For instance, “Ya Benchakun” (Figure 1E) is composed of five medicinal plant species: the roots of P. indica, the stem of Piper interuptum Opiz., the fruits of Piper longum L., the roots of Piper sarmentosum Roxb., and the rhizomes of Zingiber officinale Roscoe [4]. This formulation is available in various herbal dosage forms, including powders, tablets, pills, and infusions. Scientific evidence suggests that “Ya Benchakun” holds therapeutic potential for the treatment of cholangiocarcinoma [5]. Additionally, the ethanolic extract of “Ya Benchakun” has demonstrated anti-allergic and anti-inflammatory effects by inhibiting nitric oxide (NO) production [4]. Another polyherbal formulation, “Ya Lueat Ngam,” is traditionally used to treat primary dysmenorrhea, pain, and inflammation [6]. In addition to P. indica, two other Plumbago species are found in Thailand: P. zeylanica L. (Ceylon leadwort or Jettamoon Pleung Kaow in Thai) and P. auriculata Lam. (Cape leadwort or Jettamoon Pleung Farang). P. zeylanica has been reported to exhibit significant therapeutic potential for managing diabetes, cardiovascular disorders, ulcers, liver problems, obesity, wound healing, and cancer [7]. Meanwhile, P. auriculata Lam. is primarily used as an ornamental plant, though its hydroalcoholic extract has shown promising antiparasitic activity, as well as anti-inflammatory properties, similar to other species within this genus [8,9]. However, among these species, only the roots of P. indica are used as an ingredient in the Thai polyherbal formulations mentioned above. The substitution of P. indica with alternative species may compromise the therapeutic efficacy of these formulations, potentially affecting their intended medicinal benefits.
The increasing demand for herbal materials in the global herbal market extends beyond Plumbago indica to other valuable medicinal plants, such as Centella asiatica (L.) Urb., Cyanthillium cinereum (L.) H. Rob., Saraca asoca (Roxb.) W.J. de Wilde, and Myristica fragrans Houtt. [10,11,12,13]. Scientific evidence indicates that 1-year-old P. indica roots cultivated under conventional field conditions can yield 1.33 g of plumbagin per 100 g (dry weight) of raw material [14]. This raises concerns regarding product quality, particularly in relation to unauthenticated practices, such as adulteration and product substitution [15]. To mitigate these issues, the World Health Organization (WHO) has established internationally recognized guidelines for assessing raw materials used in herbal medicine, ensuring their quality, efficacy, and safety [16]. Various authentication tools have been developed to prevent adulteration and substitution. Morphological identification relies on characteristics such as leaf shape, flower structure, stem morphology, bark features, and fruit and seed traits to distinguish herbal materials [17]. Microscopic analysis involves the use of microscopy to examine cellular structures and anatomical features unique to specific plant species [18]. Chemical profiling methods analyze the chemical composition of herbal materials through techniques such as high-performance liquid chromatography (HPLC) [19,20], gas chromatography-mass spectrometry (GC-MS) [21,22], liquid chromatography-tandem mass spectrometry (LC-MS/MS) [20,23], and high-performance thin-layer chromatography (HPTLC) [20]. In addition, DNA barcoding has emerged as a highly effective tool for the quality control of herbal materials. This method enables species identification by analyzing single-nucleotide polymorphisms (SNPs) within short DNA regions, making it applicable to both fresh and highly processed herbal materials [24,25]. DNA barcoding has been integrated with various advanced technologies to enhance species differentiation, including next-generation sequencing (NGS), lateral-flow immunochromatographic assays (LFA), and high-performance thin-layer chromatography (HPTLC) [26,27,28]. Recently, the MassARRAY iPLEX method has been employed for SNP identification in plant species. For example, it has been used to analyze embryo DNA to reveal the abscission of self-fertilized progeny during fruit development in macadamia, as well as for species differentiation in plants such as common bean and Moscow salsify [29,30,31]. This method combines matrix-assisted laser desorption/ionization time-of-flight mass spectrometry (MALDI-TOF MS) with PCR amplification, utilizing single-base extension (SBE) chemistry and dideoxynucleotides (ddNTPs) to incorporate a single base at the 3′-end of an extension primer. The mass of the incorporated nucleotide is then measured via mass spectrometry, allowing for the precise identification of nucleotide sequences based on their specific molecular mass [32]. However, the application of MassARRAY technology for the quality assessment of medicinal plants through identification or authentication remains relatively limited.
Our previous DNA barcoding study on P. indica, P. zeylanica, and P. auriculata identified nucleotide variation sites within the internal transcribed spacer 2 (ITS2) region, which has been proposed as an effective DNA barcode for authenticating Plumbago crude drugs [33]. However, species identification using the DNA barcoding method is time-consuming, as it requires nucleotide sequencing, Basic Local Alignment Search Tool (BLAST) searches (https://blast.ncbi.nlm.nih.gov/Blast.cgi, accessed on 5 June 2025), and subsequent data analysis. As an alternative, the MassARRAY technique offers a DNA sequencing-free approach with several advantages. This method supports multiplex reactions within a single run and provides higher sensitivity and accuracy, high throughput capability, cost-effectiveness, flexibility, and reliability compared to conventional DNA sequencing methods [34]. Although this technique has been widely applied for SNP identification in various fields, its application in plant species identification is still limited. Therefore, the objective of this study is to apply MassARRAY technology for Plumbago species identification using DNA barcode information from our previous study. Specifically, this method will be employed to identify P. indica raw materials, detect SNP sites along the ITS barcode, and differentiate P. indica from its closely related species, P. zeylanica and P. auriculata. By demonstrating the feasibility of MassARRAY for herbal material authentication, this study aims to expand its application in the field of herbal quality control.

2. Results

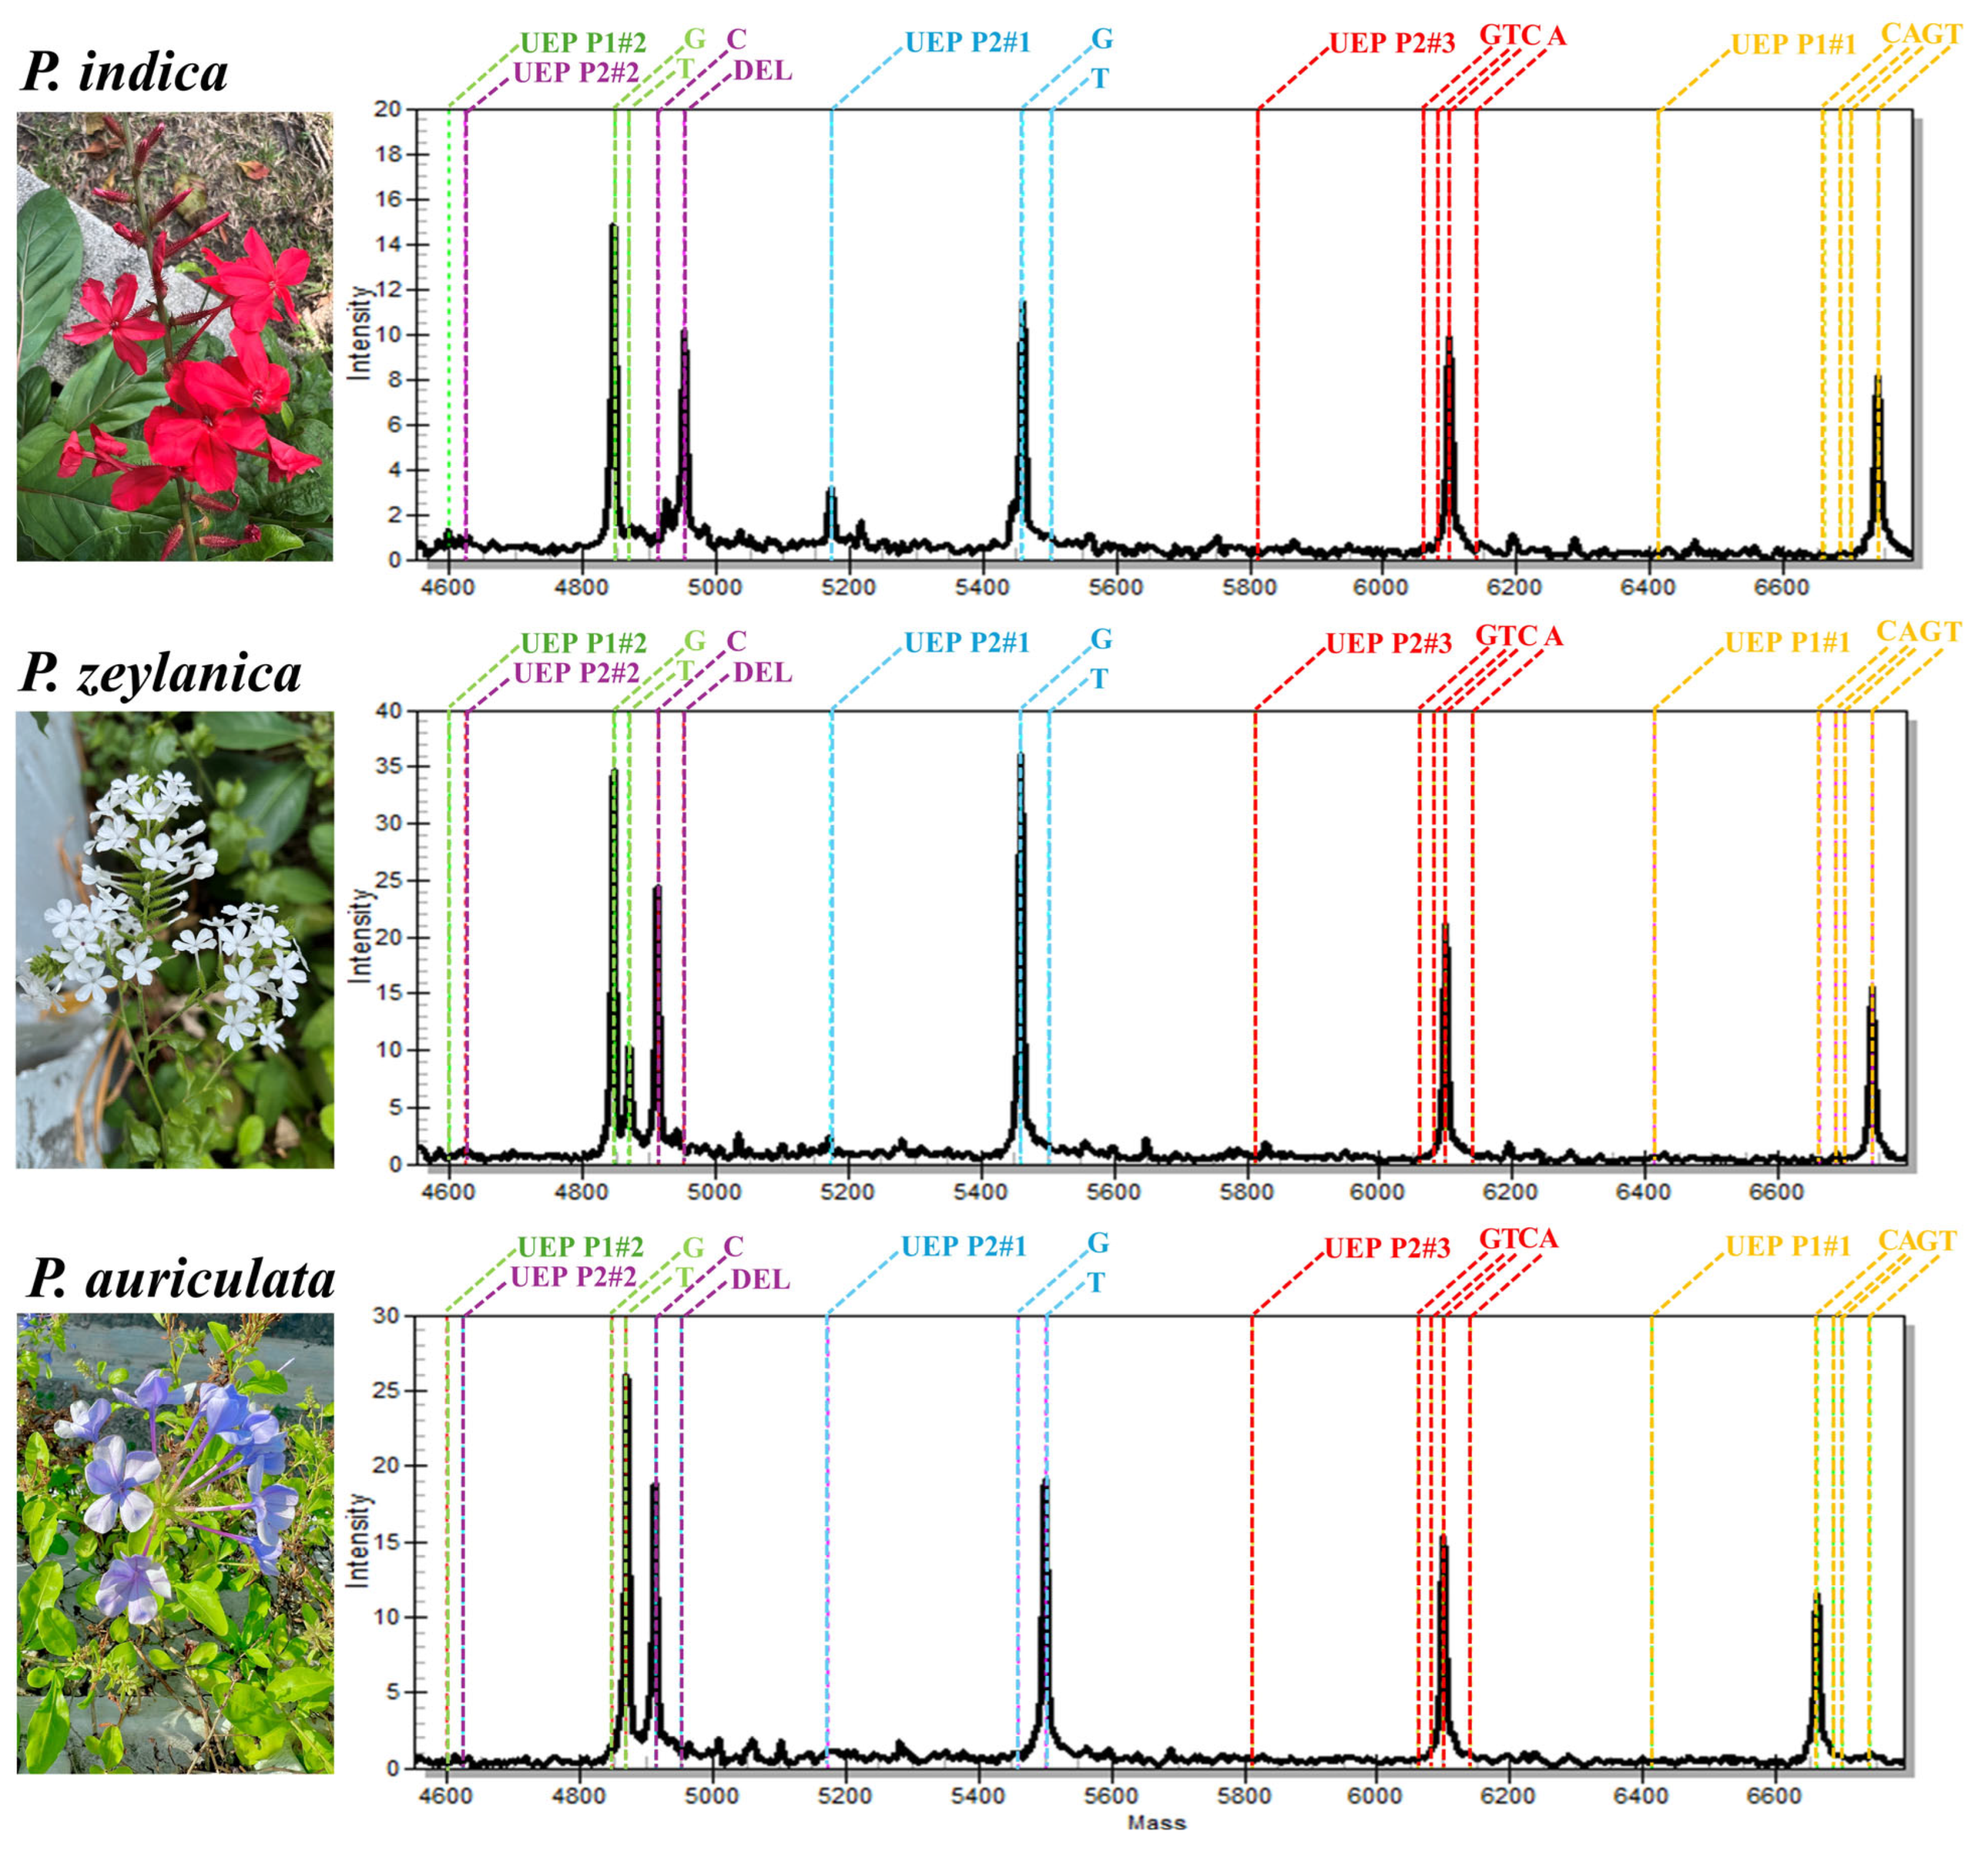
2.1. MALDI-TOF MS Analysis Differentiated P. indica from P. zeylanica and P. auriculata

The molecular masses obtained from the extension products were analyzed using MALDI-TOF MS analysis. Five unextended primers (UEPs), namely P1#1, P1#2, P2#1, P2#2, and P2#3, exhibited masses of 6414.2, 4599.0, 5172.4, 4625.0, and 5811.8 Daltons (Da), respectively. After the iPLEX extension process, the mass of each extension primer varied due to the contribution of the nucleotide bases (dCMP, dTMP, dAMP, or dGMP) at the 3ʹ-end of each extension primer (Table 1). The MALDI-TOF MS spectra exhibited distinct mass profiles for authentic P. indica, P. zeylanica, and P. auriculata (Figure 2). The mass profile of P. indica extension products was obtained from all five extension primers. The extension products revealed molecular masses of 6741.3 Da (P1#1), 4846.2 Da (P1#2), 5459.6 Da (P2#1), 4952.1 Da (P2#2), and 6059.0 Da (P2#3), corresponding to the nucleotide bases T, G, G, indel (insertion/deletion: indel is a biological term referring to an insertion or deletion of nucleotides within a DNA sequence), and C at positions 18, 112, 577, 623, and 659, respectively. The mass spectra of P. zeylanica revealed molecular masses of 6741.3 Da (P1#1), 4846.2 Da (P1#2), 5459.6 Da (P2#1), 4912.2 Da (P2#2), and 6059.0 Da (P2#3), corresponding to the bases T, G, G, C, and C, respectively. An additional mass at 4870.2 Da (base T) was observed from the P1#2 extension product. The mass profile of P. auriculata exhibited spectra at 6661.4 Da (P1#1), 4870.2 Da (P1#2), 5499.5 Da (P2#1), 4912.2 Da (P2#2), and 6059.0 Da (P2#3), which indicated nucleotide bases C, T, T, C, and C, respectively. No additional peaks were observed from the P. auriculata samples (Table 2).

2.2. Sensitivity of MassArray Technique for the Identification of P. indica, P. zeylanica, and P. auriculata

Sensitivity analysis of all iPLEX reactions using the extension primers (P1#1, P1#2, P2#1, P2#2, and P2#3) showed that detection sensitivity depended on genomic DNA concentrations (Table 3). The iPLEX extension primers produced accurate nucleotide sequence results when genomic DNA templates were within the range of 10–0.01 ng/µL. Genomic DNA concentrations lower than 0.01 ng/µL resulted in incorrect nucleotide sequence detection for Plumbago species.

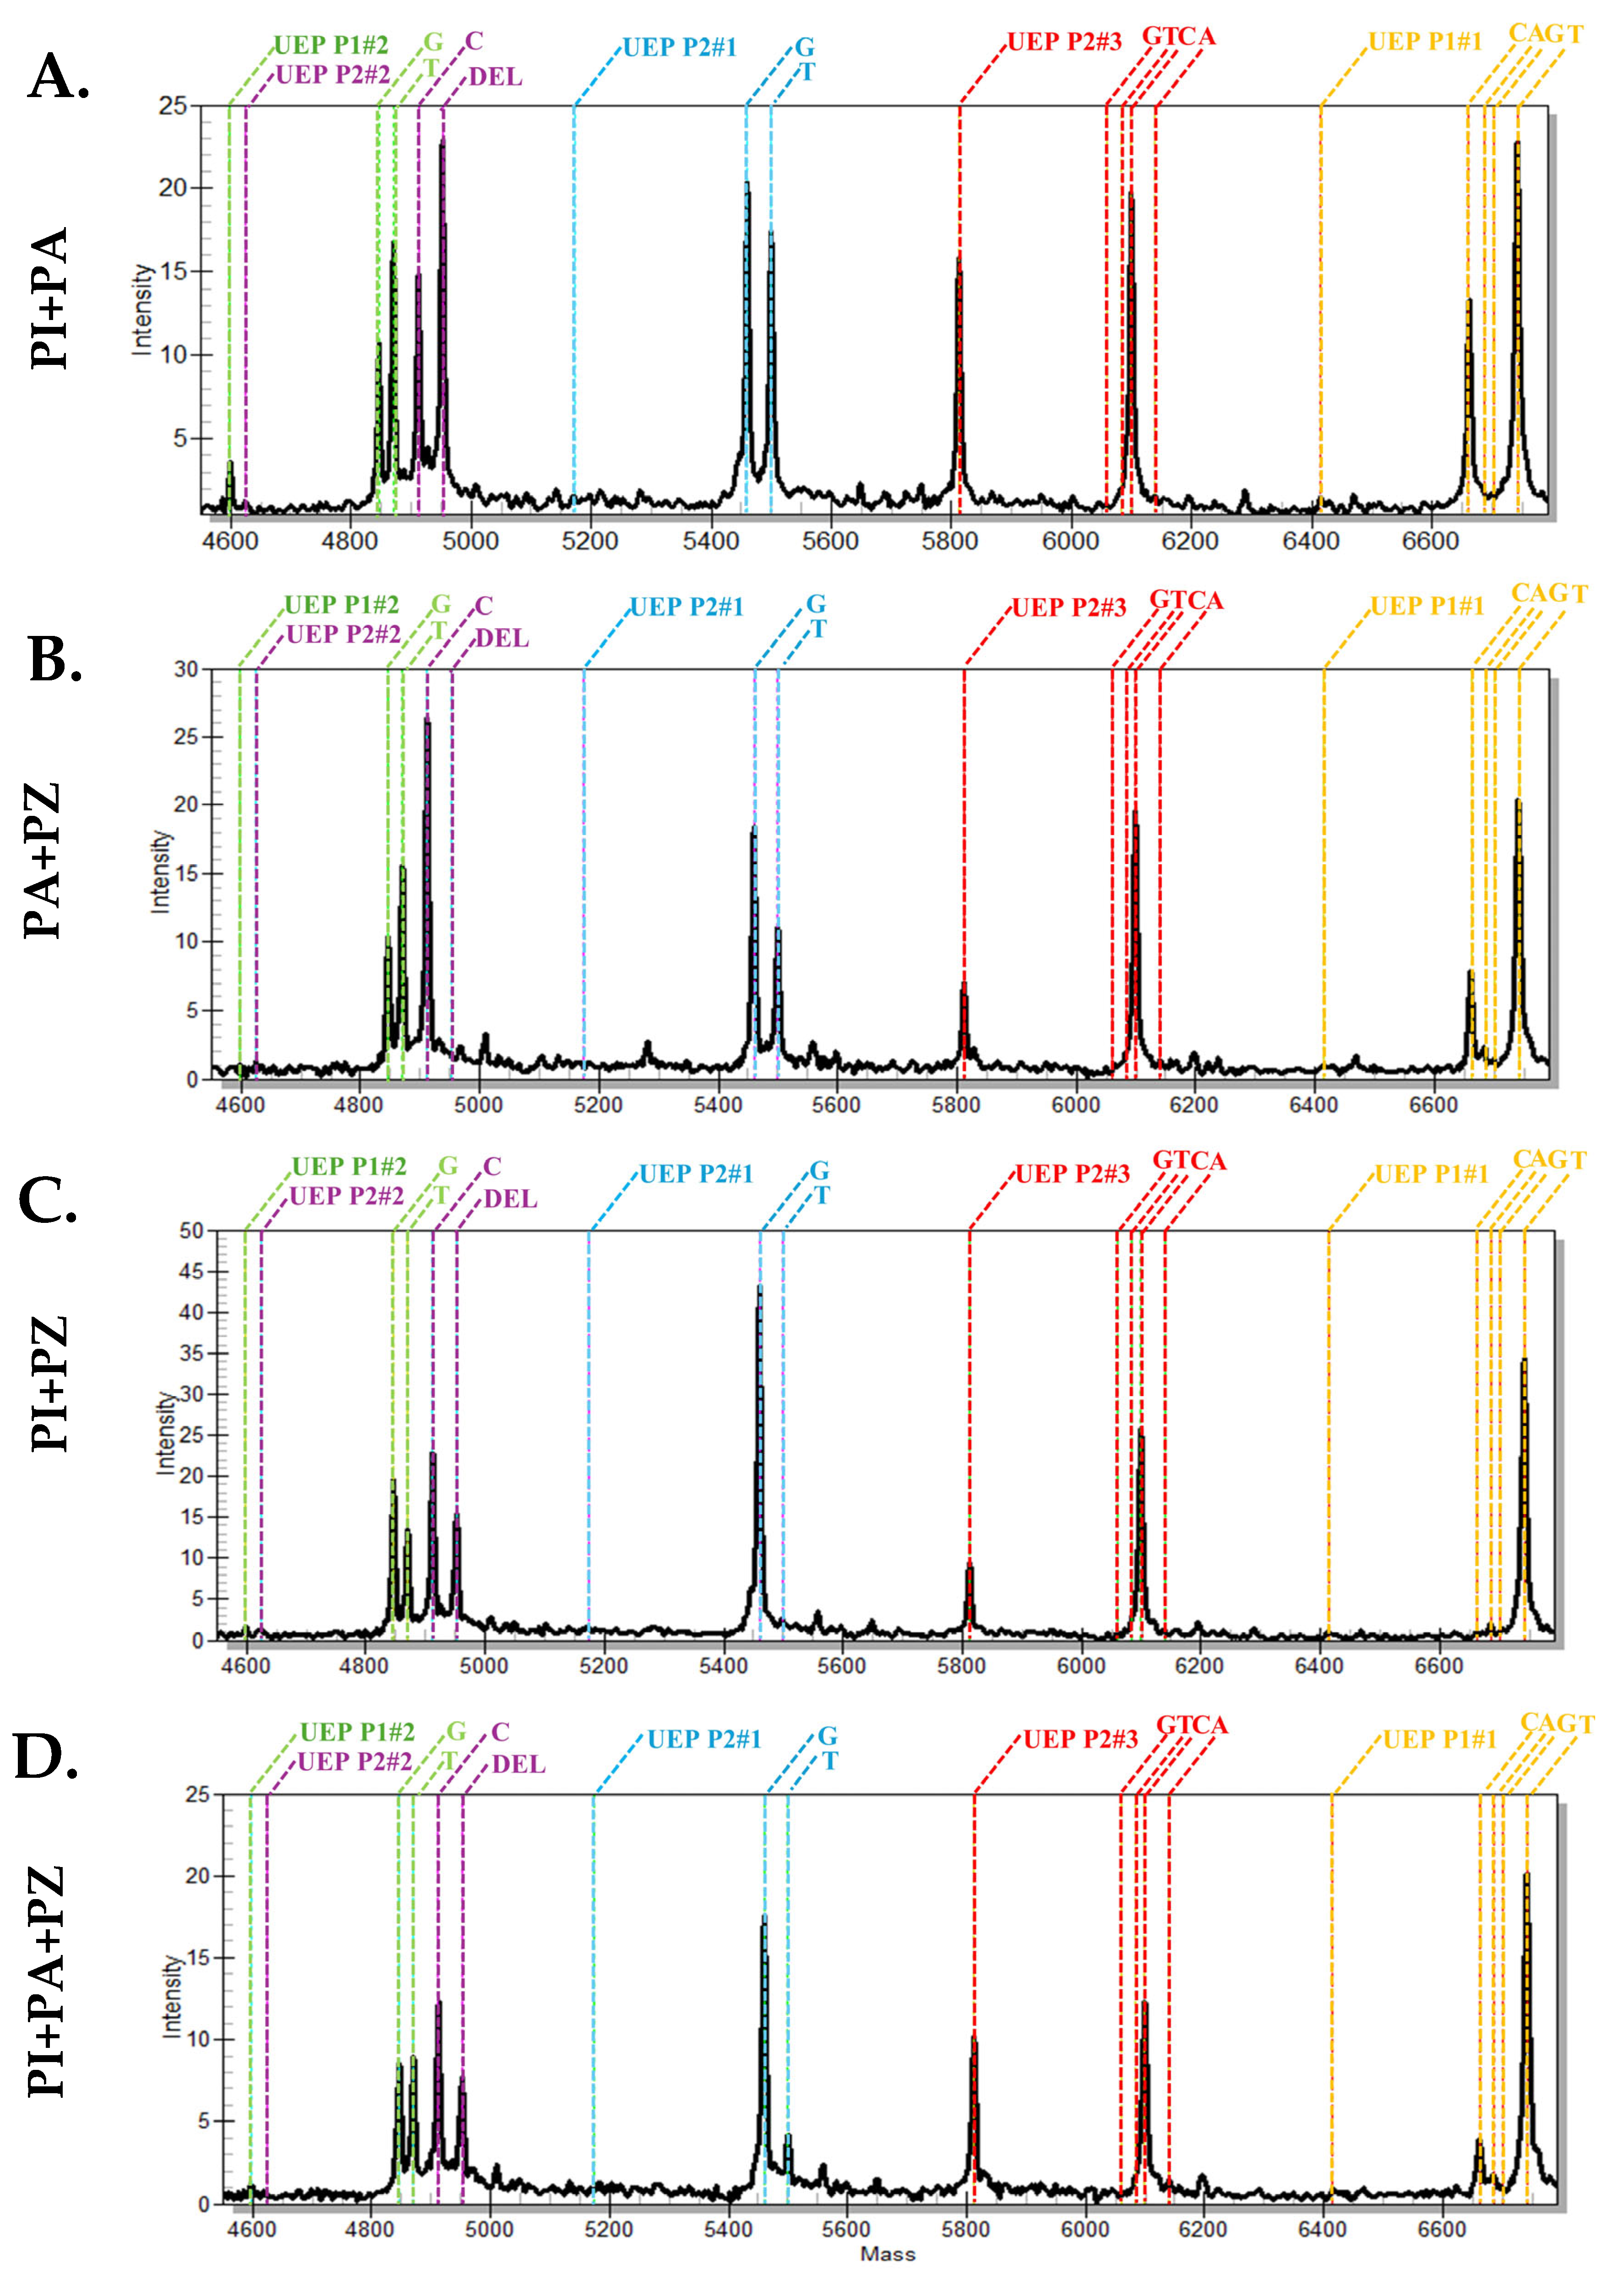
2.3. Identification of P. indica in Plumbago-Mixed Samples the MassARRAY Analysis Successfully Identified Plumbago indica in the Mixed Plumbago Sample

In Plumbago-mixed samples, the iPLEX extension reaction successfully identified the mixture of P. indica and P. auriculata (Figure 3). Mass spectra revealed the indel SNP at position 623 for P. indica (Figure 3A), which was detected in all P. indica mixed samples (Figure 3A,C,D). Species-specific SNPs for P. auriculata at positions 18, 112, and 577 were observed in all P. auriculata-mixed samples (Figure 3A,B,D). In the P. indica+P. zeylanica reaction, the iPLEX extension product from the P1#2 primer showed two spectra at 4846.2 and 4870.2, indicating the presence of bases G and T (Figure 3C). For the three-species mixed sample, the indel SNP of P. indica was detected along with all three P. auriculata species-specific SNPs. The internal control base at SNP position 652, detected by the P2#3 primer, was present in all samples, and the nucleotide sequence was correctly identified through MassARRAY analysis (Figure 3).

2.4. Identification of Jettamoon Pleung Daeng Crude Drugs and the Crude Drug Composed in the Traditional Thai Medicinal Formulations

This study focused on the authentication of commercial Jettamoon Pleung Daeng crude drugs derived from P. indica root (C-1 to C-9) and traditional Thai medicinal formulations containing Jettamoon Pleung Daeng crude drug as an ingredient. Both purchased and in-house prepared formulations were analyzed to verify the presence of Jettamoon Pleung Daeng in these preparations. The results, shown in Table 4, confirmed that all Jettamoon Pleung Daeng crude drug samples originated from roots of P. indica, as all iPLEX extension products exhibited identical SNP positions compared to the mass profile of the authentic P. indica species. However, MassARRAY analysis revealed that the commercial polyherbal formulations “Ya Benchakun” (R-2) and “Ya Fai Ha Kong” (R-6) were adulterated, as the P. indica species in these polyherbals was replaced by P. zeylanica.

3. Discussion

Our MassARRAY iPLEX results identified the presence of the roots P. zeylanica in commercial herbal products that contained Jettamoon Pleung Daeng crude drugs, indicating that adulterated products are still prevalent in the market. This highlights the importance of authentication in herbal medicine raw materials to ensure the safety, efficacy, and quality of herbal products. While the WHO and national FDA authorities have taken these issues seriously, as reflected in their policies and regulations, adulterant and substitute products continue to appear both online and on shelves. In 2019, a comprehensive global survey using DNA-based authentication methods revealed that 27% of 5957 commercial herbal products sold across 37 countries were adulterated [35]. Although P. indica, P. zeylanica, and P. auriculata all contain plumbagin, the concentration of this compound, along with other potentially differing compounds, can vary between species and may alter their therapeutic effects [36]. As a result, substituting one species for another without consulting a qualified traditional medicine expert is not recommended.
As the cost of next-generation sequencing continues to decrease, DNA sequencing-based methods are becoming more cost-effective. However, DNA degradation can affect the accuracy of DNA-based analysis. Furthermore, the quality of results obtained from DNA barcoding and metabarcoding methods depends heavily on the quality of the DNA template and the completeness of the reference database used for accurate herbal species identification. Several studies have utilized SNP sites within DNA barcode sequences, combining them with high-sensitivity, cost-effective, and rapid technologies to make DNA barcoding more efficient and accessible [26,37,38]. SNP-based identification provides a precise and reliable method for species identification and quality control, which is especially valuable for distinguishing closely related plant species. In this study, we utilized SNP sites within the ITS barcode region for iPLEX extension assay design, based on findings from our previous work. The mass of the iPLEX extension products was determined using the MassARRAY system for accurate and high-throughput analysis. The MassARRAY iPLEX technique does not require a nucleotide sequence database for analysis, nor does it rely on fluorescent compounds. Instead, it directly analyzes DNA products, making it a versatile method as the assays are not pre-spotted onto the chip by the manufacturer [39]. In terms of sensitivity, MassARRAY iPLEX technique provides high sensitivity, capable of detecting nucleotides at concentrations as low as 0.01 ng/µL, which is 1000-fold sensitive compared to the gold standard sanger Sequencing method, which requires a minimum DNA template concentration of 10 ng/µL using this primer set. This high sensitivity is beneficial for analyzing degraded DNA templates, which are commonly found in the powdered herbal products.
In this study, the application of the MassARRAY iPLEX for P. indica demonstrated species-specific spectra across all targeted SNP sites, confirming that the iPLEX extension primers are highly effective for identifying P. indica in both single-species and mixed-species samples. However, the mass of the P1#2 extension product, with a peak at 4870.2 Da, appeared in both P. auriculata and P. zeylanica. Sanger sequencing results showed that P. zeylanica had the heterozygous site, G or T, at this position (Supplementary Material). This suggests that the P1#2 primer, which targets nucleotide position 112, was not suitable for the species-specific site of P. auriculata. This finding may be attributed to the specific DNA barcode region used in this study, as heterozygosity and loss of heterozygosity within the ITS region could complicate the MassArray analysis [40,41]. Therefore, it is crucial to consider the potential impacts of heterozygosity and loss of heterozygosity (LOH) on the accuracy and reliability of the results.
Molecular techniques have become indispensable for identifying plant species in crude drugs and herbal products. Their widespread adoption stems from their high accuracy, reliability, and rapid turnaround time, offering a significant advantage over conventional methods like organoleptic, macroscopic, microscopic, and chemical analyses, which often struggle to distinguish closely related plant species [42,43,44,45]. However, a primary limitation of molecular techniques lies in their reliance on high numbers of secondary metabolites and the integrity of genomic DNA [45]. DNA degradation can commonly occur during various stages, including the collection, processing, and storage of herbal materials, as well as during the preparation of traditional formulations, particularly when high-temperature treatments are involved [46]. This degradation can impede successful amplification and sequencing, thereby compromising the effectiveness of molecular assays. To overcome these challenges and ensure accurate species identification, especially when molecular approaches face technical limitations, integrating orthogonal methods such as chemical profiling is recommended to validate molecular findings [44,45,47]. This complementary approach enhances the overall reliability and robustness of species authentication in herbal medicine research and quality control.

4. Materials and Methods

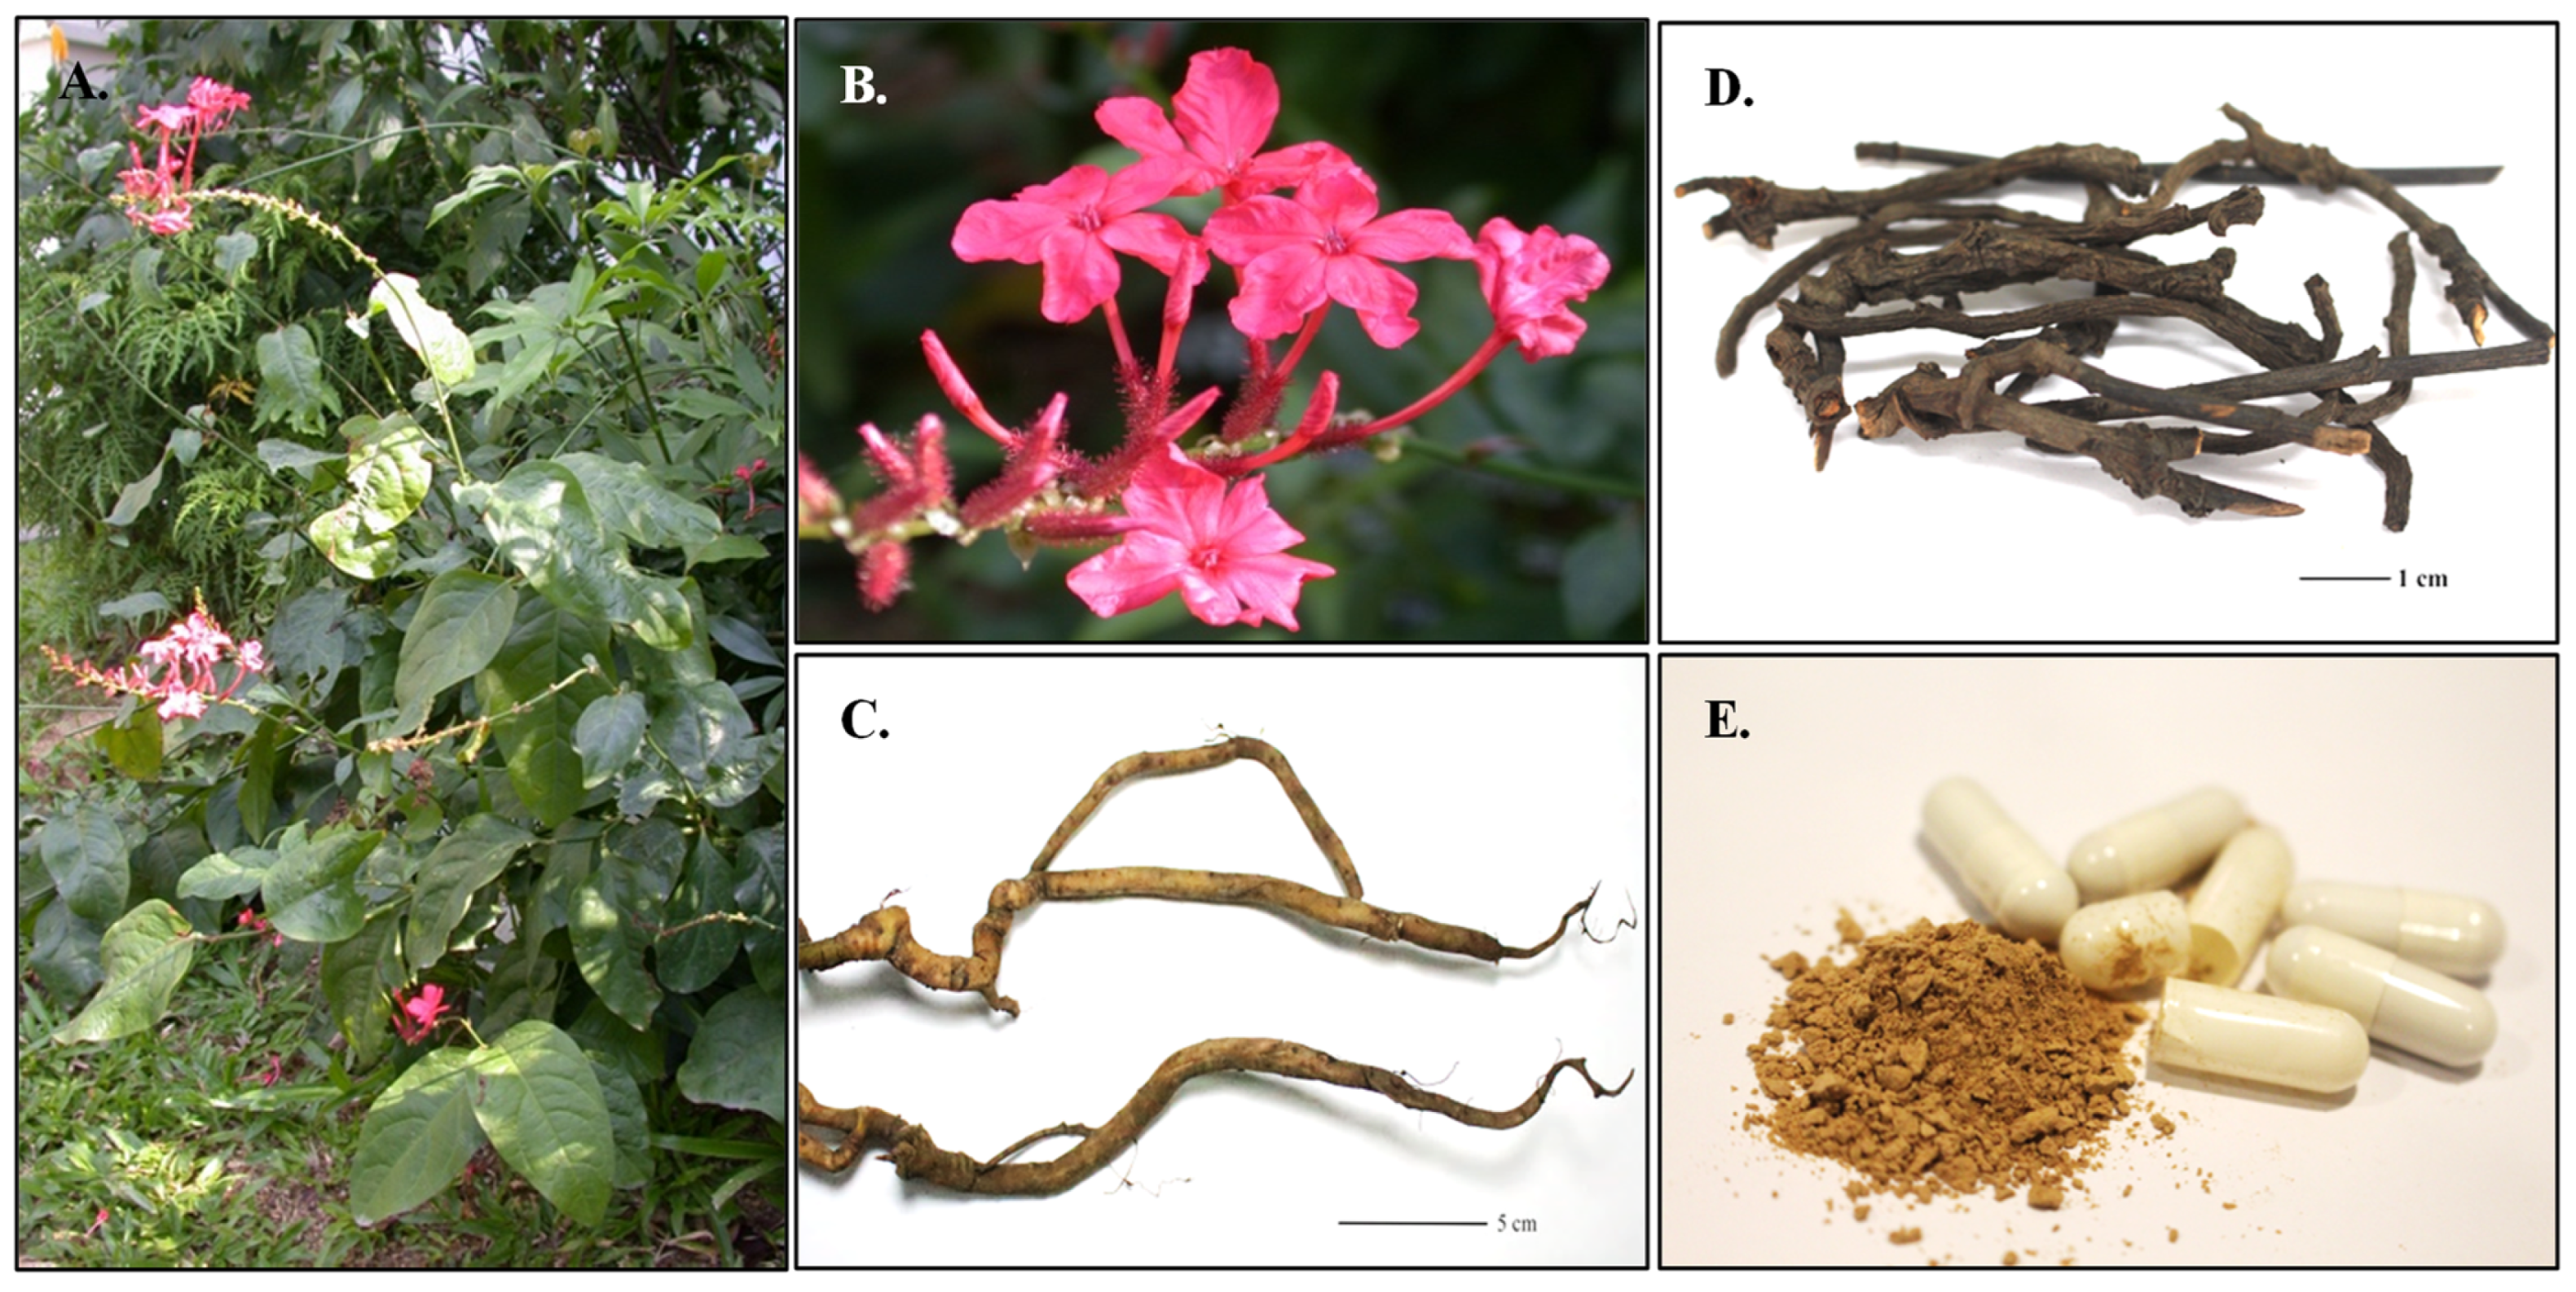
4.1. Plant Materials, Commercial Crude Drugs, and Traditional Formulations

Three species of PlumbagoP. indica L., P. zeylanica L., and P. auriculata Lam.—were randomly collected and used as reference specimens. Details of the collection sites, dates, and code numbers are provided in Table 5. All plant specimens were identified by Miss Wannaree Charoensup, a botanist at the Faculty of Pharmacy, Chiang Mai University, Thailand. The voucher specimens were subsequently deposited in the official herbarium of the Faculty of Pharmacy, Chiang Mai University. For molecular analysis, leaf samples were placed in sterile polyethylene bags containing silica gel to preserve DNA for further extraction. Additionally, commercial crude drugs derived from P. indica root, along with Thai traditional formulations containing P. indica root—namely “Ya Benchakun,” “Ya Fai Ha Gong,” and “Ya Fai Pralaikan”—were both prepared in-house and obtained from herbal dispensaries. The in-house polyherbal formulations were prepared following the guidelines of the National List of Herbal Medicines, Thailand. All collected samples were subsequently subjected to an authentication test (Table 5).

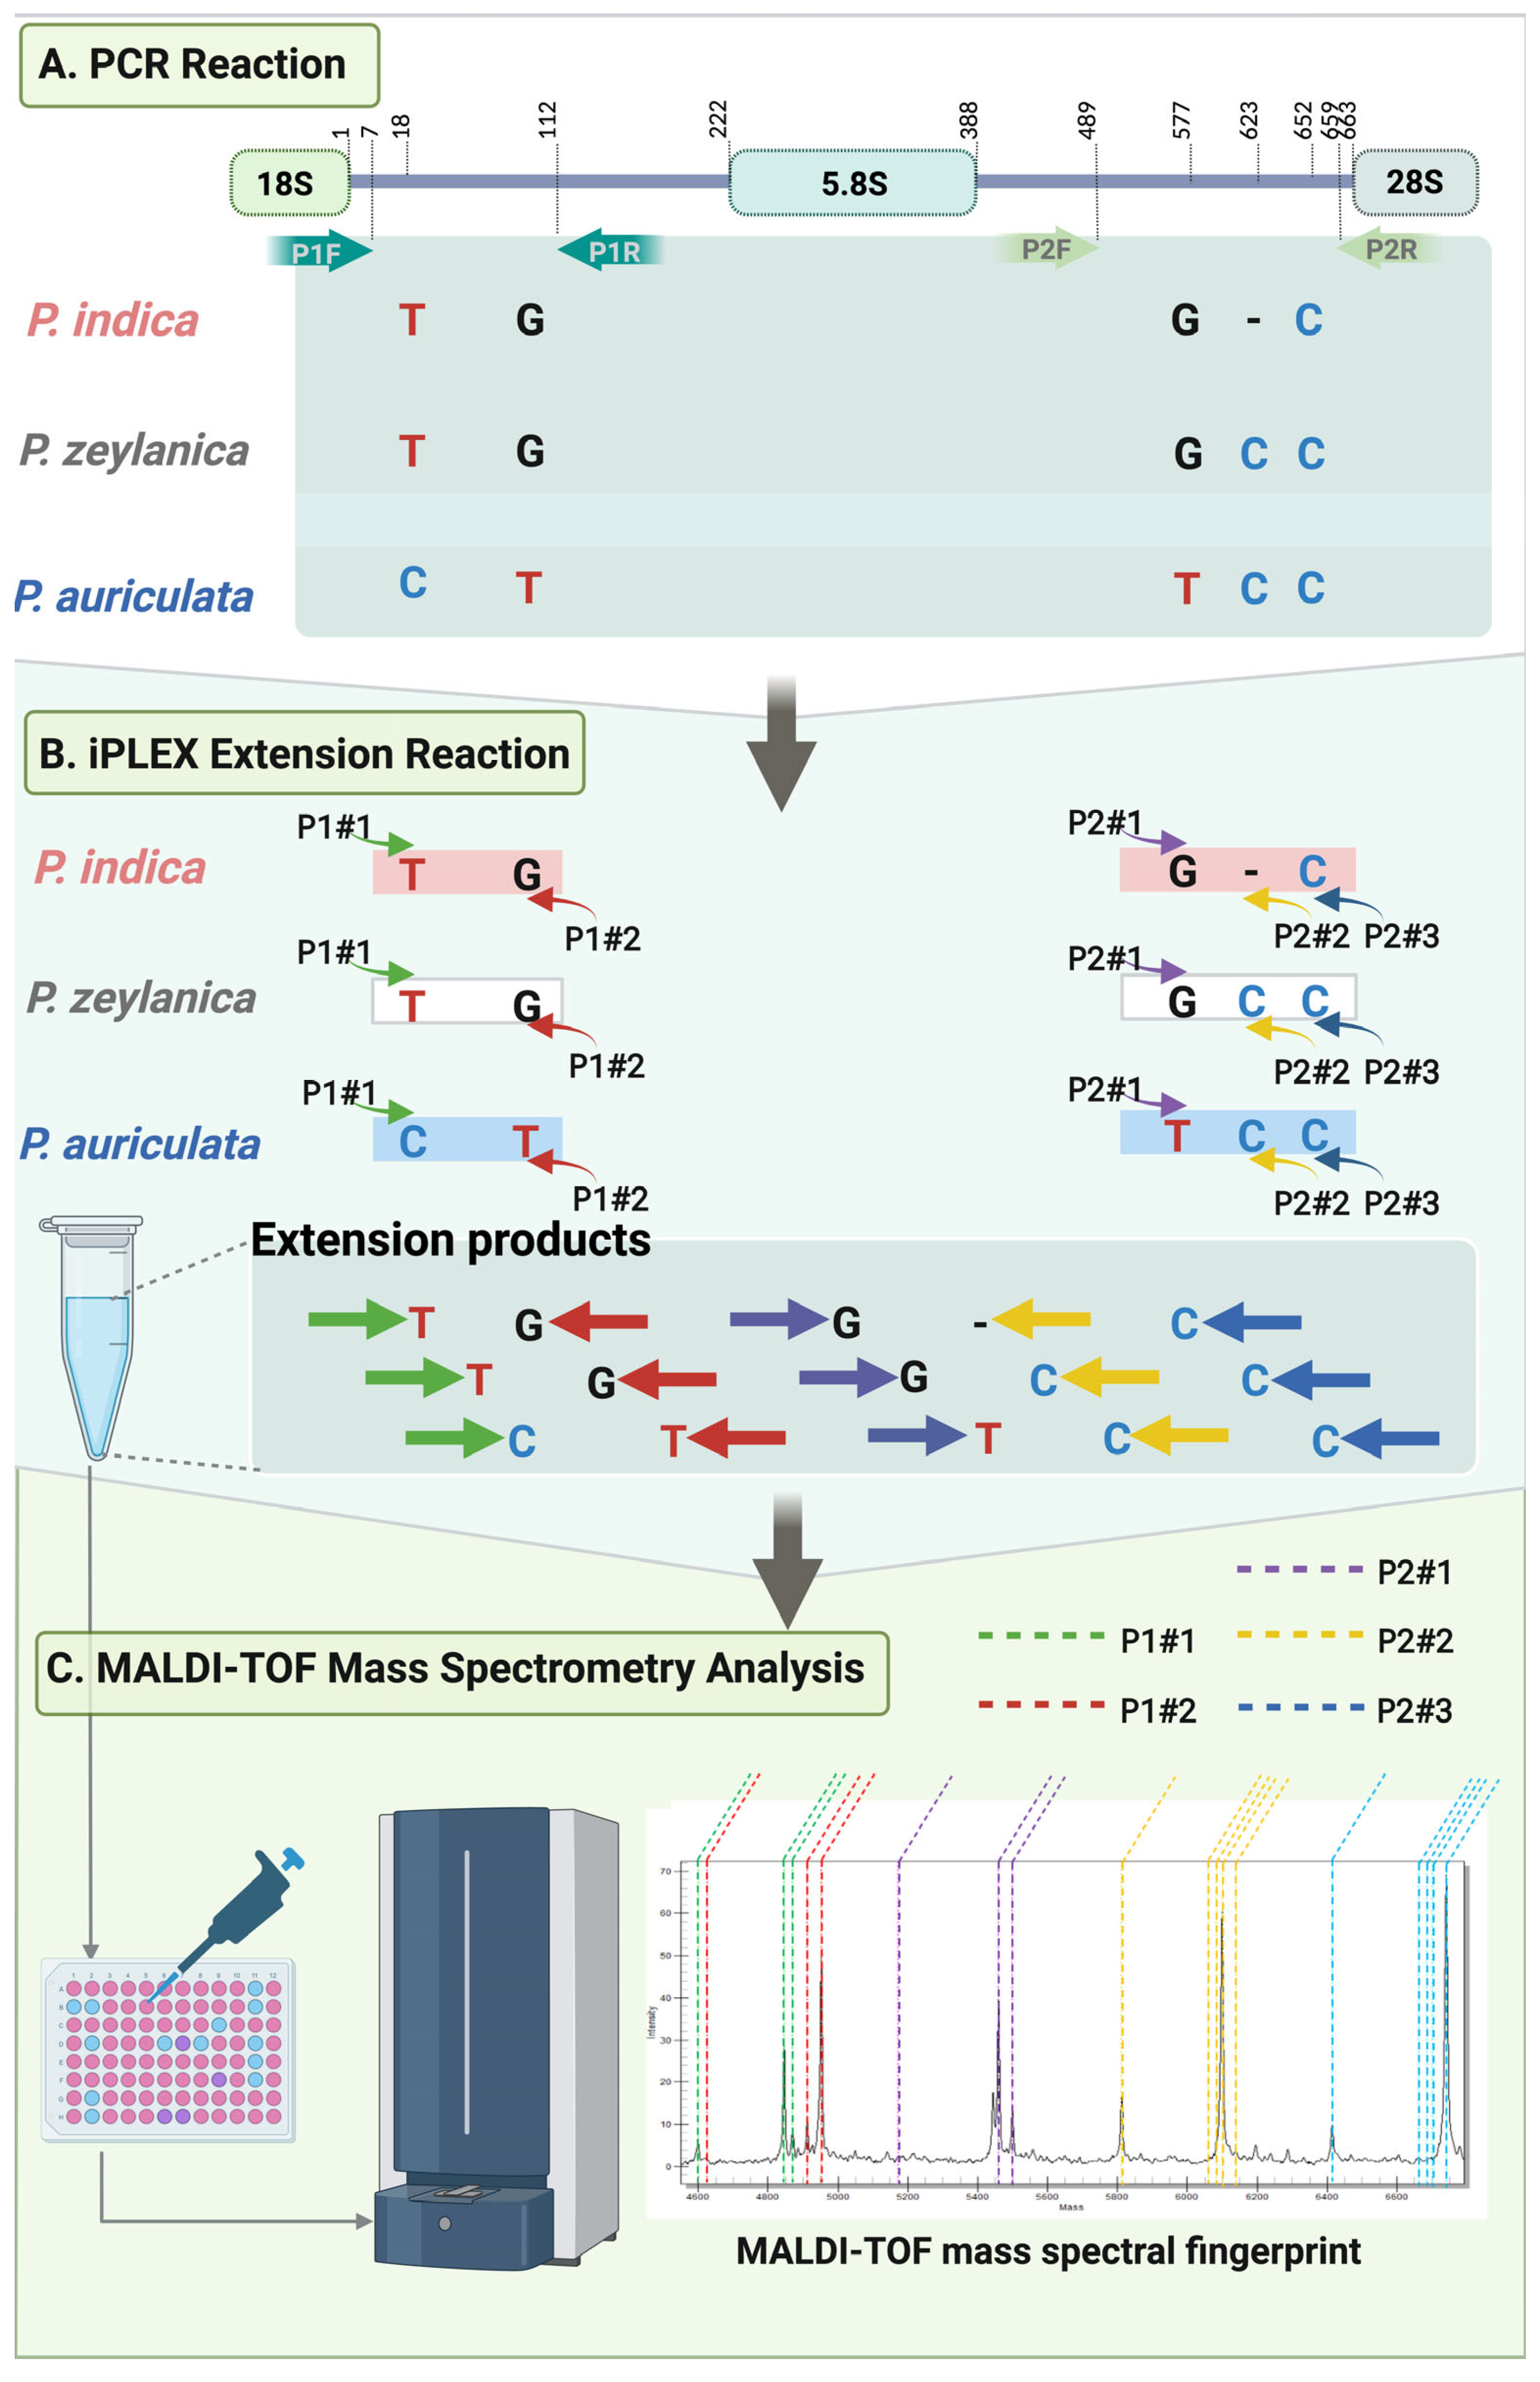
4.2. Primer Sets and Design

Nucleotide sequences of P. indica, P. zeylanica, and P. auriculata from our previous study were used as reference templates for sequence analysis. In this study, five SNP sites (positions 18, 112, 577, 623, and 652) were selected as targeted markers to differentiate among the three Plumbago species (Figure 4A). Among these, the SNP site at position 652 was designated as an internal control for the assay. For P. indica, G112, G577, and indel623 were identified as potential species-specific markers. Notably, P. indica exhibited two species-specific SNPs, with nucleotide G at position 112 and an insertion/deletion (indel) at position 623. For P. zeylanica, T18, T112, G577, and C623 were selected as differentiating markers. For P. auriculata, C18, T112, T577, and C623 were identified as the distinguishing SNPs, with C18 and T577 serving as its species-specific markers.
Three sets of primers were designed and applied for P. indica identification using the iPLEX assay by the MassARRAY system. The first primer set was the barcode set. This set contained two primers: ITS5A and ITS4 (Table 6). This primer pair functioned as the amplification primer to specifically amplify the ITS region. The second set of primer is called the specific primer set. The set contained four primers (P1F, P1R, P2F, and P2R) (Table 6), which were designed by the Assay Design Suite (ADS), an online tool offered by Agena Bioscience (https://www.agenabio.com/services/assays-by-agena/) (accessed on 11 March 2024). The aim of this primer design was to cover each specific SNP site within the internal transcribed spacer 1 or ITS1 (primers: P1F and P1R) and the ITS2 (primers: P2F and P2R) regions. The primer pair between P1F and P1R provided the PCR product encompassing the ITS1 region (SNP 18 and 112). Similarly, the primers P2F and P2R targeted the ITS2 region and covered SNP sites: 577, 577, and 623 (Figure 4A). The iPLEX extension primer set was specifically designed for the iPLEX extension assay, the final step of the species identification (Table 6). The iPLEX extension primer set, P1#1, P1#2, P2#1, P2#2, and P2#3, which were designed specifically to each SNP positions 18, 112, 577, 623, and 652, respectively, were used in the single-base extension (SBE) reaction (Figure 4B, Table 6).

4.3. DNA Extraction, Amplification, and Nucleotide Sequencing

The leaves of authenticated P. indica, P. zeylanica, and P. auriculata, as well as commercial crude drug samples, were wiped with 75% ethanol to prevent fungal contamination. Genomic DNA was extracted from leaf specimens, crude drugs, and three different Thai traditional formulations using the DNeasy Plant Mini Kit (Qiagen, Hilden, Germany), following the manufacturer’s instructions with minor modifications [33]. The DNA concentration was measured using a NanoDrop 2000C Spectrophotometer (Thermo Scientific, Waltham, MA, USA), while the quality of the extracted DNA was assessed through agarose gel electrophoresis. Genomic DNA was electrophoresed in a 1.8% agarose gel and visualized under UV light using a Gel Doc EZ Imager (Bio-Rad, Hercules, CA, USA). Only high-quality genomic DNA with an A260/A230 ratio greater than 1.5 was selected for further analysis.
The ITS region of the authentic species was amplified from the extracted genomic DNA, and DNA sequencing was performed for DNA barcode analysis. Briefly, 100–120 ng of total DNA were used as the template in a 25 µL reaction mixture containing 1× PCR buffer for KOD FX Neo, 0.2 mM dNTPs, 0.2 µM of ITS5A and ITS4 primers, and 0.5 U of KOD FX Neo (TOYOBO Life Science, Osaka, Japan). PCR amplification was conducted using a T960 Thermal Cycler (Drawell, Chongqing, China) with the following cycling conditions: 94 °C for 2 min, followed by 35 cycles of 94 °C for 15 s, 53 °C for 30 s, and 68 °C for 45 s, with a final cycle at 68 °C for 5 min. The PCR product was electrophoresed on a 1.8% agarose gel, stained with GelRed (Biotium, Fremont, CA, USA), and visualized under UV light using a Gel Doc EZ Imager (Bio-Rad, Hercules, CA, USA). Successful PCR amplicons were purified using the MEGAquick-spin Plus Total Fragment DNA Purification Kit (Intron Biotechnology, Seongnam, Republic of Korea) and subsequently bidirectionally sequenced using an ABI PRISM 3730XL sequencer (Applied Biosystems, Waltham, MA, USA). BioEdit version 7.0.5 [50] was used to manually trim and edit the raw nucleotide sequences. The sequences were then aligned with published nucleotide sequences obtained from the NCBI database using the MUSCLE program in Molecular Evolutionary Genetics Analysis (MEGA 11) software, version 11.0.13 [51]. Single-nucleotide polymorphism (SNP) sites were identified and used for further analysis.

4.4. The iPLEX Assay on the MassARRAY System for the P. indica Identification

The workflow of the iPLEX assay on the MassARRAY system is shown in Figure 4A–C. Five SNP positions (18, 112, 577, 623, and 652) on the ITS region of P. indica were targeted for multiplex PCR and iPLEX single-base extension processes. The Mass spectra of the iPLEX extension products were predicted (Table 1). The PCR reaction was performed in 384-well plates using a 5 µL PCR cocktail, which contained 10 ng/µL total DNA as the template, 1× PCR buffer, 2 mM MgCl2, 500 µM dNTP mix, 100 nM each amplification forward and reverse primers, and 0.2 U of PCR enzyme (Agena Bioscience, San Diego, CA, USA). The PCR conditions were as follows: 95 °C for 2 min, followed by 45 cycles of 95 °C for 30 s, 56 °C for 30 s, and 72 °C for 60 s, with a final extension at 72 °C for 5 min. The reaction plates were sealed and stored at −20 °C for further analysis.
The iPLEX single-base extension reaction was conducted following the manufacturer’s instructions. Briefly, shrimp alkaline phosphatase (SAP) was added to the PCR product solution to eliminate excess dNTP residues. The SAP reaction mixture (2 µL) contained 0.17 µL of SAP Buffer (10×), 0.30 µL of SAP enzyme (1.7 U/µL), and 1.53 µL of H2O. The SAP solution mixture was combined with the PCR product. The reaction plates were sealed and incubated at 37 °C for 40 min, followed by 85 °C for 5 min. After incubation, the SAP-treated reaction mixtures were subjected to the primer extension reaction using the iPLEX Gold assay (Sequenom Inc., San Diego, CA, USA). The iPLEX extension reaction was performed in 2 µL, consisting of 0.62 µL of distilled water, 0.2 µL each of 10× iPLEX buffer plus and 10× iPLEX termination mix, 0.04 µL of iPLEX Pro enzyme, and 0.94 µL of the extension primer. The extension reaction was carried out under the following conditions: 95 °C for 30 s, followed by 40 cycles of 95 °C for 5 s, 52 °C for 5 s, and 80 °C for 5 s, with a final extension at 72 °C for 3 min. The extension products were dispensed onto the SpectroCHIP Array using an automated nanodispenser and subsequently analyzed by MALDI-TOF mass spectrometry on the MassARRAY platform (Figure 4C). The results were analyzed using SpectroTYPER version 4.0 software. Mass spectra of the samples were interpreted and compared with the predicted masses of the iPLEX extension products (Table 1).

4.5. Sensitivity of the iPLEX Extension Assay for the Differentiation of P. indica from Its Related Species

Sensitivity analysis was performed by preparing a series of 10-fold dilutions. Nine DNA concentrations were prepared: 10, 1, 0.1, 0.01, 0.001, 0.0001, 0.00001, 0.000001, and 0 ng/µL. The iPLEX extension reaction and mass spectra measurement using the MassARRAY system were carried out as described above. The limit of detection (LOD) was determined by analyzing the lowest DNA concentration at which allele-specific spectra could be accurately detected and interpreted as positive signals in the spectra.

4.6. Identification of P. indica in Plumbago-Mixed Samples

To evaluate the ability of the iPLEX extension reaction for detecting P. indica in Plumbago-mixed samples, genomic DNA from each Plumbago species was extracted, and two- and three-species mixed samples were prepared. The DNA mixtures were combined in a 1:1 (v/v) ratio. The samples, namely P. indica + P. zeylanica (PI + PZ), P. indica + P. auriculata (PI + PA), P. zeylanica + P. auriculata (PZ + PA), and P. indica + P. zeylanica + P. auriculata (PI + PZ + PA), were then analyzed using the iPLEX extension assay. The resulting mass spectra were interpreted using the MassARRAY system.

4.7. Authentication of the Commercial P. indica Crude Drugs and the Polyherbal Products

Ten commercial medicinal roots of P. indica or Jettamoon Pleung Daeng and three Thai traditional polyherbal products, namely Ya Benchakun, Ya Fai Ha Gong, and Ya Fai Pralaikan (Table 1), were tested using the iPLEX extension assay on the MassARRAY system to identify Plumbago species in the samples. Genomic DNA was extracted from the crude drugs and polyherbal formulations following the protocol outlined in the genomic DNA extraction section. The extracted DNA was then purified using the OneStep PCR Inhibitor Removal Kit (Zymo Research, Irvine, CA, USA) according to the manufacturer’s protocol. The iPLEX extension and mass spectra measurement steps were performed as described in the previous section.

5. Conclusions

In this study, we developed and validated a MassARRAY iPLEX assay for differentiating three Plumbago species—P. indica, P. zeylanica, and P. auriculata—by targeting nucleotide variations within the ITS DNA barcode region. Specifically, we focused on SNP sites located at positions 18, 112, 577, 623, and 652. The assay exhibited high sensitivity, enabling accurate identification of P. indica and distinguishing it from closely related species at DNA concentrations as low as 0.01 ng/µL. The assay was successfully applied to nine commercial P. indica root samples, identifying two as P. zeylanica. Furthermore, it demonstrated the ability to detect P. auriculata in mixtures with P. indica. However, the method showed limitations in distinguishing P. zeylanica from P. indica in mixed samples, likely due to the overlap in the mass spectra of these species at certain SNP positions. These findings confirm that the developed assay is a reliable and valuable tool for the authentication of P. indica raw materials.

Supplementary Materials

The following supporting information can be downloaded at: https://www.mdpi.com/article/10.3390/ijms26157168/s1.

Author Contributions

Conceptualization, K.T. and A.I.; methodology, A.I.; software, A.I.; validation, K.T. and A.I.; formal analysis, K.T. and A.I.; investigation, A.I.; resources, A.I. and A.P.; data curation, K.T. and A.I.; writing—original draft preparation, K.T. and A.I.; writing—review and editing, K.T., A.I. and A.P.; visualization, A.I.; supervision, A.I.; project administration, A.I.; funding acquisition, A.I. and A.P. All authors have read and agreed to the published version of the manuscript.

Funding

This research was supported by the Faculty of Pharmacy, Chiang Mai University, Thailand, through the Fiscal Year 2020 Research Fund. The APC was supported by the Office of Research Administration, Chiang Mai University.

Institutional Review Board Statement

Not applicable.

Informed Consent Statement

Not applicable.

Data Availability Statement

Data will be made available on request.

Acknowledgments

The authors would like to thank the Faculty of Pharmacy, Chiang Mai University, for their generous provision of the necessary facilities and authentic Plumbago samples. They also appreciate Wattana Tanming and the Queen Sirikit Botanic Garden for granting access to authentic Plumbago specimens. Special thanks are extended to Wannaree Chareonsup for her invaluable assistance with the morphological identification of the Plumbago plant materials.

Conflicts of Interest

The authors declare no conflicts of interest.

Abbreviations

The following abbreviations are used in this manuscript:
BLASTBasic Local Alignment Search Tool
DaDalton
ddNTPsDideoxynucleotides
DELDeletion
FDAFood and Drug Administration
GC-MSGas Chromatography–Mass Spectrometry
HPLCHigh-Performance Liquid Chromatography
HPTLCHigh-Performance Thin-Layer Chromatography
INDELInsertion/Deletion
ITSInternal Transcribed Spacer
LC-MS/MSLiquid Chromatography–Tandem Mass Spectrometry
LFALateral-Flow Immunochromatographic Assay
LODLimit of Detection
LOHLoss of Heterozygosity
MALDI-TOF MSMatrix-Assisted Laser Desorption/Ionization Time-of-Flight Mass Spectrometry
NGSNext-Generation Sequencing
PCRPolymerase Chain Reaction
SAPShrimp Alkaline Phosphatase
SBESingle-Base Extension
SNPSingle Nucleotide Polymorphism
UEPUnextended Primer
WHOWorld Health Organization

References

  1. Abdu, A.; Prakash, A.; Kondal, R.; Sharma, S.; Bhagat, M.; Pal, R.; Singh, H.; Singh, B.; Kaur, S. Comprehensive review on Plumbago indica: Traditional, pharmacological insights and conservation strategies. J. Appl. Pharm. Sci. 2024, 14, 1–16. [Google Scholar] [CrossRef]
  2. Thitiorul, S.; Ratanavalachai, T.; Tanuchit, S.; Itharat, A.; Sakpakdeejaroen, I. Genotoxicity and interference with cell cycle activities by an ethanolic extract from Thai Plumbago indica roots in human lymphocytes in vitro. Asian Pac. J. Cancer Prev. 2013, 14, 2487–2490. [Google Scholar] [CrossRef]
  3. Sharma, B.; Dhiman, C.; Hasan, G.M.; Shamsi, A.; Hassan, M.I. Pharmacological Features and Therapeutic Implications of Plumbagin in Cancer and Metabolic Disorders: A Narrative Review. Nutrients 2024, 16, 3033. [Google Scholar] [CrossRef] [PubMed]
  4. Makchuchit, S.; Rattarom, R.; Itharat, A. The anti-allergic and anti-inflammatory effects of Benjakul extract (a Thai traditional medicine), its constituent plants and its some pure constituents using in vitro experiments. Biomed. Pharmacother. 2017, 89, 1018–1026. [Google Scholar] [CrossRef] [PubMed]
  5. Duenngai, K.; Promraksa, B.; Janthamala, S.; Thanee, M.; Sirithawat, P.; Wisungre, S.; Deechan, S.; Meechai, N.; Paratang, P.; Techasen, A. Antioxidant and Anticancer Potentials and Metabolic Profiling of Benjakul, A Thai Herbal Preparation. Trop. J. Nat. Prod. Res. 2024, 8, 6877–6883. [Google Scholar] [CrossRef]
  6. Threrapanithan, C.; Jaiaree, N.; Itharat, A.; Makchuchit, S.; Thongdeeying, P.; Panthong, S. Anti-inflammatory and antioxidant activities of the Thai traditional remedy called “Leard-ngam” and its plant ingredients. Thammasat Med. J. 2015, 15, 376–383. [Google Scholar]
  7. Shukla, B.; Saxena, S.; Usmani, S.; Kushwaha, P. Phytochemistry and pharmacological studies of Plumbago zeylanica L.: A medicinal plant review. Clin. Phytosci. 2021, 7, 34. [Google Scholar] [CrossRef]
  8. Melk, M.M.; Melek, F.R.; El-Sayed, A.F. Enzymes inhibitory capabilities of phenolics from Plumbago indica L. and Plumbago auriculata Lam.: In-vitro studies and molecular docking. Process Biochem. 2024, 136, 1–13. [Google Scholar] [CrossRef]
  9. Sherif, A.E.; Amen, Y.; Shimizu, K. Validation of the potential anti-inflammatory activity of Plumbago auriculata Lam. S. Afr. J. Bot. 2022, 147, 467–471. [Google Scholar] [CrossRef]
  10. Thongkhao, K.; Pongkittiphan, V.; Phadungcharoen, T.; Tungphatthong, C.; Urumarudappa, S.K.J.; Pengsuparp, T.; Sutanthavibul, N.; Wiwatcharakornkul, W.; Kengtong, S.; Sukrong, S. Differentiation of Cyanthillium cinereum, a smoking cessation herb, from its adulterant Emilia sonchifolia using macroscopic and microscopic examination, HPTLC profiles and DNA barcodes. Sci. Rep. 2020, 10, 14753. [Google Scholar] [CrossRef]
  11. Khwanchum, L.; Intharuksa, A.; Yanaso, S.; Thongkhao, K. Differentiation of Centella asiatica (L.) Urb. from Hydrocotyle umbellata L. using the trnH-psbA region, species-specific bands and anisocytic stomata as markers for quality control of raw materials and their products. J. Appl. Res. Med. Aromat. Plants 2023, 37, 100504. [Google Scholar] [CrossRef]
  12. Urumarudappa, S.K.J.; Rosario, S.; G, R.; Sukrong, S. A comprehensive review on Saraca asoca (Fabaceae)—Historical perspective, traditional uses, biological activities, and conservation. J. Ethnopharmacol. 2023, 317, 116861. [Google Scholar] [CrossRef] [PubMed]
  13. Khamnuan, S.; Phrutivorapongkul, A.; Pitchakarn, P.; Buacheen, P.; Karinchai, J.; Chittasupho, C.; Na Takuathung, M.; Theansungnoen, T.; Thongkhao, K.; Intharuksa, A. The Identification and Cytotoxic Evaluation of Nutmeg (Myristica fragrans Houtt.) and Its Substituents. Foods 2023, 12, 4211. [Google Scholar] [CrossRef] [PubMed]
  14. Lenora, R.D.K.; Dharmadasa, R.M.; Abeysinghe, D.C.; Arawwawala, L.D.A.M.; Dharmadasa, R.M.; Abeysinghe, D.C.; Arawwawala, L.D.A.M. Investigation of Plumbagin Content in Plumbago indica Linn. Grown under Different Growing Systems. Pharmacologia 2012, 3, 57–60. [Google Scholar] [CrossRef]
  15. Srivastava, S.; Misra, A. Quality Control of Herbal Drugs: Advancements and Challenges. In New Age Herbals: Resource, Quality and Pharmacognosy; Singh, B., Peter, K.V., Eds.; Springer: Singapore, 2018; pp. 189–209. [Google Scholar]
  16. World Health Organization. Quality Control Methods for Herbal Materials: Updated edition of Quality Control Methods for Medicinal Plant Materials; World Health Organization: Geneva, Switzerland, 1998. [Google Scholar]
  17. Serrano, R.; Da Silva, G.; Silva, O. Application of light and scanning electron microscopy in the identification of herbal medicines. Microsc. Sci. Technol. Appl. Educ. 2010, 3, 182–190. [Google Scholar]
  18. Song, J.H.; Yang, S.; Choi, G. Taxonomic Implications of Leaf Micromorphology Using Microscopic Analysis: A Tool for Identification and Authentication of Korean Piperales. Plants 2020, 9, 566. [Google Scholar] [CrossRef]
  19. Tarassoli, Z.; Faraji, H.; Tajabadi, F.; Shabani, M.; Shahbazi, H. Hollow Fiber-Based Liquid Phase Microextraction Combined with Chemometrics Approach: Determination of Rosmarinic Acid in Lavandula angustifolia Products. J. Anal. Chem. 2024, 79, 1717–1723. [Google Scholar] [CrossRef]
  20. Lai, K.-M.; Cheng, Y.-Y.; Tsai, T.-H. Integrated LC-MS/MS Analytical Systems and Physical Inspection for the Analysis of a Botanical Herbal Preparation. Molecules 2015, 20, 10641–10656. [Google Scholar] [CrossRef]
  21. Dubnicka, M.; Cromwell, B.; Levine, M. Investigation of the Adulteration of Essential Oils by GC-MS. Curr. Anal. Chem. 2020, 16, 965–969. [Google Scholar] [CrossRef]
  22. Tarasoli, Z.; Faraji, H.; Tajabadi, F.; Shabani, M.; Shahbazi, H. Evaluation of adulteration in Lavandula angustifolia Mill. products using GC/MS combined with chemometric methods. J. Med. Plants 2021, 20, 34–46. [Google Scholar] [CrossRef]
  23. Cao, K.; Chen, J.; Huang, R.; Lu, R.; Zhou, X.; Bu, Y.; Li, L.; Yao, C. Metabolomics analysis reveals the differences between Abrus cantoniensis Hance and Abrus mollis Hance. BMC Plant Biol. 2023, 23, 375. [Google Scholar] [CrossRef]
  24. Ha, W.-Y.; Wong, K.-L.; Ma, W.-Y.; Lau, Y.-Y.; Chan, W.-H. Enhancing Testing Laboratory Engagement in Plant DNA Barcoding through a Routine Workflow—A Case Study on Chinese Materia Medica (CMM). Plants 2022, 11, 1317. [Google Scholar] [CrossRef] [PubMed]
  25. Chen, S.; Yin, X.; Han, J.; Sun, W.; Yao, H.; Song, J.; Li, X. DNA barcoding in herbal medicine: Retrospective and prospective. J. Pharm. Anal. 2023, 13, 431–441. [Google Scholar] [CrossRef] [PubMed]
  26. Thongkhao, K.; Tungphatthong, C.; Sukrong, S. A PCR-lateral flow immunochromatographic assay (PCR-LFA) for detecting Aristolochia species, the plants responsible for aristolochic acid nephropathy. Sci. Rep. 2022, 12, 12188. [Google Scholar] [CrossRef] [PubMed]
  27. Tungphatthong, C.; Phadungcharoen, T.; Sooksawate, T.; Sukrong, S. PCR combined with lateral flow immunochromatographic assay to differentiate the narcotic Mitragyna speciosa from related species and detect it in forensic evidence. Forensic Sci. Int. 2022, 331, 111149. [Google Scholar] [CrossRef]
  28. Dechbumroong, P.; Aumnouypol, S.; Denduangboripant, J.; Sukrong, S. DNA barcoding of Aristolochia plants and development of species-specific multiplex PCR to aid HPTLC in ascertainment of Aristolochia herbal materials. PLoS ONE 2018, 13, e0202625. [Google Scholar] [CrossRef]
  29. Buggs, R.J.; Chamala, S.; Wu, W.; Gao, L.; May, G.D.; Schnable, P.S.; Soltis, D.E.; Soltis, P.S.; Barbazuk, W.B. Characterization of duplicate gene evolution in the recent natural allopolyploid Tragopogon miscellus by next-generation sequencing and Sequenom iPLEX MassARRAY genotyping. Mol. Ecol. 2010, 19 (Suppl. 1), 132–146. [Google Scholar] [CrossRef]
  30. Galeano, C.H.; Cortés, A.J.; Fernández, A.C.; Soler, Á.; Franco-Herrera, N.; Makunde, G.; Vanderleyden, J.; Blair, M.W. Gene-Based Single Nucleotide Polymorphism Markers for Genetic and Association Mapping in Common Bean. BMC Genet. 2012, 13, 48. [Google Scholar] [CrossRef]
  31. De Silva, A.L.; Kamper, W.; Ogbourne, S.M.; Nichols, J.; Royle, J.W.L.; Peters, T.; Hawkes, D.; Hosseini Bai, S.; Wallace, H.M.; Trueman, S.J. MassARRAY and SABER Analyses of SNPs in Embryo DNA Reveal the Abscission of Self-Fertilised Progeny during Fruit Development of Macadamia (Macadamia integrifolia Maiden & Betche). Int. J. Mol. Sci. 2024, 25, 6419. [Google Scholar] [CrossRef]
  32. Liang, R.; Li, J.; Zhao, Y.; Qi, H.; Bao, S.; Wang, F.; Duan, H.; Huang, H. A comparative study of MassARRAY and GeneXpert assay in detecting rifampicin resistance in tuberculosis patients’ clinical specimens. Front. Microbiol. 2024, 15, 1287806. [Google Scholar] [CrossRef]
  33. Intharuksa, A.; Phrutivorapongkul, A.; Thongkhao, K. Integrating DNA barcoding, microscopic, and chemical analyses for precise identification of Plumbago indica L., A prominent medicinal plant. Microchem. J. 2024, 199, 110038. [Google Scholar] [CrossRef]
  34. Jurinke, C.; Boom, D.; Cantor, C.R.; Köster, H. The Use of MassARRAY Technology for High Throughput Genotyping. Adv. Biochem. Eng. Biotechnol. Adv. 2002, 77, 57–74. [Google Scholar] [CrossRef]
  35. Ichim, M.C. The DNA-Based Authentication of Commercial Herbal Products Reveals Their Globally Widespread Adulteration. Front. Pharmacol. 2019, 10, 1227. [Google Scholar] [CrossRef] [PubMed]
  36. Unnikrishnan, K.P.; Raja, S.S.; Balachandran, I. A Reverse Phase HPLC-UV and HPTLC Methods for Determination of Plumbagin in Plumbago indica and Plumbago zeylanica. Indian J. Pharm. Sci. 2008, 70, 844–847. [Google Scholar] [CrossRef] [PubMed]
  37. Anthoons, B.; Lagiotis, G.; Drouzas, A.D.; de Boer, H.; Madesis, P. Barcoding High Resolution Melting (Bar-HRM) enables the discrimination between toxic plants and edible vegetables prior to consumption and after digestion. J. Food Sci. 2022, 87, 4221–4232. [Google Scholar] [CrossRef]
  38. Hao, L.; Shi, X.; Wen, S.; Yang, C.; Chen, Y.; Yue, S.; Chen, J.; Luo, K.; Liu, B.; Sun, Y.; et al. Single nucleotide polymorphism-based visual identification of Rhodiola crenulata using the loop-mediated isothermal amplification technique. Front. Plant Sci. 2024, 15, 1492083. [Google Scholar] [CrossRef]
  39. Svidnicki, M.C.; Silva-Costa, S.M.; Ramos, P.Z.; dos Santos, N.Z.; Martins, F.T.; Castilho, A.M.; Sartorato, E.L. Screening of genetic alterations related to non-syndromic hearing loss using MassARRAY iPLEX(R) technology. BMC Med. Genet. 2015, 16, 85. [Google Scholar] [CrossRef]
  40. Zhang, D.X.; Hewitt, G.M. Nuclear DNA analyses in genetic studies of populations: Practice, problems and prospects. Mol. Ecol. 2003, 12, 563–584. [Google Scholar] [CrossRef]
  41. Dutta, A.; Schacherer, J. The dynamics of loss of heterozygosity events in genomes. EMBO Rep. 2025, 26, 602–612. [Google Scholar] [CrossRef]
  42. Intharuksa, A.; Sasaki, Y.; Ando, H.; Charoensup, W.; Suksathan, R.; Kertsawang, K.; Sirisa-Ard, P.; Mikage, M. The combination of ITS2 and psb A-trn H region is powerful DNA barcode markers for authentication of medicinal Terminalia plants from Thailand. J. Nat. Med. 2020, 74, 282–293. [Google Scholar] [CrossRef]
  43. Wang, M.; Lin, H.; Lin, H.; Du, P.; Zhang, S. From species to varieties: How modern sequencing technologies are shaping Medicinal Plant Identification. Genes 2024, 16, 16. [Google Scholar] [CrossRef]
  44. Intharuksa, A.; Denduangboripant, J.; Chansakaow, S.; Thongkhao, K.; Sukrong, S. HPLC and DNA barcoding profiles for identification of the selected twelve Mucuna species and its application for detecting prohibited aphrodisiac Mucuna products. Heliyon 2023, 9, e14130. [Google Scholar] [CrossRef]
  45. Yanaso, S.; Phrutivorapongkul, A.; Hongwiset, D.; Piyamongkol, S.; Intharuksa, A. Verification of Thai ethnobotanical medicine “Kamlang Suea Khrong” driven by multiplex PCR and powerful TLC techniques. PLoS ONE 2021, 16, e0257243. [Google Scholar] [CrossRef]
  46. Han, K.; Wang, M.; Zhang, L.; Wang, C. Application of molecular methods in the identification of ingredients in Chinese herbal medicines. Molecules 2018, 23, 2728. [Google Scholar] [CrossRef]
  47. Pinya, T.; Intharuksa, A.; Yanaso, S.; Kamnuan, S.; Phrutivorapongkul, A. Conventional and molecular pharmacognostic characters integrated with chemical profiles of five Piper plants in the Thai herbal pharmacopoeia and their admixture/adulteration/substitution situations in Thailand. J. Nat. Med. 2022, 76, 605–620. [Google Scholar] [CrossRef]
  48. Stanford, A.M.; Harden, R.; Parks, C.R. Phylogeny and biogeography of Juglans (Juglandaceae) based on matK and ITS sequence data. Am. J. Bot. 2000, 87, 872–882. [Google Scholar] [CrossRef] [PubMed]
  49. White, T.J.; Bruns, T.; Lee, S.; Taylor, J. Amplification and direct sequencing of fungal ribosomal RNA genes for phylogenetics. In PCR Protocols: A Guide to Methods and Applications; Academic Press: New York, NY, USA, 1990; Volume 18, pp. 315–322. [Google Scholar]
  50. Hall, T.A. BioEdit: A user-friendly biological sequence alignment editor and analysis program for Windows 95/98/NT. Nucleic Acids Symp. Ser. 1999, 41, 95–98. [Google Scholar]
  51. Edgar, R.C. MUSCLE: Multiple sequence alignment with high accuracy and high throughput. Nucleic Acids Res. 2004, 32, 1792–1797. [Google Scholar] [CrossRef] [PubMed]
Figure 1. Morphological Characteristics and Utilization of Plumbago indica L.: (A). habit, (B). flowers, (C). roots, (D). Jettamoon Pleung Daeng crude drugs derived from dried P. indica roots, (E). Ya Benchakun formulation.
Ijms 26 07168 g001
Figure 2. Mass spectra of authentic Plumbago species. The colors represent the mass profiles of the unextended primers (UEPs) and their corresponding base extension products: yellow for P1#1, green for P1#2, blue for P2#1, purple for P2#2, and red for P2#3.
Ijms 26 07168 g002
Figure 3. MALDI-TOF mass spectral fingerprint of Plumbago-mixed samples containing P. indica (PI), P. zeylanica (PZ), and P. auriculata (PA): (A) P. indica and P. auriculata, (B) P. auriculata and P. zeylanica, (C) P. indica and P. zeylanica, (D) P. indica, P. auriculata, and P. zeylanica. The colors represent the mass profiles of the unextended primers (UEPs) and their corresponding base extension products: yellow for P1#1, green for P1#2, blue for P2#1, purple for P2#2, and red for P2#3.
Ijms 26 07168 g003
Figure 4. Molecular Principles and Workflow of the MassARRAY Method and Primer Design Concept for Differentiating Three Plumbago Species. The colors represent the arrows and mass profiles of the unextended primers (UEPs) and their corresponding base extension products: green for P1#1, red for P1#2, purple for P2#1, yellow for P2#2, and blue for P2#3. Created using BioRender (Intharuksa, A., 2025). Available online: https://BioRender.com/nu2pugl (accessed on 5 June 2025).
Ijms 26 07168 g004
Table 1. Nucleotide sequences of the single-base extension primers and their base extension products used for the detection of SNPs in ITS region of Plumbago species.
PrimersTarget SNP PositionPrimer Sequences (UEP)Mass
(Da)
Expected Masses of the Single-Base Extension Product (Da)
CAGTDEL
P1#118AAGGATCATTGTCGAAACCTC6414.26661.46685.46701.46741.3n.d.
P1#2112TTGTTCAAGCCTGGG4599.0n.d.n.d.4846.24870.2n.d.
P2#1577CCGCGAAGCGTCGTGCC5172.4n.d.n.d.5459.65499.5n.d.
P2#2623CCTGGGGTCGCATGG4625.04912.2n.d.n.d.n.d.4952.1
P2#3652ATATGCTTAAACTCAGCGG5811.86059.06083.06741.36138.9n.d.
UEP = unextended primer; Da = Dalton; DEL = deletion; n.d. = not detected.
Table 2. The expected mass and the obtained mass profiles from the single-base extension product of Plumbago species.
SpeciesTarget SNP PositionExpected Mass of the Single-Base Extension ProductsMass Profile of the Single-Base Extension Products from Authentic Plants
CGTINDELCGTINDEL
P. indicaP1#1--6741.3---6741.3-
P1#2-4846.2---4846.2--
P2#1-5459.6---5459.6--
P2#2---4952.1---4952.1
P2#36059.0---6059.0---
P. zeylanicaP1#1--6741.3---6741.3-
P1#2-4846.2---4846.24870.2 *-
P2#1-5459.6---5459.6--
P2#24912.2---4912.2---
P2#36059.0---6059.0---
P. auriculataP1#16661.4---6661.4---
P1#2--4870.2---4870.2-
P2#1--5499.5---5499.5-
P2#24912.2---4912.2---
P2#36059.0---6059.0---
* Minor peak. INDEL = an insertion/deletion.
Table 3. Mass spectral results for the sensitivity analysis of the method used in this study.
SamplesDNA Concentration
(ng/μL)
Extension Primers
P1#1P1#2P2#1P2#2P2#3
P. indica10TGGDELC
1TGGDELC
0.1TGGDELC
0.01TGGDELC
0.001TGGC/DELC
0.0001TG/TGCC
0.00001TGGCC
0.000001TG/TGCC
0-----
P. zeylanica10TGGCC
1TGGCC
0.1TGGCC
0.01TGGCC
0.001TTGCC
0.0001TG/TGCC
0.00001TGGDELC
0.000001TG/TGCC
0-----
P. auriculata10CTTCC
1CTTCC
0.1CTTCC
0.01CTTCC
0.001C/TG/TG/TCC
0.0001TGGCC
0.00001TG/TGCC
0.000001TG/TGCC
0-----
DEL = deletion.
Table 4. Mass spectral results for species identification of authentic Plumbago species, commercial Jettamoon Pleung Daeng crude drugs, and polyherbal formulations.
SamplesExtension PrimersResult
P1#1P1#2P2#1P2#2P2#3
PITGGDELCP. indica
PZTTGCCP. zeylanica
PACTTCCP. auriculata
C-1TGGDELCP. indica
C-2TGGDELCP. indica
C-3TGGDELCP. indica
C-4TGGDELCP. indica
C-5TGGDELCP. indica
C-6TGGDELCP. indica
C-7TGGDELCP. indica
C-8TGGDELCP. indica
C-9TGGDELCP. indica
R-1TGGDELCP. indica
R-2TTGCCP. zeylanica
R-3TGGDELCP. indica
R-4TGGDELCP. indica
R-5TGGDELCP. indica
R-6TTGCCP. zeylanica
DEL = deletion.
Table 5. Plant materials, crude drugs, and Thai traditional formulation used in this study.
CodesSample DetailsLocality
Authentic Plumbago species
PIP. indica L.Maerim, Chiang Mai
PZP. zeylanica L.Mueang, Chiang Mai
PAP. auriculata Lam.Mueang, Chiang Mai
Crude drugs
C-1Jettamoon Pleung DaengMueang, Phatthalung
C-2Jettamoon Pleung DaengSamphanthawong, Bangkok
C-3Jettamoon Pleung DaengSamphanthawong, Bangkok
C-4Jettamoon Pleung DaengSamphanthawong, Bangkok
C-5Jettamoon Pleung DaengMueang, Nakhon Pathom
C-6Jettamoon Pleung DaengHat Yai, Songkhla
C-7Jettamoon Pleung DaengMueang, Nakhon Pathom
C-8Jettamoon Pleung DaengSamphanthawong, Bangkok
C-9Jettamoon Pleung DaengMueang, Chiang Mai
Thai traditional formulations
R-1Ya BenchakunFaculty of Pharmacy, Chiang Mai University
(In-house preparation)
R-2Ya BenchakunCompany 1
R-3Ya Fai PralaikanFaculty of Pharmacy, Chiang Mai University
(In-house preparation)
R-4Ya Fai PralaikanCompany 2
R-5Ya Fai Ha KongFaculty of Pharmacy, Chiang Mai University
(In-house preparation)
R-6Ya Fai Ha KongCompany 3
Table 6. Nucleotide sequences of the primers used in this study.
Primer SetPrimer NameTarget(Region/SNP)DirectionPrimer Sequences (5′→ 3′)Original Design
DNA barcodeITS5AITS regionForwardCCT TAT CAT TTA GAG GAA GGA G[48]
ITS4ITS regionReverseTCC TCC GCT TAT TGA TAT GC[49]
Specific primerP1FITS1 regionForwardACG TTG GAT GAA CCT GCG GAA GGA TCA TTGThis study
P1RITS1 regionReverseACG TTG GAT GGC GCC GTG TTT TTG TTC AAGThis study
P2FITS2 regionForwardACG TTG GAT GCG GTT GGC TTA AAT TCG GGThis study
P2RITS2 regionReverseACG TTG GAT GCT TAT TGA TAT GCT TAA ACTThis study
iPLEX extension primerExt_P1#1SNP18ForwardAAG GAT CAT TGT CGA AAC CTCThis study
Ext_P1#2SNP112ReverseTTG TTC AAG CCT GGG This study
Ext_P2#1SNP577ForwardCCG CGA AGC GTC GTG CCThis study
Ext_P2#2SNP623ReverseCCT GGG GTC GCA TGGThis study
Ext_P2#3SNP652ReverseATA TGC TTA AAC TCA GCG GThis study
Disclaimer/Publisher’s Note: The statements, opinions and data contained in all publications are solely those of the individual author(s) and contributor(s) and not of MDPI and/or the editor(s). MDPI and/or the editor(s) disclaim responsibility for any injury to people or property resulting from any ideas, methods, instructions or products referred to in the content.

