Article

Comparative Transcriptomic Analysis for Identification of Environmental-Responsive Genes in Seven Species of Threadfin Breams (Nemipterus)

1
College of Marine Living Resource Sciences and Management, Shanghai Ocean University, Shanghai 201306, China
2
South China Sea Fisheries Research Institute, Chinese Academy of Fisheries Sciences, Guangzhou 510300, China
3
Key Laboratory of Offshore Fisheries Development, Ministry of Agriculture and Rural Affairs, Guangzhou 510300, China
4
Key Laboratory of Marine Ranching, Ministry of Agriculture Rural Affairs, Guangzhou 510300, China
*
Authors to whom correspondence should be addressed.
Int. J. Mol. Sci. 2025, 26(15), 7118; https://doi.org/10.3390/ijms26157118
Submission received: 15 April 2025 / Revised: 12 June 2025 / Accepted: 18 July 2025 / Published: 23 July 2025

Abstract

Members of the genus Nemipterus are economically important fish species distributed in the tropical and subtropical Indo-West Pacific region. The majority of species in this genus inhabit waters with sandy–muddy substrates on the continental shelf, although different species are found at slightly varying water depths. In this study, we sequenced seven species within the genus Nemipterus after identifying the specimens using complementary morphological analysis and DNA barcoding. Each species yielded over 40,000,000 clean reads, totaling over 300,000,000 clean reads across the seven species. A total of 276,389 unigenes were obtained after de novo assembly and a total of 168,010 (60.79%) unigenes were annotated in the protein database. The comprehensive functional annotation based on the KOG, GO, and KEGG databases revealed that these unigenes are mainly associated with numerous physiological, metabolic, and molecular processes, and that the seven species exhibit similarity in these aspects. By constructing a phylogenetic tree and conducting divergence time analysis, we found that N. bathybius and N. virgatus diverged most recently, approximately during the Neogene Period (14.9 Mya). Compared with other species, N. bathybius and N. virgatus are distributed in deeper water layers. Therefore, we conducted selection pressure analysis using these two species as the foreground branches and identified several environmental-responsive genes. The results indicate that genes such as aqp1, arrdc3, ISP2, Hip, ndufa1, ndufa3, pcyt1a, ctsk, col6a2, casp2 exhibit faster evolutionary rates during long-term adaptation to deep-water environments. Specifically, these genes are considered to be associated with adaptation to aquatic osmoregulation, temperature fluctuations, and skeletal development. This comprehensive analysis provides valuable insights into the evolutionary biology and environmental adaptability of threadfin breams, contributing to the conservation and sustainable management of these species.

1. Introduction

The family Nemipteridae holds significant importance within the order Perciformes. Currently, it is known worldwide that there are five genera within the family Nemipteridae, including Nemipterus (threadfin breams), Pentapodus (whiptail breams), Scolopsis (monocle bream), Parascolopsis (dwarf monocle bream) and Scaevius (coral breams) [1,2]. Among them, the genus Nemipterus is the largest genus, with approximately 26 species under it [3]. The morphological differences among closely related species of the genus Nemipterus are minimal, leading to many instances of synonyms and homonyms among the species [4,5,6]. Some of its species are important economic species in many countries including India [7], Japan, Indonesia, China [8] and others [9,10]. The genus are well known for their delicious taste and commercial importance. They are commonly called threadfin breams and many are targeted by fishermen [3,11,12].
The genus Nemipterus are a group of warm, small-to-moderate-sized benthic fishes primarily distributed in the tropical and subtropical Indo-West Pacific region (IWP), where they have diversified [13]. They primarily feed on crustaceans, cephalopods, or other small fish. Species of the genus Nemipterus occur on muddy and sandy bottoms of the continental shelf, with habitats typically at depths of 20–140 m [3,5]. However, N. bathybius has been observed at depths reaching up to 300 m [3], suggesting its capability to adapt to a broader range of depths. Due to the close phylogenetic relationships and similar ecological habits among species within the genus Nemipterus, as well as the overlap in their trophic niches [14,15], there may be potential interspecific competition. Environmental pressures often drive the evolution of species, including adjustments in key genes [16,17]. Most functions and gene expression are regulated by environmental factors such as temperature and osmotic pressure [18]. Therefore, these factors often determine the adaptability of fish in different environments. Previous studies have shown that physiological adaptations to environmental conditions drive niche differentiation during the adaptive evolution of teleost fish [19]. In addition to the impacts caused by environmental changes due to climate change, interspecific competition can also lead to changes in species distribution [20]. In-depth research on biological mechanisms has revealed that during the adaptive evolution of marine fish, their corresponding unique genes will undergo changes due to positive selection [21].
Currently, biological growth parameters of the Nemipterus [10,22,23,24,25] have been examined intensively. Furthermore, many previous studies have classified the species within the genus Nemipterus based on traditional morphological methods. However, due to the similar external morphology of the Nemipterus species and varying focuses of different studies, there are still many issues related to taxonomy and systematics development that remain to be resolved within this group [3,6]. With the advancement of biotechnology, the analysis of interspecific phylogeny within the genus Nemipterus has gradually shifted from morphological levels to molecular levels, with mitochondrial DNA markers being widely utilized. Specifically, this includes genes such as COI gene, Cyt b gene, and 16S rRNA gene, among others [14,26,27,28,29,30]. The genetic markers used in current research contain relatively limited genetic information. Therefore, there is a need for a technological approach that can obtain more comprehensive and in-depth genomic information, and thus, Next Generation Sequencing (NGS) technology has emerged.
Next generation sequencing (NGS) technology has the advantages of high throughput, high sensitivity, and high speed. The rapid development of NGS methods and technologies has made it possible to conduct large scale whole transcriptome sequencing projects [31,32]. RNA sequencing (RNA-seq) can evaluate absolute transcript levels of sequenced and its advantages are mainly reflected in: to begin with, RNA-Seq is highly sensitive; meanwhile, RNA-seq can accurately determine every single nucleotide of each transcript; then, RNA-Seq can conduct transcriptomic detection for any species without the design of a probe for known sequences [33,34]. RNA-seq technologies have been employed for studying both model and nonmodel organisms [35,36]. The transcriptome represents almost all effectively expressed genes in specific cells or organs. When genomic sequences are unavailable, transcriptome sequencing can provide a comprehensive understanding of the regulatory mechanisms involved in specific biological processes, based on the structures and functions of differentially expressed genes [37,38,39]. In addition, transcriptomic analysis enables simultaneous analyses of multiple processes, including protein homeostasis, metabolism and other regulatory cellular processes [40]. Current studies on the genus Nemipterus have primarily focused on mitochondrial genome analyses [41,42,43,44], with no transcriptomic investigations conducted to date.
This study conducted RNA-seq analysis on seven species within the genus Nemipterus, yielding a large amount of transcriptome data. A phylogenetic tree was constructed using COI sequences to explore the phylogenetic relationships among the seven species. Subsequently, comparative transcriptome analysis was used to identify a series of positively selected genes, ultimately identifying environmental-responsive genes. The results will provide data support for investigating the evolutionary relationships within the genus Nemipterus and will provide a certain research basis for discovering species evolution driven by environmental factors.

2. Results

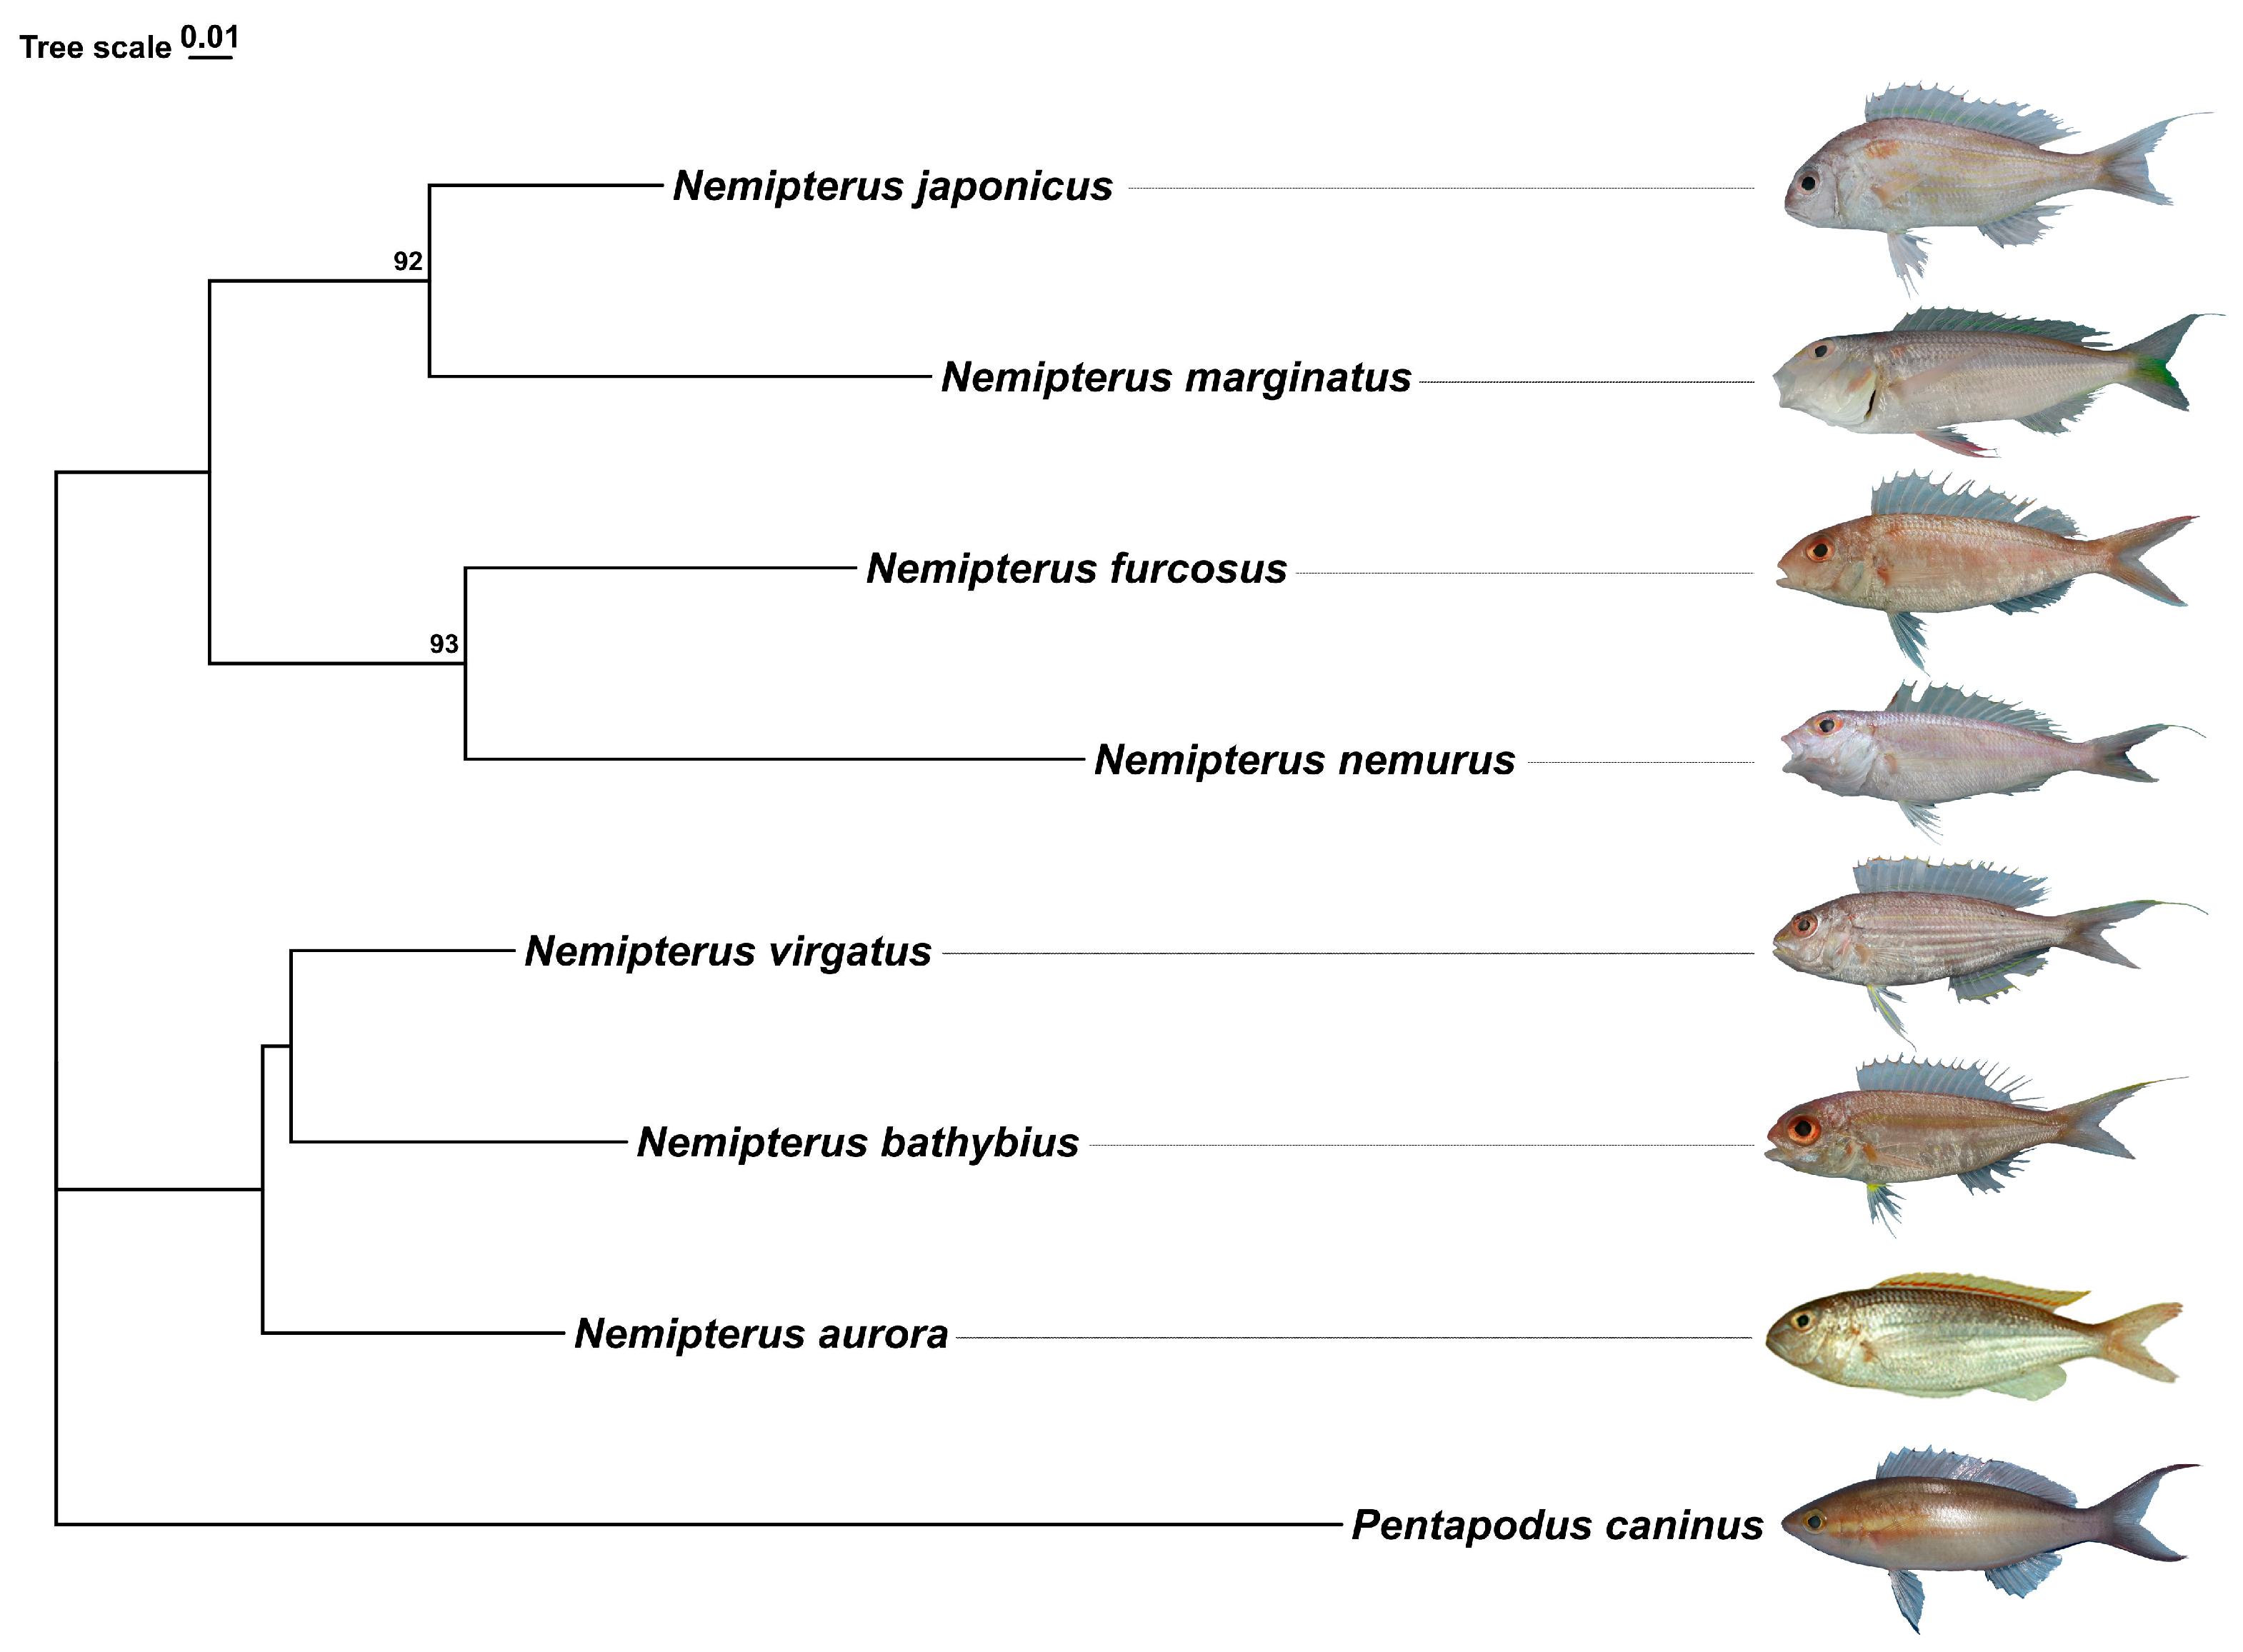
2.1. Species Identification and Phylogenetic Inferences

Morphological identification was used for seven species confirmation (Nemipterus bathybius Snyder, 1911, N. furcosus Valenciennes, 1830, N. nemurus Bleeker, 1857, N. virgatus Houttuyn, 1782, N. aurora Russell, 1993, N. japonicus Bloch, 1791, N. marginatus, Valenciennes, 1830). We amplified a 632 bp COI sequence from these seven species and the specific COI sequence is provided in the Supplementary Materials. Subsequently, we used Pentapodus caninus as an out-group and constructed a phylogenetic tree (Figure 1). In ML tree, seven species of Nemipterus are grouped into two clades. One of these clades includes N. bathybius, N. virgatus and N. aurora together. The remaining four species are gathered together. Among them, N. marginatus and N. japonicus appeared in a single clade; N. nemurus and N. furcosus also appeared in a single clade, with each clade having high bootstrap support (≥90%).

2.2. Transcriptome Sequencing and De Novo Assembly

Seven cDNA libraries were constructed and sequenced using Illumina novaseq 6000 by Gene Denovo Biotechnology Co. (Guangzhou, China). The sequencing information of transcriptomics is shown in Table 1—the seven species yielded a number of raw reads, ranging from 41,533,576 in N. marginatus to 55,724,924 in N. furcosus. In total, 345,064,922 reads were generated. After removing adapters, primers and low-quality reads, we obtained a total of 343,242,800 clean reads (99%) and the sequencing quality was high with Q20 ratio larger than 97% for all samples. These clean reads were subsequently assembled into transcripts and generated unigenes using the Trinity software (version 2.8.4). Finally, there were 32,661 unigenes in N. bathybius, 37,904 in N. furcosus, 38,342 in N. nemurus, 41,024 in N. virgatus, 34,882 in N. aurora, 40,036 in N. japonicus and 51,540 in N. marginatus. The summary of assembly analysis was displayed in Table 2.
The raw reads of the present study were uploaded to the SRA databases of NCBI under BioProject PRJNA1164947, with accession numbers SUB14748789.

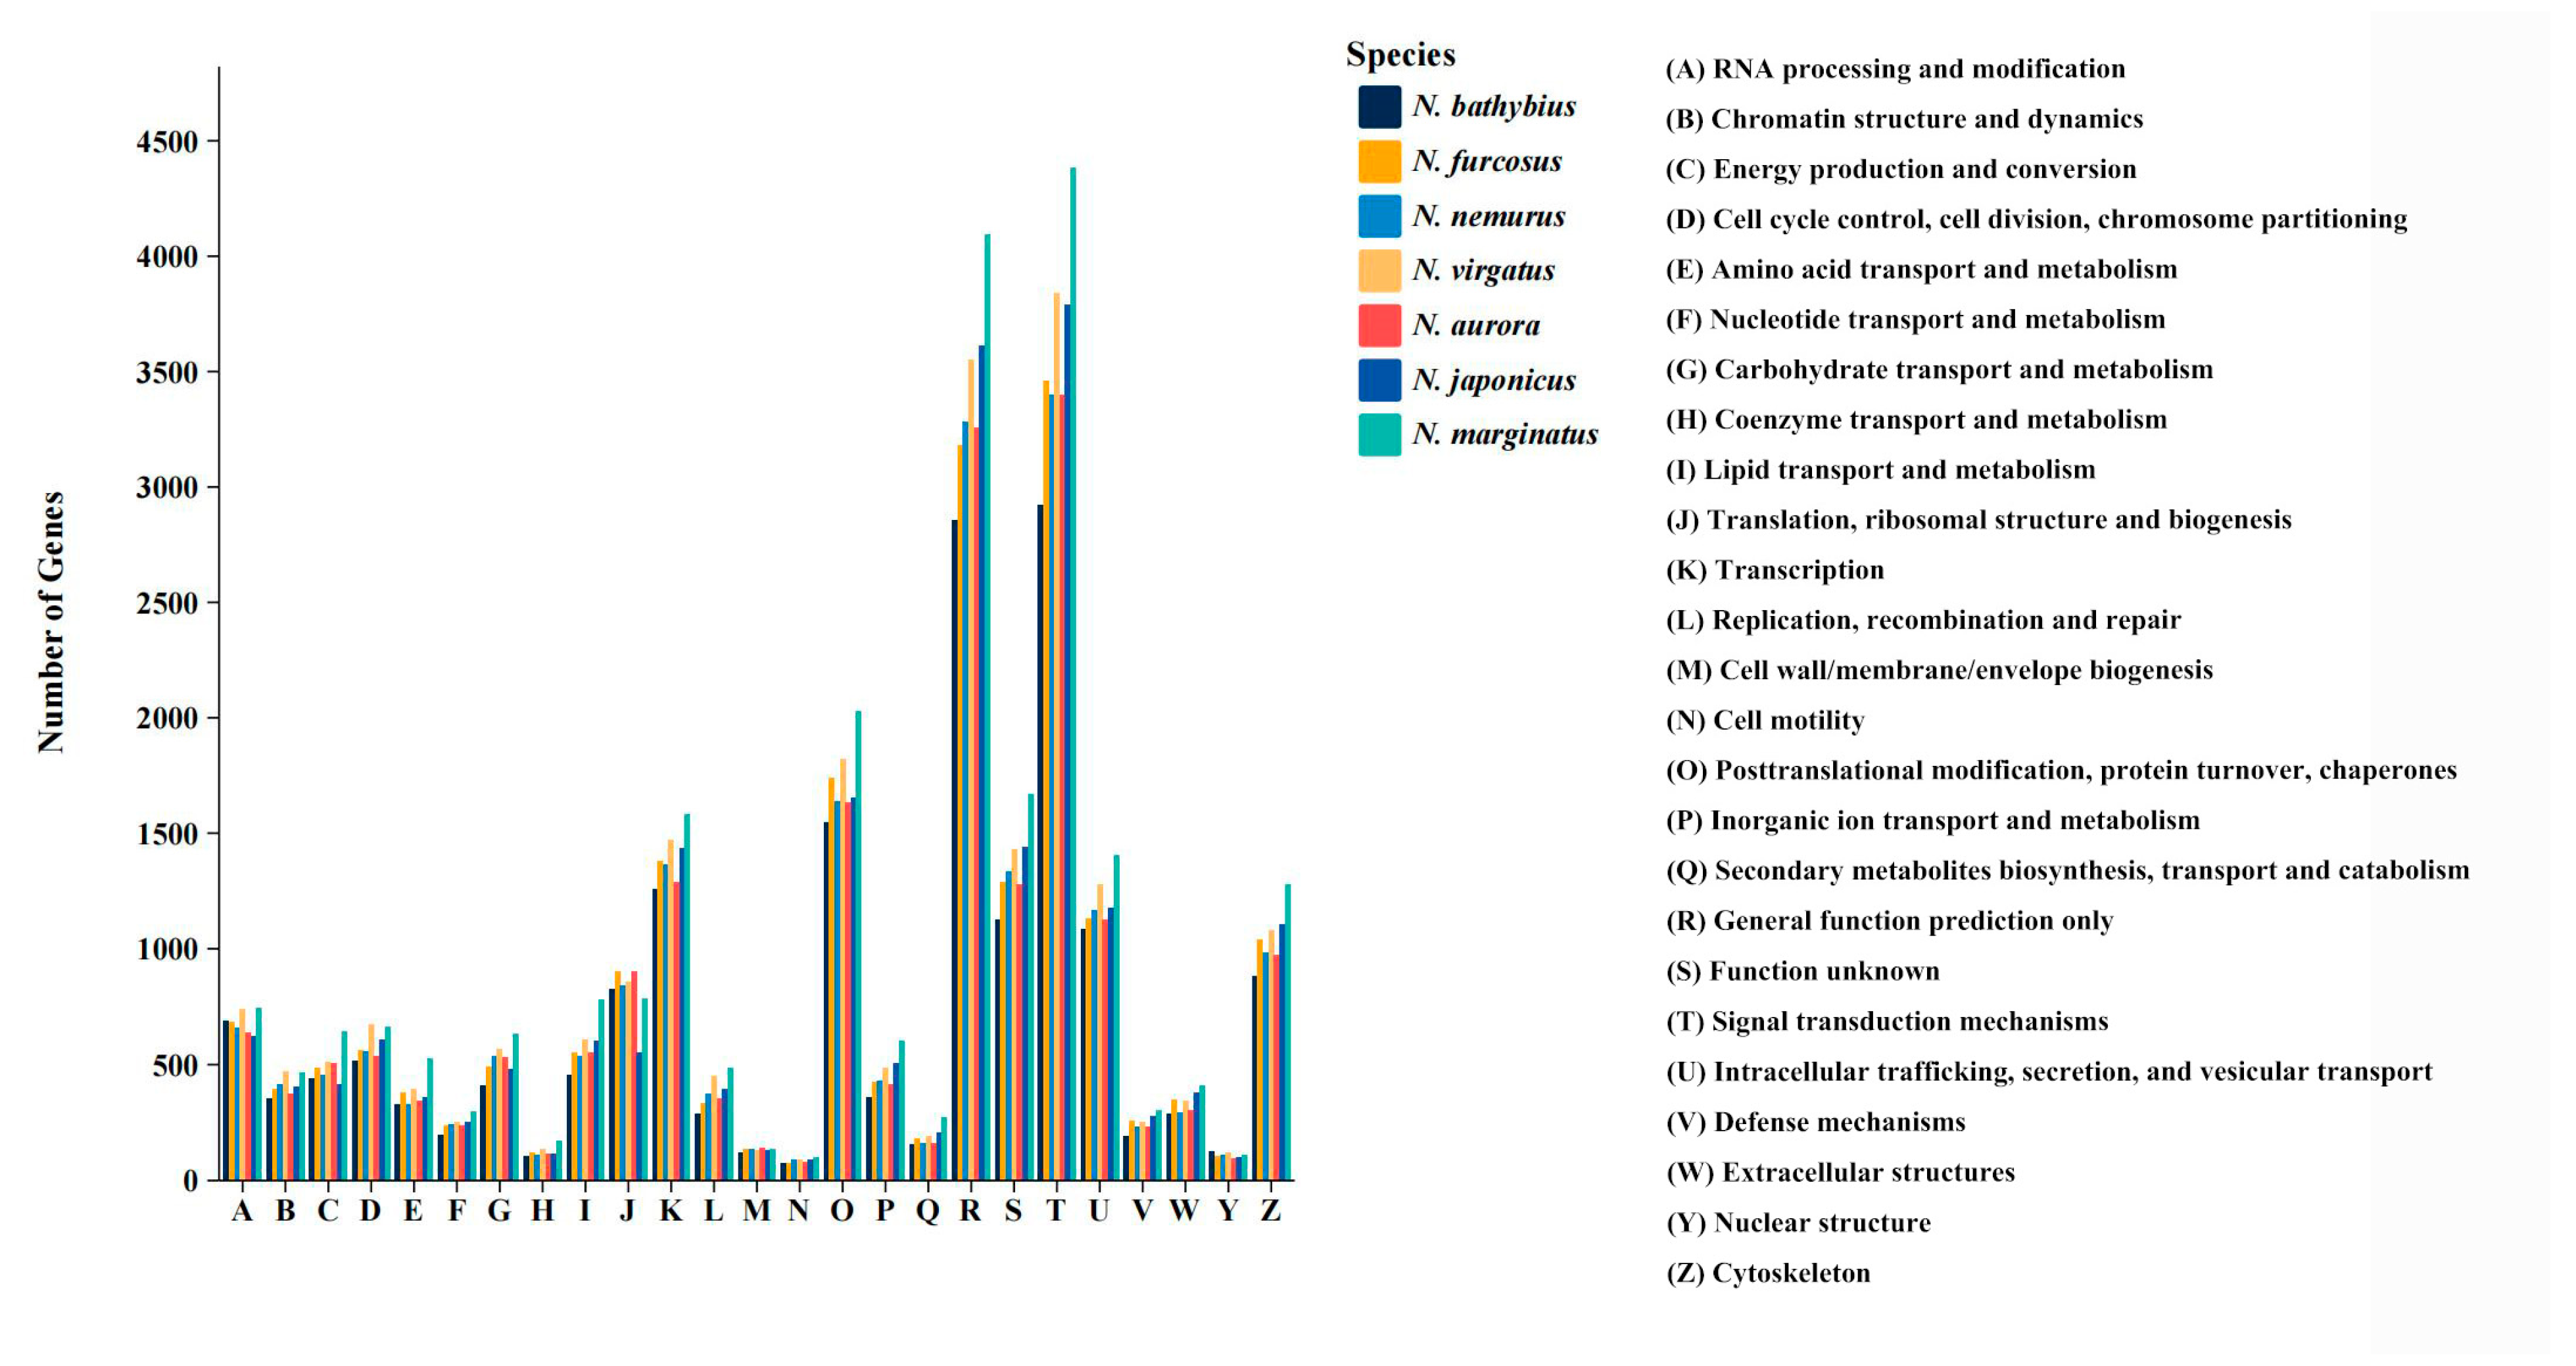
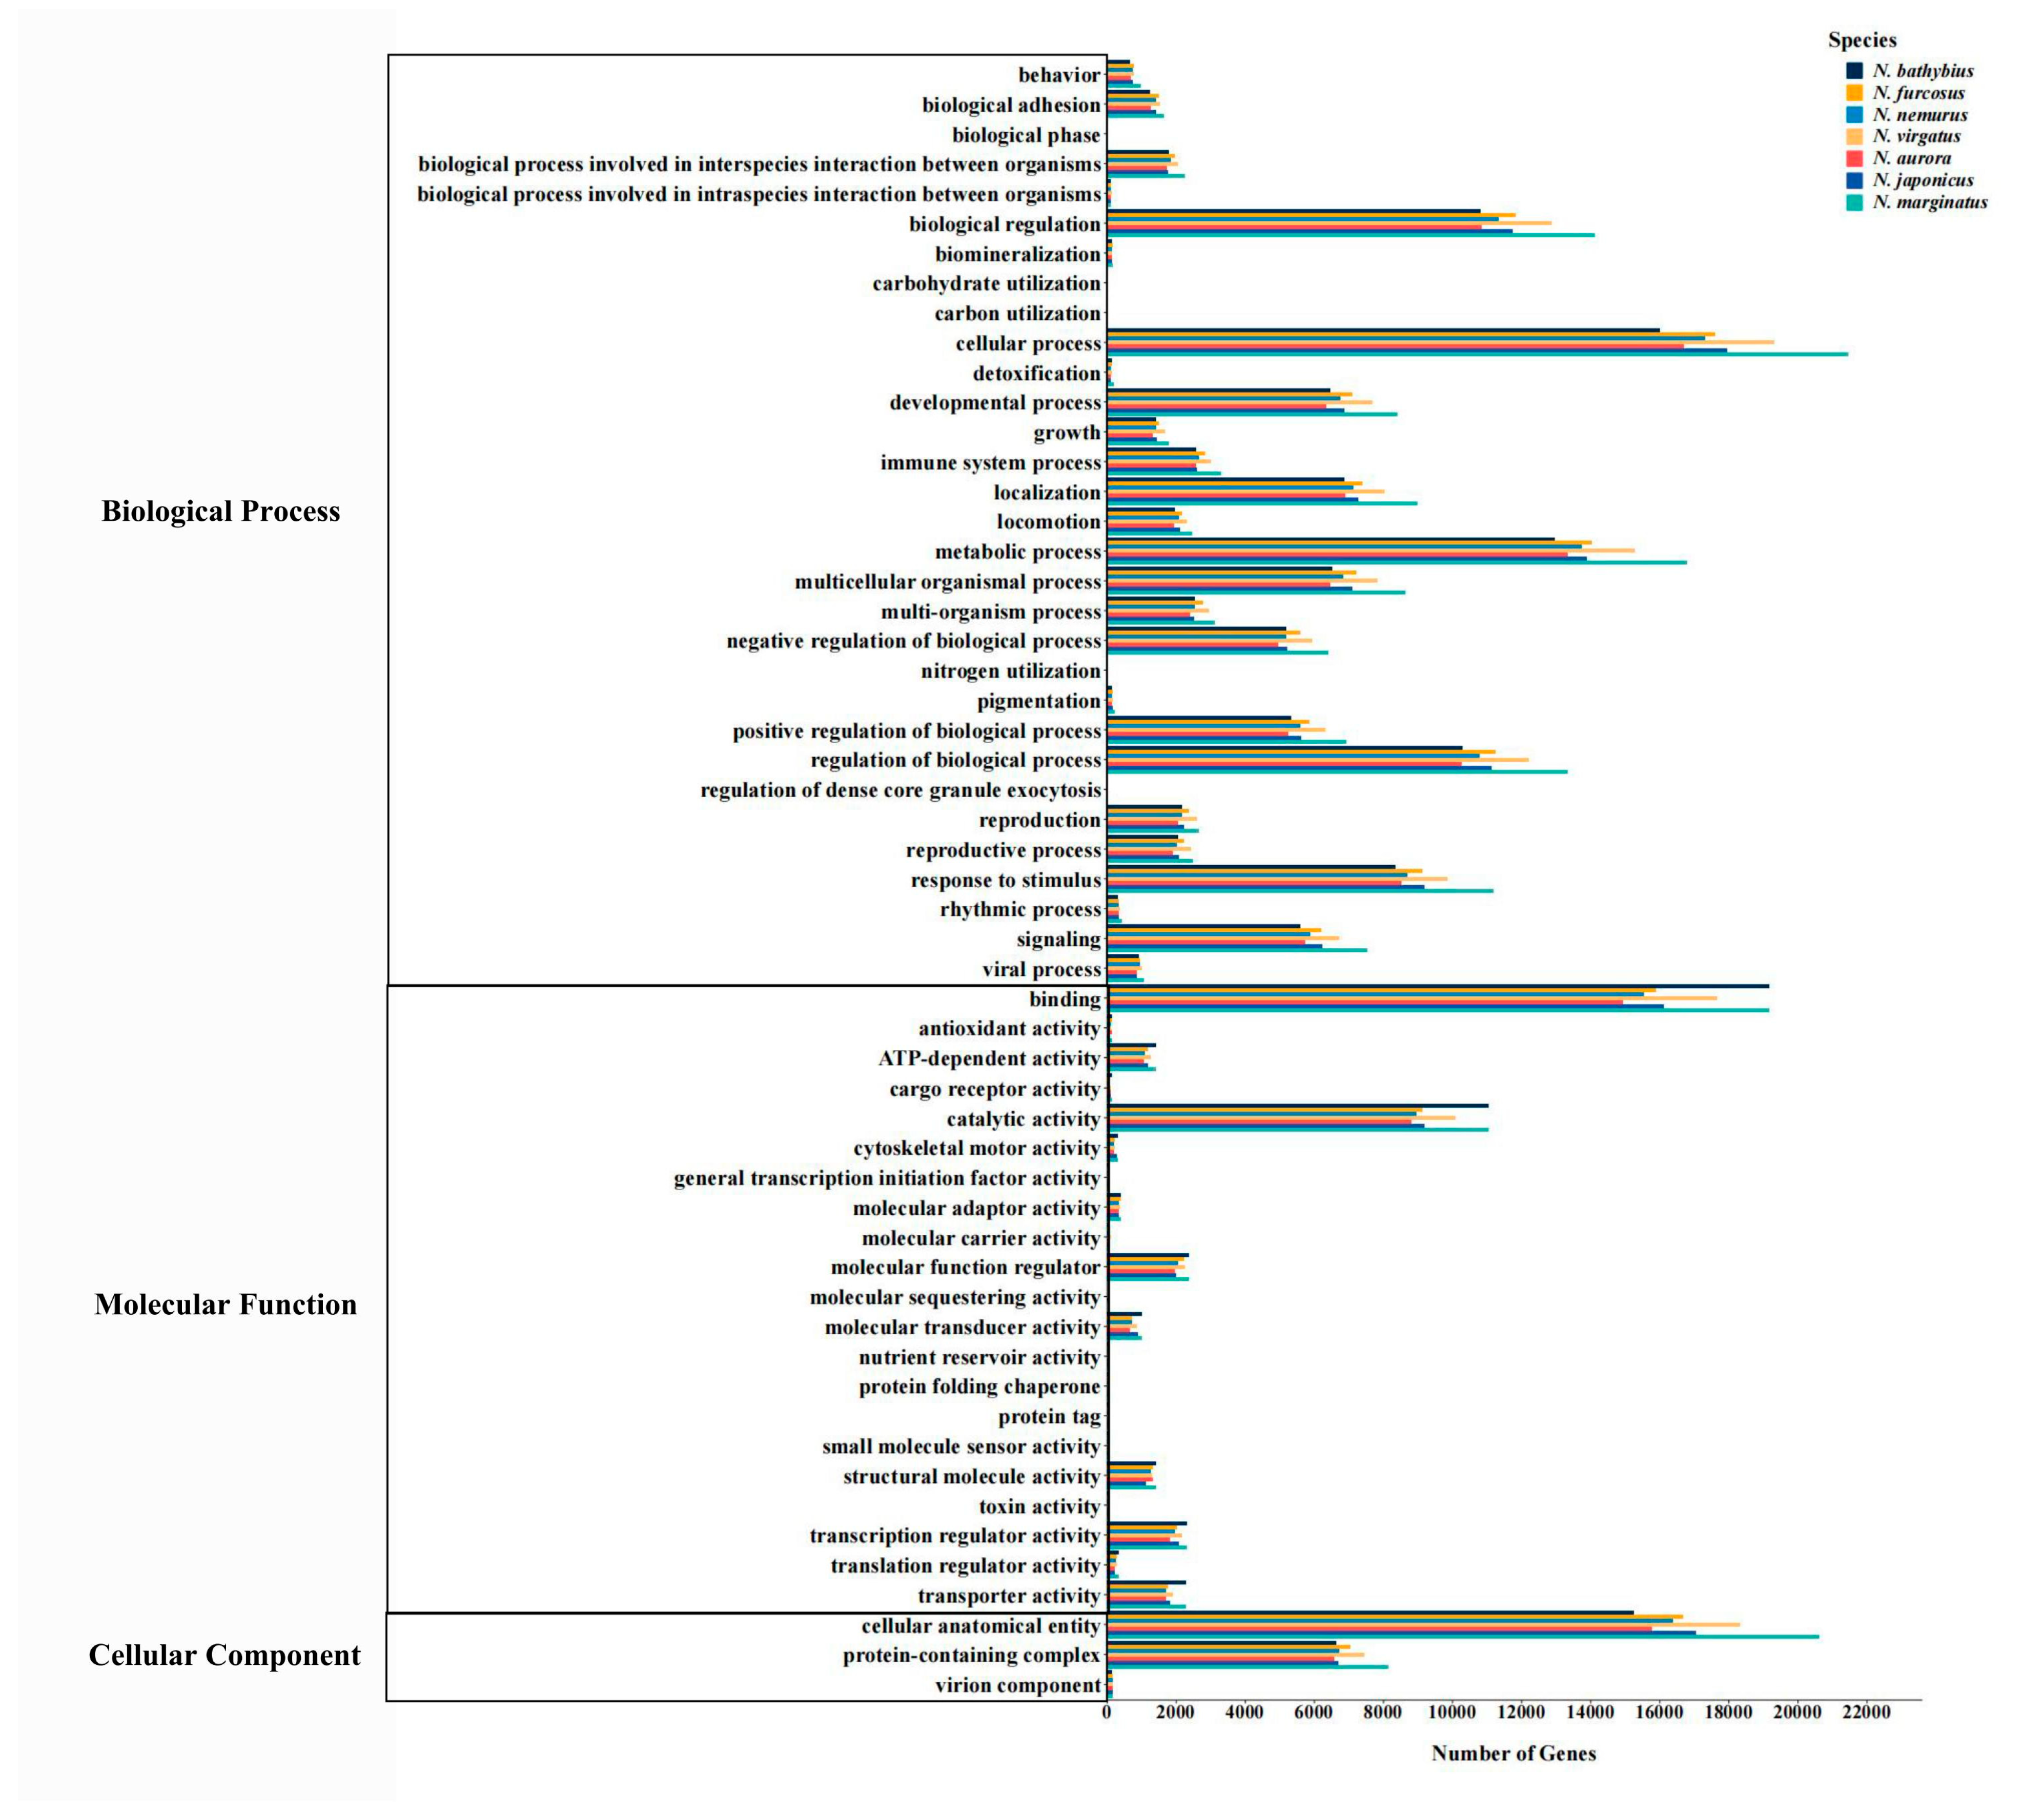
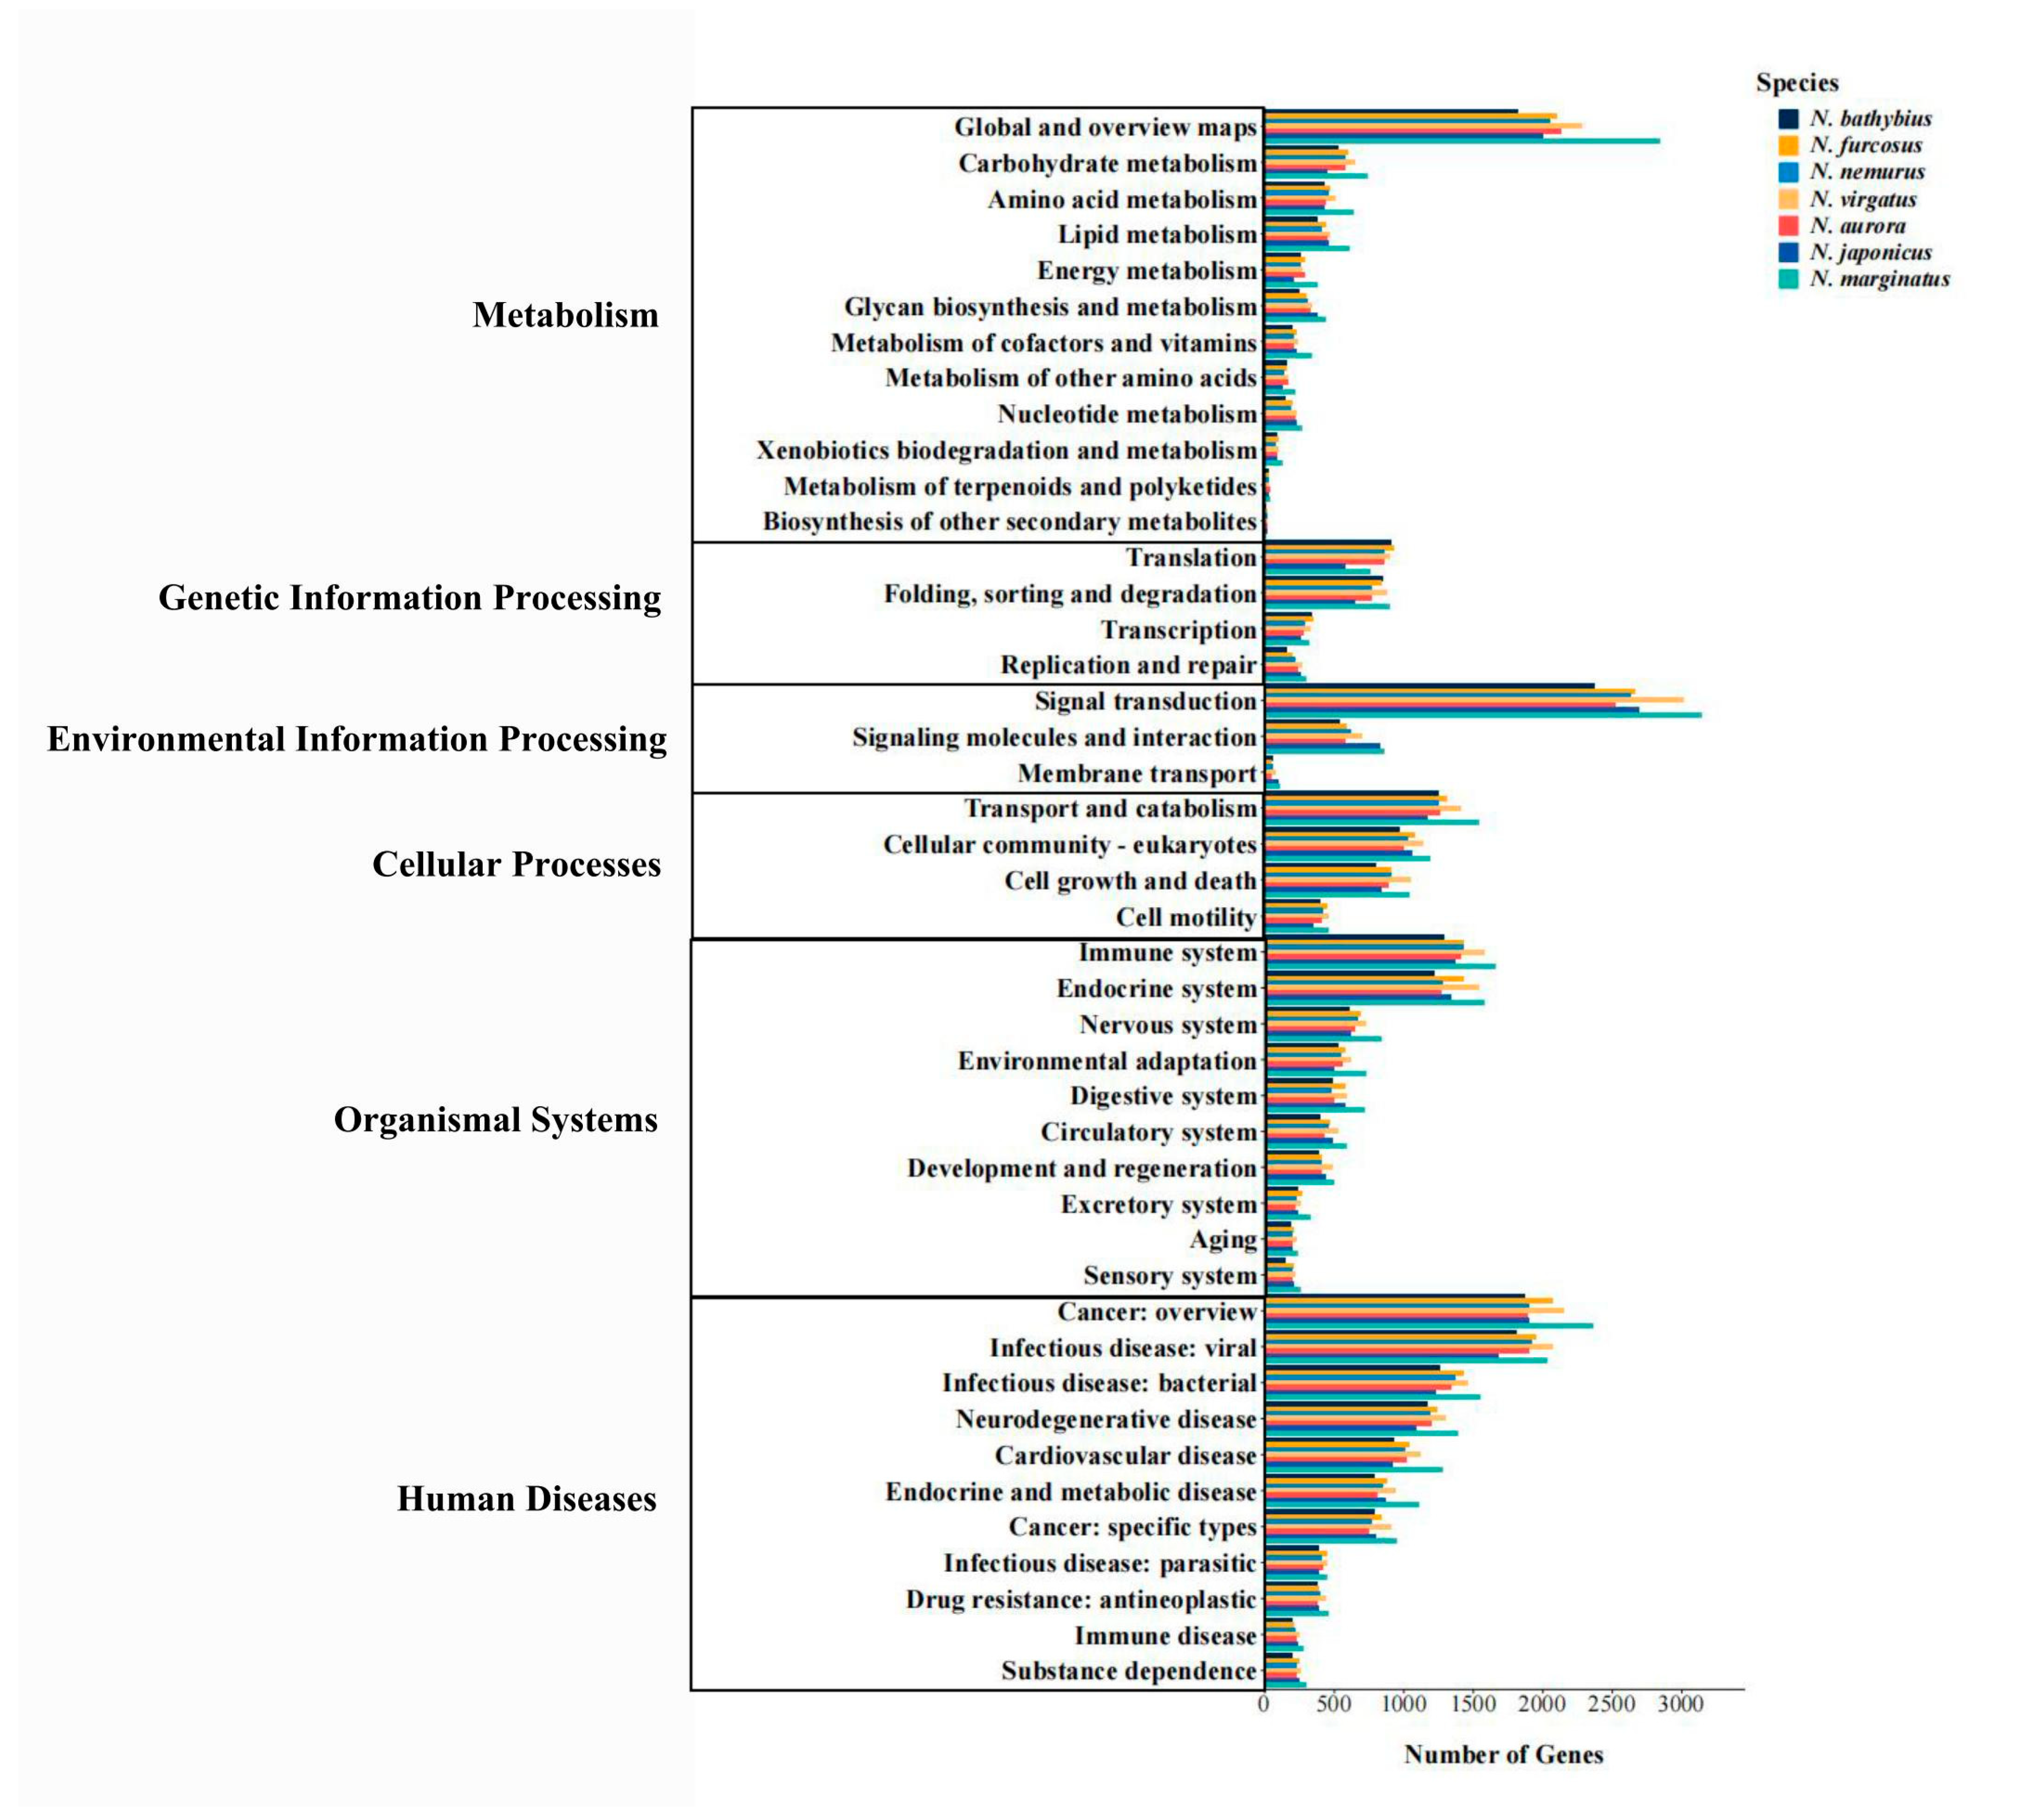
2.3. Functional Annotation

The entire set of unigenes was annotated in four frequently used databases, including the NCBI non-redundant (Nr) protein, the Cluster of Orthologous Groups of proteins (KOG/COG) database, the SwissProt protein database, and the Kyoto Encyclopedia of Genes and Genomes (KEGG). The numbers and percentages of unigenes that matched to various databases for the seven species are shown in Table 3.
The unigenes of the seven species were annotated to the KOG database and were categorized into 25 subcategories (Figure 2). We found similar distribution patterns across the seven species. Among the 25 subcategories, “General function prediction only” (“R” term) and “Signal transduction mechanisms” (“T” term) are significantly higher than the other subcategories. Furthermore, some terms related to environmental adaptability are also enriched, such as “Posttranslational modification, protein turnover, chaperones” (“O” term) and “Intracellular trafficking, secretion, and vesicular transport” (“U” term).
To determine the functional distribution of unigenes, we used the NR annotation information and obtained the GO annotation information of Unigenes with the Blast2GO software (version 2.6.0). All unigenes annotated in the GO database are divided into three major categories, including “biological processes”, “molecular functions”, and “cellular components” (Figure 3). Among them, “biological processes” contain the largest number of annotated unigenes, while “cellular components” has the fewest. Additionally, term “cellular process” dominates in the “biological process” category, term “binding” dominates in the “molecular function” category, and term “cellular anatomical entity” dominates in the “cellular component” category. These terms are all related to cellular composition and function, maintaining the basic regulation of the organism.
To further investigate the complex behaviors and interactions of gene products in biology, we conducted KEGG pathway analysis. Six types of hierarchy one pathways were involved in the KEGG annotation in the seven species, including “Metabolism”, “Genetic Information Processing”, “Environmental Information Processing”, “Cellular Processes”, “Organismal Systems”, “Human Diseases” (Figure 4). Among them, the “Human Diseases” pathway contains the largest number of annotated sequences, followed by the “Organismal Systems” pathway. Furthermore, in hierarchy two pathways, most unigenes in the seven species were annotated in the “Global and overview maps”, “Signal transduction”, “Transport and catabolism”, “Immune system”, “Endocrine system”, “Cancer: overview”, and “Infectious disease: viral” pathways. These pathways are all involved in the transmission of information within organisms and their response to various internal and external environmental changes, thereby helping organisms maintain homeostasis and adaptability.

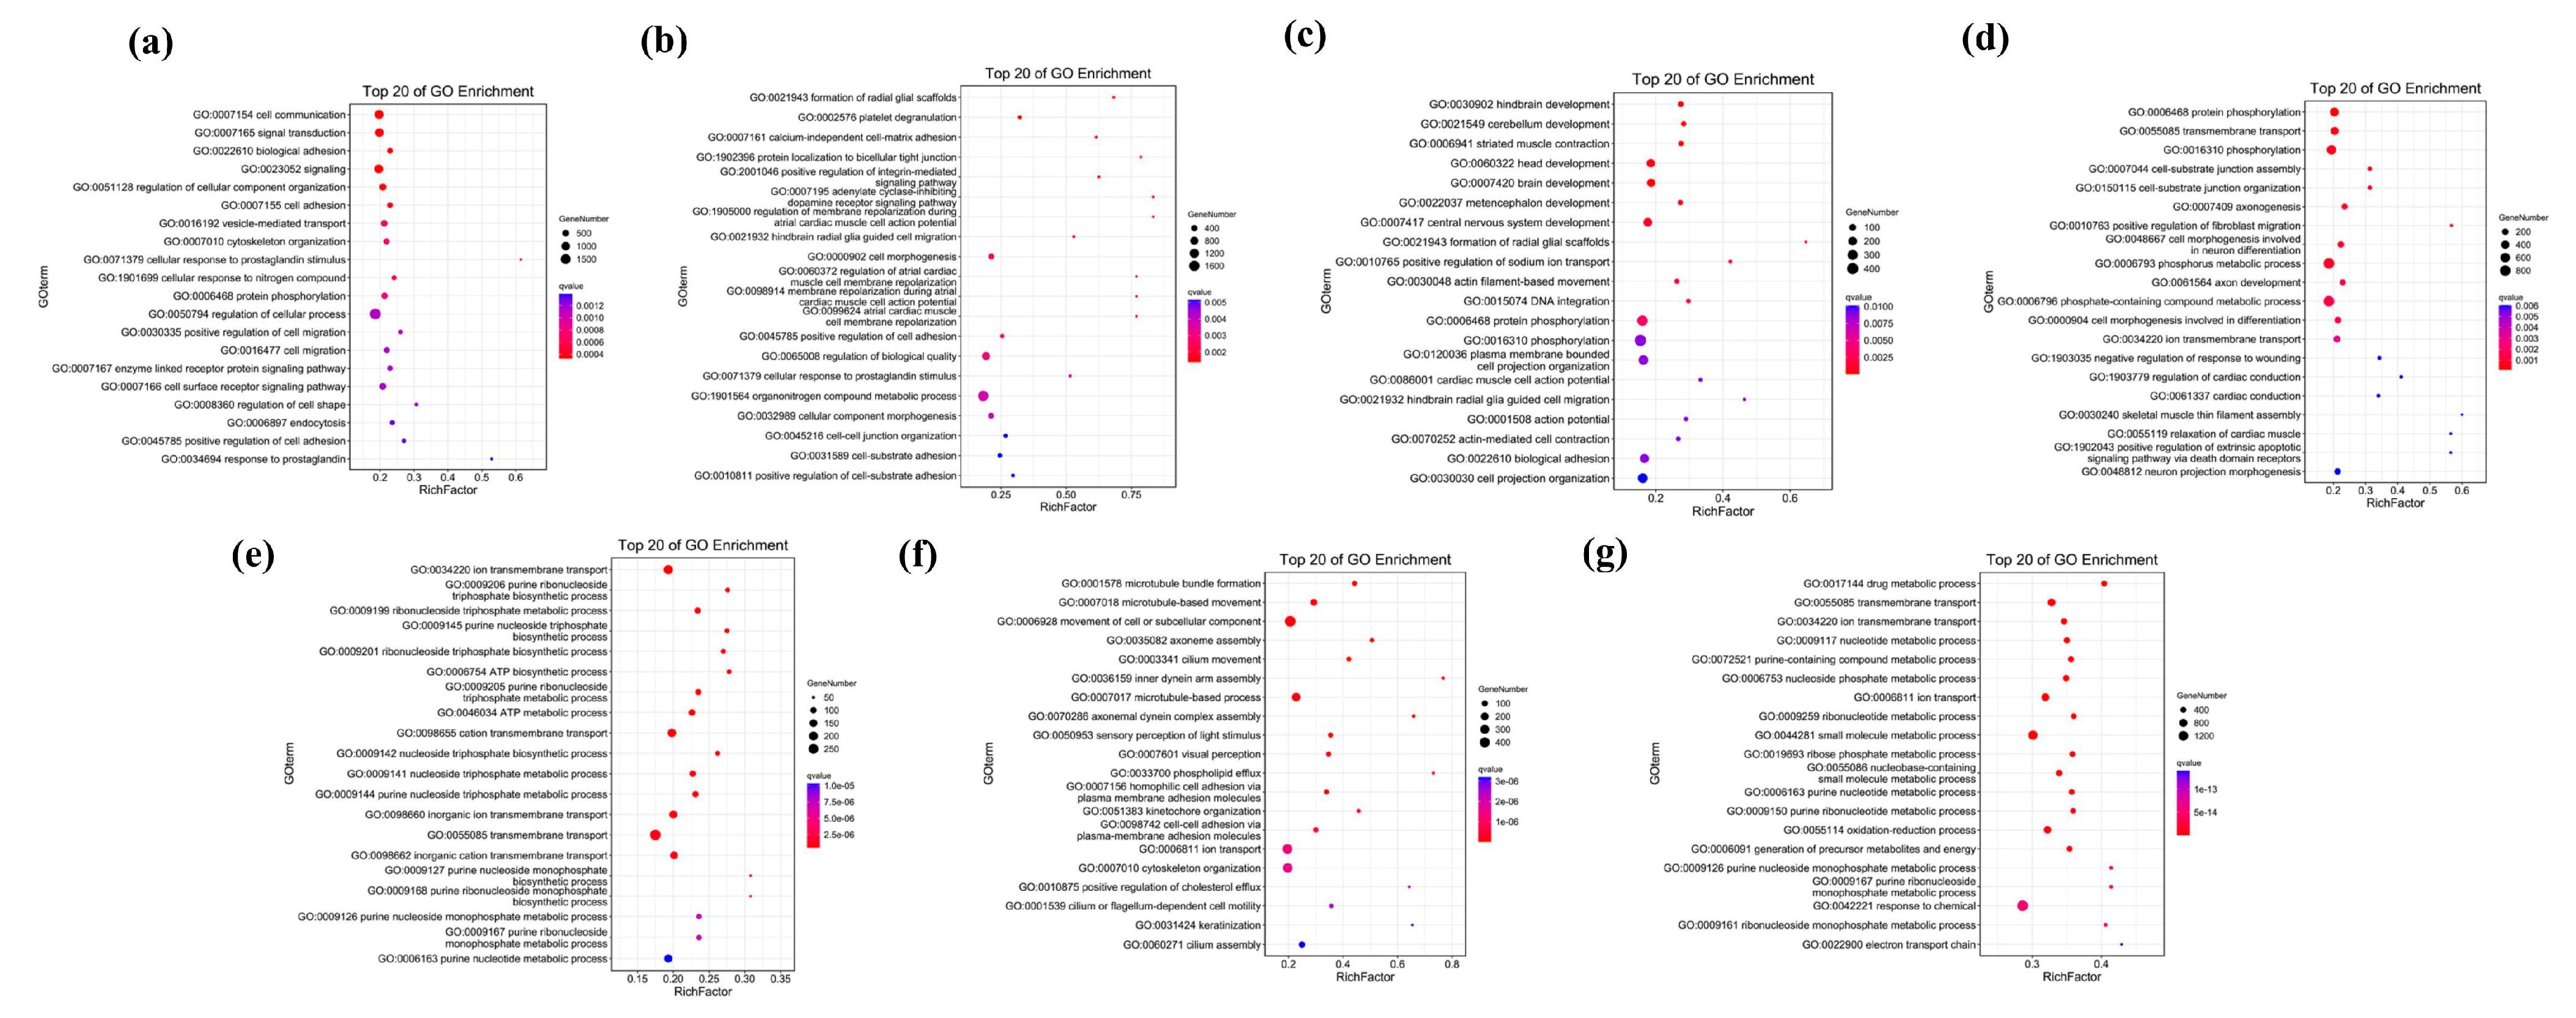
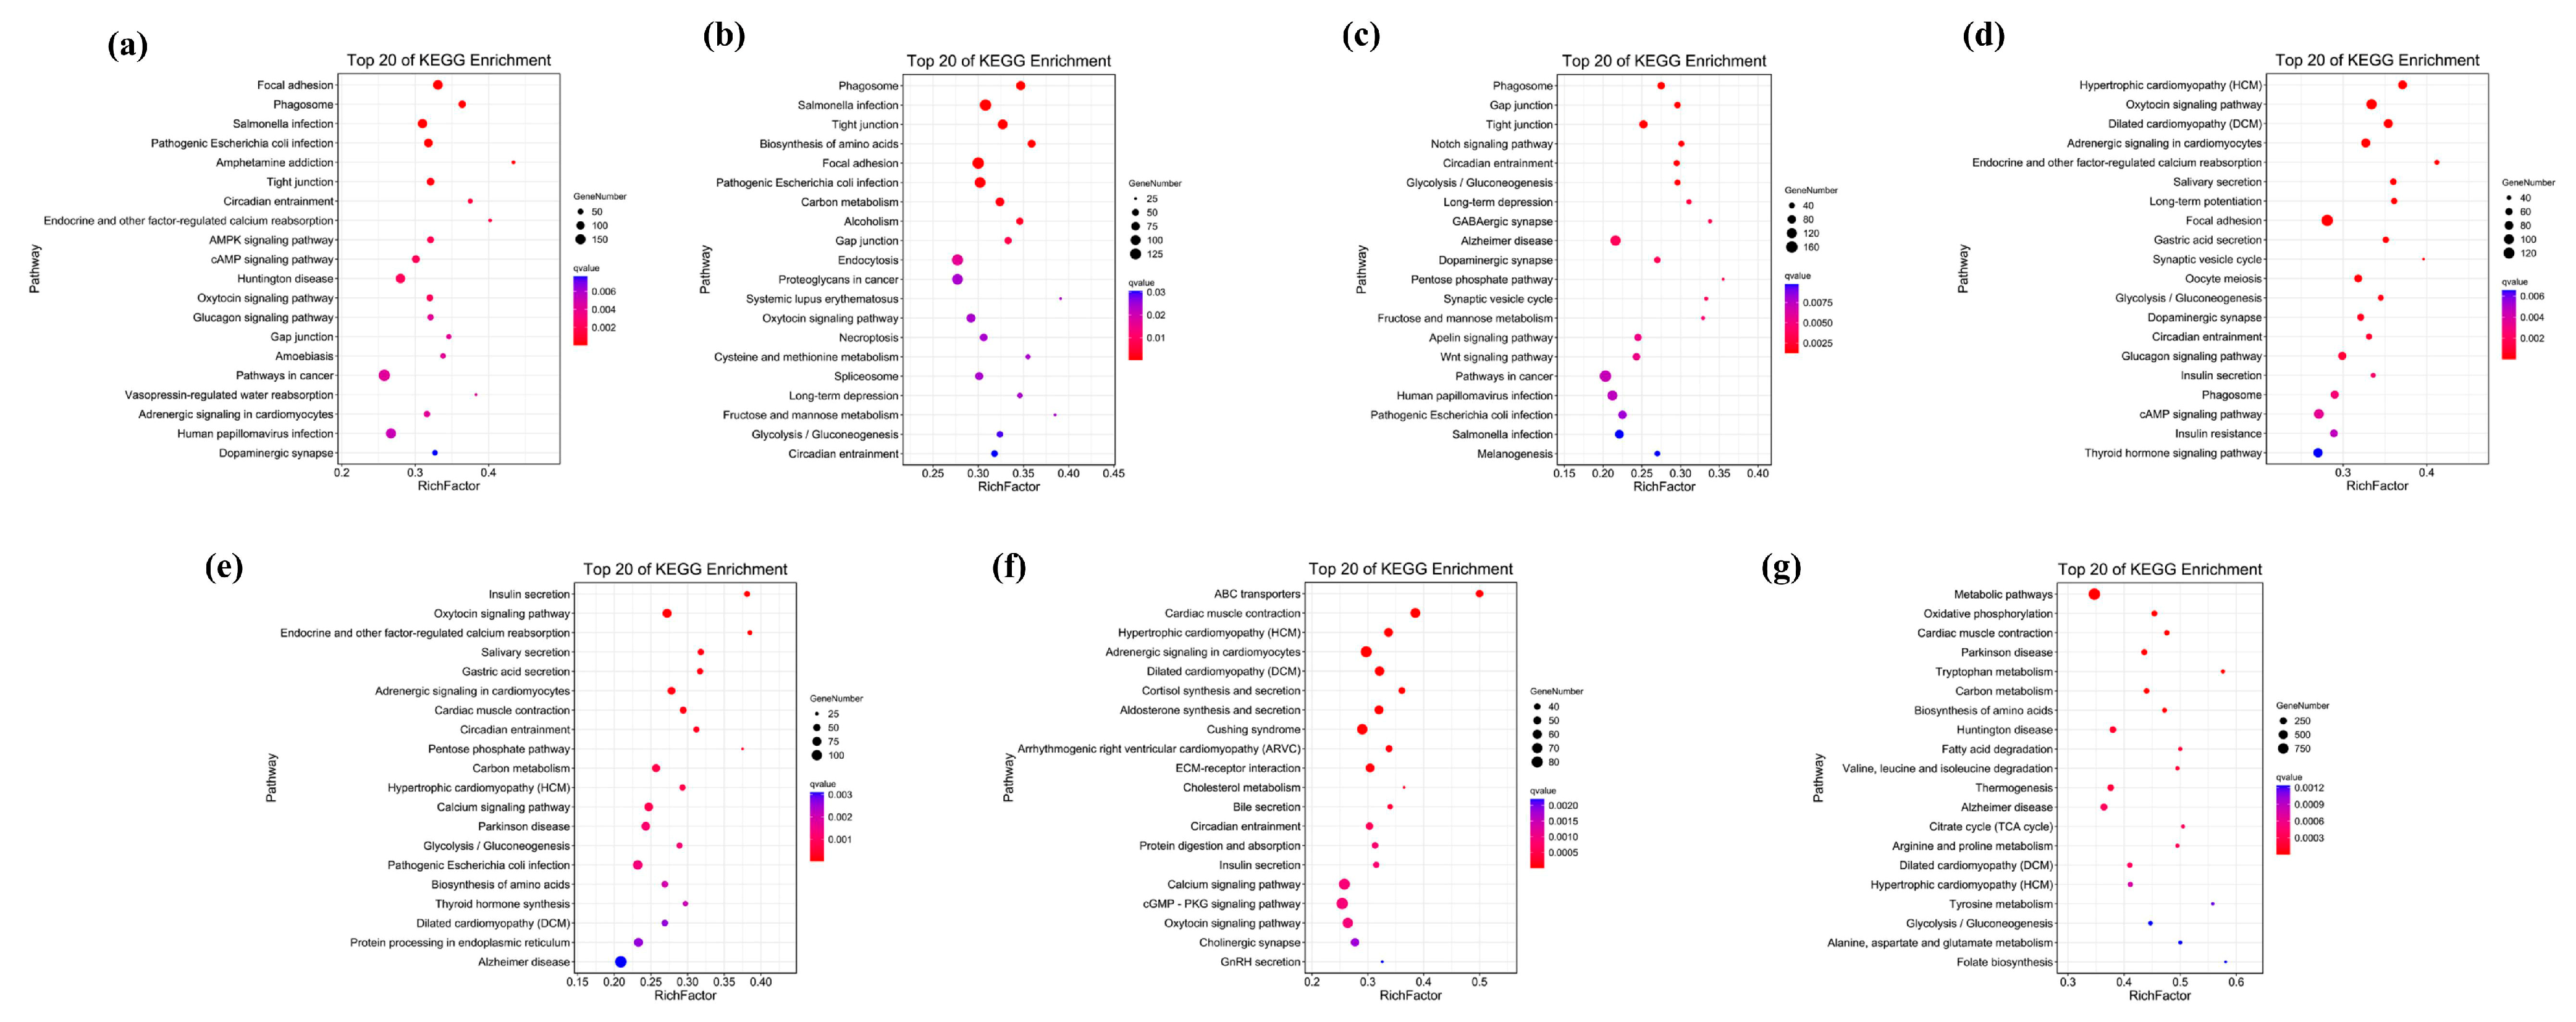
2.4. Functional Enrichment Analysis of Unique Genes

Using the combined method of Diamond and OrthoMCL, gene family information was established for seven species of the genus Nemipterus and Pagrus major. The analysis indicated that 4848 genes families were shared among the seven species, with 4546 gene families unique to species N. bathybius, 5178 gene families unique to species N. furcosus, 4085 gene families unique to species N. nemurus, 5280 gene families unique to species N. virgatus, 3891 gene families unique to species N. aurora, 5016 gene families unique to species N. japonicus, and 8316 gene families unique to species N. marginatus.
The GO enrichment analysis of unique gene families revealed that, within the biological processes, “cellular process” and “metabolic process” were the two most common GO terms. Meanwhile, ‘regulation of cellular process’ (GO:0050794) shows the highest level of enrichment in N. bathybius, ‘organonitrogen compound metabolic process’ (GO:1901564) in N. furcosus, ‘phosphorylation’ (GO:0016310) in N. nemurus, ‘phosphorus metabolic process’ (GO:0006793) in N. virgatus, ‘transmembrane transport’ (GO:0055085) in N. aurora, ‘ion transport’ (GO:0006811) in N. japonicus, and ‘response to chemical’ (GO:0042221) in N. marginatus. Within the molecular functions and cellular components, aside from N. marginatus, ‘carbohydrate derivative binding’ (GO:0097367) and ‘cytoskeleton’ (GO:0005856) demonstrate significant enrichment across all other species. In addition, the unique genes of N. bathybius are predominantly associated with ‘protein binding’ (GO:0005515) and ‘endomembrane system’ (GO:0012505), yet they do not exhibit significant enrichment in other species (Figure 5).
According to the KEGG pathway enrichment results (Figure 6), ‘Focal adhesion’ (ko04510) and ‘Alzheimer disease’(ko05010) are highly enriched in seven species. Among them, the unique genes of N. marginatus are mainly enriched in ‘Metabolic Pathways’ (ko01100), and the unique genes of N. bathybius are closely related to the ‘PI3K-Akt signaling pathway’ (ko04151).

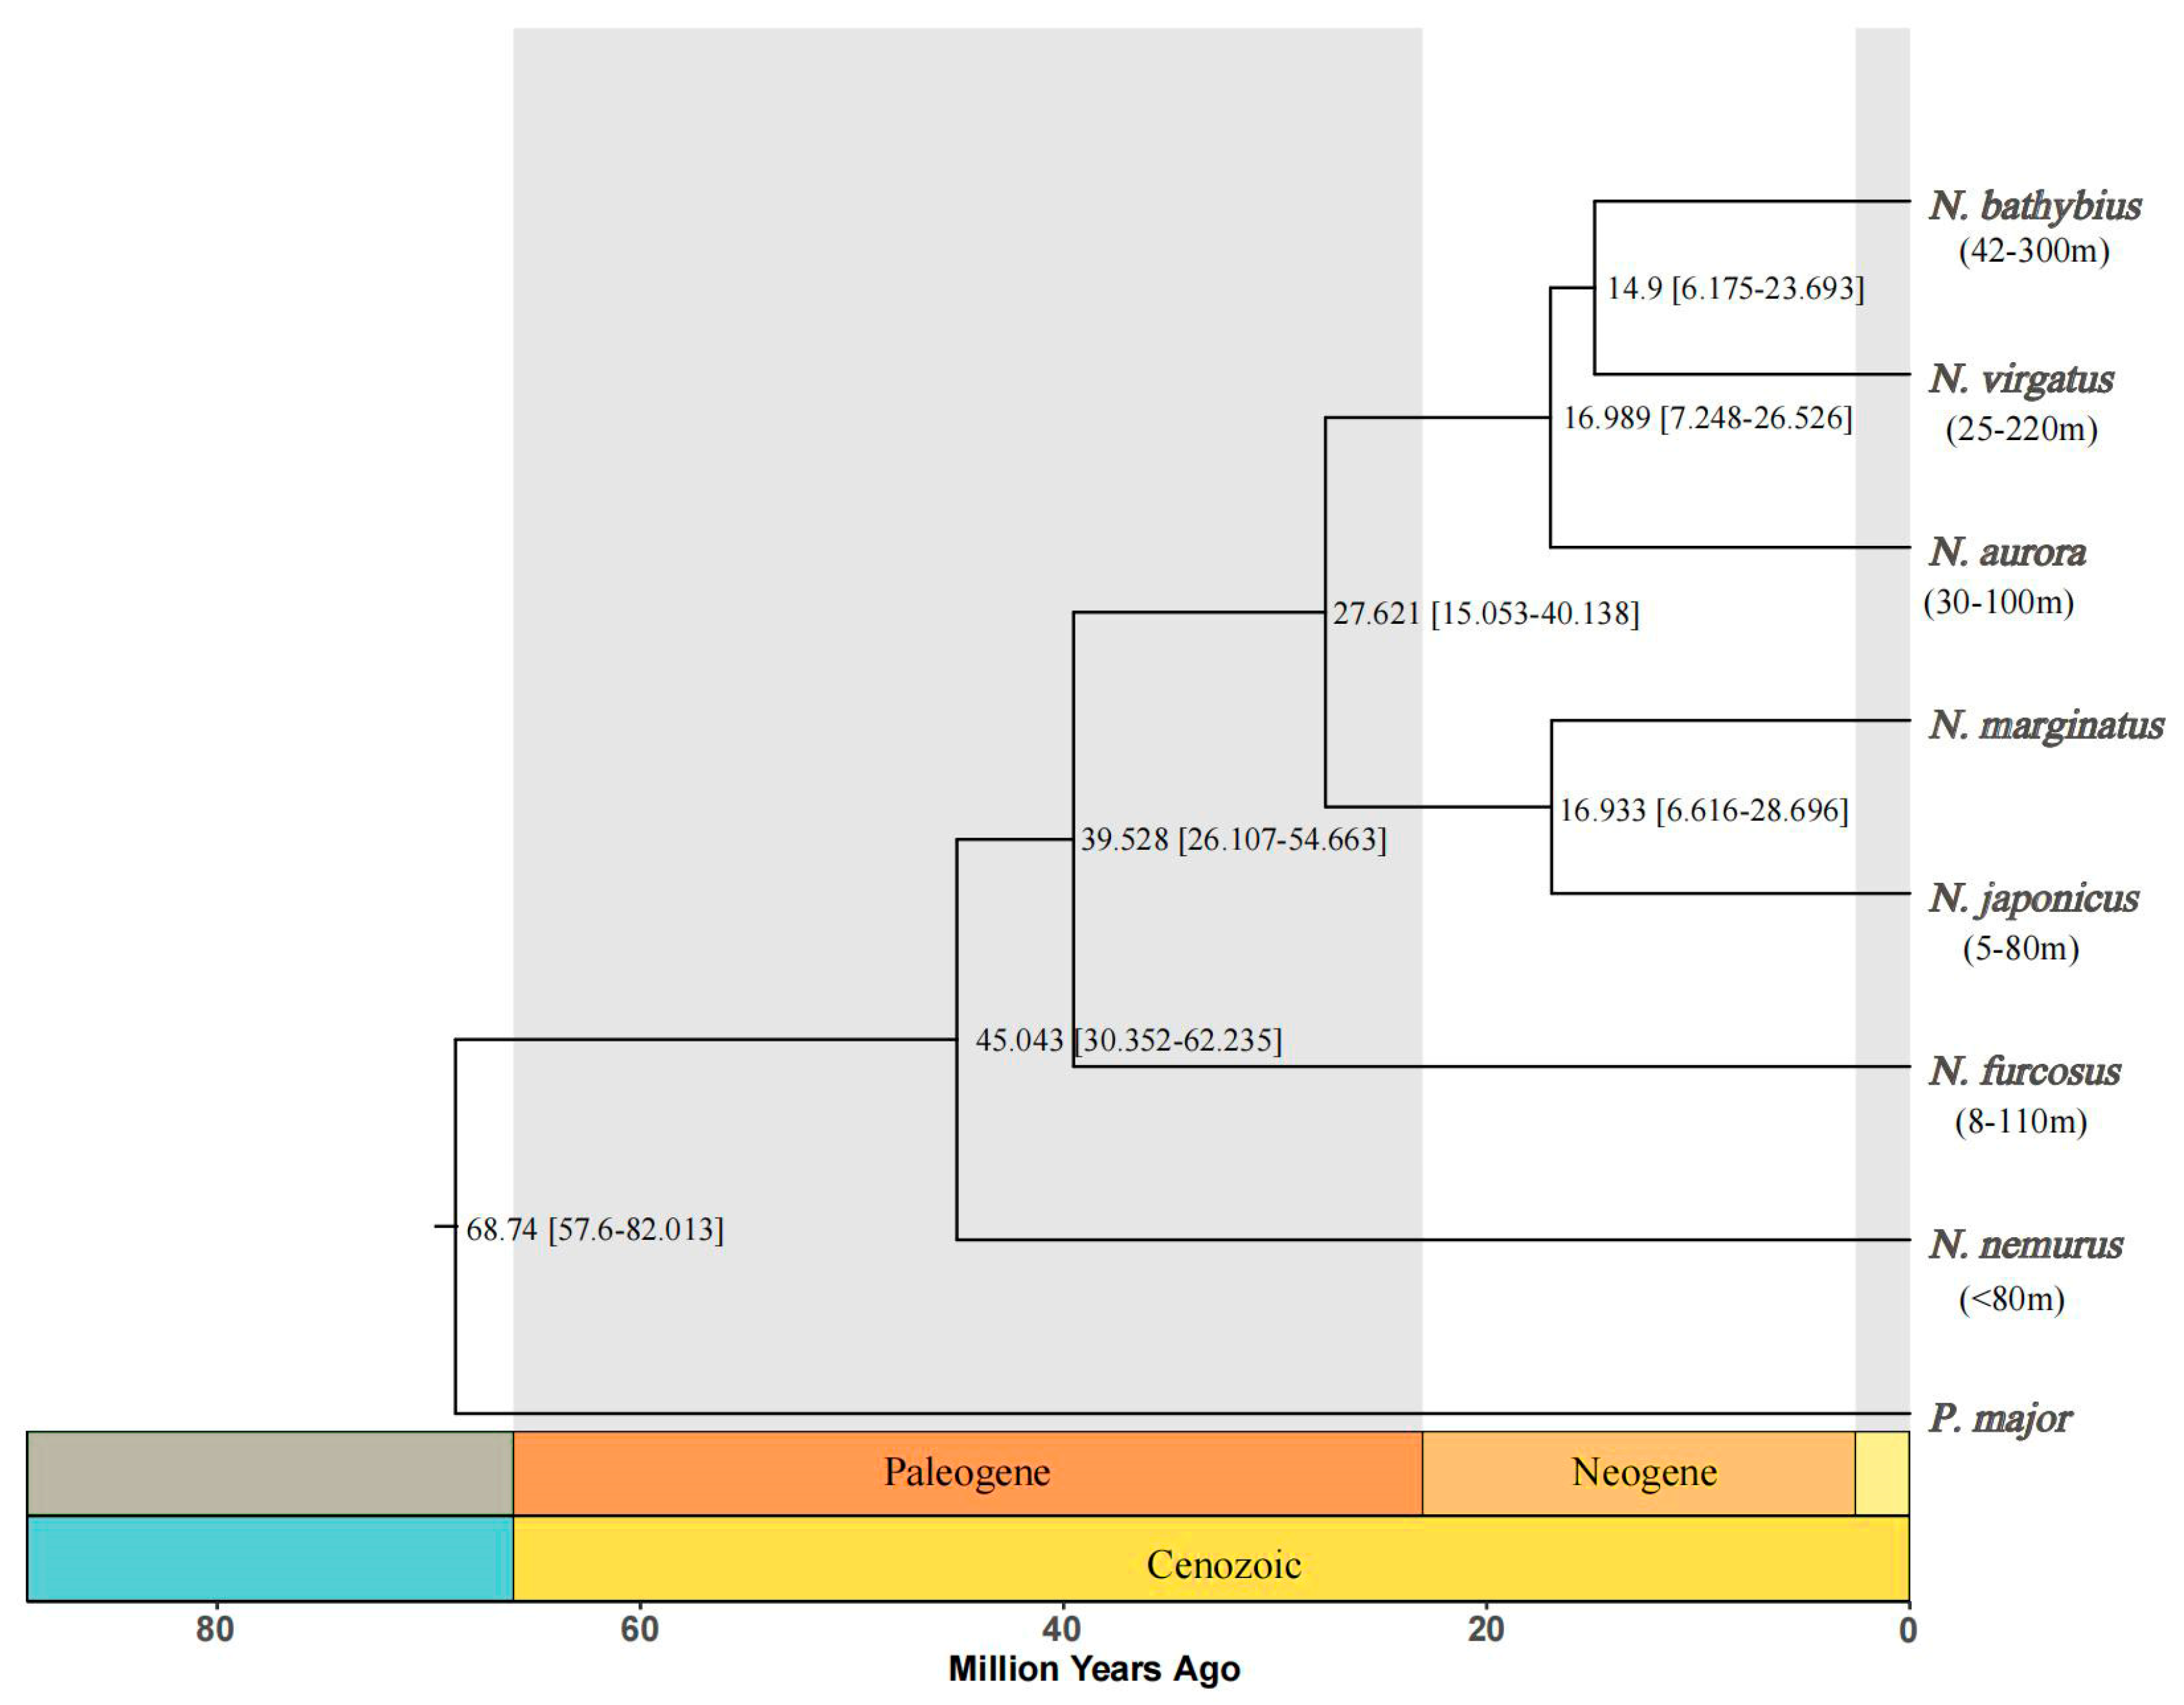
2.5. Phylogenetic and Divergence Time Estimations

Phylogenetic and divergence time estimations analysis is based on single-copy orthologous genes. The evolutionary tree provides a hierarchical or topological representation, which reflects the divergence points of novel gene duplications or organisms sharing a common ancestor. The lengths of the branches indicate the evolutionary distance between the proteins that existed at the time of these events and the contemporary proteins (Figure 7). We amplified a 632 bp COI sequence from these seven species of the genus Nemipterus. The phylogenetic trees constructed from the COI barcode sequences of seven species of the genus Nemipterus in this study shows multiple clades. Specifically, N. japonicus and N. marginatus formed a clade, N. furcosus and N. nemurus grouped into another clade, while the remaining species—N. bathybius, N. virgatus, and N. aurora—clustered together to form a separate, independent clade. It is noteworthy that N. bathybius and N. virgatus is at the tip of the evolutionary branch. Meanwhile, we found that the divergence time estimation for seven species of the genus Nemipterus and P. major is 68 million years ago (Mya). The divergence events among the Nemipterus species predominantly occurred during the Cenozoic era, from the Paleogene to the Neogene epochs, spanning approximately 45 to 14.9 million years ago (Mya). Among the studied species, N. nemurus was the first to diverge at approximately 45 Mya, followed by N. furcosus. The remaining five species diverged predominantly during the Neogene period (27.6–14.9 Mya).

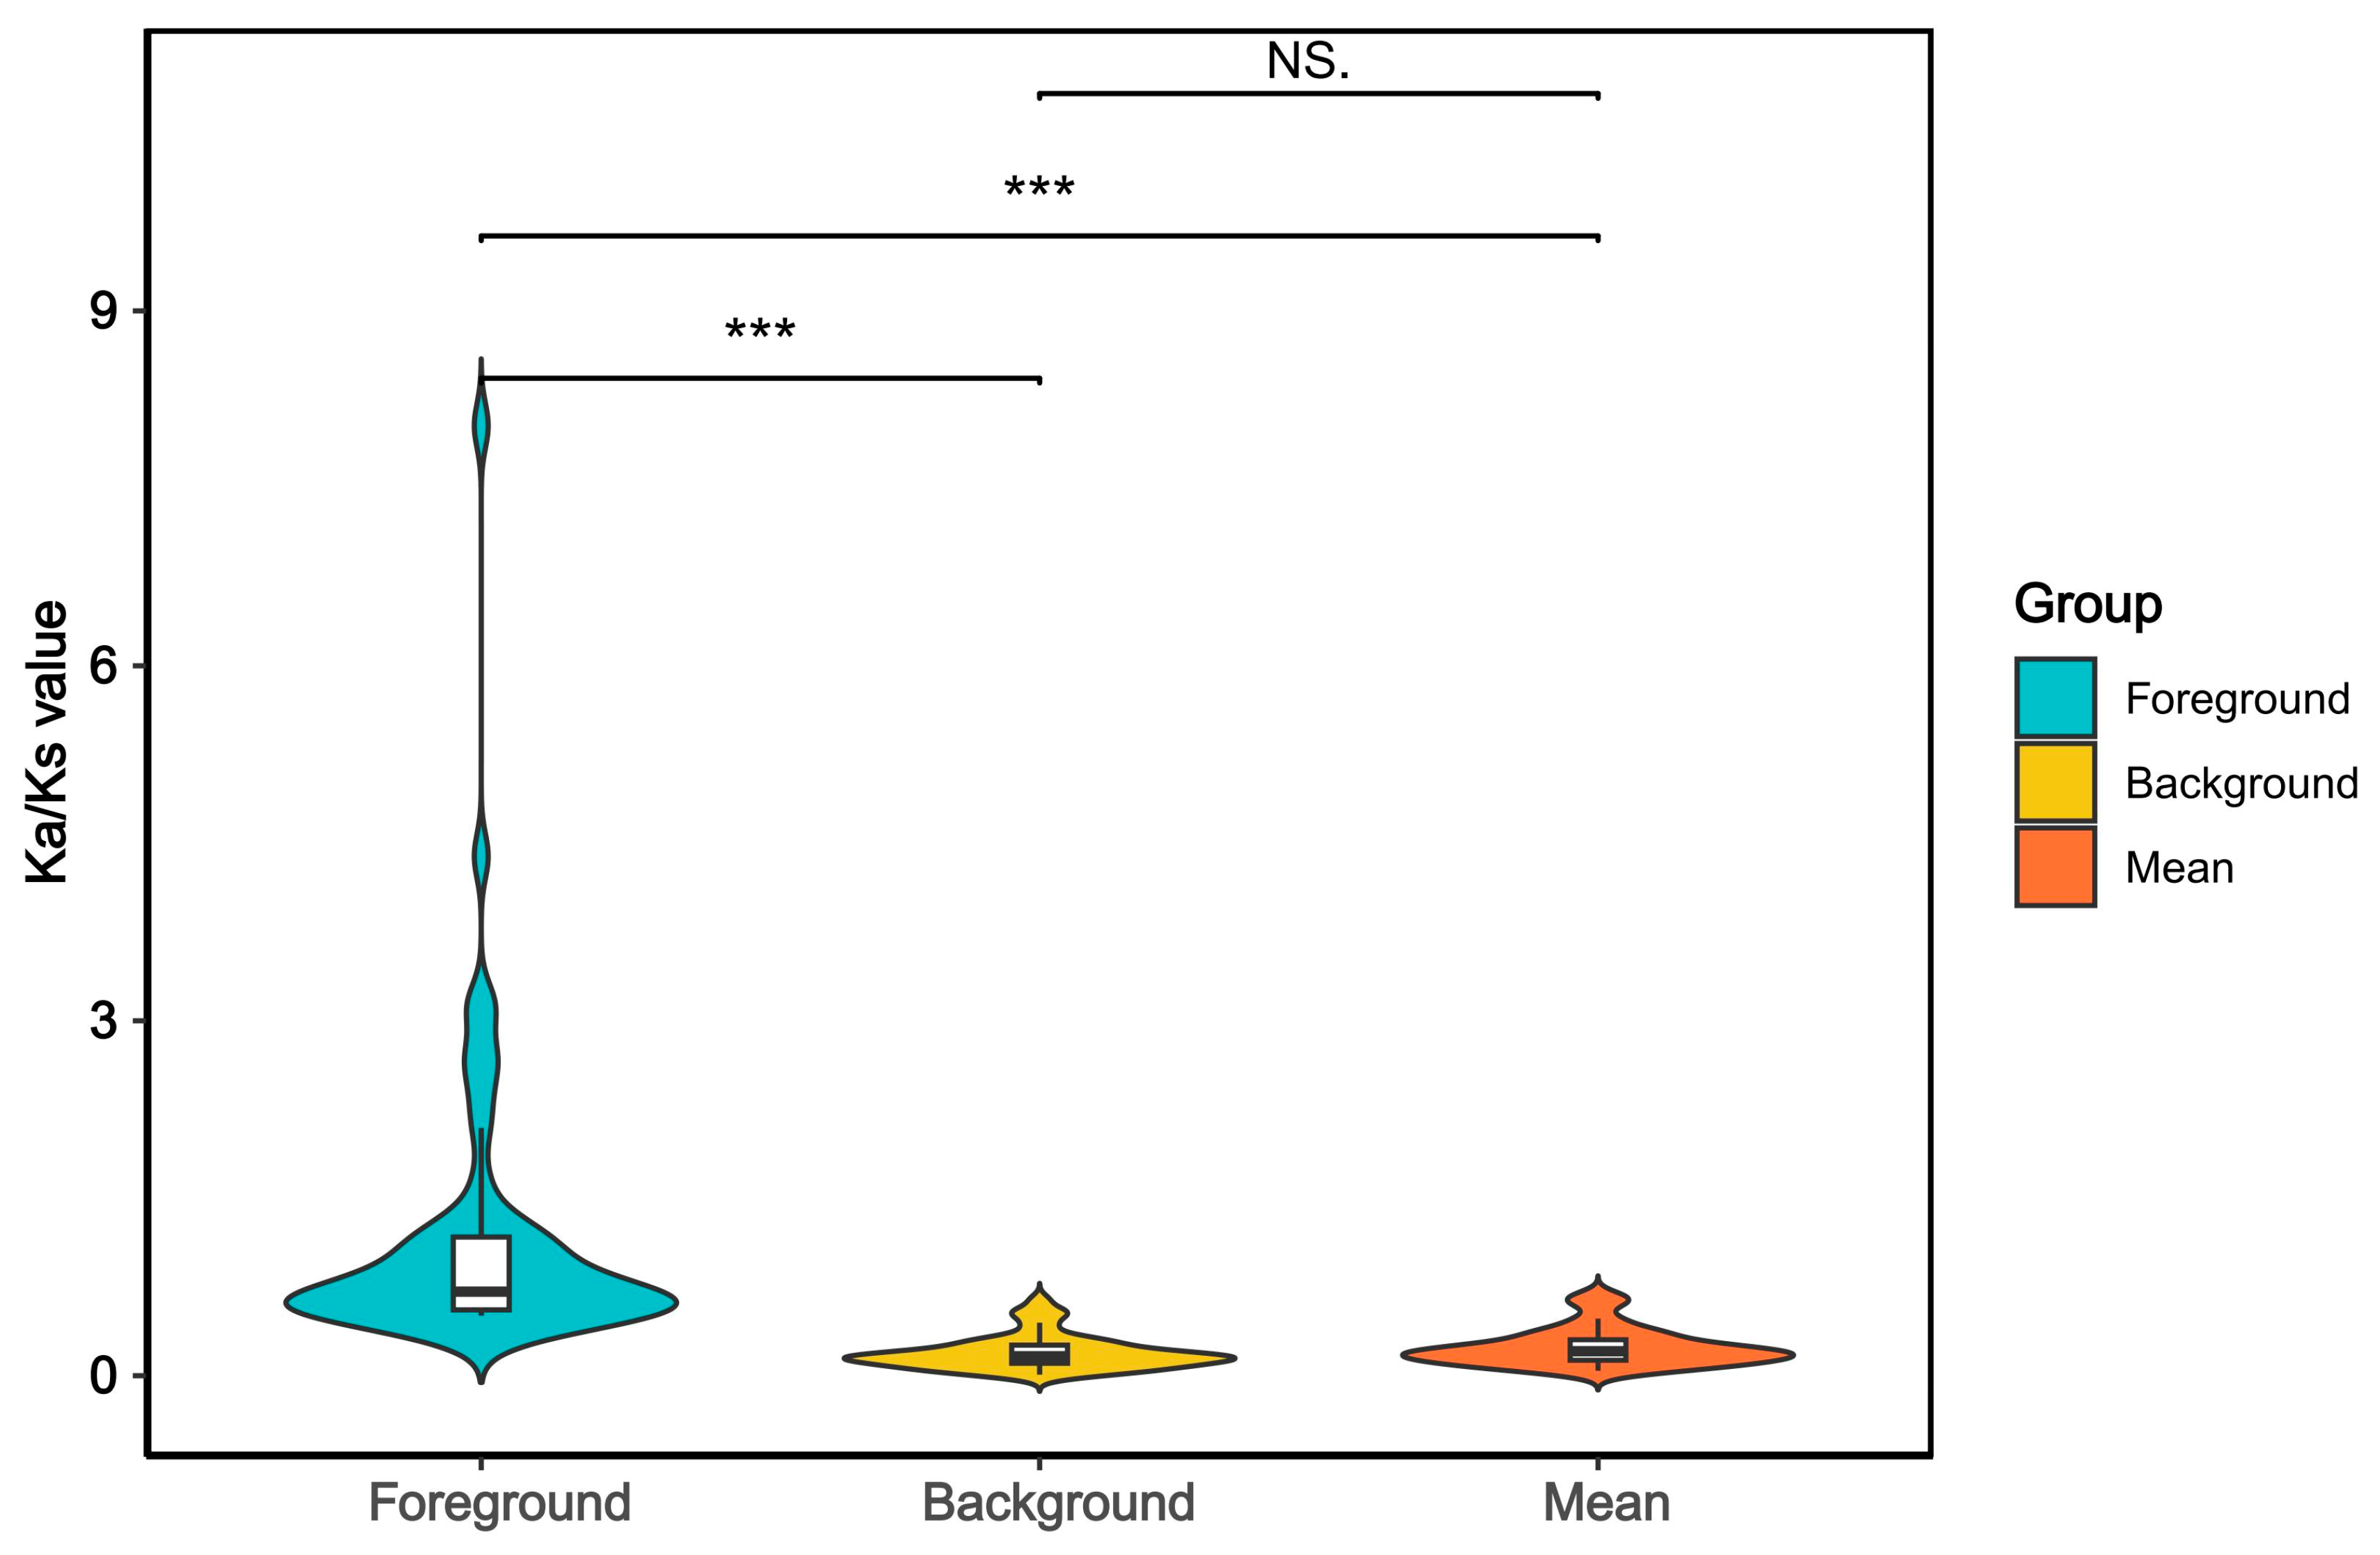
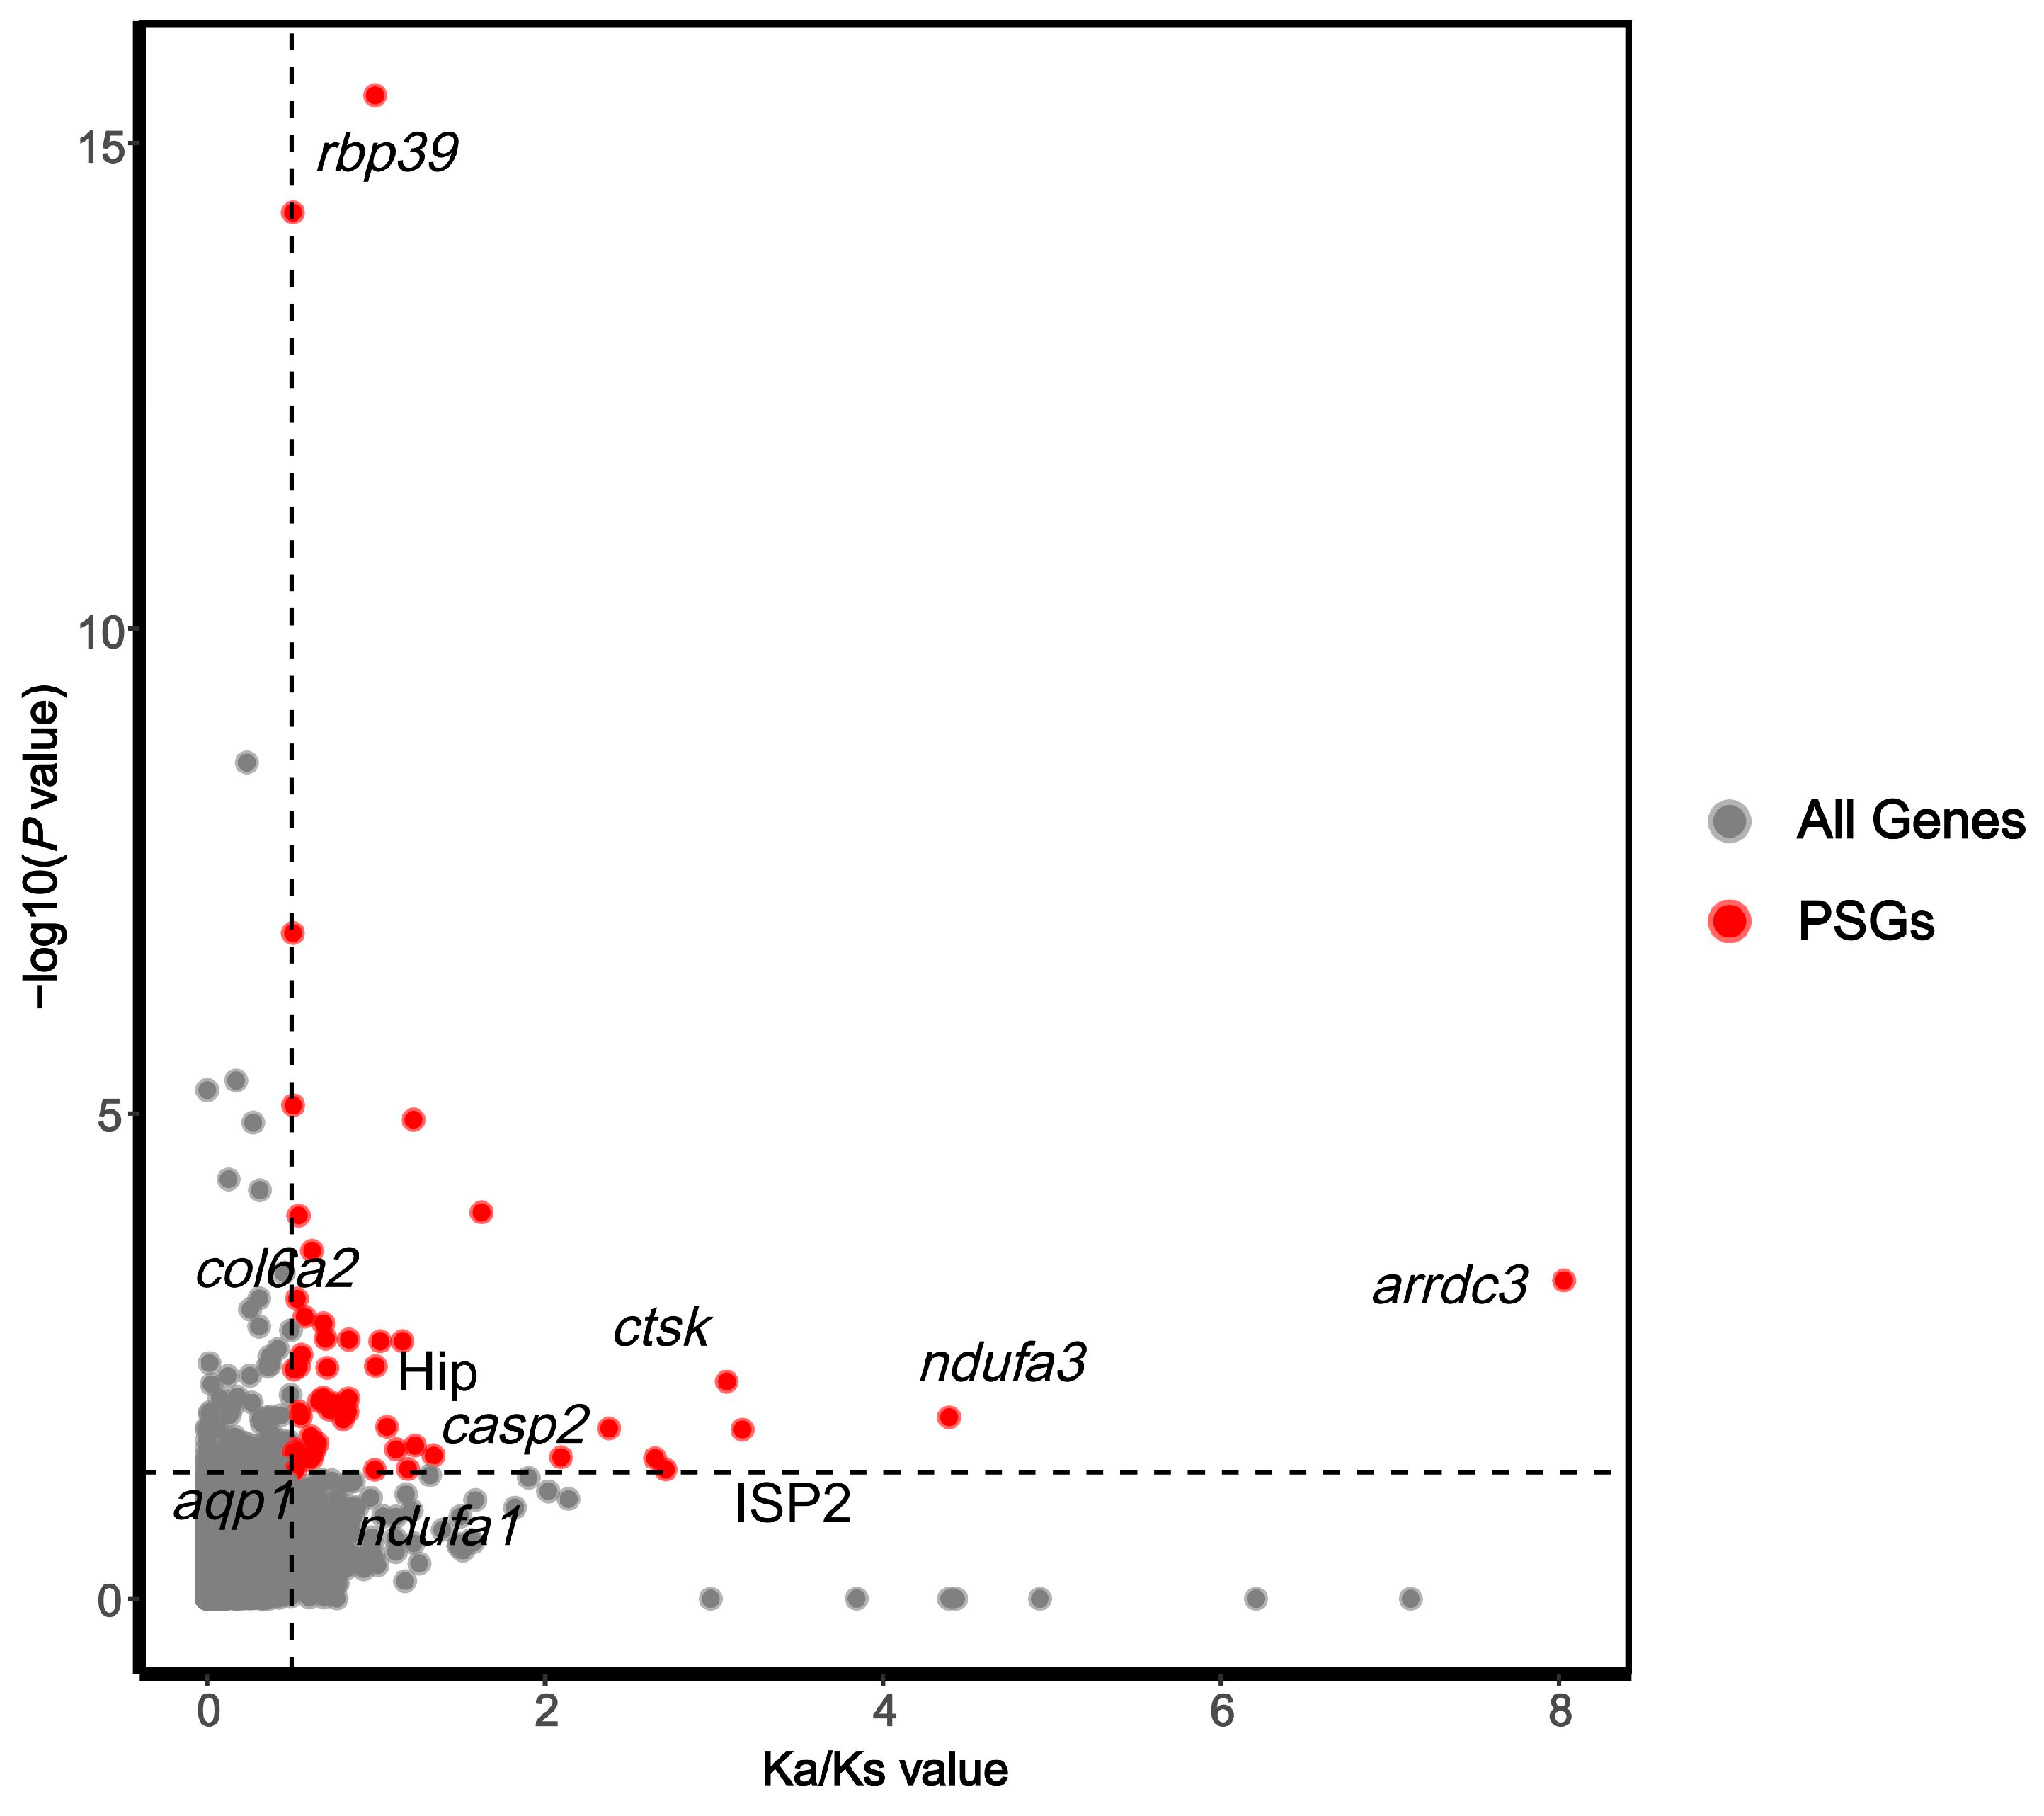
2.6. Selection Pressure Analysis

Conduct selection pressure analysis based on single-copy orthologous genes to identify genes under selection during evolution. Given that the maximum habitat depths of N. bathybius and N. virgatus reach 300 m and 220 m, respectively [5], and our phylogenetic analysis places N. bathybius and N. virgatus at the terminal positions of the clade, we designated these two species as foreground branches and the remaining species as the background branches to detect genes under positive selection linked to depth adaptation. We conducted selection pressure analysis by comparing the differences in the Ka/Ks radios at the gene level [45]. Genes with p values < 0.05 are considered to evolve more rapidly. We calculated the Ka/Ks values for the foreground branches, background branches, and all species, and compared the differences among the three groups (p < 0.05) (Figure 8). The results show that the Ka/Ks values of the foreground branches is significantly higher, while the background branches have the lowest value. After removing outliers, a total of 52 genes representing positive selection were identified (Table S1). Significance analysis of positively selected genes based on the foreground branch Ka/Ks values (Figure 9). These genes are involved in various functions such as signal transduction, cell apoptosis, metabolic processes, immune response, and membrane transport. We identified several environmental-responsive genes, such as aqp1, arrdc3, ISP2, Hip, ndufa1, ndufa3, pcyt1a, ctsk, col6a2, casp2. Among these, we selected genes that are under strong positive selection and calculated their genetic distances among seven species, constructing Neighbor-Joining (NJ) trees (Table S2, Figures S1 and S2).

3. Discussion

This study primarily investigates the phylogenetic relationships within the genus Nemipterus and explores the potential molecular pathways and genes that facilitate adaptation to distinct ecological niches among species. We first utilized DNA barcoding as a molecular approach to authenticate the taxonomic identity of the sampled specimens. Subsequently, we utilized RNA from seven species of the genus Nemipterus and applied Illumina sequencing technology for transcriptome de novo assembly and functional annotation. The phylogenetic relationships among species within the genus Nemipterus were explored by constructing a phylogenetic tree, and then environmental-responsive genes were identified through comparative transcriptome analysis.

3.1. Transcriptomic Characteristics of the Genus Nemipterus

This study used RNA-seq technology to obtain transcriptome information for seven species of the genus Nemipterus. Each species yielded over 40,000,000 clean reads, totaling over 300,000,000 clean reads across the seven species. The Q30 scores of the seven species ranged from 92.37% to 94.45%, indicating high sequencing quality. A total of 276,389 unigenes were obtained after assembly and a total of 168,010 (60.79%) unigenes were annotated in the protein database. Among them, the unigene annotation rate of N. aurora (64.02%) is higher than that of other species, which may be due to its higher N50 value (1958 bp).
Based on the KOG classification of proteins, more than 36% of the transcripts in all seven species were classified into 25 functional categories. In particular, the categories of “General function prediction only” and “Signal transduction mechanisms” showed significant dominance and were much higher than the other categories. The dominance of these two categories highlights the active regulation of the relationship between cells and the external environment in species of the genus Nemipterus, as well as the significant importance in the exploration of unknown gene functions. In the level two GO categories of biological process and cellular component, most of the unigenes were involved in maintaining basic biological functions, such as “cellular process”, “metabolic process” and “cellular anatomical entity”. In terms of molecular function, the majority of unigenes were primarily involved in “binding” and “catalytic activity” processes, reflecting their active role in maintaining fundamental life processes. For KEGG pathways, they were mainly annotated in the following pathways: “Global and overview maps”, “Signal transduction”, “Transport and catabolism”, “Immune system”, “Endocrine system”, “Cancer: overview” and “Infectious disease: viral”. The annotation results show that the seven species exhibit similar pathway distributions, indicating that they have a high degree of conservation in basic metabolic pathways and cellular functions [46]. The transcriptomic dataset obtained from this study on seven species within the genus Nemipterus, economically important fish in many countries, addresses a knowledge gap and enables further in-depth research into the phylogeny and adaptive evolution of the genus Nemipterus.

3.2. Phylogenetic and Divergence Time Analysis of the Genus Nemipterus

The COI gene, with its moderate evolutionary rate, is widely recognized as an effective tool for molecular species identification and resolving phylogenetic relationships among closely related species [47,48]. In this study, the phylogenetic tree constructed based on the COI barcode sequences of the seven species of the genus Nemipterus revealed multiple clades. The present findings are consistent with previously observed topological structures in certain studies. For example, N. japonicus and N. marginatus clustered into a single clade, indicating their close phylogenetic relationship [13,14]. Compared to other species within the genus Nemipterus, N. bathybius exhibited closer affinity to N. virgatus [14,49], while N. furcosus and N. nemurus formed a distinct sister group [13]. However, discrepancies exist with some studies proposing a closer relationship between N. japonicus and N. nemurus [30], which conflicts with the topology resolved in this study. Overall, these results demonstrate that the COI gene effectively elucidates taxonomic relationships among Nemipterus species.
A total of 2923 orthologous gene families were identified across seven species, and subsequently conducted divergence time analysis based on single-copy orthologous genes. We found that species within the Nemipterus genus diverged predominantly during the Neogene period, aligning with the hypothesis that the Neogene represents a critical phase for marine fish speciation [50,51]. Concurrently, the Cenozoic era was marked by profound and complex climatic transformations [52], with studies indicating that Neogene temperature fluctuations were pivotal in shaping modern marine biodiversity patterns [53]. The rapid diversification observed in the genus Nemipterus during this period likely reflects adaptive responses to climatic and environmental shifts. Similar divergence timelines have been documented in other marine taxa [54,55,56], further underscoring the Neogene as a key epoch for evolutionary radiation in marine ecosystems. Notably, N. bathybius is the most recent species on the evolutionary tree, with a divergence time of approximately 14.9 Mya. Due to N. bathybius having the ability to adapt to a wider range of depths, the phylogenetic analysis may suggest an evolutionary transition from shallow- to deep-water species within the genus Nemipterus. The ability to live across wide depths may promote population connectivity [57]. The increase in habitat depth may have advantages such as improved environmental stability and reduced metabolic energy consumption [58]. Previous studies have shown that organisms inhabiting deeper water layers need to functionally adapt to the prevalent high-pressure and low-temperature conditions [59].

3.3. Adaptive Evolution of the Genus Nemipterus

Environmental stress perturbs cellular homeostasis, thereby impairing critical physiological processes at the organismal level [60]. Responses to environmental stress generally range from neuroendocrine and hormone release to changes in metabolism, cellular function, and circulation, and finally to overall physiological and behavioral stress responses [61]. Marine organisms undergo a series of physiological, biochemical, and molecular activities to cope with changes in environmental stress [62,63]. For N. bathybius and N. virgatus, which have broader bathymetric ranges, they may encounter gradients in salinity, water temperature, and light intensity during vertical migration into deeper waters [64,65]. Marine teleosts must ingest the seawater medium to replace the water loss osmotically, and the molecular mechanisms underlying this process are of vital importance [66]. In this study, we identified numerous genes involved in signal transduction and cellular regulation, with a particular focus on those related to environmental adaptation. Among these genes, aqp1 participates in osmoregulatory pathways. Pairwise interspecific sequence divergence analyses revealed genetic differentiation in N. marginatus relative to congeners, suggesting that aqp1 may have undergone lineage-specific adaptive divergence during the evolutionary history of this taxon. This finding aligns with the osmotic demands imposed by the fluctuating salinity of estuarine and coastal habitats occupied by this species [67], implying that the adaptive evolution of aqp1 constitutes a key mechanism for coping with such osmotic environments. Aquaporins, AQPs, are members of a ubiquitous family of channel-forming proteins [68]. AQP1 originally characterized in human erythrocytes, represents a water-selective channel protein [69]. The induction of aqp1 gene by hypertonicity results from a sequential MAPK-signaling pathway that directly affects the promoter region of aqp1 gene [70]. Aquaporin proteins can regulate the water permeability of cell membranes to maintain cell volume and counteract the osmotic imbalance caused by the hydrostatic pressure of the deep sea. In teleost fish, aquaporins have been demonstrated to potentially play multiple roles in osmoregulatory processes [71]. In addition to its role in osmoregulation, aqp1 has been identified in photoreceptor cells of the mouse retina [72]. Furthermore, it has been found in the retinal pigment epithelium (RPE), where it is associated with transepithelial water transport [73]. It can be hypothesized that the aqp1 gene may have undergone positive selection in the threadfin breams to adapt to low-light conditions. Notably, AQP4, a paralog within the aquaporin family, has been functionally validated as essential for maintaining retinal signal transduction [74]. Additionally, significant positive selection signals were detected on the foreground branch (Ka/Ks = 8, p < 0.001), suggesting arrdc3 underwent accelerated adaptive evolution in this lineage, potentially driven by osmoregulatory challenges. Arrestin domain containing protein 3 is a member of the α-arrestin family [75] and can influence energy balance by regulating thermogenic function in adipose tissue [76]. arrdc3 has been identified to exhibit positive selection signals in the euryhaline fish Acanthopagrus latus, potentially associated with salinity adaptation [77]. Furthermore, this gene has been implicated in osmoregulatory processes in Scophthalmus maximus [78]. Based on the genetic distance matrix, significant differences in genetic distances among seven species for the arrdc3 gene are observed. Specifically, N. bathybius exhibits relatively lower divergence with N. virgatus and N. aurora, while showing generally higher genetic differences with other species. This pattern aligns with the phylogenetic affiliations as determined by their evolutionary history. The smallest genetic divergence between N. japonicus and N. marglnatus (0.0258) suggests that the function of the arrdc3 gene may be relatively conserved within this small evolutionary clade.
Fluctuations in water temperature critically impair the physiological functions of aquatic organisms, prompting teleosts to dynamically modulate physiological, biochemical, and molecular processes as adaptive strategies to thermal variations [60]. In this study, we also identified proteins with positive selection signals associated with temperature adaptation, such as Hip (Ka/Ks > 1, p < 0.05) and ISP2 (Ka/Ks > 3, p < 0.05). Heat shock proteins (HSPs) also called molecular chaperones, are expressed in response to heat or other forms of stress [79]. Hsp70 interacting protein (Hip) is a co-factor (co-chaperone) of the 70 kDa heat shock proteins (Hsc/Hsp70) [80]. The HSP70 gene family has been detected and identified in various species of teleost fish and is closely related to environmental responses, such as heat, hypoxia, and salinity stress [81,82,83]. Hip also has been associated with salinity acclimation/adaptation in teleosts [84]. st13 encodes the Hip protein, and genetic distance results indicate that the st13 gene exhibits an overall conserved pattern of genetic differentiation across seven species, with all pairwise genetic distances remaining at relatively low levels (0.0224–0.0697). Ice structure proteins (ISPs), also known as antifreeze proteins, can protect organisms from freezing temperatures [85]. AFPs enhance the ability of fish to resist freezing at low temperatures [86]. Studies have demonstrated that the large yellow croaker can synthesize ISP2 protein to protect the central neural system from cold stress [87]. Additionally, the genes ndufa1, ndufa3 and pcyt1a were also found to exhibit positive selection (Ka/Ks > 1). The genes ndufa3 and ndufa1 have been identified as potentially related to the adaptation of the threadfin breams to the low-temperature environment of the deep sea. In some teleost fish, the ability to synthesize ATP through oxidative phosphorylation is enhanced at lower temperatures [60]. The expression of ndufa3 also can facilitate adaptive metabolic adjustments in response to hypoxic environments in organisms [88]. The pcyt1a gene encodes phosphocholine cytidylyltransferase α (CCTα), which is considered to be involved in the lipid metabolism process of teleost fish [89]. Based on our findings, genus Nemipterus may modulate energy metabolism to adapt to temperature variations in its environment.
There are significant differences in physical environments between deep and shallow water, including water pressure. For aquatic organisms, the skeleton can adjust its structure to adapt to physiological stimuli or mechanical stress. The adaptation mechanisms involve multiple cellular signaling processes [90]. We have identified the ctsk gene as being under strong positive selection (Ka/Ks > 3) and this gene also exhibits low genetic distances among species pairs (0.00707–0.06364), indicating that its amino acid sequence may play a crucial fundamental biological role in the evolution within the Nemipterus genus. Additionally, the clustering of N. bathybius, N. virgatus, and N. aurora into one group, and N. japonicus and N. marginatus into another, further substantiates the reliability of the phylogenetic relationships within this genus. Cathepsin K (ctsk) is a cysteine protease predominantly produced by osteoclasts. It can mediate bone degradation and regulate skeletal growth [91]. A reduction in bone mass can help decrease body weight, which may enhance locomotor ability and swimming speed, as well as enable them to withstand the immense pressure of the deep sea [92]. Two additional positively selected genes associated with skeletal development are col6a2 and casp2. The col6a2 gene encodes the α2 chain of collagen type VI, which is an essential component of collagen type VI [93]. Collagen type VI plays a crucial role in maintaining the structural integrity and development of bones and soft tissues [94]. Previous studies have demonstrated that caspase-2 can also be directly involved in skeletal muscle differentiation and myogenesis [95]. The discovery of these genes reflects the molecular mechanisms by which the genus Nemipterus adapts to the high-pressure deep-sea environment through its skeletal system. In summary, our study demonstrates that the adaptation of the threadfin breams to environmental changes involves the regulation of numerous genes and proteins. The identification of these candidate genes provides a reference for further understanding the mechanisms driving the evolution of species within the genus Nemipterus.

4. Material and Methods

4.1. Sample Collection and Species Identification

All samples were collected from the South China Sea using a bottom trawl method, and the collected samples were identified to species where possible using morphological keys in taxonomic references. The morphological identification was primarily based on FAO catalog of genus Nemipterus [3] and Systematic Synopsis of Chinese Fishes [96] and then checked against photographs available on FishBase (http://www.fishbase.org; accessed on 18 October 2024). Furthermore, we employed DNA barcoding to confirm the species identification by comparing the sequences with those in GenBank. We used primers FishF1 (5′-TCA ACC AAC CAC AAA GAC ATT GGC AC-3′) and FishR1 (5′-TAG ACT TCT GGG TGG CCA AAG AAT CA-3′) to amplify the mitochondrial COI gene by PCR [48]. Then, we used Pentapodus caninus as an outgroup and constructed a maximum likelihood (ML) tree using IQ-Tree2 (version 2.2.2.6) (https://github.com/StaPH-B/docker-builds/pull/679; accessed on 20 October 2024).
One individual was collected for each species, specimens and environment information can be found in Table S3. These samples were sacrificed after anaesthetization with MS-222 (100 mg/L). Dorsal muscle tissue was sampled, frozen immediately in liquid nitrogen, and stored at −80 °C for subsequent experiments. Animal handling during sample collection complied with institutional standards (see Institutional Review Board Statement for full details).

4.2. RNA Extraction, cDNA Library Building and Illumina Sequencing

We collected muscle tissue samples from one individual of each species for RNA extraction. Total RNA was extracted using Trizol reagent kit (Invitrogen, Carlsbad, CA, USA) according to the manufacturer’s protocol. RNA degradation and contamination was assessed with 1% agarose gels. The RNA integrity was assessed on an Agilent 2100 Bioanalyzer (Agilent Technologies, Palo Alto, CA, USA). And the samples with RNA Integrity Number (RIN) ≥ 7 indicate that the integrity of the extracted RNA is sufficient for subsequent transcriptome sequencing requirements [97].
After total RNA was extracted, eukaryotic mRNA was enriched by Oligo(dT) beads, while prokaryotic mRNA was enriched by removing rRNA by Ribo-ZeroTM Magnetic Kit (Epicentre, Madison, WI, USA). Then, the enriched mRNA was fragmented into short fragments using fragmentation buffer and reverse transcribed into cDNA with random primers. Second-strand cDNA was synthesized by DNA polymerase I, RNase H, dNTP and buffer. Then, the cDNA fragments were purified with QiaQuick PCR extraction kit (Qiagen, Venlo, The Netherlands), end repaired, a base added, and ligated to Illumina sequencing adapters. The ligation products were size selected by agarose gel electrophoresis, PCR amplified, and sequenced using Illumina novaseq 6000 by Gene Denovo Biotechnology Co. (Guangzhou, China).

4.3. Transcriptome De Novo Assembly and Functional Annotation

The reads were filtered using fastp [98] (version 0.18.0) and clean reads were obtained by removing raw reads containing adapter, ploy-N (N ratio > 10%) and low quality reads containing more than 50% of low quality (Q-value ≤ 20) bases. Transcriptome de novo assembly was carried out with short reads assembling program-Trinity [99] (version 2.8.4), with the min_kmer_cov set to 2. The k-mer value was set to 25. Subsequently, we assessed the completeness of the assembly information using BUSCO software (version 3.0). To annotate the unigenes, we used BLASTx program (http://www.ncbi.nlm.nih.gov/BLAST/; accessed on 22 October 2024) with an E-value threshold of 1 × 10⁻⁵ to NCBI non-redundant protein (Nr) database (http://www.ncbi.nlm.nih.gov; accessed on 22 October 2024), the Swiss-Prot protein database (http://www.expasy.ch/sprot; accessed on 22 October 2024), the Kyoto Encyclopedia of Genes and Genomes (KEGG) database (http://www.genome.jp/kegg; accessed on 22 October 2024), and the COG/KOG database (http://www.ncbi.nlm.nih.gov/COG; accessed on 22 October 2024). Protein functional annotations could then be obtained according to the best alignment results.

4.4. Differential Gene Expression Analysis

We used the software package RSEM [100] (version 1.2.19) to estimate the gene expression levels for each species. First, read_count values of all genes were obtained by mapping clean data back onto the transcripts. Then, we calculated the TPM (Transcripts Per Kilobase of exon model per Million mapped reads) values. RNAs differential expression analysis was performed by DESeq2 (version 3.22) [101] software. The genes with the parameter of false discovery rate (FDR) below 0.05 and absolute fold change ≥ 2 were considered differentially expressed genes. We selected Pagrus major as the outgroup and used the default settings of the Diamond (version 2.1.12) [102] and OrthoMCL (version 2.0) [103] software to identify orthologous unigenes among species. After that the orthologous genes between species were classified into one protein family, other species specific genes were also classified into different families by OrthoMCL v2.0. The KEGG and GO function annotation and enrichment analysis of obtained specific genes of each species were then conducted. Following multiple testing correction, pathways with a Q-value of ≤0.05 are delineated as significantly enriched among differentially expressed proteins.

4.5. Single Copy Orthologous Gene Analysis

In gene family research, most studies are based on single-copy orthologous genes. Initially, multiple sequence alignment was performed on distinct protein sequences within the same single-copy orthologous gene family using MUSCLE (version 5.0) [104] software (http://www.drive5.com/muscle/; accessed on 24 October 2024). After sequence alignment, the evolutionary tree was constructed using NJ and ML methods. The NJ tree was constructed with MEGA [105], and the ML tree was constructed with iqtree [106]. Then, the Bootstrap method was used to test 1000 times to construct the final evolution trees. Estimating species divergence is conducted using the mcmctree (http://abacus.gene.ucl.ac.uk/software/paml.html; accessed on 24 October 2024) tool in the PAML [107] package. Given the considerable variation in depth distribution ranges among species within the genus Nemipterus, particularly the documented presence of N. bathybius and N. virgatus at depths exceeding 200 m [3,5]. Therefore, comparative transcriptomics was utilized and selection pressure analysis was conducted by calculating Ka, Ks, and the Ka/Ks ratio using paml-codeml. Positively selected genes exhibiting strong signatures were subsequently subjected to pairwise interspecific sequence divergence analysis in MEGA to explore the molecular mechanisms underlying the adaptation of this genus to deep-sea environments.

5. Conclusions

This study conducted de novo assembly and sequencing of the transcriptomes of seven species within the genus Nemipterus, enriching the genomic information of the genus. Furthermore, comparative transcriptome analysis was used to elucidate the phylogeny and estimate the divergence times of the seven species. Additionally, through Ka/Ks analysis, a number of genes responsive to environmental changes were identified. The results indicate that genes such as aqp1, arrdc3, ISP2, Hip, ndufa1, ndufa3, pcyt1a, ctsk, col6a2, casp2 exhibit faster evolutionary rates during long-term adaptation to deep-water environments. These genes may provide the species with advantages for survival and adaptation to environmental changes.

Supplementary Materials

The supporting information can be downloaded at: https://www.mdpi.com/article/10.3390/ijms26157118/s1.

Author Contributions

Conceptualization, Z.D., B.S. and Y.L.; methodology, Z.D., B.S. and L.W.; software, B.S., Z.D. and C.Y.; validation, B.S. and Z.D.; formal analysis, B.S. and Z.D.; investigation, L.W. and C.Y.; resources, Y.L. and Q.X.; data curation, M.L. and C.C.; writing—original draft preparation, Z.D.; writing—review and editing, B.S. and S.M.; visualization, Z.D.; supervision, B.S., Y.Z. and Q.W.; project administration, Q.W. and Y.Z.; funding acquisition, S.M. and Q.W. All authors have read and agreed to the published version of the manuscript.

Funding

This study was supported by the National Natural Science Foundation of China (NO. 42206109); the Asia Cooperation Fund Project—Modern fishery cooperation between China and neighboring countries around the South China Sea; and the Central Public-interest Scientific Institution Basal Research Fund, CAFS (NO. 2023TD93).

Institutional Review Board Statement

The study was conducted according to the guidelines of the Declaration of Helsinki, and approved by the Committee on Laboratory Animal Welfare and Ethics of South China Sea Fisheries Research Institute (protocol code nhdf 2024-11; 13 February 2025).

Data Availability Statement

The data presented in this study are available in this article.

Acknowledgments

We are grateful to Fei Tong for his assistance with sample collection and preservation.

Conflicts of Interest

The authors declare no conflicts of interest. The funders had no role in the design of the study; in the collection, analyses, or interpretation of data; in the writing of the manuscript; or in the decision to publish the results.

References

  1. Nelson, J.S.; Grande, T.C.; Wilson, M.V.H. Fishes of the World; John Wiley & Sons: Hoboken, NJ, USA, 2016. [Google Scholar] [CrossRef]
  2. Eschmeyer, W.N.; Fong, J.D. Species of Fishes by Family/Subfamily. Available online: http://research.calacademy.org/research/ichthyology/catalog/SpeciesBYFamily.asp (accessed on 15 September 2024).
  3. Russell, B.C. Nemipterid fishes of the world. FAO Fish. Synop. 1990, 12, I. [Google Scholar]
  4. Masuda, H.; Uyeno, T.; Yoshino, T. The Fishes of the Japanese Archipelago; Tokai University Press: Tokyo, Japan, 1984. [Google Scholar]
  5. Russell, B.C. A review of the threadfin breams of the genus Nemipterus (Nemipteridae) from Japan and Taiwan, with description of a new species. Jpn. J. Ichthyol. 1993, 39, 295–310. [Google Scholar] [CrossRef]
  6. Menezes, M.R.; Arolkar, U.; Rathod, V. Genetic relationships among five nemipterid fish species from the Indian coast using allozyme analysis. J. Fish Biol. 2002, 60, 1326–1330. [Google Scholar] [CrossRef]
  7. Joshi, K.K. Biology and population dynamics of Nemipterus mesoprion (Bleeker) off Cochin. Indian J. Fish. 2005, 52, 315–322. [Google Scholar]
  8. Ning, P.; Wu, R.; Liu, J. First record of red filament threadfin bream, Nemipterus marginatus (Valenciennes, 1830) (Perciformes, Nemipteridae), from Chinese waters. Chin. J. Oceanol. Limnol. 2011, 29, 1306–1308. [Google Scholar] [CrossRef]
  9. ElHaweet, A.E.A. Biological studies of the invasive species Nemipterus japonicus (Bloch, 1791) as a Red Sea immigrant into the Mediterranean. Egypt. J. Aquat. Res. 2013, 39, 267–274. [Google Scholar] [CrossRef]
  10. Erguden, D.; Turan, C.; Gurlek, M.; Yaglioglu, D.; Gungor, M. Age and growth of the Randall’s threadfin bream Nemipterus randalli (Russell, 1986), a recent Lessepsian migrant in Iskenderun Bay, northeastern Mediterranean. J. Appl. Ichthyol. 2010, 26, 441–444. [Google Scholar] [CrossRef]
  11. Russell, B.C.; Allen, G.R. Nemipteridae. In FAO Species Identification Guide for Fishery Purposes. The Living Marine Resources of the Western Central Pacific; FAO: Rome, Italy, 2001; Volume 5, pp. 3051–3089. [Google Scholar]
  12. Imtiaz, A.; Yen, D.T.; Nor, S.A.M.; Naim, D.M. Molecular identification of commercially important species of Nemipterus (Perciformes: Nemipteridae) in surrounding seas of Malaysia. Biodiversitas J. Biol. Divers. 2016, 17. [Google Scholar] [CrossRef]
  13. Hung, K.W.; Russell, B.C.; Chen, W.J. Molecular systematics of threadfin breams and relatives (Teleostei, Nemipteridae). Zool. Scr. 2017, 46, 536–551. [Google Scholar] [CrossRef]
  14. Ping, N. Taxonomy, Molecular Phylogeny, and Zoogeography of the Family Nemipteridae (Pisces: Perciformes) in China Seas. Ph.D. Thesis, University of Chinese Academy of Sciences (Institute of Oceanology), Qingdao, China, 2012. [Google Scholar]
  15. Jin, W. Fisheries Biology and Trophic Characteristics of Four Species of Nemipterus in the Beibu Gulf. Ph.D. Thesis, Guangdong Ocean University, Zhanjiang, China, 2023. [Google Scholar]
  16. Hoffmann, A.A.; Hercus, M.J. Environmental stress as an evolutionary force. Bioscience 2000, 50, 217–226. [Google Scholar] [CrossRef]
  17. Hoffmann, A.A.; Willi, Y. Detecting genetic responses to environmental change. Nat. Rev. Genet. 2008, 9, 421–432. [Google Scholar] [CrossRef] [PubMed]
  18. Xie, P.; Yi, S.K.; Yao, H.; Chi, W.; Guo, Y.; Ma, X.F.; Wang, H.P. Comparative transcriptome analysis reveals potential evolutionary differences in adaptation of temperature and body shape among four Percidae species. PLoS ONE 2019, 14, e0215933. [Google Scholar] [CrossRef] [PubMed]
  19. Ohlberger, J.; Mehner, T.; Staaks, G.; Hölker, F. Temperature-related physiological adaptations promote ecological divergence in a sympatric species pair of temperate freshwater fish, Coregonus spp. Funct. Ecol. 2008, 22, 501–508. [Google Scholar] [CrossRef]
  20. Chen, S.; Xiao, Y.; Xiao, Z.; Li, J.; Herrera-Ulloa, A. Suitable habitat shifts and ecological niche overlay assessments among benthic Oplegnathus species in response to climate change. Environ. Res. 2024, 252, 119129. [Google Scholar] [CrossRef] [PubMed]
  21. Lan, Y.; Sun, J.; Xu, T.; Chen, C.; Tian, R.; Qiu, J.W.; Qian, P.Y. De novo transcriptome assembly and positive selection analysis of an individual deep-sea fish. BMC Genom. 2018, 19, 394. [Google Scholar] [CrossRef] [PubMed]
  22. Samuel, M. Biology, age, growth and population dynamics of threadfin bream Nemipterus japonicus. J. Mar. Biol. Assoc. India. 1990, 32, 66–76. [Google Scholar]
  23. Kimoto, H.; Ibrahim, J. The Stock Status and Management Scheme of Kerisi (Nemipterus peronii) on the East Coast of Peninsular Malaysia; SEAFDEC/MFRDMD: Kuala Terengganu, Malaysia, 1996. [Google Scholar]
  24. Granada, V.P.; Masuda, Y.; Matsuoka, T. Age and growth of the yellowbelly threadfin bream Nemipterus bathybius in Kagoshima Bay, southern Japan. Fish. Sci. 2004, 70, 497–506. [Google Scholar] [CrossRef]
  25. Wu, C.C.; Weng, J.S.; Liu, K.M.; Su, W.C. Reproductive biology of the notchedfin threadfin bream, Nemipterus peronii (Nemipteridae), in waters of southwestern Taiwan. Zool. Stud.-TAIPEI 2008, 47, 103. [Google Scholar]
  26. Gandra, M.; Assis, J.; Martins, M.R.; Abecasis, D. Reduced global genetic differentiation of exploited marine fish species. Mol. Biol. Evol. 2021, 38, 1402–1412. [Google Scholar] [CrossRef] [PubMed]
  27. Ravitchandirane, V.; Geetha, V.; Ramya, V.; Janifer, B.; Thangaraj, M.; Subburaj, J.; Ramanadevi, V.; Ganesan, T. Molecular identification and phylogenetic relationships of Threadfin Breams (Family: Nemipteridae) using mtDNA marker. Not. Sci. Biol. 2012, 4, 13–18. [Google Scholar] [CrossRef]
  28. Ogwang, J.; Bariche, M.; Bos, A.R. Genetic diversity and phylogenetic relationships of threadfin breams (Nemipterus spp.) from the Red Sea and eastern Mediterranean Sea. Genome 2021, 64, 207–216. [Google Scholar] [CrossRef] [PubMed]
  29. Neenu, R.; Sandhya, S.; Anjaly, J.; Nisha, K.; Subal, K.R.; Shikha, R.; Shoba, J.K.; Gopalakrishnan, A. Population genetic structure of Randall’s threadfin bream Nemipterus randalli in Indian waters based on mitochondrial and nuclear gene sequences. Sci. Rep. 2024, 14, 7556. [Google Scholar] [CrossRef] [PubMed]
  30. Dong, L.; Huang, Z.; Li, Y.; Cheng, G. Sequence analysis of mitochondrial COI and Cytb gene of Nemipterus species in South China Sea. J. Fish. Sci. China 2012, 19, 355–363. [Google Scholar]
  31. Han, Y.; Gao, S.; Muegge, K.; Zhang, W.; Zhou, B. Advanced applications of RNA sequencing and challenges. Bioinform. Biol. Insights 2015, 9, BBI.S28991. [Google Scholar] [CrossRef] [PubMed]
  32. Jiang, Z.; Zhou, X.; Li, R.; Michal, J.J.; Zhang, S.; Dodson, M.V.; Zhang, Z.; Harland, R.M. Whole transcriptome analysis with sequencing: Methods, challenges and potential solutions. Cell. Mol. Life Sci. 2015, 72, 3425–3439. [Google Scholar] [CrossRef] [PubMed]
  33. Mutz, K.O.; Heilkenbrinker, A.; Lönne, M.; Walter, J.G.; Stahl, F. Transcriptome analysis using next-generation sequencing. Curr. Opin. Biotechnol. 2013, 24, 22–30. [Google Scholar] [CrossRef] [PubMed]
  34. Kukurba, K.R.; Montgomery, S.B. RNA sequencing and analysis. Cold Spring Harb. Protoc. 2015, 2015, pdb.top084970. [Google Scholar] [CrossRef] [PubMed]
  35. Trapnell, C.; Williams, B.A.; Pertea, G.; Mortazavi, A.; Kwan, G.; van Baren, M.J.; Salzberg, S.L.; Wold, B.J.; Pachter, L. Transcript assembly and quantification by RNA-Seq reveals unannotated transcripts and isoform switching during cell differentiation. Nat. Biotechnol. 2010, 28, 511–515. [Google Scholar] [CrossRef] [PubMed]
  36. Chatchaiphan, S.; Srisapoome, P.; Kim, J.H.; Devlin, R.H.; Na-Nakorn, U. De novo transcriptome characterization and growth-related gene expression profiling of diploid and triploid bighead catfish (Clarias macrocephalus Günther, 1864). Mar. Biotechnol. 2017, 19, 36–48. [Google Scholar] [CrossRef] [PubMed]
  37. Tirosh, I.; Weinberger, A.; Carmi, M.; Barkai, N. A genetic signature of interspecies variations in gene expression. Nat. Genet. 2006, 38, 830–834. [Google Scholar] [CrossRef] [PubMed]
  38. Ekblom, R.; Galindo, J. Applications of next generation sequencing in molecular ecology of non-model organisms. Heredity 2011, 107, 1–15. [Google Scholar] [CrossRef] [PubMed]
  39. Wolf, J.B.W. Principles of transcriptome analysis and gene expression quantification: An RNA-seq tutorial. Mol. Ecol. Resour. 2013, 13, 559–572. [Google Scholar] [CrossRef] [PubMed]
  40. Goncalves, P.; Jones, D.B.; Thompson, E.L.; Parker, L.M.; Ross, P.M.; Raftos, D.A. Transcriptomic profiling of adaptive responses to ocean acidification. Mol. Ecol. 2017, 26, 5974–5988. [Google Scholar] [CrossRef] [PubMed]
  41. Raj, N.; Sukumaran, S.; Mukundan, L.; Jose, A.; Mary, S.; Nisha, K.; Gopalakrishnan, A. Complete mitochondrial genome profile of Randall’s threadfin bream, Nemipterus randalli and its phylogenetic analysis. Curr. Sci. 2024, 127, 322–332. [Google Scholar] [CrossRef]
  42. Wu, Z.; Li, X. Complete mitochondrial genome of the Nemipterus virgatus (Perciformes: Nemipteridae). Mitochondrial DNA Part A 2016, 27, 3485–3486. [Google Scholar] [CrossRef] [PubMed]
  43. Li, Y.; Chen, J.; Yan, B.; Meng, X. The complete mitochondrial genome of the Japanese threadfin bream, Nemipterus japonicus (Teleostei, Nemipteridae). Mitochondrial DNA Part A 2016, 27, 429–430. [Google Scholar] [CrossRef] [PubMed]
  44. Song, H.Y.; Jung, Y.H.; Choi, Y.J.; Kim, B.; Nguyen, T.V.; Lee, D.S. Characterization of the complete mitochondrial genome of the fork-tailed threadfin bream, Nemipterus furcosus (Spariformes, Nemipteridae) and phylogenetic analysis. Mitochondrial DNA Part B 2020, 5, 3130–3131. [Google Scholar] [CrossRef] [PubMed]
  45. Yang, Z.; Nielsen, R. Estimating synonymous and nonsynonymous substitution rates under realistic evolutionary models. Mol. Biol. Evol. 2000, 17, 32–43. [Google Scholar] [CrossRef] [PubMed]
  46. Koonin, E.V. Evolution of genome architecture. Int. J. Biochem. Cell Biol. 2009, 41, 298–306. [Google Scholar] [CrossRef] [PubMed]
  47. Hebert, P.D.N.; Cywinska, A.; Ball, S.L.; DeWaard, J.R. Biological identifications through DNA barcodes. Proc. R. Soc. Lond. Ser. B Biol. Sci. 2003, 270, 313–321. [Google Scholar] [CrossRef] [PubMed]
  48. Ward, R.D.; Zemlak, T.S.; Innes, B.H.; Last, P.R.; Hebert, P.D. DNA barcoding Australia’s fish species. Philos. Trans. R. Soc. B Biol. Sci. 2005, 360, 1847–1857. [Google Scholar] [CrossRef] [PubMed]
  49. Liang, R.; Chen, D.; Su, G.; Zhou, M.; Wu, Z.; Zou, J. Molecular phylogenetic relationships of 15 species of the family Nemipteridae based on COI and RAG2 gene sequences. J. Ocean. Univ. China (Nat. Sci. Ed.) 2017, 47, 74–81. [Google Scholar]
  50. Villafaña, J.A.; Rivadeneira, M.M. Rise and fall in diversity of Neogene marine vertebrates on the temperate Pacific coast of South America. Paleobiology 2014, 40, 659–674. [Google Scholar] [CrossRef] [PubMed]
  51. Obura, D.O. An Indian Ocean centre of origin revisited: Palaeogene and Neogene influences defining a biogeographic realm. J. Biogeogr. 2016, 43, 229–242. [Google Scholar] [CrossRef]
  52. Zachos, J.; Pagani, M.; Sloan, L.; Thomas, E.; Billups, K. Trends, rhythms, and aberrations in global climate 65 Ma to present. Science 2001, 292, 686–693. [Google Scholar] [CrossRef] [PubMed]
  53. Valentine, J.W. Neogene marine climate trends: Implications for biogeography and evolution of the shallow-sea biota. Geology 1984, 12, 647–650. [Google Scholar] [CrossRef]
  54. Lo, P.C.; Liu, S.H.; Chao, N.L.; Nunoo, F.K.; Mok, H.K.; Chen, W.J. A multi-gene dataset reveals a tropical New World origin and Early Miocene diversification of croakers (Perciformes: Sciaenidae). Mol. Phylogenetics Evol. 2015, 88, 132–143. [Google Scholar] [CrossRef] [PubMed]
  55. Floeter, S.R.; Bender, M.G.; Siqueira, A.C.; Cowman, P.F. Phylogenetic perspectives on reef fish functional traits. Biol. Rev. 2018, 93, 131–151. [Google Scholar] [CrossRef] [PubMed]
  56. Miao, J.; Feng, J.; Liu, X.; Yan, C.; Ye, Y.; Li, J.; Xu, K.; Guo, B.; Lü, Z. Sequence comparison of the mitochondrial genomes of five brackish water species of the family Neritidae: Phylogenetic implications and divergence time estimation. Ecol. Evol. 2022, 12, e8984. [Google Scholar] [CrossRef] [PubMed]
  57. Gaither, M.R.; Violi, B.; Gray, H.W.I.; Neat, F.; Drazen, J.C.; Grubbs, R.D.; Roa-Varón, A.; Sutton, T.; Hoelzel, A.R. Depth as a driver of evolution in the deep sea: Insights from grenadiers (Gadiformes: Macrouridae) of the genus Coryphaenoides. Mol. Phylogenet. Evol. 2016, 104, 73–82. [Google Scholar] [CrossRef] [PubMed]
  58. Hall, S.; Thatje, S. Global bottlenecks in the distribution of marine Crustacea: Temperature constraints in the family Lithodidae. J. Biogeogr. 2009, 36, 2125–2135. [Google Scholar] [CrossRef]
  59. Brown, A.; Thatje, S. Explaining bathymetric diversity patterns in marine benthic invertebrates and demersal fishes: Physiological contributions to adaptation of life at depth. Biol. Rev. 2014, 89, 406–426. [Google Scholar] [CrossRef] [PubMed]
  60. Gracey, A.Y.; Fraser, E.J.; Li, W.; Fang, Y.; Taylor, R.R.; Rogers, J.; Brass, A.; Cossins, A.R. Coping with cold: An integrative, multitissue analysis of the transcriptome of a poikilothermic vertebrate. Proc. Natl. Acad. Sci. USA 2004, 101, 16970–16975. [Google Scholar] [CrossRef] [PubMed]
  61. Barton, B.A. Stress in fishes: A diversity of responses with particular reference to changes in circulating corticosteroids. Integr. Comp. Biol. 2002, 42, 517–525. [Google Scholar] [CrossRef] [PubMed]
  62. Xu, D.; You, Q.; Chi, C.; Luo, S.; Song, H.; Lou, B.; Takeuchi, Y. Transcriptional response to low temperature in the yellow drum (Nibea albiflora) and identification of genes related to cold stress. Comp. Biochem. Physiol. Part D Genom. Proteom. 2018, 28, 80–89. [Google Scholar] [CrossRef] [PubMed]
  63. Yancey, P.H. Cellular responses in marine animals to hydrostatic pressure. J. Exp. Zool. Part A Ecol. Integr. Physiol. 2020, 333, 398–420. [Google Scholar] [CrossRef] [PubMed]
  64. Robison, B.H. Deep pelagic biology. J. Exp. Mar. Biol. Ecol. 2004, 300, 253–272. [Google Scholar] [CrossRef]
  65. Martinez, C.M.; Friedman, S.T.; Corn, K.A.; Larouche, O.; Price, S.A.; Wainwright, P.C. The deep sea is a hot spot of fish body shape evolution. Ecol. Lett. 2021, 24, 1788–1799. [Google Scholar] [CrossRef] [PubMed]
  66. Evans, D.H. Teleost fish osmoregulation: What have we learned since August Krogh, Homer Smith, and Ancel Keys. Am. J. Physiol.-Regul. Integr. Comp. Physiol. 2008, 295, R704–R713. [Google Scholar] [CrossRef] [PubMed]
  67. Thao, H.N.; Thu, T.T.; Ly, N.T.; Hong, D.T. Distribution of Nemipterus marginatus (Valenciennes, 1830) (Nemipteridae, Perciformes) in the estuary and coastal areas of North Central, Vietnam. Check List 2022, 18, 1127–1130. [Google Scholar] [CrossRef]
  68. van Os, C.H.; Kamsteeg, E.J.; Marr, N.; Deen, P.M. Physiological relevance of aquaporins: Luxury or necessity? Pflüg. Arch. 2000, 440, 513–520. [Google Scholar] [CrossRef] [PubMed]
  69. Benga, G. The first discovered water channel protein, later called aquaporin 1: Molecular characteristics, functions and medical implications. Mol. Asp. Med. 2012, 33, 518–534. [Google Scholar] [CrossRef] [PubMed]
  70. Umenishi, F.; Schrier, R.W. Hypertonicity-induced aquaporin-1 (AQP1) expression is mediated by the activation of MAPK pathways and hypertonicity-responsive element in the AQP1 gene. J. Biol. Chem. 2003, 278, 15765–15770. [Google Scholar] [CrossRef] [PubMed]
  71. Cutler, C.P.; Cramb, G. Molecular physiology of osmoregulation in eels and other teleosts: The role of transporter isoforms and gene duplication. Comp. Biochem. Physiol. Part A Mol. Integr. Physiol. 2001, 130, 551–564. [Google Scholar] [CrossRef] [PubMed]
  72. Iandiev, I.; Pannicke, T.; Reichel, M.B.; Wiedemann, P.; Reichenbach, A.; Bringmann, A. Expression of aquaporin-1 immunoreactivity by photoreceptor cells in the mouse retina. Neurosci. Lett. 2005, 388, 96–99. [Google Scholar] [CrossRef] [PubMed]
  73. Stamer, W.D.; Bok, D.; Hu, J.; Jaffe, G.J.; McKay, B.S. Aquaporin-1 channels in human retinal pigment epithelium: Role in transepithelial water movement. Investig. Ophthalmol. Vis. Sci. 2003, 44, 2803–2808. [Google Scholar] [CrossRef] [PubMed]
  74. Hombrebueno, J.R.; Lee, E.J.; Martínez-Ruiz, N.; García-Alcázar, A.; Grzywacz, N.M.; De Juan, J. Aquaporin-4 immunoreactivity in Müller and amacrine cells of marine teleost fish retina. Brain Res. 2012, 1432, 46–55. [Google Scholar] [CrossRef] [PubMed]
  75. Alvarez, C.E. On the origins of arrestin and rhodopsin. BMC Evol. Biol. 2008, 8, 222. [Google Scholar] [CrossRef] [PubMed]
  76. Patwari, P.; Emilsson, V.; Schadt, E.E.; Chutkow, W.A.; Lee, S.; Marsili, A.; Zhang, Y.; Dobrin, R.; Cohen, D.E.; Larsen, P.R.; et al. The arrestin domain-containing 3 protein regulates body mass and energy expenditure. Cell Metab. 2011, 14, 671–683. [Google Scholar] [CrossRef] [PubMed]
  77. Zhu, K.; Zhang, N.; Liu, B.S.; Guo, L.; Guo, H.Y.; Jiang, S.G.; Zhang, D.C. A chromosome-level genome assembly of the yellowfin seabream (Acanthopagrus latus; Hottuyn, 1782) provides insights into its osmoregulation and sex reversal. Genomics 2021, 113, 1617–1627. [Google Scholar] [CrossRef] [PubMed]
  78. Cui, W.; Ma, A.; Huang, Z.; Wang, X.; Liu, Z.; Xia, D.; Yang, S.; Zhao, T. Comparative transcriptomic analysis reveals mechanisms of divergence in osmotic regulation of the turbot Scophthalmus maximus. Fish Physiol. Biochem. 2020, 46, 1519–1536. [Google Scholar] [CrossRef] [PubMed]
  79. Feder, M.E.; Hofmann, G.E. Heat-shock proteins, molecular chaperones, and the stress response: Evolutionary and ecological physiology. Annu. Rev. Physiol. 1999, 61, 243–282. [Google Scholar] [CrossRef] [PubMed]
  80. Shi, Z.; Zhang, J.; Zheng, S. What we know about ST13, a co-factor of heat shock protein, or a tumor suppressor? J. Zhejiang Univ. Sci. B 2007, 8, 170–176. [Google Scholar] [CrossRef] [PubMed]
  81. Zheng, W.; Xu, X.; Chen, Y.; Wang, J.; Zhang, T.; E, Z.; Chen, S.; Liu, Y. Genome-wide identification, molecular characterization, and involvement in response to abiotic and biotic stresses of the hsp70 gene family in turbot (Scophthalmus maximus). Int. J. Mol. Sci. 2023, 24, 6025. [Google Scholar] [CrossRef] [PubMed]
  82. Deng, Z.; Liu, H.; He, C.; Shou, C.; Han, Z. Heat shock protein 70 (Hsp70) and heat shock transcription factor (Hsf) gene families in Cynoglossus semilaevis: Genome-wide identification and correlation analysis in response to low salinity stress. Mar. Freshw. Res. 2021, 72, 1132–1141. [Google Scholar] [CrossRef]
  83. Sun, Y.; Wen, H.; Tian, Y.; Mao, X.; Li, X.; Li, J.; Hu, Y.; Liu, Y.; Li, J.; Li, Y. HSP90 and HSP70 families in Lateolabrax maculatus: Genome-wide identification, molecular characterization, and expression profiles in response to various environmental stressors. Front. Physiol. 2021, 12, 784803. [Google Scholar] [CrossRef] [PubMed]
  84. Papakostas, S.; Vasemaegi, A.; Vähä, J.P.; Himberg, M.; Peil, L.; Primmer, C.R. A proteomics approach reveals divergent molecular responses to salinity in populations of European whitefish (Coregonus lavaretus). Mol. Ecol. 2012, 21, 3516–3530. [Google Scholar] [CrossRef] [PubMed]
  85. DeVries, A.L.; Wohlschlag, D.E. Freezing resistance in some Antarctic fishes. Science 1969, 163, 1073–1075. [Google Scholar] [CrossRef] [PubMed]
  86. Du, X.; Li, H.; Dong, C.; Ren, Y.; Pan, N.; Kong, B.; Liu, H.; Xia, X. Effect of ice structuring protein on the microstructure and myofibrillar protein structure of mirror carp (Cyprinus carpio L.) induced by freeze-thaw processes. Lwt 2021, 139, 110570. [Google Scholar] [CrossRef]
  87. Qian, B. Molecular characterization and mRNA expression of ISP2 and ISP4 in the Large Yellow Croaker (Larimichthys Crocea) under acute cold stress. Res. Sq. 2021. [Google Scholar] [CrossRef]
  88. Martos-Sitcha, J.A.; Bermejo-Nogales, A.; Calduch-Giner, J.A.; Pérez-Sánchez, J. Gene expression profiling of whole blood cells supports a more efficient mitochondrial respiration in hypoxia-challenged gilthead sea bream (Sparus aurata). Front. Zool. 2017, 14, 34. [Google Scholar] [CrossRef] [PubMed]
  89. Cai, Z.; Mai, K.; Ai, Q. Regulation of hepatic lipid deposition by phospholipid in large yellow croaker. Br. J. Nutr. 2017, 118, 999–1009. [Google Scholar] [CrossRef] [PubMed]
  90. Turner, C.H.; Pavalko, F.M. Mechanotransduction and functional response of the skeleton to physical stress: The mechanisms and mechanics of bone adaptation. J. Orthop. Sci. 1998, 3, 346–355. [Google Scholar] [CrossRef] [PubMed]
  91. Konttinen, Y.T.; Ma, J.; Ruuttilal, P.; Hukkanen, M.; Santavirta, S. Chondrocyte-mediated collagenolysis correlates with cartilage destruction grades in osteoarthritis. Clin. Exp. Rheumatol. 2005, 23, 19–26. [Google Scholar] [PubMed]
  92. Pradillon, F.; Gaill, F. Pressure and life: Some biological strategies. Life Extrem. Environ. 2006, 341–355. [Google Scholar] [CrossRef]
  93. Myllyharju, J.; Kivirikko, K.I. Collagens and collagen-related diseases. Ann. Med. 2001, 33, 7–21. [Google Scholar] [CrossRef] [PubMed]
  94. Alexopoulos, L.G.; Youn, I.; Bonaldo, P.; Guilak, F. Developmental and osteoarthritic changes in Col6a1-knockout mice: Biomechanics of type VI collagen in the cartilage pericellular matrix. Arthritis Rheum. Off. J. Am. Coll. Rheumatol. 2009, 60, 771–779. [Google Scholar] [CrossRef] [PubMed]
  95. Boonstra, K.; Bloemberg, D.; Quadrilatero, J. Caspase-2 is required for skeletal muscle differentiation and myogenesis. Biochim. Biophys. Acta (BBA)-Mol. Cell Res. 2018, 1865, 95–104. [Google Scholar] [CrossRef] [PubMed]
  96. Cheng, Q.T.; Zheng, B.S. Systematic Synopsis of Chinese Fishes; Science Press: Beijing, China, 1987; pp. 339–341. [Google Scholar]
  97. Schroeder, A.; Mueller, O.; Stocker, S.; Salowsky, R.; Leiber, M.; Gassmann, M.; Lightfoot, S.; Menzel, W.; Granzow, M.; Ragg, T. The RIN: An RNA integrity number for assigning integrity values to RNA measurements. BMC Mol. Biol. 2006, 7, 3. [Google Scholar] [CrossRef] [PubMed]
  98. Chen, S.; Zhou, Y.; Chen, Y.; Gu, J. fastp: An ultra-fast all-in-one FASTQ preprocessor. BioRxiv 2018, 34, 274100. [Google Scholar] [CrossRef] [PubMed]
  99. Grabherr, M.G.; Haas, B.J.; Yassour, M.; Levin, J.Z.; Thompson, D.A.; Amit, I.; Adiconis, X.; Fan, L.; Raychowdhury, R.; Zeng, Q.; et al. Full-length transcriptome assembly from RNA-Seq data without a reference genome. Nat. Biotechnol. 2011, 29, 644. [Google Scholar] [CrossRef] [PubMed]
  100. Li, B.; Dewey, C.N. RSEM: Accurate transcript quantification from RNA-Seq data with or without a reference genome. BMC Bioinform. 2011, 12, 323. [Google Scholar] [CrossRef] [PubMed]
  101. Love, M.I.; Huber, W.; Anders, S. Moderated estimation of fold change and dispersion for RNAseq data with DESeq2. Genome Biol. 2014, 15, 550. [Google Scholar] [CrossRef] [PubMed]
  102. Buchfink, B.; Xie, C.; Huson, D.H. Fast and sensitive protein alignment using DIAMOND. Nat. Methods 2015, 12, 59. [Google Scholar] [CrossRef] [PubMed]
  103. Li, L.; Stoeckert, C.J.; Roos, D.S. OrthoMCL: Identification of ortholog groups for eukaryotic genomes. Genome Res. 2003, 13, 2178–2189. [Google Scholar] [CrossRef] [PubMed]
  104. Edgar, R.C. MUSCLE: Multiple sequence alignment with high accuracy and high throughput. Nucleic Acids Res. 2004, 32, 1792–1797. [Google Scholar] [CrossRef] [PubMed]
  105. Kumar, S.; Tamura, K.; Nei, M. MEGA: Molecular evolutionary genetics analysis software for microcomputers. Bioinformatics 1994, 10, 189–191. [Google Scholar] [CrossRef] [PubMed]
  106. Nguyen, L.T.; Schmidt, H.A.; von Haeseler, A.; Minh, B.Q. IQ-TREE: A fast and effective stochastic algorithm for estimating maximum-likelihood phylogenies. Mol. Biol. Evol. 2014, 32, 268–274. [Google Scholar] [CrossRef] [PubMed]
  107. Yang, Z. PAML: A program package for phylogenetic analysis by maximum likelihood. Bioinformatics 1997, 13, 555–556. [Google Scholar] [CrossRef] [PubMed]
Figure 1. ML tree based on the analysis of COI sequences from seven species of Nemipterus. Note: Bootstrap values are shown near the nodes. The pictures in the phylogenetic tree were taken from samples collected in the Beibu Gulf, with the pictures of N. aurora were downloaded from Fishbase.
Ijms 26 07118 g001
Figure 2. Histogram of the KOG annotations of unigenes in seven species. Note: The capital letters on the x-axis symbolize 25 biological processes, as shown on the right side and the y-axis represents the number of genes. Bars with different colors represent different species.
Ijms 26 07118 g002
Figure 3. Histogram of the GO annotations of unigenes in seven species. Note: The x-axis represents GO terms number of genes and the y-axis represents GO terms belonging to three categories. Bars with different colors represent different species.
Ijms 26 07118 g003
Figure 4. Histogram of the KEGG annotations of unigenes in seven species. Note: The x-axis represents the number of genes annotated to the KEGG pathways and the y-axis represents pathways in KEGG annotations. Bars with different colors represent different species.
Ijms 26 07118 g004
Figure 5. GO enrichment analysis of unique genes in seven species. Note: (a): N. bathybius; (b): N. furcosus; (c): N. nemurus; (d): N. virgatus; (e): N. aurora; (f): N. japonicus; (g): N. marginatus.
Ijms 26 07118 g005
Figure 6. KEGG enrichment analysis of unique genes in seven species. Note: (a): N. bathybius; (b): N. furcosus; (c): N. nemurus; (d): N. virgatus; (e): N. aurora; (f): N. japonicus; (g): N. marginatus.
Ijms 26 07118 g006
Figure 7. Phylogenetic tree and divergence times estimated of seven species of Nemipterus and P. major. Note: The content within parentheses under the species names represents the depth range of distribution for each species.
Ijms 26 07118 g007
Figure 8. Violin plot comparing the Ka/Ks ratios across three groups (p < 0.05). Note: The x-axis represents different groups and the y-axis represents the Ka/Ks values. In the figure, asterisks “***” denote statistical significance with a p-value less than 0.001, whereas “NS.” signifies “Not Significant” indicating no statistically significant difference.
Ijms 26 07118 g008
Figure 9. Volcano plot based on the foreground branch Ka/Ks values analysis. Note: The x-axis represents the Ka/Ks value and the y-axis represents the −log10-transformed p value. The red dots indicate positively selected genes. The horizontal dashed line corresponds to a p-value of 0.05, and the vertical dashed line indicates a Ka/Ks value of 0.5.
Ijms 26 07118 g009
Table 1. The sequencing information of transcriptomics.
SampleRaw ReadsClean ReadsClean Reads Ratio (%)Clean Bases (bp)Clean Reads Q20 (%)Clean Reads Q30 (%)
N. bathybius48,063,78447,827,82499.517,144,556,37098.0194.45
N. furcosus55,724,92455,422,05099.468,274,446,96397.7593.92
N. nemurus52,998,37452,690,59299.427,869,665,82297.6593.62
N. virgatus51,121,27250,875,27699.527,607,939,56197.9494.26
N. aurora46,469,25846,255,04899.546,915,888,87397.8294.03
N. japonicus49,153,73448,869,97699.427,311,785,45397.1392.37
N. marginatus41,533,57641,302,03499.446,177,399,99997.1692.40
Table 2. Statistics for the assembled unigenes.
SampleTotal NumberMax LengthMin LengthMean LengthN50GC (%)
N. bathybius32,66133,374201794120549.21
N. furcosus37,90437,710201877140049.27
N. nemurus38,34260,447201971170148.06
N. virgatus41,02443,285201877143348.55
N. aurora34,88270,2862011096195848.57
N. japonicus40,03667,5202011177216547.88
N. marginatus51,54051,855201965187247.73
Table 3. Numbers of unigenes annotated in the muscle tissues of seven species within the genus Nemipterus against four databases.
N. bathybiusN. furcosusN. nemurusN. virgatusN. auroraN. japonicusN. marginatus
NR20,641
(63.20%)
22,907
(60.43%)
22,637
(59.04%)
25,751
(62.77%)
22,016
(63.12%)
24,115
(60.23%)
28,636
(55.56%)
KEGG20,291
(62.13%)
22,596
(59.61%)
22,248
(58.03%)
25,356
(61.81%)
21,708
(62.23%)
23,673
(59.13%)
28,058
(54.44%)
KOG13,648
(41.79%)
15,293
(40.35%)
14,915
(38.90%)
16,582
(40.42%)
14,802
(42.43%)
15,348
(38.34%)
18,562
(36.01%)
Swiss-Prot16,878
(51.68%)
18,962
(50.03%)
18,567
(48.42%)
20,761
(50.61%)
18,397
(52.74%)
19,404
(48.47%)
23,225
(45.06%)
annotation genes20,858
(63.86%)
23,178
(61.15%)
22,842
(59.57%)
25,948
(63.25%)
22,331
(64.02%)
24,154
(60.33%)
28,699
(55.68%)
Note: The percentages of unigenes annotated against each database among all unigenes are shown in parentheses.
Disclaimer/Publisher’s Note: The statements, opinions and data contained in all publications are solely those of the individual author(s) and contributor(s) and not of MDPI and/or the editor(s). MDPI and/or the editor(s) disclaim responsibility for any injury to people or property resulting from any ideas, methods, instructions or products referred to in the content.

