
Phenotype Differences Between ATP13A2 Heterozygous and Knockout Mice Across Aging

 ,
,
Abstract
1. Introduction
2. Results
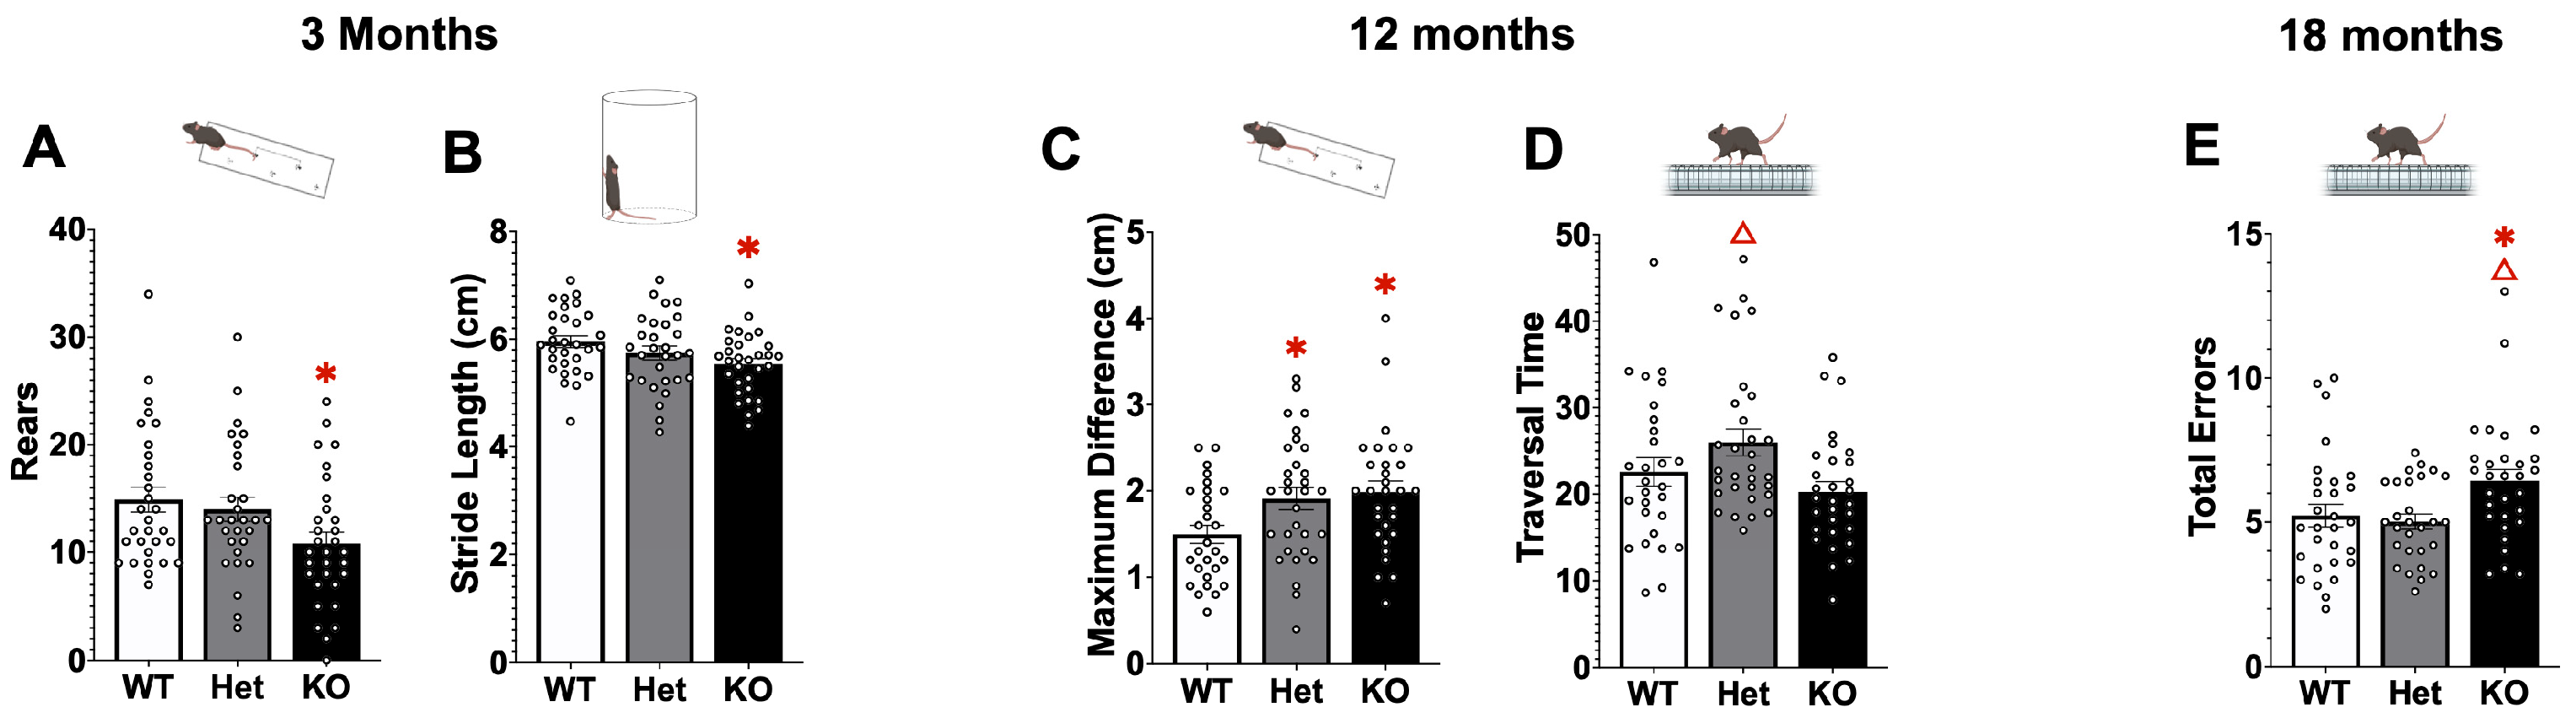
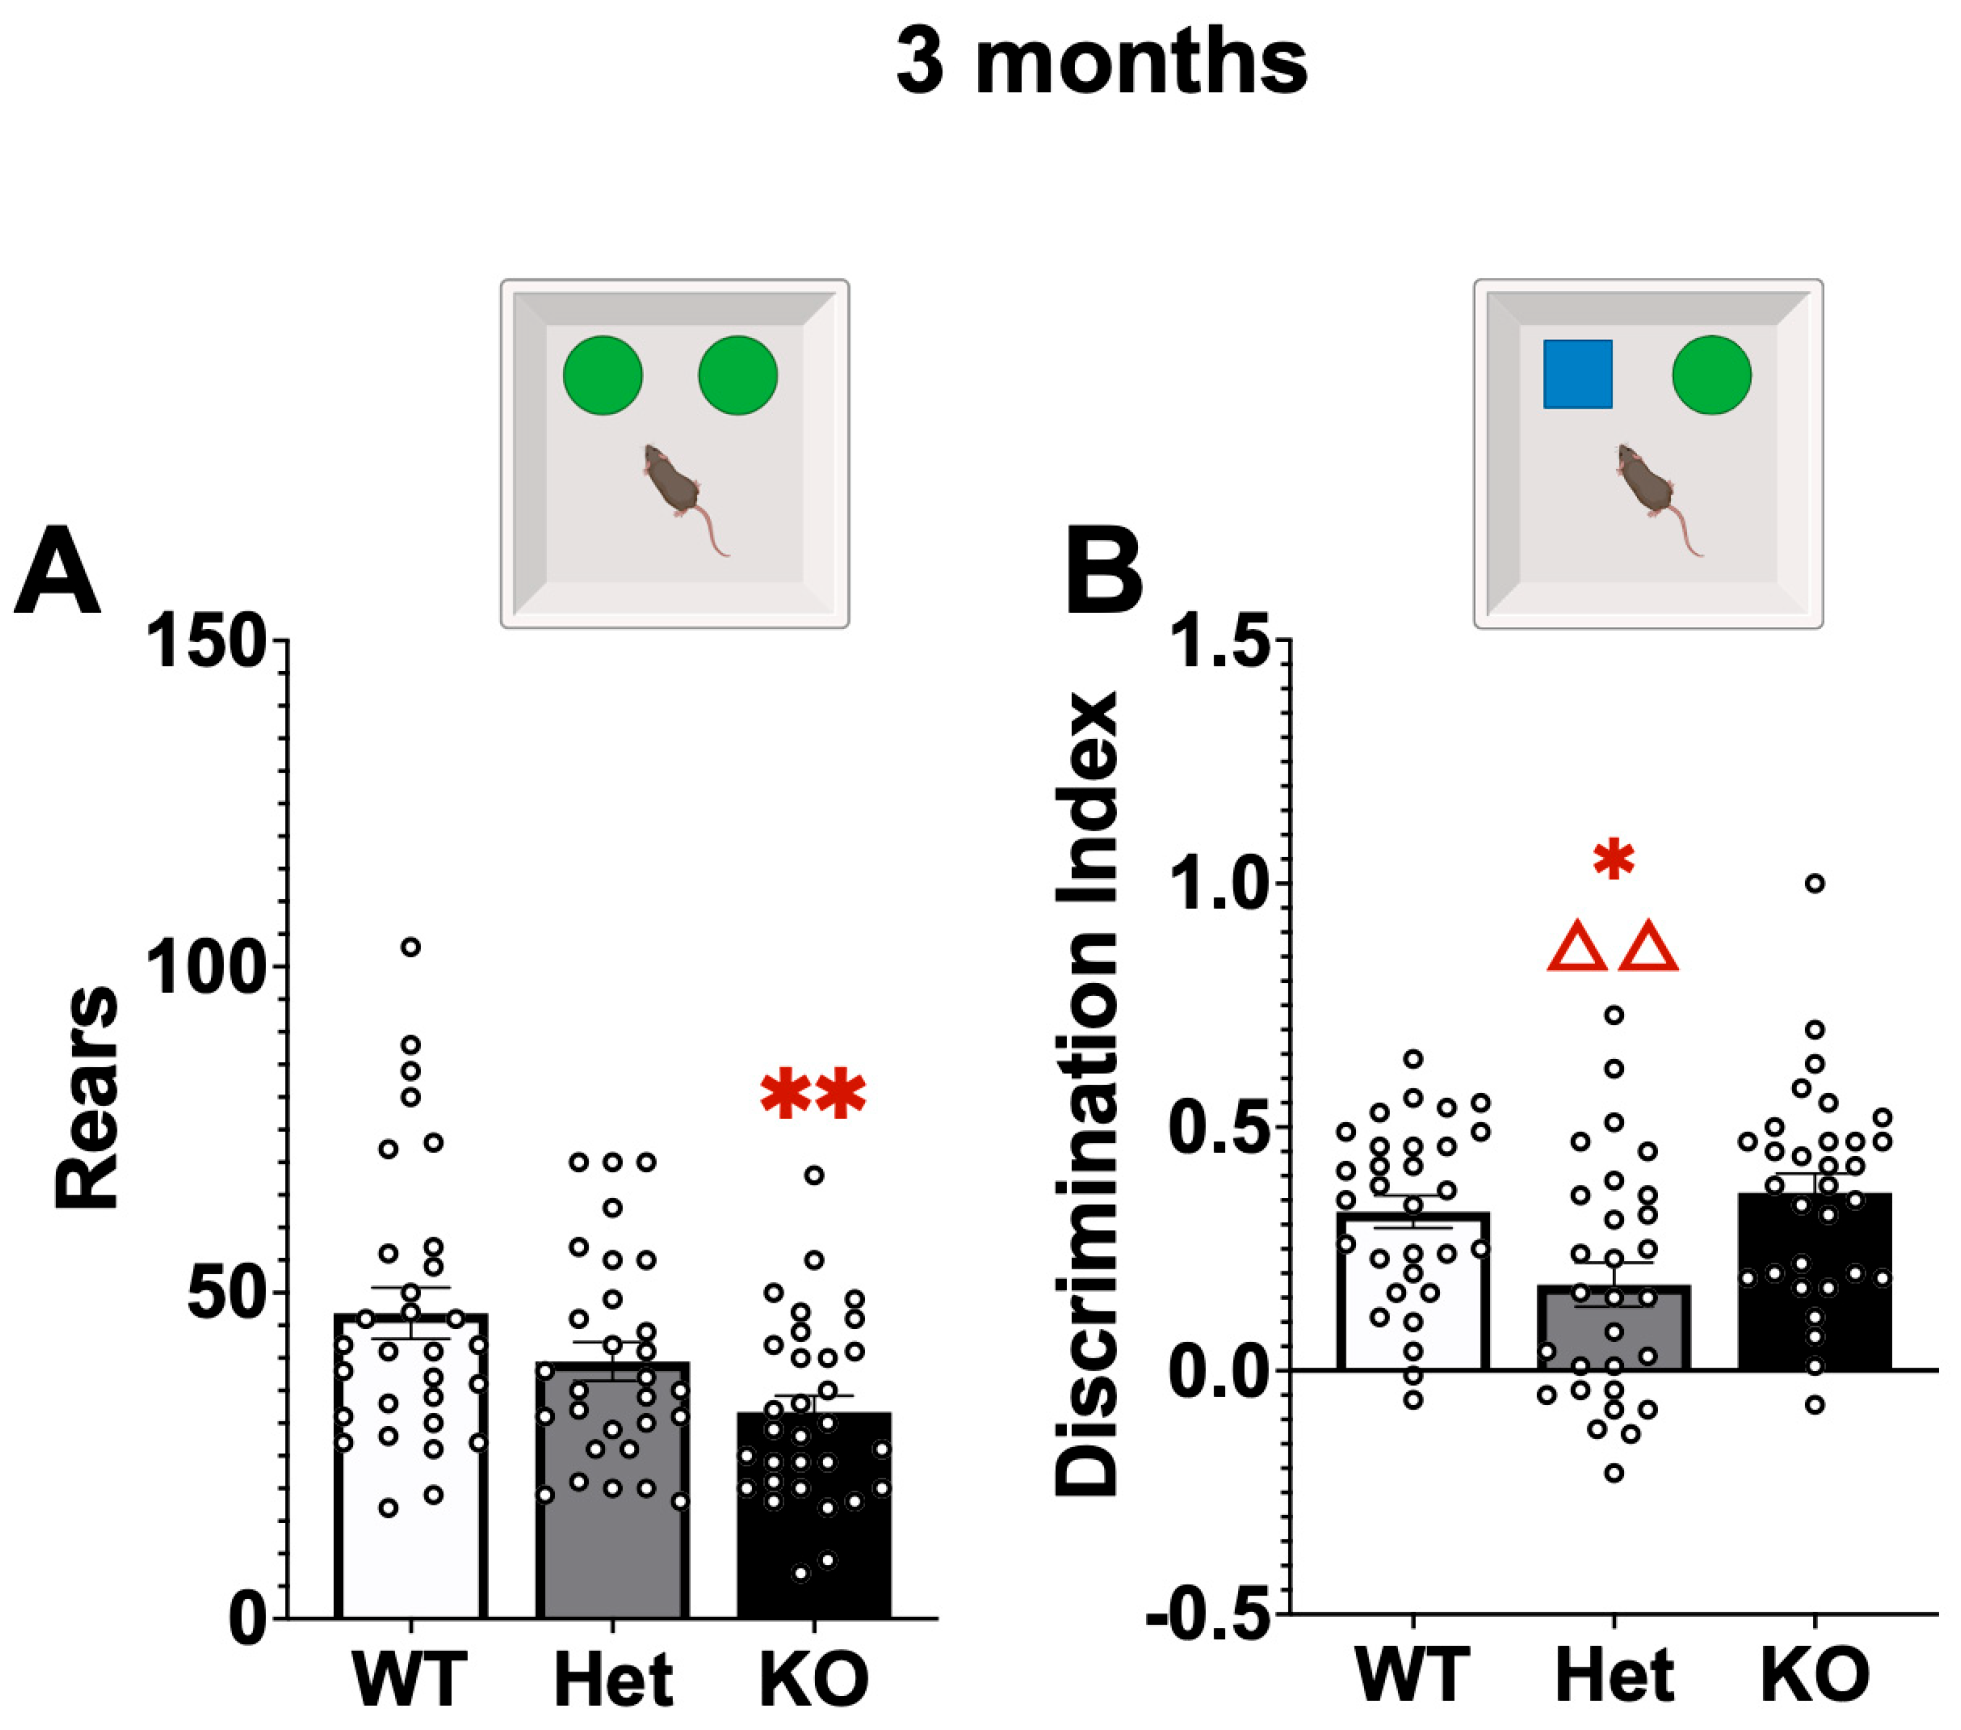
2.1. Behavior
2.2. Real Time qPCR
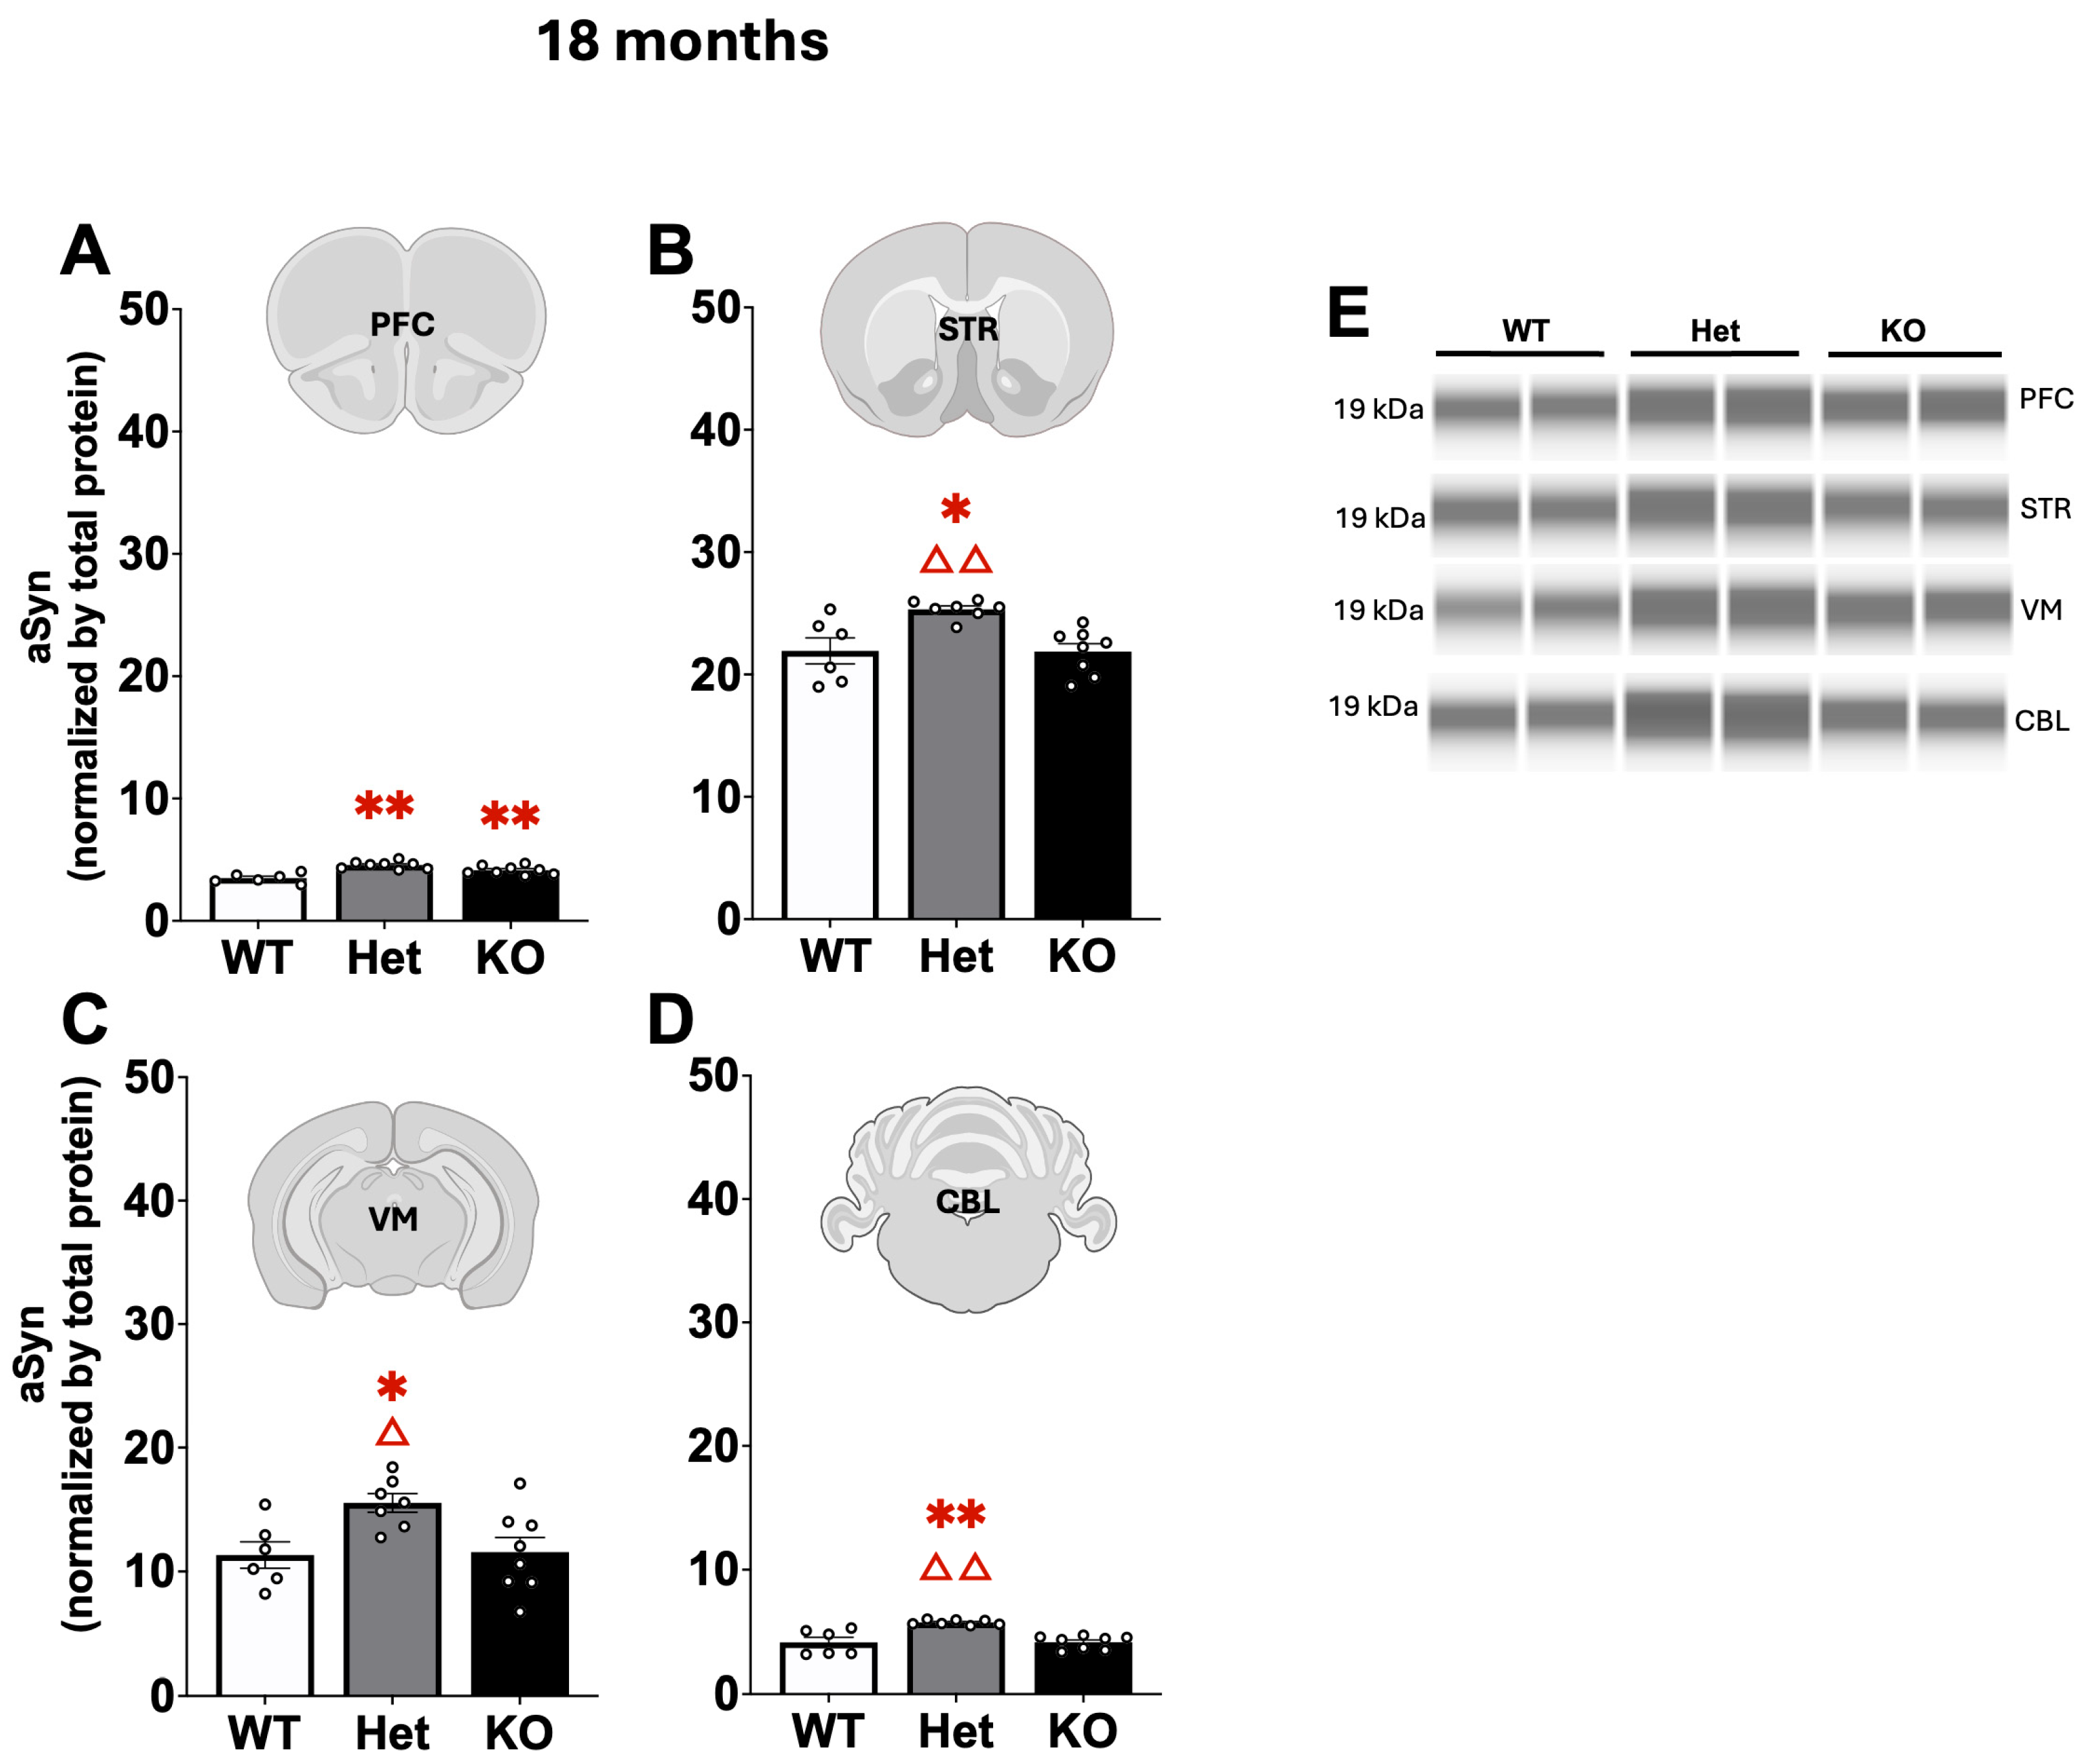
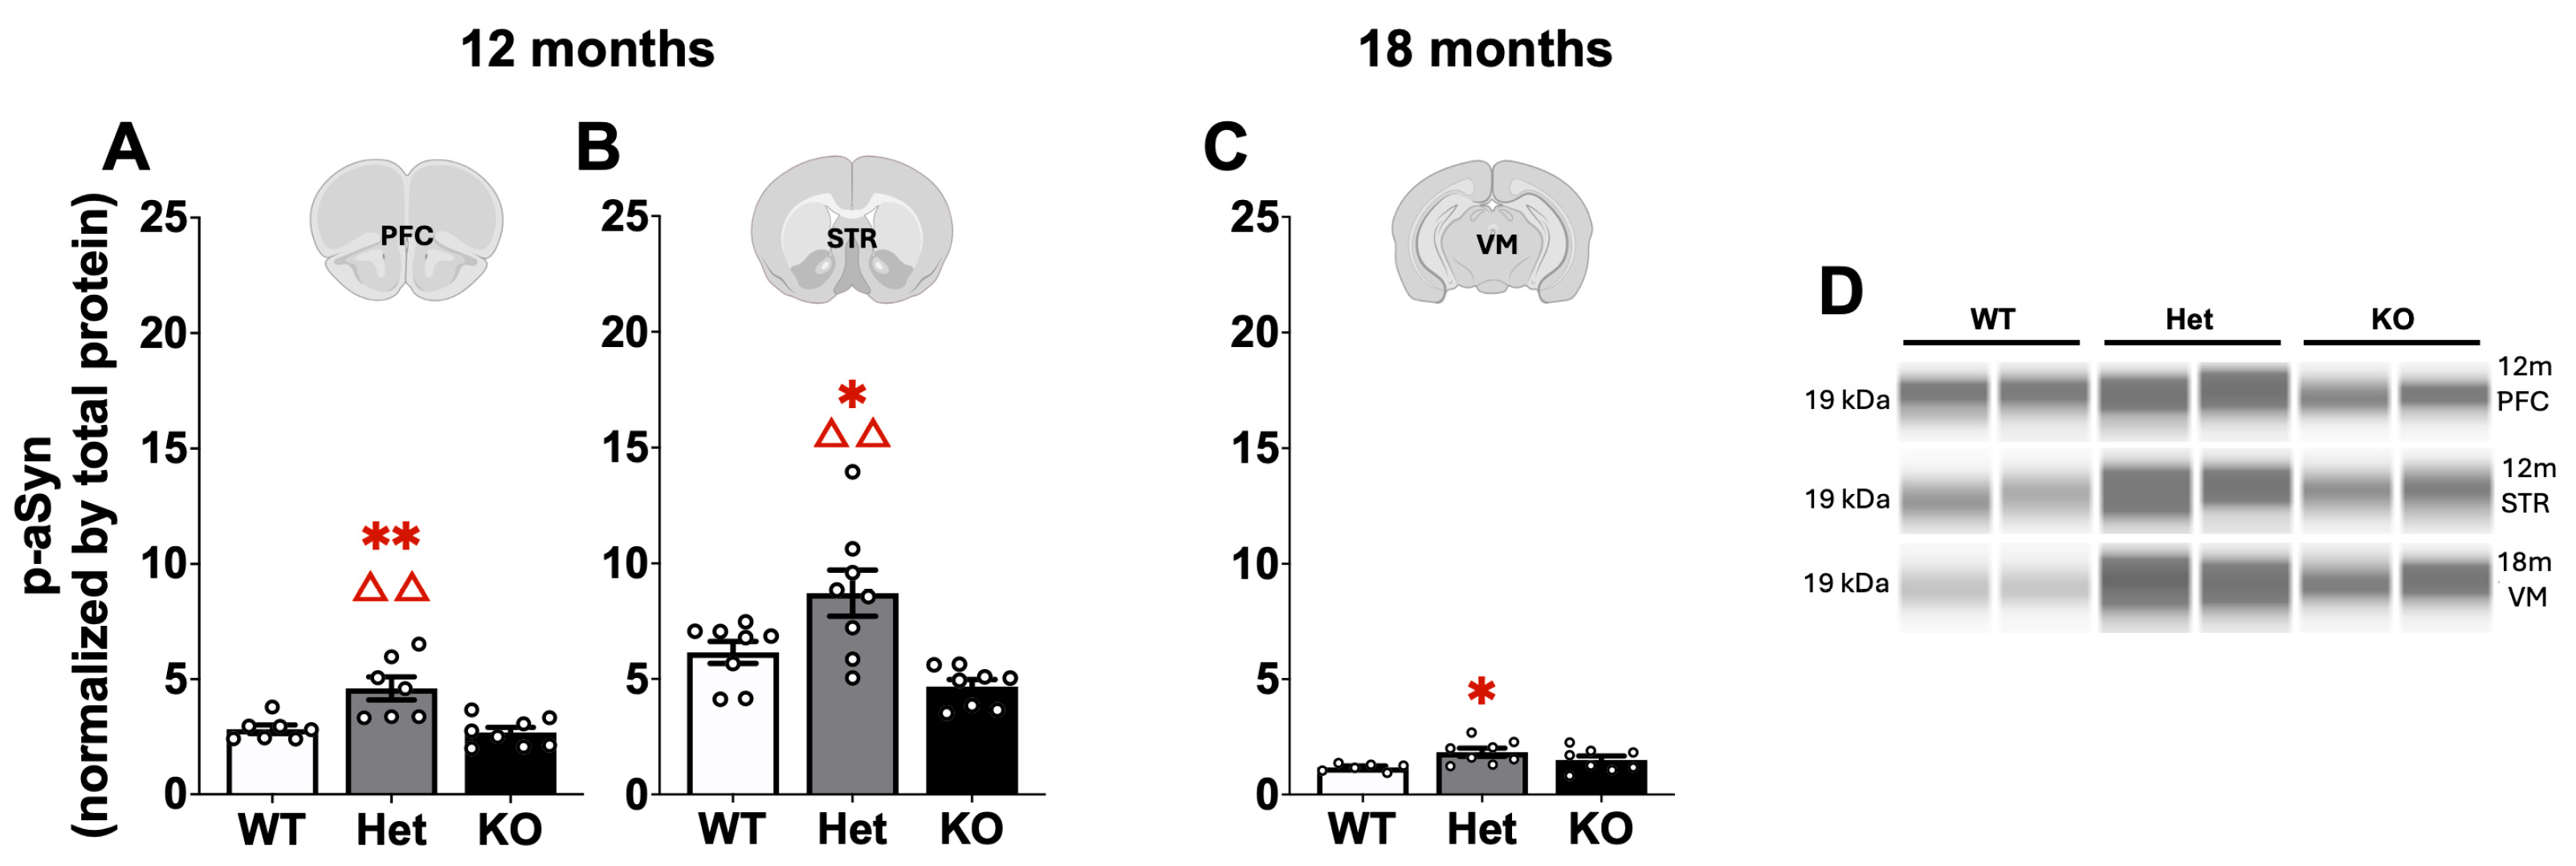
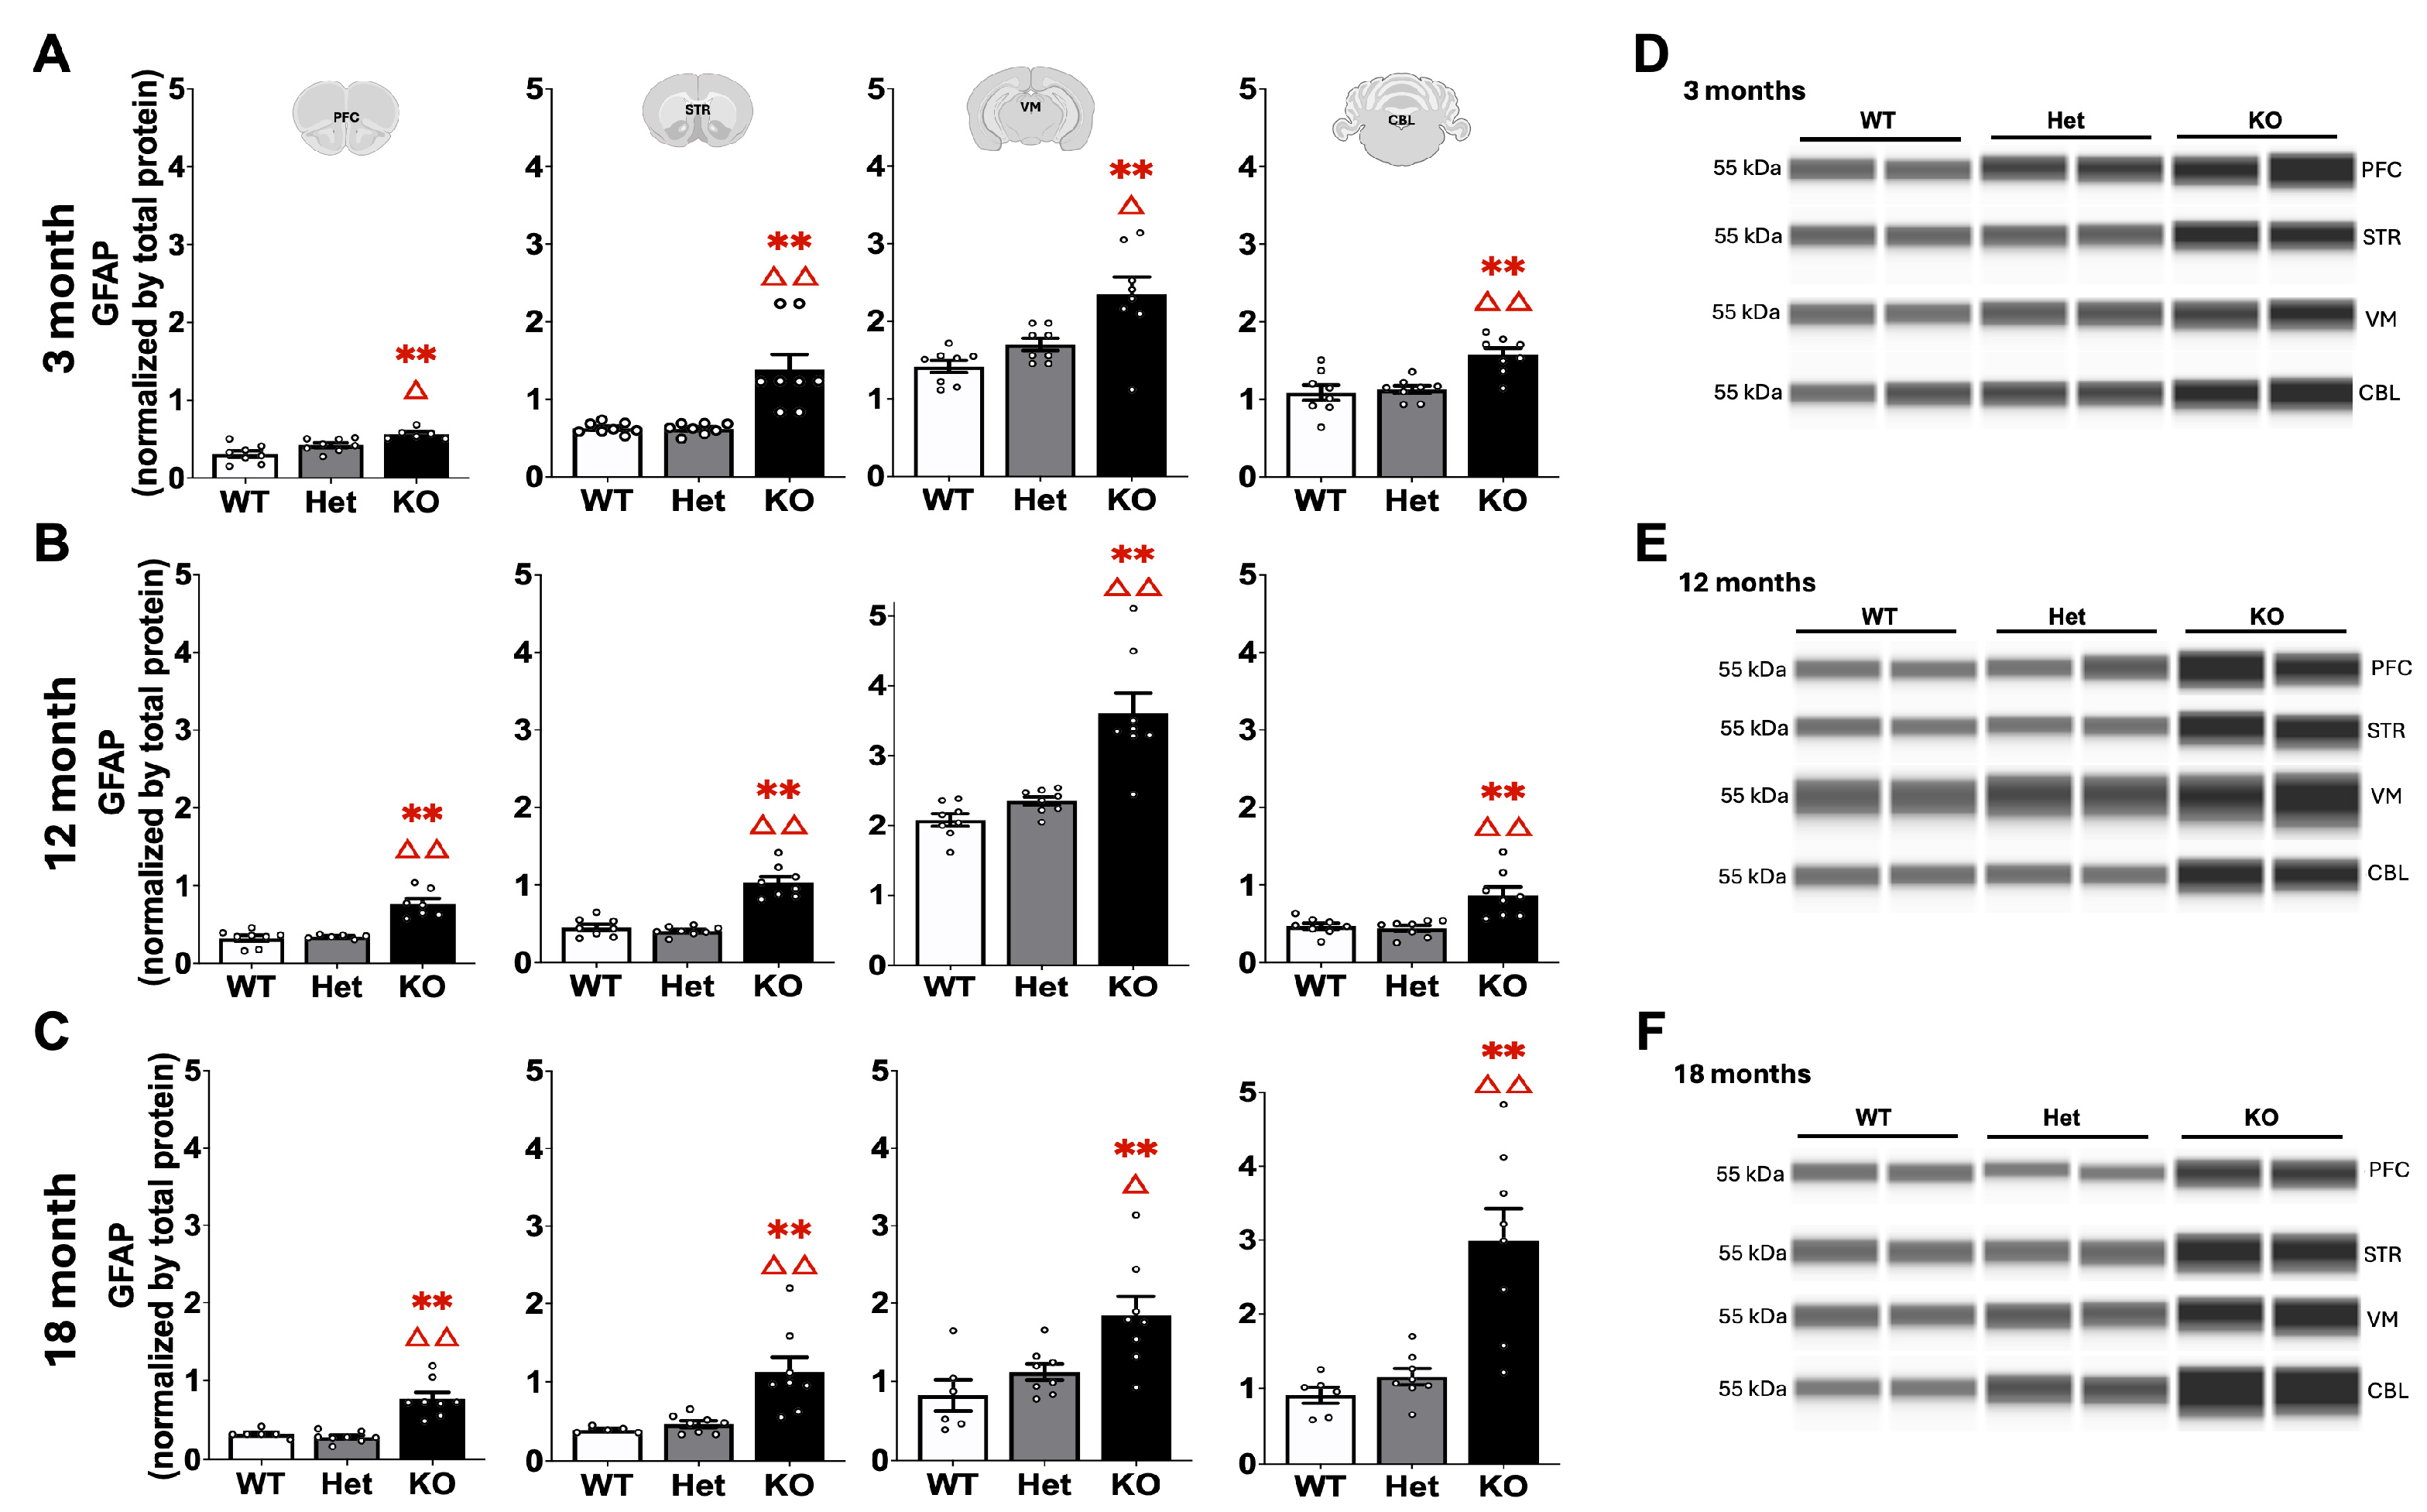
2.3. Protein Quantification
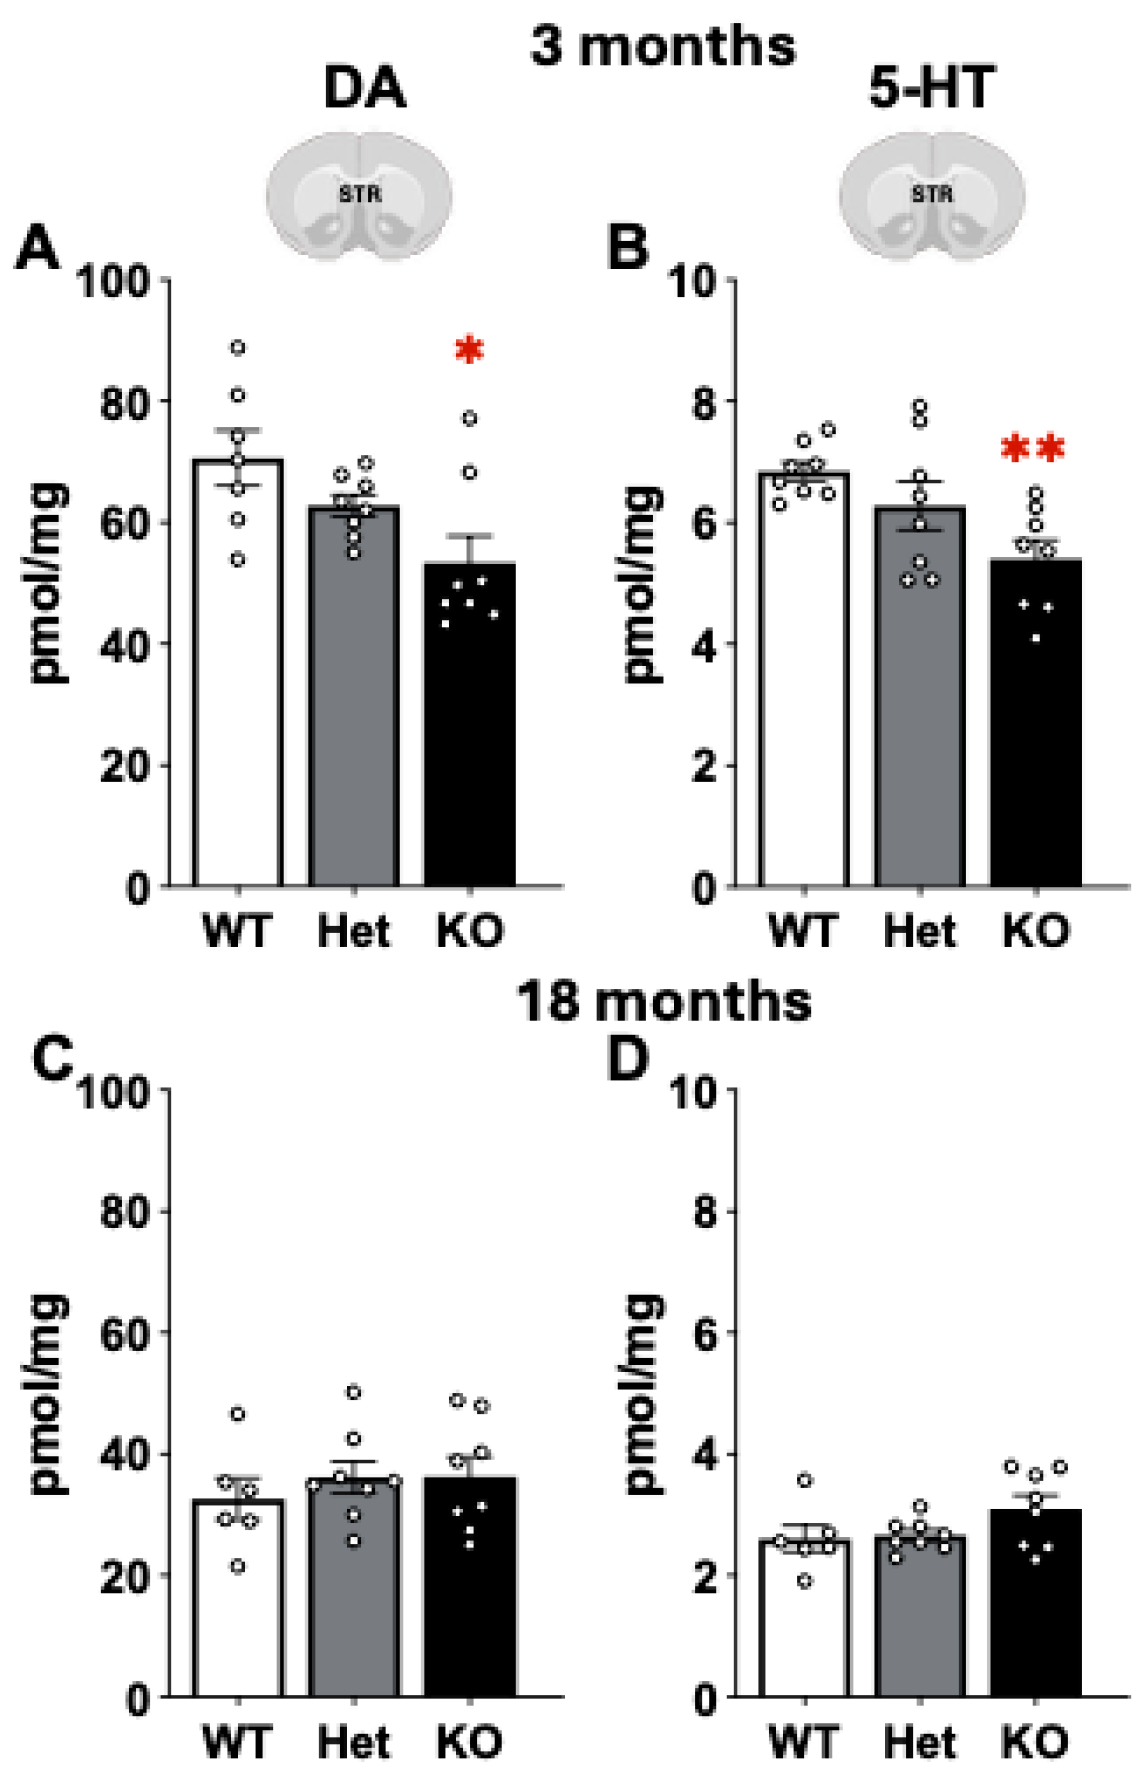
2.4. Mass Spectrometry
3. Discussion
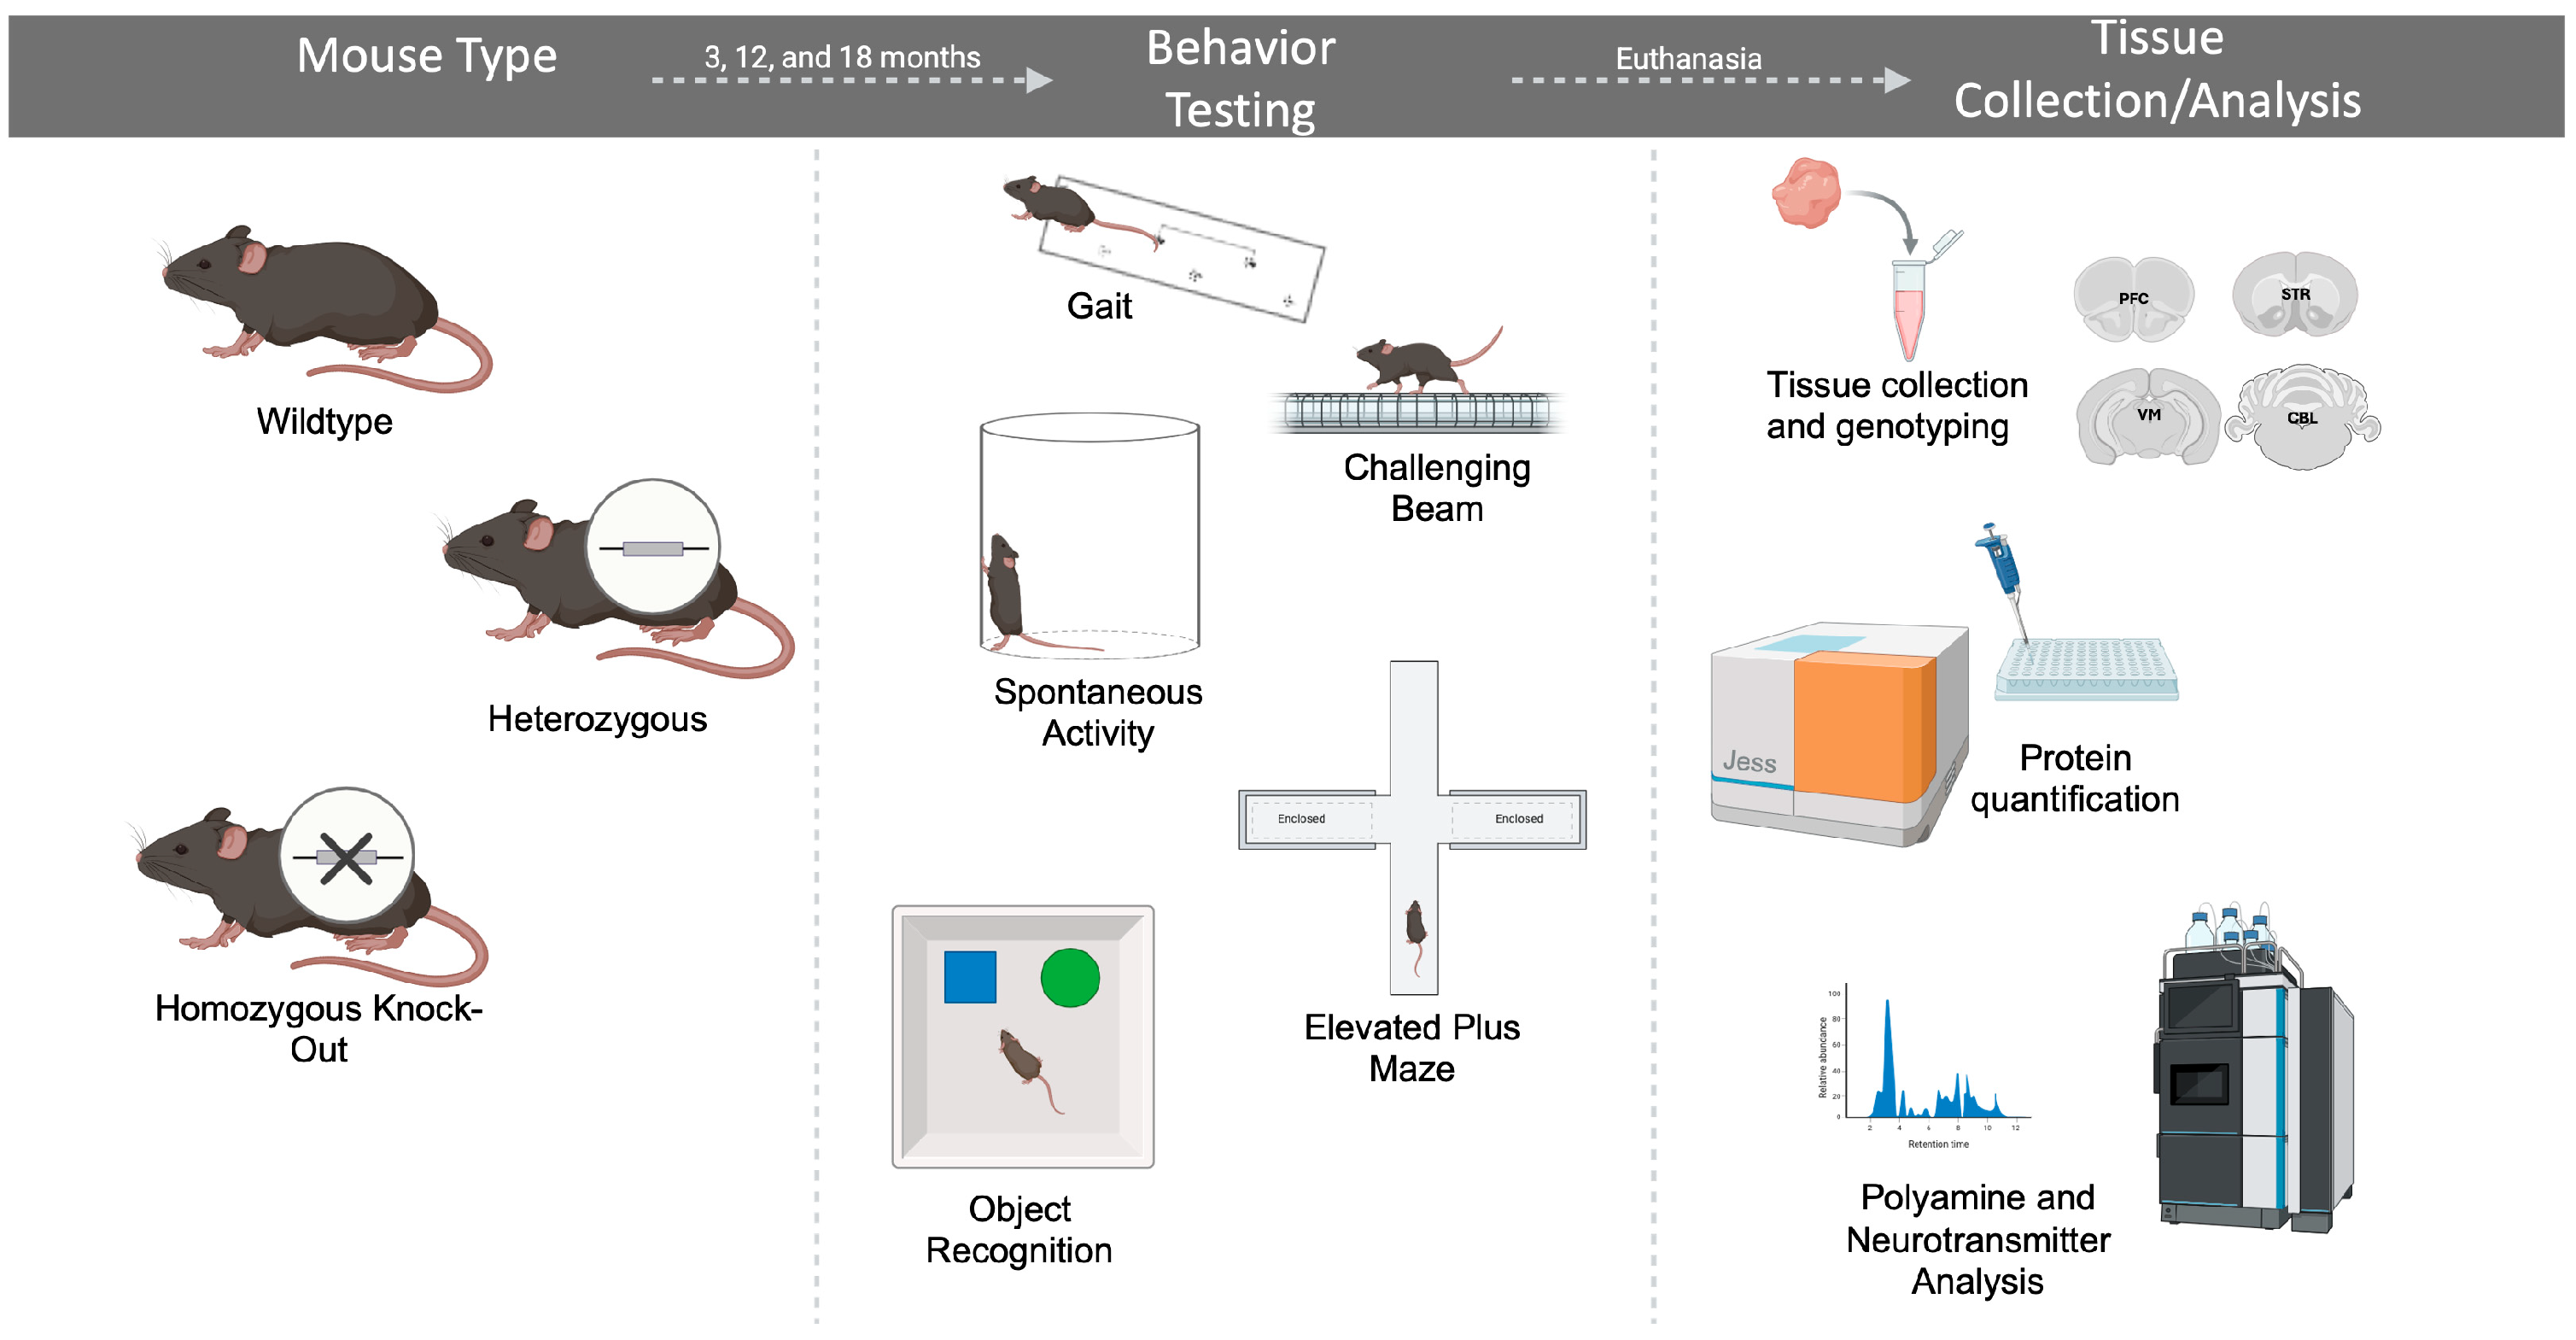
4. Materials and Methods
4.1. Animals
4.2. Behavioral Testing
4.3. Tissue Analysis
4.4. Statistics
Supplementary Materials
Author Contributions
Funding
Institutional Review Board Statement
Informed Consent Statement
Data Availability Statement
Conflicts of Interest
Abbreviations
| PD | Parkinson’s disease |
| KRS | Kufor-Rakeb Syndrome |
| NCL | Neuronal Ceroid Lipofuscinosis |
| αSyn | alpha-synuclein |
| p-αSyn | phosphorylated alpha-synuclein |
| WT | wildtype |
| Het | heterozygous |
| KO | knockout |
| PFC | prefrontal cortex |
| STR | striatum |
| VM | ventral midbrain |
| CBL | cerebellum |
| DA | dopamine |
| 5-HT | serotonin |
| PCR | polymerase chain reaction |
| GFAP | glial fibrillary acidic protein |
| LC/MS/MS | liquid chromatography-tandem mass spectrometry |
| TCA | trichloroacetic acid |
| SPE | solid phase extraction |
| PRM | parallel reaction monitoring |
| CE | collision energy |
References
- Schultheis, P.J.; Hagen, T.T.; O’Toole, K.K.; Tachibana, A.; Burke, C.R.; McGill, D.L.; Okunade, G.W.; Shull, G.E. Characterization of the P5 subfamily of P-type transport ATPases in mice. Biochem. Biophys. Res. Commun. 2004, 323, 731–738. [Google Scholar] [CrossRef] [PubMed]
- Schultheis, P.J.; Fleming, S.M.; Clippinger, A.K.; Lewis, J.; Tsunemi, T.; Giasson, B.; Dickson, D.W.; Mazzulli, J.R.; Bardgett, M.E.; Haik, K.L.; et al. Atp13a2-deficient mice exhibit neuronal ceroid lipofuscinosis, limited α-synuclein accumulation and age-dependent sensorimotor deficits. Hum. Mol. Genet. 2013, 22, 2067–2082. [Google Scholar] [CrossRef] [PubMed]
- Ramirez, A.; Heimbach, A.; Gründemann, J.; Stiller, B.; Hampshire, D.; Cid, L.P.; Goebel, I.; Mubaidin, A.F.; Wriekat, A.L.; Roeper, J.; et al. Hereditary parkinsonism with dementia is caused by mutations in ATP13A2, encoding a lysosomal type 5 P-type ATPase. Nat. Genet. 2006, 38, 1184–1191. [Google Scholar] [CrossRef] [PubMed]
- Schneider, S.A.; Paisan-Ruiz, C.; Quinn, N.P.; Lees, A.J.; Houlden, H.; Hardy, J.; Bhatia, K.P. ATP13A2 mutations (PARK9) cause neurodegeneration with brain iron accumulation. Mov. Disord. 2010, 25, 979–984. [Google Scholar] [CrossRef] [PubMed]
- Bras, J.; Verloes, A.; Schneider, S.A.; Mole, S.E.; Guerreiro, R.J. Mutation of the parkinsonism gene ATP13A2 causes neuronal ceroid-lipofuscinosis. Hum. Mol. Genet. 2012, 21, 2646–2650. [Google Scholar] [CrossRef] [PubMed]
- Estrada-Cuzcano, A.; Martin, S.; Chamova, T.; Synofzik, M.; Timmann, D.; Holemans, T.; Andreeva, A.; Reichbauer, J.; De Rycke, R.; Chang, D.I.; et al. Loss-of-function mutations in the ATP13A2/PARK9 gene cause complicated hereditary spastic paraplegia (SPG78). Brain 2017, 140, 287–305. [Google Scholar] [CrossRef] [PubMed]
- Lubbe, S.J.; Escott-Price, V.; Gibbs, J.R.; Nalls, M.A.; Bras, J.; Price, T.R.; Nicolas, A.; Jansen, I.E.; Mok, K.Y.; Pittman, A.M.; et al. Additional rare variant analysis in Parkinson’s disease cases with and without known pathogenic mutations: Evidence for oligogenic inheritance. Hum. Mol. Genet. 2016, 25, 5483–5489. [Google Scholar] [CrossRef] [PubMed]
- Murphy, K.E.; Cottle, L.; Gysbers, A.M.; Cooper, A.A.; Halliday, G.M. ATP13A2 (PARK9) protein levels are reduced in brain tissue of cases with Lewy bodies. Acta Neuropathol. Commun. 2013, 1, 11. [Google Scholar] [CrossRef] [PubMed]
- Anheim, M.; Lagier-Tourenne, C.; Stevanin, G.; Fleury, M.; Durr, A.; Namer, I.J.; Denora, P.; Brice, A.; Mandel, J.L.; Koenig, M.; et al. SPG11 spastic paraplegia. A new cause of juvenile parkinsonism. J. Neurol. 2009, 256, 104–108. [Google Scholar] [CrossRef] [PubMed]
- Mallaret, M.; Lagha-Boukbiza, O.; Biskup, S.; Namer, I.J.; Rudolf, G.; Anheim, M.; Tranchant, C. SPG15: A cause of juvenile atypical levodopa responsive parkinsonism. J. Neurol. 2014, 261, 435–437. [Google Scholar] [CrossRef] [PubMed]
- Nijssen, P.C.; Brusse, E.; Leyten, A.C.; Martin, J.J.; Teepen, J.L.; Roos, R.A. Autosomal dominant adult neuronal ceroid lipofuscinosis: Parkinsonism due to both striatal and nigral dysfunction. Mov. Disord. 2002, 17, 482–487. [Google Scholar] [CrossRef] [PubMed]
- Behrens, M.I.; Brüggemann, N.; Chana, P.; Venegas, P.; Kägi, M.; Parrao, T.; Orellana, P.; Garrido, C.; Rojas, C.V.; Hauke, J.; et al. Clinical spectrum of Kufor-Rakeb syndrome in the Chilean kindred with ATP13A2 mutations. Mov. Disord. 2010, 25, 1929–1937. [Google Scholar] [CrossRef] [PubMed]
- Chien, H.F.; Rodriguez, R.D.; Bonifati, V.; Nitrini, R.; Pasqualucci, C.A.; Gelpi, E.; Barbosa, E.R. Neuropathologic Findings in a Patient with Juvenile-Onset Levodopa-Responsive Parkinsonism Due to ATP13A2 Mutation. Neurology 2021, 97, 763–766. [Google Scholar] [CrossRef] [PubMed]
- Gitler, A.D.; Chesi, A.; Geddie, M.L.; Strathearn, K.E.; Hamamichi, S.; Hill, K.J.; Caldwell, K.A.; Caldwell, G.A.; Cooper, A.A.; Rochet, J.C.; et al. Alpha-synuclein is part of a diverse and highly conserved interaction network that includes PARK9 and manganese toxicity. Nat Genet. 2009, 41, 308–315. [Google Scholar] [CrossRef] [PubMed]
- Dehay, B.; Ramirez, A.; Martinez-Vicente, M.; Perier, C.; Canron, M.H.; Doudnikoff, E.; Vital, A.; Vila, M.; Klein, C.; Bezard, E. Loss of P-type ATPase ATP13A2/PARK9 function induces general lysosomal deficiency and leads to Parkinson disease neurodegeneration. Proc. Natl. Acad. Sci. USA 2012, 109, 9611–9616. [Google Scholar] [CrossRef] [PubMed]
- Usenovic, M.; Tresse, E.; Mazzulli, J.R.; Taylor, J.P.; Krainc, D. Deficiency of ATP13A2 leads to lysosomal dysfunction, α-synuclein accumulation, and neurotoxicity. J. Neurosci. 2012, 32, 4240–4246. [Google Scholar] [CrossRef] [PubMed]
- Si, J.; Van den Haute, C.; Lobbestael, E.; Martin, S.; van Veen, S.; Vangheluwe, P.; Baekelandt, V. ATP13A2 Regulates Cellular α-Synuclein Multimerization, Membrane Association, and Externalization. Int. J. Mol. Sci. 2021, 22, 2689. [Google Scholar] [CrossRef] [PubMed]
- van Veen, S.; Martin, S.; Van den Haute, C.; Benoy, V.; Lyons, J.; Vanhoutte, R.; Kahler, J.P.; Decuypere, J.P.; Gelders, G.; Lambie, E.; et al. ATP13A2 deficiency disrupts lysosomal polyamine export. Nature 2020, 578, 419–424. [Google Scholar] [CrossRef] [PubMed]
- Pinto Fde, T.; Corradi, G.R.; Hera, D.P.; Adamo, H.P. CHO cells expressing the human P5-ATPase ATP13A2 are more sensitive to the toxic effects of herbicide paraquat. Neurochem. Int. 2012, 60, 243–248. [Google Scholar] [CrossRef] [PubMed]
- De La Hera, D.P.; Corradi, G.R.; Adamo, H.P.; De Tezanos Pinto, F. Parkinson’s disease-associated human P5B-ATPase ATP13A2 increases spermidine uptake. Biochem. J. 2013, 450, 47–53. [Google Scholar] [CrossRef] [PubMed]
- Minois, N.; Carmona-Gutierrez, D.; Madeo, F. Polyamines in aging and disease. Aging 2011, 3, 716–732. [Google Scholar] [CrossRef] [PubMed]
- Miller-Fleming, L.; Olin-Sandoval, V.; Campbell, K.; Ralser, M. Remaining Mysteries of Molecular Biology: The Role of Polyamines in the Cell. J. Mol. Biol. 2015, 427, 3389–3406. [Google Scholar] [CrossRef] [PubMed]
- Kett, L.R.; Stiller, B.; Bernath, M.M.; Tasset, I.; Blesa, J.; Jackson-Lewis, V.; Chan, R.B.; Zhou, B.; Di Paolo, G.; Przedborski, S.; et al. α-Synuclein-independent histopathological and motor deficits in mice lacking the endolysosomal Parkinsonism protein Atp13a2. J. Neurosci. 2015, 35, 5724–5742. [Google Scholar] [CrossRef] [PubMed]
- Fleming, S.M.; Santiago, N.A.; Mullin, E.J.; Pamphile, S.; Karkare, S.; Lemkuhl, A.; Ekhator, O.R.; Linn, S.C.; Holden, J.G.; Aga, D.S.; et al. The effect of manganese exposure in Atp13a2-deficient mice. Neurotoxicology 2018, 64, 256–266. [Google Scholar] [CrossRef] [PubMed]
- Dirr, E.R.; Ekhator, O.R.; Blackwood, R.; Holden, J.G.; Masliah, E.; Schultheis, P.J.; Fleming, S.M. Exacerbation of sensorimotor dysfunction in mice deficient in Atp13a2 and overexpressing human wildtype alpha-synuclein. Behav. Brain Res. 2018, 343, 41–49. [Google Scholar] [CrossRef] [PubMed]
- Erb, M.L.; Sipple, K.; Levine, N.; Chen, X.; Moore, D.J. Adult-onset deletion of ATP13A2 in mice induces progressive nigrostriatal pathway dopaminergic degeneration and lysosomal abnormalities. NPJ Park. Dis. 2024, 10, 133. [Google Scholar] [CrossRef] [PubMed]
- Sikora, J.; Dovero, S.; Kinet, R.; Arotcarena, M.L.; Bohic, S.; Bezard, E.; Fernagut, P.O.; Dehay, B. Nigral ATP13A2 depletion induces Parkinson’s disease-related neurodegeneration in a pilot study in non-human primates. NPJ Park. Dis. 2024, 10, 141. [Google Scholar] [CrossRef] [PubMed]
- Xu, Y.H.; Sun, Y.; Ran, H.; Quinn, B.; Witte, D.; Grabowski, G.A. Accumulation and distribution of α-synuclein and ubiquitin in the CNS of Gaucher disease mouse models. Mol. Genet. Metab. 2011, 4, 436–447. [Google Scholar] [CrossRef] [PubMed]
- Sato, S.; Koike, M.; Funayama, M.; Ezaki, J.; Fukuda, T.; Ueno, T.; Uchiyama, Y.; Hattori, N. Lysosomal storage of subunit c of mitochondrial ATP synthase in brain-specific Atp13a2-deficient mice. Am. J. Pathol. 2016, 186, 3074–3082. [Google Scholar] [CrossRef] [PubMed]
- Rayaprolu, S.; Seven, Y.B.; Howard, J.; Duffy, C.; Altshuler, M.; Moloney, C.; Giasson, B.I.; Lewis, J. Partial loss of ATP13A2 causes selective gliosis independent of robust lipofuscinosis. Mol. Cell. Neurosci. 2018, 92, 17–26. [Google Scholar] [CrossRef] [PubMed]
- Hoshino, K.; Momiyama, E.; Yoshida, K.; Nishimura, K.; Sakai, S.; Toida, T.; Kashiwagi, K.; Igarashi, K. Polyamine transport by mammalian cells and mitochondria: Role of antizyme and glycosaminoglycans. J. Biol. Chem. 2005, 280, 42801–42808. [Google Scholar] [CrossRef] [PubMed]
- Qiao, C.; Yin, N.; Gu, H.Y.; Zhu, J.L.; Ding, J.H.; Lu, M.; Hu, G. Atp13a2 Deficiency Aggravates Astrocyte-Mediated Neuroinflammation via NLRP3 Inflammasome Activation. CNS Neurosci. Ther. 2016, 22, 451–460. [Google Scholar] [CrossRef] [PubMed]
- Xu, T.T.; Li, H.; Dai, Z.; Lau, G.K.; Li, B.Y.; Zhu, W.L.; Liu, X.Q.; Liu, H.F.; Cai, W.W.; Huang, S.Q.; et al. Spermidine and spermine delay brain aging by inducing autophagy in SAMP8 mice. Aging 2020, 12, 6401–6414. [Google Scholar] [CrossRef] [PubMed]
- Laube, G.; Veh, R.W. Astrocytes, not neurons, show most prominent staining for spermidine/spermine-like immunoreactivity in adult rat brain. Glia 1997, 19, 171–179. [Google Scholar] [CrossRef]
- Fleming, S.M.; Salcedo, J.; Fernagut, P.O.; Rockenstein, E.; Masliah, E.; Levine, M.S.; Chesselet, M.F. Early and progressive sensorimotor anomalies in mice overexpressing wild-type human alpha-synuclein. J. Neurosci. 2004, 24, 9434–9440. [Google Scholar] [CrossRef] [PubMed]
- Schallert, T.; Whishaw, I.Q.; Ramirez, V.D.; Teitelbaum, P. 6-hydroxydopamine and anticholinergic drugs. Science 1978, 202, 1216–1217. [Google Scholar] [CrossRef] [PubMed]
- Walf, A.A.; Frye, C.A. The use of the elevated plus maze as an assay of anxiety-related behavior in rodents. Nat. Protoc. 2007, 2, 322–328. [Google Scholar] [CrossRef] [PubMed]
- Gupta, S.; Jinka, S.K.A.; Khanal, S.; Bhavnani, N.; Almashhori, F.; Lallo, J.; Mathias, A.; Al-Rhayyel, Y.; Herman, D.; Holden, J.G.; et al. Cognitive dysfunction and increased phosphorylated tau are associated with reduced O-GlcNAc signaling in an aging mouse model of metabolic syndrome. J. Neurosci. Res. 2023, 101, 1324–1344. [Google Scholar] [CrossRef] [PubMed]
- Fleming, S.M.; Scott, S.; Hamad, E.J.; Herman, D.E.; Holden, J.G.; Yan, L.; Linning-Duffy, K.; Kemp, C.J.; Patterson, J.R.; Miller, K.M.; et al. Intrastriatal injection of alpha-synuclein preformed fibrils to rats results in L-DOPA reversible sensorimotor impairments and alterations in non-motor function. Front. Neurosci. 2025, 19, 1556447. [Google Scholar] [CrossRef] [PubMed]
- Brown, J.A.; Emnett, R.J.; White, C.R.; Yuede, C.M.; Conyers, S.B.; O’Malley, K.L.; Wozniak, D.F.; Gutmann, D.H. Reduced striatal dopamine underlies the attention system dysfunction in neurofibromatosis-1 mutant mice. Hum. Mol. Genet. 2010, 19, 4515–4528. [Google Scholar] [CrossRef] [PubMed]
- Mittal, N.; Fleming, S.M.; Martinez, A.; Thakore, N.; Bell, R.L.; Maddox, W.T.; Schallert, T.; Duvauchelle, C.L. Sex differences in cognitive performance and alcohol consumption in High Alcohol-Drinking (HAD-1) rats. Behav. Brain Res. 2020, 381, 112456. [Google Scholar] [CrossRef] [PubMed]
- Hof, P.R.; Young, W.G.; Bloom, F.E.; Belichenko, P.V.; Celio, M.R. Comparative Cytoarchitectonic Atlas of the C57BL6 and 129 Sv Mouse Brains; Elsevier: Amsterdam, The Netherlands, 2000. [Google Scholar]
- Spijker, S. Dissection of Rodent Brain Regions. In Neuroproteomics. Neuromethods; Li, K., Ed.; Humana Press: Totowa, NJ, USA, 2011; Volume 57. [Google Scholar]
- Sormunen, A.; Koivulehto, E.; Alitalo, K.; Saksela, K.; Laham-Karam, N.; Ylä-Herttuala, S. Comparison of Automated and Traditional Western Blotting Methods. Methods Protoc. 2023, 6, 43. [Google Scholar] [CrossRef] [PubMed]
- Bretland, K.A.; Lin, L.; Bretland, K.M.; Smith, M.A.; Fleming, S.M.; Dengler-Crish, C.M. Irisin treatment lowers levels of phosphorylated tau in the hippocampus of pre-symptomatic female but not male htau mice. Neuropathol. Appl. Neurobiol. 2021, 47, 967–978. [Google Scholar] [CrossRef] [PubMed]
- Ghanta, P.; Hessel, E.; Arias-Alvarado, A.; Aghayev, M.; Ilchenko, S.; Kasumov, T.; Oyewumi, M.O. Lung cancer exosomal Gal3BP promotes osteoclastogenesis with potential connotation in osteolytic metastasis. Sci. Rep. 2024, 14, 27201. [Google Scholar] [CrossRef] [PubMed]
- Magnes, C.; Fauland, A.; Gander, E.; Narath, S.; Ratzer, M.; Eisenberg, T.; Madeo, F.; Pieber, T.; Sinner, F. Polyamines in biological samples: Rapid and robust quantification by solid-phase extraction online-coupled to liquid chromatography-tandem mass spectrometry. J. Chromatogr. A 2014, 1331, 44–51. [Google Scholar] [CrossRef] [PubMed]


| WT | Het | KO | |
|---|---|---|---|
| PFC | 1.10 ± 0.17 | 0.74 ± 0.09 | 0.00 ± 0.00 |
| STR | 1.09 ± 0.13 | 0.78 ± 0.13 | 0.00 ± 0.00 |
| VM | 1.08 ± 0.14 | 0.68 ± 0.09 | 0.00 ± 0.00 |
| CBL | 1.02 ± 0.07 | 0.55 ± 0.03 | 0.00 ± 0.00 |
| 3 Months | WT | Het | KO |
| PFC | 25.61 ± 1.52 | 27.79 ± 0.51 ΔΔ | 21.98 ± 0.73 |
| STR | 18.76 ± 1.06 | 20.17 ± 0.63 | 17.81 ± 0.72 |
| VM | 11.07 ± 0.54 | 11.30 ± 0.67 | 8.29 ± 0.65 |
| CBL | 3.81 ± 0.24 | 4.41 ± 0.15 ΔΔ | 3.69 ± 0.11 |
| 12 Months | WT | Het | KO |
| PFC | 22.42 ± 1.42 | 25.51 ± 1.02 | 13.54 ± 1.47 |
| STR | 27.24 ± 1.62 | 27.08 ± 0.65 | 24.30 ± 1.19 |
| VM | 10.10 ± 0.42 | 10.98 ± 0.55 | 8.64 ± 0.88 |
| CBL | 3.03 ± 0.20 | 3.41 ± 0.11 Δ | 2.80 ± 0.13 |
| WT | Het | KO | |
|---|---|---|---|
| PFC | 5.02 ± 0.43 | 5.47 ± 0.17 | 3.31 ± 0.34 |
| STR | 4.83 ± 0.24 | 6.81 ± 0.91 ΔΔ | 2.97 ± 0.13 |
| VM | 1.90 ± 0.16 | 2.32 ± 0.24 | 1.80 ± 0.21 |
| CBL | 0.53 ± 0.08 | 0.60 ± 0.13 | 0.42 ± 0.06 |
Disclaimer/Publisher’s Note: The statements, opinions and data contained in all publications are solely those of the individual author(s) and contributor(s) and not of MDPI and/or the editor(s). MDPI and/or the editor(s) disclaim responsibility for any injury to people or property resulting from any ideas, methods, instructions or products referred to in the content. |
© 2025 by the authors. Licensee MDPI, Basel, Switzerland. This article is an open access article distributed under the terms and conditions of the Creative Commons Attribution (CC BY) license (https://creativecommons.org/licenses/by/4.0/).
Share and Cite
Croucher, K.; Lepp, J.K.; Bechtold, J.; Hamad, E.J.; Scott, S.; Bittner, C.; Rogers, S.; Ong, C.; Boehme, S.; Wang, Z.; et al. Phenotype Differences Between ATP13A2 Heterozygous and Knockout Mice Across Aging. Int. J. Mol. Sci. 2025, 26, 7030. https://doi.org/10.3390/ijms26157030
Croucher K, Lepp JK, Bechtold J, Hamad EJ, Scott S, Bittner C, Rogers S, Ong C, Boehme S, Wang Z, et al. Phenotype Differences Between ATP13A2 Heterozygous and Knockout Mice Across Aging. International Journal of Molecular Sciences. 2025; 26(15):7030. https://doi.org/10.3390/ijms26157030
Chicago/Turabian StyleCroucher, Kristina, Josephine K. Lepp, Jennifer Bechtold, Edward J. Hamad, Sophia Scott, Christian Bittner, Sara Rogers, Christian Ong, Shannon Boehme, Zhuo Wang, and et al. 2025. "Phenotype Differences Between ATP13A2 Heterozygous and Knockout Mice Across Aging" International Journal of Molecular Sciences 26, no. 15: 7030. https://doi.org/10.3390/ijms26157030
APA StyleCroucher, K., Lepp, J. K., Bechtold, J., Hamad, E. J., Scott, S., Bittner, C., Rogers, S., Ong, C., Boehme, S., Wang, Z., Lin, L., Wang, X., & Fleming, S. M. (2025). Phenotype Differences Between ATP13A2 Heterozygous and Knockout Mice Across Aging. International Journal of Molecular Sciences, 26(15), 7030. https://doi.org/10.3390/ijms26157030