Article

Transcriptomic Profiling of Paired Primary Tumors and CNS Metastases in Breast Cancer Reveals Immune Modulation Signatures

by
Ana Julia Aguiar de Freitas
1,†,
Muriele Bertagna Varuzza
1,†,
Stéphanie Calfa
1,
Rhafaela Lima Causin
1,
Vinicius Duval da Silva
2,
Cristiano de Pádua Souza
2 and
Márcia Maria Chiquitelli Marques
1,*
1
Molecular Oncology Research Center, Teaching and Research Institute, Barretos Cancer Hospital, Barretos 14784-400, SP, Brazil
2
Barretos Cancer Hospital, Barretos 14784-400, SP, Brazil
*
Author to whom correspondence should be addressed.
These authors contributed equally to this work and share first authorship.
Int. J. Mol. Sci. 2025, 26(14), 6944; https://doi.org/10.3390/ijms26146944
Submission received: 10 June 2025 / Revised: 8 July 2025 / Accepted: 17 July 2025 / Published: 19 July 2025
(This article belongs to the Special Issue State-of-the-Art Molecular Oncology in Brazil, 3rd Edition)

Abstract

Breast cancer is a leading cause of central nervous system (CNS) metastases in women, often associated with poor prognosis and limited therapeutic options. However, molecular differences between primary tumors and CNS metastases remain underexplored. We aimed to characterize transcriptomic differences between primary breast tumors and matched CNS metastases and identify immune-related biomarkers associated with metastatic progression and patient outcomes. Transcriptomic profiling was based on 11 matched FFPE sample pairs (primary tumor and CNS metastasis). Paired formalin-fixed paraffin-embedded (FFPE) samples from primary tumors (T1) and CNS metastases (T2) were analyzed using the NanoString nCounter® platform and the PanCancer IO 360™ Gene Expression Panel. Differential gene expression, Z-score transformation, and heatmap visualization were performed in R. In silico survival analyses for overall survival (OS) and recurrence-free survival (RFS) were conducted using publicly available TCGA and GEO datasets. Forty-five genes were significantly differentially expressed between the T1 and T2 samples. Immune-related genes such as CXCL9, IL7R, CD79A, and CTSW showed consistent downregulation in CNS metastases. High expression of CXCL9 and CD79A was associated with improved OS and RFS, whereas high IL7R and CTSW expression correlated with worse outcomes. These findings indicate immune suppression as a hallmark of CNS colonization. Comparative transcriptomic analysis further underscored the distinct molecular landscapes between primary and metastatic tumors. This study highlights transcriptional signatures associated with breast cancer CNS metastases, emphasizing the role of immune modulation in metastatic progression. The identified genes have potential as prognostic biomarkers and therapeutic targets, supporting the need for site-specific molecular profiling in metastatic breast cancer management.

Graphical Abstract

1. Introduction

According to the Global Cancer Observatory (GLOBOCAN), breast cancer was the most frequently diagnosed cancer in women worldwide in 2022, accounting for 23.8% of all new cancer cases and 15.4% of all cancer-related deaths [1]. In Brazil, data from the National Cancer Institute (INCA) indicate a similar pattern, with 73,610 estimated new breast cancer cases for 2023 and 17,825 recorded deaths in 2020 [2].
Breast cancer is a heterogeneous disease driven by a wide array of genetic and molecular alterations, resulting in substantial clinical and biological variability [3,4,5]. During disease progression, malignant cells can disseminate through lymphatic or hematogenous routes, establishing metastases in distant organs [6,7]. This metastatic capability is associated with genomic instability and the ability of tumor cells to remodel their microenvironment to favor colonization [6]. The molecular underpinnings of metastasis include clonal selection, epithelial–mesenchymal transition (EMT), and immune system modulation, all of which may differ depending on the metastatic site [8].
The central nervous system (CNS) is a notable site for breast cancer metastases, with a reported incidence of 10–16% [9] in clinical series and up to 30% in autopsy studies [10,11]. Breast cancer is the second most common cause of CNS metastases after lung cancer [12]. Without treatment, the average survival after CNS involvement is approximately four weeks. Even with interventions such as radiotherapy or neurosurgery, only about 20% of patients survive beyond one year [13,14,15].
Recent studies demonstrate that there might be a change in the biological pattern of the disease in breast cancer metastasis compared to the primary tumor [16,17,18]. Changes in the expression of Human Epidermal Growth Factor Receptor 2 (HER2), Estrogen Receptor (ER), and/or Progesterone Receptor (PR) status have been described [19,20,21]. In addition, other authors have identified changes in the signaling pathway of recognized markers (EGFR, RAS, PIK3CA, HER2) in breast cancer brain metastases [22]. However, due to the difficulty of accessing biological material in this metastasis location, in addition to the scarcity of studies on this scenario, not much is known about the molecular events that lead to CNS metastasis [23].
Treatment options for metastatic breast cancer are limited and include surgical resection, radiation therapy to the entire skull, chemotherapy, and targeted therapies [24,25]. CNS metastases develop in a specific microenvironment, with highly evolved adaptive manifestations, thus providing a unique opportunity to investigate the influence of the tumor microenvironment on the metastatic process [26,27]. Studies show that for micrometastases to be able to colonize the neural niche, originally hostile, it is necessary to change the microenvironment, which essentially involves the transformation of the glial compartment into a tumor support mechanism [28,29,30].
Due to the uncertainty regarding the origin of multiple genetic abnormalities and their potential clinical utility, molecular targets have shown an important role in clarifying tumor biology [31,32]. A recent study demonstrated intratumoral heterogeneity in metastatic capacity by analyzing gene expression in phylogenies [33]. Another study, with an animal model of metastatic breast cancer, showed a difference in the expression of several genes when comparing metastatic tissue with primary tumors, confirming the fact that intratumoral heterogeneity plays an important role in the selection of clones with metastatic potential [34] and as a target for therapy.
Taken together, these observations underscore the urgent need for a deeper understanding of the tumor microenvironment and the molecular features of CNS metastases in breast cancer. Here we describe transcriptomic profiles associated with CNS metastasis in advanced breast cancer and allow the creation of a standard for clinical trials that personalize the treatment, seeking greater efficacy and better clinical results. In this study, we characterize the transcriptomic profiles associated with CNS dissemination in advanced breast cancer, aiming to identify potential biomarkers and guide the development of personalized treatment strategies to improve clinical outcomes.

2. Results

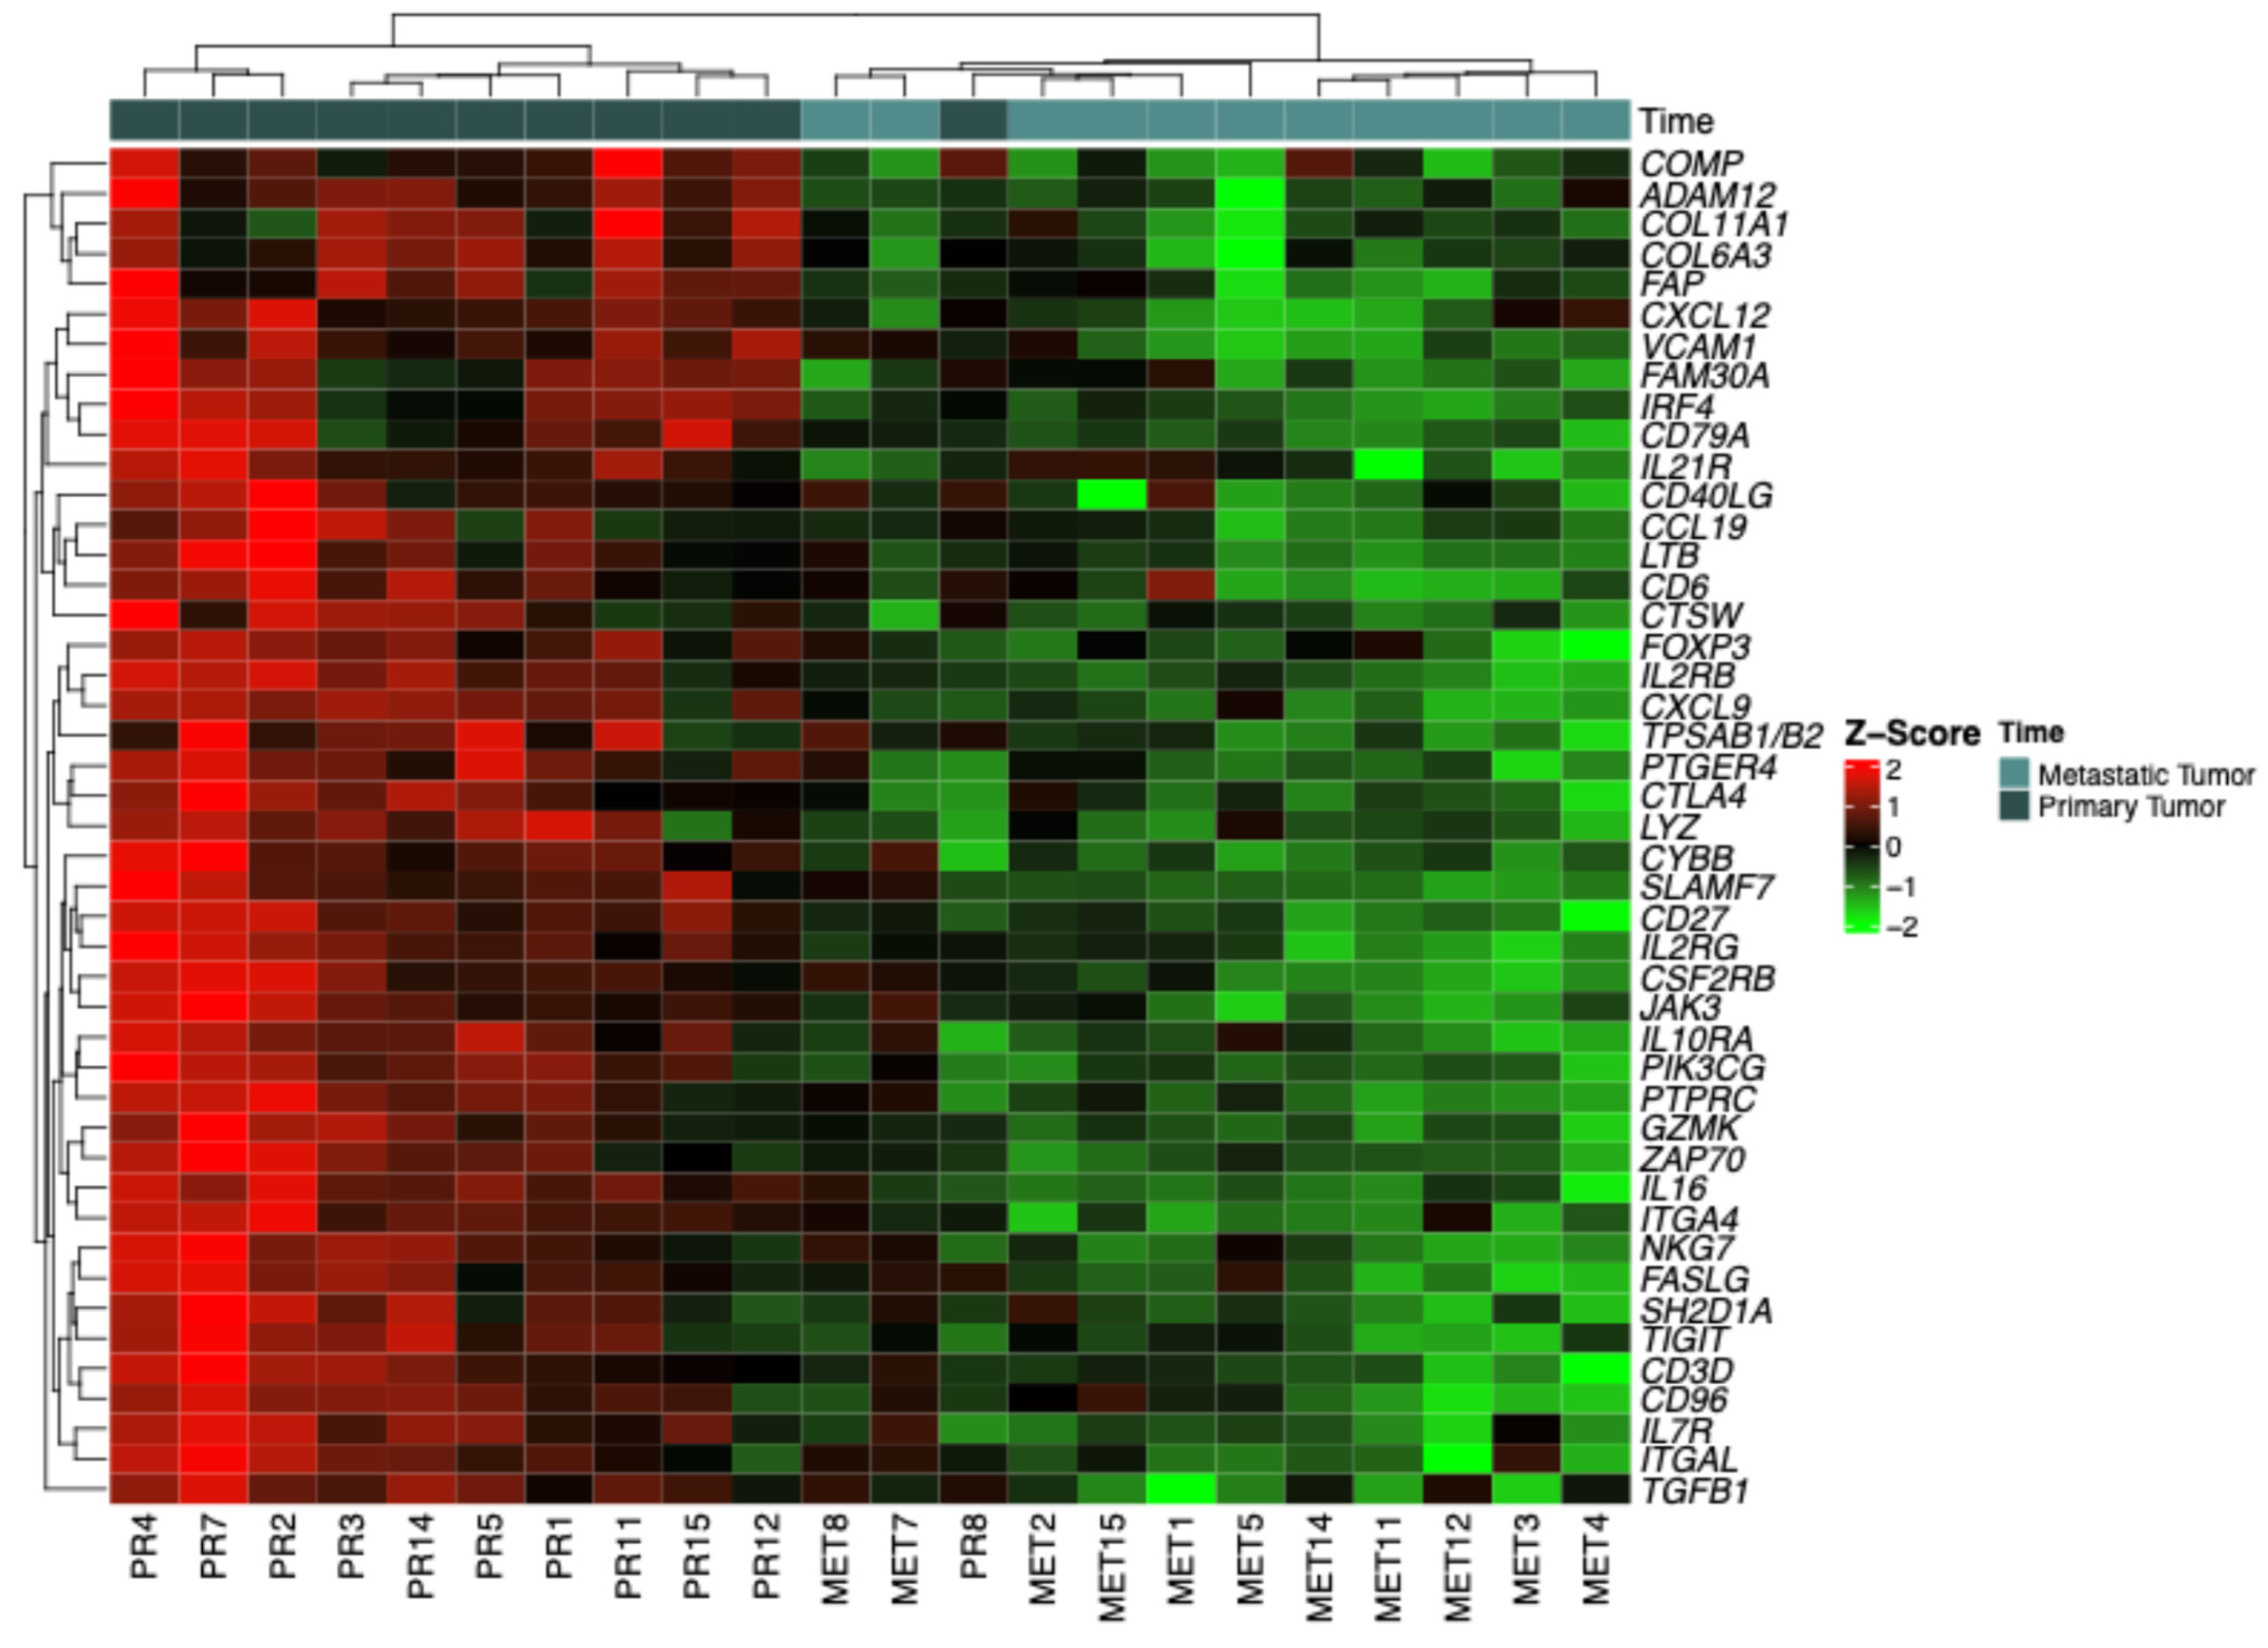
2.1. Identification of Differentially Expressed Genes

The analysis revealed 45 genes with significant differential expression between primary tumors (T1) and CNS metastases (T2). These genes were identified based on logFC (log fold-change) values, which indicate the magnitude of gene expression alterations, and statistically significant p-values. Among the most significantly altered genes were CXCL9, IL7R, CD79A, and CTSW. For instance, CXCL9 exhibited a significant reduction (logFC = −4.26, p = 0.000001), with a Z-score indicating a marked decrease in expression in CNS metastases compared to primary tumors (Table 1).

2.2. Categorization by Z-Scores

The heatmap (Figure 1) presents gene expression data standardized using Z-scores, allowing for a relative comparison between primary tumors (T1) and CNS metastases (T2). The heatmap visually demonstrates how gene expression varies between primary tumors (T1) and CNS metastases (T2) in breast cancer patients. Shades of red represent upregulation (higher expression), green indicates downregulation (lower expression), and neutral tones reflect expression near the mean (Z-score ≈ 0). Genes with intense red coloration have higher expression levels, suggesting activation or increased transcriptional activity in these samples. Conversely, genes with intense green coloration show decreased expression, indicating suppression or downregulation in the context of metastasis compared to the primary tumor. This visualization highlights distinct transcriptional patterns associated with CNS metastasis in breast cancer patients.

2.3. In Silico Analysis of Overall Survival and Recurrence-Free Survival

Survival analyses using publicly available datasets evaluated the impact of gene expression levels on overall survival (OS) and recurrence-free survival (RFS). Using publicly available datasets, patients were filtered specifically for breast cancer, and survival analyses were conducted for all identified genes. Among all the analyzed genes, CXCL9, IL7R, CD79A, and CTSW were the most significantly associated with both OS and RFS (Figure 2).

2.4. Overall Survival (OS)

Figure 2A shows the Kaplan–Meier survival curves for overall survival, highlighting the impact of gene expression levels on patient prognosis. Significant genes such as CXCL9, IL7R, CD79A, and CTSW were analyzed, and their corresponding p-values and hazard ratios (HRs) are detailed: CXCL9: p-value = 0.0001, HR = 0.68. Patients with high CXCL9 expression (red curve) have a lower risk of death, indicated by an HR < 1. IL7R: p-value = 0.002, HR = 1.45. High expression (red curve) is associated with an increased risk of death, as reflected by an HR > 1. CD79A: p-value = 0.003, HR = 0.74. High expression correlates with better survival outcomes, with an HR < 1 indicating reduced mortality risk. CTSW: p-value = 0.005, HR = 1.62. High expression (red curve) corresponds to a higher mortality risk, as shown by HR > 1. These survival curves illustrate the differential impact of gene expression on overall survival, with red and blue curves representing high- and low-expression groups, respectively.

2.5. Recurrence-Free Survival (RFS)

Figure 2B depicts the Kaplan–Meier curves for recurrence-free survival, demonstrating how gene expression levels affect cancer recurrence: CXCL9: p-value = 0.0002, HR = 0.72. High expression (red curve) is linked to a reduced risk of recurrence, reflected by an HR < 1. IL7R: p-value = 0.004, HR = 1.38. Patients with high IL7R expression (red curve) face a higher risk of recurrence, as indicated by HR > 1. CD79A: p-value = 0.007, HR = 0.76. High expression (red curve) correlates with a lower risk of recurrence, suggesting protective effects with HR < 1. CTSW: p-value = 0.009, HR = 1.55. High expression (red curve) is associated with an increased likelihood of recurrence, as HR > 1 denotes a higher recurrence risk.

2.6. Gene Expression Comparison: Primary Tumor (T1) vs. Metastasis (T2)

The genes CXCL9, IL7R, CD79A, and CTSW were selected for their significant associations with overall survival (OS) and recurrence-free survival (RFS) in breast cancer patients. Analyzing their expression levels in paired samples of primary tumors (T1) and CNS metastases (T2) revealed notable changes that reflect their roles in tumor progression and adaptation. Upon analyzing their expression in paired primary tumors (T1) and CNS metastases (T2), all four genes exhibited a significant decrease in expression in the metastatic setting. Specifically, CXCL9 showed a marked reduction in expression from T1 to T2, with a significant p-value of p = 1.64 × 10⁻⁵, indicating a loss of immune-related function that may contribute to immune evasion in metastases. IL7R also displayed a significant decline in expression (p = 0.000507), suggesting that the diminished immune signaling pathways may facilitate tumor progression in the CNS environment. CD79A was similarly downregulated in T2 compared to T1 (p = 0.000337), reflecting a decrease in B-cell activity, which could weaken the immune surveillance in the metastatic context. Finally, CTSW experienced a notable reduction in expression between T1 and T2 (p = 0.00026), suggesting that the suppressed immune response in metastases might be linked to decreased tumor suppressive activities. These consistent decreases in gene expression highlight the immune-modulatory changes that occur during metastasis to the CNS, emphasizing the potential of these genes as critical biomarkers and therapeutic targets in breast cancer (Figure 3).

2.7. Functional Enrichment Analysis of Immune-Related Genes

To explore the biological relevance of the key immune-related genes identified as differentially expressed between primary breast tumors and CNS metastases, we performed a pathway enrichment analysis using curated gene sets from KEGG, Reactome, and other canonical databases. The analysis revealed statistically significant enrichment (FDR < 0.05) in multiple immune-related and cell signaling pathways, particularly those involving B-cell- and cytokine-receptor-mediated signaling. The top enriched pathways are summarized in Table 2. Notably, CD79A and IL7R were involved in the primary immunodeficiency pathway (FDR = 1.43 × 10⁻³), which represents essential disruptions in adaptive immune cell development and function. CXCL9 and IL7R also contributed to the enrichment of the cytokine–cytokine receptor interaction pathway (FDR = 0.034), suggesting impaired immune communication and recruitment within the CNS metastatic niche. Other enriched pathways involving CD79A included B-cell activation, BCR signaling, and B-cell receptor signaling, supporting the role of altered humoral immunity. IL7R was also enriched in Interleukin-7 signaling, hematopoietic cell lineage, and FoxO signaling, pointing to disturbed lymphocyte homeostasis. CXCL9 appeared in CXCR3-mediated and IL-23-mediated signaling events, pathways known for T-cell trafficking and inflammation. Finally, CTSW showed enrichment in the lysosome and apoptosis sets, both linked to cytotoxic granule function and immune-mediated tumor clearance. These findings suggest that the downregulation of these genes in CNS metastases is not random, but functionally clustered in key immunological processes, contributing to the immune-evasive phenotype of breast cancer brain metastases.

3. Discussion

The results of this study contribute significantly to understanding the gene expression profile in breast cancer metastases to the central nervous system (CNS), an area of great importance due to the high mortality associated with these metastases [12]. We observed significant differences in gene expression between primary tumors and CNS metastases, suggesting specific cellular adaptations for colonization in the neural environment. Genes such as CXCL9 [35] and IL7R [36] showed marked decreases in metastases, which may reflect immunological modulation facilitating immune evasion. In the literature, elevated expression of CXCL9 [37] and IL7R [38] was related to an improved breast cancer prognosis. However, for CTSW and CD79A, there is no currently consistent evidence in the literature regarding their specific differential expression in the CNS. A study using machine learning identified CTSW as a prognostic marker for pancreatic cancer, whose decreased expression was related to a worse survival rate [39]. CD79A was used as a B lymphocyte infiltration prognostic marker in oral squamous cell carcinoma [40].
These findings reinforce the role of the tumor microenvironment in metastatic progression. Previous studies have shown that, for micrometastases to thrive in the CNS, a transformation of the glial environment is required to support tumor growth [41,42]. The modulation of immune-related genes observed in metastases in this study aligns with literature emphasizing that the cerebral microenvironment becomes a facilitator for tumor growth [28,43].
Additionally, the impact of gene expression levels on overall survival (OS) and recurrence-free survival (RFS) highlights the potential prognostic value of these markers.
The results also show that primary tumors and their CNS metastases have distinct molecular profiles, indicating that targeted therapies based on the primary tumor’s profile may not be fully effective for metastases. This underscores the need for personalized approaches and specific biomarker analyses for each metastatic site [44].
This study has some important limitations. First, the sample size is relatively small, which may limit the generalizability of the findings. Additionally, the genetic and phenotypic diversity of patients was not extensively analyzed, which could impact gene expression data interpretation and the applicability of findings to broader populations. Another point is that, due to the retrospective nature of the study, variability in sample collection and preservation conditions may have introduced bias in the results. Finally, focusing on specific genes and the lack of additional functional analyses limit the full understanding of the biological mechanisms underlying tumor cell adaptations to the CNS microenvironment.
Despite its limitations, this study offers several strengths that significantly enhance the current understanding of breast cancer metastases to the central nervous system. The inclusion of paired samples from both primary tumors and CNS metastases—a rare and clinically valuable dataset—adds substantial robustness and translational relevance. The use of high-resolution gene expression profiling enabled the identification of distinct transcriptional alterations, particularly involving immune-regulatory pathways.
Importantly, the focus on immune-related genes implicated in tumor surveillance adds prognostic depth to the analysis and reveals potential therapeutic targets. The comparative approach between primary tumors and matched CNS metastases further illuminates key molecular adaptations that occur during neural colonization and tumor progression.
The consistent downregulation of immune-related genes such as CXCL9, IL7R, CD79A, and CTSW in CNS metastases underscores their potential role not only as biomarkers of immune evasion but also as possible therapeutic targets. CXCL9 and CD79A have been associated with favorable prognosis and are involved in T-cell and B-cell recruitment, respectively, suggesting a role in immune surveillance. Conversely, IL7R and CTSW, while associated with worse outcomes in primary tumors, may represent context-dependent immune modulators whose suppression in the CNS could reflect immune exclusion or microenvironmental adaptation. These findings highlight the need for site-specific molecular profiling to guide therapeutic strategies and suggest that immune pathways altered in CNS lesions may provide new opportunities for personalized immunotherapeutic interventions, particularly in patients with brain metastases from breast cancer.
Although high expression of IL7R and CTSW was associated with worse prognosis in survival analyses from publicly available datasets, both genes were found to be significantly downregulated in CNS metastases compared to matched primary tumors. This apparent contradiction can be explained by the differences in the biological context of the datasets used. The survival analyses were conducted using unpaired cohorts, primarily composed of primary breast tumors, whereas the gene expression comparison in our study was based on paired samples from primary tumors and CNS metastases. The observed downregulation of IL7R and CTSW in the metastatic setting likely reflects local immune escape mechanisms or microenvironmental pressures that differ from those in the primary tumor. These genes may therefore play context-dependent roles, promoting immune resistance in primary tumors when overexpressed, but being selectively suppressed in the CNS due to the immunologically distinct environment of the brain. This interpretation underscores the complexity of immune-related gene behavior in different metastatic niches and highlights the importance of site-specific molecular profiling in understanding disease progression.

4. Materials and Methods

4.1. Sample Collection and RNA Extraction

Samples were obtained from the archives of pathological anatomy of the Barretos Cancer Hospital Pathology Department from female patients who were diagnosed with breast cancer and CNS metastasis. Eleven FFPE paired samples of primary tumors (T1) and CNS metastases (T2) were collected. FFPE tissues were macrodissected under RNase-free conditions prior to RNA extraction using the QIAsymphony platform. After RNA extraction, concentration ranged from 50 to 250 ng/µL with Qubit-confirmed quantification. Quality assessment with NanoDrop A260/280 >1.8 (Thermo Fisher Scientific, Waltham, MA, USA) met NanoString quality criteria.

4.2. Gene Expression Analysis Using NanoString Technology

Gene expression profiling was performed using the NanoString nCounter® Analysis System (NanoString Technologies, Inc., Seattle, WA, USA.), which provides a highly reproducible and amplification-free digital readout of mRNA abundance. We employed the PanCancer IO 360™ Gene Expression Panel, which includes 770 genes related to tumor biology, the tumor microenvironment, and immune regulation. Total RNA extracted from FFPE samples was hybridized to custom barcoded probe pairs, consisting of reporter and capture probes specific to each target gene. Hybridization was carried out at 65 °C overnight (21 h), in accordance with the manufacturer’s instructions, ensuring optimal hybrid formation. Following hybridization, the samples were processed using the nCounter Prep Station for automated purification and immobilization on a cartridge, followed by scanning with the nCounter Digital Analyzer, which generates direct counts of hybridized transcripts. The raw data were analyzed using nSolver™ Analysis Software, version 4.0 (NanoString Technologies, Seattle, WA, USA), which included several quality control steps: imaging QC, binding density evaluation, positive and negative control assessment, and CodeSet content validation. Data normalization was performed using the geometric mean of the validated housekeeping genes included in the panel. All samples were processed in a single batch, thereby minimizing technical variation and eliminating the need for batch effect correction.

4.3. Identification of Differentially Expressed Genes

Differential gene expression analysis between T1 and T2 was performed using the NanostringNorm package in R version 4.2.2. Genes with significant differences in expression were identified based on log fold-change (logFC) and p-values. The significant genes were those with an adjusted p-value < 0.05 and a logFC threshold defined according to predefined criteria for clinical relevance.

4.4. Z-Score Categorization and Heatmap Visualization

Gene expression data were standardized into Z-scores to compare the relative expression levels of each gene between samples. Heatmaps were generated using the ComplexHeatmap package in R version 4.2.2, displaying expression levels with a red to green color gradient. Red indicated upregulation (high expression) and green indicated downregulation (low expression), helping to visualize expression patterns in primary tumors and metastases.

4.5. Survival Analysis

In silico survival analysis was conducted using publicly available datasets from The Cancer Genome Atlas (TCGA) and Gene Expression Omnibus (GEO). Overall survival (OS) and recurrence-free survival (RFS) were assessed for each gene using Kaplan–Meier analysis and Cox proportional hazards models. Patients were stratified based on high and low levels of gene expression, and hazard ratios (HRs) were calculated to determine the impact of gene expression on survival outcomes.

5. Conclusions

Our findings highlight a consistent downregulation of immune-modulatory genes—including CXCL9, IL7R, CD79A, and CTSW—in CNS metastases. This suggests that immune suppression plays a critical role in facilitating tumor adaptation to the brain microenvironment. These genes demonstrated prognostic value in in silico survival analyses and may serve as biomarkers for clinical stratification or therapeutic intervention.
Together, these results emphasize the need for site-specific molecular profiling, as relying solely on the primary tumor’s molecular landscape may overlook critical alterations in metastatic lesions. Tailoring treatment strategies based on the biology of the metastatic site may ultimately improve outcomes for patients with breast cancer brain metastases.

Author Contributions

Conceptualization, A.J.A.d.F. and M.B.V.; Methodology, S.C., R.L.C., V.D.d.S. and C.d.P.S.; Formal analysis, A.J.A.d.F. and M.B.V.; Writing—original draft, A.J.A.d.F. and M.B.V.; Project administration, M.M.C.M. All authors have read and agreed to the published version of the manuscript.

Funding

This study received support from the Sao Paulo Research Foundation (FAPESP) through a Regular Research Grant (process number 2018/19741-7) and PhD Scholarship (process number 2020/07773-9). The opinions, hypotheses, and conclusions or recommendations expressed in this material are the author’s responsibility and do not necessarily reflect the views of FAPESP.

Institutional Review Board Statement

This study was conducted at the Molecular Oncology Research Center of the Pio XII Foundation—Barretos Cancer Hospital (BCH), Barretos, Sao Paulo, Brazil, and it was approved by the Barretos Cancer Hospital Research Ethics Committee, under the number: 1888/2019.

Informed Consent Statement

Patient consent was waived due to the retrospective nature of the study, which used archived FFPE tumor samples from the pathology department of Barretos Cancer Hospital. The study did not involve direct patient contact, interviews, or any form of experimentation. All selected cases refer to patients with advanced breast cancer who are most likely deceased. Only gene expression data were analyzed, and all data were anonymized to ensure full confidentiality. This waiver was approved by the institutional ethics committee.

Data Availability Statement

The data presented in this study are available on request from the corresponding author. The data are not publicly available due to restrictions related to patient confidentiality and institutional data use policies.

Conflicts of Interest

The authors declare no conflict of interest.

References

  1. Bray, F.; Laversanne, M.; Sung, H.; Ferlay, J.; Siegel, R.L.; Soerjomataram, I.; Jemal, A. Global cancer statistics 2022: GLOBOCAN estimates of incidence and mortality worldwide for 36 cancers in 185 countries. CA Cancer J. Clin. 2024, 74, 229–263. [Google Scholar] [CrossRef]
  2. Instituto Nacional de Câncer (INCA). Estimativa 2023: Incidência de Câncer no Brasil; Instituto Nacional De Câncer: Rio de Janeiro, Brazil, 2023; ISBN 9786588517093.
  3. Anderson, W.F.; Rosenberg, P.S.; Prat, A.; Perou, C.M.; Sherman, M.E. How Many Etiological Subtypes of Breast Cancer: Two, Three, Four, or More? J. Natl. Cancer Inst. 2014, 106, dju165. [Google Scholar] [CrossRef]
  4. Perou, C.M.; Sørlie, T.; Eisen, M.B.; van de Rijn, M.; Jeffrey, S.S.; Rees, C.A.; Pollack, J.R.; Ross, D.T.; Johnsen, H.; Akslen, L.A.; et al. Molecular portraits of human breast tumours. Nature 2000, 406, 747–752. [Google Scholar] [CrossRef]
  5. Januškevičienė, I.; Petrikaitė, V. Heterogeneity of breast cancer: The importance of interaction between different tumor cell populations. Life Sci. 2019, 239, 117009. [Google Scholar] [CrossRef]
  6. Ganesh, K.; Massagué, J. Targeting metastatic cancer. Nat. Med. 2021, 27, 34–44. [Google Scholar] [CrossRef] [PubMed]
  7. Gerstberger, S.; Jiang, Q.; Ganesh, K. Metastasis. Cell 2023, 186, 1564–1579. [Google Scholar] [CrossRef] [PubMed]
  8. Castaneda, M.; den Hollander, P.; Kuburich, N.A.; Rosen, J.M.; Mani, S.A. Mechanisms of cancer metastasis. Semin. Cancer Biol. 2022, 87, 17–31. [Google Scholar] [CrossRef]
  9. Lin, N.U.; Bellon, J.R.; Winer, E.P. CNS Metastases in Breast Cancer. J. Clin. Oncol. 2004, 22, 3608–3617. [Google Scholar] [CrossRef]
  10. Tsukada, Y.; Fouad, A.; Pickren, J.W.; Lane, W.W. Central nervous system metastasis from breast carcinoma. Autopsy study. Cancer 1983, 52, 2349–2354. [Google Scholar] [CrossRef]
  11. Altundag, K.; Bondy, M.L.; Mirza, N.Q.; Kau, S.-W.; Broglio, K.; Hortobagyi, G.N.; Rivera, E. Clinicopathologic characteristics and prognostic factors in 420 metastatic breast cancer patients with central nervous system metastasis. Cancer 2007, 110, 2640–2647. [Google Scholar] [CrossRef]
  12. Witzel, I.; Oliveira-Ferrer, L.; Pantel, K.; Müller, V.; Wikman, H. Breast cancer brain metastases: Biology and new clinical perspectives. Breast Cancer Res. 2016, 18, 8. [Google Scholar] [CrossRef] [PubMed]
  13. Graesslin, O.; Abdulkarim, B.S.; Coutant, C.; Huguet, F.; Gabos, Z.; Hsu, L.; Marpeau, O.; Uzan, S.; Pusztai, L.; Strom, E.A.; et al. Nomogram to Predict Subsequent Brain Metastasis in Patients with Metastatic Breast Cancer. J. Clin. Oncol. 2010, 28, 2032–2037. [Google Scholar] [CrossRef] [PubMed]
  14. Quigley, M.R.; Fukui, O.; Chew, B.; Bhatia, S.; Karlovits, S. The shifting landscape of metastatic breast cancer to the CNS. Neurosurg. Rev. 2013, 36, 377–382. [Google Scholar] [CrossRef] [PubMed]
  15. Niikura, N.; Hayashi, N.; Masuda, N.; Takashima, S.; Nakamura, R.; Watanabe, K.; Kanbayashi, C.; Ishida, M.; Hozumi, Y.; Tsuneizumi, M.; et al. Treatment outcomes and prognostic factors for patients with brain metastases from breast cancer of each subtype: A multicenter retrospective analysis. Breast Cancer Res. Treat. 2014, 147, 103–112. [Google Scholar] [CrossRef]
  16. Amir, E.; Clemons, M. Should a biopsy be recommended to confirm metastatic disease in women with breast cancer? Lancet Oncol. 2009, 10, 933–935. [Google Scholar] [CrossRef]
  17. Karagöz Özen, D.S.; Ozturk, M.A.; Aydin, Ö.; Turna, Z.H.; Ilvan, S.; Özgüroglu, M. Receptor expression discrepancy between primary and metastatic breast cancer lesions. Oncol. Res. Treat. 2014, 37, 622–626. [Google Scholar] [CrossRef]
  18. Van Poznak, C.; Somerfield, M.R.; Bast, R.C.; Cristofanilli, M.; Goetz, M.P.; Gonzalez-Angulo, A.M.; Hicks, D.G.; Hill, E.G.; Liu, M.C.; Lucas, W.; et al. Use of Biomarkers to Guide Decisions on Systemic Therapy for Women With Metastatic Breast Cancer: American Society of Clinical Oncology Clinical Practice Guideline. J. Clin. Oncol. 2015, 33, 2695–2704. [Google Scholar] [CrossRef]
  19. Regitnig, P.; Schippinger, W.; Lindbauer, M.; Samonigg, H.; Lax, S.F. Change of HER-2/neu status in a subset of distant metastases from breast carcinomas. J. Pathol. 2004, 203, 918–926. [Google Scholar] [CrossRef]
  20. Nishimura, R.; Osako, T.; Okumura, Y.; Tashima, R.; Toyozumi, Y.; Arima, N. Changes in the ER, PgR, HER2, p53 and Ki-67 biological markers between primary and recurrent breast cancer: Discordance rates and prognosis. World J. Surg. Oncol. 2011, 9, 131. [Google Scholar] [CrossRef]
  21. Nishizuka, I.; Ishikawa, T.; Hamaguchi, Y.; Kamiyama, M.; Ichikawa, Y.; Kadota, K.; Miki, R.; Tomaru, Y.; Mizuno, Y.; Tominaga, N.; et al. Analysis of gene expression involved in brain metastasis from breast cancer using cDNA microarray. Breast Cancer 2002, 9, 26–32. [Google Scholar] [CrossRef]
  22. Da Silva, L.; Simpson, P.T.; Smart, C.E.; Cocciardi, S.; Waddell, N.; Lane, A.; Morrison, B.J.; Vargas, A.C.; Healey, S.; Beesley, J.; et al. HER3 and downstream pathways are involved in colonization of brain metastases from breast cancer. Breast Cancer Res. 2010, 12, R46. [Google Scholar] [CrossRef]
  23. Thomson, A.H.; McGrane, J.; Mathew, J.; Palmer, J.; Hilton, D.A.; Purvis, G.; Jenkins, R. Changing molecular profile of brain metastases compared with matched breast primary cancers and impact on clinical outcomes. Br. J. Cancer 2016, 114, 793–800. [Google Scholar] [CrossRef]
  24. Lee, S.S.; Ahn, J.-H.; Kim, M.K.; Sym, S.J.; Gong, G.; Ahn, S.D.; Kim, S.-B.; Kim, W.K. Brain metastases in breast cancer: Prognostic factors and management. Breast Cancer Res. Treat. 2008, 111, 523–530. [Google Scholar] [CrossRef]
  25. Kyeong, S.; Cha, Y.J.; Ahn, S.G.; Suh, S.H.; Son, E.J.; Ahn, S.J. Subtypes of breast cancer show different spatial distributions of brain metastases. PLoS ONE 2017, 12, e0188542. [Google Scholar] [CrossRef] [PubMed]
  26. Neman, J.; Choy, C.; Kowolik, C.M.; Anderson, A.; Duenas, V.J.; Waliany, S.; Chen, B.T.; Chen, M.Y.; Jandial, R. Co-evolution of breast-to-brain metastasis and neural progenitor cells. Clin. Exp. Metastasis 2013, 30, 753–768. [Google Scholar] [CrossRef] [PubMed]
  27. Momeny, M.; Saunus, J.M.; Marturana, F.; McCart Reed, A.E.; Black, D.; Sala, G.; Iacobelli, S.; Holland, J.D.; Yu, D.; Da Silva, L.; et al. Heregulin-HER3-HER2 signaling promotes matrix metalloproteinase-dependent blood-brain-barrier transendothelial migration of human breast cancer cell lines. Oncotarget 2015, 6, 3932–3946. [Google Scholar] [CrossRef] [PubMed]
  28. Neman, J.; Termini, J.; Wilczynski, S.; Vaidehi, N.; Choy, C.; Kowolik, C.M.; Li, H.; Hambrecht, A.C.; Roberts, E.; Jandial, R. Human breast cancer metastases to the brain display GABAergic properties in the neural niche. Proc. Natl. Acad. Sci. USA 2014, 111, 984–989. [Google Scholar] [CrossRef]
  29. Zhang, L.; Wang, L.; Yang, H.; Li, C.; Fang, C. Identification of potential genes related to breast cancer brain metastasis in breast cancer patients. Biosci. Rep. 2021, 41, BSR20211615. [Google Scholar] [CrossRef]
  30. Gril, B.; Palmieri, D.; Qian, Y.; Anwar, T.; Liewehr, D.J.; Steinberg, S.M.; Andreu, Z.; Masana, D.; Fernández, P.; Steeg, P.S.; et al. Pazopanib inhibits the activation of PDGFRβ-expressing astrocytes in the brain metastatic microenvironment of breast cancer cells. Am. J. Pathol. 2013, 182, 2368–2379. [Google Scholar] [CrossRef]
  31. Hahn, W.C.; Bader, J.S.; Braun, T.P.; Califano, A.; Clemons, P.A.; Druker, B.J.; Ewald, A.J.; Fu, H.; Jagu, S.; Kemp, C.J.; et al. An expanded universe of cancer targets. Cell 2021, 184, 1142–1155. [Google Scholar] [CrossRef]
  32. Chakravarty, D.; Solit, D.B. Clinical cancer genomic profiling. Nat. Rev. Genet. 2021, 22, 483–501. [Google Scholar] [CrossRef]
  33. Quinn, J.J.; Jones, M.G.; Okimoto, R.A.; Nanjo, S.; Chan, M.M.; Yosef, N.; Bivona, T.G.; Weissman, J.S. Single-cell lineages reveal the rates, routes, and drivers of metastasis in cancer xenografts. Science 2021, 371, eabc1944. [Google Scholar] [CrossRef]
  34. Ionkina, A.A.; Balderrama-Gutierrez, G.; Ibanez, K.J.; Phan, S.H.D.; Cortez, A.N.; Mortazavi, A.; Prescher, J.A. Transcriptome analysis of heterogeneity in mouse model of metastatic breast cancer. Breast Cancer Res. 2021, 23, 93. [Google Scholar] [CrossRef] [PubMed]
  35. Pedrosa, R.M.S.M.; Kros, J.M.; Schrijver, B.; Berrevoets, C.; Marques, R.B.; van Eijck, C.C.H.J.; Debets, R.; Leenen, P.M.; Dik, W.A.; Mustafa, D.M. T lymphocyte-derived IFN-γ facilitates breast cancer cells to pass the blood-brain barrier: An in vitro study corroborating translational data. Heliyon 2024, 10, e36598. [Google Scholar] [CrossRef] [PubMed]
  36. Liang, J.; Zhu, L.; Li, J.; Wu, K.; Zhang, M.; Ma, S.; Chen, X.; Xia, B. Comprehensive analysis to identify IL7R as a immunotherapy biomarker from pan-cancer analysis to in vitro validation. Discov. Oncol. 2024, 15, 509. [Google Scholar] [CrossRef] [PubMed]
  37. Li, Y.; Liang, M.; Lin, Y.; Lv, J.; Chen, M.; Zhou, P.; Fu, F.; Wang, C. Transcriptional Expressions of CXCL9/10/12/13 as Prognosis Factors in Breast Cancer. J. Oncol. 2020, 2020, 4270957. [Google Scholar] [CrossRef]
  38. Yu, X.; Zhang, H.; Liu, J.; Hou, C.; Zhang, H.; Yang, Z. IL-7R Expression Correlates with Prognosis in Breast Cancer. Comb. Chem. High Throughput Screen. 2024, 28, 973–987. [Google Scholar] [CrossRef]
  39. Khojasteh-Leylakoohi, F.; Mohit, R.; Khalili-Tanha, N.; Asadnia, A.; Naderi, H.; Pourali, G.; Yousefli, Z.; Khalili-Tanha, G.; Khazaei, M.; Maftooh, M.; et al. Down regulation of Cathepsin W is associated with poor prognosis in pancreatic cancer. Sci. Rep. 2023, 13, 16678. [Google Scholar] [CrossRef]
  40. Yao, S.; Huang, Z.; Wei, C.; Wang, Y.; Xiao, H.; Chen, S.; Huang, Z. CD79A work as a potential target for the prognosis of patients with OSCC: Analysis of immune cell infiltration in oral squamous cell carcinoma based on the CIBERSORTx deconvolution algorithm. BMC Oral Health 2023, 23, 411. [Google Scholar] [CrossRef]
  41. Fidler, I.J. The role of the organ microenvironment in brain metastasis. Semin. Cancer Biol. 2011, 21, 107–112. [Google Scholar] [CrossRef]
  42. Zhang, Y.; Zhang, Y.; Niu, W.; Ge, X.; Huang, F.; Pang, J.; Li, X.; Wang, Y.; Gao, W.; Fan, F.; et al. Experimental Study of Almonertinib Crossing the Blood-Brain Barrier in EGFR-Mutant NSCLC Brain Metastasis and Spinal Cord Metastasis Models. Front. Pharmacol. 2021, 12, 750031. [Google Scholar] [CrossRef]
  43. Wang, H.; Ou, Q.; Li, D.; Qin, T.; Bao, H.; Hou, X.; Wang, K.; Wang, F.; Deng, Q.; Liang, J.; et al. Genes associated with increased brain metastasis risk in non-small cell lung cancer: Comprehensive genomic profiling of 61 resected brain metastases versus primary non-small cell lung cancer (Guangdong Association Study of Thoracic Oncology 1036). Cancer 2019, 125, 3535–3544. [Google Scholar] [CrossRef]
  44. Padzińska-Pruszyńska, I.B.; Akbar, M.W.; Isbilen, M.; Górka, E.; Kucukkaraduman, B.; Canlı, S.D.; Dedeoğlu, E.; Azizolli, S.; Cela, I.; Akcay, A.G.; et al. Breast Cancer Plasticity after Chemotherapy Highlights the Need for Re-Evaluation of Subtyping in Residual Cancer and Metastatic Tissues. Int. J. Mol. Sci. 2024, 25, 6054. [Google Scholar] [CrossRef]
Figure 1. Heatmap representing differential gene expression between primary tumors (T1) and CNS metastases (T2).
Ijms 26 06944 g001
Figure 2. In silico analysis of (A) overall survival and (B) recurrence-free survival.
Ijms 26 06944 g002
Figure 3. Gene expression comparison: primary tumor (T1) vs. metastasis (T2).
Ijms 26 06944 g003
Table 1. Genes differentially expressed between primary tumors (T1) and CNS metastases (T2).
GenesLog Fold-Changep-ValueProtein Function
CXCL9−4.260.000001Chemotactic for T-cells
IRF4−2.330.000002Interferon regulation
IL2RB−2.100.000003T-cell-mediated immune response
IL16−1.780.000005Modulator of T-cell activation
IL2RG−1.630.000006Signaling component of interleukin receptors
CD27−2.180.000006Maintenance of T-cell immunity
ITGA4−1.410.000009Cell surface adhesion and signaling
CXCL12−1.660.000141Signaling receptor and chemokine activity
COMP−2.610.000153Extracellular matrix protein
COL6A3−2.320.000167Binding to extracellular matrix
CD79A−2.400.000376B-cell antigen component
VCAM1−1.590.000391Leukocyte–endothelial cell adhesion
SLAMF7−1.540.000491Protein binding activity
GZMK−1.580.000553Serine proteases
LTB−1.990.000568Inflammatory response system
JAK3−1.540.000621Cytokine receptor-mediated
ADAM12−1.550.000646Cell–matrix interactions
FASLG−1.450.000670Induction of apoptosis
CTSW−1.520.000736Regulation of T-cell cytolytic activity
CSF2RB−1.370.000839Interleukin-3 receptor activity
FAM30A−1.580.000894LncRNA class
CD3D−1.720.000904T-cell development and signal transduction
ZAP70−1.440.000112T-cell development and lymphocyte activation
PIK3CG−1.200.000117Cell growth, survival, proliferation, and motility
FAP−1.170.000161Epithelial–mesenchymal interactions
TPSAB1/B2−2.440.000170Tryptases
IL7R−1.680.000189Lymphocyte development
COL11A1−2,000.000253Extracellular matrix structural constituent
CTLA4−1.390.000337Inhibitory signal to T-cells
LYZ−2.030.000357Antitumor immune activity
PTPRC−1.400.000365Cell growth, differentiation, and mitosis
CD6−1.200.000388Binding site for adhesion molecules
NKG7−1.840.000417Regulates cytotoxic granule exocytosis
PTGER4−1.040.000435Activates T-cell factor signaling
CCL19−1.960.000465Immunoregulatory and inflammatory processes
TIGIT−1.450.000497Signaling receptor binding
CD96−1.100.000519Adhesive interactions of activated T- and NK cells
CYBB−1.430.000712Microbicidal oxidase system of phagocytes
FOXP3−0.990.000725DNA-binding transcription factor activity
CD40LG−1.110.000758Regulates B-cell function
TGFB1−0.820.000778Regulates gene expression
IL21R−1.200.000835Proliferation and differentiation of immune cells
ITGAL−1.290.000900Leukocyte intercellular adhesion
IL10RA−1.090.000990Related to interferon receptors
SH2D1A−1.290.016551Stimulation of T- and B-cells
Table 2. Pathway enrichment analysis of selected immune-related genes.
Gene SetRatio of
Proteins
Proteins in PathwayGenes From Networkp-ValueFDRInvolved Genes
Primary immunodeficiency (KEGG)0.00323825.95 × 10−50.00143CD79A, IL7R
Cytokine–cytokine receptor interaction (KEGG)0.024529523.48 × 10−30.034CXCL9, IL7R
ctcf: first multivalent nuclear factor (BioCarta)0.00182217.29 × 10−30.034CD79A
Interleukin-7 signaling (Reactome)0.00182217.29 × 10−30.034IL7R
BCR signaling pathway (BioCarta)0.00222618.61 × 10−30.034CD79A
CXCR3-mediated signaling events (NCI)0.00293510.0120.034CXCL9
IL-23-mediated signaling events (NCI)0.00313710.0120.034CXCL9
B-cell activation (PID)0.00394710.0160.034CD79A
BCR signaling pathway (NCI)0.00546510.0210.034CD79A
B-cell receptor signaling pathway (KEGG)0.00688210.0270.034CD79A
Hematopoietic cell lineage (KEGG)0.00829910.0320.034IL7R
Viral protein interaction with cytokine and cytokine receptor (KEGG)0.008310010.0330.034CXCL9
Toll-like receptor signaling pathway (KEGG)0.008610410.0340.034CXCL9
Clathrin-mediated endocytosis (Reactome)0.010312410.0410.041IL7R
Lysosome (KEGG)0.010612810.0420.042CTSW
FoxO signaling pathway (KEGG)0.010913110.0430.043IL7R
Apoptosis (KEGG)0.011313610.0440.044CTSW
Disclaimer/Publisher’s Note: The statements, opinions and data contained in all publications are solely those of the individual author(s) and contributor(s) and not of MDPI and/or the editor(s). MDPI and/or the editor(s) disclaim responsibility for any injury to people or property resulting from any ideas, methods, instructions or products referred to in the content.

