Review

Neuromuscular Activity Determines, at Least in Part, the Motoneuron, Nerve and Muscle Properties Under Normal Conditions and After Nerve Injury

Department of Surgery, Division of Plastic Reconstructive Surgery, University of Toronto, Toronto, ON M5G 1X8, Canada
Int. J. Mol. Sci. 2025, 26(14), 6891; https://doi.org/10.3390/ijms26146891
Submission received: 28 April 2025 / Revised: 26 June 2025 / Accepted: 1 July 2025 / Published: 17 July 2025
(This article belongs to the Section Molecular Neurobiology)

Abstract

Whether pattern or amount of daily activity determines neuromuscular properties is the focus of this review. The fast-to-slow conversion of many properties of fast-twitch muscles, by stimulating their nerves electrically with the continuous low-frequency pattern typical of slow motoneurons, argued that muscle properties are determined by their pattern of activity. However, the composition of the motor units (MUs) in almost all muscles is heterogeneous, with the MUs grouped into slow, fast-fatigue-resistant and fast-fatigable types that match corresponding histochemical fiber types. Nonetheless, their contractile forces lie on a continuum, with MUs recruited into activity in order of their size. This ‘size principle’ of MU organization and function applies in normally innervated and reinnervated muscles and, importantly, begs the question of whether it is the amount rather than the pattern of the MU activation that determines their properties. Experimental evidence that uniform daily amounts of ~<0.5, 5%, and 50% ES, converted motoneuron, nerve, and muscle properties to one physiological and histochemical type, argued in favor of the amount of activity determining MU properties. Yet, that the properties were not confined to the expected narrow range argued that factors other than the pattern and/or amount of neuromuscular activity must be considered. These include the progressive increase in the synaptic inputs onto motoneurons. The range of the effects of endurance and intermittent exercise programs on healthy subjects and those suffering nerve injuries and disease is also consistent with the argument that factors other than pattern or amount of neuromuscular activity should be investigated.

1. Introduction

Mammalian fast- and slow-twitch skeletal muscles were first identified as red and white in the 1800s on the basis of their color [1,2] and fatiguability [3]. The high endurance of the slow-twitch muscles for repetitive muscle contractions [4] is associated with their high resting blood flow and oxidative/glycolytic ratios [5,6]. There are, however, few (if any) homogenous muscles with regard to the composition of their muscle fibers [7]. The majority of the fast-twitch muscles have a separate deep compartment, which contains slow oxidative (SO; type I) muscle fibers that are intermingled with fast-oxidative-glycolytic (FOG; type IIA) fibers, and a superficial and larger compartment in which the fast fibers of both FOG and fast-glycolytic (FG, type IIB) types reside [8,9,10,11,12]. The slow-twitch muscles, in contrast, are either homogenous, with slow-twitch soleus (SOL) muscles in cat hindlimbs and human legs having only SO fibers, or the muscles include a small number of FOG fibers [7]. These slow-twitch muscles are located deep within limbs and close to bone [8,10].
In the early 20th century, Sherrington [13] coined the term motor unit (MU) for the motoneuron and the muscle fibers it supplies. He referred to the MU as the final common pathway of the nervous system because all the processing in the central nervous system results in activation of the MUs and, in turn, movement. The MU includes the motoneuron (cell body, dendrites and axon) and the muscle unit (MusU), the muscle fibers it supplies. The MusUs were first divided into slow (S) and fast (F) on the basis of the twitch contractile speed [14]. Burke and colleagues then divided the F units in to fast-fatigue resistant (FR) and fast-fatigable (FF) MusUs in the cat medial gastrocnemius (MG) muscle on the basis of their fatigability and distinguished S from F MusUs by the absence and presence of ‘sag’ of their unfused tetanic contractions in response to the stimulus train of 25 pulses/s (second) rather than on their twitch contraction times [14,15,16]. The last MusU that was isolated and identified as S, FR or FF was stimulated repetitively, as described by Edstrom and Kugelberg [16], to deplete the MusU fibers for subsequent histochemical analysis and classification as SO, FOG or FG [17]. The excellent correspondence of the physiological and histochemical criteria in the isolated MusUs formed the basis of the Burke MusU classification that remains widely used in many studies [18]. The distinction of the muscle fiber types on the basis of their myosin ATPase is due to differences in myosin heavy chains, each of which is coded by a separate gene [18]. There are several, however, as there are of the myosin light chains [19]. The biochemical analysis of enzyme activities in single muscle fibers revealed a continuum of enzyme activities, but the MusU fibers are homogeneous with relatively little variance between them, as compared to the variance between muscle fibers of the same histochemical type 1 [20,21].
The pattern of neuromuscular activity was advocated by Vrbová and Pette as responsible for the plasticity that fast- and slow-twitch muscles display in their capacity to alter their properties in response to imposed activity by electrical stimulation [20,22,23,24,25]. On the other hand, the experiments of Kernell and colleagues [26,27,28,29] and Gordon and colleagues [30,31,32,33,34,35] provided equally compelling evidence that the amount of neuromuscular activity determines their properties, including those of the motoneurons and their motor nerves. This review concerns evidence for and against these two competing explanations for the differences in the neuromuscular properties. In addition, several other factors, including the intrinsic regulation of slow and fast muscle fiber phenotypes and different mechanical conditions, are imposed by their locations deep and more superficially, respectively [36,37,38,39].

2. Pattern of Neuromuscular Activity

2.1. Muscle Cross-Reinnervation

A seminal paper published by Buller, Eccles and Eccles in 1960 suggested that the muscle phenotype is determined by the motoneuron [40]. They used the experimental paradigm of cross-reinnervation of fast- and slow-twitch muscles in the cat hindlimb to examine whether and how the nerve determines the properties of the muscle that it supplies. The slow-twitch SOL muscle nerve was cut and sutured to the distal stump of the cut ‘fast’ nerve to one of several fast-twitch muscles in kittens and adult cats. Recordings of the isometric force of the cross-reinnervated muscles demonstrated that the apparent fast-to-slow conversion of the fast-twitch muscles, the time-to-peak force and the relaxation time of the twitch contraction slowed, and a slow-to-fast conversion of the slow-twitch SOL muscle. Yet, as illustrated in Figure 1, the conversions were incomplete with neither cross-reinnervated muscles, displaying the contractile speeds of the unoperated fast- and slow-twitch muscles [40].

2.2. Electrical Stimulation

Buller et al. [40] attributed the muscle speed conversions to “trophic” effects of the cross-reinnervating nerves but, they provided an alternate explanation of Huxley that the different activation patterns of low steady and the short-lived high-frequency firing rates typical of slow- and fast-MusUs, respectively [4,41,42,43,44,45], were responsible for the conversions. In support of Huxley’s explanation, (1) the SOL muscle became fast-contracting after eliminating the stretch reflex-induced muscle contractions by cutting the muscle tendon—tenotomy [46], and (2) the fast-contracting tibialis anterior (TA) muscle became slow-contracting in response to continuous low-frequency (10 Hz) electrical stimulation (ES) of the common peroneal (CP) nerve after all the natural neuromuscular activity of the hindlimb was eliminated by spinal cord transection at T11 and L1 levels (Figure 2A; [47]).
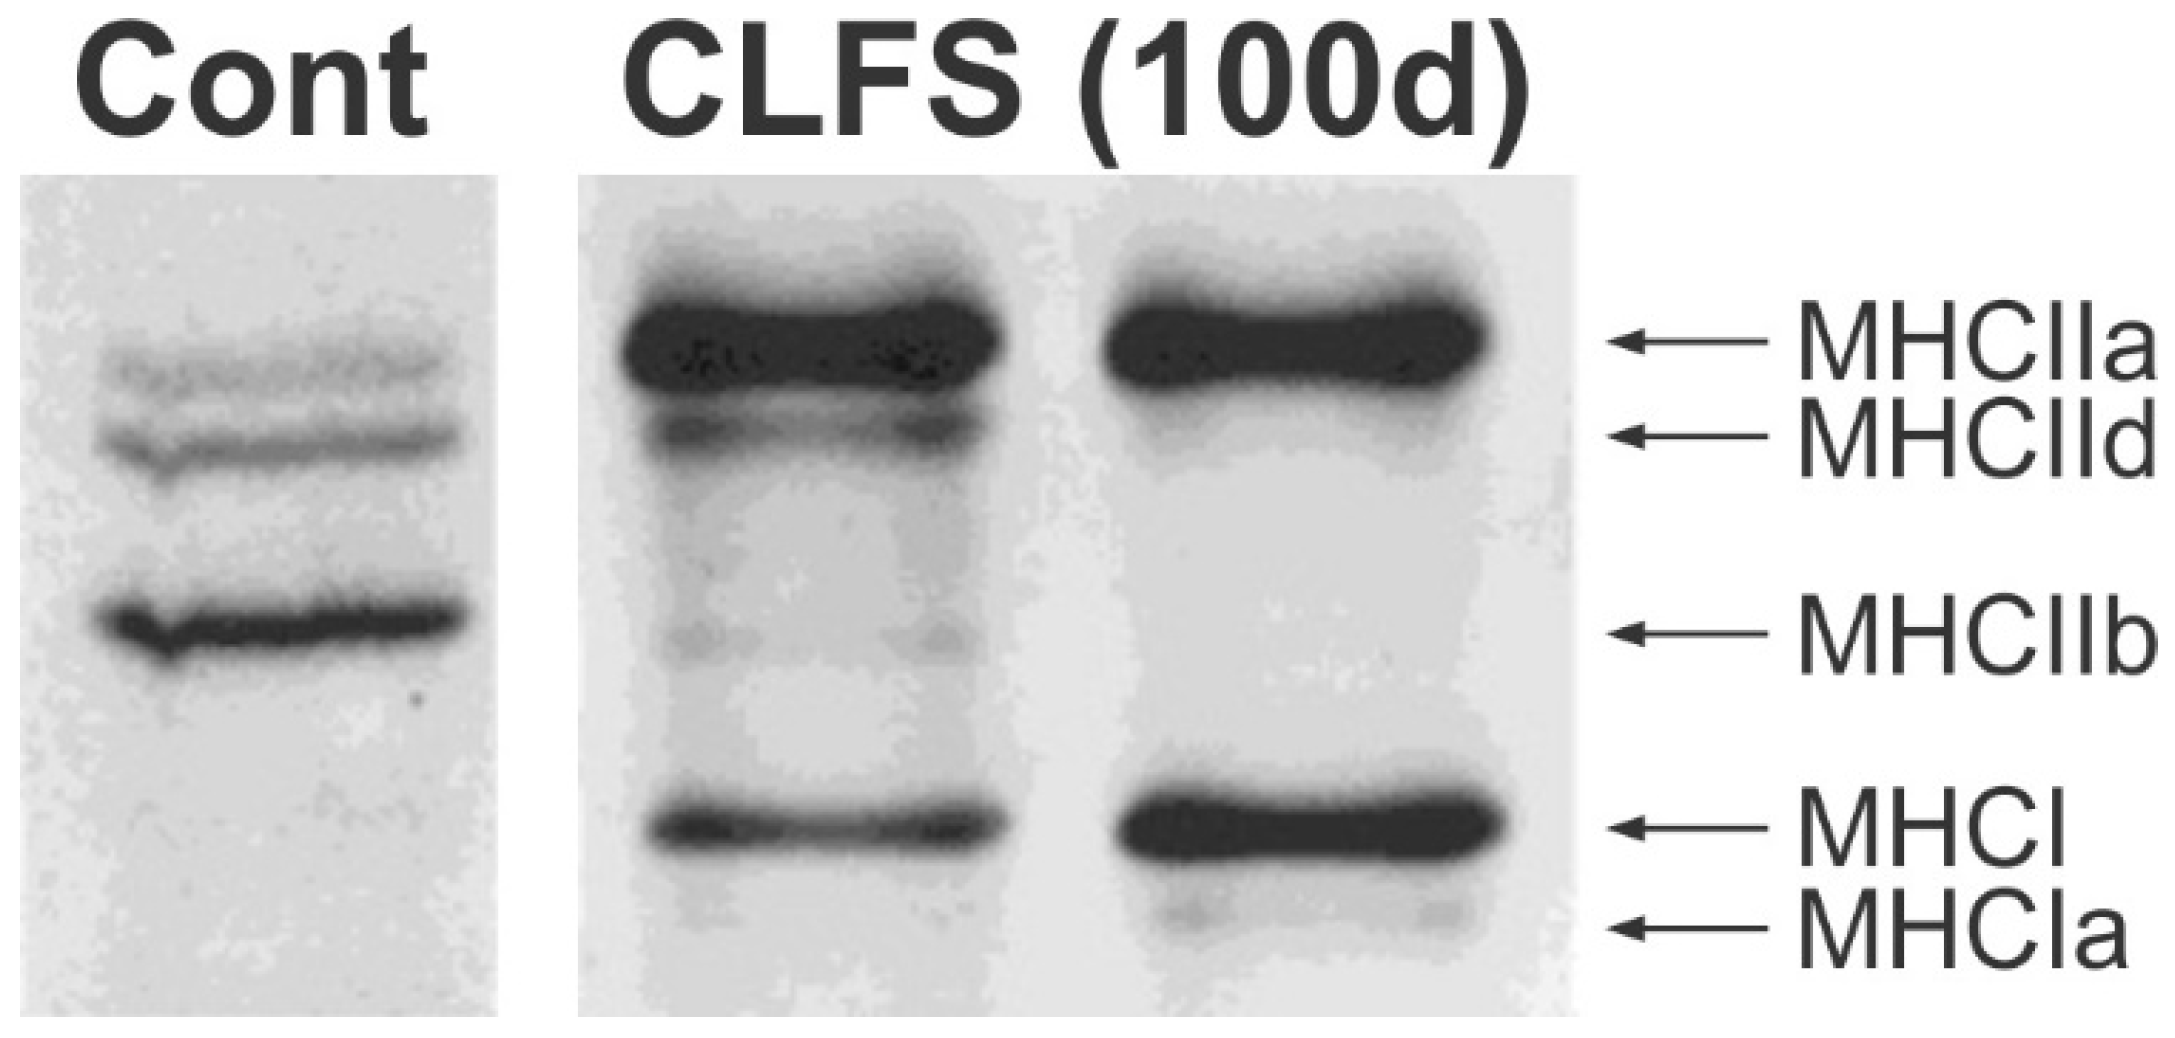
Extensive studies followed to demonstrate fast-to-slow histochemical, immunological and molecular conversions of fast-twitch muscles by continuous, low-frequency ES [23,24,25]. These included the fast-to-slow conversion of TA muscles with enhanced capillarization and blood flow, conversion from anaerobic to aerobic metabolism, fast-to-slow conversion of myosin isoforms, calcium regulatory proteins including sarcoplasmic reticulum Ca2+-ATPase, the α-subunit of the dihydropyridine receptor and calsequestrin, and the gene expression of troponin and tropomyosin in the sarcoplasmic reticulum [10,19,21,23,24,25,48,49]. For example, myosin isoforms transform from MHCIIb to MHCI and MHCIIa in rat TA (Figure 3; [19]) and from MHCIId/x to MHCI in human vastus lateralis muscle (VL) biopsies [50]. Within days of daily ES, mRNA levels [51,52,53] and activities of the enzymes of the citric acid cycle, fatty acid β-oxidation and the respiratory chain increase significantly [51]. The enzymes include the aerobic enzymes, succinic dehydrogenase and NADH, which increase concurrently with an increase in the number of mitochondria per muscle fibre Williams 1987 [52] and with the decline in anaerobic glycolytic enzyme activities, with the changes following an exponential time course [48]. Examples of increased oxidative enzyme activity with a concomitant decline in glycolytic enzyme activity were demonstrated in human VL muscle biopsies [50].
Lomo and colleagues, recognising the deficiency of research on the effects of a fast pattern of ES, used the denervated SOL muscle as the model in which to compare the effects of ES in the continuous slow and high frequency stimulation patterns and those of ES in an intermittent high frequency pattern [54,55]. The investigators independently varied the number and frequency of the electrical pulses that were imposed by the chronic stimulation. Their conclusions were that large numbers of stimulus pulses had a slowing effect on the denervated SOL muscle that was greatest at the low firing frequencies of 10–20 Hz [55,56], typical of the normal SOL MUs [56,57]. Consistent with this conclusion are the findings that SOL muscle contractions become faster when the ‘amount of activity’ is reduced by limb immobilization [58,59], spinal cord transection [60] and denervating antagonistic muscles [61,62].

3. Amount of Neuromuscular Activity

3.1. Kernell’s Experiments

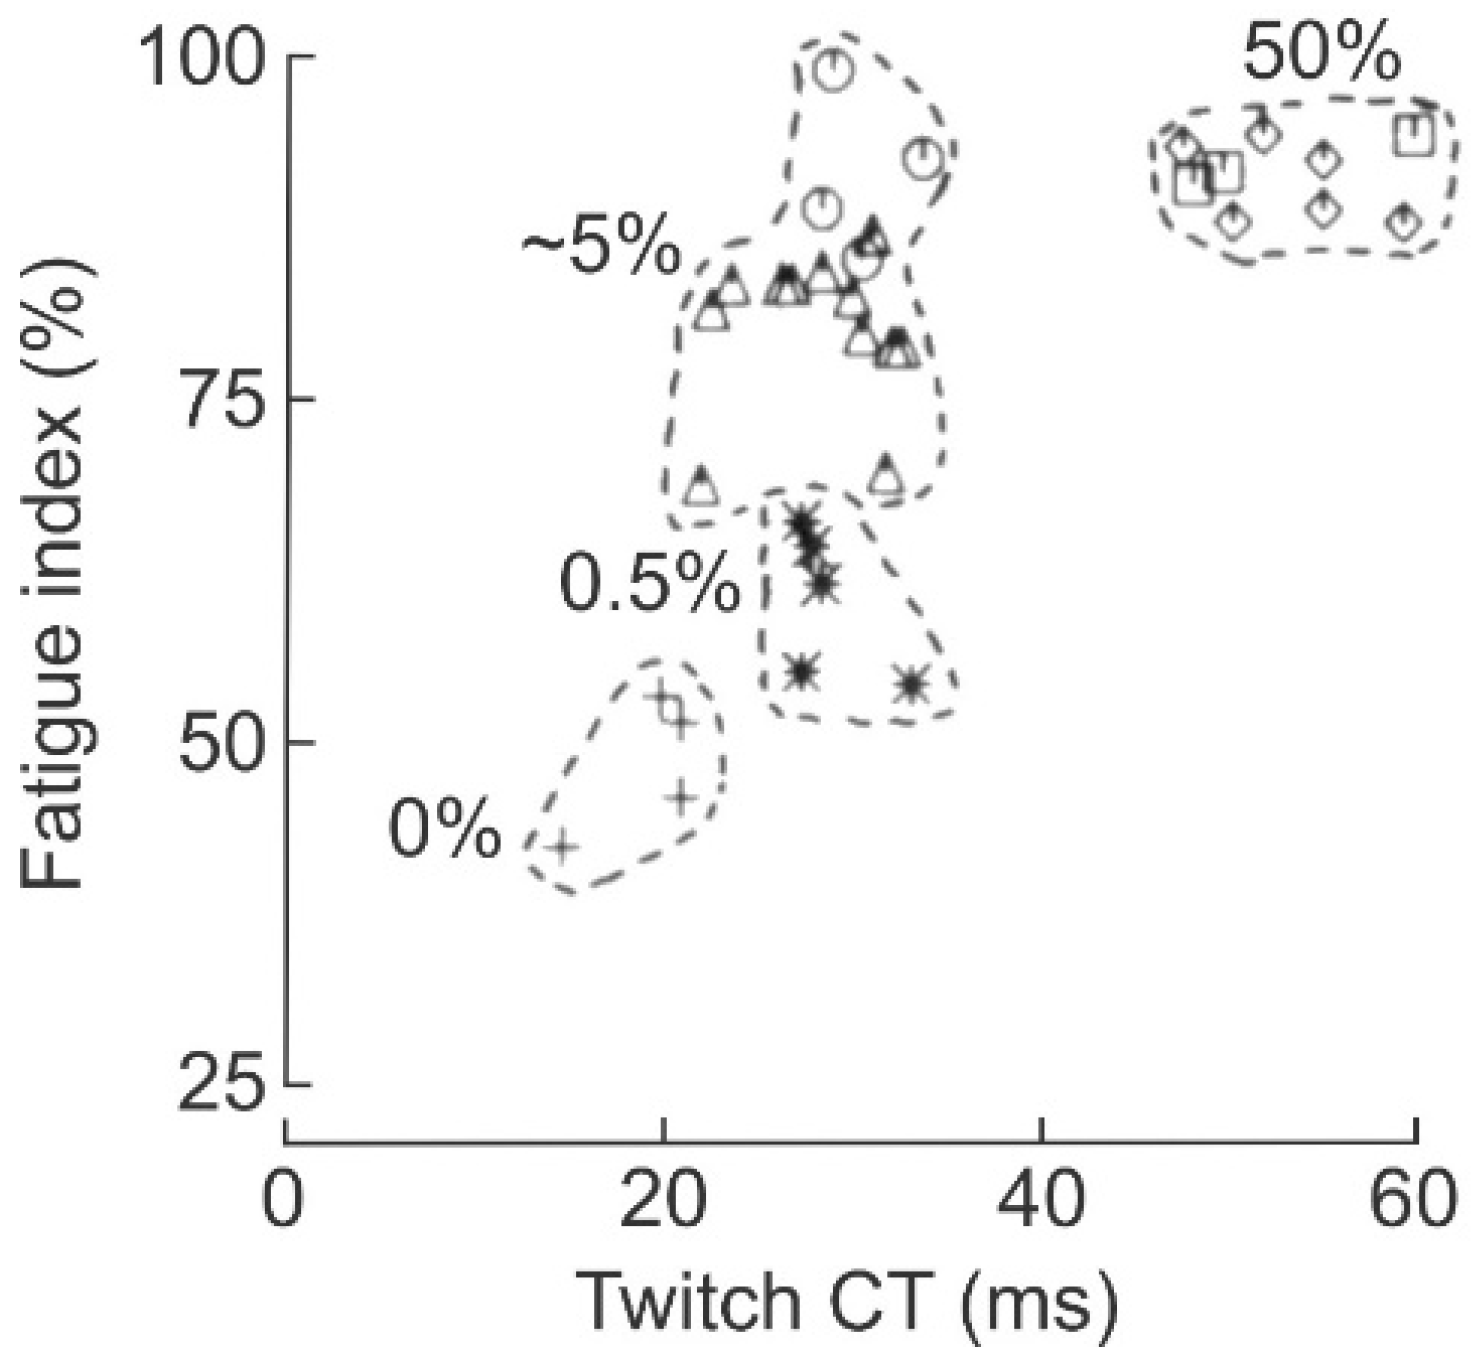
Comparisons of the effects of daily low (10 Hz) and high (40 Hz) frequencies of ES of the nerve to the paralyzed peroneus longus (PerL) muscle in cats demonstrated that the two frequencies were equally effective in fast-to-slow conversion of the muscle (Figure 2B; [26,28]). PerL muscles were paralyzed by hemisection of the spinal cord at L1 and deafferentation of the lumbosacral motoneurons (HSDA) in order to implement ES for a duration of 50% of each day [26,27,28,29]. Daily 50% ES in an on–off pattern that continued throughout each day (either at a continuous 5 Hz frequency or in 10, 20 or 40 Hz intra-burst rates on and off each for 1 s) resulted in their conversion to slow-contracting, fatigue-resistant muscles (Figure 4; [28,29]). The fast-to-slow muscle conversion was demonstrated by the increased twitch contraction time (CT) and fatigue index (FI) of the stimulated muscles where the FI is the ratio of tetanic forces developed at the start and the end of a two-minute period of repetitive 40 Hz stimulation of the CP nerve for 300 ms of every second. The slowing and reduced force of the stimulated PerL twitch contractions occurred at all the ES frequencies [26], and they were accompanied by the corresponding conversion of fast-to-slow fiber types and reduction in the size of their muscle fibers [27]. This demonstration of the role of the amount rather than the pattern of daily neuromuscular activity in controlling muscle properties was further clarified by their findings on the conversion of the properties to those typical of fast-contracting, fatigue-resistant muscles by reducing their daily activity to 5% of each day (Figure 4). When the daily amount of activity was reduced further to 0.5% and <0.5%, the PerL muscles were converted to the FG and FF phenotypes, respectively (Figure 4).

3.2. The Size Principle

Introduced by Henneman in the 1960s [63,64,65,66], the progressive activation (recruitment) of MUs during movement in order of size, with respect to nerve conduction velocity (CV) and MusU force, is consistent with the amount of activity determining muscle properties. This size-dependent MU recruitment was demonstrated in both cats [63,67,68,69] and human subjects [70,71].
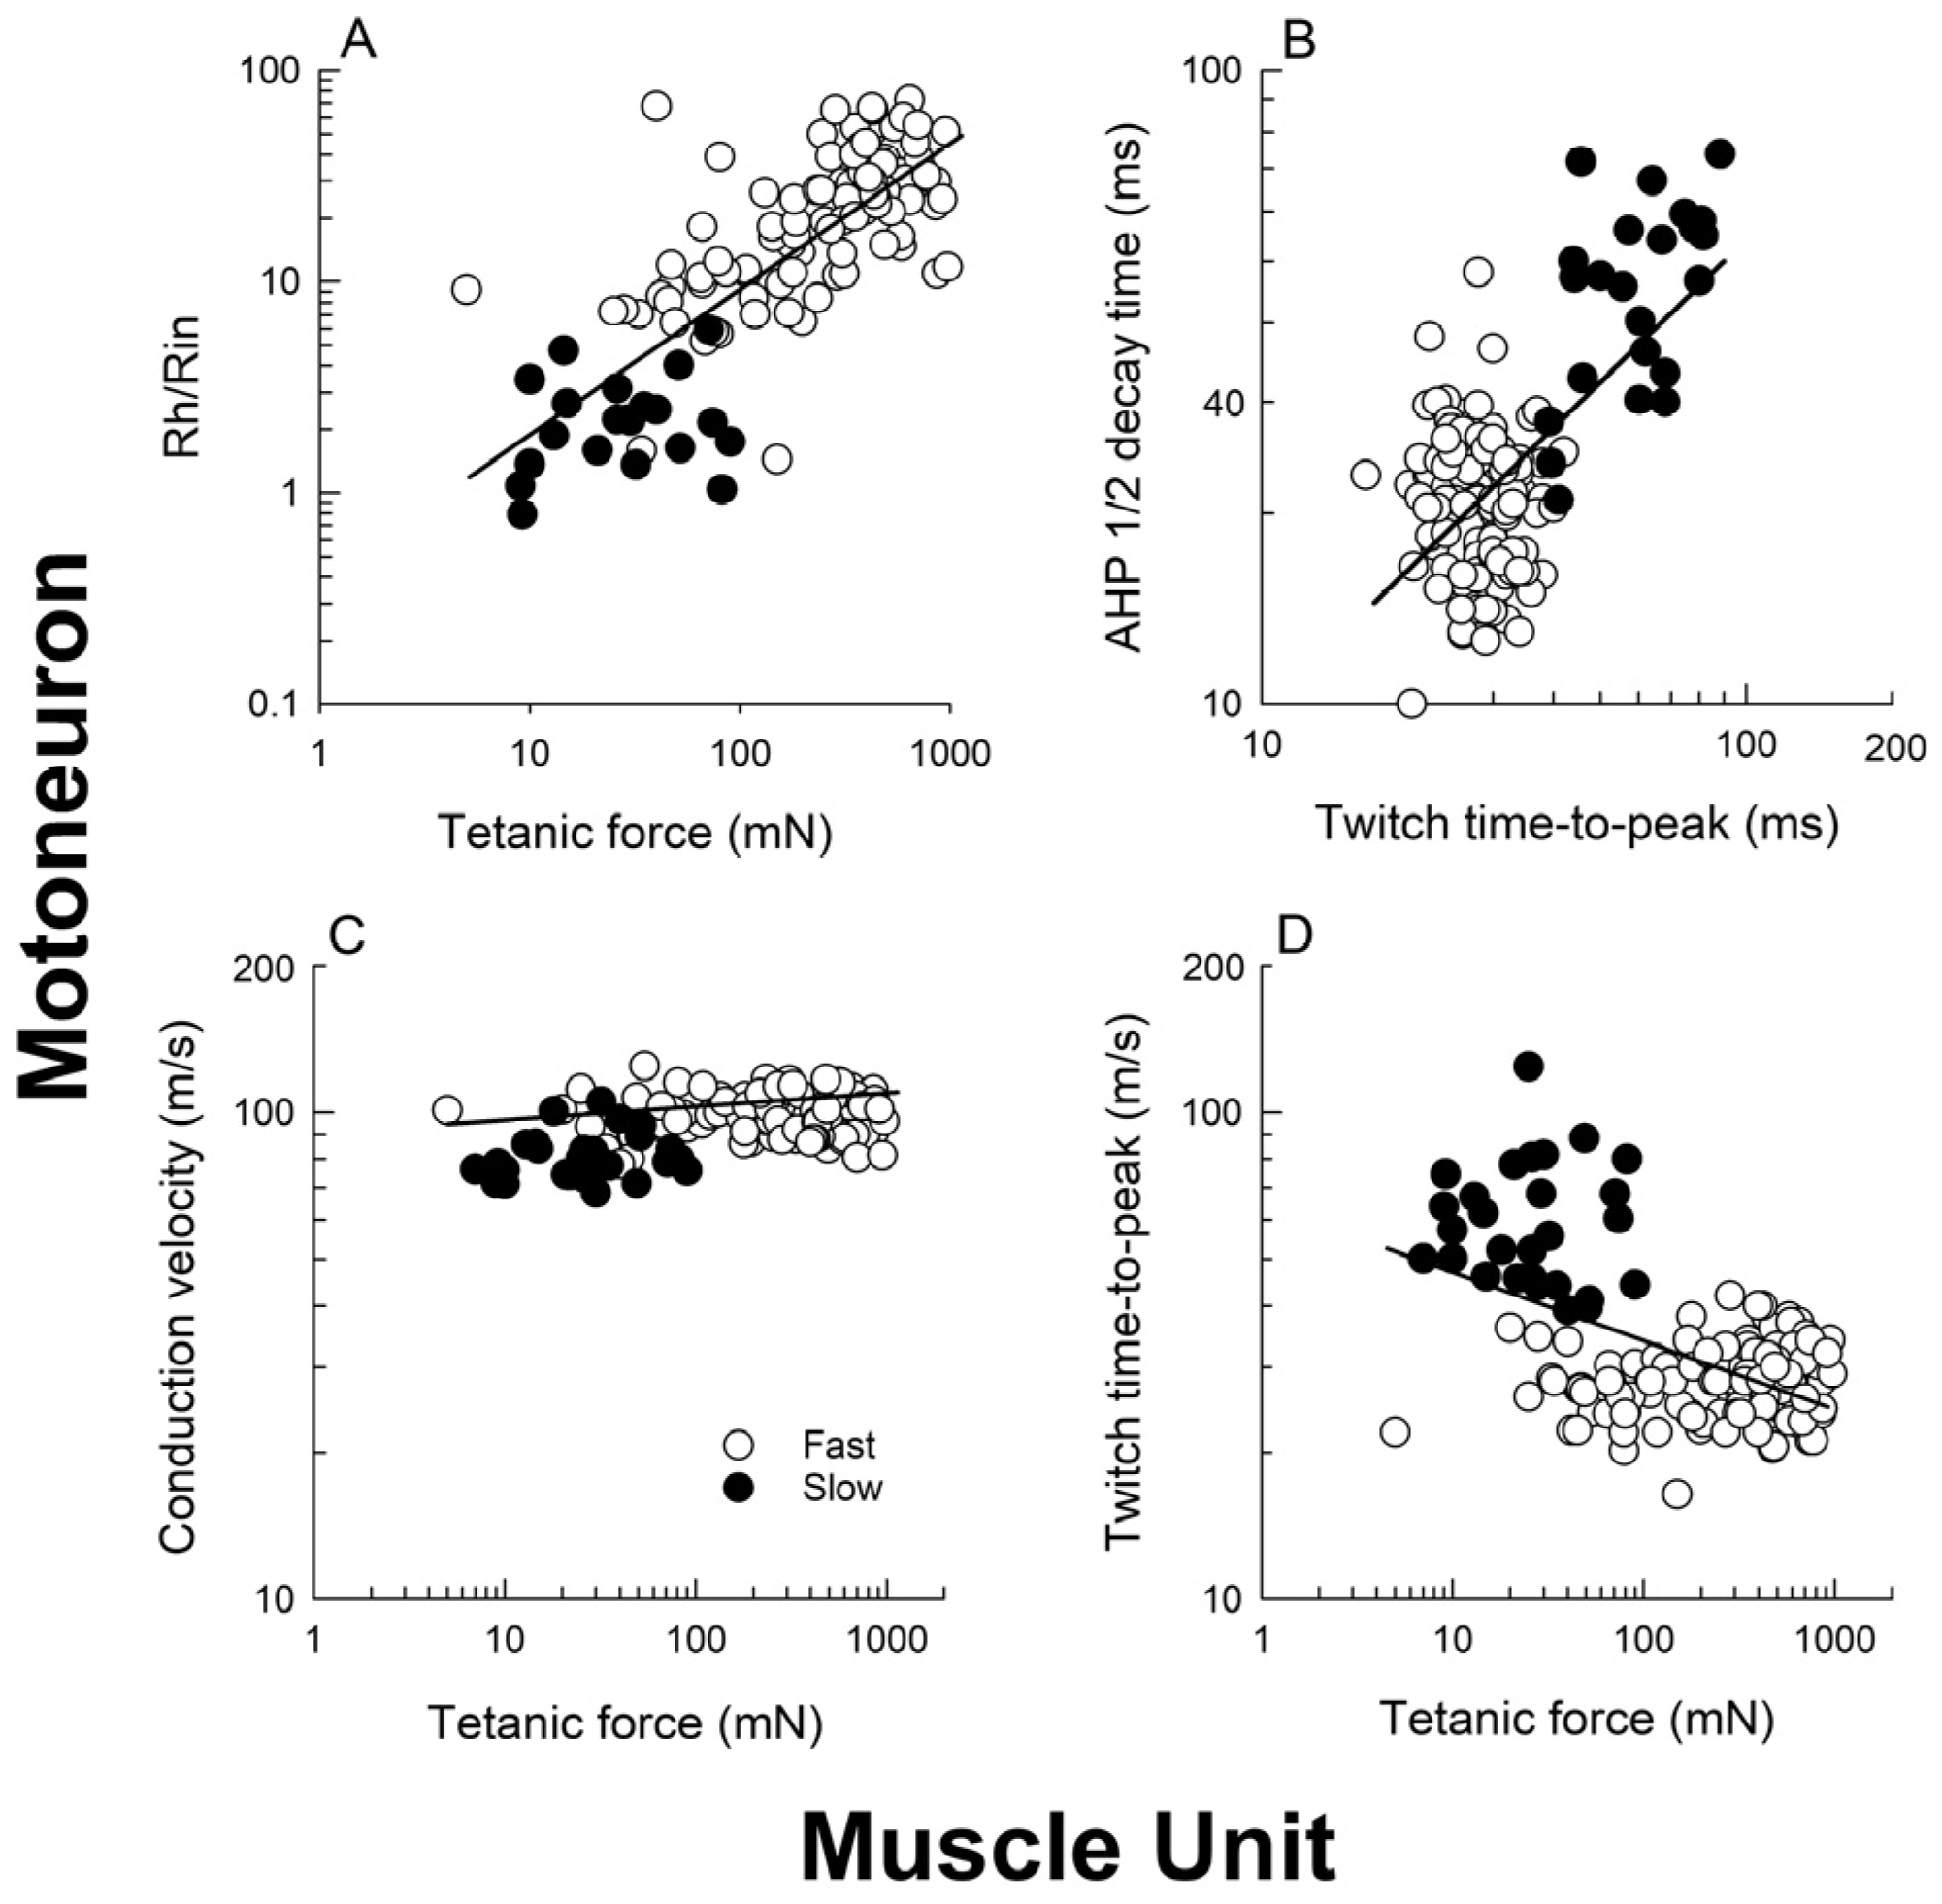
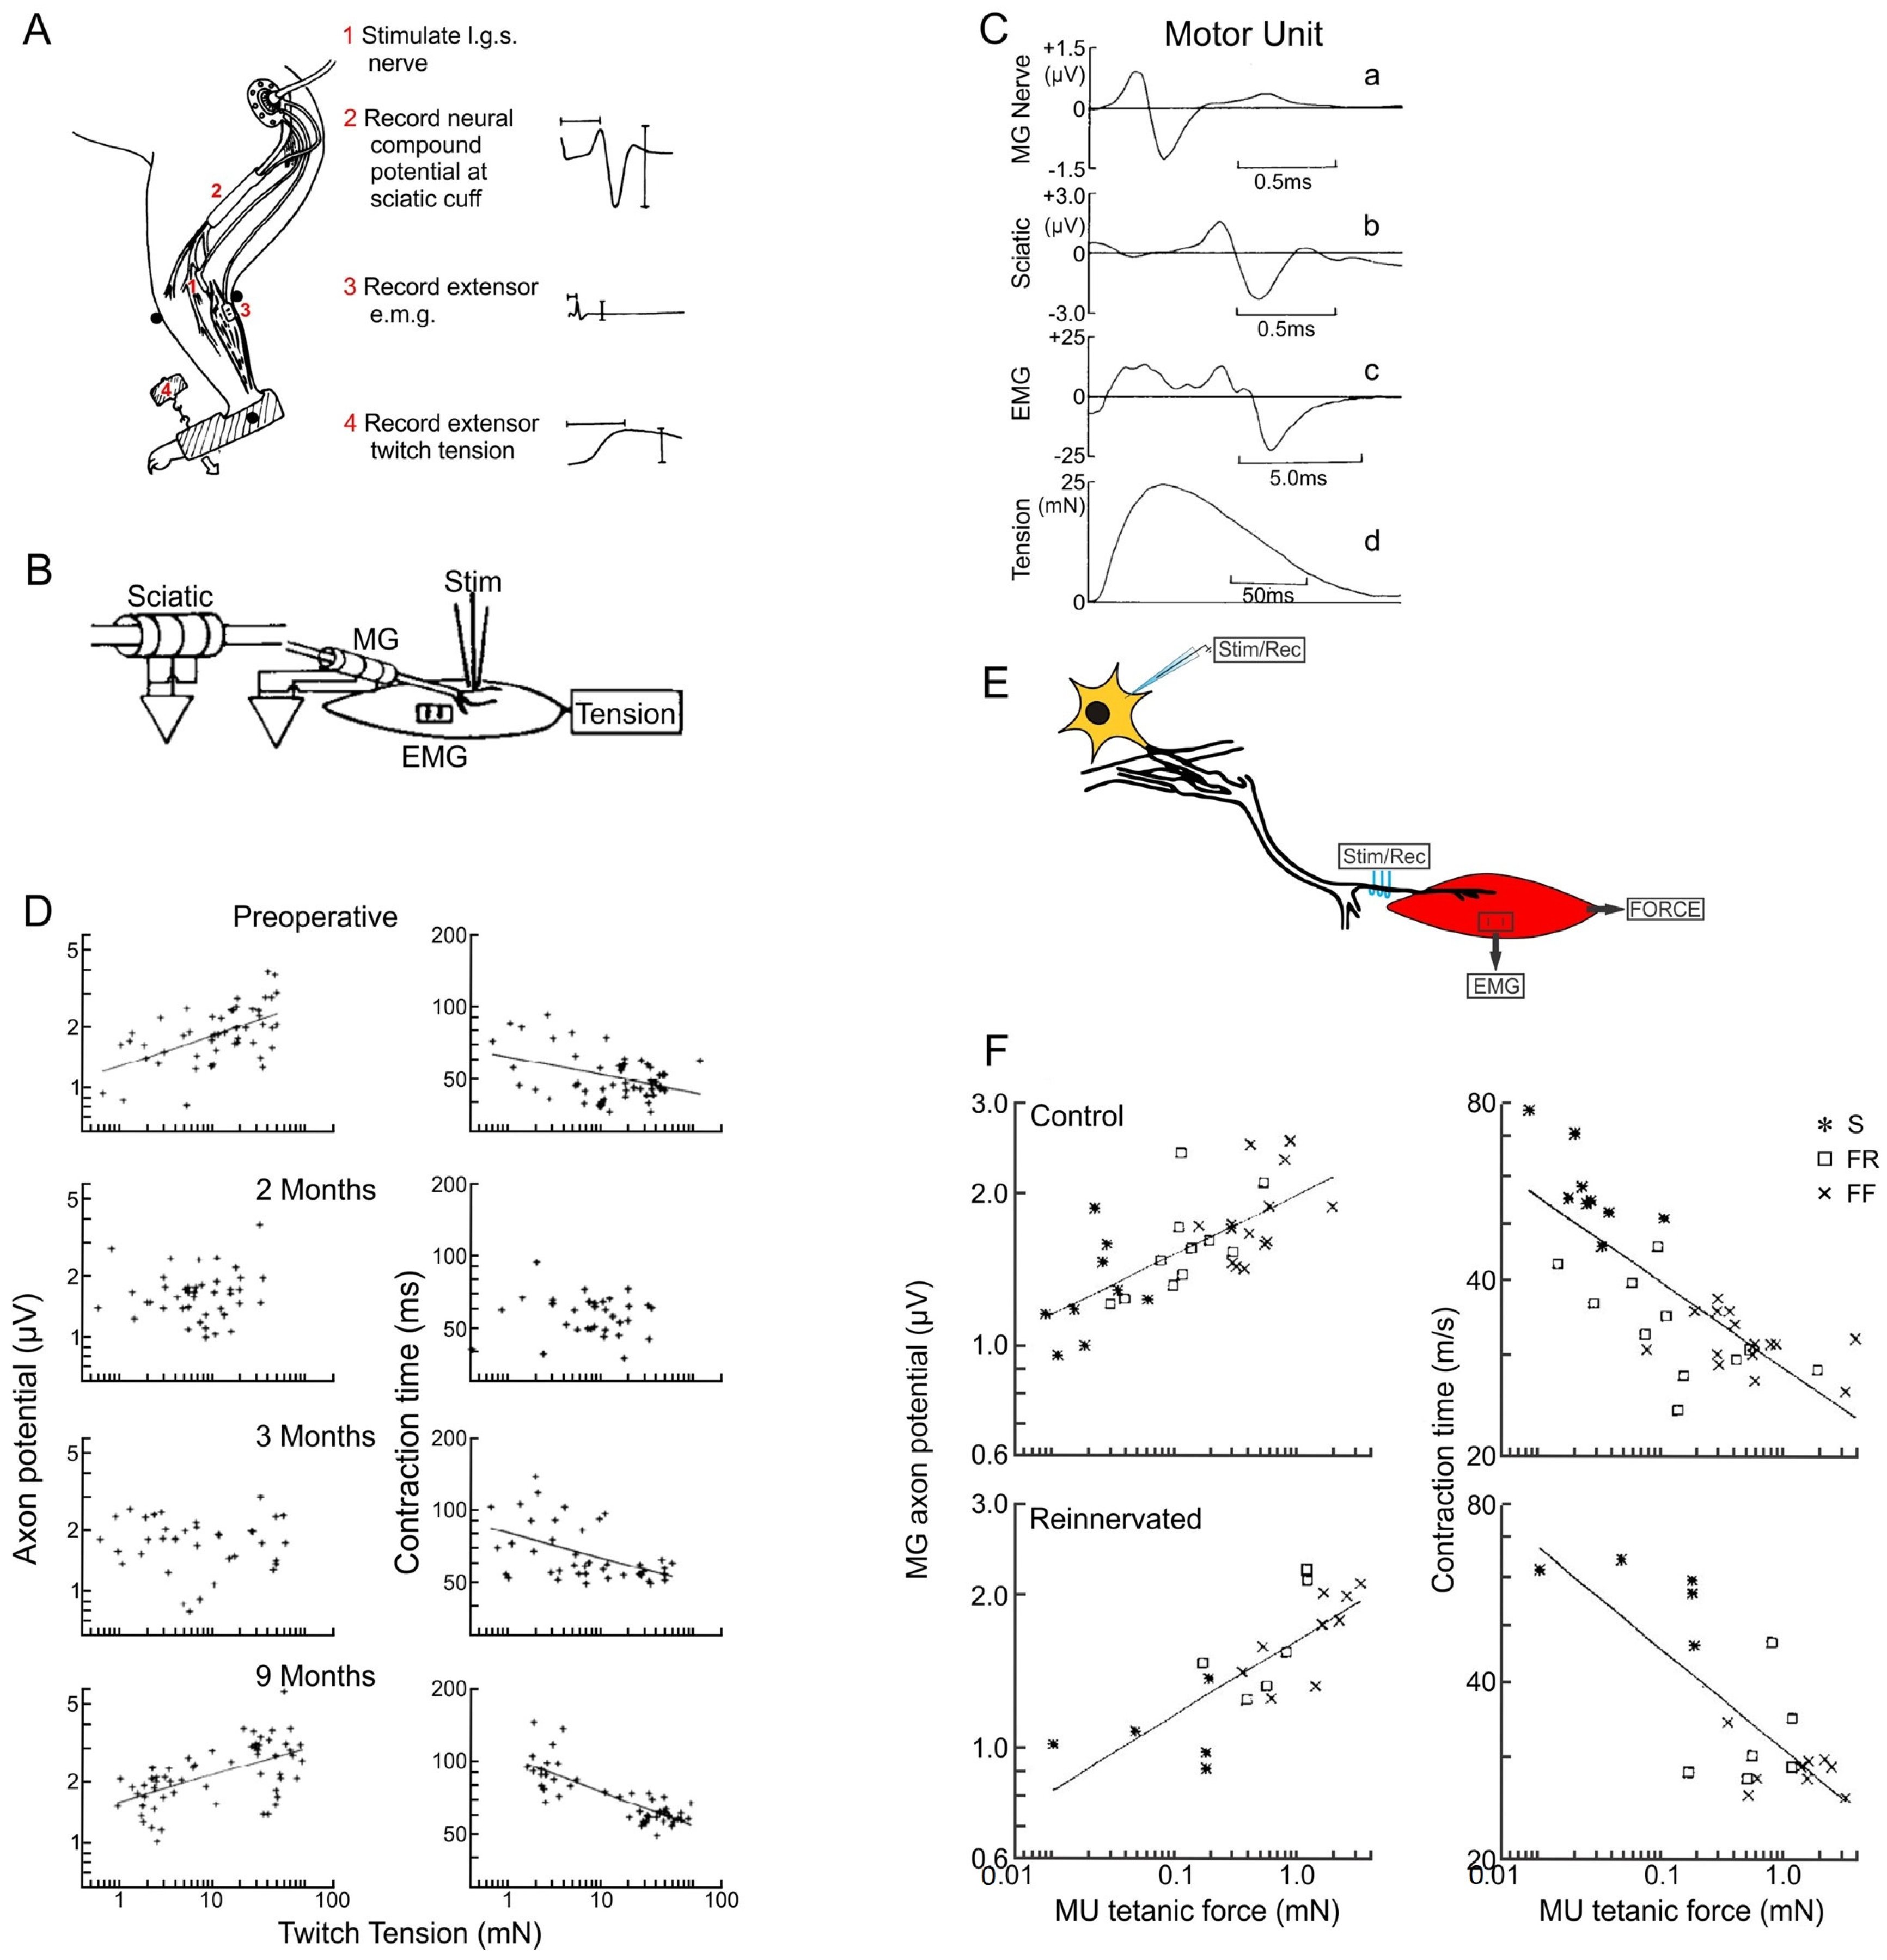
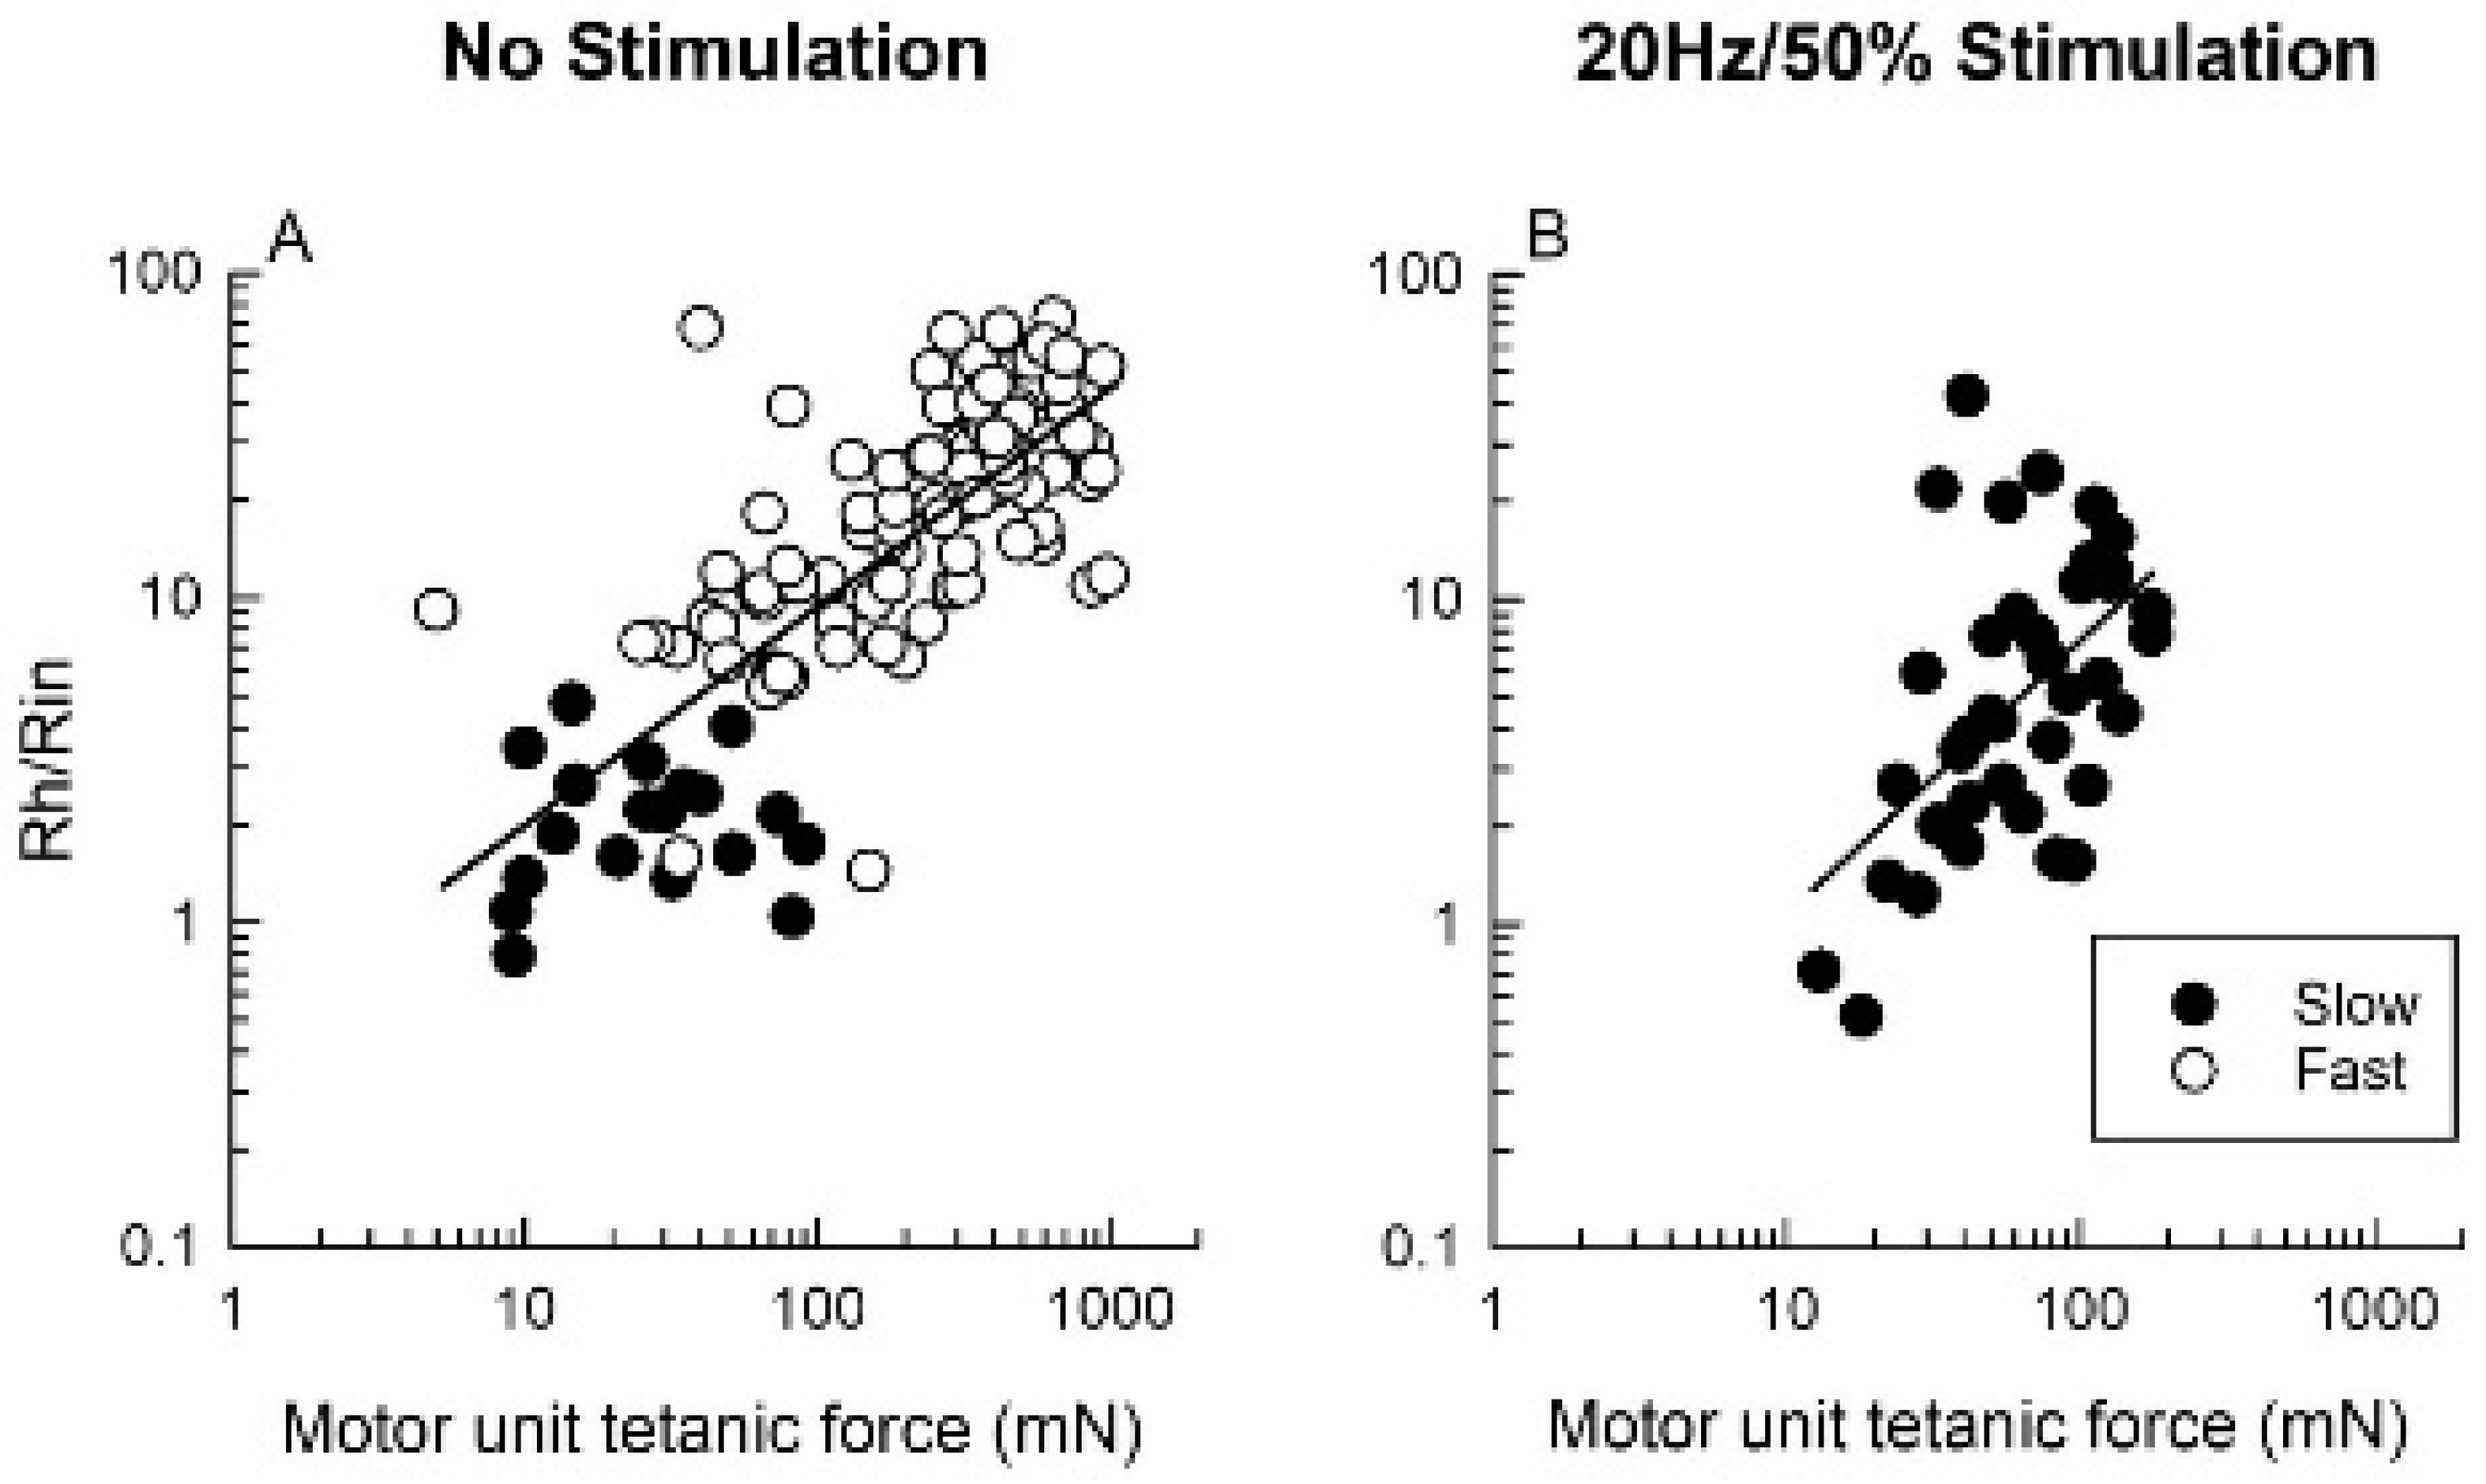
The CVs of the cat MG motor nerves, the electrophysiological measure of the size (and diameters) of nerves supplying S and F MusUs, increase from the S to the F as a function of their MusU contractile force in the MG muscle, but differences in the nerve CVs within the F group were not discernable (Figure 5C; [72]). Yet, in support of the findings of Henneman and colleagues [64,65,66], Jami and Petit [73] reported near-linear relationships between logarithmic values of tetanic tension of MusUs and the CV of their nerves in four cat hindlimb muscles, including SOL and TA. Chronic recordings of unitary action potentials on the MG nerve indicated that the peak-to-peak amplitudes of these potentials were a more reliable electrophysiological measure of nerve size (Figure 6A,B; [74,75]). The size of individual motor nerves was also measured by the peak-to-peak amplitudes of unitary action potentials that were evoked by the stimulation of single motor nerves via a bipolar needle electrode inserted into the muscle at or near the motor point (Figure 6C,E; [74]). The electrical parameters of rheobase current (Rh) and input resistance of motoneurons (Rin), obtained with intracellular stimulation and recording of the motoneurons with a glass microelectrode, are good measures of motoneuron size [76,77]. Rh is the electrical current that evokes a nerve fiber action potential and is, by definition, an index of motoneuronal excitability whose value increases as the size of the motoneuron increases. Rin decreases with the neuron’s surface area, such that Rin values decrease with size, being highest in the small motoneurons. It is the Rh/Rin ratio that provides the excellent electrophysiological measure of MN size (Figure 5A; [72]).
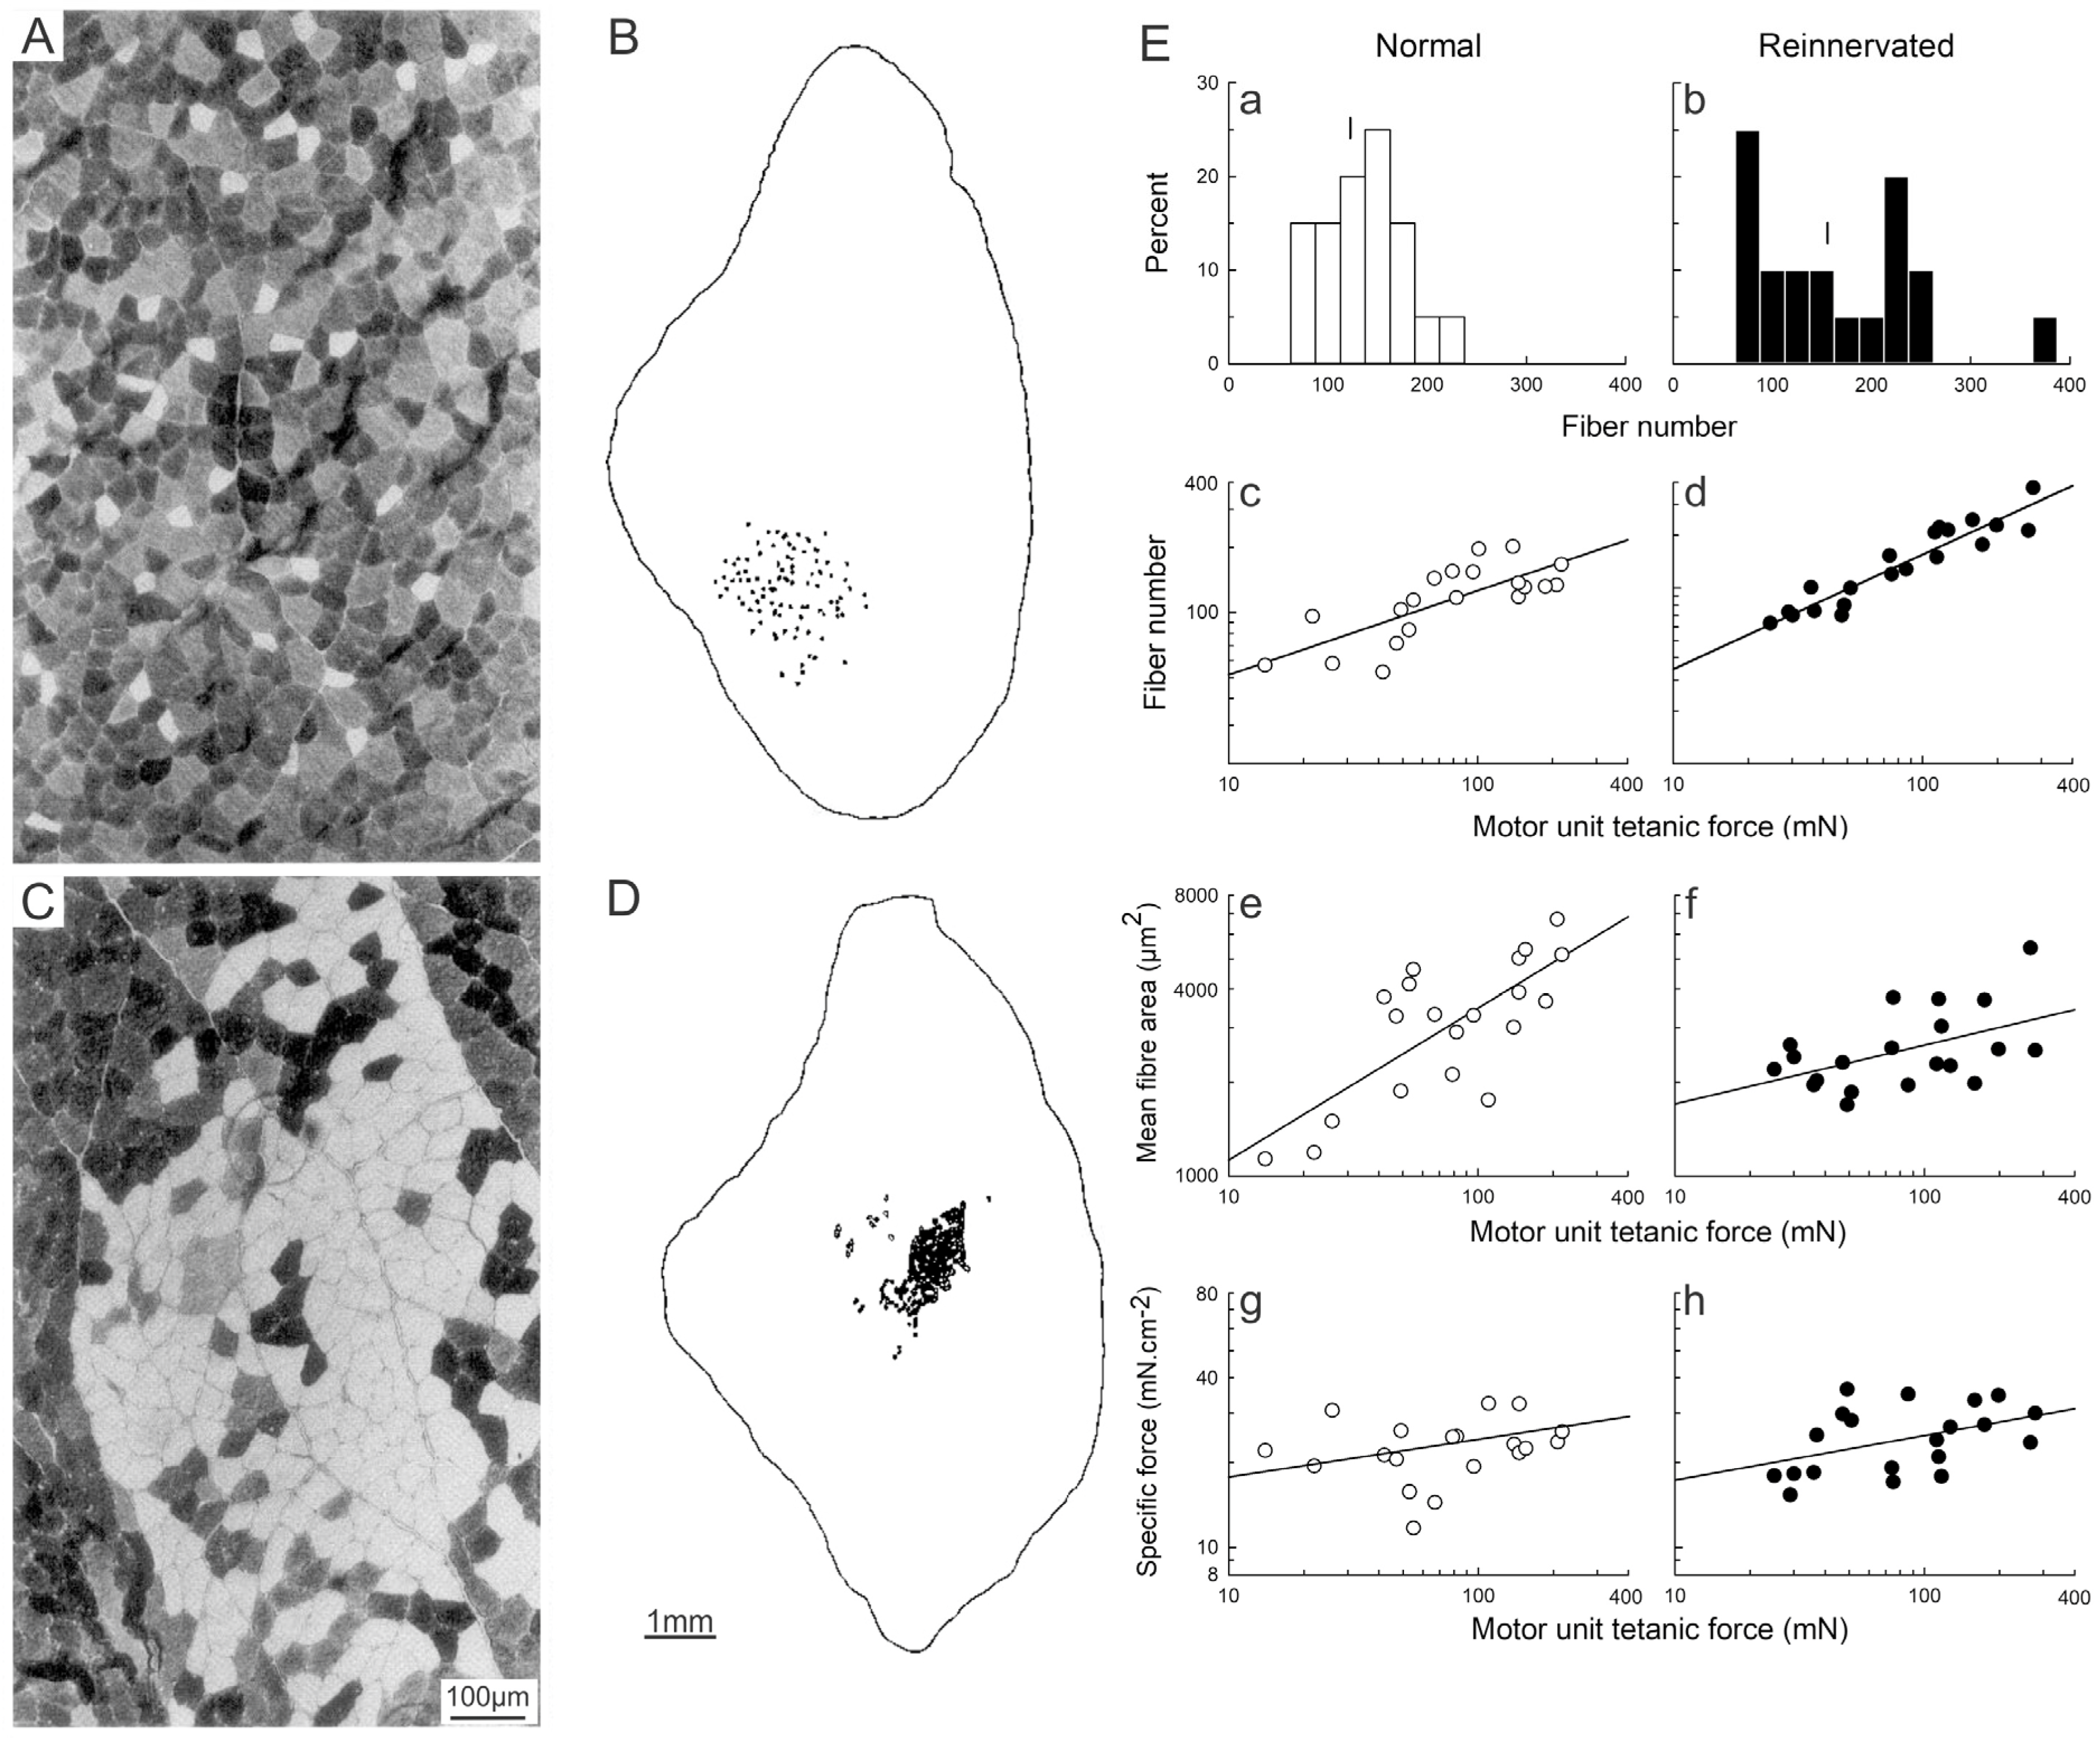
Henneman and colleagues [63,64] had assumed that MusU contractile force reflects their innervation ratio, namely the number of muscle fibers innervated by each MN, in addition to the cross-sectional area of the muscle fibers. This assumption was proven to be correct by experiments performed in Gordon’s laboratory [78], in which an identified MusU in rat TA muscles was classified as S, FR, FI or FF on the basis of both the CT of the twitch contraction and the fatigue index (FI) prior to its repetitive stimulation to deplete the MusU of glycogen. Using histochemistry to locate, type, count and measure the cross-sectional area of the glycogen-depleted MusU fibers, the authors confirmed the assumptions made by Henneman and colleagues [64,65] that MusU force indeed increases with the number of the MusU fibers and, to a lesser extent, with the total cross-sectional area of the fibers (Figure 7c,f; [78]).
In summary, the relationships between multiple measures of MN, nerve, MusU force and innervation ratio all provide strong evidence of Henneman’s size principle.

3.3. The “Speed” Match of Motoneurons and Their Muscles

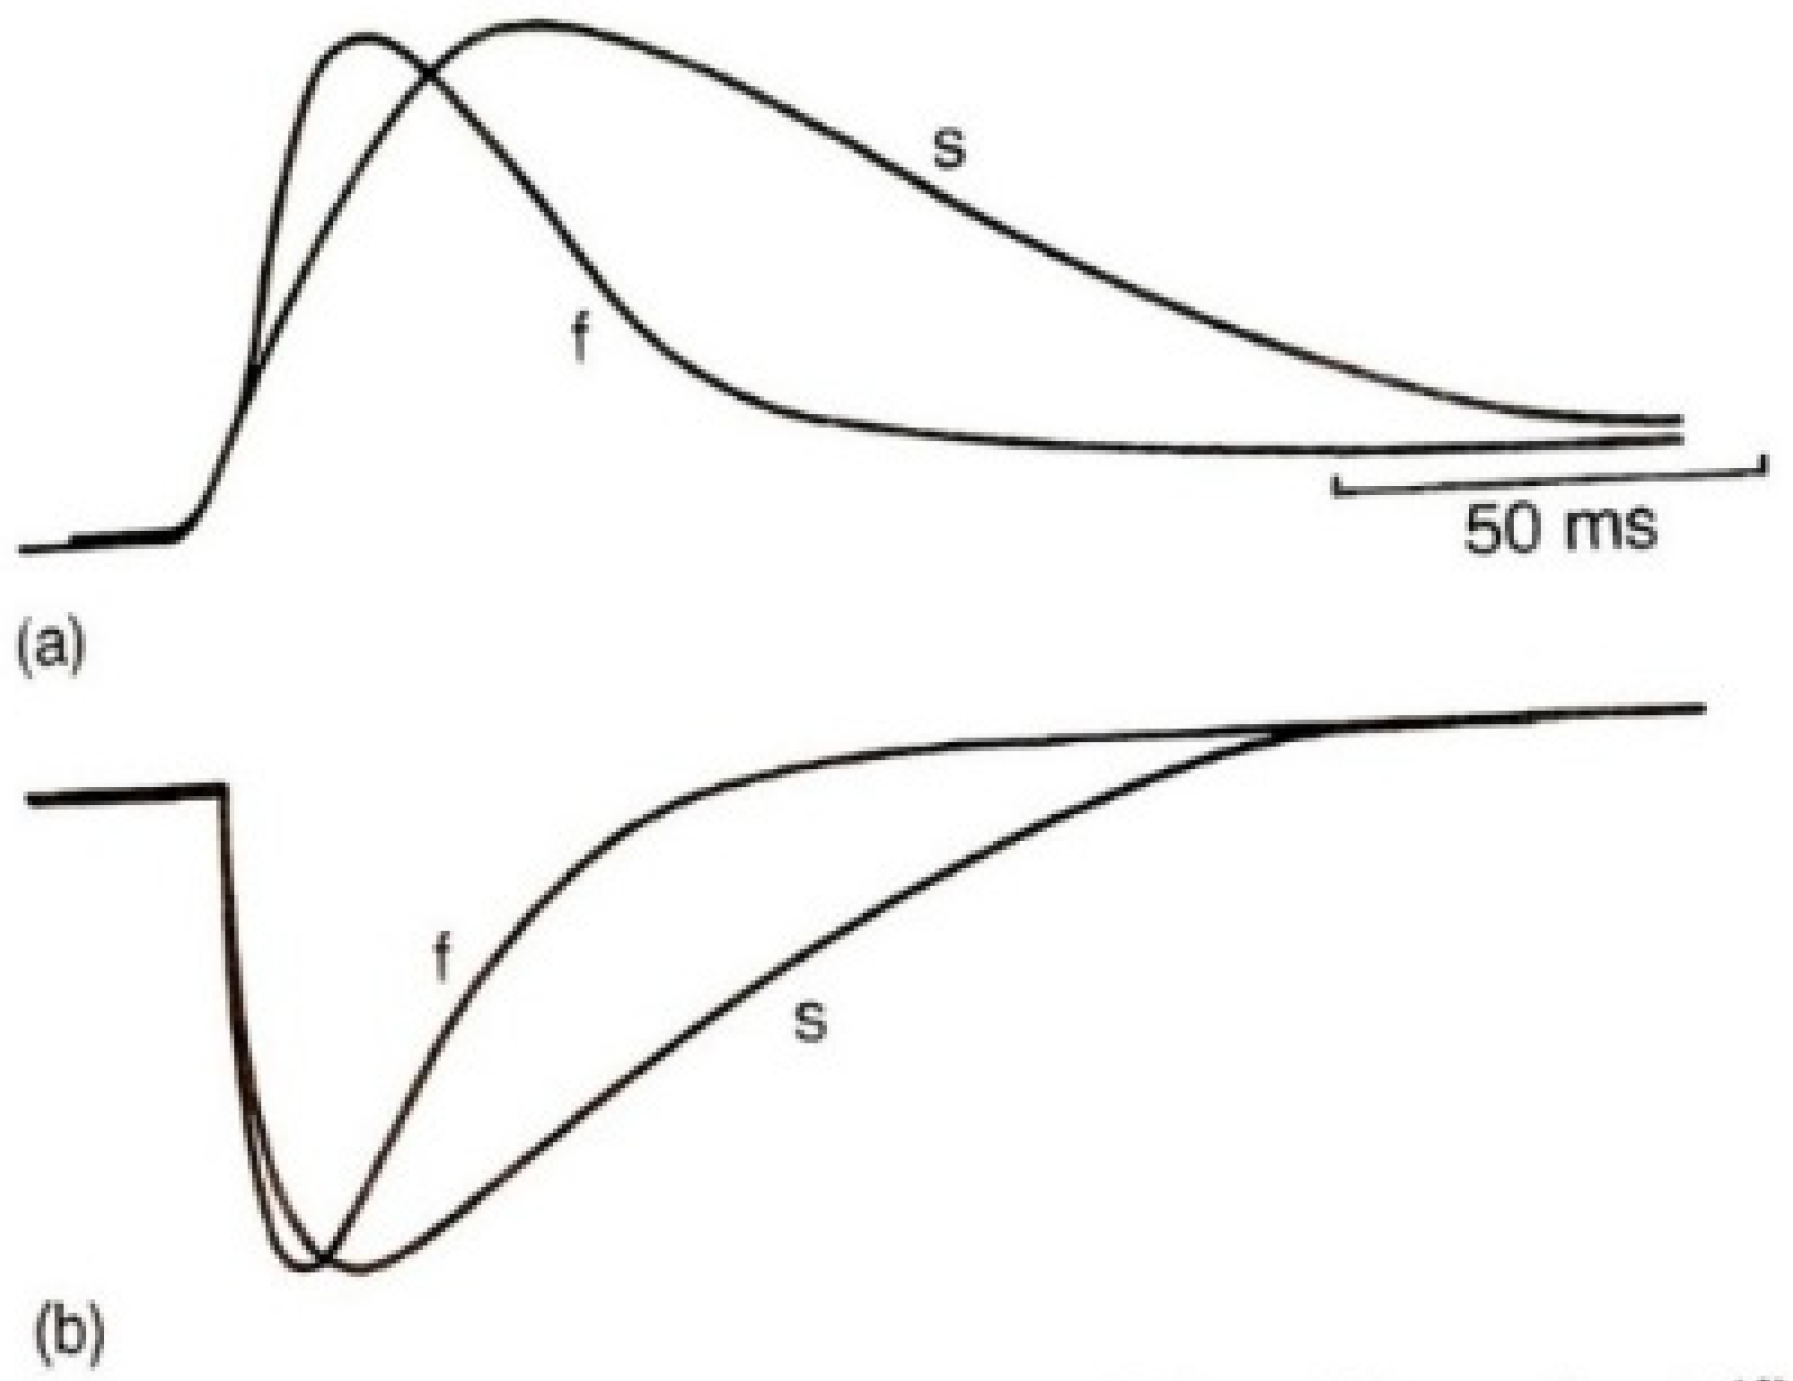
Grützner [2] recognised in 1884 that the slow-twitch muscle contractions fuse to a tetanic contraction at lower rates of nerve electrical stimulation than the twitch contractions of fast-twitch muscles. The fusion frequency of SOL muscle contractions was reported to be 30 pulses/s as compared to over 100 pulses/s for the contractions of fast-twitch gastrocnemius and flexor hallucis longus muscles in the cat [79,80]. Both the minimum and maximum rates at which motoneurons generate action potentials correlate with the duration of the twitch of the MusU fibers, that is, the discharge rates are low for the slow-contracting MusUs and progressively higher as the contraction times increase [45,81]. The minimum discharge rates that were recorded from motoneurons when they start to fire action potentials are typically those rates at which the MusU twitch contractions just begin to fuse to tetanic contractions [45]. Eccles and colleagues [82] made the classical observation that was confirmed later by others (e.g., [83,84]), namely that the duration of the after-hyperpolarization (AHP) of the action potentials generated by the motoneurons innervating slow muscles is longer than that of the motoneurons supplying fast-contracting muscles. These observations pre-empted the recognition of a ‘speed match’ between the duration of the motoneuron’s AHP and the duration of the MusU twitch contraction [41,84] (Figure 5C and Figure 8 [72,85]). The ‘match’ is continuous for rat MG MUs [85] but is less obvious for TA Mus, where the range of MusU contractile speeds is more limited [86]. The match is likely to be important for ensuring that the barely recruited motoneurons start to fire at the frequency that is optimally suited for the subsequent gradation of force. The S-shaped T-f relationship between muscle tension (T) and the frequency of stimulation (f) is steep and shifts to the right to higher frequencies for MusUs with faster contractile speeds (cf. Figure 5.2 in [18,81,83,85,86]).
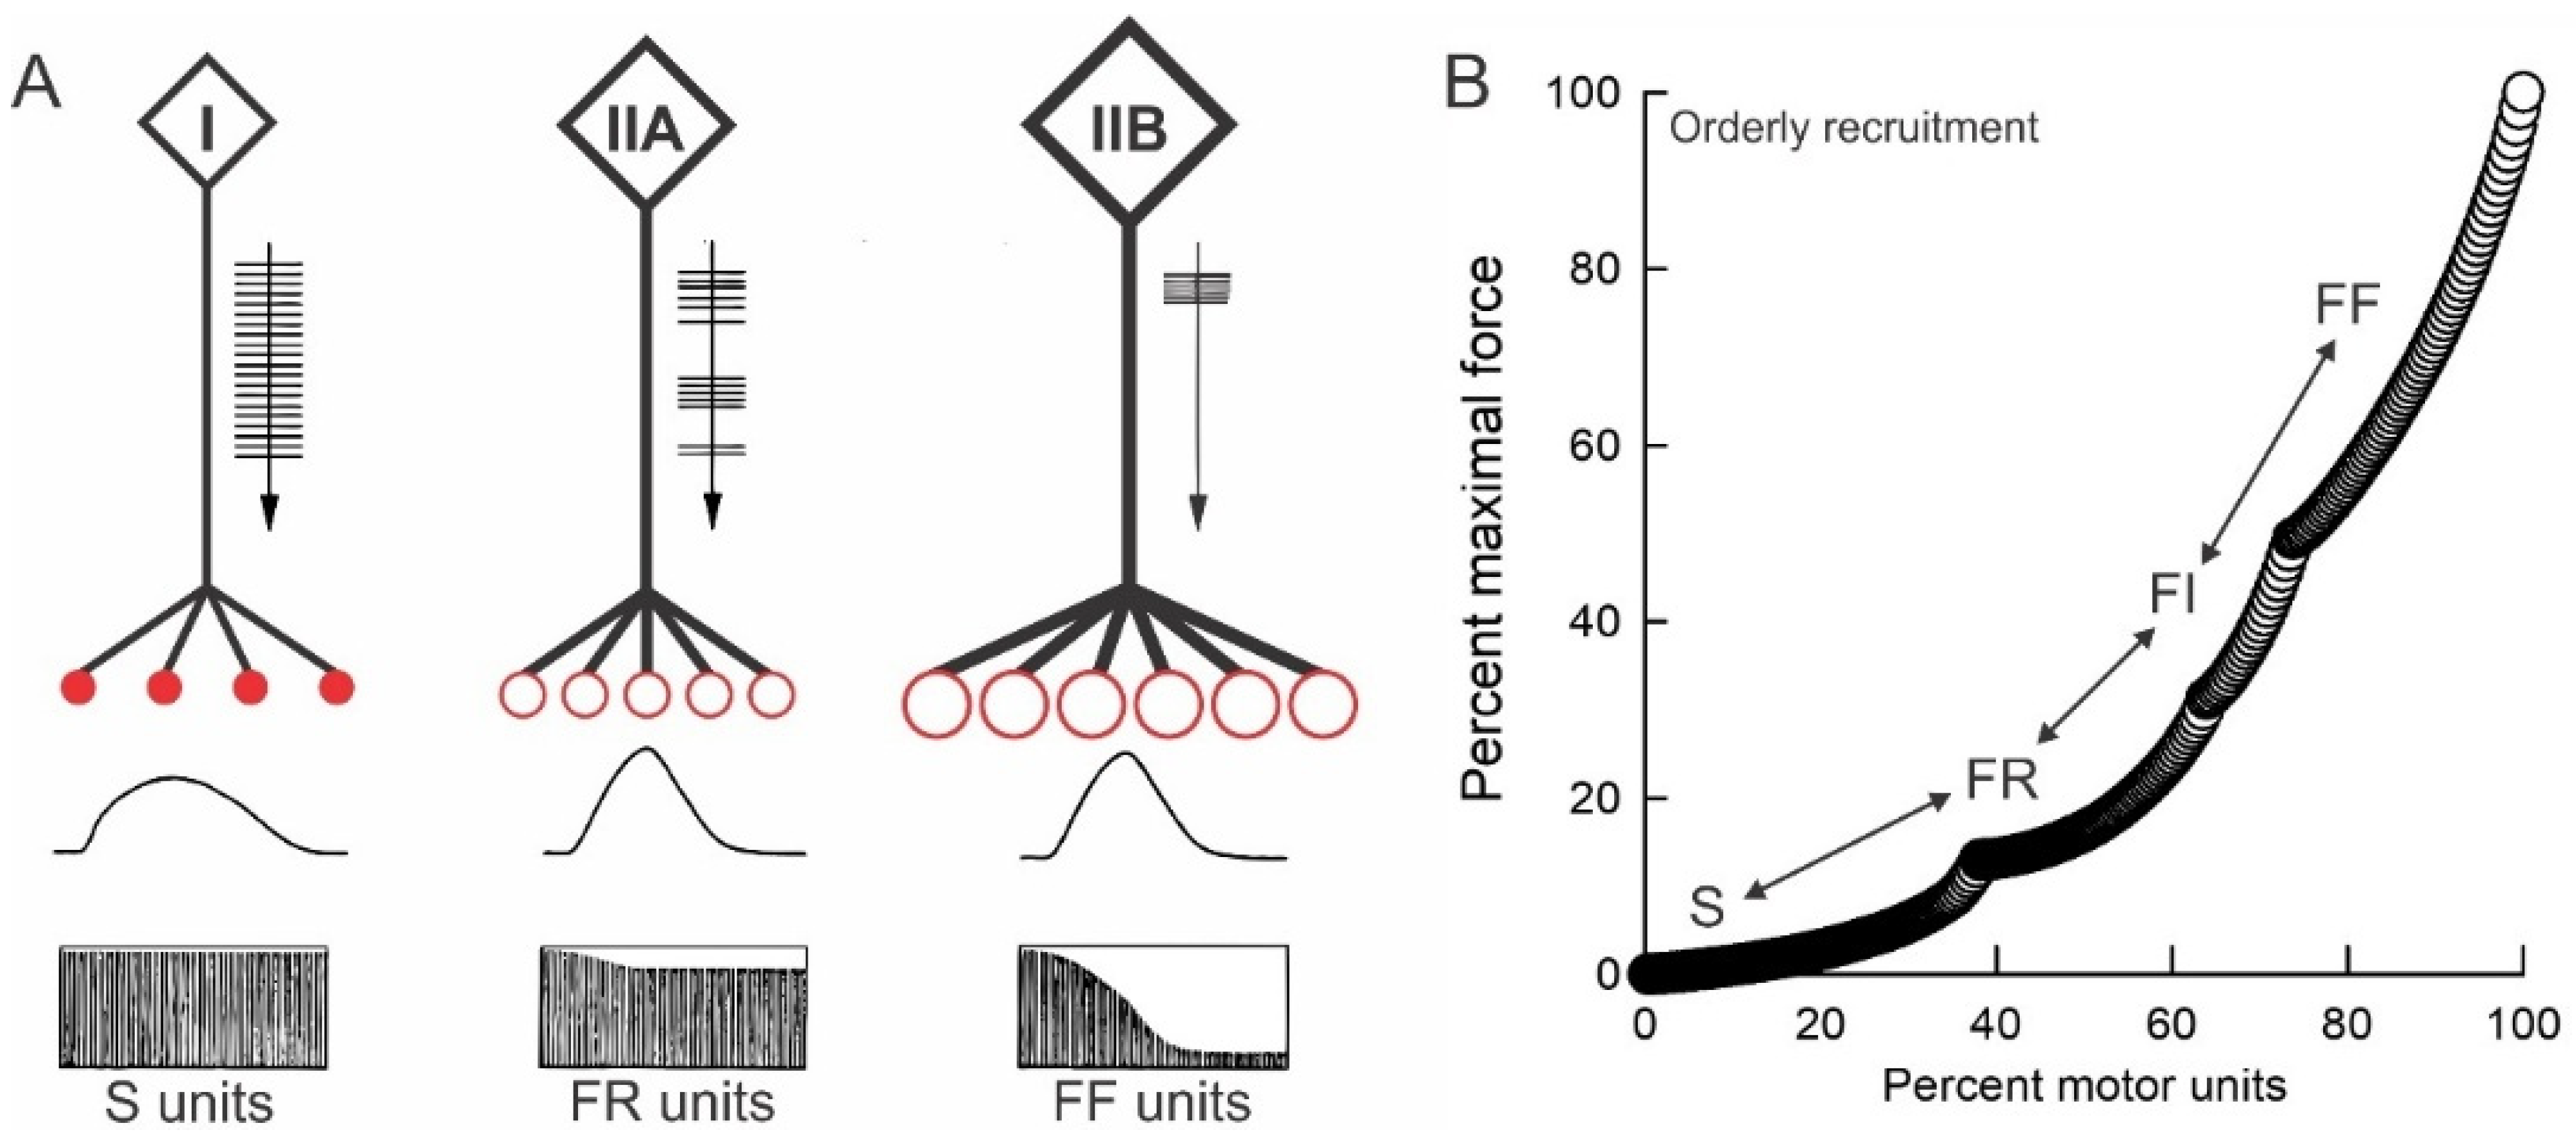
The low and continuous discharge rates of the ‘slow’ motoneurons contrast with the intermittent discharge of the ‘fast’ motoneurons (Figure 9A) as described in Section 2.2: [4,41,42,43,44,45]. Human SOL MusUs exhibit lower steady states of ~16 Hz compared to the higher maximal steady-state discharge rates of ~23 Hz of fast-twitch MG and LG muscles [87,88,89,90]. The low discharge rates allow postural firing for long periods without fatigue, while the higher, intermittent discharge rates of the large MusUs allow for the transient development of large forces in the muscles that fatigue more readily (Figure 9A; [16,67]). The fatigability of the forceful FF MusUs is well matched to the transient firing of their motoneurons due in part to their property of adaptation, namely the decline in their discharge rates during repetitive activity [18,67,91]. The rates decline with the slowing of the MusU contractions and a decline in their fusion frequencies [16]. The result is that the firing rates and the fusion frequencies remain well matched.
Threshold levels for MU recruitment during movement are different for different muscles. For example, they are lower in SOL as compared to MG and LG muscles in human subjects [92,93]. In addition, the control of the discharge rates of the motoneurons, namely, rate coding, contributes to the development of muscle force, with the relative contributions of MU recruitment and rate modulation varying in different muscles [44,94,95]. For example, rate coding accounts for a large component of force production in small foot muscles [87,96], in contrast to the gradual recruitment of MUs that occurs in the cat SOL muscle with almost no concurrent modulation of the MU firing rates [97,98]. While there are context-specific and muscle-dependent differences in the neuromechanical control of the triceps surae musculature [90], the orderly recruitment of MUs in order of their size is obeyed in all tasks (e.g., [99,100]).

3.4. The Size Principle After Nerve Injury

The size relationships between motoneurons, their nerves and the MusUs return in cat and rat hindlimb muscles after partial [101] and complete nerve injuries (Figure 6D,F; [74,75,102,103,104]). This was so, despite the regenerated nerves not reinnervating muscle fibers that they had supplied prior to the injuries. The relationships also returned in the hand muscles of patients with pressure or entrapment neuropathies and after microsurgical repair of transection injuries [105,106]. The size relationships returned even when the muscle reinnervation was functionally inappropriate, as demonstrated in reinnervated MG and TA muscles in cats after cross-suture of their nerves [103,107]. The relationships also returned after partial nerve injuries [101], where axons sprouted from remaining intact nerve to reinnervate adjacent muscle fibers after partial nerve injuries [8,107,108,109,110]. The size principle was restored in self-reinnervated cat triceps surae muscles [74] as shown by the significant regression lines drawn in Figure 6D. However, the chronic recordings of unitary nerve and MG muscle responses to the stimulation of single intramuscular motor nerves, using an inserted concentric needle electrode at or near the motor point (Figure 6B; [74]), revealed a delay in the return of the size relationships between the nerve action potential amplitude, isometric MusU twitch tension and MusU twitch contractile speed (Figure 6D; [74]). The early loss of the significant regression lines 3 months after the surgical nerve transection and repair reflects the random reinnervation of denervated muscle fibers by the regenerating nerves, as illustrated by the obviously changed muscle fiber distributions of glycogen-depleted MusUs in control and reinnervated rat muscles (Figure 7A–D; [78]). Initially, the reinnervated MusUs are heterogeneous in the muscle fiber-type composition as a result of the random reinnervation of denervated muscle fibers by the regenerating nerves. The delayed return of the size principle reflects the conversion of all the muscle fibers in the reinnervated MusUs to one type by their regenerated nerves [74,111,112,113,114].

3.5. Activity-Controlled Muscle and Motor Unit Properties

We expanded the Kernell studies of how the amount of neuromuscular activity affects PerL muscle and muscle fiber phenotypes [25,26,27,28,29] to investigations in cat and humans on the effects of (1) 0% daily neuromuscular activity on cat paralyzed hindlimb nerves [34], (2) 5% daily activity on paralyzed cat TA and MG muscles and MusUs [35], <0.5 to 5% daily activity on paralyzed TA muscles in spinal injured patients [115] and 5% daily activity on paralyzed MG muscle and MusU properties [35] and (3) 50% daily activity on paralyzed cat hindlimb muscle MG motoneurons [32] and their MusU properties [31].

3.5.1. Reduction in Daily Neuromuscular Activity to 0%

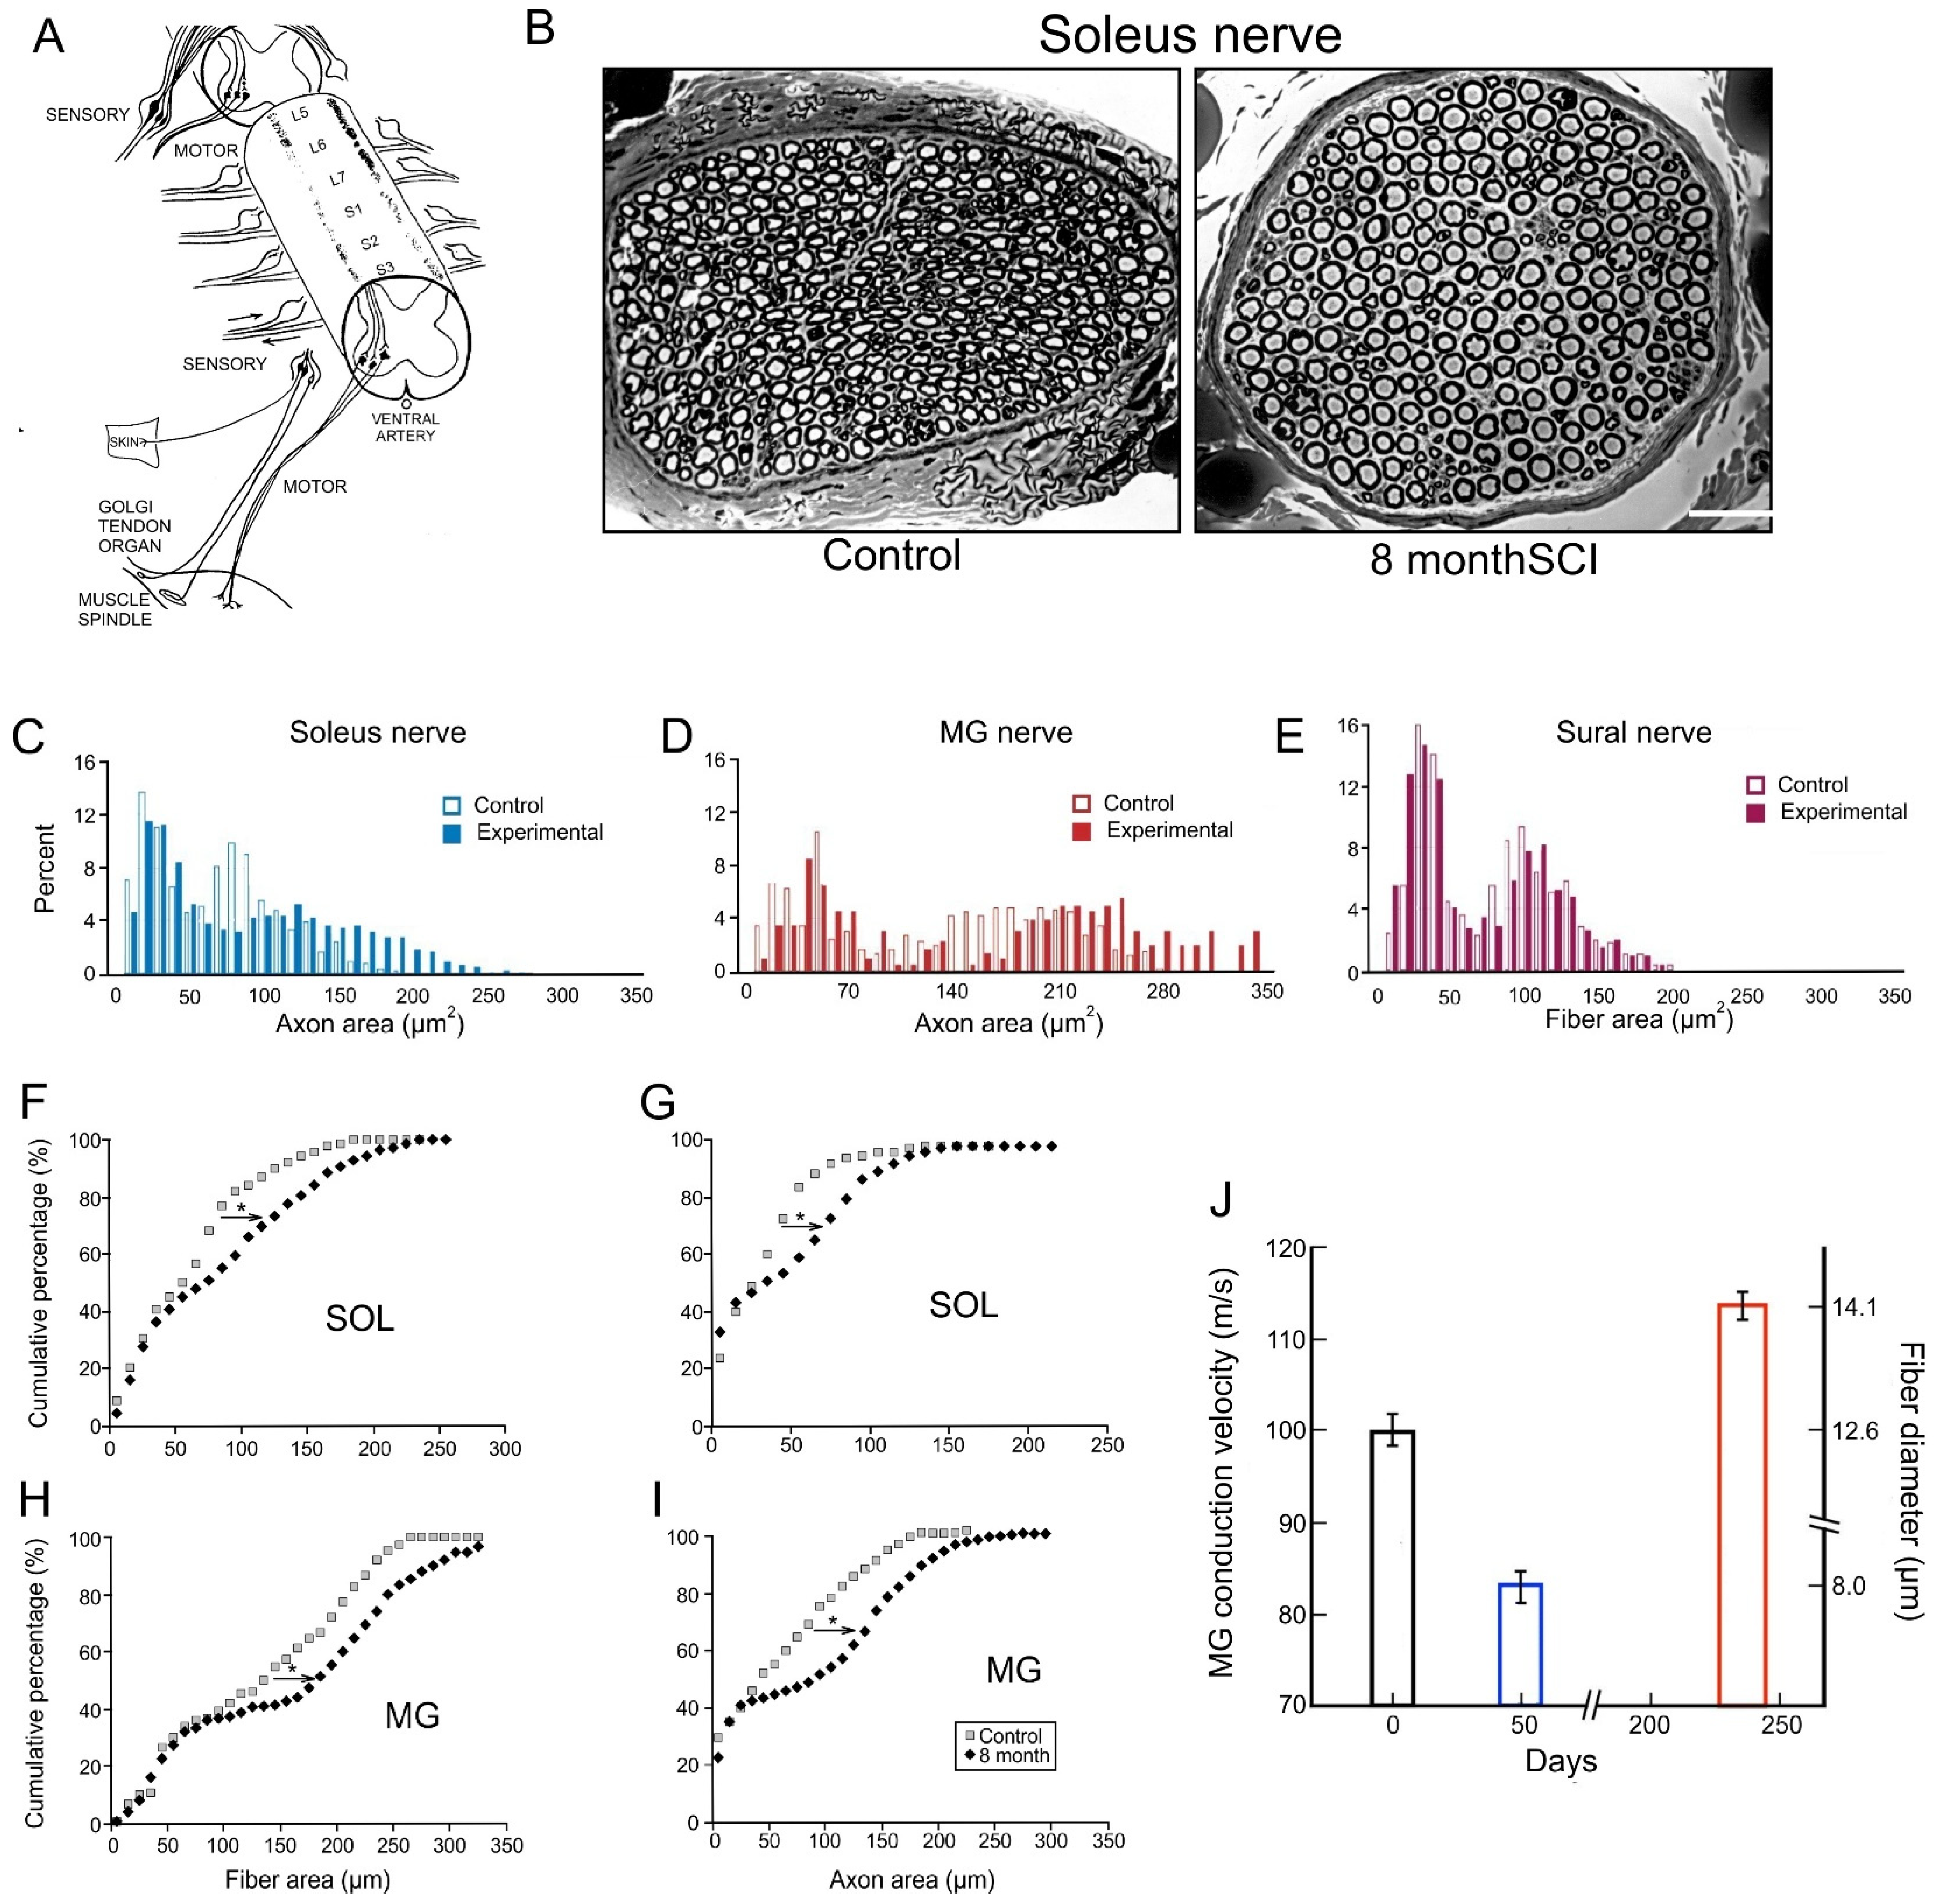
Spinal cord isolation (SCI) surgery was performed to silence cat motoneurons and their nerves to hindlimb muscles, namely transection of the spinal cord above and below the motoneurons and the dorsal roots that enter the isolated cord, leaving the cell bodies in the dorsal root ganglia intact (Figure 10A; [34,116]). After 8 months, the axon and fiber size of the silenced MG and SOL nerve fibers, but not of the sensory sural nerves, increased significantly [34]. This significant shift was evident when axon and fiber areas were displayed as histograms or as cumulative histograms (Figure 10C–I; p > 0.01). The cumulative histograms were shifted to the right in parallel, excluding the fiber and axon areas of the smallest SOL and MG nerves that did not change, with these nerves being the afferent nerves from their muscle spindles and tendon organs (Figure 10F–I; [34]). These small SOL and MG nerves were not affected by their silencing in the same manner as the sensory SUR nerves were not affected (Figure 10E; [34]). The increased size of the motor fibers in silenced MG and SOL nerves support the hypothesis that low daily amounts of neural activity in the largest motoneurons and their motor nerves are responsible, at least in part, for their size, consistent with Henneman’s size principle [63,67].

3.5.2. Low Daily Amounts of Neuromuscular Activity in Cat and Human Muscles

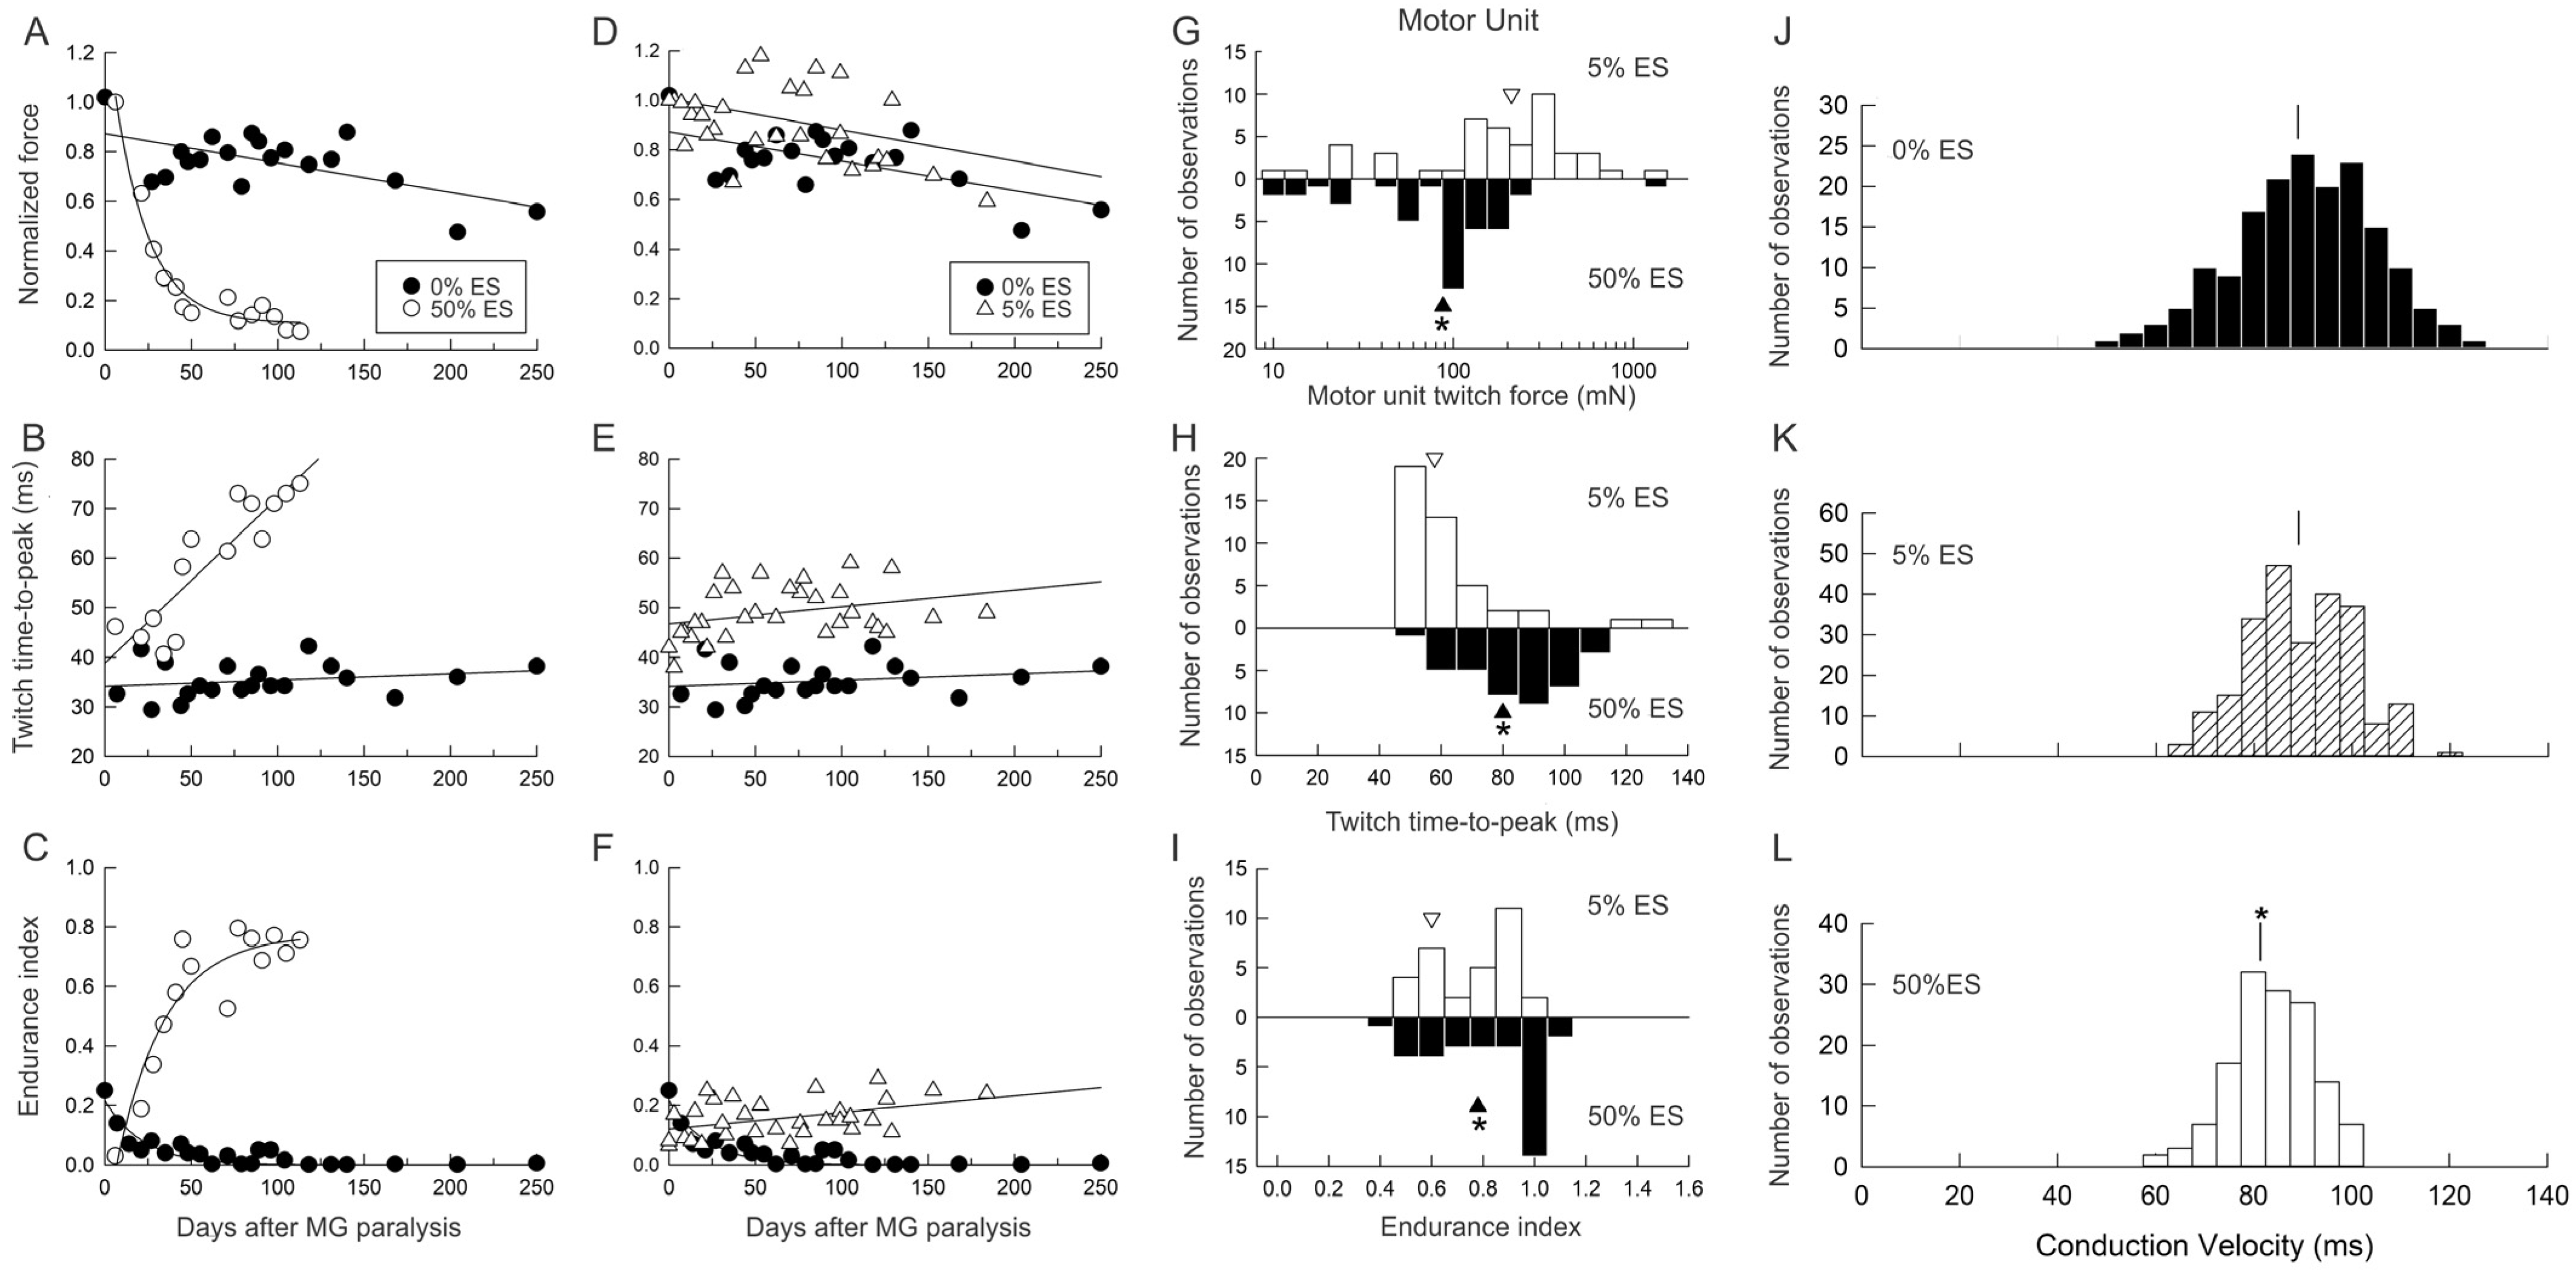
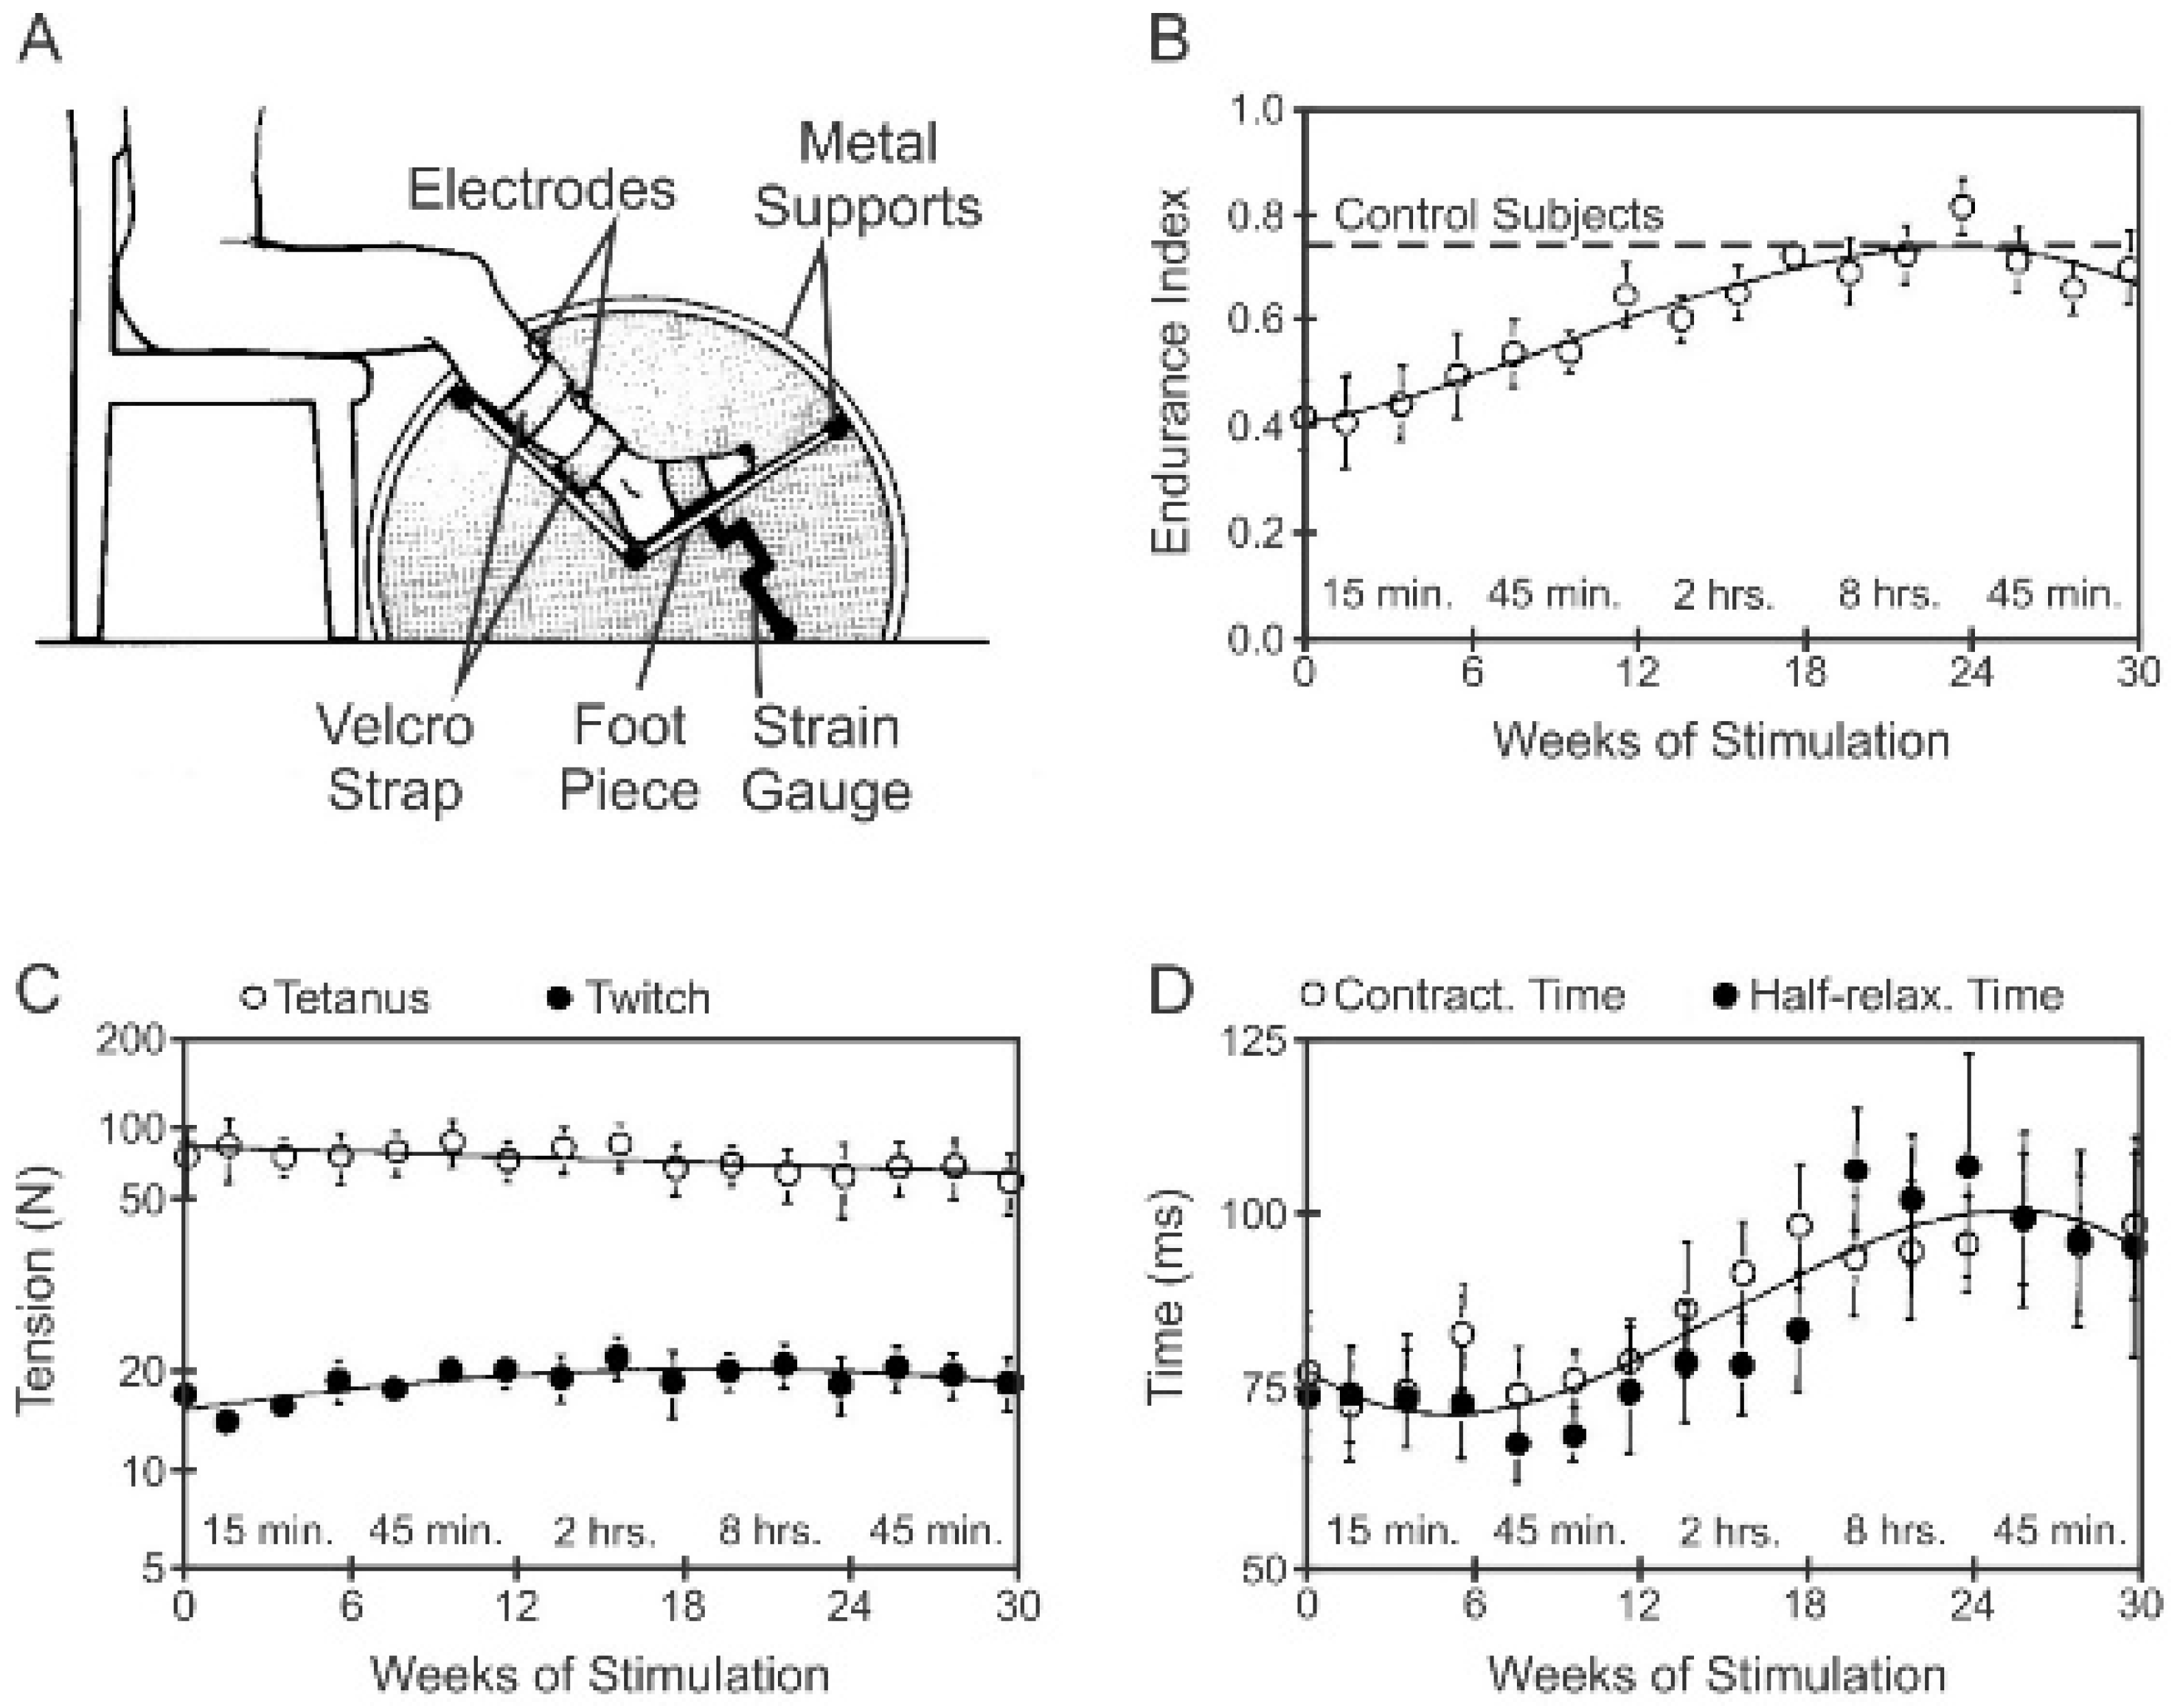
Paralysis of cats’ hindlimb muscles by the HSDA surgical paradigm of Kernell and colleagues [26,27,28,29] did not reduce the contractile force of the MG muscle recorded over time (Figure 11A,D; [33,35]). Similarly, the contractile force developed by stabilized TA muscles of spinal injured patients was not affected by their paralysis (Figure 12C; [115]). There was also little change in the contractile speed of twitch contractions in either paralyzed cat MG or TA muscles [35], as shown for the MG muscle in Figure 11B,E and Figure 12D [35]. In contrast, the endurance of the paralyzed muscles in the cat declined to very low levels (Figure 11C and Figure 12C; [33,35]). This fatiguability of paralyzed muscle was also reported in paralyzed human SOL [117,118] and quadriceps [119,120] muscles with accompanying type I-to-II-fiber-type conversion [113,121,122,123,124]. The ‘normal’ muscle forces recorded from the paralyzed cat MG and human TA muscles may be attributed to the remaining ~25% of neuromuscular activity [33] and the length of the muscles [125,126]. Muscle atrophy does occur in several paralyzed human muscles [125,126,127,128], developing with time after spinal cord injury [125,127]. The atrophy is severe in thigh muscles [122,126] as compared to the lesser atrophy of lower limb muscles such as the TA [113].
The contractile forces of both human and cat paralyzed hindlimb muscles and the time course of their contractions were not changed significantly by the daily amounts of 5% activity or less that were provided by electrical stimulation of their nerves at 20 Hz (ES) (Figure 13A–D; [35,115]). The ES was delivered to the patients’ TA muscles via external electrodes that adhered to the motor point [115] and, in the cats, via implanted electrodes around the CP and/pr MG nerves that were externalized for daily ES and regular monitoring of TA and MG muscle contractions [31,35]. ES was performed at home by the patients for progressively longer periods of 15 min (min), 45 min, 2 h, 8 h and, finally, 45 min each, for a 6-week period, i.e., 0.01%, 2%, 4%, 17% and 2% daily amounts of neuromuscular activity [115]. The ES regimens of daily amounts of 5% and 50% activities in the cats were 2.5 s (second) on and 2.5 s off for 3 h/day for 5 days/week [35] and 5 s on and 5 s off for 24 h/day for 5 days/week [31], respectively.
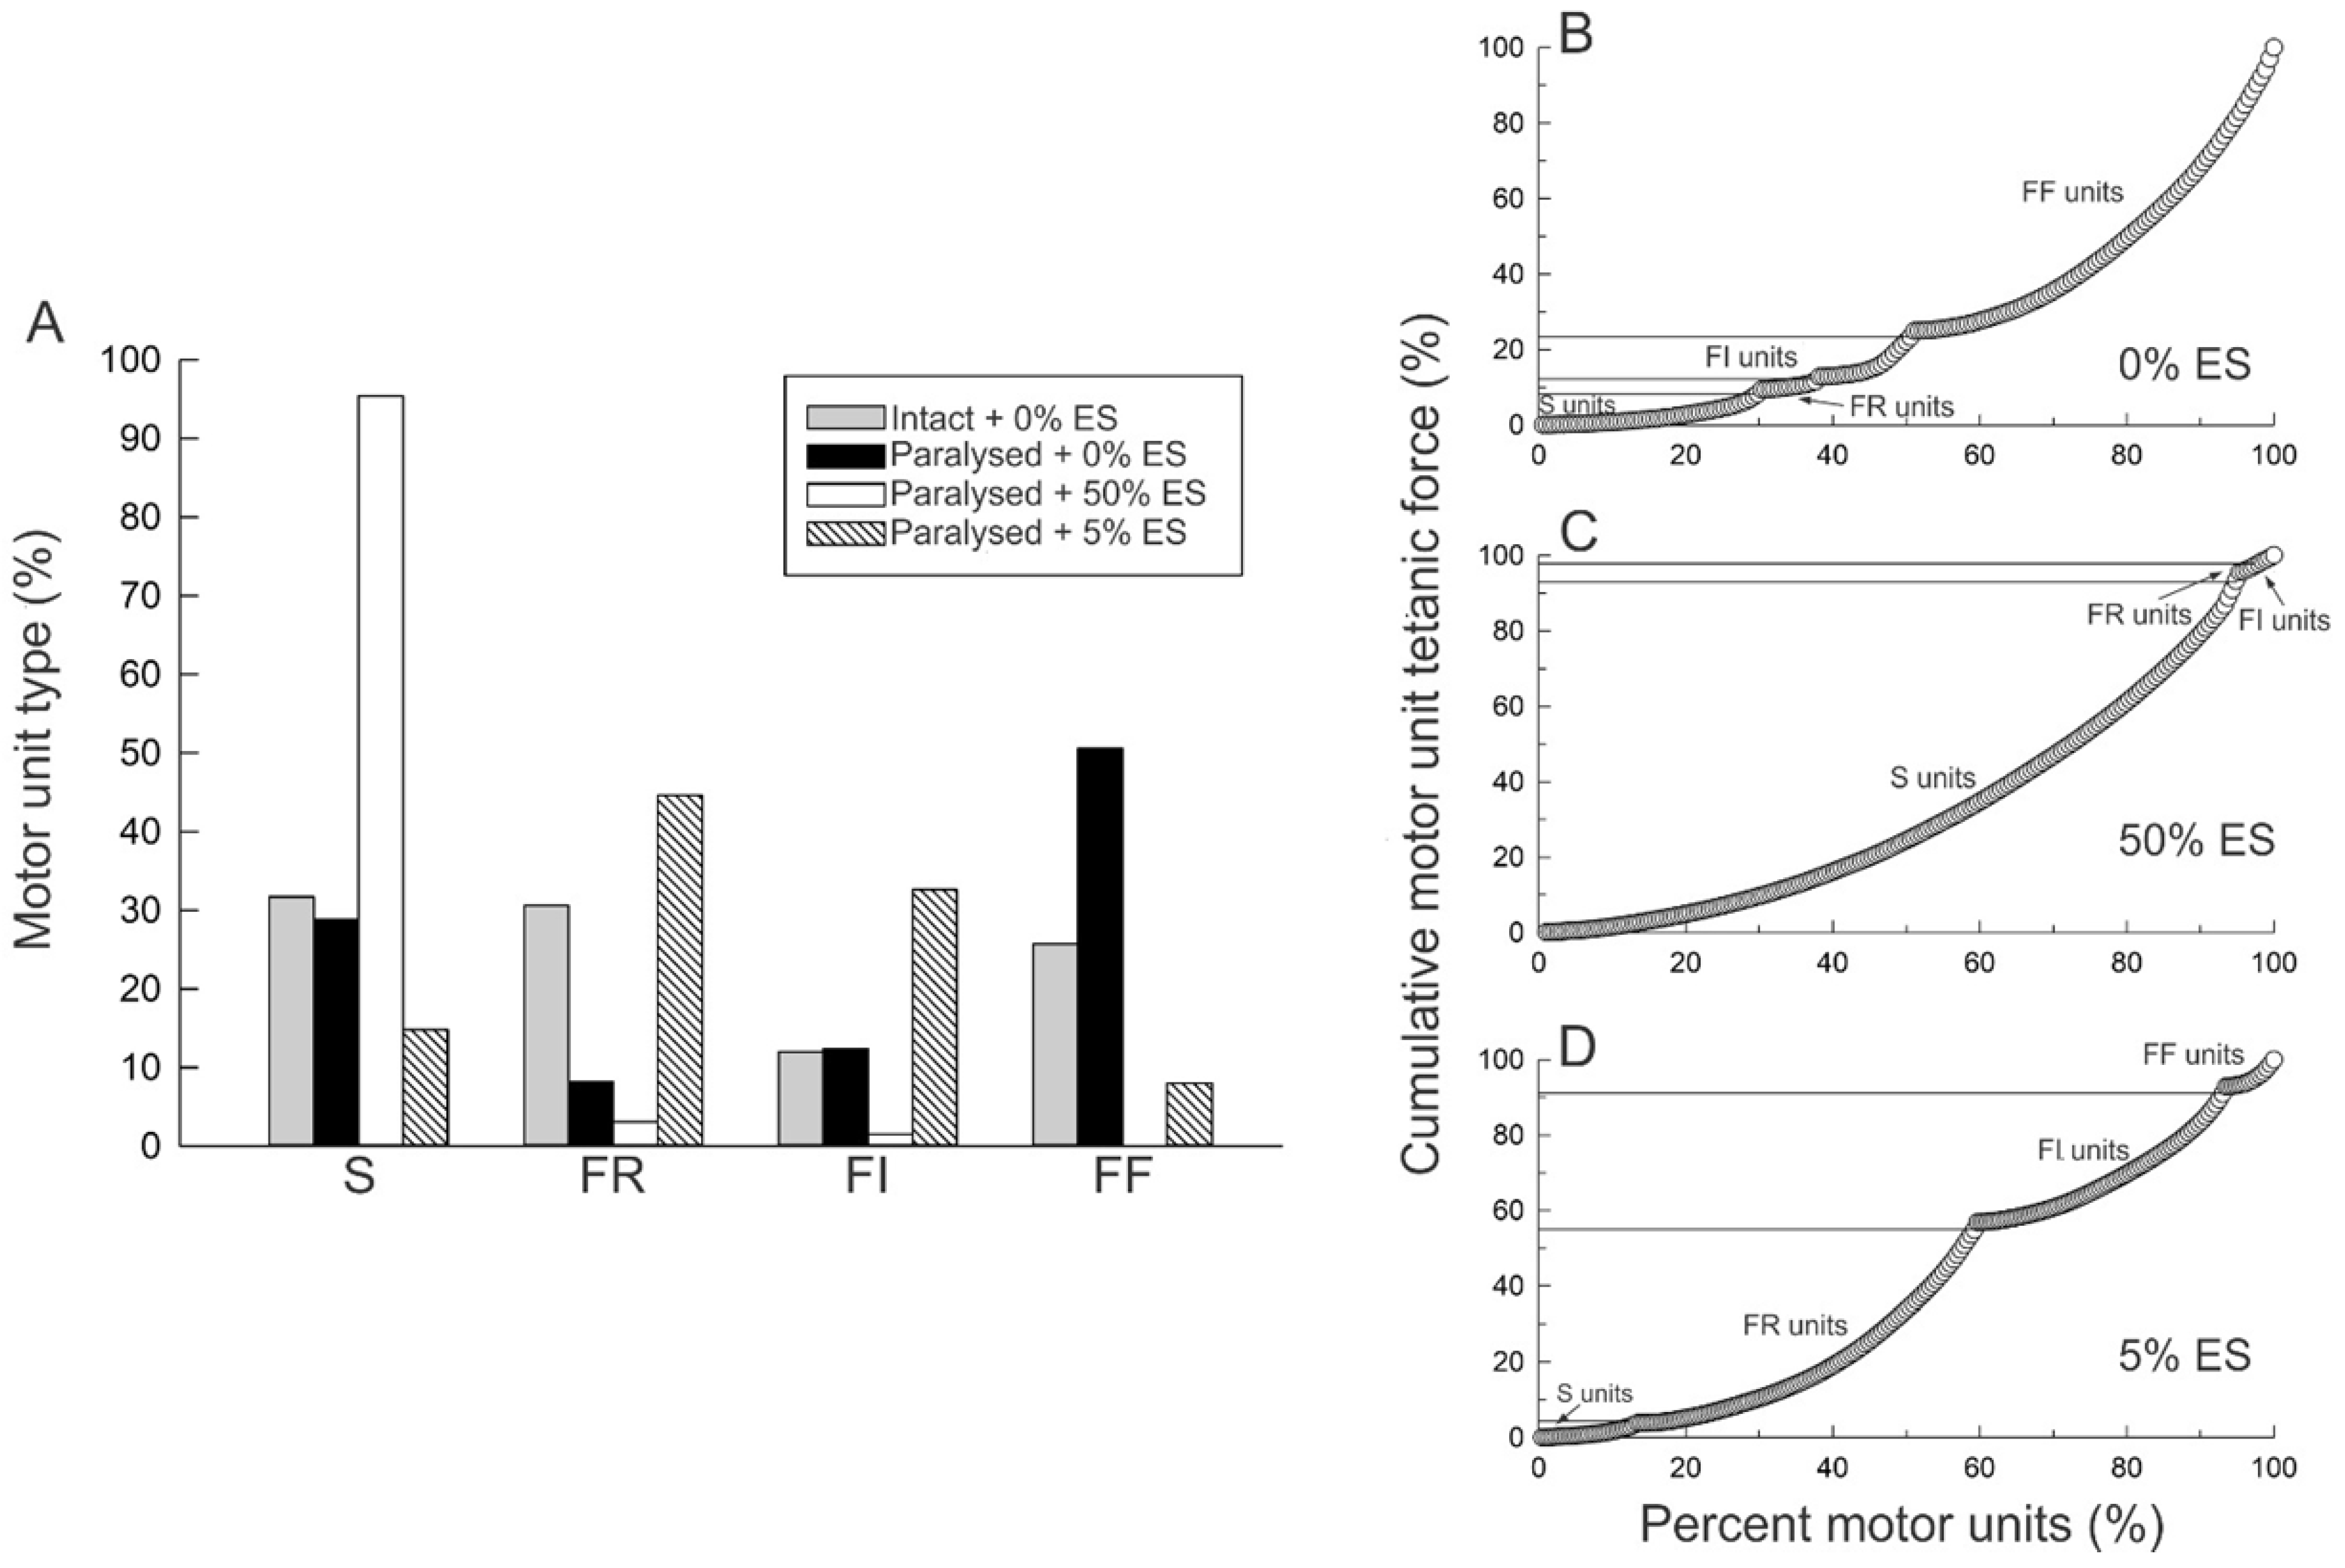
Daily 5% ES, both in human and cat muscles, having the dramatic effect of reversing the high fatigability of the muscle contractions (Figure 11F and Figure 12B), demonstrated that the amount of 4–5% daily activity is effective in promoting increased muscle endurance without compromising contractile force [33,35,115]. The MusU types shifted from FF to FR in the cat MG muscle without changing the proportions of the S-type MusUs or of SO muscle fibers (Figure 13A; [115]. The percentage of the FOG muscle fibers increased as the percentage of FF fibers declined (Figure 13A), consistent with the findings of Kernell and colleagues that 5% daily activity converts paralyzed PerL muscles to the FR muscle type [28,39]. The FR and FI MusUs almost entirely replaced the FF MusUs after 5% daily activity, with the FR MusU proportions doubling from ~25% of the MusUs to ~55% (Figure 13B,D). This conversion of FF to FR and FI MusUs by the 5% ES paradigm allows for the recruitment of ~55% of the MusUs during movement without muscle fatigue (Figure 13D).

3.5.3. High Daily Amounts of Neuromuscular Activity

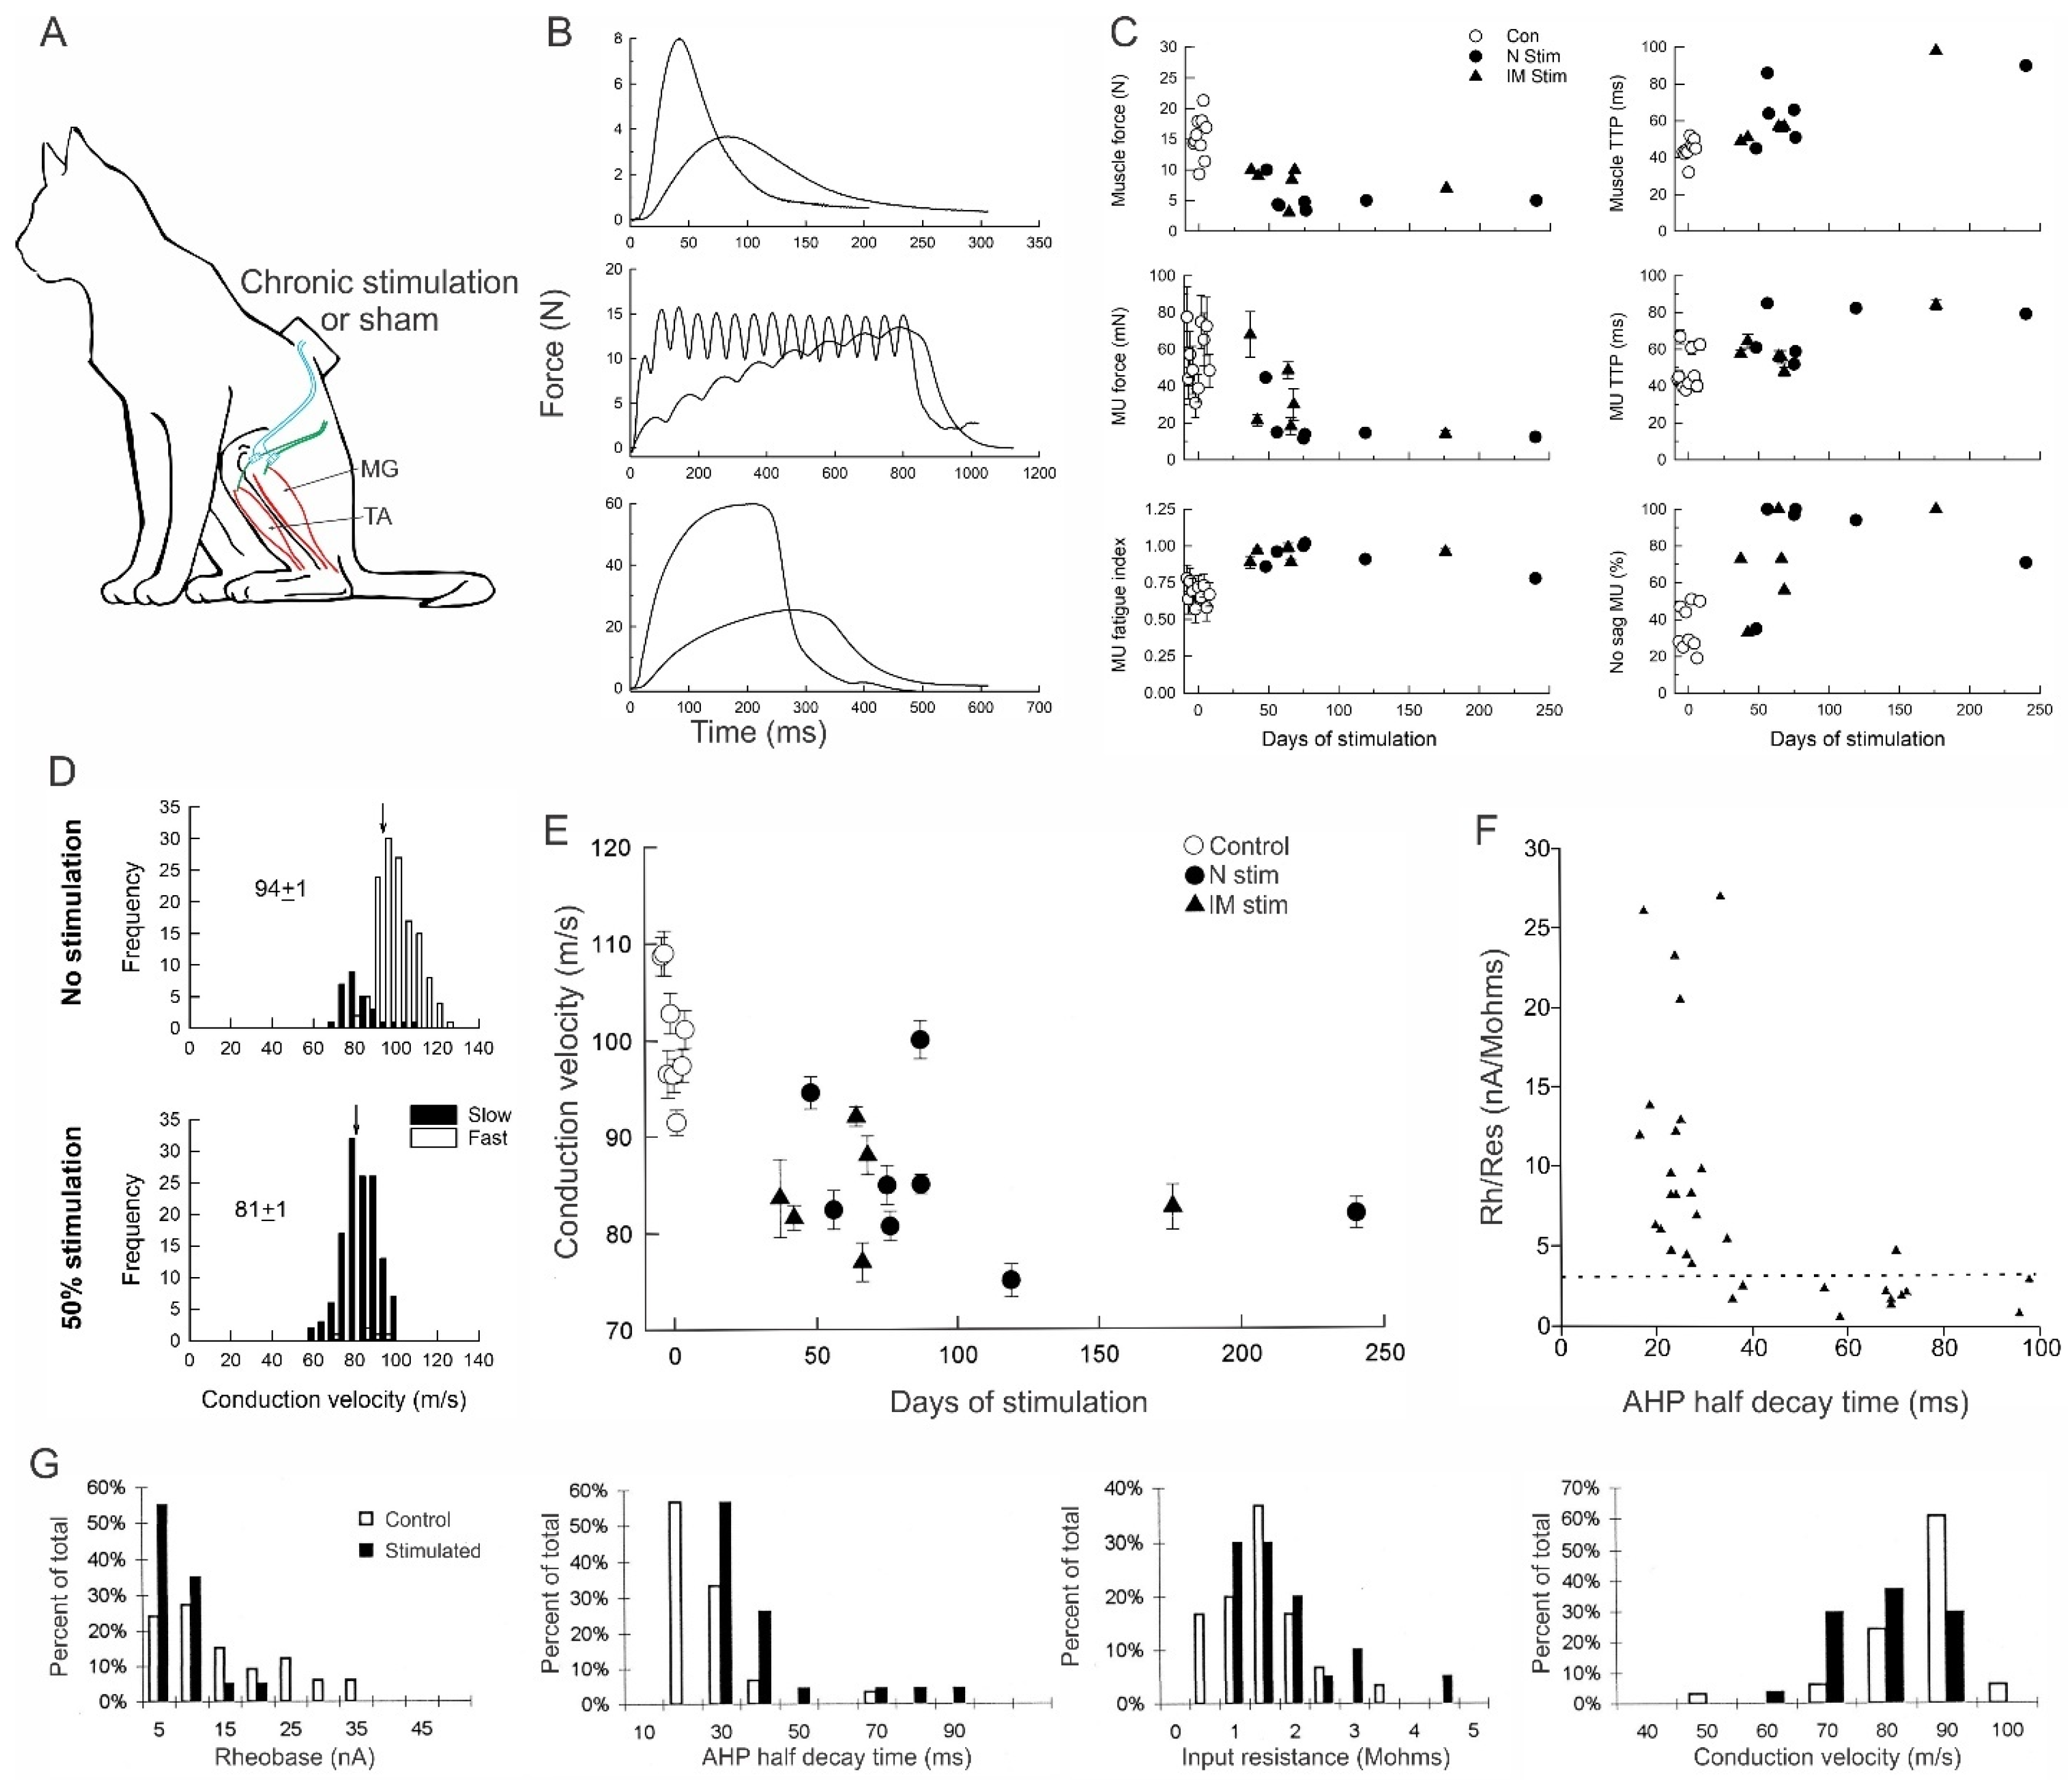
Increasing the daily activity to 50% of each day dramatically reduced the contractile force, speed and fatigability of the stimulated MG muscle (Figure 11A–C; [31]). The effects of the daily 50% were analogous to the fast-to-slow conversion of muscles and their fibers by continuous low-frequency ES regimens of Vrbová and Pette [22,23,24,25] and were accompanied by the almost complete fast-to-slow conversion of MusU types (Figure 13A; [31]). Chronic recordings of muscle contractions revealed rapid fast-to-slow muscle conversion, including the transition from “sag” to “non-sag’ of unfused contractions (Figure 14B,C; [31]). Acute intracellular stimulation and recording of MG motoneurons permitted a detailed study of their electrical properties in conjunction with the contractile properties of their MusUs, demonstrating a parallel conversion of motoneuron and MusU properties from fast to slow (Figure 14D–G). The distribution of MG nerve conduction velocities after daily 50% ES was shifted to lower values as compared with those of the nerves that were not stimulated, with their average values being significantly different (p < 0.05; Figure 14D; [31]). The time course of the slowing of conduction velocities during daily 50% ES (Figure 14E) paralleled the fast-to-slow conversion of their MusU properties (Figure 14C). More detailed study of the electrical properties of the motoneurons after 58–87 days of daily 50% ES confirmed their fast-to-slow conversion [32]. MG-type F and S motoneurons normally have Rh/Rin ratios of >7 and <7, respectively, with the ratio for the S-type drawn as a straight line in Figure 14F. The ratios for the stimulated motoneurons progressively declined to the S-type as the duration of the AHP increased to values typical of S-type motoneurons (Figure 14F; [32]). Indeed, the histograms of data collected for all the measures of motoneuron size, Rh, AHP, Rin and CV shifted to the values of S-type values (Figure 14G; [32]). Importantly, the size relationships between MU nerve and muscle properties remained after their F-to-S type conversion [31], with their demonstration being consistent with that in the cat soleus muscle in which all the motoneurons and their MusUs are slow [65].

3.5.4. A Range of Properties Within MU Types

The experimental evidence of S-to-F conversion of nerve size when all neuromuscular activity was removed by SCI surgery [116] and the F-to-S conversion of muscle and their MusU properties by daily 50% ES [31,32], indicate the critical role of the daily amount of neuromuscular activity in determining the electrical properties of motoneurons, the size of their nerve fibers and matching properties of the motoneurons and their MusUs. The daily amounts of neuromuscular activities of <0.05%, 5% and 50% by ES converted the heterogenous MU populations in MG muscles to FF, FR and S types, irrespective of the frequency of the ES pulses (Figure 12, Figure 14 and Figure 15). Theoretically, if it were only the amount of neuromuscular activity that determines the properties of the motoneuron, motor nerve and muscle fibers that they supply, imposing any one of the controlled daily activities should result in restricted and narrow distributions of the properties of the motoneurons, nerves and MusUs. This was not the case, however, with the range of the motoneuron, nerve and MusU parameters remaining wide and frequently exceeding that of each of the MU types in the control unstimulated MUs. For example, despite the conversion of all the MUs to the S-type by daily 50% ES, the range of Rh/Rin values of MG motoneurons exceeded their normal range (Figure 14G and Figure 15; [32]). Moreover, the Rh/Rin ratios recorded in motoneurons after 50% ES increased as a function of the remaining but increased range of tetanic forces of their MusUs (Figure 15). Hence, the experimental findings indicate that neuromuscular activity has a strong modulating rather than a determining effect on the size and properties of motoneurons, nerves and MusUs. The expansion in the range of the electrophysiological measures of motoneuron and MusU size argue that other factors, in addition to the amount of daily activity, must be considered in determining MU properties.
Given the monosynaptic inputs on motoneurons that increase from S through to FF MUs [129], these inputs onto the motoneurons are likely important contributors to Henneman’s s1ize principle of the orderly recruitment of MUs according to size [63,64,67]. The fact that the size relationships between nerves and their MusUs return in partially denervated muscles [101] reinnervated muscles, even after cross-reinnervation [72,78,80,88,102,103,106,107] and in paralysed muscles and muscles subjected to controlled amounts of daily activity with ES [31,33,34,35,80], demonstrates the centrality of the size principle of neuromuscular organization. The properties of motoneurons, their nerves and MusUs may be modulated by their activity, including spinal cord transection, spinal cord isolation, limb immobilization and space flight [10].

3.5.5. Plasticity of Human Muscle Fibers

Human skeletal muscles are heterogenous in their fiber type composition, as they are in animals [130]. They both exhibit plasticity, but unlike experiments in which a single pattern of amount of daily activity can be imposed on muscles to demonstrate plasticity in rats, rabbits and cats, it is not possible to control the pattern or the amount of daily activity in human muscles. Rather, exercise programs that include endurance and intermittent exercises have been used to investigate the plasticity of muscles of athletes, healthy subjects, elderly subjects and subjects with nerve and muscle injuries and disease, including diabetes and amyotrophic lateral sclerosis. The endurance exercises are characterized by repeated, sustained, low-intensity contractions for prolonged periods of time without fatigue [42,131]. Intermittent resistance exercises, in turn, involve low-frequency, high-intensity contractions against external resistance. The programs essentially utilize the lower and upper levels of orderly MU recruitment curve, with the endurance exercise activating the <30% of all MUs that are low-threshold fatigue-resistant MUs and the intermittent exercise programs activating the high-threshold fatigable MUs that constitute the upper 30% of the total numbers of MUs in most muscles (Figure 13B; [132]).
Human muscle fiber types are divided into slow-twitch type I and slow-twitch type II, as in animal muscles, both based on myosin ATPase histochemistry. The type II fibers in human muscles have been further differentiated into intermediate type IIa and type IIx, based on their oxidative-glycolytic and fast-glycolytic histochemical profiles [130]. The histochemical recognition of type I and II fibers has been the mainstay of many investigations of muscle plasticity in human subjects [133]. Of these, many investigators have used computer searches across numerous databases, including PubMed, SPORTDiscus, MEDLINE and Google Scholar, to determine the fiber type composition in muscles subjected to endurance and/or intermittent exercise programs. Thereby, the studies evaluate whether and how the intervention programs affect healthy individuals and those who suffer injury or disease. Nonetheless, other more substantive investigations have been performed with regard to the identification of myosin isoforms and determining blood flow within muscles and the location, density and function of intramuscular capillaries, numbers and function of mitochondria and the proliferation and behaviour of satellite cells in their studies on muscle plasticity [133].
The link between the muscle and muscle fiber properties with the patterns and/or amounts of neuromuscular activity was identified in studies of the muscle fiber types in athletes. The studies found that athletes whose muscles contain a preponderance of type I fibers are likely to enjoy success in endurance-type events such as road cycling and marathon running. Also, football players typically possess more type I fibers compared to rugby players and handball athletes, as do European football players whose muscles are comprised of greater proportions of type I fibers and who cover greater distances [134,135,136,137]. The proportions of type II fibers are higher than type I in athletes, who are more likely to succeed in track sprint cycling, power-type events (i.e., Olympic lifting) or cyclic movements that require high-frequency MU firing (i.e., track sprint running). The elite runners who compete and succeed in competitive sprinting events in competitions also tend to have greater proportions of type II muscle fibers.
These important observations on the proportions of muscle fiber types in athletes may be explained by experimental findings that have elucidated fiber-type conversions with concomitant changes in the muscle fiber properties. First, endurance exercises lead to type-II-to-type-I fiber-type conversion with increases in the slow myosin composition of the myofibrils [138], mitochondria [139], number and densities of capillaries in association with increased blood flow to the muscle fibers [140,141,142], the number of nuclei per muscle fiber and the satellite cellular pool [133]. Second, intermittent resistance exercise leads to muscle fiber hypertrophy of type II fibers when they are repeated weekly for 6 weeks [143] and both type I and II fiber hypertrophy when the length of time of the exercises is prolonged [144,145]. Hypertrophy has been attributed to the addition of sarcomeres and myofibrils in parallel [146], along with increased amounts of actin and myosin contractile proteins in the exercised muscles [147]. There is also a paradoxical increase in the number of myonuclei in the type II fibers that contributes to hypertrophy of the fibers by enhancing protein synthesis (see [133]).
Regarding the question of the range of muscle properties in athletes, as well as the range in muscle conversions in healthy young and elderly individuals and those affected by nerve injury or disease, by exercise programs, many of the studies report a range of properties using different outcome measures. As an example, there remained a range in sleep quality that was assessed by PSQI (Pittsburgh Sleep Quality Index) in older subjects who performed a variety of different types of exercise, including Pilates, yoga and Nordic walking [147].

4. Conclusions and Significance

Slow- and fast-twitch muscle fibers are localized to deep and superficial compartments in extensive studies of limb muscles in many animal species and in humans. Kernell, in particular, pointed out the functional significance of this localization. The slow-twitch muscle fibers that fire at continuous low frequencies, maintain low force levels for long periods of time, localize deep in muscles and surround the bones stabilize the limbs during standing. In the background of this stability, the progressive recruitment of the more forceful fast-contracting muscle fibers, which tend to fire intermittently at high frequencies, accounts for the progressively increased forceful contractions during movement. In addition to MU recruitment, modulating the MU firing rates controls the force production of the muscles.
The early and simple delineation of fast- and slow-twitch skeletal muscles, in association with findings of the intermittent high-frequency and continuous low-frequency firing characteristics of their motoneurons, was the basis for the extensive studies by Vrbová, Pette and colleagues to support the view that it is the pattern of activity that determines the properties of muscles and their muscle fibers. Henneman’s size principle, that the size and properties of motoneurons and their MUs are matched and that MUs are recruited in order of their size, was brought into perspective by their work on the functional role of the diversity of muscle properties and functions [148]. Kernell’s extensive recordings of muscle contractile and histochemical properties concluded that it is not the pattern of activity of MUs that determines their physiological, biochemical, immune and histochemical properties, but rather it is the daily amount of activity that determines their properties. Gordon’s work verified this view with the recording of motoneuron and MusU properties, in addition to physiological and anatomical verification. Nonetheless, findings that, despite the conversion of muscle and MU properties to S, FR or FF by 50%, 5% and 0% daily activity, the range of properties in each of these MU types is retained argues that factor(s) other than either, or both the pattern and amount of daily neuromuscular activity, must be considered as determining the properties of the motoneurons and their MusUs. Similarly, the range of the effects of endurance and intermittent exercise programs on healthy subjects and those suffering nerve injuries and disease is also consistent with the argument that factors other than the pattern or amount of neuromuscular activity must be determined.

Funding

This research received external funding from the Canadian Institutes of Health Research, the Muscular Dystrophy Association of Canada and the Amyotrophic Lateral Sclerosis Society of Canada. T.G. was funded as a Heritage Scientist by the Alberta Heritage Foundation for Medical Research.

Acknowledgments

My thanks to my students, post-doctoral students, technicians and collaborators in Edmonton and Toronto who have made contributions to the research that is described in this review. I am most grateful to the Canadian agencies who have funded much of the research work described and to the continued assistance provided to me by my technologist Neil Tyreman in Edmonton.

Conflicts of Interest

The authors declare no conflicts of interest.

Abbreviations

MUmotor unit
Sslow
FRfast-fatigue-resistant
FFfast-fatigable
Ffast
SOslow oxidative
FOGfast-oxidative-glycolytic
FGfast-glycolytic
MusUmuscle unit
FDLflexor digitorum longus
SOLsoleus muscle
MGmedial gastrocnemius muscle
FDLflexor digitorum longus muscle
TAtibialis anterior muscle
ESelectrical stimulation
ssecond
CPcommon peroneal nerve
PerLperoneus longus muscle
CTtwitch contraction time
FIfatigue index
CVnerve conduction velocity
TTPtime-to-peak force
RhRheobase current
Rininput resistance
AHPafter-hyperpolarization
EMGelectromyographic signal
T-frelationship between T muscle tension and f the frequency of stimulation frequency
SCIspinal cord isolation for 8 months
minminutes
SEstandard error

References

  1. Ranvier, L. De quelques faits relatifs a l’histologie et à la physiologie des muscles striès. Arch. Physiol. Norm. Pathol. 1874, 6, 1–15. [Google Scholar]
  2. Grűtzner, P. Zűr anatomie und physioslogie der querquestreiften muskeln. Rec. Zool. Suisse 1884, 1, 665–684. [Google Scholar]
  3. Kuhne, W. Under die Endignung der Nerven u deb Nyscjekb. Vischows Arch. 1863, 27, 1628–1632. [Google Scholar]
  4. Denny-Brown, D. On the nature of postural reflexes. Proc. R. Soc. (Biol.) 1929, 104, 252–301. [Google Scholar]
  5. Hilton, S.M.; Jeffries, M.G.; Vrbová, G. Functional specializations of the vascular bed of soleus. J. Physiol. 1970, 206, 543–562. [Google Scholar] [CrossRef] [PubMed]
  6. Hudlická, O.; Hoppeler, H.; Uhlmann, E. Relationship between the size of the capillary bed and oxidative capacity in various cat skeletal muscles. Pflug. Arch. 1987, 410, 369–375. [Google Scholar] [CrossRef] [PubMed]
  7. Ariano, M.A.; Armstrong, R.B.; Edgerton, V.R. Hindlimb muscle fiber populations of five mammals. J. Histochem. Cytochem. 1973, 21, 51–55. [Google Scholar] [CrossRef] [PubMed]
  8. Armstrong, R.B. Properties and distributions of the fibre types in the locomotory muscles of mammals. In Comparative Physiology: Primitive Mammals; Schmidt-Nielsen, K., Bolis, L., Taylor, C.R., Eds.; Cambridge University Press: Cambridge, UK, 1980; pp. 243–254. [Google Scholar]
  9. Armstrong, R.B.; Phelps, R.O. Muscle fiber type composition of the rat hindlimb. Am. J. Anat. 1984, 171, 57–62. [Google Scholar] [CrossRef] [PubMed]
  10. Gordon, T.; Pattullo, M. Plasticity of muscle fiber and motor unit types. Exerc. Sport Sci. Rev. 1993, 21, 331–362. [Google Scholar] [CrossRef] [PubMed]
  11. Kernell, D. Muscle regionalization. Can. J. Appl. Physiol. 1998, 23, 1–22. [Google Scholar] [CrossRef] [PubMed]
  12. Wang, L.C.; Kernell, D. Quantification of fibre type regionalisation: An analysis of lower hindlimb muscles in the rat. J. Anat. 2001, 198, 295–308. [Google Scholar] [CrossRef] [PubMed]
  13. Sherrington, C. The correlation of reflexes and the principle of the common final path. Br. Assoc. 1939, 74, 728–741. [Google Scholar]
  14. Burke, R.E. Motor unit types of cat triceps surae. J. Physiol. 1967, 193, 141–160. [Google Scholar] [CrossRef] [PubMed]
  15. Burke, R.E.; Tsairis, P. The correlation of physiological properties with histochemical characteristics of single muscle units. Ann. N. Y. Acad. Sci. 1974, 228, 145–159. [Google Scholar] [CrossRef] [PubMed]
  16. Burke, R.E.; Levine, D.N.; Tsairis, P.; Zajac, F.E. Physiological types and histochemical profiles in motor units of the cat gastrocnemius. J. Physiol. 1973, 234, 723–748. [Google Scholar] [CrossRef] [PubMed]
  17. Edstrőm, L.; Kugelberg, E. Histochemical composition, distribution of fibres and fatigability of single motor units. J. Neurol. Neurosurg. Psychiatry 1968, 31, 424–433. [Google Scholar] [CrossRef] [PubMed]
  18. Burke, R.E. Motor units: Anatomy, physiology, and functional organization. In Handbook of Physiology. Sect. I. Vol. II. The Nervous System: Motor Control. Part I; Brooks, V.B., Ed.; American Physiological Society: Rockville, MD, USA, 1981; pp. 345–422. [Google Scholar]
  19. Pette, D.; Staron, R.S. Myosin isoforms, muscle fiber types, and transitions. Microsc. Res. Tech. 2006, 50, 500–509. [Google Scholar] [CrossRef]
  20. Gauthier, G.F.; Burke, R.E.; Lowey, S.; Hobbs, A.W. Myosin isozymes in normal and reinnervated cat skeletal muscle fibers. J. Cell Biol. 1983, 97, 756–771. [Google Scholar] [CrossRef] [PubMed]
  21. Nemeth, P.; Pette, D.; Vrbová, G. Comparison of enzyme activities among single muscle fibres within defined motor units. J. Physiol. 1981, 311, 489–495. [Google Scholar] [CrossRef] [PubMed]
  22. Vrbová, G.; Jones, R.; Gordon, T. Nerve-Muscle Interaction, 2nd ed.; Chapman and Hall, John Wiley & Sons: New York, NY, USA, 1995. [Google Scholar]
  23. Pette, D.; Vrbová, G. Neural control of phenotypic expression in mammalian muscle fibers. Muscle Nerve 1985, 8, 676–689. [Google Scholar] [CrossRef] [PubMed]
  24. Pette, D.; Vrbová, G. Adaptations of muscle fibers to chronic electrical stimulation. Rev. Physiol. Biochem. Pharmacol. 1992, 120, 115–202. [Google Scholar] [PubMed]
  25. Pette, D.; Vrbová, G. The contribution of neuromuscular stimulation in elucidating muscle plasticity revisited. Eur. J. Transl. Myol. 2017, 27, 633–639. [Google Scholar] [CrossRef] [PubMed]
  26. Eerbeek, O.; Kernell, D.; Verhey, B.A. Effects of fast and slow patterns of tonic long-term stimulation on contractile properties of fast muscle in the cat. J. Physiol. 1984, 352, 73–90. [Google Scholar] [CrossRef] [PubMed]
  27. Donselaar, Y.; Eerbeek, O.; Kernell, D.; Verhey, B.A. Fibre sizes and histochemical staining characteristics in normal and chronically stimulated fast muscle of the cat. J. Physiol. 1987, 382, 237–254. [Google Scholar] [CrossRef] [PubMed]
  28. Kernell, D.; Eerbeek, O.; Verhey, B.A.; Donselaar, Y. Effects of physiological amounts of high- and low-rate chronic stimulation on fast-twitch muscle of the cat hindlimb. I. Speed and force-related properties. J. Neurophysiol. 1987, 58, 598–613. [Google Scholar] [CrossRef] [PubMed]
  29. Kernell, D.; Donselaar, Y.; Eerbeek, O. Effects of physiological amounts of high- and low-rate chronic stimulation on fast-twitch muscle of the cat hindlimb. II. Fatigability-related properties. J. Neurophysiol. 1987, 58, 614–627. [Google Scholar] [CrossRef] [PubMed]
  30. Gordon, T.; Mao, J. Muscle atrophy and procedures for training after spinal cord injury. Phys. Ther. 1994, 74, 50–60. [Google Scholar] [CrossRef] [PubMed]
  31. Gordon, T.; Tyreman, N.; Rafuse, V.F.; Munson, J.B. Fast-to-slow conversion following chronic low-frequency activation of medial gastrocnemius muscle in cats. I. Muscle and motor unit properties. J. Neurophysiol. 1997, 77, 2585–2604. [Google Scholar] [CrossRef] [PubMed]
  32. Munson, J.B.; Foehring, R.C.; Mendell, L.M.; Gordon, T. Fast-to-slow conversion following chronic low-frequency activation of medial gastrocnemius muscle in cats. II. Motoneuron properties. J. Neurophysiol. 1997, 77, 2005–2615. [Google Scholar] [CrossRef] [PubMed]
  33. Gordon, T.; Pattullo, M.; Rafuse, V.F. Medial gastrocnemius muscles fatigue but do not atrophy in the paralyzed cat hindlimb after long-term hemisection and deafferentation. Exp. Neurol. 2020, 327, 113201. [Google Scholar] [CrossRef] [PubMed]
  34. Gordon, T.; Eldridge, L.; Aurora, S. Enlargement of the nerve fibres of silenced lumbosacral motoneurons in cats. Biomedicines 2022, 10, 2022. [Google Scholar] [CrossRef] [PubMed]
  35. Gordon, T.; Tyreman, N. Electrical stimulation to promote muscle and motor unit force and endurance after spinal cord injury. J. Physiol. 2023, 601, 1449–1466. [Google Scholar] [CrossRef] [PubMed]
  36. Butler, J.E.; Cosmos, E.; Brierly, J. Differentiation of muscle fibre types in aneurogenic branchial muscles of the chick embryo. J. Exp. Zool. 1982, 224, 65–80. [Google Scholar] [CrossRef] [PubMed]
  37. Condon, K.L.; Silberstein, H.M.; Blau, H.M.; Thompson, W.J. Differentiation of fiber types in aneural musculature of the prenatal rat hindlimb. Dev. Biol. 1990, 198, 275–295. [Google Scholar] [CrossRef] [PubMed]
  38. Fredette, B.J.; Landmesser, L.T. Relationship of primary and secondary myogenesis in fiber type development in embryonic chick muscle. Dev. Biol. 1990, 143, 1–18. [Google Scholar] [CrossRef] [PubMed]
  39. Miller, J.B.; Stockdale, F.E. Developmental regulation of the multiple myogenic cell lineages of the avian embryo. J. Cell Biol. 1986, 103, 2197–2208. [Google Scholar] [CrossRef] [PubMed]
  40. Buller, A.J.; Eccles, J.C.; Eccles, R.M. Interactions between motoneurons and muscles in respect of the characteristic speeds of their responses. J. Physiol. 1960, 150, 417–439. [Google Scholar] [CrossRef] [PubMed]
  41. Kernell, D. The repetitive discharge of motoneurons. In Muscular Afferents and Motor Control Nobel Symposium I; Granit, R., Ed.; Almqvist and Wilseli: Stockholm, Sweden, 1966; pp. 351–362. [Google Scholar]
  42. Granit, R. Mechanisms regulating the discharge of motoneurones. In The Sherrington Lectures, XI; Liverpool University Press: Liverpool, UK, 1970. [Google Scholar]
  43. Granit, R. The Basis of Motor Control; Academic Press: London, UK; New York, NY, USA, 1970. [Google Scholar]
  44. Kernell, D. Recruitment, rate modulation and the tonic stretch reflex. Prog. Brain Res. 1976, 44, 257–265. [Google Scholar] [PubMed]
  45. Kernell, D. Rhythmic properties of motoneurones innervating muscle fibres of different speed in m. gastrocnemius medialis of the cat. Brain Res. 1979, 160, 159–162. [Google Scholar] [CrossRef] [PubMed]
  46. Vrbová, G. The effect of motoneurone activity on the speed of contraction of striated muscle. J. Physiol. 1963, 169, 513–526. [Google Scholar] [CrossRef] [PubMed]
  47. Salmons, S.; Vrbová, G. The influence of activity on some contractile characteristics of mammalian fast and slow muscles. J. Physiol. 1969, 201, 535–549. [Google Scholar] [CrossRef] [PubMed]
  48. Pette, D.; Smith, M.E.; Staudte, H.W.; Vrbová, G. Effects of long-term stimulation on some contractile and metabolic characteristics of fast rabbit muscles. Pflug. Arch. Eur. J. Physiol. 1973, 338, 257–272. [Google Scholar] [CrossRef] [PubMed]
  49. Pette, D.; Muller, W.; Leisner, E.; Vrbová, G. Time dependent effect on contractile properties, fibre population, myosin light chains and enzymes of energy metabolism in intermittently and continuously stimulated fast twitch muscles of the rabbit. Pflug. Arch. 1976, 364, 103–112. [Google Scholar] [CrossRef] [PubMed]
  50. Nuhr, M.; Crevenna, R.; Gohlsch, H.; Bittner, C.; Pleiner, J.; Wiesinger, G.; Fialka-Moser, V.; Quittan, M.; Pette, D. Functional and biochemical properties of chronically stimulated human skeletal muscle. Eur. J. Appl. Physiol. 2003, 89, 202–208. [Google Scholar] [CrossRef] [PubMed]
  51. Hendriksson, J.; Chi, M.M.-Y.; Hintz, C.S.; Young, D.A.; Kaiser, K.K.; Salmons, S.; Lowry, O.H. Chronic stimulation of mammalian muscle: Changes in enzymes of six metabolic pathways. Am. J. Physiol. 1986, 251, C614–C632. [Google Scholar] [CrossRef] [PubMed]
  52. Williams, R.S.; Carein-Moll, M.; Mellor, J.; Salmons, S.; Harlan, W. Adaptation of skeletal muscle to increased contractile activity. J. Biol. Chem. 1987, 262, 2764–2767. [Google Scholar] [CrossRef] [PubMed]
  53. Hood, D.A.; Zak, R.; Pette, D. Chronic stimulation of rat skeletal muscle induces coordinate increases in mitochondrial and nuclear mRNAs of cytochrome-c-oxidase subunits. Eur. J. Biochem. 1989, 179, 275–280. [Google Scholar] [CrossRef] [PubMed]
  54. Gorza, L.; Gundersen, K.; Lomo, S.; Schiaffino, S.; Westgaard, R.H. Slow-to-fast transformation of denervated soleus muscles by chronic high-frequency stimulation in the rat. J. Physiol. 1988, 402, 627–769. [Google Scholar] [CrossRef] [PubMed]
  55. Lomo, T.; Westgaard, R.H.; Dahl, H.A. Contractile properties of muscle: Control by pattern of muscle activity in the rat. Proc. R. Soc. (Lond.) Ser. B Biol. Sci. 1974, 187, 99–103. [Google Scholar]
  56. Hennig, R.; Lomo, T. Effects of chronic stimulation on the size and speed of long-term denervated and innervated rat fast and slow skeletal muscles. Acta Physiol. Scand. 1987, 130, 115–131. [Google Scholar] [CrossRef] [PubMed]
  57. Hennig, R.; Lomo, T. Firing patterns of motor units in normal rats. Nature 1985, 314, 164–166. [Google Scholar] [CrossRef] [PubMed]
  58. Fischbach, G.; Robbins, N. Changes in contractile properties of disused soleus muscles. J. Physiol. 1989, 201, 305–320. [Google Scholar] [CrossRef] [PubMed]
  59. Mayer, R.F.; Burke, R.E.; Toop, J.; Hodgson, A.; Kanda, K.; Walmsley, B. The effect of long-term immobilization on the motor unit population of the cat medial gastrocnemius muscle. Neuroscience 1981, 6, 725–739. [Google Scholar] [CrossRef] [PubMed]
  60. Mayer, R.F.; Burke, R.E.; Toop, J.; Walmsley, B.; Hodgson, J.A. The effect of spinal cord transection on motor units in cat medial gastrocnemius muscles. Muscle Nerve 1984, 7, 23–31. [Google Scholar] [CrossRef] [PubMed]
  61. Guth, L.; Wells, J.B. Physiological and histochemical properties of the soleus muscle after denervation of its antagonists. Exp. Neurol. 1972, 36, 463–471. [Google Scholar] [CrossRef] [PubMed]
  62. Hennig, R. Section of fibular nerve affects activity pattern and contractile properties of soleus motor units in adult rats. Acta Physiol. Scand. 1987, 130, 143–151. [Google Scholar] [CrossRef] [PubMed]
  63. Henneman, E.; Olson, C.B. Relations between structure and function in the design of skeletal muscles. J. Neurophysiol. 1965, 28, 581–598. [Google Scholar] [CrossRef] [PubMed]
  64. Henneman, E.; Somjen, G.; Carpenter, D.O. Functional significance of cell size in spinal motoneurons. J. Neurophysiol. 1965, 28, 560–580. [Google Scholar] [CrossRef] [PubMed]
  65. McPhedran, A.M.; Wuerker, R.B.; Henneman, E. Properties of motor units in a homogeneous red muscle (soleus) of the cat. J. Neurophysiol. 1965, 28, 71–84. [Google Scholar] [CrossRef] [PubMed]
  66. Wuerker, R.B.; McPhedran, A.M.; Henneman, E. Properties of motor units in a heterogeneous pale muscle (m. gastrocnemius) of the cat. J. Neurophysiol. 1965, 28, 85–99. [Google Scholar] [CrossRef] [PubMed]
  67. Henneman, E.; Mendell, L.M. Functional organization of the motoneurone pool and its inputs. In Handbook of Physiology. Sect. I. Vol. II. The Nervous System: Motor Control Part I; Brooks, V.B., Ed.; American Physiology Society: Washington, DC, USA, 1981. [Google Scholar]
  68. Bawa, P.; Binder, M.D.; Ruenzel, P.; Henneman, E. Recruitment order of motoneurons in stretch reflexes is highly correlated with their axonal conduction velocity. J. Neurophysiol. 1984, 52, 410–420. [Google Scholar] [CrossRef] [PubMed]
  69. Henneman, E.; Clamann, H.P.; Gillies, J.D.; Skinner, R.D. Rank order of motoneurons within a pool: Law of combination. J. Neurophysiol. 1974, 37, 1338–1349. [Google Scholar] [CrossRef] [PubMed]
  70. Milner-Brown, H.S.; Stein, R.B.; Yemm, R. The orderly recruitment of human motor units during linearly changing during voluntary isometric contractions. J. Physiol. 1993, 230, 359–370. [Google Scholar] [CrossRef] [PubMed]
  71. Dengler, R.; Stein, R.B.; Thomas, C.K. Axonal conduction velocity and force of single human motor units. Muscle Nerve 1988, 11, 136–145. [Google Scholar] [CrossRef] [PubMed]
  72. Gordon, T.; Tyreman, N.; Rafuse, V.F.; Munson, J.B. Limited plasticity of adult motor units conserves recruitment order and rate coding. Prog. Brain Res. 1999, 123, 191–202. [Google Scholar] [PubMed]
  73. Jami, L.; Petit, J. Correlation between axonal conduction velocity and tetanic tension of motor units in four muscles of the cat hind limb. Brain Res. 1975, 96, 114–118. [Google Scholar] [CrossRef] [PubMed]
  74. Gordon, T.; Stein, R.B. Time course and extent of recovery in reinnervated motor units of cat triceps surae muscles. J. Physiol. 1982, 323, 307–323. [Google Scholar] [CrossRef] [PubMed]
  75. Gordon, T.; Stein, R.B. Reorganization of motor-unit properties in reinnervated muscles of the cat. J. Neurophysiol. 1982, 48, 1175–1190. [Google Scholar] [CrossRef] [PubMed]
  76. Zengel, J.E.; Reid, S.R.; Sypert, G.W.; Munson, J.B. Membrane electrical properties and prediction of motor-unit type of medial gastrocnemius motoneurons in the cat. J. Neurophysiol. 1985, 53, 1323–1344. [Google Scholar] [CrossRef] [PubMed]
  77. Fleshman, J.W.; Munson, J.B.; Sypert, G.W.; Friedman, W.A. Rheobase, input resistance, and motor unit type in medial gastrocnemius motoneurons in the cat. J. Neurophysiol. 1981, 46, 1326–1338. [Google Scholar] [CrossRef] [PubMed]
  78. Tőtősy de Zepetnek, J.F.; Zung, H.V.; Erdebil, S.; Gordon, T. Innervation ratio is an important determinant of force in normal and reinnervated rat tibialis anterior muscles. J. Neurophysiol. 1992, 67, 1385–1403. [Google Scholar] [CrossRef] [PubMed]
  79. Cooper, E.; Eccles, J.C. The isometric responses of mammalian muscles. J. Physiol. 1930, 69, 377–385. [Google Scholar] [CrossRef] [PubMed]
  80. Kernell, D.; Eerbeek, O.; Verhey, B.A. Relation between isometric force and stimulus rate in cat’s hindlimb motor units of different twitch contraction time. Exp. Brain Res. 1983, 50, 220–227. [Google Scholar] [CrossRef] [PubMed]
  81. Kernell, D. The limits of firing frequency in cat lumbosacral motoneurones possessing different time course of afterhyperpolarization. Acta Physiol. Scand. 1965, 65, 87–100. [Google Scholar] [CrossRef]
  82. Eccles, J.C.; Eccles, R.M.; Lundberg, A. The action potentials of the alpha motoneurones supplying fast and slow muscles. J. Physiol. 1958, 142, 275–291. [Google Scholar] [CrossRef] [PubMed]
  83. Gardiner, P.F.; Kernell, D. The ‘fastness’ of rat motoneurones: Time course of afterhyperpolarization in relation to axonal conduction velocity and muscle contractile speed. Pflug. Arch. 1990, 415, 762–766. [Google Scholar] [CrossRef] [PubMed]
  84. Hammarberg, C.; Kellerth, J.-O. Studies of some twitch and fatigue properties of different motor unit types in the ankle muscles of the adult cat. Acta Physiol. Scand. 1975, 95, 231–242. [Google Scholar] [CrossRef] [PubMed]
  85. Bakels, R.; Kernell, D. Matching between motoneurone and muscle unit properties in rat medial gastrocnemius. J. Physiol. 1993, 463, 307–324. [Google Scholar] [CrossRef] [PubMed]
  86. Bakels, R.; Kernell, D. Average but not continuous speed match between motoneurons and muscle units of rat tibialis anterior. J. Neurophysiol. 1993, 70, 1300–1306. [Google Scholar] [CrossRef] [PubMed]
  87. Bellemare, F.; Woods, J.J.; Johansson, R.; Bigland-Ritchie, B. Motor-unit discharge rates in maximal voluntary contractions of three human muscles. J. Neurophysiol. 1983, 50, 1380–1392. [Google Scholar] [CrossRef] [PubMed]
  88. Dalton, B.H.; Harwood, B.; Davidson, A.W.; Rice, C.L. Triceps surae contractile properties and firing rates in the soleus of young and old men. J. Appl. Physiol. 2009, 107, 1781–1788. [Google Scholar] [CrossRef] [PubMed]
  89. Graham, M.T.; Rice, C.L.; Dalton, B.H. MU firing rates of the gastrocnemii during maximal brief steady-state contractions in humans. J. Electromyogr. Kinesiol. 2016, 26, 82–87. [Google Scholar] [CrossRef] [PubMed]
  90. Kirk, E.A.; Copithorne, D.B.; Dalton, B.H.; Rice, C.L. MU firing rates of the gastrocnemii during maximal and sub-maximal isometric contractions in young and old men. Neuroscience 2016, 330, 376–385. [Google Scholar] [CrossRef] [PubMed]
  91. Bigland-Richie, B.; Johansson, R.; Lippold, O.C.J.; Woods, J.J. Contraction speed and EMG changes during fatigue of sustained maximal voluntary contractions. J. Neurophysiol. 1983, 50, 313–324. [Google Scholar] [CrossRef] [PubMed]
  92. Hali, K.; Kirk, E.A.; Rice, C.L. Effect of knee joint position on triceps surae motor unit recruitment and firing rates. Exp. Brain Res. 2019, 237, 2345–2352. [Google Scholar] [CrossRef] [PubMed]
  93. Hali, K.; Dalton, B.H.; Harwood, B.; Fessler, A.F.; Power, G.A.; Rice, C.L. Differential modulation of motor unit properties from the separate components of the triceps surae in humans. Neuroscience 2020, 428, 192–198. [Google Scholar] [CrossRef] [PubMed]
  94. Kernell, D. Principles of force gradation in skeletal muscles. Neural Plast. 2003, 10, 69–76. [Google Scholar] [CrossRef] [PubMed]
  95. Enoka, R.M.; Duchateau, J. Rate coding and the control of muscle force. Cold Spring Harb. Perspect. Med. 2017, 7, a029702. [Google Scholar] [CrossRef] [PubMed]
  96. Kernell, D.; Sjoholm, H. Recruitment and firing rate modulation of motor unit tension in a small muscle of the cat’s foot. Brain Res. 1975, 98, 57–72. [Google Scholar] [CrossRef] [PubMed]
  97. Granit, R. Neuromuscular interaction in postural tone of the cat’s isometric soleus muscle. J. Physiol. 1958, 143, 387–402. [Google Scholar] [CrossRef] [PubMed]
  98. Grillner, S.; Udo, M. Recruitment in the tonic stretch reflex. Acta Physiol. Scand. 1971, 81, 571–573. [Google Scholar] [CrossRef] [PubMed]
  99. Heroux, M.E.; Dakin, C.J.; Luu, B.L.; Iglis, J.T.; Blouin, J.S. Absence of lateral gastrocnemius activity and differential MU behavior in soleus and medial gastrocnemius during standing balance. J. Appl. Physiol. 2014, 116, 140–148. [Google Scholar] [CrossRef] [PubMed]
  100. Oya, T.; Riek, S.; Cresswell, A.G. Recruitment and rate coding organisation for soleus MUs across entire range of voluntary isometric plantar flexions. J. Physiol. 2009, 587, 4737–4748. [Google Scholar] [CrossRef] [PubMed]
  101. Rafuse, V.F.; Gordon, T.; Orozco, R. Proportional enlargement of motor units after partial denervation of cat triceps surae muscles. J. Neurophysiol. 1992, 68, 1261–1276. [Google Scholar] [CrossRef] [PubMed]
  102. Gillespie, M.J.; Gordon, T.; Murphy, P.R. Reinnervation of the lateral gastrocnemius and soleus muscles in the rat by their common nerve. J. Physiol. 1986, 372, 485–500. [Google Scholar] [CrossRef] [PubMed]
  103. Gordon, T.; Stein, R.B.; Thomas, C.K. Organization of motor units following cross-reinnervation of antagonistic muscles in the cat hindlimb. J. Physiol. 1986, 374, 442–456. [Google Scholar] [CrossRef] [PubMed]
  104. Rafuse, V.F.; Gordon, T. Incomplete rematching of nerve and muscle properties in motor units after extensive nerve injuries in cat hindlimb muscle. J. Physiol. 1998, 509, 909–926. [Google Scholar] [CrossRef] [PubMed]
  105. Milner-Brown, H.S.; Stein, R.B.; Lee, R.G. Pattern of recruiting human motor units in neuropathies and motorneuron disease. J. Neurol. Neurosurg. Psychiatry 1974, 37, 665–669. [Google Scholar] [CrossRef] [PubMed]
  106. Thomas, C.K.; Stein, R.B.; Gordon, T.; Lee, R.G.; Elleker, M.G. Patterns of reinnervation and motor unit recruitment in human hand muscles after complete ulnar and median nerve section and resuture. J. Neurol. Neurosurg. Psychiatry 1987, 54, 259–268. [Google Scholar] [CrossRef] [PubMed]
  107. Gordon, T.; Stein, R.B.; Thomas, C.K. Innervation and function of hind-limb muscles in the cat after cross-union of the tibial and peroneal nerves. J. Physiol. 1986, 374, 429–441. [Google Scholar] [CrossRef] [PubMed]
  108. Tam, S.L.; Gordon, T. Mechanisms controlling axonal sprouting at the neuromuscular junction. J. Neurocytol. 2003, 32, 961–974. [Google Scholar] [CrossRef] [PubMed]
  109. Gordon, T.; Hegedus, J.; Tam, S.L. Adaptive and maladaptive motor axonal sprouting in aging and motoneuron disease. Invited review. Neurol. Res. 2004, 26, 174–185. [Google Scholar] [CrossRef] [PubMed]
  110. Tam, S.L.; Gordon, T. Axonal sprouting in health and disease. In Encyclopedia of Neuroscience; Springer: Berlin/Heidelberg, Germany, 2011; Part 1; pp. 322–328. [Google Scholar]
  111. Kugelberg, E.; Edström, L.; Abbruzzese, M. Mapping of motor units in experimentally reinnervated rat muscle. Interpretation of histochemical and atrophic fibre patterns in neurogenic lesions. J. Neurol. Neurosurg. Psychiatry 1970, 33, 319–329. [Google Scholar] [CrossRef] [PubMed]
  112. Karpati, G.; Engel, W.K. “Type-grouping” in skeletal muscles after experimental reinnervation. Neurology 1988, 18, 447–455. [Google Scholar] [CrossRef] [PubMed]
  113. Grimby, G.; Broberg, C.; Krotkiewska, I.; Krotkiewski, M. Muscle fiber composition in patients with traumatic cord lesion. Scand. J. Rehabil. Med. 1976, 8, 37–42. [Google Scholar] [PubMed]
  114. Rafuse, V.F.; Gordon, T. Self-reinnervated cat medial gastrocnemius muscles. II. analysis of the mechanisms and significance of fiber type grouping in reinnervated muscles. J. Neurophysiol. 1996, 75, 282–297. [Google Scholar] [CrossRef] [PubMed]
  115. Stein, R.B.; Gordon, T.; Jefferson, J.; Sharfenberger, A.; Yang, J.; Tőtősy de Zepetnek, J.; Belanger, M. Optimal stimulation of paralysed muscle in spinal cord patients. J. Appl. Physiol. 1992, 72, 1393–1400. [Google Scholar] [CrossRef] [PubMed]
  116. Eldridge, L. Lumbosacral spinal isolation in cat: Surgical preparation and health maintenance. Exp. Neurol. 1984, 83, 318–327. [Google Scholar] [CrossRef] [PubMed]
  117. Shields, R.K. Fatigability, relaxation properties, and electromyographic responses of the human paralyzed soleus muscle. J. Neurophysiol. 1995, 173, 2195–2206. [Google Scholar] [CrossRef] [PubMed]
  118. Shields, R.K.; Chang, Y.J.; Ross, M. Neuromuscular propagation after fatiguing contractions of the paralyzed soleus muscle in humans. Muscle Nerve 1998, 21, 776–787. [Google Scholar] [CrossRef]
  119. Kralj, A.R.; Bajd, T. Functional Electrical Stimulation: Standing and Walking; CRC Press: Boca Raton, FL, USA, 1989. [Google Scholar]
  120. Gerrits, H.L.; De Haan, A.; Hopman, M.T.; van Der Woude, L.J.; Jones, D.A.; Sargeant, A.J. Contractile properties of the quadriceps in individuals with spinal cord injury. Muscle Nerve 1999, 22, 1249–1256. [Google Scholar] [CrossRef]
  121. Alaimo, M.A.; Smith, J.L.; Roy, R.R.; Edgerton, V.R. EMG activity of slow and fast ankle extensors following spinal cord transection. J. Appl. Physiol. 1984, 56, 1608–1613. [Google Scholar] [CrossRef] [PubMed]
  122. Burnham, R.; Martin, T.; Stein, R.; Bell, G.; MacLean, I.; Steadward, R. Skeletal muscle fibre type transformation following spinal cord injury. Spinal Cord 1997, 35, 86–91. [Google Scholar] [CrossRef] [PubMed]
  123. Round, J.M.; Barr, F.M.; Moffat, B.; Jones, D.A. Fibre areas and histochemical fibre types in the quadriceps muscle of paraplegic subjects. J. Neurol. Sci. 1993, 116, 207–211. [Google Scholar] [CrossRef] [PubMed]
  124. Talmadge, R.J. Myosin heavy chain isoform expression following reduced neuromuscular activity: Potential regulatory mechanisms. Muscle Nerve 2000, 23, 661–679. [Google Scholar] [CrossRef]
  125. Castro, M.J.; Apple, D.F., Jr.; Staron, R.S.; Gerson, E.R.; Campos, G.E.; Dudley, G.A. Influence of complete spinal cord injury on skeletal muscle within 6 mo of injury. J. Appl. Physiol. 1999, 86, 350–358. [Google Scholar] [CrossRef] [PubMed]
  126. Scelsi, R.; Marchetti, C.; Poggi, P.; Lotta, S.; Lommi, G. Muscle fiber type morphology and distribution in paraplegic patient with traumatic cord lesion. Acta Neuropathol. 1982, 57, 243–248. [Google Scholar] [CrossRef] [PubMed]
  127. Castro, M.J.; Apple, D.F., Jr.; Hillegass, E.A.; Dudley, G.A. Influence of complete spinal cord injury on skeletal muscle cross-sectional area within the first 6 months of injury. Eur. J. Appl. Physiol. 1999, 80, 373–378. [Google Scholar] [CrossRef] [PubMed]
  128. Thomas, C.K.; Zaidner, E.Y.; Calancie, B.; Broton, J.G.; Bigland-Richie, B.R. Muscle weakness, paralysis, and atrophy after human cervical spinal cord injury. Exp. Neurol. 1997, 148, 414–423. [Google Scholar] [CrossRef] [PubMed]
  129. Burke, R.E.; Rymer, W.Z. Relative strength of synaptic input from short-latency pathways to motor units of defined type in cat medial gastrocnemius. J. Neurophysiol. 1976, 39, 447–458. [Google Scholar] [CrossRef] [PubMed]
  130. Sciaffiino, S.; Reggiani, C. Fiber types in mammalian skeletal muscles. Physiol. Rev. 2011, 9, 1447–1531. [Google Scholar] [CrossRef] [PubMed]
  131. Esmarck, B.; Andersen, J.L.; Olsen, S.; Richter, E.A.; Mizuno, M.; Kjaer, M. Timing of postexercise protein intake is important for muscle hypertrophy with resistance training in elderly humans. J. Physiol. 2001, 535, 301–311. [Google Scholar] [CrossRef] [PubMed]
  132. Flewwelling, L.D.; Hannaian, S.J.; Cao, V.; Chaillou, T.; Churchward-Venne, T.A.; Cheng, A.J. What are the potential mechanisms of fatigue-induced skeletal muscle hypertrophy with low-load resistance exercise training? Am. J. Physiol. Cell Physiol. 2025, 328, C1001–C1014. [Google Scholar] [CrossRef] [PubMed]
  133. Quisar, R.; Bhaskaran, S.; Van Remmen, H. Muscle fiber type diversification during exercise and regeneration. Free Radic. Biol. Med. 2016, 98, 56–67. [Google Scholar] [CrossRef] [PubMed]
  134. Rampinini, E.; Coutts, A.J.; Castagna, C.; Sassi, R.; Impellizzeri, F.M. Variation in top level soccer match performance. Int. J. Sports Med. 2007, 28, 1018–1024. [Google Scholar] [CrossRef] [PubMed]
  135. Metaxas, T.; Mandroukas, A.; Michailidis, Y.; Koutlianos, N.; Christoulas, K.; Ekblom, B. Correlation of fiber-type composition and sprint performance in youth soccer players. J. Strength Cond. Res. 2019, 33, 2629–2634. [Google Scholar] [CrossRef] [PubMed]
  136. Hopwood, H.J.; Bellinger, P.M.; Compton, H.R.; Bourne, M.N.; Minahan, C. The Relevance of Muscle Fiber Type to Physical Characteristics and Performance in Team-Sport Athletes. Int. J. Sports Physiol. Perform. 2023, 18, 223–230. [Google Scholar] [CrossRef] [PubMed]
  137. Zhen, Y.; Okutsu, M.; Vitor, Y.N.; Lira, V.A. Regulation of exercise-induced fiber type transformation, mitochondrial biogenesis, and angiogenesis in skeletal muscle. J. Appl. Physiol. 1985, 110, 264–274. [Google Scholar]
  138. Hood, D.A. Mechanisms of exercise-induced mitochondrial biogenesis in skeletal muscle. Appl. Physiol. Nutr. Metab. 2009, 34, 465–472. [Google Scholar] [CrossRef] [PubMed]
  139. Ljubicic, V.; Joseph, A.-M.; Saleem, A.; Uguccioni, G.; Collu-Marchese, M.; Lai, R.Y.J.; Nguyen, L.M.-D.; Hood, D.A. Transcriptional and post-transcriptional regulation of mitochondrial biogenesis in skeletal muscle: Effects of exercise and aging. Biochem. Biophys. Acta 2010, 1800, 223–234. [Google Scholar] [CrossRef] [PubMed]
  140. Tamaki, N. Effect of endurance training on muscle fiber type composition and capillary supply in rat diaphragm. Eur. J. Appl. Physiol. Occup. Physiol. 1987, 56, 127–131. [Google Scholar] [CrossRef] [PubMed]
  141. Lewis, M.I.; Fournier, H.; Wang, H.; Storor, R.; Casaburi, R.; Kopple, J.D. Effect of endurance and/or strength training on muscle fiber size, oxidative capacity, and capillarity in hemodialysis patients. J. Appl. Physiol. 2015, 119, 865–871. [Google Scholar] [CrossRef] [PubMed]
  142. Hikida, R.S.; Staron, R.S.; Hagerman, F.C.; Walsh, S.; Kaiser, E.; Shell, S.; Hervey, S. Effects of high-intensity resistance training on untrained older men. II. Muscle fiber characteristics and nucleo-cytoplasmic relationships. J. Gerontol. 2000, 55, B347–B354. [Google Scholar]
  143. Revero, J.L.; Talmadge, R.J.; Edgerton, V.R. Fibre size and metabolic properties of myosin heavy chain-based fibre types in rat skeletal muscle. J. Muscle Res. Cell Motil. 1998, 19, 733–742. [Google Scholar] [CrossRef] [PubMed]
  144. Medler, S. Comparative trends in shortening velocity and force production in skeletal muscles. Am. J. Physiol. Regul. Integr. Comp. Physiol. 2002, 283, R368–R378. [Google Scholar] [CrossRef] [PubMed]
  145. Paul, A.C.; Rosenthal, N. Different modes of hypertrophy in skeletal muscle fibers. J. Cell Biol. 2002, 156, 751–760. [Google Scholar] [CrossRef] [PubMed]
  146. West, D.W.; Burd, N.A.; Staples, A.W.; Phillips, S.M. Human exercise-mediated skeletal muscle hypertrophy is an intrinsic process. Int. J. Biochem. Cell Biol. 2010, 42, 1371–1375. [Google Scholar] [CrossRef] [PubMed]
  147. Fank, F.; Perieira, F.d.S.; Santos, L.D.; Tŭlio de Mello, M.; Mazo, G.Z. Effects of Exercise on Sleep in Older Adults: An Overview of Systematic Reviews and Meta-Analyses. J. Aging Phys. Act. 2022, 30, 1101–1117. [Google Scholar] [CrossRef] [PubMed]
  148. Lieber, R.L. Skeletal Muscle Structure, Function, and Plasticity: The Physiological Basis of Rehabilitation; Lippincott Williams & Wilkins: Philadelphia, PA, USA, 2009. [Google Scholar]
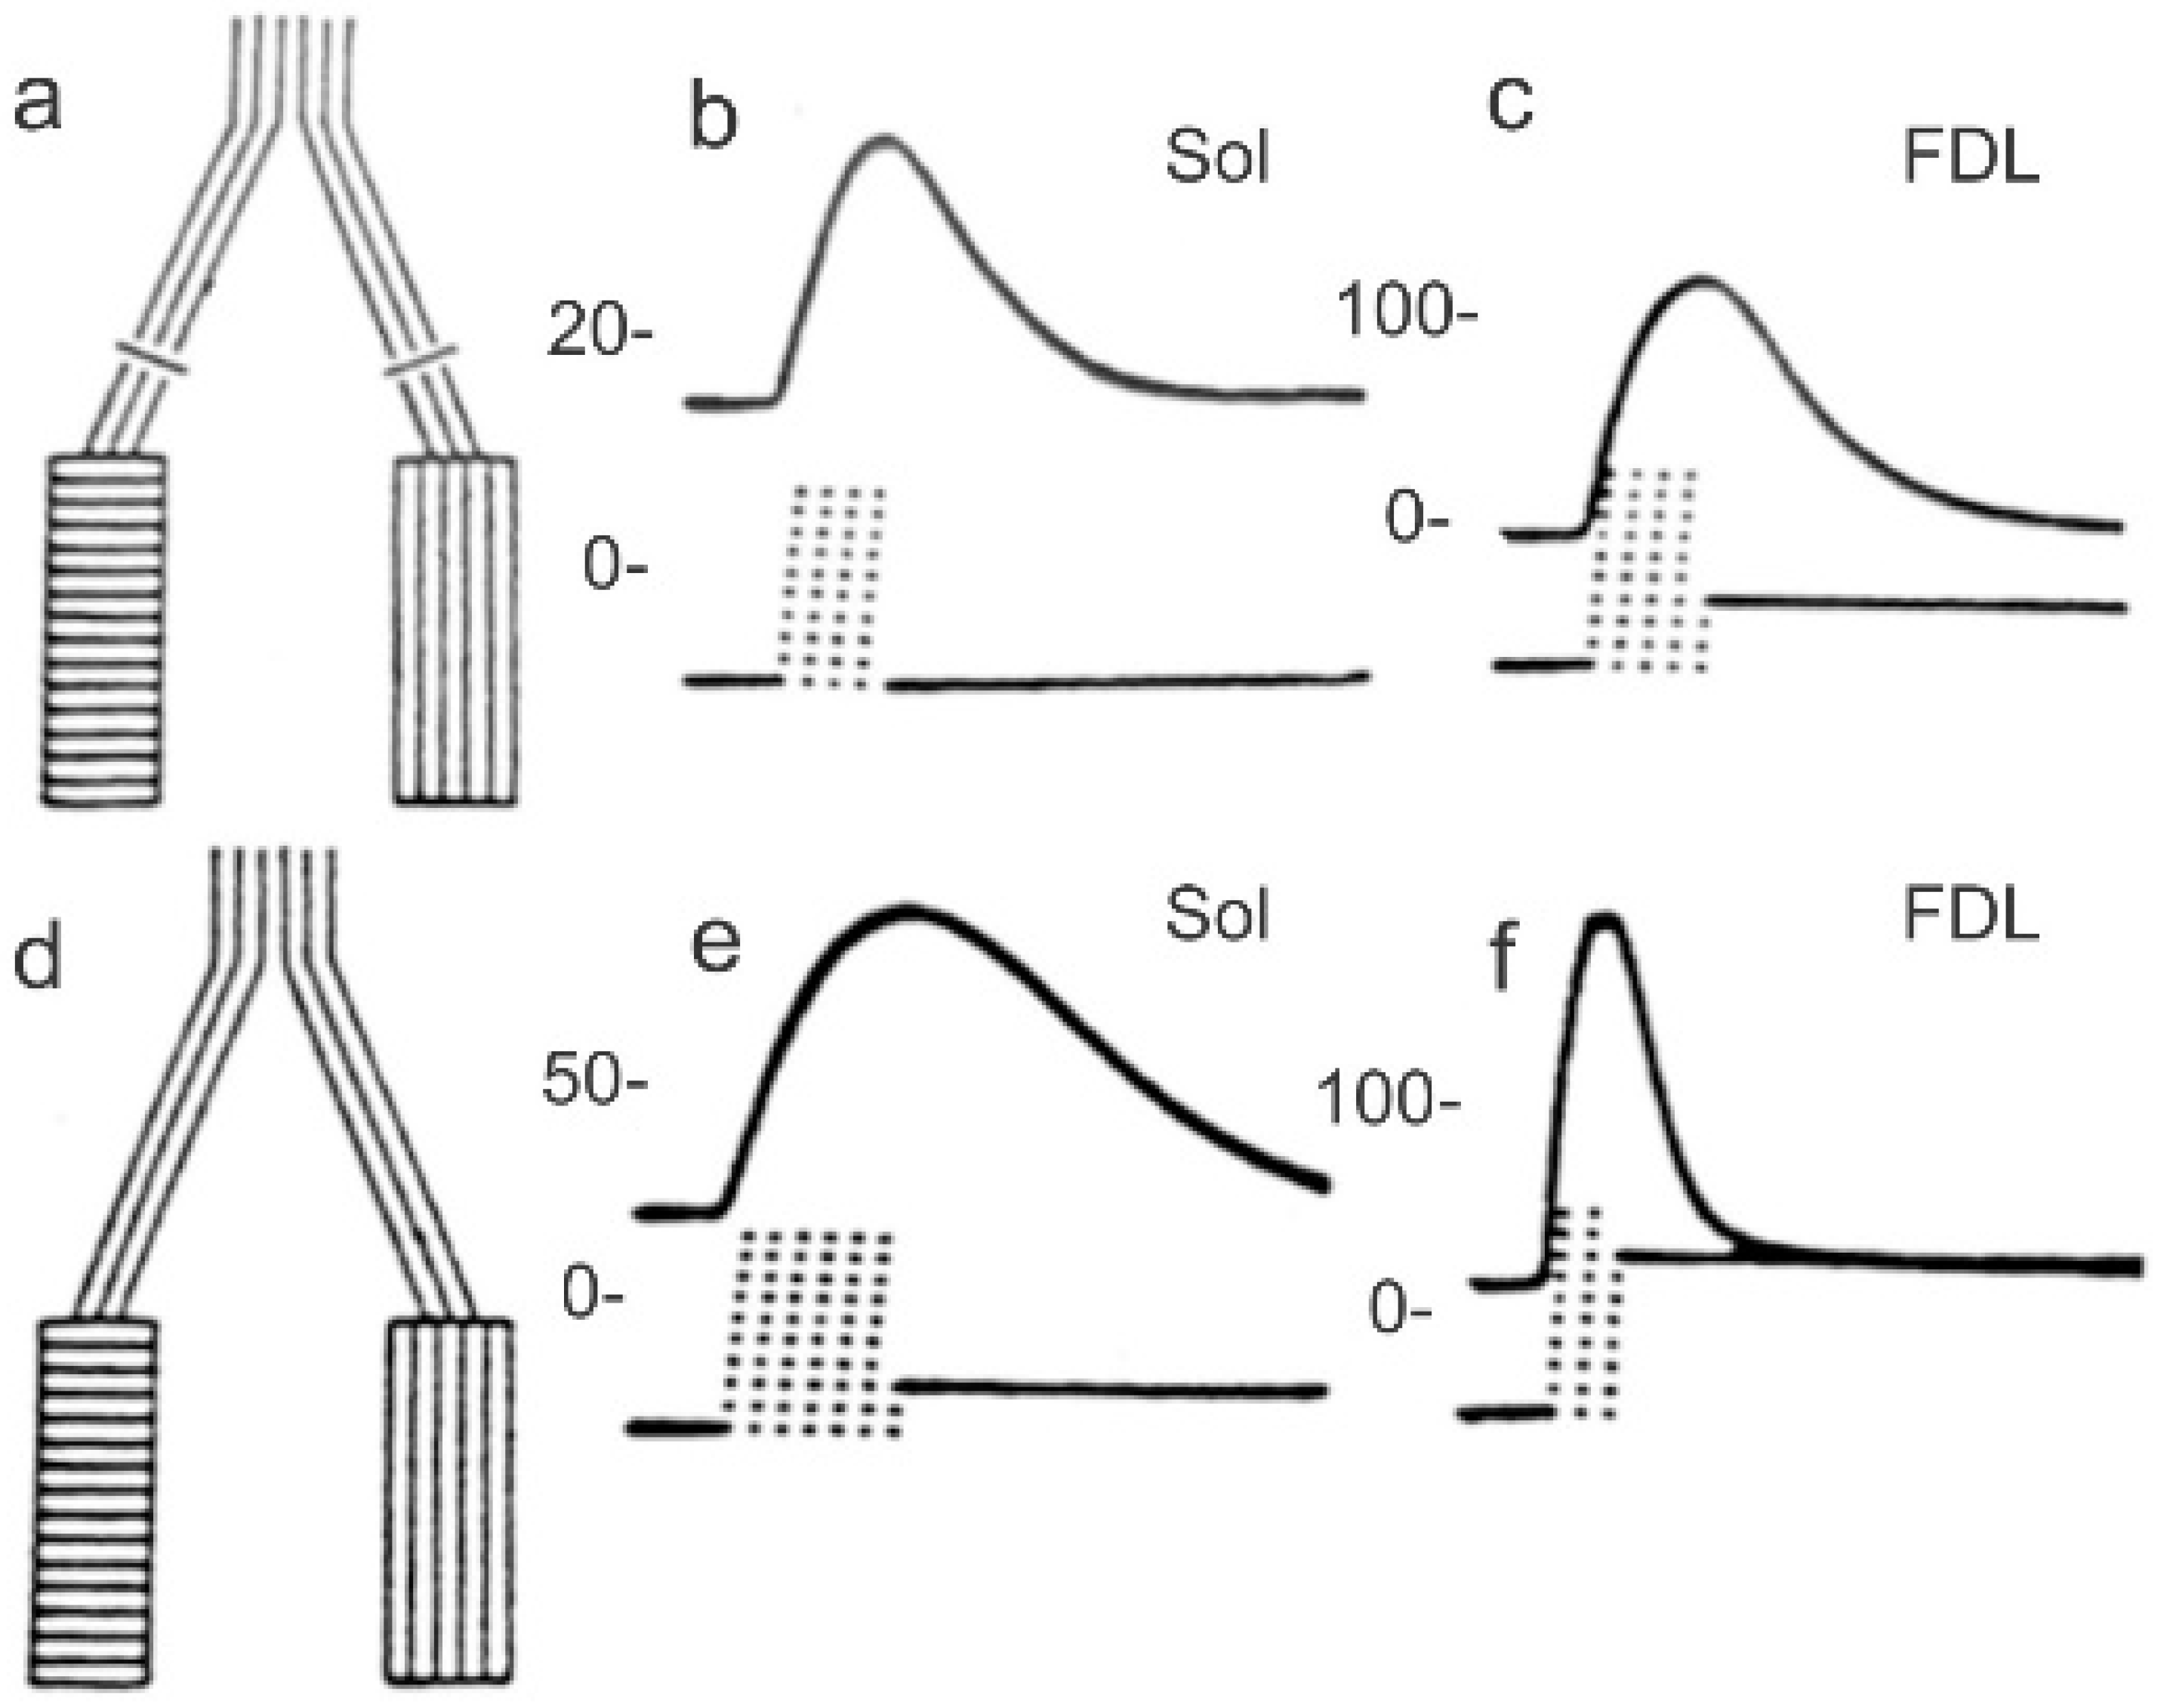
Figure 1. Cross-reinnervation of slow- and fast-muscles increases and decreases their twitch contraction times, respectively. (a) Figurative representation of the surgical cross-suture of the nerves to slow and fast muscles. Twitch contractions of cross-reinnervated (b) slow-twitch soleus (SOL) and (c) fast-twitch flexor digitorum longus (FDL) muscles. (d) Figurative representation of the normal innervation of fast and slow muscles. Twitch contractions of normally innervated (e) SOL and (f) FDL muscles. The scales of contractile force are in grams, and each dot below the twitch contractions represents 1 ms. Adapted with permission from [40]. Copyright 1960 The Physiological Society.
Ijms 26 06891 g001
Figure 2. Fast–slow conversions of rabbit and cat fast-twitch muscles by (A) the pattern of low-frequency (20 Hz) continuous activity of slow motoneurons and (B) the amount of daily activity, regardless of the frequency of the activity. The muscle twitch contractions are shown for (A) control and stimulated tibialis anterior muscles and (B) control and stimulated PerL muscles. (The markers below the twitch contractions in (B) represent 10 msec intervals). Adapted with permission from [26,47], respectively.
Ijms 26 06891 g002
Figure 3. Chronic low-frequency electrical stimulation (CLFS) converts fast myosin heavy chains to slow. Electrophoretic separation of MHC isoforms from rat tibialis anterior (TA) muscles after 10 weeks of CLFS (2 h/day of 15 Hz at tolerable stimulation levels, for 2 s on and 4 s off). Adapted with permission from [19]. Copyright 2000 Wiley-Liss, Inc.
Ijms 26 06891 g003
Figure 4. The contraction speed and fatigability of hindlimb muscle increase with the daily amount of neuromuscular activity. The fatigue index (FI) as a percent of maximum, the maximum being “no fatigue”, is plotted as a function of the twitch contraction time (CT). The data was obtained in different paralyzed cats in whom the daily amount of electrical stimulation (ES) of the peroneal longus (PerL) muscle was <0.05%, ~5% and 50% of each day for 4 to 8 weeks. The muscles stimulated for 4 weeks are represented by plus signs, stars, open circles and open squares and those stimulated for 8 weeks by open triangles and diamonds. The dashed lines surround the muscles that were subjected to 0%, 0.5%, ~5%, and 50% amounts of ES. Graph drawn from data from [28,29].
Ijms 26 06891 g004
Figure 5. Size-dependent matching of the electrical and contractile properties of motoneurons and their muscle units, respectively. Correlations of (A) the ratio of rheobase current (Rh) to input resistance (Rin) of medial gastrocnemius (MG) motor units as a measure of their excitability, and their muscle unit (MusU) tetanic force; (B) half-decay time of the after-hyperpolarization (AHP) of the MN action potential and the time-to-peak force of the MusU twitch contractions (TTP); (C) conduction velocity of the motor nerves to the MG muscle and the tetanic force of the MG MusUs they supply. The inverse correlation of (D) the MusU twitch TTP and tetanic force. The correlation coefficients of all the regression lines were significantly different from zero (p < 0.05). The open and closed circles represent fast and slow MusUs defined by their presence and absence of ‘sag’ of their unfused tetanic contractions. Adapted from [72].
Ijms 26 06891 g005
Figure 6. Normal and reinnervated muscles obey Henneman’s size principle. (A) Chronic recordings of sciatic nerve compound action potentials in response to stimulation of the medial gastrocnemius (MG) nerve, the electromyographic signal (EMG) from MG muscle and, by coupling the foot to a strain gauge, the MG muscle isometric contractile force. (B) Diagrammatic representation of the chronic recording of unitary MG nerve fiber action potentials on triphasic electrode arrays within silastic cuffs that surrounded the MG and sciatic nerves in response to electrical stimulation of one MG nerve fiber at the muscle’s motor point by a fine bipolar needle electrode. (C) The motor unit’s unitary action potentials on (a) MG and (b) sciatic nerves and (c) EMG on bipolar muscle electrodes and (d) muscle force that were evoked in an all-or-none manner by the intramuscular stimulation of one MG nerve. The unitary responses were identified by all-or-none responses. (D) The linear relationship of MG nerve action potentials and MU twitch forces and the inverse relationship between the muscle unit (MusU) contraction time and twitch isometric forces before and months after MG nerve transection and surgical repair. Individual recordings are shown as + symbols and the regression lines were drawn only when the slope of the lines was significantly different from zero at p < 0.01. (E) Diagrammatic representation of acute recording in uninjured control and experimental cats (1–2 years post-surgical MG nerve transection and repair) from MG nerve and muscle in response to stimulation of a single motor nerve in a teased ventral root filament. (F) MG axon potentials and MusU contraction times are plotted as a function of the contractile force of the MusU types of S, FR and FF, identified by different symbols. Regression lines were drawn in the graphs only when the slope of the lines was significantly different from zero at p < 0.01. Adapted from [74,75].
Ijms 26 06891 g006
Figure 7. The number of muscle fibers supplied by each motoneuron, and to a lesser extent, their size, determine their contractile force. The white glycogen-depleted muscle fibers within a muscle unit (MusU) are the fibers innervated by one motoneuron in rat tibialis anterior muscle cross-sections of (A) normally innervated and (C) reinnervated muscles after common peroneal (CP) nerve transection and surgical repair. Camera lucida drawings of the total number and distribution of the MusU fibers of the (B) normally innervated and (D) reinnervated muscles. (E) Numbers of MusUs plotted as histograms and (ad) as a function of motor unit (MU) force. Mean MusU fiber area (e,f) and MusU fiber specific force (g,h) are plotted as a function of MU force in normally innervated and reinnervated TA muscles. The bars (|) on the top of the histograms are the mean values of the percent distributions. The slopes of the regression lines were significantly different from zero (p < 0.05) with the exception of the lines drawn for the plot of fiber-specific forces as a function of MU force. Adapted from [78].
Ijms 26 06891 g007
Figure 8. Matching of the time course of the twitch contraction of fast and slow muscle units in rats’ medial gastrocnemius muscle and the after-hyperpolarizations that follow the action potentials of the motoneurons that innervate them. (a) The isomeric twitch contractions of fast (f) and slow (s) muscle units and (b) the afterhyperpolarizations (AHP) that follow the action potentials of the motoneurons that innervate them. Their amplitudes have been normalized and are shown on a common time scale. Adapted from [85].
Ijms 26 06891 g008
Figure 9. (A) Motor unit types and their orderly recruitment. Diagrammatic representation of type I (slow: S), type II (fast-resistant, FR) and type III (fast-fatigable, FF) motor units labelled on the basis of their physiological and histochemical properties. The pattern of firing of the units is shown and the increasing number of muscle fibers innervated by each motoneuron is represented. The muscle fibers of the type I and type II motor units are shown as filled and unfilled circles. The different sizes of the fibers are represented by the size of the circles. The slow and fast contractions of the S and the F units are shown and, below this, the tetanic contractions elicited at 40 Hz for 2 min, in the fatigue-resistant S and FR and the fatigable FF motor units. (B) Tetanic forces are plotted as a function of the numbers of the S, FR, FI and FF units in the cat medial gastrocnemius muscle, with both the forces and numbers as a percentage of the maximum force and numbers, respectively. The motor units are recruited in order of their size, with the muscle force increasing as a function of their number. See text for details of methods to delineate the different motor unit types according to the criteria of Burke et al. [16].
Ijms 26 06891 g009
Figure 10. Elimination of motor nerve activity in cat hindlimb motoneurons by spinal cord isolation for 8 months increases the size of the nerve fibers. (A) Spinal cord isolation surgery (SCI). (B) Cross-sections of soleus (SOL) nerves 8 months after SCI and from the control nerve in the contralateral hindlimb. Histograms of axon areas of the nerves of (C) control and experimental soleus (SOL, after 8 months SCI) and (D) medial gastrocnemius (MG; 8 months after SCI). (E) Histogram of fiber areas of control and experimental sural nerves, 8 months after SCI. SOL (F) nerve fiber and (G) axon areas and MG (H) nerve fiber and (I) axon areas of control and experimental nerves, plotted as cumulative histograms. The rightward arrows with the asterisk (*) show the significant shift of the cumulative plots to the right to larger values (p < 0.01). (J) Histograms comparing the mean [±standard error (SE)] values of MG nerve fiber diameters and conduction velocities in cats experiencing normal neuromuscular activity, 50% daily electrical stimulation (ES) in a 50% duty cycle, (2.5 s on and 2.5 s off for 5 days/week) and little or no neuromuscular activity after SCI surgery (shown in black, blue and red, respectively). The scale bar in (B) is 50 µm. Adapted from [34].
Ijms 26 06891 g010
Figure 11. Daily nerve electrical stimulation delivered for 5% and 50% of each day elevates muscle and motor unit endurance while maintaining and reducing their conduction velocities and contractile forces, respectively. (A,D) Isometric tetanic force, normalized to the same day of daily electrical stimulation (ES); (B,E) the time-to-peak twitch force and (C,F) the endurance index of the cat medial gastrocnemius (MG) muscle as a function of the days after initiating (AC) daily ES for 50% of each day (50% ES; ○) as compared to controls in which no daily ES was imposed (0% ES ●); (DF) 5% ES (open triangle) of paralyzed MG muscle as compared to the controls in which no daily ES was imposed (0% ES ●). The paralysis was induced by hemisection at the T12–T13 level of the spinal cord and deafferentation by cutting the lumbosacral dorsal roots [35]. Histograms of motor unit (G) Tetanic force. (H) Time-to-peak twitch contraction and (I) endurance index for 5% ES and 50% ES. Mean values are denoted by inverted open triangles for daily 5% ES and by filled triangles for daily 50% ES on each of the histograms. Histograms of conduction velocities of MG nerves with (J) no daily ES (0% ES), (K) after daily 5% ES and (L) after daily 50% ES. Mean values are denoted by the vertical bars (|) on the three histograms with the significant difference in the mean values after 50% ES shown as an asterisk in (L) as compared to the mean values after no ES (0% ES) and 5% ES in (J) and (K), respectively. Adapted from [35].
Ijms 26 06891 g011
Figure 12. Muscle endurance of paralyzed tibialis anterior muscle increases in spinal injured subjects as the amount of daily 20 Hz electrical stimulation increases from 15 min to 2 h per day. (A) One leg was stabilized on a platform that was linked to a strain gauge for weekly recordings of isometric twitch and tetanic forces developed in response to stimulation at the motor point of the tibialis anterior muscle. The effect of progressive increase in the duration of daily ES on mean [±standard error (SE)] values of (B) endurance index, the ratio of force developed after and before 3.5 min of intermittent generation of tetanic contractions. (C) Twitch and tetanic isometric forces and (D) the time course of twitch contractions. Adapted from [115].
Ijms 26 06891 g012
Figure 13. Increasing daily amounts of neuromuscular activity from 0. to 50% by 20 Hz electrical stimulation promotes a progressive slow-to-fast conversion of motor unit properties. (A) Percentages of motor unit (MU) types in the medial gastrocnemius (MG) muscle of cats paralyzed by hemisection and deafferentation (HSDA) either with no electrical stimulation [ES (paralyzed + 0% ES; n = 194], and the tibial nerve electrically stimulated daily with 5% ES: paralyzed + 5% ES; n = 224), or with 50% ES (paralyzed + 50% ES; n = 194). These percentages are compared directly with the percentages of MU types in intact cats (intact + 0% ES; n = 183). (B) Cumulative MU tetanic force as a percentage of maximum, plotted as a function of the percent of MU types in MG muscles, after 0% ES, (C) daily 50% ES and (D) 5% ES for 186, 138 and 198 days, respectively. Adapted from [35]. See text for details.
Ijms 26 06891 g013
Figure 14. Motoneuron and muscle contractile properties are converted in parallel to a slow-type phenotype daily 50% daily neuromuscular activity. (A) Diagrammatic representation of the chronic electrical stimulation of the nerve to the medial gastrocnemius (MG) muscle for 50% of each day in cats. (B) Muscle isometric twitch and tetanic forces 73 days after initiation of chronic 50% ES. The ‘sag’ of unfused tetani elicited by pulse intervals of 1.25× time to peak values before initiating daily 50% ES changed to the ‘no sag’ characteristic of slow-twitch muscles (C) Muscle and motor unit (MU) twitch force, the time-to-peak twitch force (TTP), MU fatigue index and presence or absence of ‘sag’ are plotted as a function of the days of ES. (D) Histograms of MG nerve conduction velocities with mean values denoted by a arrow. (E) MG nerve conduction velocity plotted as a function of days of stimulation. Muscle and motor unit (MU) tetanic forces declined with time of 50% ES as the MU fatigue index increased. (F) The ratio of the rheobase (Rh) current and input resistance plotted as a function of the after-hyperpolarization (AHP) half-decay time. The horizontal dashed line denotes the mean value of Rh/Rin of 3.0 in unoperated MG motoneurons. (G) Histograms of rheobase, AHP, input resistance and CV plotted as a percent of the total. Mean ± standard error (SE) values are shown in the plots in (C,E). Adapted from [31,32].
Ijms 26 06891 g014
Figure 15. The correlation of motoneuron and muscle properties is retained after their fast-to-slow conversion. (A) The correlation of the ratio of rheobase (Rh) and input resistance (Rin) that differentiates slow from fast motoneurons with motor unit tetanic force is maintained after (B) 50% daily stimulation, where all motoneurons and their muscle units were classified as slow.
Ijms 26 06891 g015
Disclaimer/Publisher’s Note: The statements, opinions and data contained in all publications are solely those of the individual author(s) and contributor(s) and not of MDPI and/or the editor(s). MDPI and/or the editor(s) disclaim responsibility for any injury to people or property resulting from any ideas, methods, instructions or products referred to in the content.