Figure 1.
Relative mRNA expression of ENO1 normalized to GAPDH in hepatocyte cultures derived from healthy and ketotic cows after exposure to Zearalenone (ZEN) for (a) 1 h, (b) 3 h, and (c) 6 h. Bars represent the mean relative quantity (RQ) of mRNA expression in control (C; 0 μM ZEN) and treatment groups (10, 20, 50, 100 μM). The expression in untreated control samples (C) was used as the calibrator for each group. Asterisk (*) indicates statistically significant differences between healthy and ketotic cows at the same time point (p < 0.05). Error bars represent standard error of the mean (SEM).
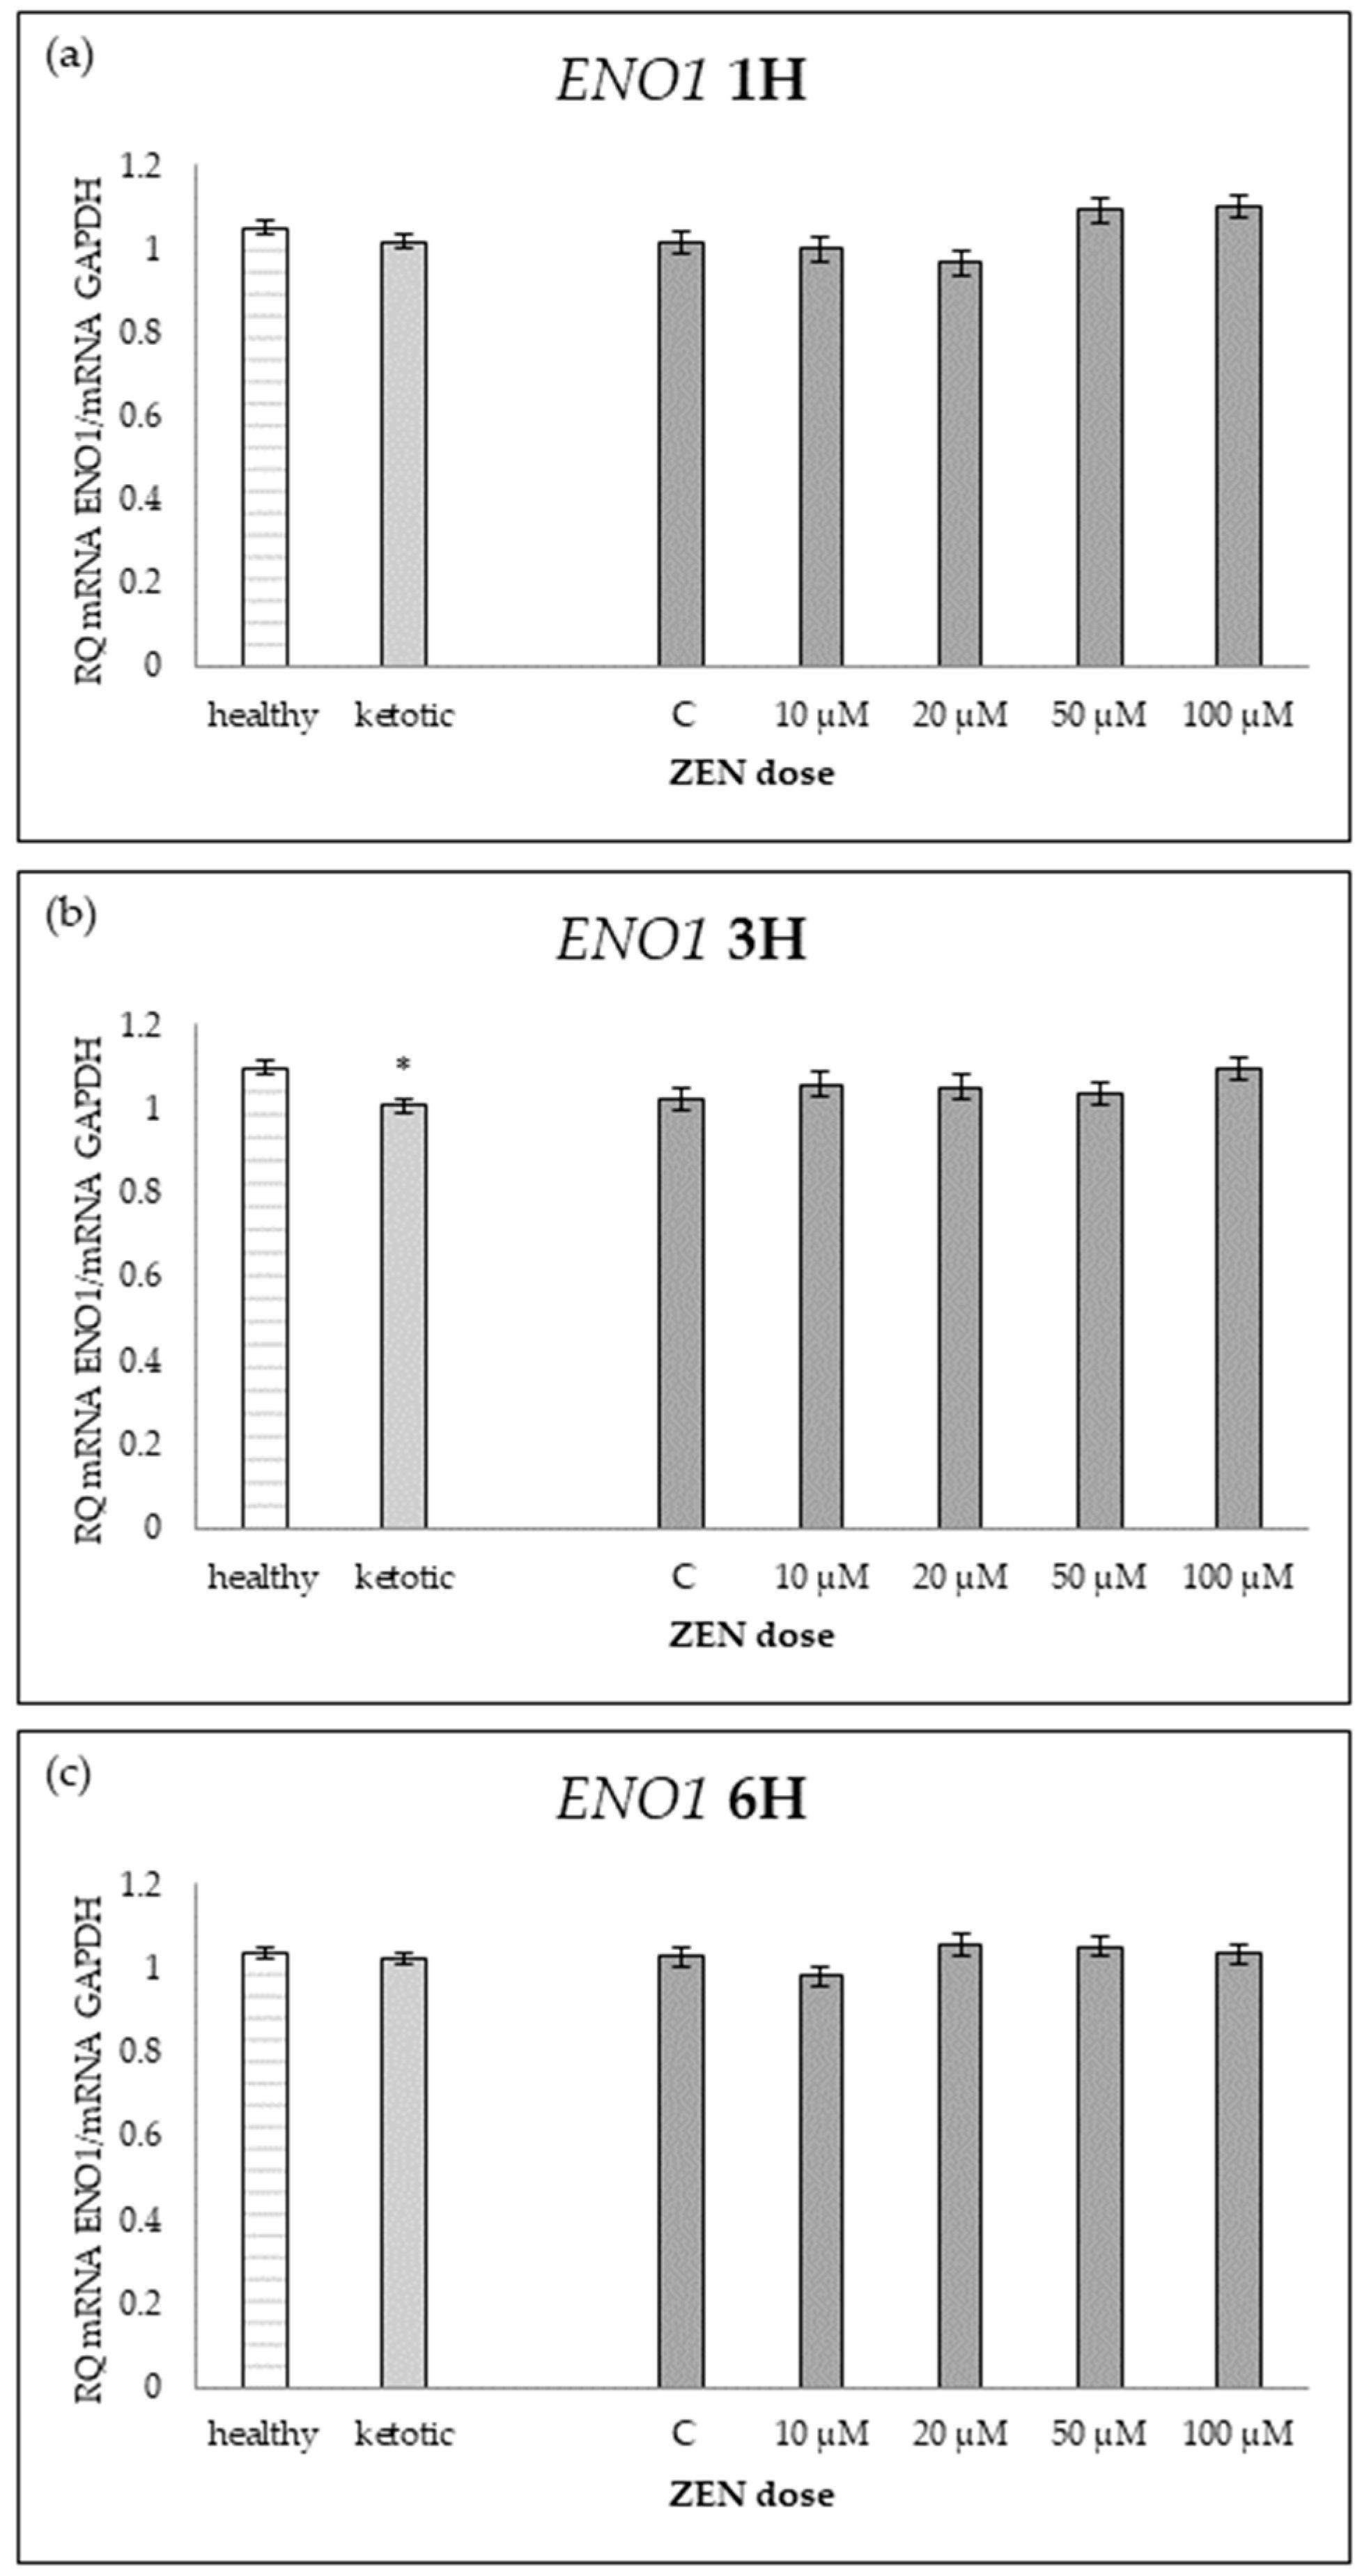
Figure 2.
Relative mRNA expression of PDHB normalized to GAPDH in hepatocyte cultures derived from healthy and ketotic cows after exposure to Zearalenone (ZEN) for (a) 1 h, (b) 3 h, and (c) 6 h. Bars represent the mean relative quantity (RQ) of mRNA expression in control (C; 0 μM ZEN) and treatment groups (10, 20, 50, 100 μM). The expression in untreated control samples (C) was used as the calibrator for each group. Asterisks indicate statistically significant differences compared to the control within the same group: * p < 0.05, ** p < 0.001. Error bars represent the standard error of the mean (SEM).
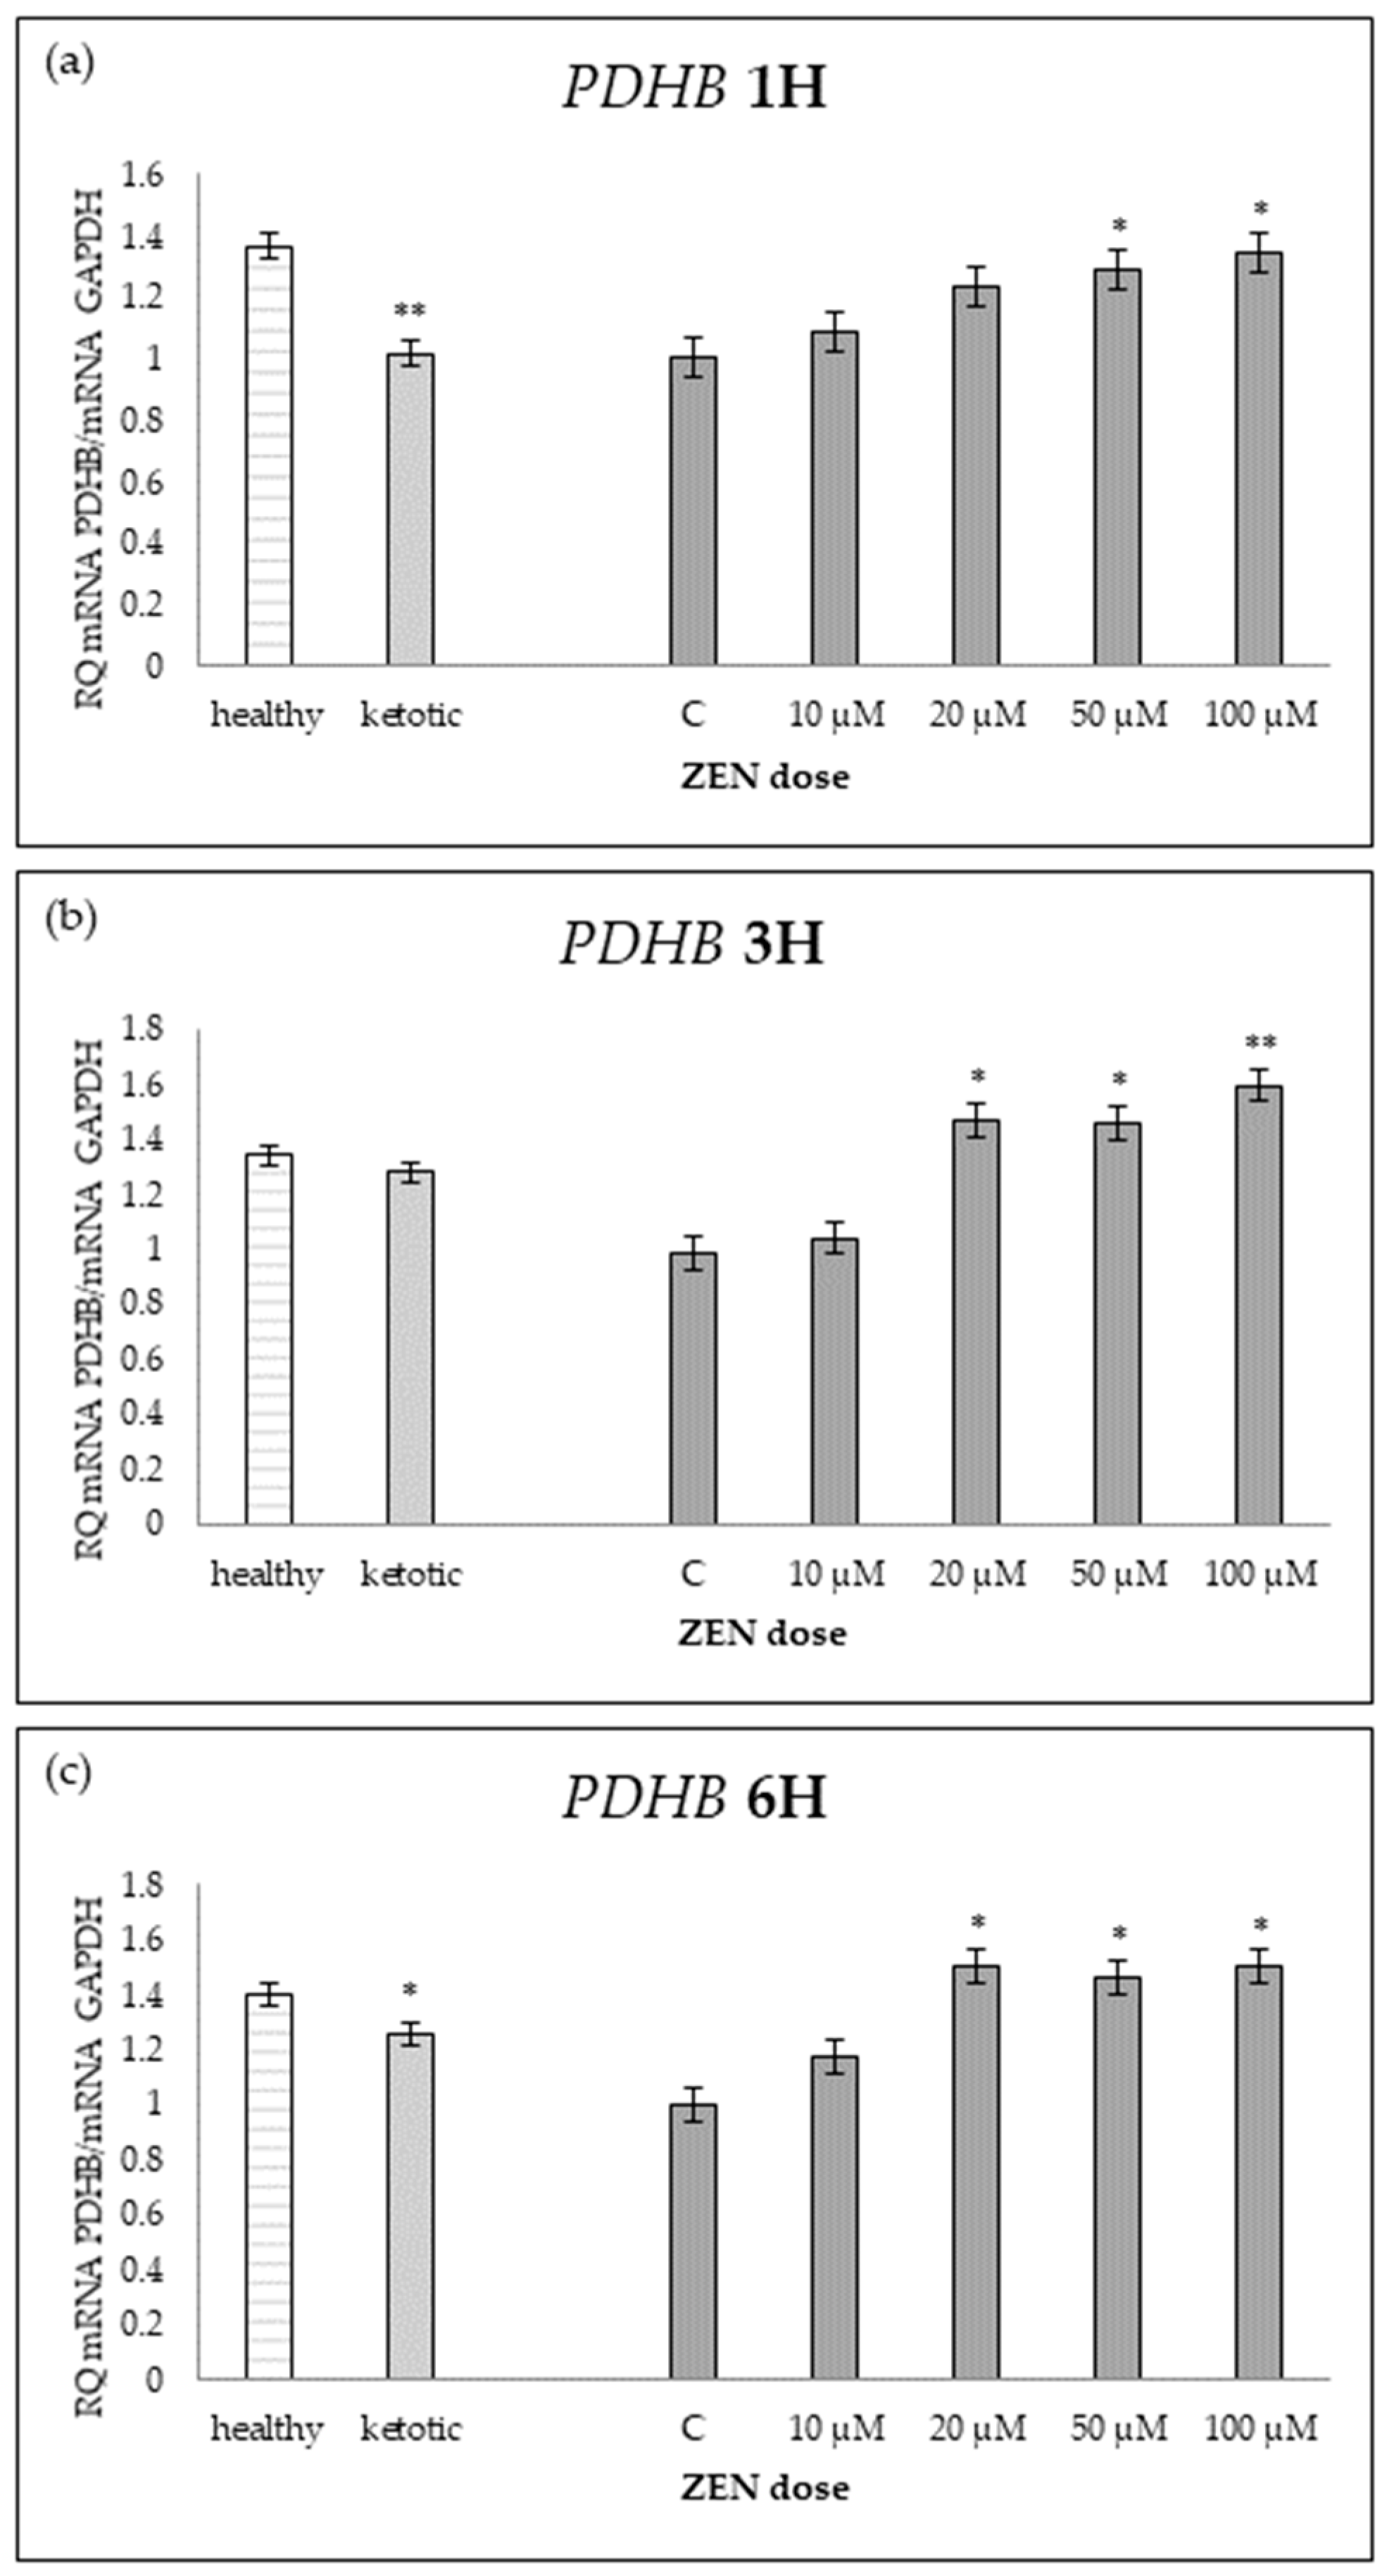
Figure 3.
Relative mRNA expression of PGAM1 normalized to GAPDH in hepatocyte cultures derived from healthy and ketotic cows after exposure to Zearalenone (ZEN) for (a) 1 h, (b) 3 h, and (c) 6 h. Bars represent the mean relative quantity (RQ) of mRNA expression in control (C; 0 μM ZEN) and treatment groups (10, 20, 50, 100 μM). The expression in untreated control samples (C) was used as the calibrator for each group. Asterisks indicate statistically significant differences compared to the control within the same group: * p < 0.05, ** p < 0.001. Error bars represent the standard error of the mean (SEM).
Figure 4.
Relative mRNA expression of PGK1 normalized to GAPDH in hepatocyte cultures derived from healthy and ketotic cows after exposure to Zearalenone (ZEN) for (a) 1 h, (b) 3 h, and (c) 6 h. Bars represent the mean relative quantity (RQ) of mRNA expression in control (C; 0 μM ZEN) and treatment groups (10, 20, 50, 100 μM). The expression in untreated control samples (C) was used as the calibrator for each group. Asterisks indicate statistically significant differences compared to the control within the same group: * p < 0.05, ** p < 0.001. Error bars represent the standard error of the mean (SEM).
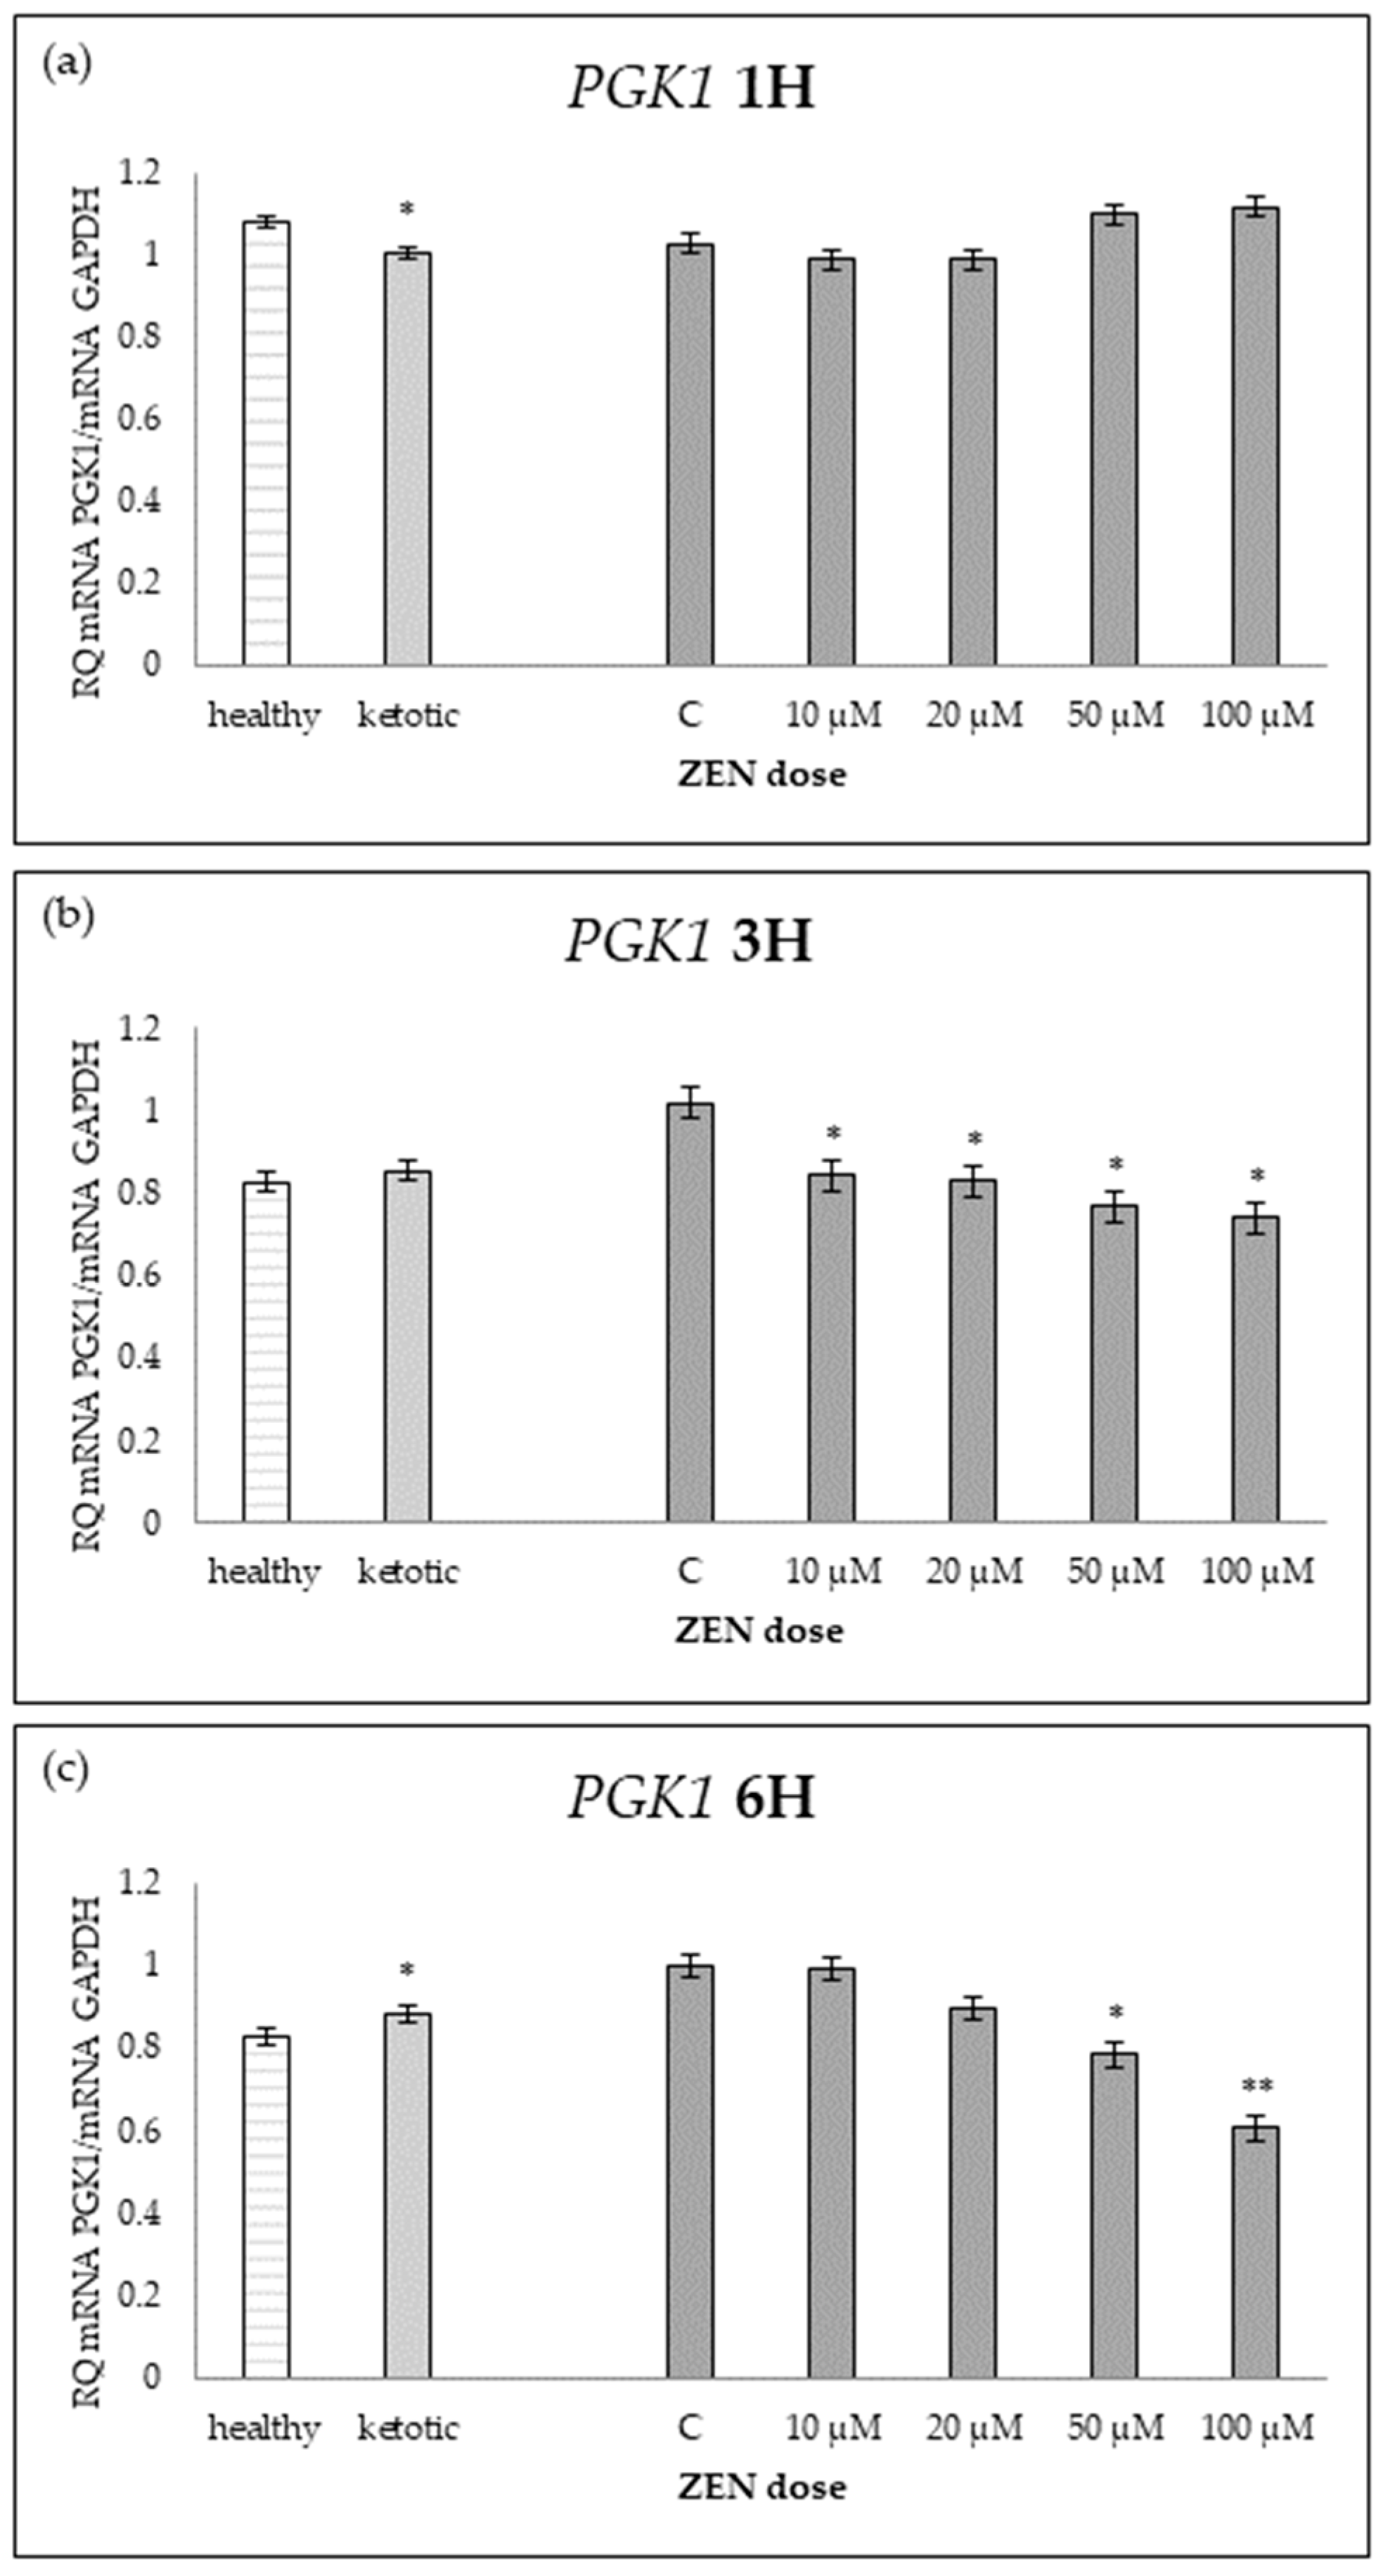
Figure 5.
Relative mRNA expression of TPI1 normalized to GAPDH in hepatocyte cultures derived from healthy and ketotic cows after exposure to zearalenone (ZEN) for (a) 1 h, (b) 3 h, and (c) 6 h. Bars represent the mean relative quantity (RQ) of mRNA expression in control (C; 0 μM ZEN) and treatment groups (10, 20, 50, 100 μM). The expression in untreated control samples (C) was used as the calibrator for each group. Asterisk (*) indicates statistically significant differences between healthy and ketotic cows at the same time point (p < 0.05). Error bars represent the standard error of the mean (SEM).
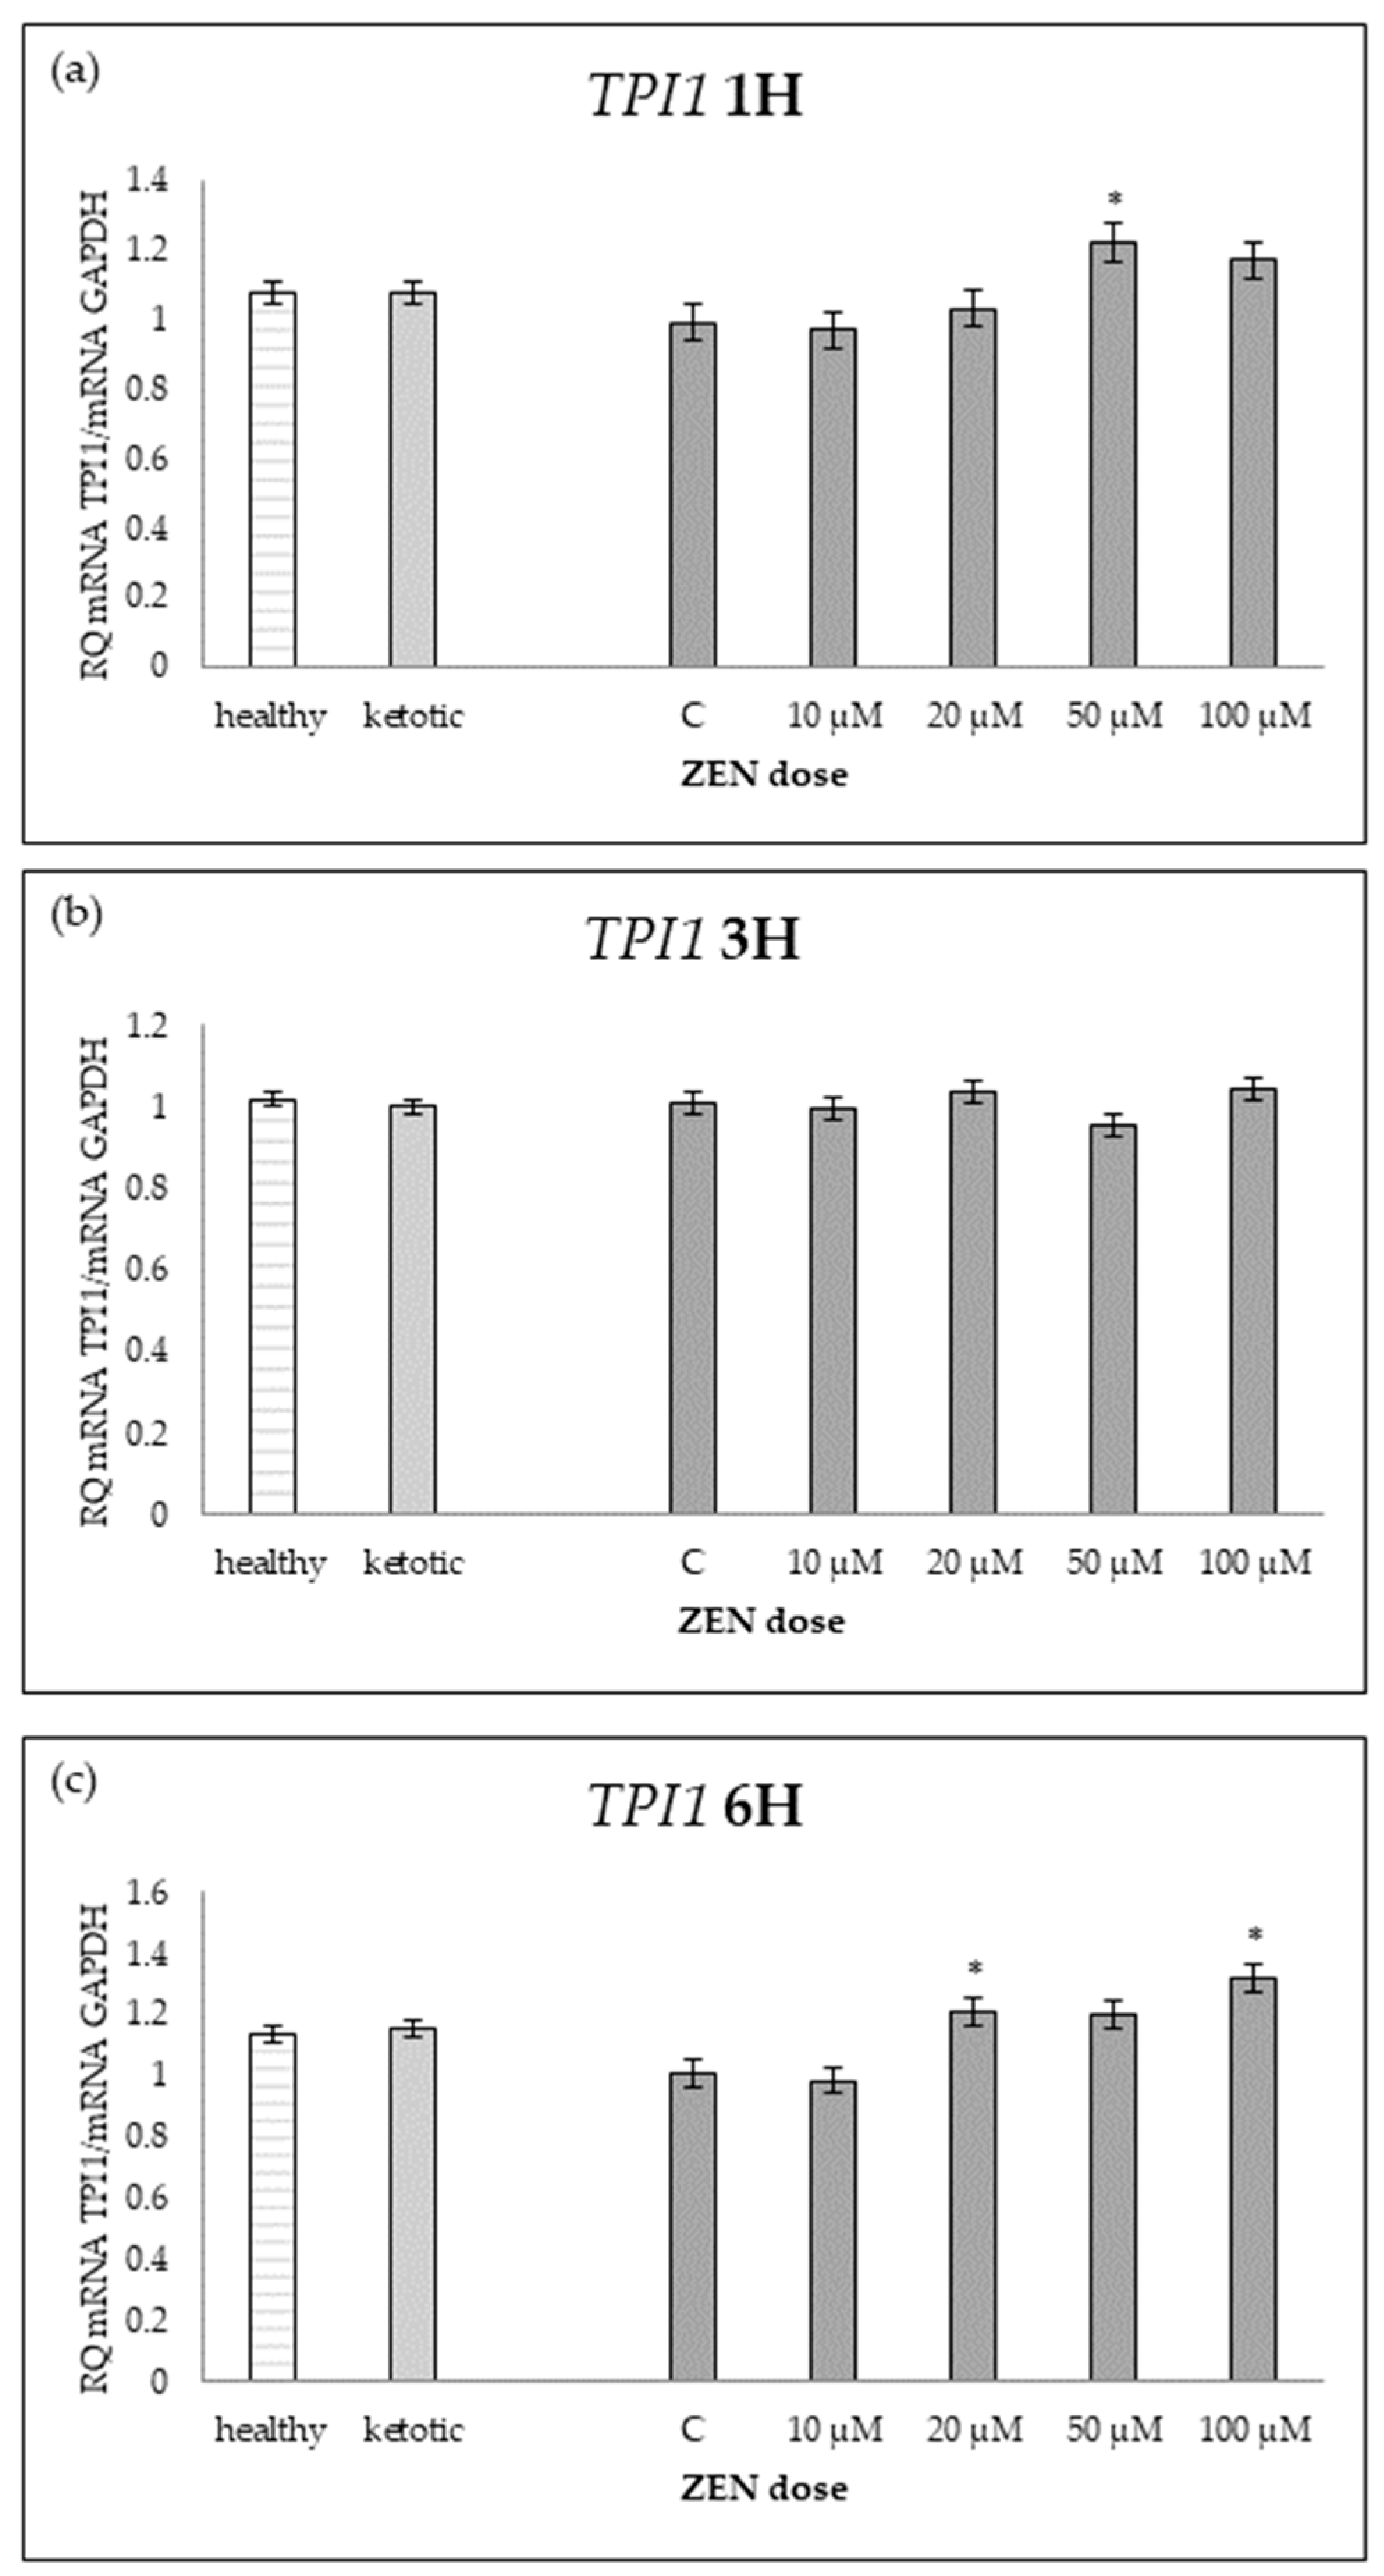
Figure 6.
Relative mRNA expression of ACOX1 normalized to GAPDH in hepatocyte cultures derived from healthy and ketotic cows after exposure to zearalenone (ZEN) for (a) 1 h, (b) 3 h, and (c) 6 h. Bars represent the mean relative quantity (RQ) of mRNA expression in control (C; 0 μM ZEN) and treatment groups (10, 20, 50, 100 μM). The expression in untreated control samples (C) was used as the calibrator for each group. Asterisks indicate statistically significant differences compared to the control within the same group: * p < 0.05, ** p < 0.001. Error bars represent the standard error of the mean (SEM).
Figure 7.
Relative mRNA expression of ACAA1 normalized to GAPDH in hepatocyte cultures derived from healthy and ketotic cows after exposure to zearalenone (ZEN) for (a) 1 h, (b) 3 h, and (c) 6 h. Bars represent the mean relative quantity (RQ) of mRNA expression in control (C; 0 μM ZEN) and treatment groups (10, 20, 50, 100 μM). The expression in untreated control samples (C) was used as the calibrator for each group. Asterisk (*) indicates statistically significant differences between healthy and ketotic cows at the same time point (p < 0.05). Error bars represent the standard error of the mean (SEM).
Figure 8.
Relative mRNA expression of ACACA normalized to GAPDH in hepatocyte cultures derived from healthy and ketotic cows after exposure to zearalenone (ZEN) for (a) 1 h, (b) 3 h, and (c) 6 h. Bars represent the mean relative quantity (RQ) of mRNA expression in control (C; 0 μM ZEN) and treatment groups (10, 20, 50, 100 μM). The expression in untreated control samples (C) was used as the calibrator for each group. Asterisks indicate statistically significant differences compared to the control within the same group: * p < 0.05, ** p < 0.001. Error bars represent the standard error of the mean (SEM).
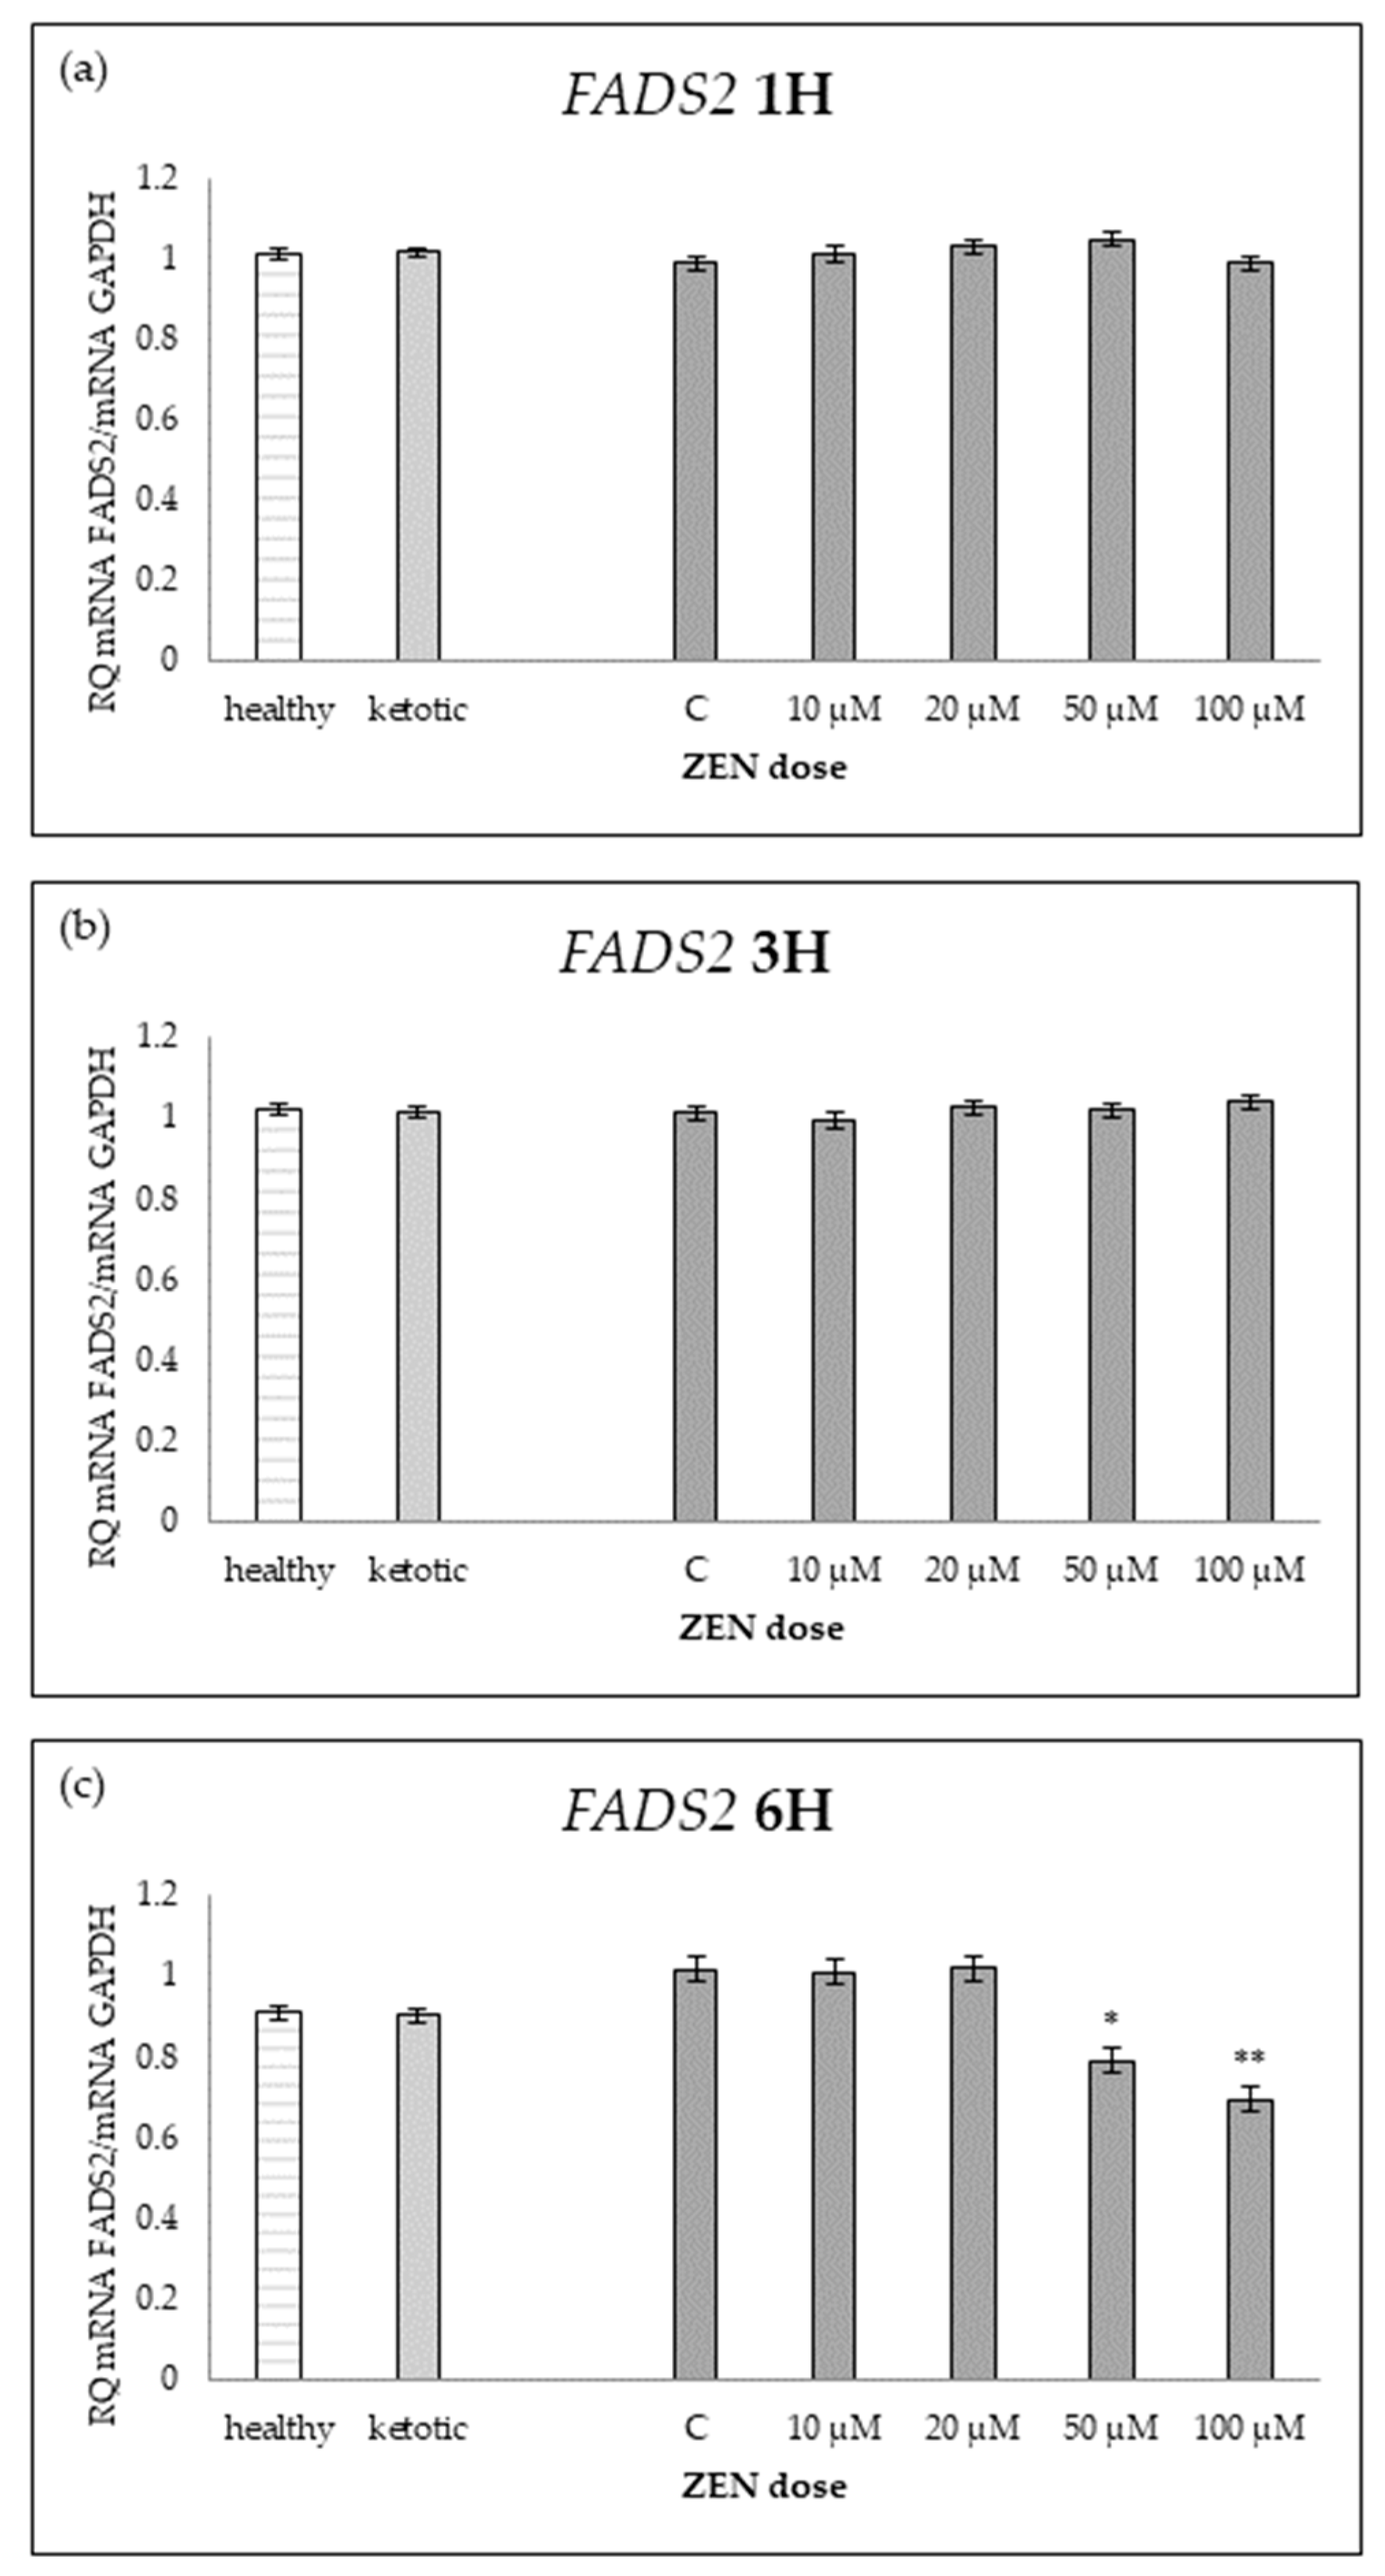
Figure 9.
Relative mRNA expression of FADS2 normalized to GAPDH in hepatocyte cultures derived from healthy and ketotic cows after exposure to zearalenone (ZEN) for (a) 1 h, (b) 3 h, and (c) 6 h. Bars represent the mean relative quantity (RQ) of mRNA expression in control (C; 0 μM ZEN) and treatment groups (10, 20, 50, 100 μM). The expression in untreated control samples (C) was used as the calibrator for each group. Asterisks indicate statistically significant differences compared to the control within the same group: * p < 0.05, ** p < 0.001. Error bars represent the standard error of the mean (SEM).
Figure 10.
Relative mRNA expression of FASN normalized to GAPDH in hepatocyte cultures derived from healthy and ketotic cows after exposure to zearalenone (ZEN) for (a) 1 h, (b) 3 h, and (c) 6 h. Bars represent the mean relative quantity (RQ) of mRNA expression in control (C; 0 μM ZEN) and treatment groups (10, 20, 50, 100 μM). The expression in untreated control samples (C) was used as the calibrator for each group. Asterisks indicate statistically significant differences compared to the control within the same group: * p < 0.05, ** p < 0.001. Error bars represent the standard error of the mean (SEM).
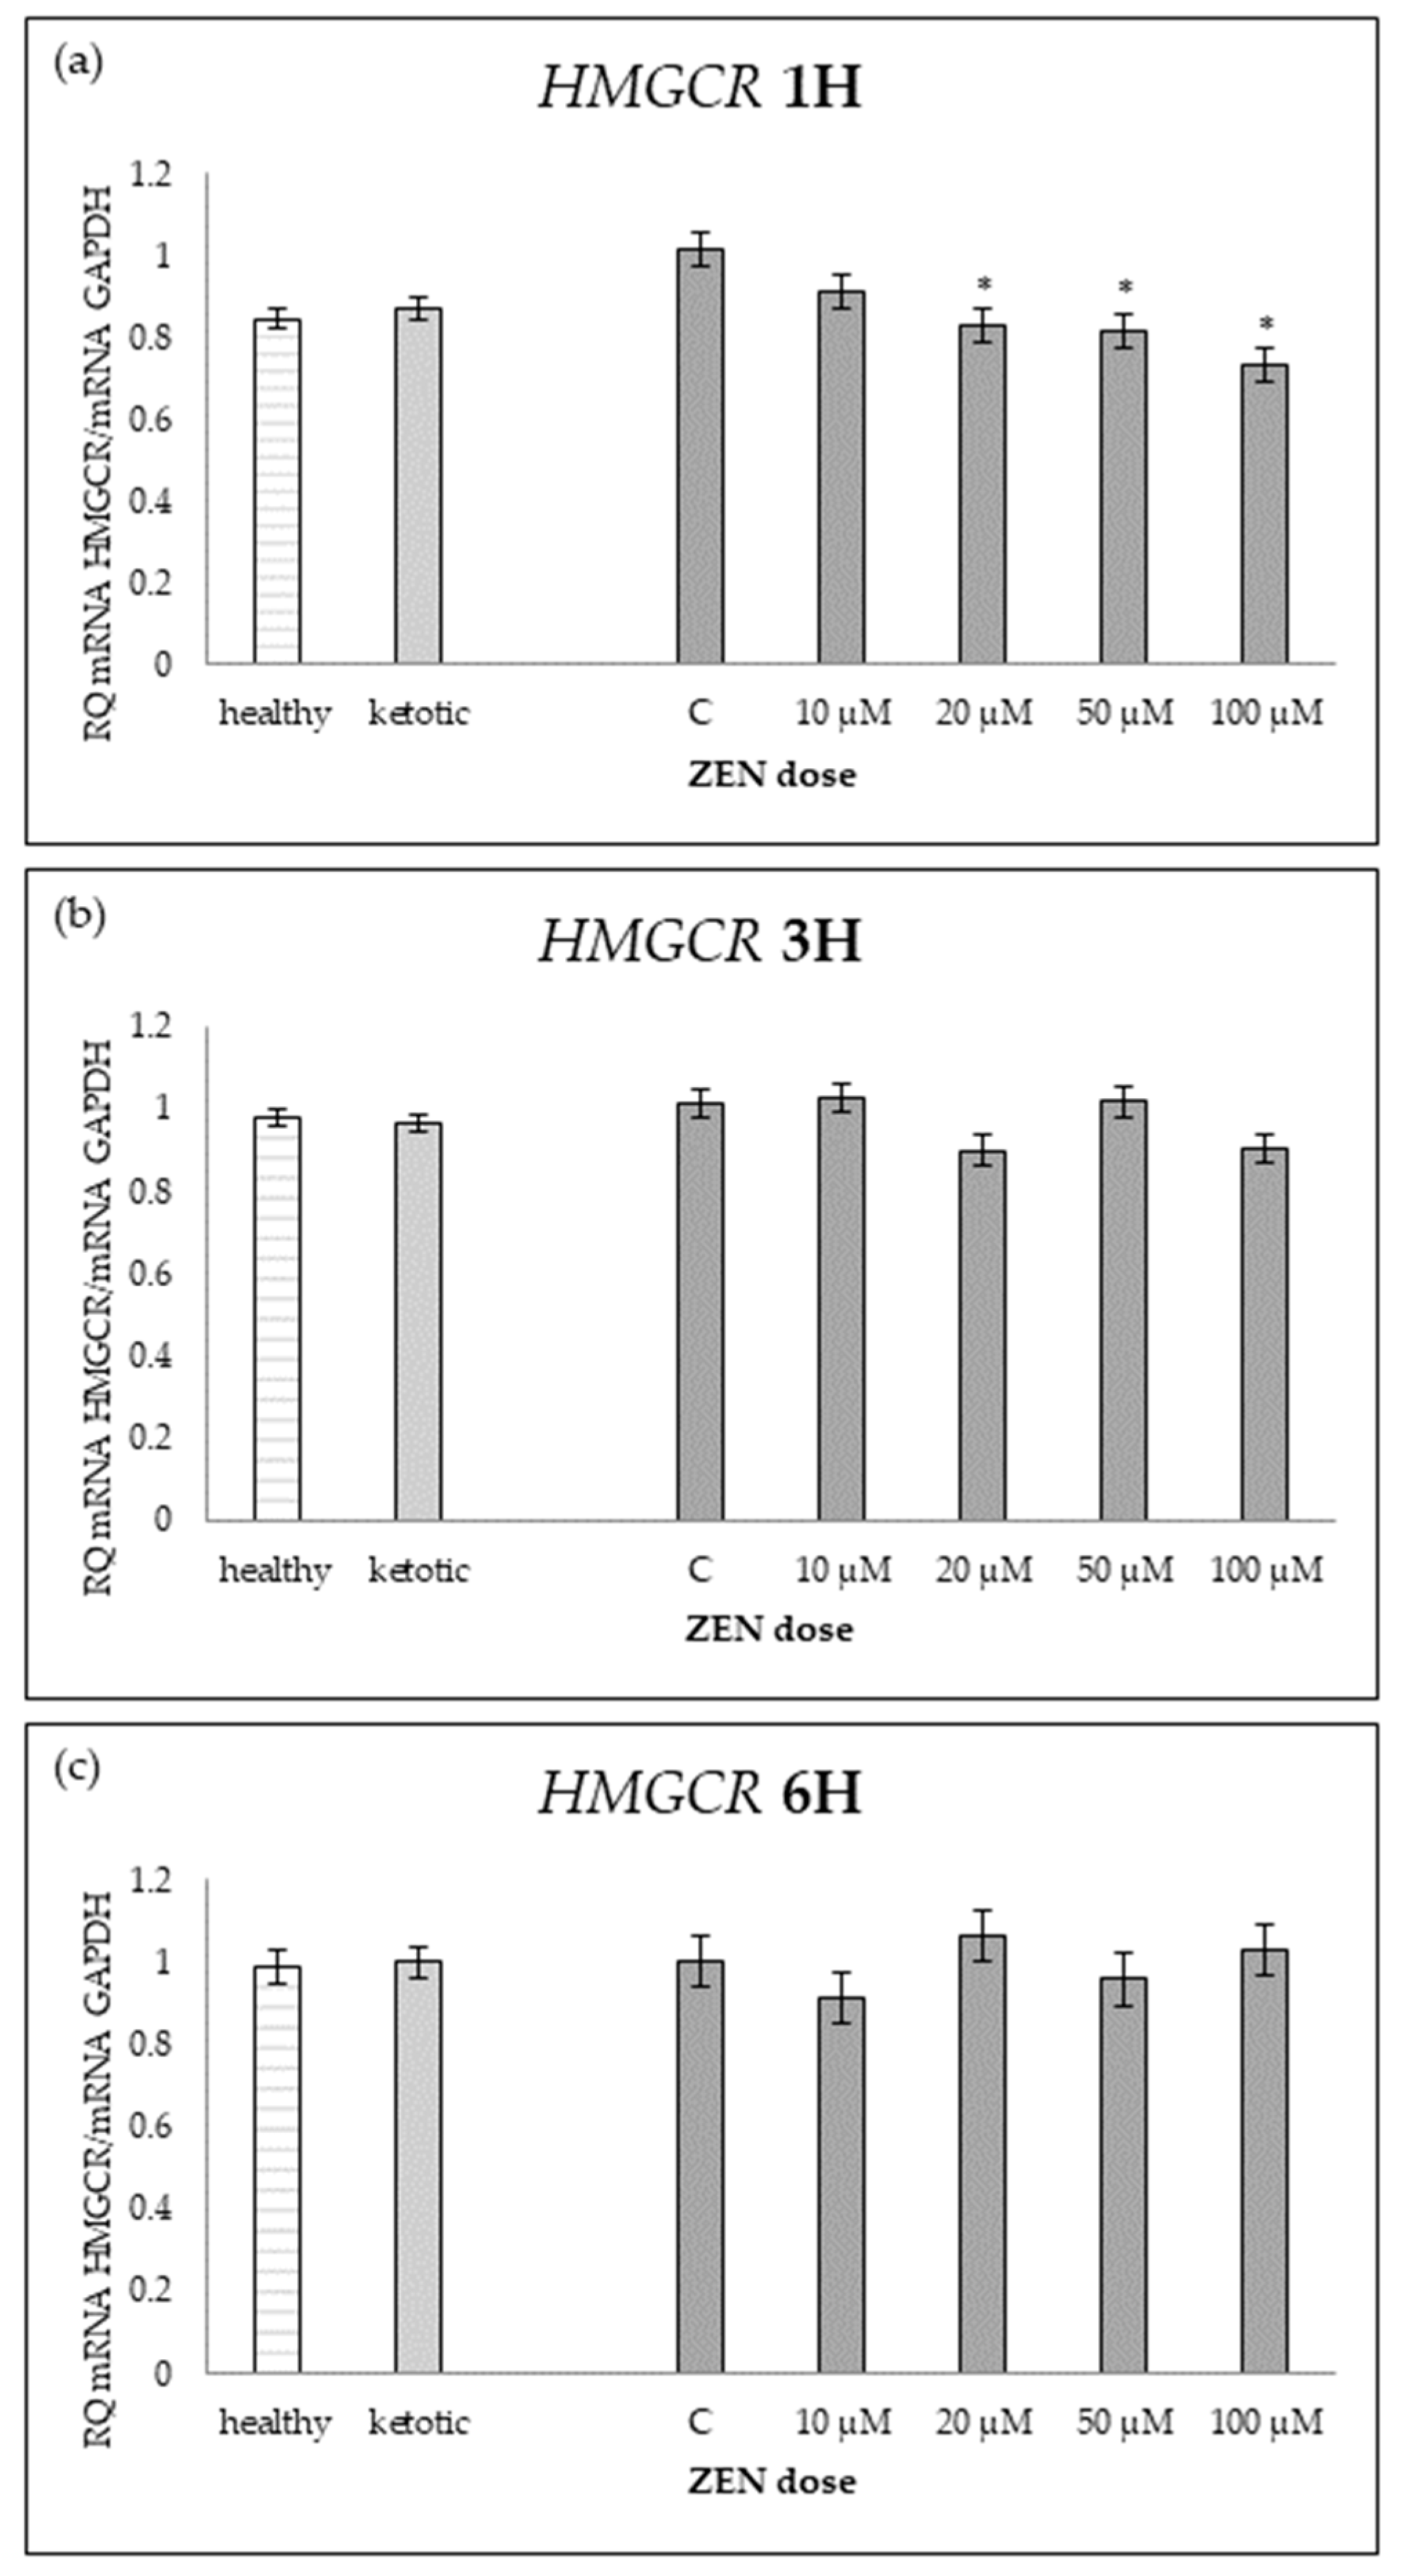
Figure 11.
Relative mRNA expression of HMGCR normalized to GAPDH in hepatocyte cultures derived from healthy and ketotic cows after exposure to zearalenone (ZEN) for (a) 1 h, (b) 3 h, and (c) 6 h. Bars represent the mean relative quantity (RQ) of mRNA expression in control (C; 0 μM ZEN) and treatment groups (10, 20, 50, 100 μM). The expression in untreated control samples (C) was used as the calibrator for each group. Asterisk (*) indicates statistically significant differences between healthy and ketotic cows at the same time point (p < 0.05). Error bars represent the standard error of the mean (SEM).
Figure 12.
Relative mRNA expression of HMGCR normalized to GAPDH in hepatocyte cultures derived from healthy and ketotic cows after exposure to zearalenone (ZEN) for (a) 1 h, (b) 3 h, and (c) 6 h. Bars represent the mean relative quantity (RQ) of mRNA expression in control (C; 0 μM ZEN) and treatment groups (10, 20, 50, 100 μM). The expression in untreated control samples (C) was used as the calibrator for each group. Asterisks indicate statistically significant differences compared to the control within the same group: * p < 0.05, ** p < 0.001. Error bars represent the standard error of the mean (SEM).
Table 1.
Relative mRNA expression of ENO1 in hepatocyte cultures isolated from healthy and ketotic cows exposed to various concentrations of Zearalenone (ZEN; 10, 20, 50, 100 μM) for 1, 3, and 6 h. Gene expression was normalized to the control group (0 μM) using the 2(−ΔΔCT) method. Values represent least squares mean (LSM), and SEM denotes the standard error of the mean. Statistical significance was determined for the effects of metabolic status (MS), ZEN (Z), and their interaction (MS*Z).
| ENO1 | Healthy Cows | Ketotic Cows | SEM | p Value |
|---|
| ZEN Dose [μM] | 0 | 10 | 20 | 50 | 100 | 0 | 10 | 20 | 50 | 100 | | MS | Z | MS*Z |
|---|
| 1H | 1.04 | 0.97 | 0.95 | 1.16 | 1.15 | 0.99 | 1.04 | 0.98 | 1.03 | 1.06 | 0.04 | 0.2073 | 0.0114 | 0.1323 |
| 3H | 1.03 | 1.15 | 1.12 | 1.04 | 1.16 | 1.02 | 0.97 | 0.98 | 1.03 | 1.03 | 0.04 | 0.002 | 0.4216 | 0.1566 |
| 6H | 1.03 | 0.96 | 1.11 | 1.04 | 1.05 | 1.02 | 1.00 | 1.00 | 1.06 | 1.02 | 0.03 | 0.4741 | 0.2163 | 0.2433 |
Table 2.
Relative mRNA expression of PDHB in hepatocyte cultures isolated from healthy and ketotic cows exposed to various concentrations of Zearalenone (ZEN; 10, 20, 50, 100 μM) for 1, 3, and 6 h. Gene expression was normalized to the control group (0 μM) using the 2(−ΔΔCT) method. Values represent least squares mean (LSM), and SEM denotes the standard error of the mean. Statistical significance was determined for the effects of metabolic status (MS), ZEN (Z), and their interaction (MS*Z). Different letters within the same row indicate statistically significant differences between ZEN doses at the same incubation time (p < 0.05).
| PDHB | Healthy Cows | Ketotic Cows | SEM | p Value |
|---|
| ZEN Dose [μM] | 0 | 10 | 20 | 50 | 100 | 0 | 10 | 20 | 50 | 100 | | MS | Z | MS*Z |
|---|
| 1H | 1.01 a | 1.13 a | 1.45 b | 1.57 b | 1.68 b | 1.00 a | 1.04 a | 1.02 a | 1.02 a | 1.01 a | 0.09 | <0.0001 | 0.0077 | 0.0070 |
| 3H | 0.97 | 1.10 | 1.52 | 1.40 | 1.72 | 1.00 | 0.98 | 1.41 | 1.52 | 1.47 | 0.08 | 0.2594 | <0.0001 | 0.2704 |
| 6H | 1.01 | 1.24 | 1.60 | 1.53 | 1.62 | 0.99 | 1.11 | 1.41 | 1.40 | 1.38 | 0.09 | 0.0239 | <0.0001 | 0.8112 |
Table 3.
Relative mRNA expression of PGAM1 in hepatocyte cultures isolated from healthy and ketotic cows exposed to various concentrations of Zearalenone (ZEN; 10, 20, 50, 100 μM) for 1, 3, and 6 h. Gene expression was normalized to the control group (0 μM) using the 2(−ΔΔCT) method. Values represent least squares mean (LSM), and SEM denotes the standard error of the mean. Statistical significance was determined for the effects of metabolic status (MS), ZEN (Z), and their interaction (MS*Z). Different letters within the same row indicate statistically significant differences between ZEN doses at the same incubation time (p < 0.05).
| PGAM1 | Healthy Cows | Ketotic Cows | SEM | p Value |
|---|
| ZEN Dose [μM] | 0 | 10 | 20 | 50 | 100 | 0 | 10 | 20 | 50 | 100 | | MS | Z | MS*Z |
|---|
| 1H | 1.00 a | 0.99 a | 0.80 bcd | 0.76 bc | 0.71 b | 1.01 a | 1.02 a | 1.02 a | 1.02 a | 0.98 acd | 0.05 | 0.0001 | 0.0169 | 0.0393 |
| 3H | 1.02 | 0.91 | 0.76 | 0.79 | 0.72 | 1.02 | 1.00 | 0.89 | 0.64 | 0.60 | 0.06 | 0.757 | <0.0001 | 0.0774 |
| 6H | 1.00 ab | 1.02 a | 0.83 bc | 0.68 c | 0.75 c | 1.01 ab | 0.98 ab | 0.9 ab9 | 1.05 a | 0.87 abc | 0.04 | 0.0003 | 0.0011 | 0.0020 |
Table 4.
Relative mRNA expression of PGK1 in hepatocyte cultures isolated from healthy and ketotic cows exposed to various concentrations of Zearalenone (ZEN; 10, 20, 50, 100 μM) for 1, 3, and 6 h. Gene expression was normalized to the control group (0 μM) using the 2(−ΔΔCT) method. Values represent least squares mean (LSM), and SEM denotes the standard error of the mean. Statistical significance was determined for the effects of metabolic status (MS), ZEN (Z), and their interaction (MS*Z). Different letters within the same row indicate statistically significant differences between ZEN doses at the same incubation time (p < 0.05).
| PGK1 | Healthy Cows | Ketotic Cows | SEM | p Value |
|---|
| ZEN Dose [μM] | 0 | 10 | 20 | 50 | 100 | 0 | 10 | 20 | 50 | 100 | | MS | Z | MS*Z |
|---|
| 1H | 1.04 ab | 0.96 a | 0.98 ab | 1.21 b | 1.22 b | 1.01 ab | 1.02 a | 0.99 ab | 1.00 ab | 1.01 ab | 0.03 | 0.0028 | 0.0026 | 0.0021 |
| 3H | 1.01 | 0.85 | 0.83 | 0.71 | 0.72 | 1.03 | 0.83 | 0.82 | 0.82 | 0.76 | 0.05 | 0.4089 | 0.0005 | 0.7145 |
| 6H | 0.99 ab | 0.95 ab | 0.95 ab | 0.72 cd | 0.53 e | 1.00 ab | 1.04 b | 0.84 ad | 0.85 acd | 0.68 ce | 0.04 | 0.0425 | <0.0001 | 0.0366 |
Table 5.
Relative mRNA expression of TPI1 in hepatocyte cultures isolated from healthy and ketotic cows exposed to various concentrations of Zearalenone (ZEN; 10, 20, 50, 100 μM) for 1, 3, and 6 h. Gene expression was normalized to the control group (0 μM) using the 2(−ΔΔCT) method. Values represent low least squares mean (LSM), and SEM denotes the standard error of the mean. Statistical significance was determined for the effects of metabolic status (MS), ZEN (Z), and their interaction (MS*Z).
| TPI1 | Healthy Cows | Ketotic Cows | SEM | p Value |
|---|
| ZEN Dose [μM] | 0 | 10 | 20 | 50 | 100 | 0 | 10 | 20 | 50 | 100 | | MS | Z | MS*Z |
|---|
| 1H | 0.98 | 0.91 | 1.07 | 1.21 | 1.21 | 1.00 | 1.03 | 0.99 | 1.23 | 1.14 | 0.07 | 0.9959 | 0.0122 | 0.6842 |
| 3H | 1.01 | 0.96 | 1.10 | 0.95 | 1.07 | 1.02 | 1.03 | 0.98 | 0.96 | 1.02 | 0.04 | 0.5375 | 0.2019 | 0.1878 |
| 6H | 1.01 | 0.97 | 1.20 | 1.14 | 1.35 | 1.01 | 1.00 | 1.22 | 1.26 | 1.29 | 0.06 | 0.5881 | 0.0003 | 0.7214 |
Table 6.
Relative mRNA expression of ACOX1 in hepatocyte cultures isolated from healthy and ketotic cows exposed to various concentrations of zearalenone (ZEN; 10, 20, 50, 100 μM) for 1, 3, and 6 h. Gene expression was normalized to the control group (0 μM) using the 2(−ΔΔCT) method. Values represent means, and SEM denotes the standard error of the mean. Statistical significance was determined for the effects of metabolic status (MS), ZEN dose (Z), and their interaction (MS*Z). Different letters within the same row indicate statistically significant differences between ZEN doses at the same incubation time (p < 0.05).
| ACOX1 | Healthy Cows | Ketotic Cows | SEM | p Value |
|---|
| ZEN Dose [μM] | 0 | 10 | 20 | 50 | 100 | 0 | 10 | 20 | 50 | 100 | | MS | Z | MS*Z |
|---|
| 1H | 1.06 a | 1.03 a | 1.19 a | 1.36 a | 2.30 b | 1.02 a | 1.06 a | 0.91 a | 1.03 a | 1.03 a | 0.16 | 0.0016 | 0.0042 | 0.0049 |
| 3H | 1.01 a | 1.27 bc | 1.43 cd | 1.40 bcd | 1.58 d | 1.00 a | 1.02 a | 1.18 ab | 1.35 bcd | 1.46 cd | 0.06 | 0.0029 | <0.0001 | 0.2485 |
| 6H | 1.07 a | 1.11 a | 1.47 b | 1.43 b | 1.61 b | 1.01 a | 1.01 a | 1.01 a | 1.36 b | 1.43 b | 0.07 | 0.0012 | <0.0001 | 0.0658 |
Table 7.
Relative mRNA expression of ACAA1 in hepatocyte cultures isolated from healthy and ketotic cows exposed to various concentrations of zearalenone (ZEN; 10, 20, 50, 100 μM) for 1, 3, and 6 h. Gene expression was normalized to the control group (0 μM) using the 2(−ΔΔCT) method. Values represent means, and SEM denotes the standard error of the mean. Statistical significance was determined for the effects of metabolic status (MS), ZEN dose (Z), and their interaction (MS*Z). Different letters within the same row indicate statistically significant differences between ZEN doses at the same incubation time (p < 0.05).
| ACAA1 | Healthy Cows | Ketotic Cows | SEM | p Value |
|---|
| ZEA Dose [μM] | 0 | 10 | 20 | 50 | 100 | 0 | 10 | 20 | 50 | 100 | | MS | Z | MS*Z |
|---|
| 1H | 1.01 a | 1.00 a | 1.01 a | 1.00 a | 0.75 b | 1.01 a | 1.02 a | 0.98 a | 1.01 a | 1.05 a | 0.02 | 0.0008 | 0.0004 | <0.0001 |
| 3H | 1.01 | 1.05 | 1.00 | 1.02 | 1.04 | 0.99 | 1.02 | 1.01 | 1.05 | 1.02 | 0.03 | 0.8667 | 0.6951 | 0.8013 |
| 6H | 0.99 | 0.95 | 1.01 | 1.01 | 1.02 | 1.00 | 0.95 | 1.01 | 0.99 | 1.02 | 0.02 | 0.8639 | 0.0444 | 0.9812 |
Table 8.
Relative mRNA expression of ACACA in hepatocyte cultures isolated from healthy and ketotic cows exposed to various concentrations of zearalenone (ZEN; 10, 20, 50, 100 μM) for 1, 3, and 6 h. Gene expression was normalized to the control group (0 μM) using the 2(−ΔΔCT) method. Values represent means, and SEM denotes the standard error of the mean. Statistical significance was determined for the effects of health status (MS), ZEN dose (Z), and their interaction (MS*Z). Different letters within the same row indicate statistically significant differences between ZEN doses at the same incubation time (p < 0.05).
| ACACA | Healthy Cows | Ketotic Cows | SEM | p Value |
|---|
| ZEN Dose [μM] | 0 | 10 | 20 | 50 | 100 | 0 | 10 | 20 | 50 | 100 | | MS | Z | MS*Z |
|---|
| 1H | 1.01 ab | 0.83 acde | 0.81 ce | 0.82 cde | 0.74 e | 1.01 abd | 1.00 abcd | 1.02 ab | 0.99 abcd | 1.04 b | 0.04 | <0.0001 | 0.0301 | 0.0119 |
| 3H | 1.04 acd | 0.98 abc | 0.90 ab | 1.23 cd | 1.24 d | 1.01 abcd | 0.93 ab | 0.75 b | 0.74 b | 0.77 b | 0.03 | <0.0001 | 0.0002 | <0.0001 |
| 6H | 1.02 | 0.96 | 1.09 | 1.15 | 1.20 | 1.02 | 1.01 | 1.01 | 0.96 | 1.01 | 0.03 | 0.0013 | 0.0393 | 0.009 |
Table 9.
Relative mRNA expression of FADS2 in hepatocyte cultures isolated from healthy and ketotic cows exposed to various concentrations of zearalenone (ZEN; 10, 20, 50, 100 μM) for 1, 3, and 6 h. Gene expression was normalized to the control group (0 μM) using the 2(−ΔΔCT) method. Values represent means, and SEM denotes the standard error of the mean. Statistical significance was determined for the effects of metabolic status (MS), ZEN dose (Z), and their interaction (MS*Z). Different letters within the same row indicate statistically significant differences between ZEN doses at the same incubation time (p < 0.05).
| FADS2 | Healthy Cows | Ketotic Cows | SEM | p Value |
|---|
| ZEN Dose [μM] | 0 | 10 | 20 | 50 | 100 | 0 | 10 | 20 | 50 | 100 | | MS | Z | MS*Z |
|---|
| 1H | 0.99 | 1.01 | 1.01 | 1.05 | 0.99 | 0.99 | 1.01 | 1.05 | 1.05 | 0.98 | 0.03 | 0.8029 | 0.1622 | 0.8925 |
| 3H | 1.02 | 1.01 | 1.01 | 1.03 | 1.03 | 1.00 | 0.98 | 1.04 | 1.00 | 1.04 | 0.03 | 0.582 | 0.5647 | 0.7711 |
| 6H | 1.02 a | 1.04 a | 0.99 a | 0.77 b | 0.73 b | 1.01 a | 0.98 a | 1.05 a | 0.81 a | 0.66 b | 0.04 | 0.7861 | <0.0001 | 0.5092 |
Table 10.
Relative mRNA expression of FASN in hepatocyte cultures isolated from healthy and ketotic cows exposed to various concentrations of zearalenone (ZEN; 10, 20, 50, 100 μM) for 1, 3, and 6 h. Gene expression was normalized to the control group (0 μM) using the 2(−ΔΔCT) method. Values represent means, and SEM denotes the standard error of the mean. Statistical significance was determined for the effects of metabolic status (MS), ZEN dose (Z), and their interaction (MS*Z). Different letters within the same row indicate statistically significant differences between ZEN doses at the same incubation time (p < 0.05).
| FASN | Healthy Cows | Ketotic Cows | SEM | p Value |
|---|
| ZEN Dose [μM] | 0 | 10 | 20 | 50 | 100 | 0 | 10 | 20 | 50 | 100 | | MS | Z | MS*Z |
|---|
| 1H | 1.06 | 0.75 | 0.99 | 0.92 | 0.99 | 0.99 | 1.02 | 1.03 | 1.00 | 0.99 | 0.04 | 0.0226 | 0.0295 | 0.0122 |
| 3H | 1.03 a | 1.01 a | 1.24 a | 1.28 a | 1.62 b | 1.01 a | 1.06 a | 0.99 a | 1.06 a | 1.03 a | 0.06 | 0.0001 | 0.0014 | 0.0015 |
| 6H | 1.02 | 0.99 | 1.46 | 1.70 | 1.77 | 0.99 | 1.03 | 1.56 | 1.67 | 1.55 | 0.07 | 0.5961 | <0.0001 | 0.2552 |
Table 11.
Relative mRNA expression of HMGCR in hepatocyte cultures isolated from healthy and ketotic cows exposed to various concentrations of zearalenone (ZEN; 10, 20, 50, 100 μM) for 1, 3, and 6 h. Gene expression was normalized to the control group (0 μM) using the 2(−ΔΔCT) method. Values represent means, and SEM denotes the standard error of the mean. Statistical significance was determined for the effects of metabolic status (MS), ZEN dose (Z), and their interaction (MS*Z). Different letters within the same row indicate statistically significant differences between ZEN doses at the same incubation time (p < 0.05).
| HMGCR | Healthy Cows | Ketotic Cows | SEM | p Value |
|---|
| ZEN Dose [μM] | 0 | 10 | 20 | 50 | 100 | 0 | 10 | 20 | 50 | 100 | | MS | Z | MS*Z |
|---|
| 1H | 1.03 a | 0.83 ab | 0.80 ab | 0.82 ab | 0.76 ab | 1.00 a | 1.00 a | 0.86 ab | 0.81 ab | 0.70 b | 0.06 | 0.4948 | 0.0023 | 0.3555 |
| 3H | 1.01 a | 1.04 a | 0.86 ab | 1.05 a | 0.95 ab | 1.01 a | 1.02 a | 0.94 ab | 0.99 a | 0.87 ab | 0.05 | 0.6241 | 0.0343 | 0.4995 |
| 6H | 0.99 | 0.82 | 1.12 | 0.94 | 1.07 | 1.01 | 1.01 | 1.01 | 0.98 | 0.99 | 0.09 | 0.8445 | 0.5107 | 0.4959 |
Table 12.
Relative mRNA expression of SC4MOL in hepatocyte cultures isolated from healthy and ketotic cows exposed to various concentrations of zearalenone (ZEN; 10, 20, 50, 100 μM) for 1, 3, and 6 h. Gene expression was normalized to the control group (0 μM) using the 2(−ΔΔCT) method. Values represent means, and SEM denotes the standard error of the mean. Statistical significance was determined for the effects of health metabolic status (MS), ZEN dose (Z), and their interaction (MS*Z). Different letters within the same row indicate statistically significant differences between ZEN doses at the same incubation time (p < 0.05).
| SC4MOL | Healthy Cows | Ketotic Cows | SEM | p Value |
|---|
| ZEN Dose [μM] | 0 | 10 | 20 | 50 | 100 | 0 | 10 | 20 | 50 | 100 | | MS | Z | MS*Z |
|---|
| 1H | 1.00 a | 1.03 a | 0.69 bc | 0.73 b | 0.64 c | 1.00 a | 0.96 a | 0.78 ab | 0.61 c | 0.60 c | 0.06 | 0.4321 | <0.0001 | 0.3962 |
| 3H | 1.00 a | 0.79 ab | 0.72 ab | 0.72 ab | 0.70 ab | 1.00 a | 0.78 ab | 0.71 ab | 0.71 ab | 0.70 ab | 0.06 | 0.9359 | 0.0013 | 0.9998 |
| 6H | 1.00 | 0.98 | 1.01 | 1.01 | 0.97 | 1.01 | 1.02 | 1.00 | 0.98 | 1.02 | 0.03 | 0.611 | 0.9917 | 0.6676 |


