
Antimicrobial Composite Films Based on Alginate–Chitosan with Honey, Propolis, Royal Jelly and Green-Synthesized Silver Nanoparticles

 ,
,  ,
,  ,
,  , ,
, ,  ,
,
Abstract
1. Introduction
2. Results and Discussion
2.1. Scanning Electron Microscopy (SEM)
2.2. Fourier Transformed Infrared (FTIR) Spectrometry
2.3. UV-Vis and Fluorescence Spectral Analyses
2.4. Thermal Analysis
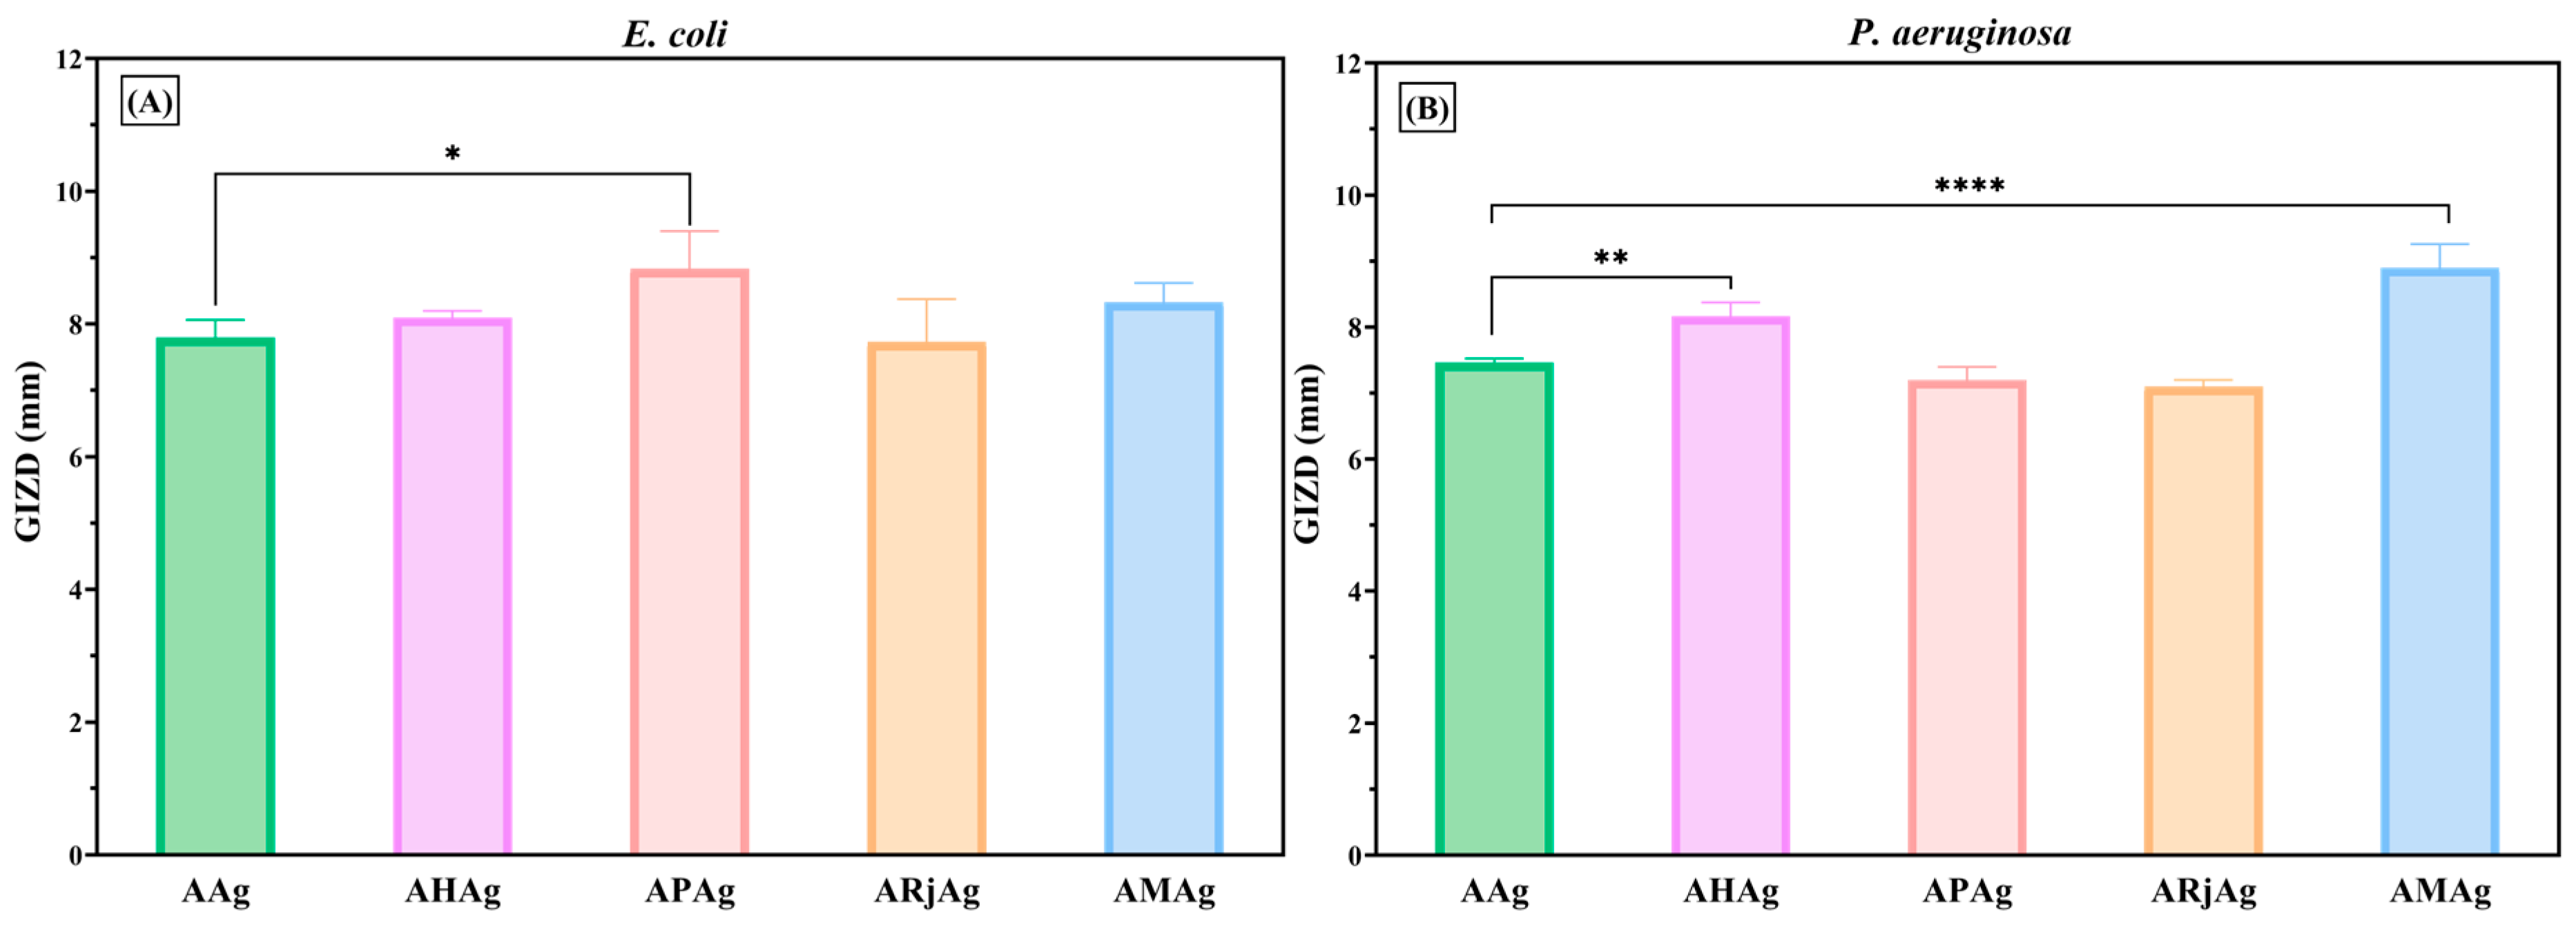
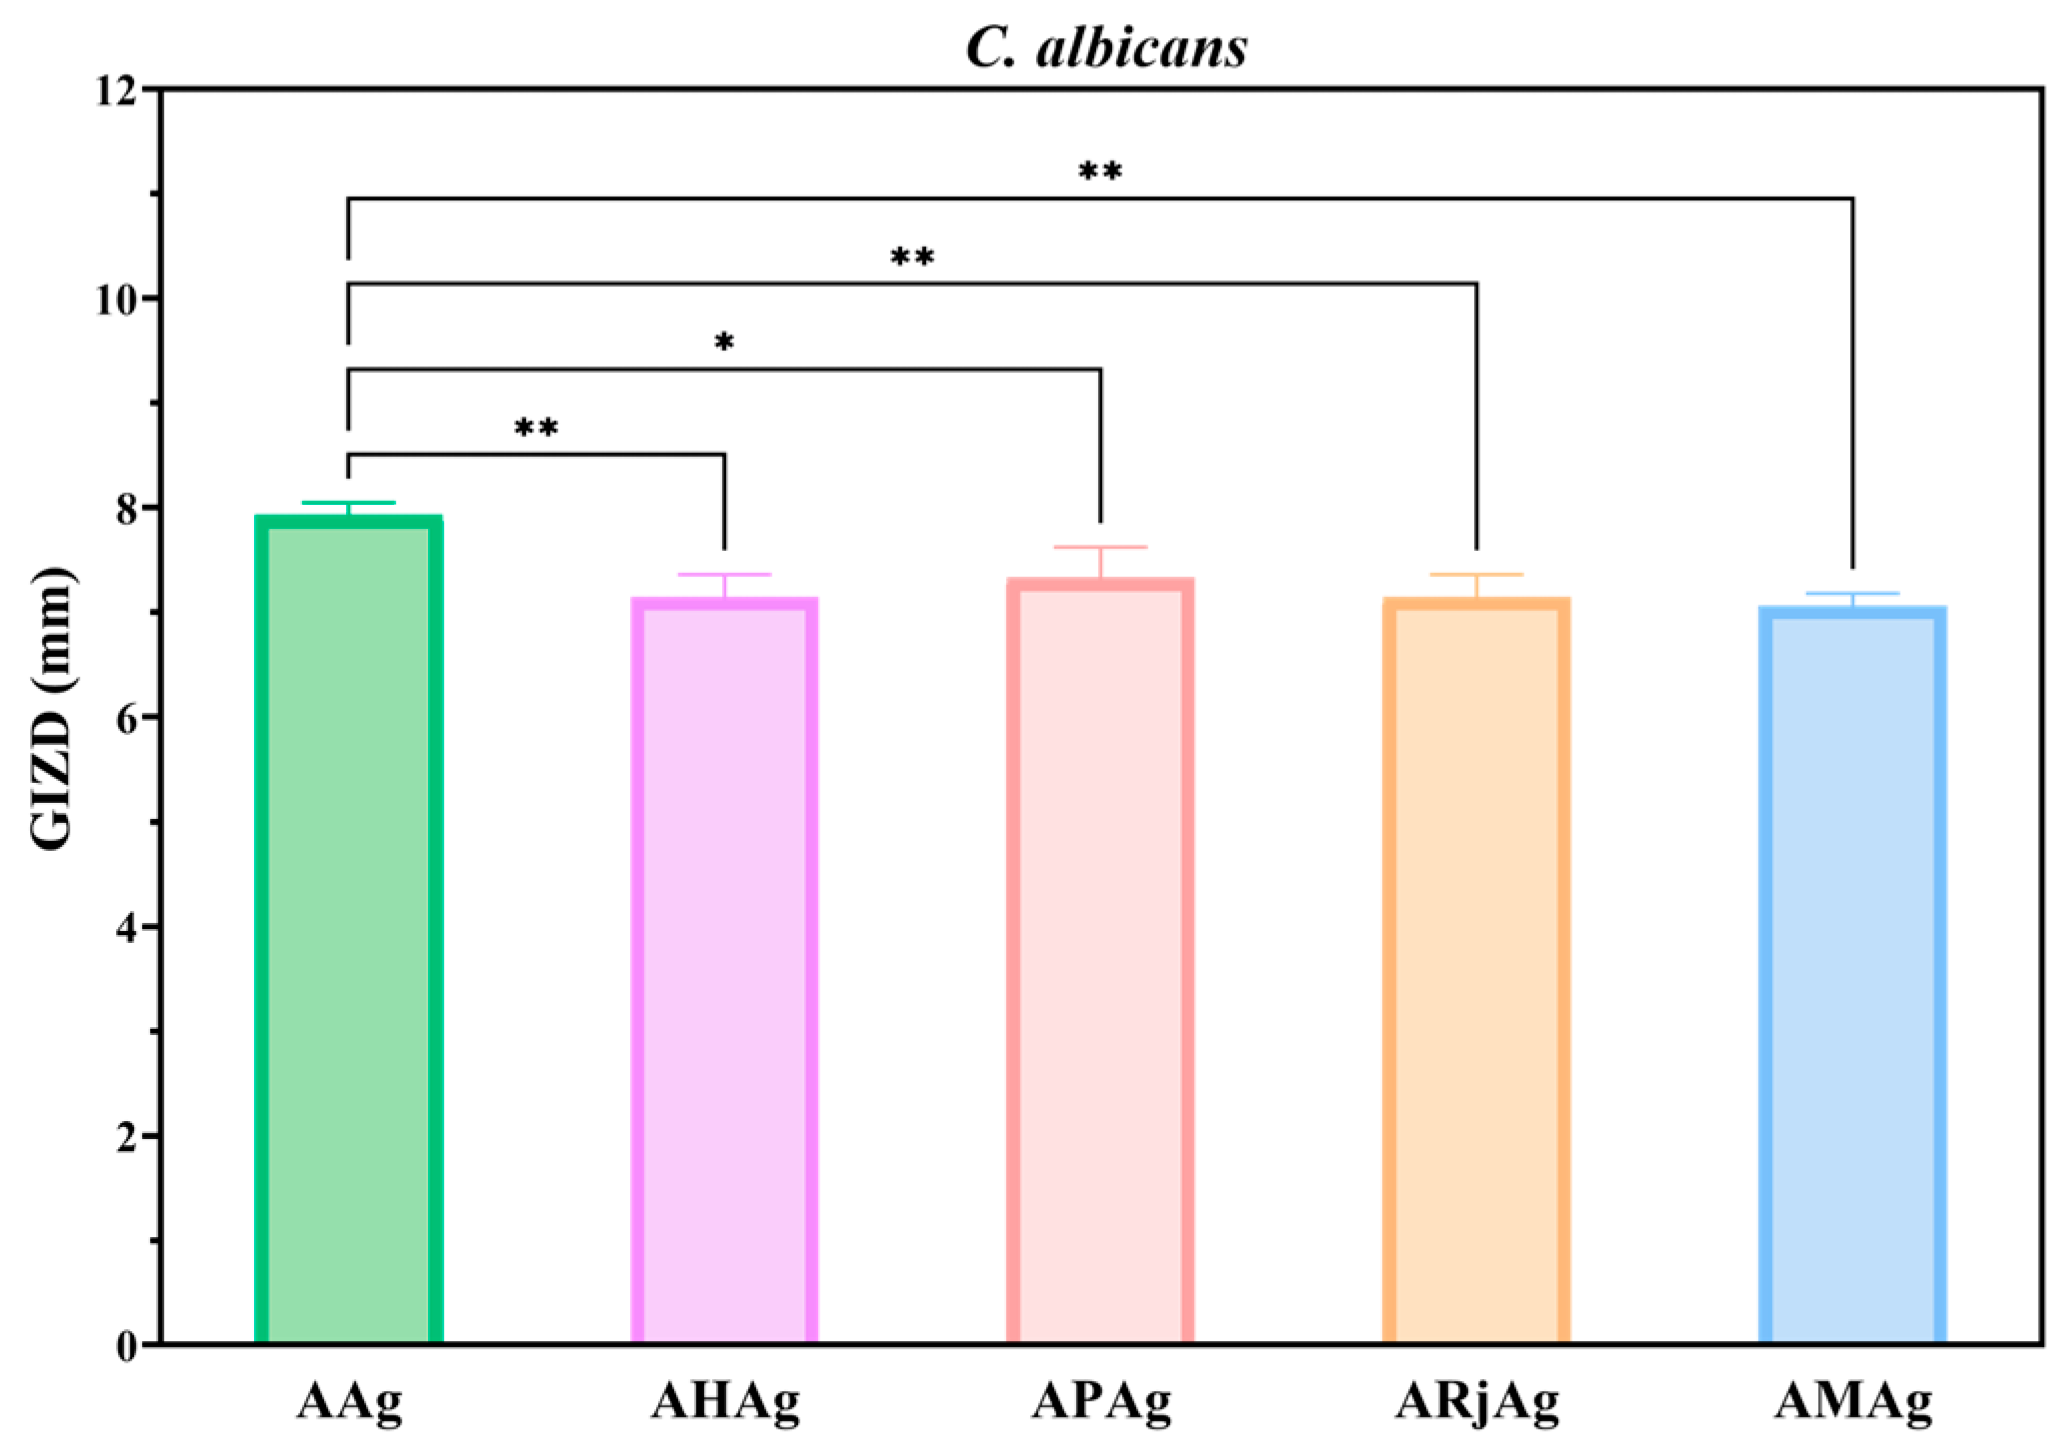
2.5. Antimicrobial Activity
2.6. Biocompatibility and Cytotoxicity Assays
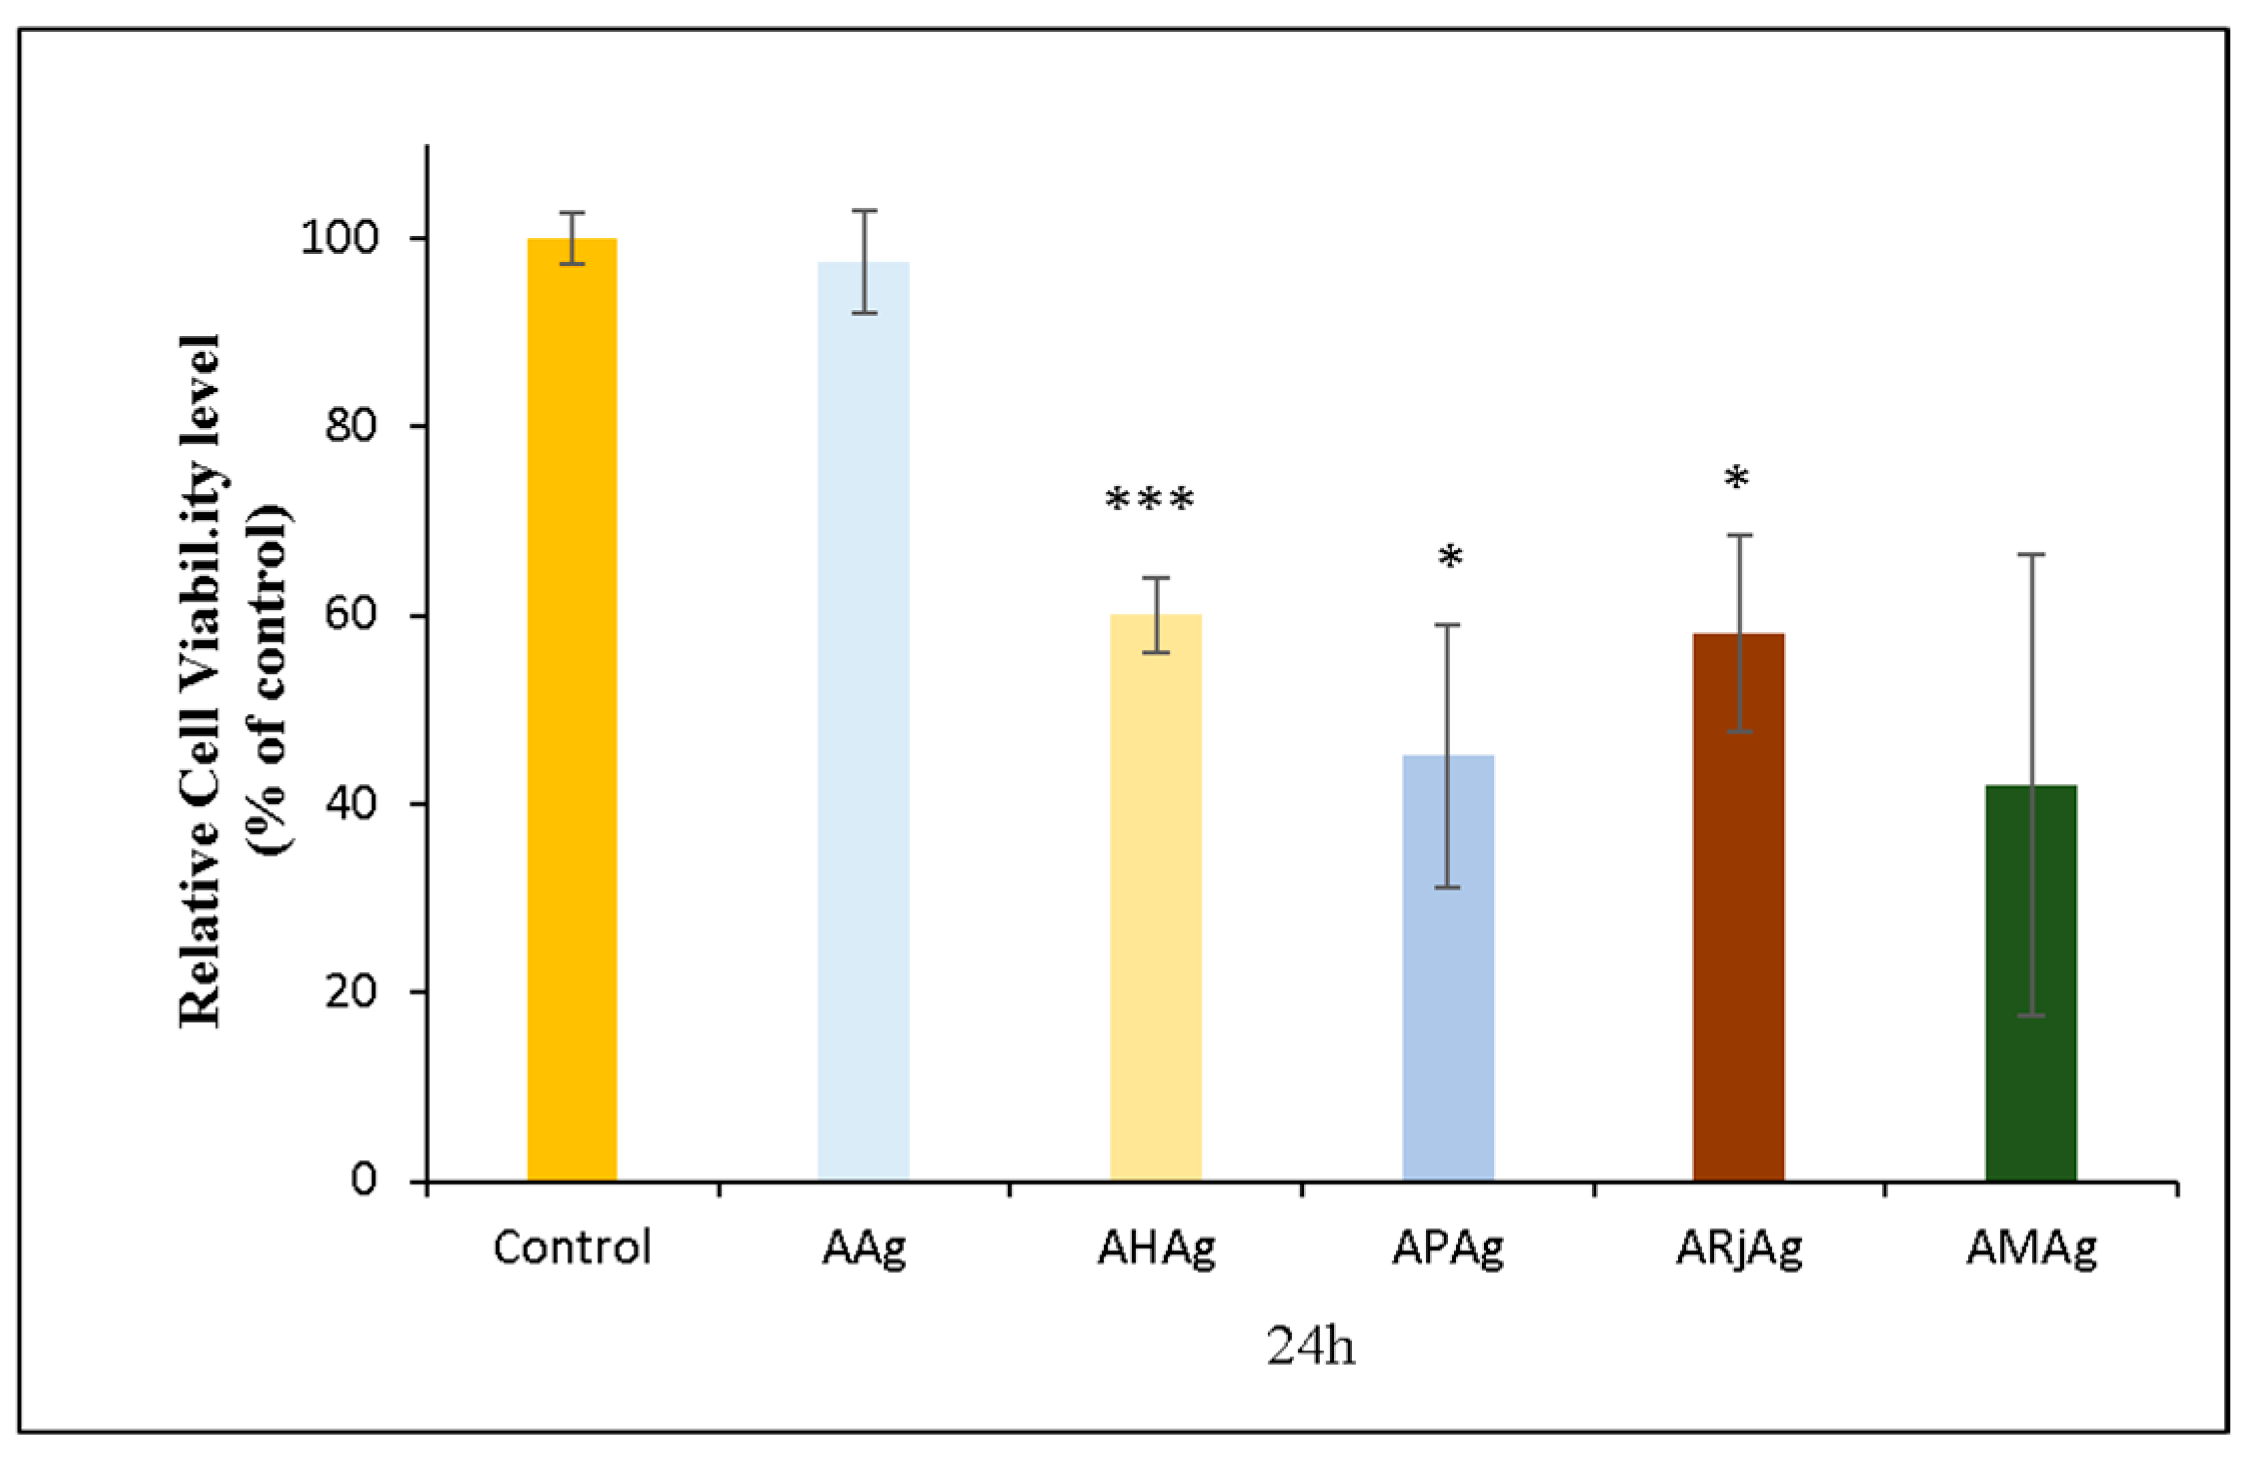
2.6.1. MTT Assay
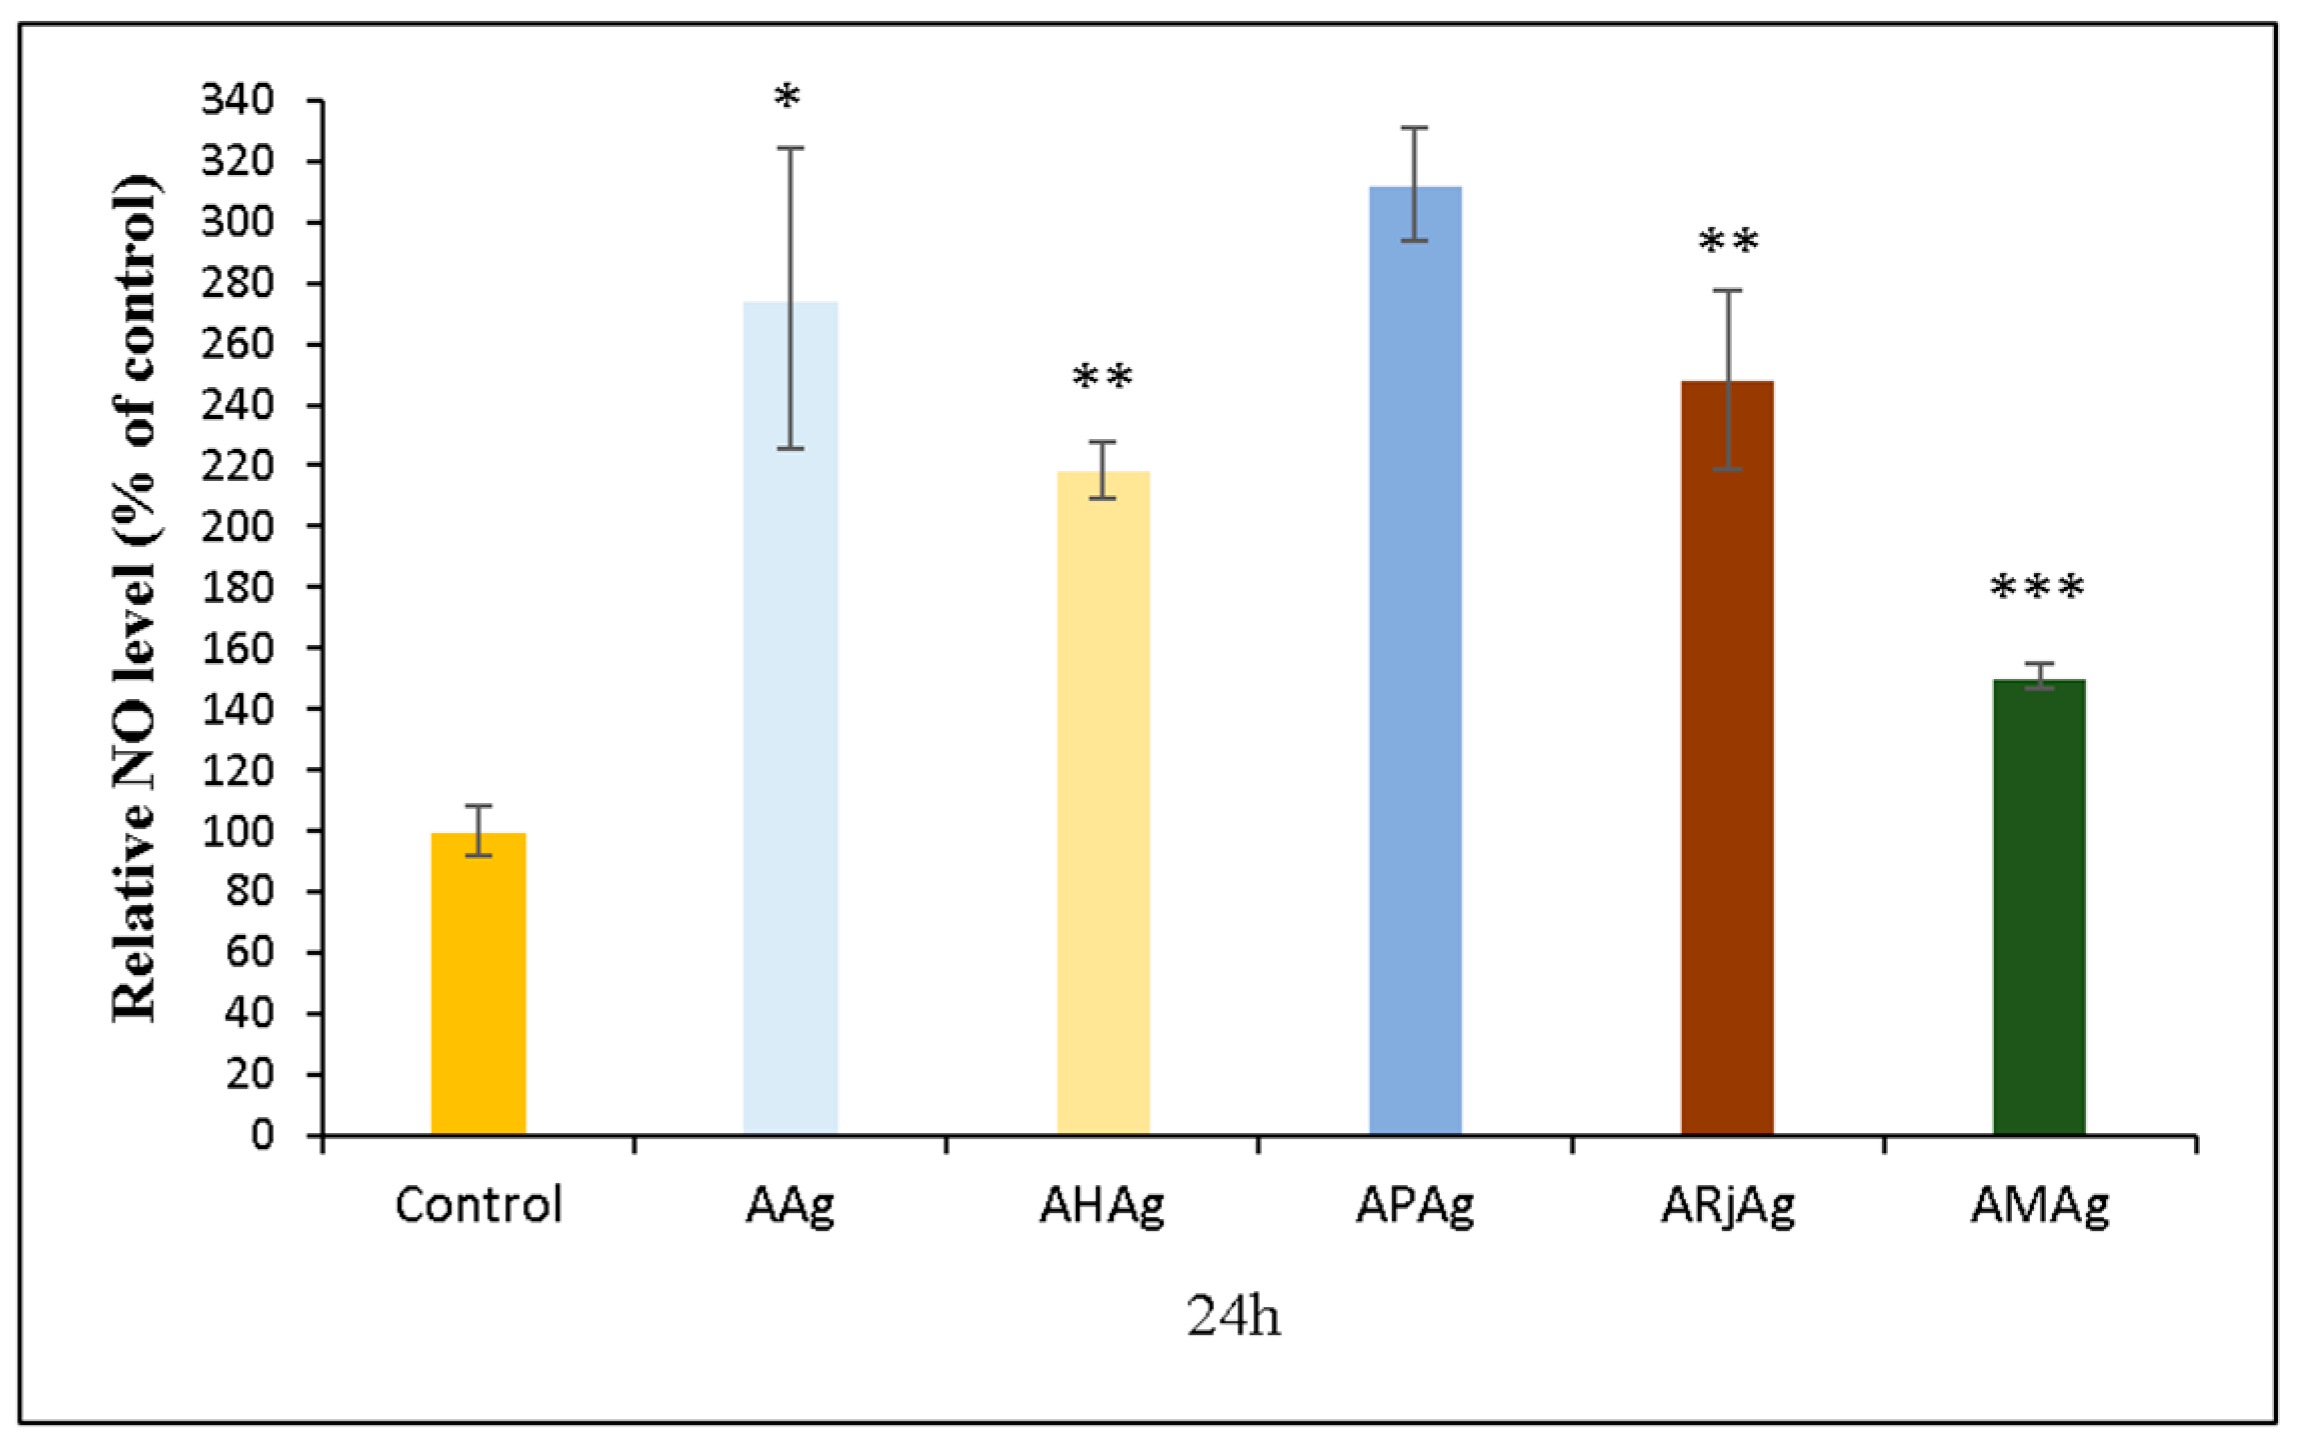
2.6.2. NO Assay
2.6.3. LDH Assay
3. Materials and Methods
3.1. Materials
3.2. Synthesis of Biomaterials Based on Bee Products
3.3. Characterization of Biomaterials Based on Bee Products
3.4. Antimicrobial Assessments
3.5. Biocompatibility Assays
3.5.1. Cell Culture
3.5.2. Indirect Cytotoxicity Tests
3.6. Statistical Analysis
4. Conclusions
Supplementary Materials
Author Contributions
Funding
Institutional Review Board Statement
Informed Consent Statement
Data Availability Statement
Acknowledgments
Conflicts of Interest
References
- Maeso, L.; Antezana, P.E.; Arana, A.G.H.; Evelson, P.A.; Orive, G.; Desimone, M.F. Progress in the Use of Hydrogels for Antioxidant Delivery in Skin Wounds. Pharmaceutics 2024, 16, 524. [Google Scholar] [CrossRef]
- Iacopetti, I.; Perazzi, A.; Martinello, T.; Gemignani, F.; Patruno, M. Hyaluronic acid, Manuka honey and Acemannan gel: Wound-specific applications for skin lesions. Res. Vet. Sci. 2020, 129, 82–89. [Google Scholar] [CrossRef]
- Oprica, G.M.; Panaitescu, D.M.; Lixandru, B.E.; Usurelu, C.D.; Gabor, A.R.; Nicolae, C.A.; Fierascu, R.C.; Frone, A.N. Plant-Derived Nanocellulose with Antibacterial Activity for Wound Healing Dressing. Pharmaceutics 2023, 15, 2672. [Google Scholar] [CrossRef]
- Lai, J.N.; Azad, A.; Sulaiman, W.M.A.W.; Kumarasamy, V.; Subramaniyan, V.; Alshehade, S.A. Alginate-Based Encapsulation Fabrication Technique for Drug Delivery: An Updated Review of Particle Type, Formulation Technique, Pharmaceutical Ingredient, and Targeted Delivery System. Pharmaceutics 2024, 16, 370. [Google Scholar] [CrossRef] [PubMed]
- Zhang, Q.; Huang, Z.; Jiang, H.; Wu, M.; Dong, Z.; Chen, C.; Chen, F.; Zhao, G.; Ma, P. “Bamboo-like” strong and tough sodium alginate/polyacrylate hydrogel fiber with directional controlled release for wound healing promotion. Carbohydr. Polym. 2025, 347, 122761. [Google Scholar] [CrossRef] [PubMed]
- Duceac, I.A.; Verestiuc, L.; Dimitriu, C.D.; Maier, V.; Coseri, S. Design and Preparation of New Multifunctional Hydrogels Based on Chitosan/Acrylic Polymers for Drug Delivery and Wound Dressing Applications. Polymers 2020, 12, 1473. [Google Scholar] [CrossRef]
- Albuquerque, P.B.S.; de Oliveira, W.F.; Dos Santos Silva, P.M.; Dos Santos Correia, M.T.; Kennedy, J.F.; Coelho, L. Skincare application of medicinal plant polysaccharides—A review. Carbohydr. Polym. 2022, 277, 118824. [Google Scholar] [CrossRef]
- Stavarache, C.; Garea, S.A.; Ghebaur, A.; Iovu, H. K-Carrageenan/Sodium Alginate Interpenetrating Network Beads for the Incorporation of Ketoprofen as a Potential Drug Delivery System. UPB Sci. Bull. Ser. B 2023, 85, 45–62. [Google Scholar]
- Rizi, E.M.; Ebrahimian-Hosseinabadi, M.; Kharazi, A.Z. Royal jelly-enriched alginate/gelatin hydrogel film for effective treatment of chronic skin wounds. Mater. Today Commun. 2025, 46, 112859. [Google Scholar] [CrossRef]
- Motelica, L.; Ficai, D.; Oprea, O.C.; Ficai, A.; Ene, V.L.; Vasile, B.S.; Andronescu, E.; Holban, A.M. Antibacterial Biodegradable Films Based on Alginate with Silver Nanoparticles and Lemongrass Essential Oil-Innovative Packaging for Cheese. Nanomaterials 2021, 11, 2377. [Google Scholar] [CrossRef]
- Alven, S.; Aderibigbe, B.A. Chitosan and Cellulose-Based Hydrogels for Wound Management. Int. J. Mol. Sci. 2020, 21, 9656. [Google Scholar] [CrossRef] [PubMed]
- Golmohammadi, R.; Peerayeh, S.; Moghadam, T.; Hosseini, S. Synergistic Antibacterial Activity and Wound Healing Properties of Selenium-Chitosan-Mupirocin Nanohybrid System: An in Vivo Study on Rat Diabetic Staphylococcus aureus Wound Infection Model. Sci. Rep. 2020, 10, 2854. [Google Scholar] [CrossRef] [PubMed]
- Andjic, M.; Bradic, J.; Kocovic, A.; Simic, M.; Krstonosic, V.; Capo, I.; Jakovljevic, V.; Lazarevic, N. Immortelle Essential-Oil-Enriched Hydrogel for Diabetic Wound Repair: Development, Characterization, and In Vivo Efficacy Assessment. Pharmaceutics 2024, 16, 1309. [Google Scholar] [CrossRef] [PubMed]
- Rybka, M.; Mazurek, Ł.; Konop, M. Beneficial Effect of Wound Dressings Containing Silver and Silver Nanoparticles in Wound Healing-From Experimental Studies to Clinical Practice. Life 2022, 13, 69. [Google Scholar] [CrossRef]
- Sabira, O.; Drisya, N.; Ajaykumar, A.P.; Mathew, A.; Jayaraj, K.N.; Binitha, V.S.; Zeena, K.V.; Roy, K.B.; Janish, P.A.; Sheena, P.; et al. From Ficus recemosa Leaf Galls to Therapeutic Silver Nanoparticles: Antibacterial and Anticancer Applications. Pharmaceutics 2024, 16, 1025. [Google Scholar] [CrossRef]
- Nandhini, S.N.; Sisubalan, N.; Vijayan, A.; Karthikeyan, C.; Gnanaraj, M.; Gideon, D.A.M.; Jebastin, T.; Varaprasad, K.; Sadiku, R. Recent advances in green synthesized nanoparticles for bactericidal and wound healing applications. Heliyon 2023, 9, e13128. [Google Scholar] [CrossRef]
- Eid, N.; Yosri, N.; El-Seedi, H.R.; Awad, H.M.; Emam, H.E. Ag@Sidr honey nanocomposite: Chemical profiles, antioxidant and microbicide procurator. Biocatal. Agric. Biotechnol. 2023, 51, 102788. [Google Scholar] [CrossRef]
- Salvo, J.; Sandoval, C.; Schencke, C.; Acevedo, F.; del Sol, M. Healing Effect of a Nano-Functionalized Medical-Grade Honey for the Treatment of Infected Wounds. Pharmaceutics 2023, 15, 2187. [Google Scholar] [CrossRef]
- Ewunkem, A.; Johnson, N.; Beard, A.l.; Tshimanga, I.; Justice, B.; Meixner, J. Synthesis of Silver Nanoparticles from Honeybees and Its Antibacterial Potential. Open J. Med. Microbiol. 2024, 14, 77–92. [Google Scholar] [CrossRef]
- Orsolic, N.; Jembrek, M.J. Royal Jelly: Biological Action and Health Benefits. Int. J. Mol. Sci. 2024, 25, 6023. [Google Scholar] [CrossRef]
- Viteri, R.; Zacconi, F.; Montenegro, G.; Giordano, A. Bioactive compounds in Apis mellifera monofloral honeys. J. Food Sci. 2021, 86, 1552–1582. [Google Scholar] [CrossRef]
- Martinello, M.; Mutinelli, F. Antioxidant Activity in Bee Products: A Review. Antioxidants 2021, 10, 71. [Google Scholar] [CrossRef] [PubMed]
- Alarjani, K.M.; Yehia, H.M.; Badr, A.N.; Ali, H.S.; Al-Masoud, A.H.; Alhaqbani, S.M.; Alkhatib, S.A.; Rady, A.M. Anti-MRSA and Biological Activities of Propolis Concentrations Loaded to Chitosan Nanoemulsion for Pharmaceutics Applications. Pharmaceutics 2023, 15, 2386. [Google Scholar] [CrossRef] [PubMed]
- El-Sakhawy, M.; Salama, A.; Tohamy, H.S. Applications of propolis-based materials in wound healing. Arch. Dermatol. Res. 2023, 316, 61. [Google Scholar] [CrossRef] [PubMed]
- Guo, J.; Wang, Z.; Chen, Y.; Cao, J.; Tian, W.; Ma, B.; Dong, Y. Active components and biological functions of royal jelly. J. Funct. Foods 2021, 82, 104514. [Google Scholar] [CrossRef]
- Al-Hatamleh, M.A.I.; Alshaer, W.; Hatmal, M.M.; Lambuk, L.; Ahmed, N.; Mustafa, M.Z.; Low, S.C.; Jaafar, J.; Ferji, K.; Six, J.L.; et al. Applications of Alginate-Based Nanomaterials in Enhancing the Therapeutic Effects of Bee Products. Front. Mol. Biosci. 2022, 9, 865833. [Google Scholar] [CrossRef]
- Khan, K.; Malik, K.; Ahmad, M.; Qureshi, R.; Aziz, M.A.; Gul, S.; Al-Qahtani, W.H.; Khan, R. Diversity of melliferous Flora (Apiaries) in Honey and microscopic authentication using LM and SEM Techniques. Flora 2024, 312, 152477. [Google Scholar] [CrossRef]
- Motelica, L.; Ficai, D.; Ficai, A.; Trusca, R.D.; Ilie, C.I.; Oprea, O.C.; Andronescu, E. Innovative Antimicrobial Chitosan/ZnO/Ag NPs/Citronella Essential Oil Nanocomposite—Potential Coating for Grapes. Foods 2020, 9, 1801. [Google Scholar] [CrossRef]
- Cárdenas-Escudero, J.; Galán-Madruga, D.; Cáceres, J.O. FTIR-ATR detection method for emerging C3-plants-derivated adulterants in honey: Beet, dates, and carob syrups. Talanta 2023, 265, 124768. [Google Scholar] [CrossRef]
- Lacatusu, I.; Badea, N.; Murariu, A.; Oprea, O.; Bojin, D.; Meghea, A. Antioxidant Activity of Solid Lipid Nanoparticles Loaded with Umbelliferone. Soft Mater. 2013, 11, 75–84. [Google Scholar] [CrossRef]
- Liu, F.; Liu, Y.C.; Guo, Y.L.; Liu, J.R.; Dong, J.W.; Wang, T.B.; Hao, D.; Zhang, Y.Q. FTIR determination of the degree of molar substitution for hydroxypropyl chitosan. Carbohyd. Polym. 2024, 339, 122229. [Google Scholar] [CrossRef]
- Hong, T.; Yin, J.Y.; Nie, S.P.; Xie, M.Y. Applications of infrared spectroscopy in polysaccharide structural analysis: Progress, challenge and perspective. Food Chem. X 2021, 12, 100168. [Google Scholar] [CrossRef]
- Chen, D.; Guo, C.; Lu, W.; Zhang, C.; Xiao, C. Rapid quantification of royal jelly quality by mid-infrared spectroscopy coupled with backpropagation neural network. Food Chem. 2023, 418, 135996. [Google Scholar] [CrossRef]
- Hashemirad, F.-S.; Behfar, M.; Kavoosi, G. Proximate composition, physico-chemical, techno-functional, amino acid profile, fatty acid profile, nutritional quality, antioxidant, anti-amylase and anti-lipase properties of bee bread, royal jelly, and bee propolis. LWT 2024, 200, 116190. [Google Scholar] [CrossRef]
- Borah, R.; Ninakanti, R.; Bals, S.; Verbruggen, S.W. Plasmon resonance of gold and silver nanoparticle arrays in the Kretschmann (attenuated total reflectance) vs. direct incidence configuration. Sci. Rep. 2022, 12, 15738. [Google Scholar] [CrossRef] [PubMed]
- Wiley, B.J.; Im, S.H.; Li, Z.Y.; McLellan, J.; Siekkinen, A.; Xia, Y.N. Maneuvering the surface plasmon resonance of silver nanostructures through shape-controlled synthesis. J. Phys. Chem. B 2006, 110, 15666–15675. [Google Scholar] [CrossRef] [PubMed]
- Alzoubi, F.Y.; Ahmad, A.A.; Aljarrah, I.A.; Migdadi, A.B.; Al-Bataineh, Q.M. Localize surface plasmon resonance of silver nanoparticles using Mie theory. J. Mater. Sci. Mater. Electron. 2023, 34, 2128. [Google Scholar] [CrossRef]
- Amirjani, A.; Firouzi, F.; Haghshenas, D.F. Predicting the Size of Silver Nanoparticles from Their Optical Properties. Plasmonics 2020, 15, 1077–1082. [Google Scholar] [CrossRef]
- Motelica, L.; Ficai, D.; Petrisor, G.; Oprea, O.C.; Trusca, R.D.; Ficai, A.; Andronescu, E.; Hudita, A.; Holban, A.M. Antimicrobial Hydroxyethyl-Cellulose-Based Composite Films with Zinc Oxide and Mesoporous Silica Loaded with Cinnamon Essential Oil. Pharmaceutics 2024, 16, 1225. [Google Scholar] [CrossRef]
- Motelica, L.; Ficai, D.; Oprea, O.; Ficai, A.; Trusca, R.D.; Andronescu, E.; Holban, A.M. Biodegradable Alginate Films with ZnO Nanoparticles and Citronella Essential Oil—A Novel Antimicrobial Structure. Pharmaceutics 2021, 13, 1020. [Google Scholar] [CrossRef]
- Luo, J.D.; Xie, Z.L.; Lam, J.W.Y.; Cheng, L.; Chen, H.Y.; Qiu, C.F.; Kwok, H.S.; Zhan, X.W.; Liu, Y.Q.; Zhu, D.B.; et al. Aggregation-induced emission of 1-methyl-1,2,3,4,5-pentaphenylsilole. Chem. Commun. 2001, 18, 1740–1741. [Google Scholar] [CrossRef]
- Zhang, H.K.; Tang, B. Through-Space Interactions in Clusteroluminescence. JACS Au 2021, 1, 1805–1814. [Google Scholar] [CrossRef] [PubMed]
- Yuan, W.Z.; Zhang, Y.M. Nonconventional Macromolecular Luminogens with Aggregation-Induced Emission Characteristics. J. Polym. Sci. Polym. Chem. 2017, 55, 560–574. [Google Scholar] [CrossRef]
- Gong, Y.Y.; Tan, Y.Q.; Mei, J.; Zhang, Y.R.; Yuan, W.Z.; Zhang, Y.M.; Sun, J.Z.; Tang, B.Z. Room temperature phosphorescence from natural products: Crystallization matters. Sci. China Chem. 2013, 56, 1178–1182. [Google Scholar] [CrossRef]
- Geng, Z.G.; Zhang, H.M.; Xiong, Q.Z.; Zhang, Y.X.; Zhao, H.J.; Wang, G.Z. A fluorescent chitosan hydrogel detection platform for the sensitive and selective determination of trace mercury(II) in water. J. Mater. Chem. A 2015, 3, 19455–19460. [Google Scholar] [CrossRef]
- Dou, X.Y.; Zhou, Q.; Chen, X.H.; Tan, Y.Q.; He, X.; Lu, P.; Sui, K.Y.; Tang, B.Z.; Zhang, Y.M.; Yuan, W.Z. Clustering-Triggered Emission and Persistent Room Temperature Phosphorescence of Sodium Alginate. Biomacromolecules 2018, 19, 2014–2022. [Google Scholar] [CrossRef]
- Yu, J.Z.; Hu, N.; Hou, L.R.; Hang, F.X.; Li, K.; Xie, C.F. Effect of deacetylation of chitosan on the physicochemical, antioxidant and antibacterial properties activities of chitosan-mannose derivatives. J. Sci. Food Agric. 2023, 103, 6394–6405. [Google Scholar] [CrossRef]
- Bardajee, G.R.; Mahmoodian, H.; Amiri, B.; Atashkadi, M. Immobilization of CdTe QDs on Glucose-Imprinted Alg-g-P(AA-co-VPBA) Nanocomposite for Optical Sensing of Glucose. Langmuir 2025, 41, 9601–9617. [Google Scholar] [CrossRef]
- Dumitru, C.D.; Neacsu, I.A.; Oprea, O.C.; Motelica, L.; Voicu Balasea, B.; Ilie, C.-I.; Marinescu, F.; Ripszky, A.; Pituru, S.-M.; Andronescu, E. Biomaterials Based on Bee Products and Their Effectiveness in Soft Tissue Regeneration. Materials 2025, 18, 2689. [Google Scholar] [CrossRef]
- Iwuji, C.; Saha, H.; Ghann, W.; Dotson, D.; Bhuiya, M.A.K.; Parvez, M.S.; Jahangir, Z.M.G.S.; Rahman, M.M.; Chowdhury, F.I.; Uddin, J. Synthesis and characterization of silver nanoparticles and their promising antimicrobial effects. Chem. Phys. Impact 2024, 9, 100758. [Google Scholar] [CrossRef]
- Aldakheel, F.; Wickramasinghe, R.; Thamaraiselvan, C.; Sayed, M.; Fagir, M.; Dein, D.; Mohsen, D. Green silver nanoparticle-embedded chitosan-alginate hydrogel: A novel antibacterial approach for potential wound healing. Polym. Polym. Compos. 2025, 33, 09673911251320463. [Google Scholar] [CrossRef]
- Oe, T.; Dechojarassri, D.; Kakinoki, S.; Kawasaki, H.; Furuike, T.; Tamura, H. Microwave-Assisted Incorporation of AgNP into Chitosan-Alginate Hydrogels for Antimicrobial Applications. J. Funct. Biomater. 2023, 14, 199. [Google Scholar] [CrossRef]
- Obeidat, M.; Haddad, M.A.; Ghnamat, S.A. Antimicrobial activities of seasonally collected bee products: Honey, propolis, royal jelly, venom, and mellitin. Braz. J. Biol. 2024, 84, e286731. [Google Scholar] [CrossRef]
- Yanovska, A.; Husak, Y.; Korniienko, V.; Viktoriia, H.; Mishchenko, O.; Banasiuk, R.; Radwan-Pragłowska, J.; Piatkowski, M.; Janus, Ł.; Maksym, P. Development, characterization and antimicrobial properties of silver nanoparticles loaded chitosan-alginate sponges for biomedical application. J. Mater. Res. 2021, 36, 3267–3277. [Google Scholar] [CrossRef]
- Vanti, G.; Poondla, N.; Manogaran, P.; Teradal, N.; S, V.; Kaulgud, R.; Kurjogi, M. Synthesis and Characterization of Multifunctional Chitosan–Silver Nanoparticles: An In-Vitro Approach for Biomedical Applications. Pharmaceuticals 2024, 17, 1229. [Google Scholar] [CrossRef] [PubMed]
- Nalbantsoy, A.; Varol, E.; Çaglar, A.; Yücel, B. Cytotoxic and apoptotic effectiveness of Cypriot honeybee (Apis mellifera cypria) venom on various cancer cells. Turk. J. Biochem. 2024, 49, 446–454. [Google Scholar] [CrossRef]
- Bonamigo, T.; Campos, J.F.; Alfredo, T.M.; Balestieri, J.B.; Cardoso, C.A.; Paredes-Gamero, E.J.; de Picoli Souza, K.; Dos Santos, E.L. Antioxidant, Cytotoxic, and Toxic Activities of Propolis from Two Native Bees in Brazil: Scaptotrigona depilis and Melipona quadrifasciata anthidioides. Oxidative Med. Cell. Longev. 2017, 2017, 1038153. [Google Scholar] [CrossRef] [PubMed]
- Sharma, J.N.; Al-Omran, A.; Parvathy, S.S. Role of nitric oxide in inflammatory diseases. Inflammopharmacology 2007, 15, 252–259. [Google Scholar] [CrossRef]
- Pahlavani, N.; Malekahmadi, M.; Firouzi, S.; Rostami, D.; Alireza, S.; Bagheri Moghadam, A.; Ferns, G.; Navashenaq, J.; Rezvani, R.; Safarian, M.; et al. Molecular and cellular mechanisms of the effects of Propolis in inflammation, oxidative stress and glycemic control in chronic diseases. Nutr. Metab. 2020, 17, 65. [Google Scholar] [CrossRef]
- Kurek-Górecka, A.; Górecki, M.; Rzepecka-Stojko, A.; Balwierz, R.; Stojko, J. Bee Products in Dermatology and Skin Care. Molecules 2020, 25, 556. [Google Scholar] [CrossRef]
- Zuo, W.; Wei, K.; Zhang, X.; Wang, D.; Gong, H.; Zhang, Y.; Wang, H. A Multifunctional Nanozyme Hydrogel with Antibacterial, Antioxidative, and Photo-Induced Nitric Oxide-Supplying Properties for Promoting Infected Wound Healing. Pharmaceutics 2024, 16, 1624. [Google Scholar] [CrossRef]
- Man, M.Q.; Wakefield, J.S.; Mauro, T.M.; Elias, P.M. Regulatory Role of Nitric Oxide in Cutaneous Inflammation. Inflammation 2022, 45, 949–964. [Google Scholar] [CrossRef] [PubMed]
- Liang, H.; He, X.; Li, X.; Semiruomi, D.; Yan, F. Effect of Royal Gel addition to chitosan matrix for wound dress applications: Fabrication, characterization and artificial neural network analysis. Environ. Technol. Innov. 2023, 30, 103077. [Google Scholar] [CrossRef]
- Choudhary, P.; Tushir, S.; Bala, M.; Sharma, S.; Sangha, M.; Rani, H.; Yewle, N.; Kumar, P.; Singla, D.; Chandran, D.; et al. Exploring the Potential of Bee-Derived Antioxidants for Maintaining Oral Hygiene and Dental Health: A Comprehensive Review. Antioxidants 2023, 12, 1452. [Google Scholar] [CrossRef] [PubMed]
- Lesmana, R.; Zulhendri, F.; Fearnley, J.; Irsyam, I.A.; Rasyid, R.P.H.N.; Abidin, T.; Abdulah, R.; Suwantika, A.; Paradkar, A.; Budiman, A.S.; et al. The Suitability of Propolis as a Bioactive Component of Biomaterials. Front. Pharmacol. 2022, 13, 930515. [Google Scholar] [CrossRef]
- Zara, S.; Fioravanti, G.; Ciuffreda, A.; Annicchiarico, C.; Quaresima, R.; Mastrangelo, F. Evaluation of Human Gingival Fibroblasts (HGFs) Behavior on Innovative Laser Colored Titanium Surfaces. Materials 2023, 16, 4530. [Google Scholar] [CrossRef]
- Ghasemi, M.; Turnbull, T.; Sebastian, S.; Kempson, I. The MTT Assay: Utility, Limitations, Pitfalls, and Interpretation in Bulk and Single-Cell Analysis. Int. J. Mol. Sci. 2021, 22, 12827. [Google Scholar] [CrossRef]
- Froelich, A.; Jakubowska, E.; Wojtyłko, M.; Jadach, B.; Gackowski, M.; Gadziński, P.; Napierała, O.; Ravliv, Y.; Osmałek, T. Alginate-Based Materials Loaded with Nanoparticles in Wound Healing. Pharmaceutics 2023, 15, 1142. [Google Scholar] [CrossRef]
- CLSI Supplemenent M100; Performance Standards for Antimicrobial Susceptibility Testing. Clinical and Laboratory Standards Institute: Malvern, PA, USA, 2021; Volume 41, p. 352.
- Motelica, L.; Vasile, B.-S.; Ficai, A.; Surdu, V.-A.; Ficai, D.; Oprea, O.C.; Andronescu, E.; Mustățea, G.; Ungureanu, E.L.; Dobre, A.A. Antibacterial activity of zinc oxide nanoparticles loaded with essential oils. Pharmaceutics 2023, 15, 2470. [Google Scholar] [CrossRef]


| Sample | T1% | T5% | T10% | Mass Loss RT–115 °C | Mass Loss 115–460 °C | Mass Loss 460–720 °C |
|---|---|---|---|---|---|---|
| A | 50.1 °C | 94.6 °C | 156.7 °C | 6.94% | 53.18% | 21.65% |
| AAg | 45.8 °C | 95.0 °C | 163.9 °C | 6.73% | 52.00% | 27.09% |
| AH | 60.7 °C | 100.9 °C | 134.6 °C | 6.93% | 55.50% | 23.41% |
| AHAg | 92.6 °C | 134.3 °C | 162.4 °C | 2.68% | 56.07% | 24.22% |
| AP | 48.1 °C | 87.8 °C | 142.5 °C | 7.81% | 53.22% | 23.81% |
| APAg | 57.3 °C | 98.8 °C | 158.1 °C | 6.83% | 53.08% | 26.28% |
| ARj | 46.1 °C | 87.6 °C | 144.1 °C | 7.67% | 52.89% | 21.27% |
| ARjAg | 51.4 °C | 100.2 °C | 159.7 °C | 6.36% | 54.00% | 22.77% |
| AM | 95.3 °C | 132.4 °C | 152.7 °C | 2.03% | 59.92% | 15.25% |
| AMAg | 80.4 °C | 132.1 °C | 163.9 °C | 3.09% | 56.45% | 11.01% |
| Sample | Alginate | Honey | Propolis | Royal Jelly | AgNP (mL) | Chitosan | Glycerol |
|---|---|---|---|---|---|---|---|
| AAg | 1 g | 2 mL | 0.4 g | 0.1 g | |||
| AHAg | 1 g | 3.5 g | 2 mL | 0.4 g | 0.1 g | ||
| APAg | 1 g | 2 mL | 2 mL | 0.4 g | 0.1 g | ||
| ARjAg | 1 g | 0.5 g | 2 mL | 0.4 g | 0.1 g | ||
| AMAg | 1 g | 3.5 g | 2 mL | 0.5 g | 2 mL | 0.4 g | 0.1 g |
Disclaimer/Publisher’s Note: The statements, opinions and data contained in all publications are solely those of the individual author(s) and contributor(s) and not of MDPI and/or the editor(s). MDPI and/or the editor(s) disclaim responsibility for any injury to people or property resulting from any ideas, methods, instructions or products referred to in the content. |
© 2025 by the authors. Licensee MDPI, Basel, Switzerland. This article is an open access article distributed under the terms and conditions of the Creative Commons Attribution (CC BY) license (https://creativecommons.org/licenses/by/4.0/).
Share and Cite
Dumitru, C.D.; Ilie, C.-I.; Neacsu, I.A.; Motelica, L.; Oprea, O.C.; Ripszky, A.; Pițuru, S.M.; Voicu Bălașea, B.; Marinescu, F.; Andronescu, E. Antimicrobial Composite Films Based on Alginate–Chitosan with Honey, Propolis, Royal Jelly and Green-Synthesized Silver Nanoparticles. Int. J. Mol. Sci. 2025, 26, 6809. https://doi.org/10.3390/ijms26146809
Dumitru CD, Ilie C-I, Neacsu IA, Motelica L, Oprea OC, Ripszky A, Pițuru SM, Voicu Bălașea B, Marinescu F, Andronescu E. Antimicrobial Composite Films Based on Alginate–Chitosan with Honey, Propolis, Royal Jelly and Green-Synthesized Silver Nanoparticles. International Journal of Molecular Sciences. 2025; 26(14):6809. https://doi.org/10.3390/ijms26146809
Chicago/Turabian StyleDumitru, Corina Dana, Cornelia-Ioana Ilie, Ionela Andreea Neacsu, Ludmila Motelica, Ovidiu Cristian Oprea, Alexandra Ripszky, Silviu Mirel Pițuru, Bianca Voicu Bălașea, Florica Marinescu, and Ecaterina Andronescu. 2025. "Antimicrobial Composite Films Based on Alginate–Chitosan with Honey, Propolis, Royal Jelly and Green-Synthesized Silver Nanoparticles" International Journal of Molecular Sciences 26, no. 14: 6809. https://doi.org/10.3390/ijms26146809
APA StyleDumitru, C. D., Ilie, C.-I., Neacsu, I. A., Motelica, L., Oprea, O. C., Ripszky, A., Pițuru, S. M., Voicu Bălașea, B., Marinescu, F., & Andronescu, E. (2025). Antimicrobial Composite Films Based on Alginate–Chitosan with Honey, Propolis, Royal Jelly and Green-Synthesized Silver Nanoparticles. International Journal of Molecular Sciences, 26(14), 6809. https://doi.org/10.3390/ijms26146809