Article

Impact of SOD1 Transcript Variants on Amyotrophic Lateral Sclerosis Severity

1
Cellular Models and Neuroepigenetics Section, IRCCS Mondino Foundation, Via Mondino 2, 27100 Pavia, Italy
2
Department of Brain and Behavioral Sciences, University of Pavia, Via Agostino Bassi 21, 27100 Pavia, Italy
3
Molecular Biology and Transcriptomics Section, IRCCS Mondino Foundation, Via Mondino 2, 27100 Pavia, Italy
4
Department of Biology and Biotechnology “L. Spallanzani”, University of Pavia, Via Adolfo Ferrata 9, 27100 Pavia, Italy
5
Golgi Cenci Foundation, Corso S. Martino 10, 20081 Abbiategrasso, Italy
6
Neuroncology and Neuroinflammation Unit, IRCCS Mondino Foundation, Via Mondino 2, 27100 Pavia, Italy
*
Author to whom correspondence should be addressed.
These authors contributed equally to this work and share first authorship.
Int. J. Mol. Sci. 2025, 26(14), 6788; https://doi.org/10.3390/ijms26146788
Submission received: 15 May 2025 / Revised: 10 July 2025 / Accepted: 10 July 2025 / Published: 15 July 2025
(This article belongs to the Special Issue Amyotrophic Lateral Sclerosis: From Molecular Basis to Therapies)

Abstract

Amyotrophic lateral sclerosis (ALS) is an incurable neurodegenerative disease that affects motor neurons of people, leading to death. This pathology can be caused by mutations in different genes, including superoxide dismutase 1 (SOD1). Previous studies have pointed out the presence of two transcripts of SOD1, a short one and a long one. The aim of this study was the investigation of these two transcripts both in the SH-SY5Y cell line and in patients’ peripheral blood mononuclear cells. We found that the shortest SOD1 transcript is upregulated under stress conditions in both the cellular model and the patients’ cells. Moreover, we found a potential correlation between the short SOD1 transcript and the severity of the pathology, which also correlates with the age of patients. No correlation was found between SOD1 transcripts and the progression of the disease. These data suggest a toxic effect of short SOD1 transcripts in ALS patients, by affecting the severity of the pathology making it a possible biomarker for this disease. Interestingly, our data suggest that a short SOD1 transcript does not influence and drive disease progression. The finding of a biomarker will have suitable implications as indicators of disease severity and from the perspective of drug development.

1. Introduction

Amyotrophic lateral sclerosis (ALS) (OMIM ID: 105400) is a fatal and progressive neurodegenerative disease that damages motor neurons. It is considered a rare disease since about 2 people in 100,000 are affected [1]. The pathology causes the death of upper and lower motor neurons in the motor cortex, brainstem, and spinal cord, leading to death usually by respiratory failure [2]. Traditionally, ALS has been divided into a ‘sporadic’ form (sALS), which represent 90% of cases, and a ‘familial’ form, 10% of cases, and there is evidence of mutations in apparently sporadic cases [3]. More than 30 genes have been implicated in genetic forms of ALS, but the most common mutated genes are C9ORF72, superoxide dismutase 1 (SOD1), TARDBP, and FUS [4,5].
The pathogenic mechanism that leads to motor neuron degeneration in ALS is not completely clear. Several cellular and molecular processes have been found to be implicated, e.g., mitochondrial dysfunction, toxic protein aggregation, impaired protein degradation, prion-like spreading, excitotoxicity, oxidative stress (OS), RNA metabolism defects, and RNA toxicity [6].
In 1993, Rosen and colleagues linked for the first time mutations in SOD1 to ALS [7]. SOD1 was the first ALS gene identified, and it is present in approximately 8–23% of familial ALS and 1–4% of sALS cases [8]. Familial ALS cases associated with SOD1 mutations are designated as ALS1 [9]. The gene is formed of five exons and four intronic regions and possesses several poly(A) signal sequences on the 3′ end [7,10].
More than 200 disease-associated SOD1 mutations, most of which are missense, have been identified, and they can be found virtually in every region of the 153-amino acid SOD1 polypeptide [11]. Moreover, there is a huge phenotypic heterogeneity amongst patients with the same mutation, indicating that epigenetic and environmental factors could influence disease expression [12,13].
Mutations usually lead to low enzyme activity, OS, since the enzyme is normally involved in reactive oxygen species elimination, endoplasmic reticulum, and mitochondrial dysfunction [12,14]. Like other genes involved in ALS pathology, mutated SOD1 is associated with protein re-localization and aggregation [15,16]. Furthermore, a prion-like spreading of SOD1 was repeatedly demonstrated [17,18,19]. Curiously, SOD1-linked ALS lacks TDP43 inclusions, considered a hallmark for most ALS cases [20,21].
In 1984, Sherman and colleagues identified for the first time two different SOD1 transcripts that differ in their polyadenylation signals at 3′UTR: one mRNA of 0.7 kb is approximately four time more abundant than the other one of 0.9 kb [11,12]. Moreover, it was demonstrated that the 3′UTR region of the 0.9 kb SOD1 transcript presents five adenylate/urydilate-rich elements, which can act as binding sites for proteins, stabilizing the transcript [13,14]. Adenylate/urydilate-rich elements bind transcription factors such as ELAVL4 (HuD), a member of the ELAVL family, required for neuronal differentiation and strongly associated with neurodegenerative diseases [15]. Precedent studies have also demonstrated an involvement of HuD in ALS pathogenesis, inasmuch as it interacts with mRNAs of FUS [16]. Thus, the aim of this work was the investigation of the biological role of both short (0.7 kb) and long (0.9 kb) transcripts of SOD1. We evaluated the level of these two variants in both sALS patients and in cellular models and their possible effects. Finally, we correlate their levels with several patients’ characteristics.

2. Results

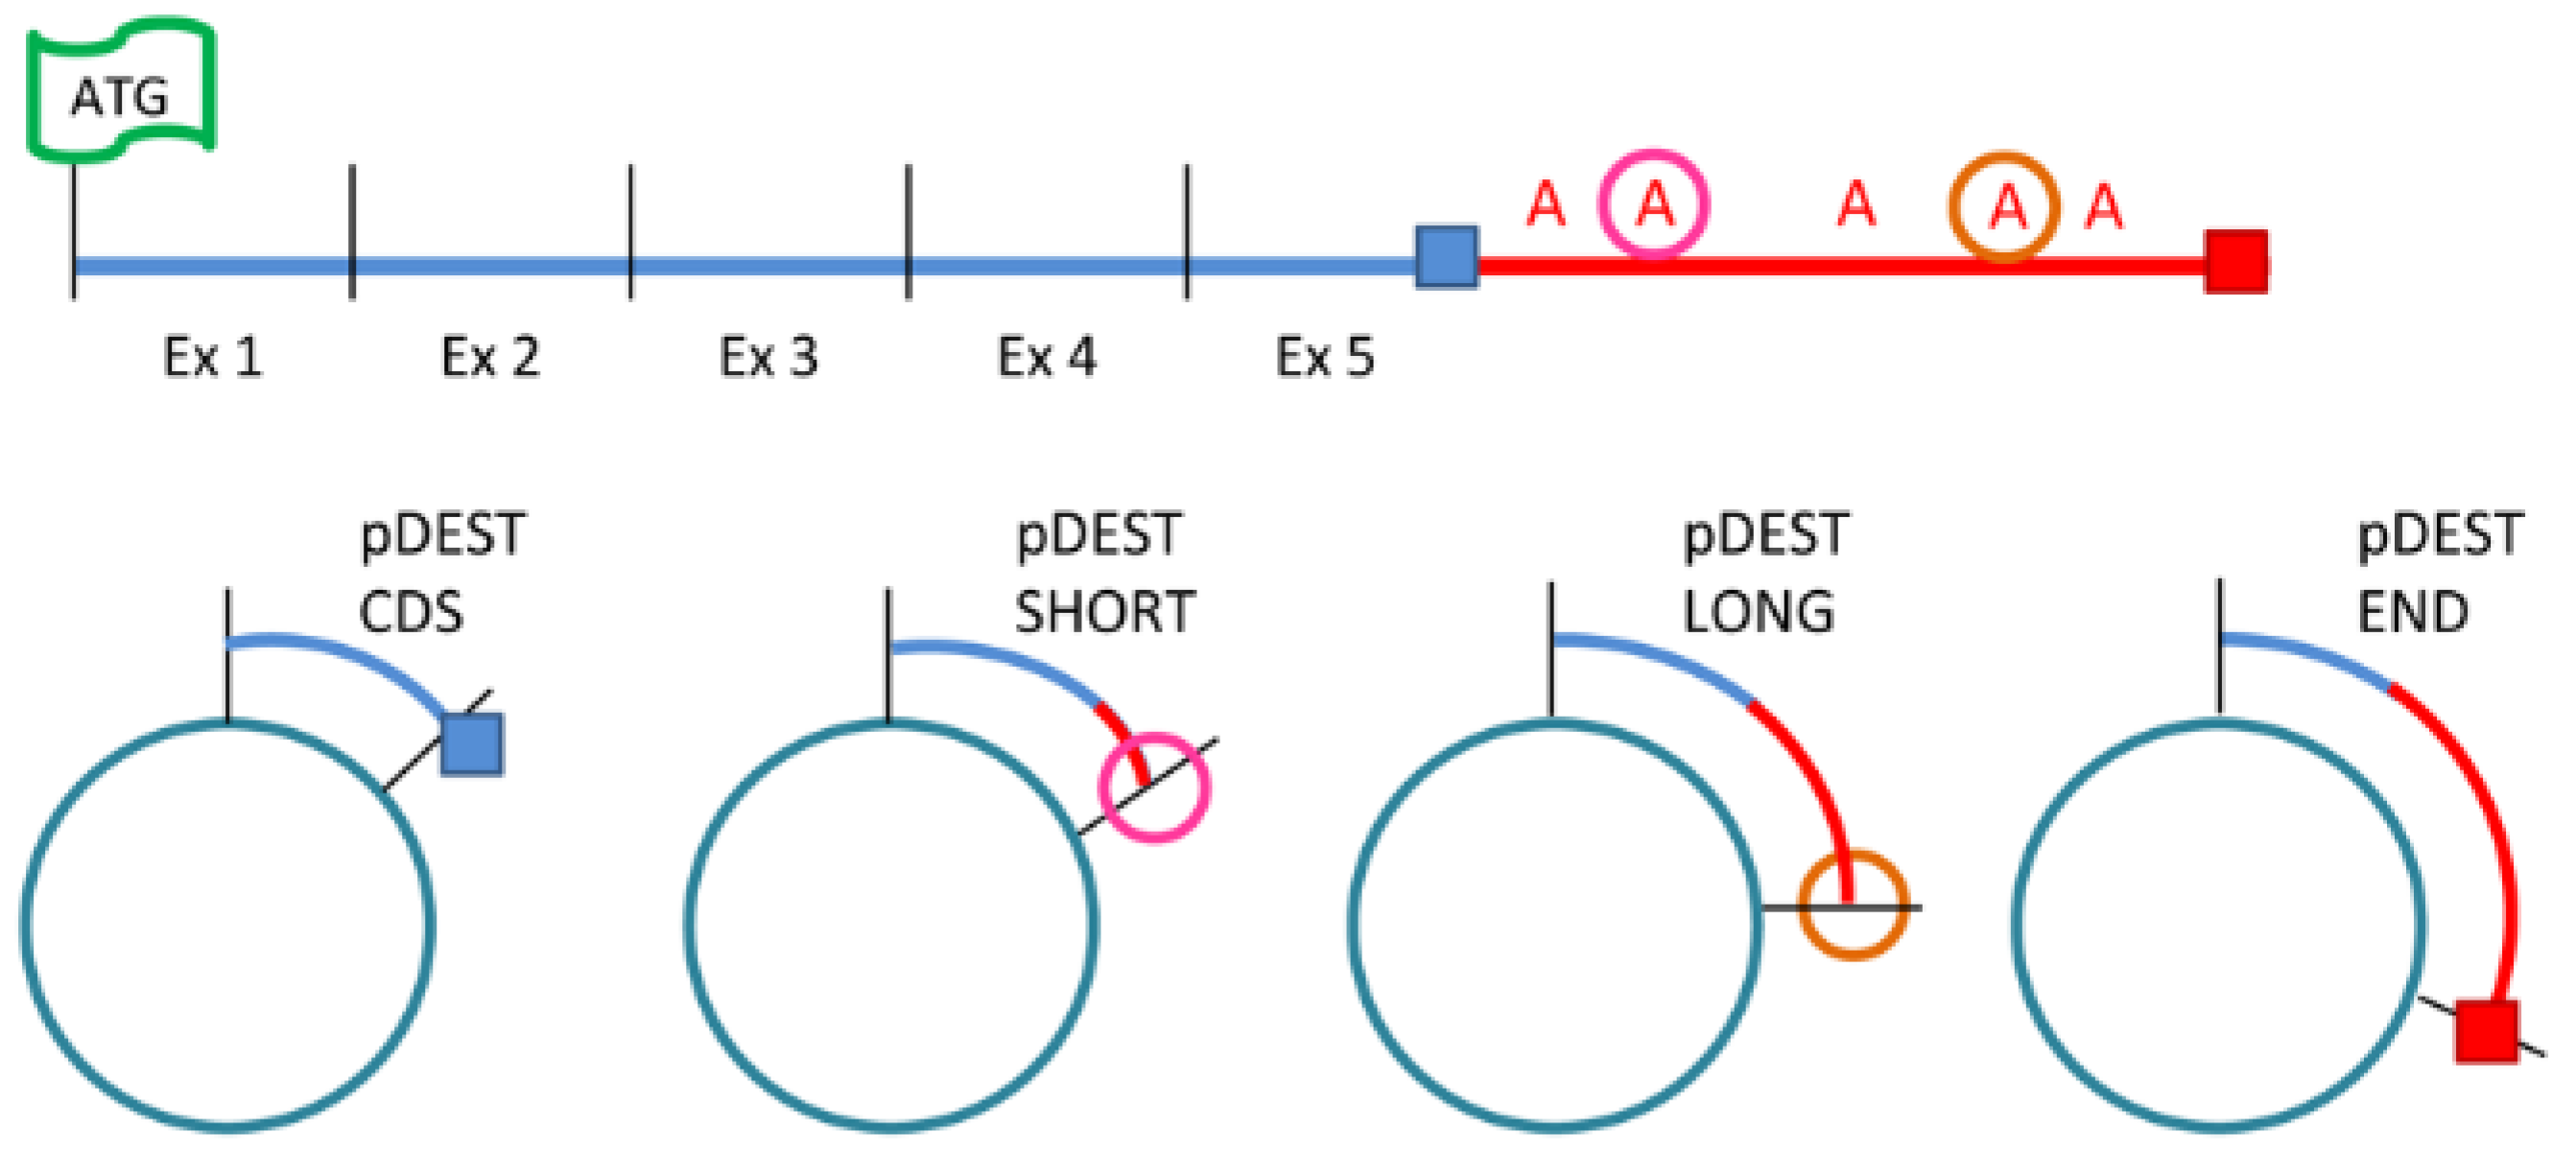
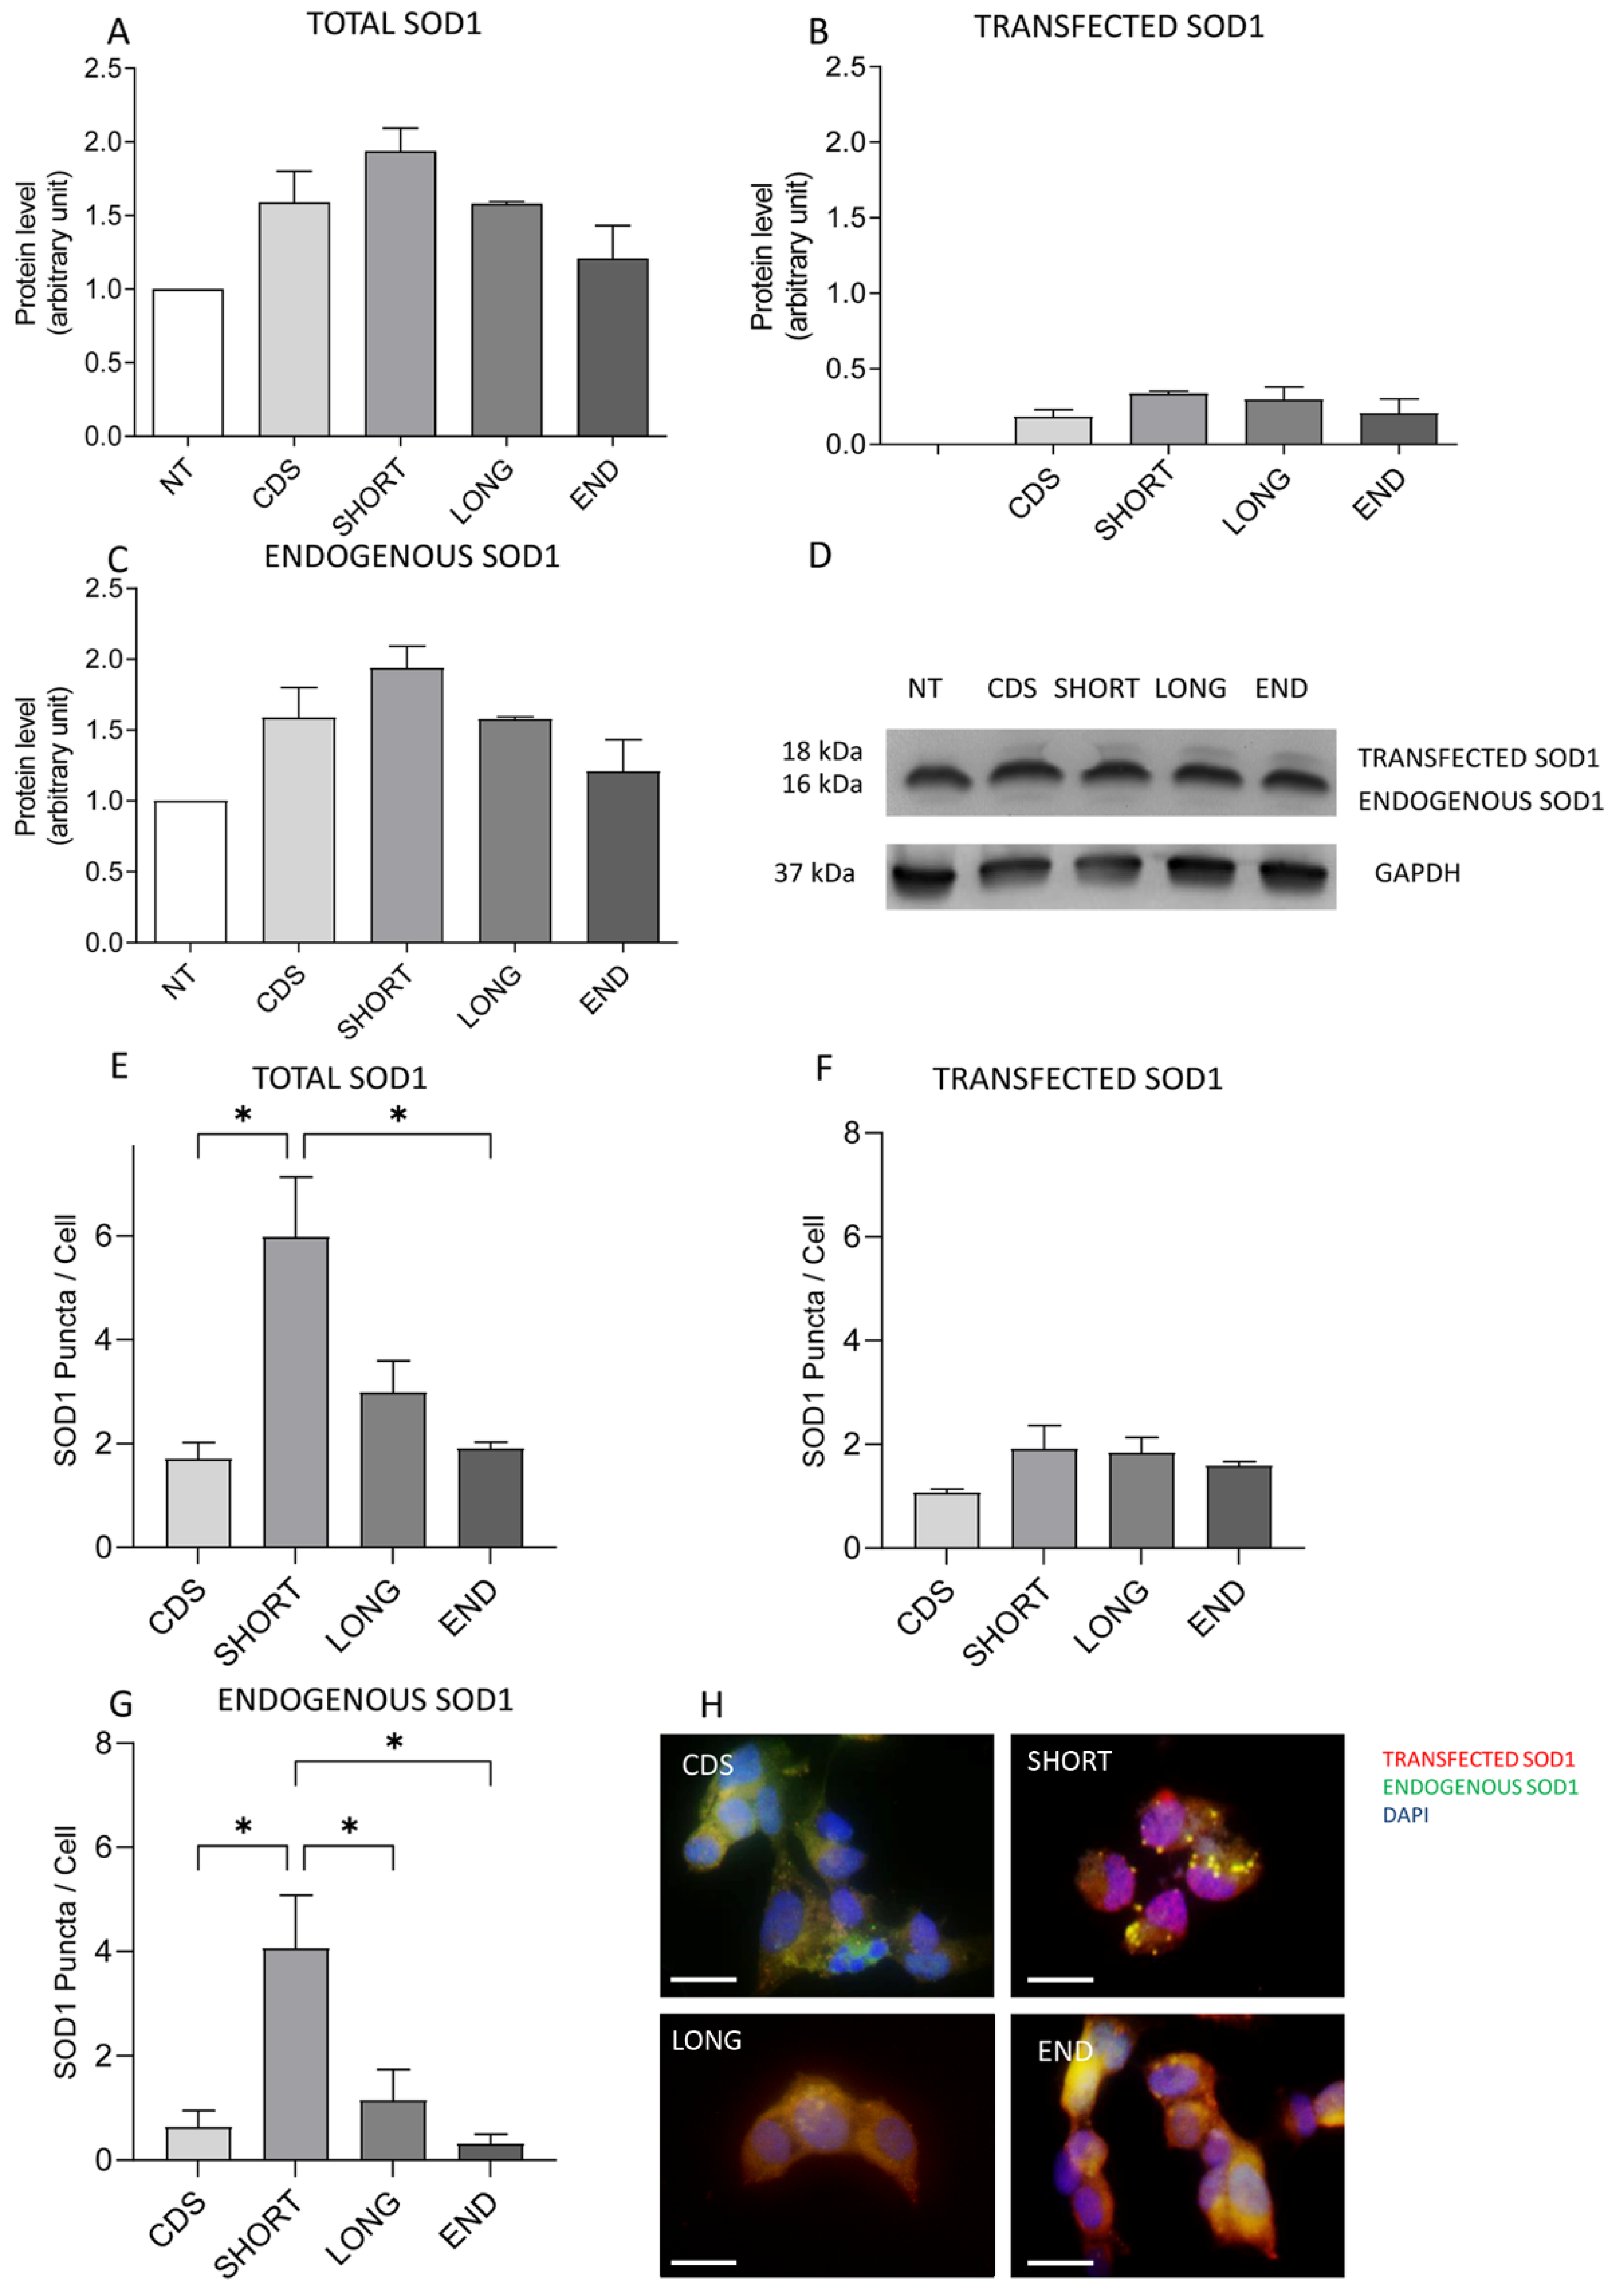
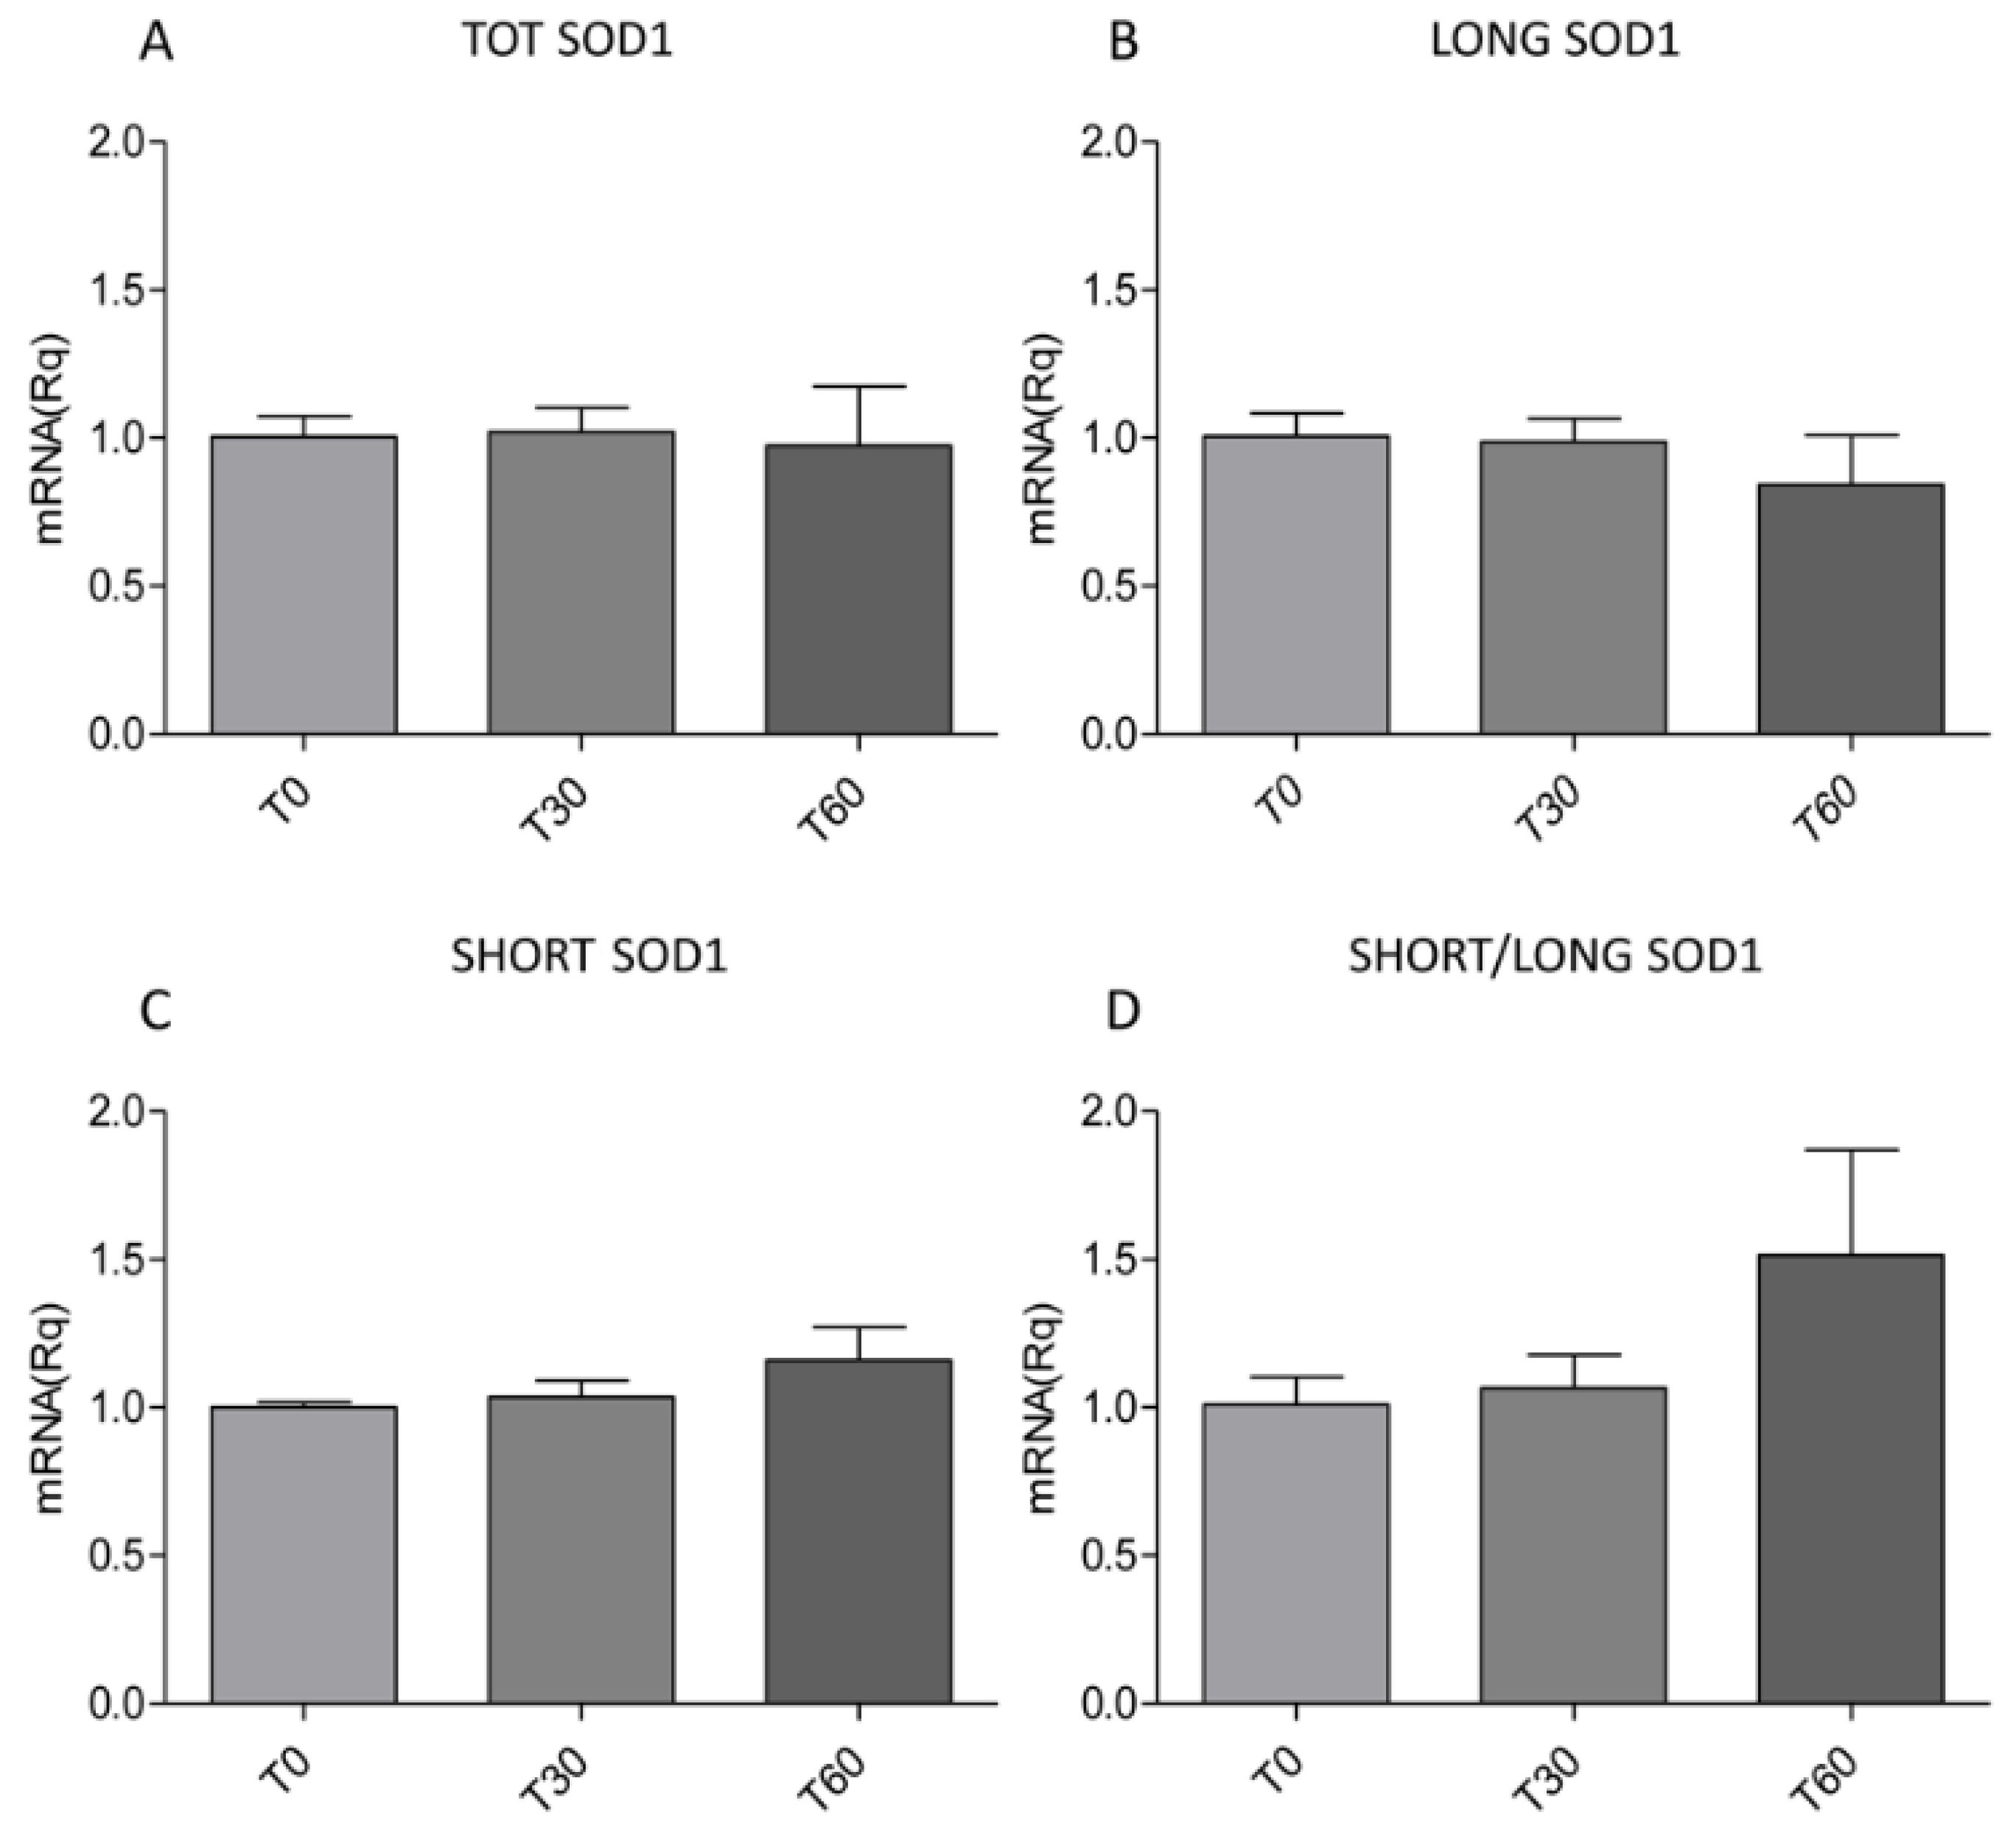
2.1. Oxidative Stress Induces the Overexpression of SHORT SOD1 Transcript Leading to the Increase and Aggregation of TOT SOD1

Two SOD1 transcripts differing in the length of their 3′UTRs, 0.7 kb and 0.9 kb, were first described by Sherman in 1984 [22]. In this work, to better understand the role of these two transcripts, we cloned the long (LONG SOD1) and the short (SHORT SOD1) transcripts into pDEST30 plasmid and we generated four SOD1 plasmids fused with an N’terminal-Flag sequence (FLAG): the coding sequence only (which ends with the stop codon) (blue square, CDS SOD1), a SHORT SOD1 transcript that ends with the 2nd polyA signal (pink circle, pDEST SHORT), a LONG SOD1 transcript that terminates with the 4th polyA site (orange circle, pDEST LONG), and a SOD1 transcript containing the entire 3′UTR (terminating with the red square, END SOD1) (Figure 1).
We then transfected these plasmids into both HeLa and SH-SY5Y cells, as non-neural and neural cellular models, respectively. We confirmed the correct transfection in HeLa cells (Figure S1A,B); however, in both transfected and not-transfected (NT) HeLa cells, we did not find any differences in the expression of endogenous SOD1 (Figure S1C,D). These data were confirmed by immunofluorescence (IF) (Figure S1E–H).
Thus, we focused on the neural cellular model, i.e., SH-SY5Y cells. In a previous work, we demonstrated that SH-SY5Y cells are a good model with which to study mechanisms underlying neurodegenerative diseases. In particular, both the treatments with hydrogen peroxide (H2O2) [23,24] and the transfection with disease-related plasmids [25] mimic some features of ALS pathomechanisms. We firstly confirmed the successful transfection in SH-SY5Y cells (Figure 2A,B). Using Western blot (WB) analysis, we found an increasing trend in the expression of both total and endogenous SOD1 in SHORT SOD1 transfected cells compared to the other variants (Figure 2A,C). On the contrary, no differences were found in transfected SOD1 (Figure 2B). By IF analysis, we investigated the presence of pathological SOD1 aggregation. We found a statistically significant increase in the total SOD1 puncta in SHORT SOD1 transfected cells compared to CDS (* p = 0.0120) and to END SOD1 (* p = 0.0133) (Figure 2E). A statistically significant increase in the endogenous SOD1 puncta in SHORT SOD1 transfected cells compared to CDS (* p = 0.0215), LONG (* p = 0.0401), and END (* p = 0.0157) SOD1 was also reported (Figure 2G).
All these data suggest a role of SHORT SOD1 in SOD1 aggregation and greater specificity of the SH-SY5Y neuronal model. In particular, since we found an increase in SOD1 aggregation when we induce SHORT SOD1 protein expression, we hypothesize a toxic function of this form. To assess this hypothesis, we used 1 mM H2O2-treated SH-SY5Y cells, a well-characterized cellular model that mimics several pathological features of ALS [23,24,25]. We analyzed the levels of total SOD1 (TOT SOD1), LONG SOD1, and SHORT SOD1 (Figure 3A–C) by multiplex reverse transcription–polymerase chain reaction (RT-PCR), and we did not find any differences after OS induction (T30 and T60). Notwithstanding, when we looked at the ratio of SHORT SOD1 to LONG SOD1, we observed an interesting, but not significant, increase in this ratio after prolonged OS induction (T60) (Figure 3D).

2.2. Peripheral Blood Mononuclear Cells of sALS Patients Present an Increased Expression of SHORT SOD1

In 2016, we first reported that SH-5YSY cells treated with 1 mM H2O2 for 60 min display pathological features typical of sALS patients [24]. Here, we further proved that also transfected SH-SY5Y cells treated with H2O2 at the same concentration and for the same time are a valid ALS model. Based on this in vitro evidence, we decided to evaluate if the differences found in SH-SY5Y cells, regarding LONG and SHORT SOD1, could be detected in peripheral blood mononuclear cells (PBMCs) derived from sALS patients.
To evaluate the presence of both SHORT SOD1 and LONG SOD1 transcripts in patients, we performed a 3′ rapid amplification of cDNA ends (RACE) on PBMCs of sALS patients and healthy controls (CTRL) (Figure 4). As a positive control, we used SH-SY5Y cells exposed to OS for 60 min (T60), while GAPDH was used as a negative control. By means of 3′RACE, we confirmed the presence of SOD1 transcripts (LONG and SHORT SOD1) also in the PBMCs of sALS patients and the CTRL. In particular, sALS patients have a lower expression of LONG SOD1 and a higher expression of SHORT SOD1 (Figure 4).
Since 3′RACE is not a quantitative analysis, we also performed multiplex RT-PCR to evaluate and quantify the level of each transcript (Figure 5). We found an increase, although not significant, in the TOT SOD1 expression in sALS patients compared to in CTRL subjects (Figure 5A). When we separately analyzed the levels of LONG and SHORT SOD1, we found no change in LONG SOD1 expression (Figure 5B) and a significant increase in SHORT SOD1 (* p = 0.0429) (Figure 5C) in sALS patients. Similarly to previous results in SH-SY5Y cells after OS induction (T60), by analyzing the ratio between SHORT and LONG SOD1 values in both CTRL and sALS PBMCs, we found a non-significant increase in the SHORT to LONG SOD1 ratio in sALS patients (Figure 5D). These data further address a different role of the two SOD1 transcripts in ALS’ pathomechanism.

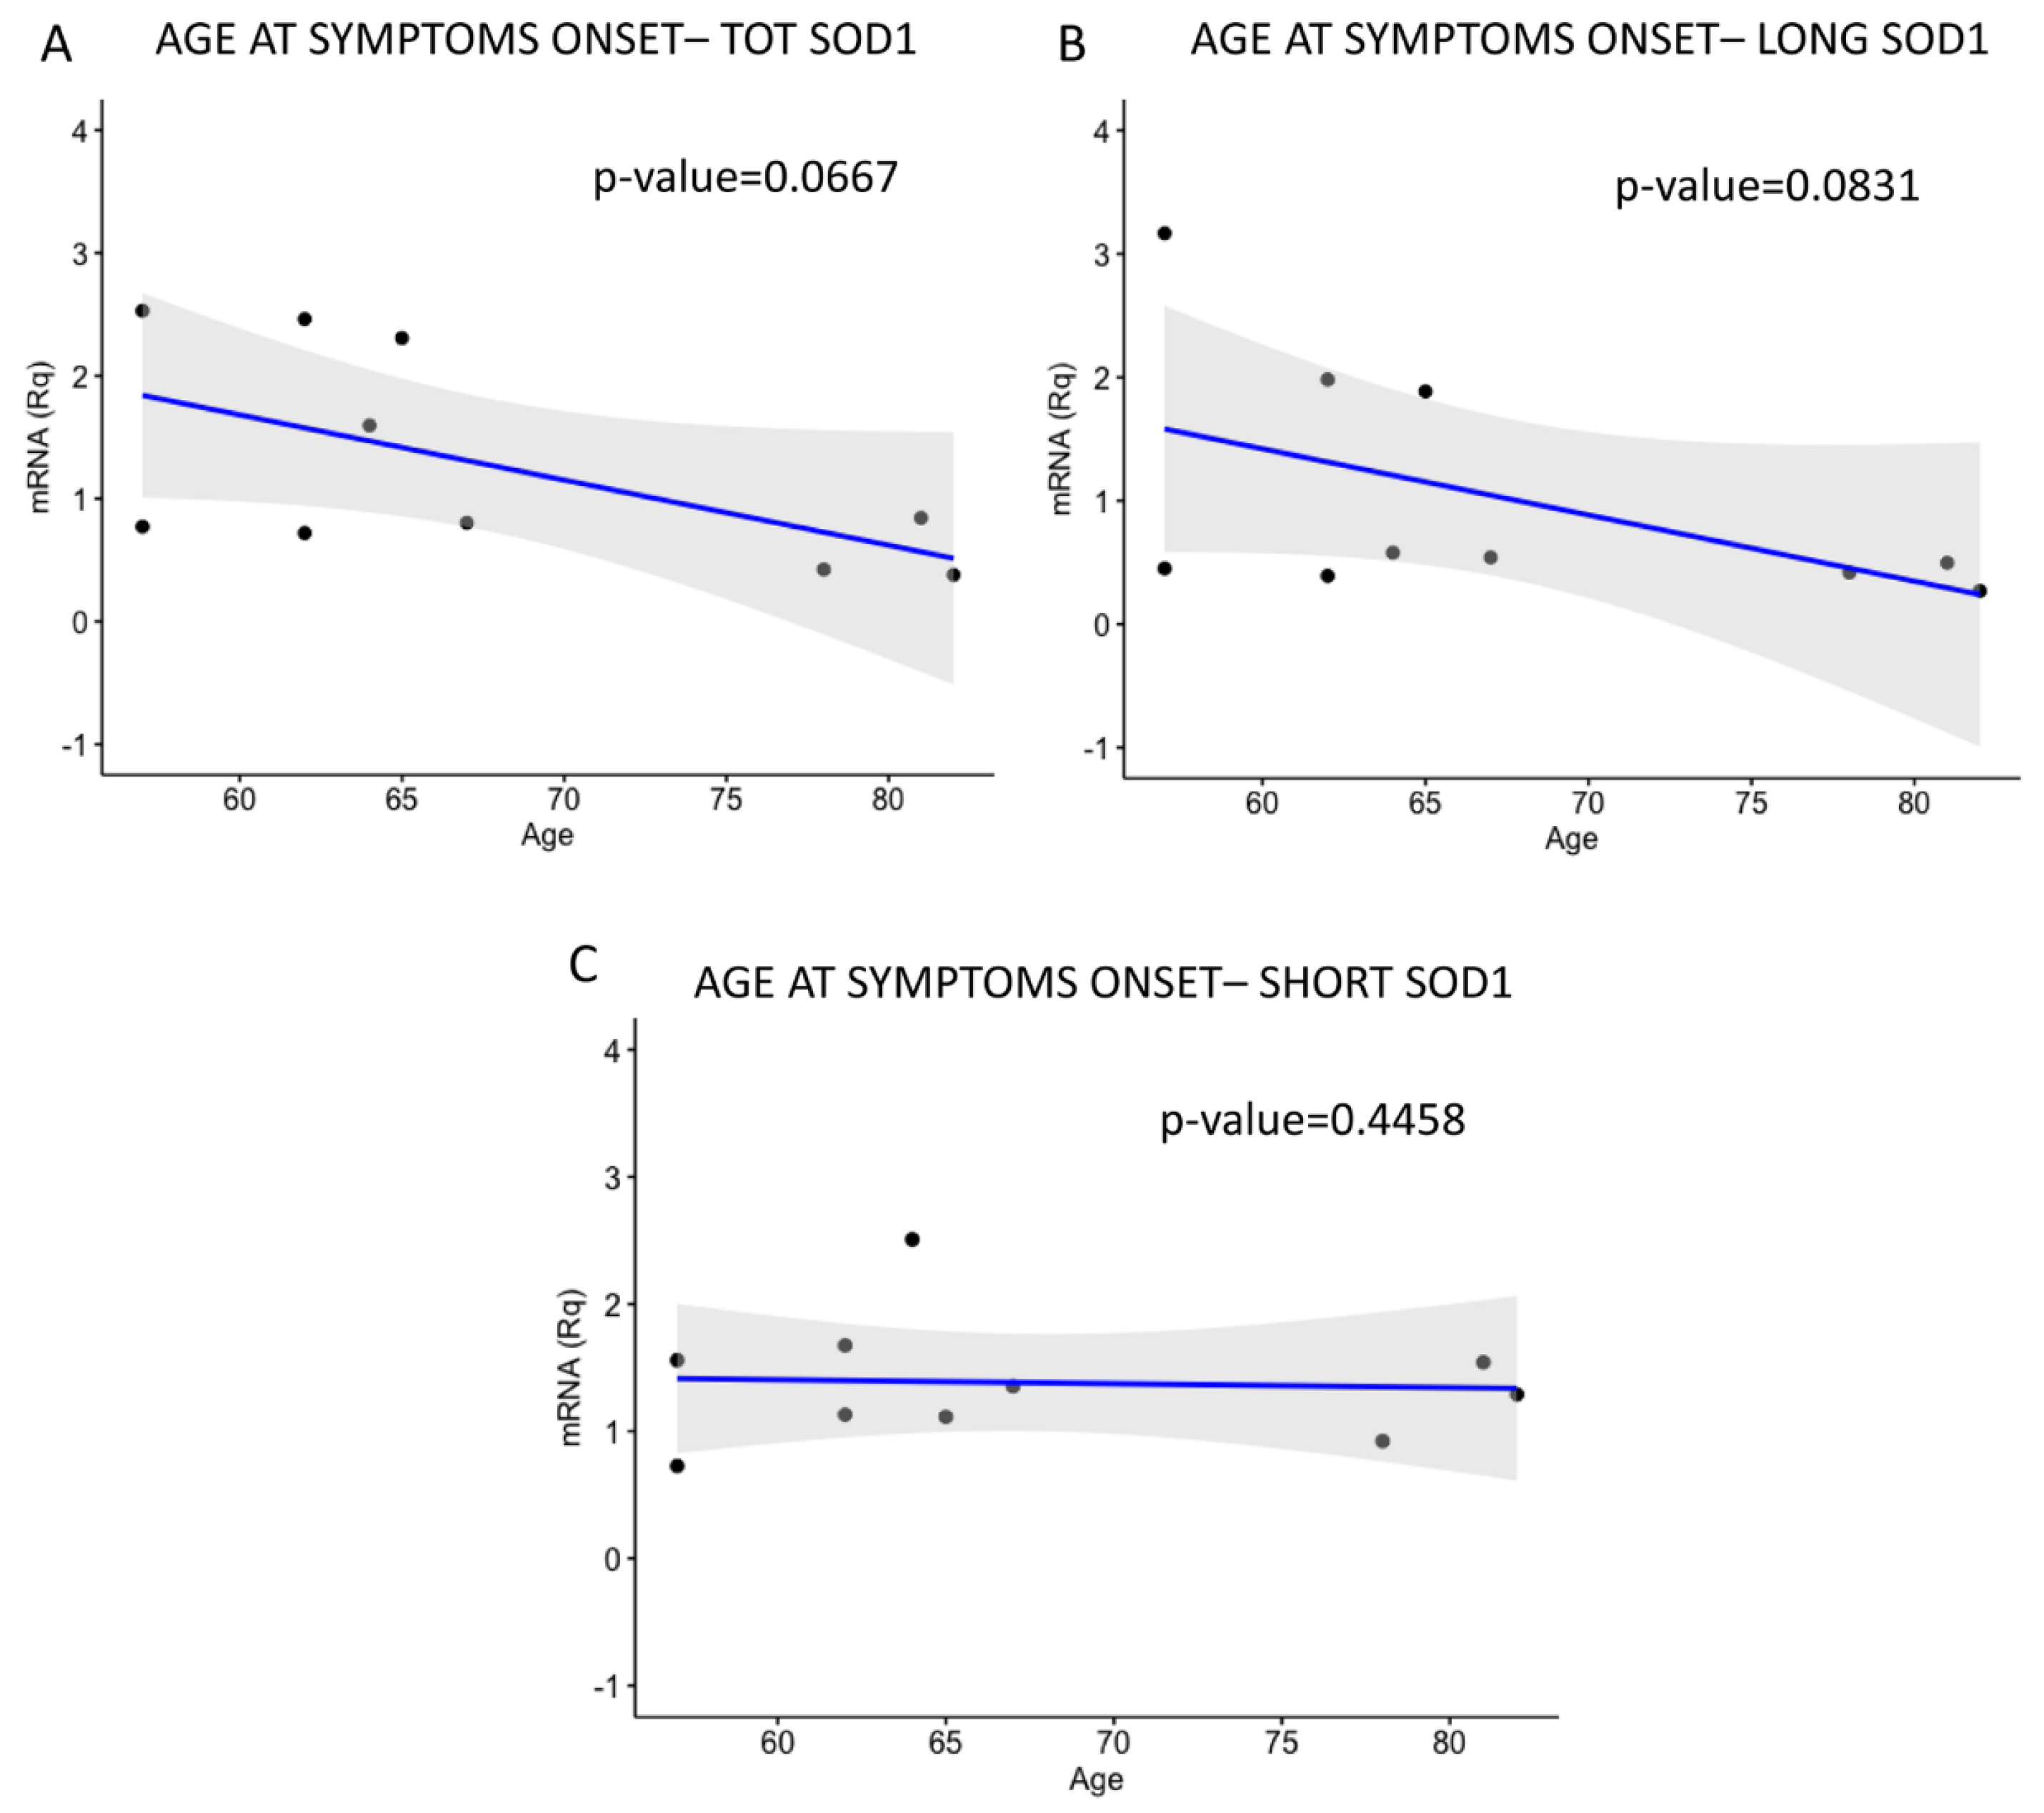
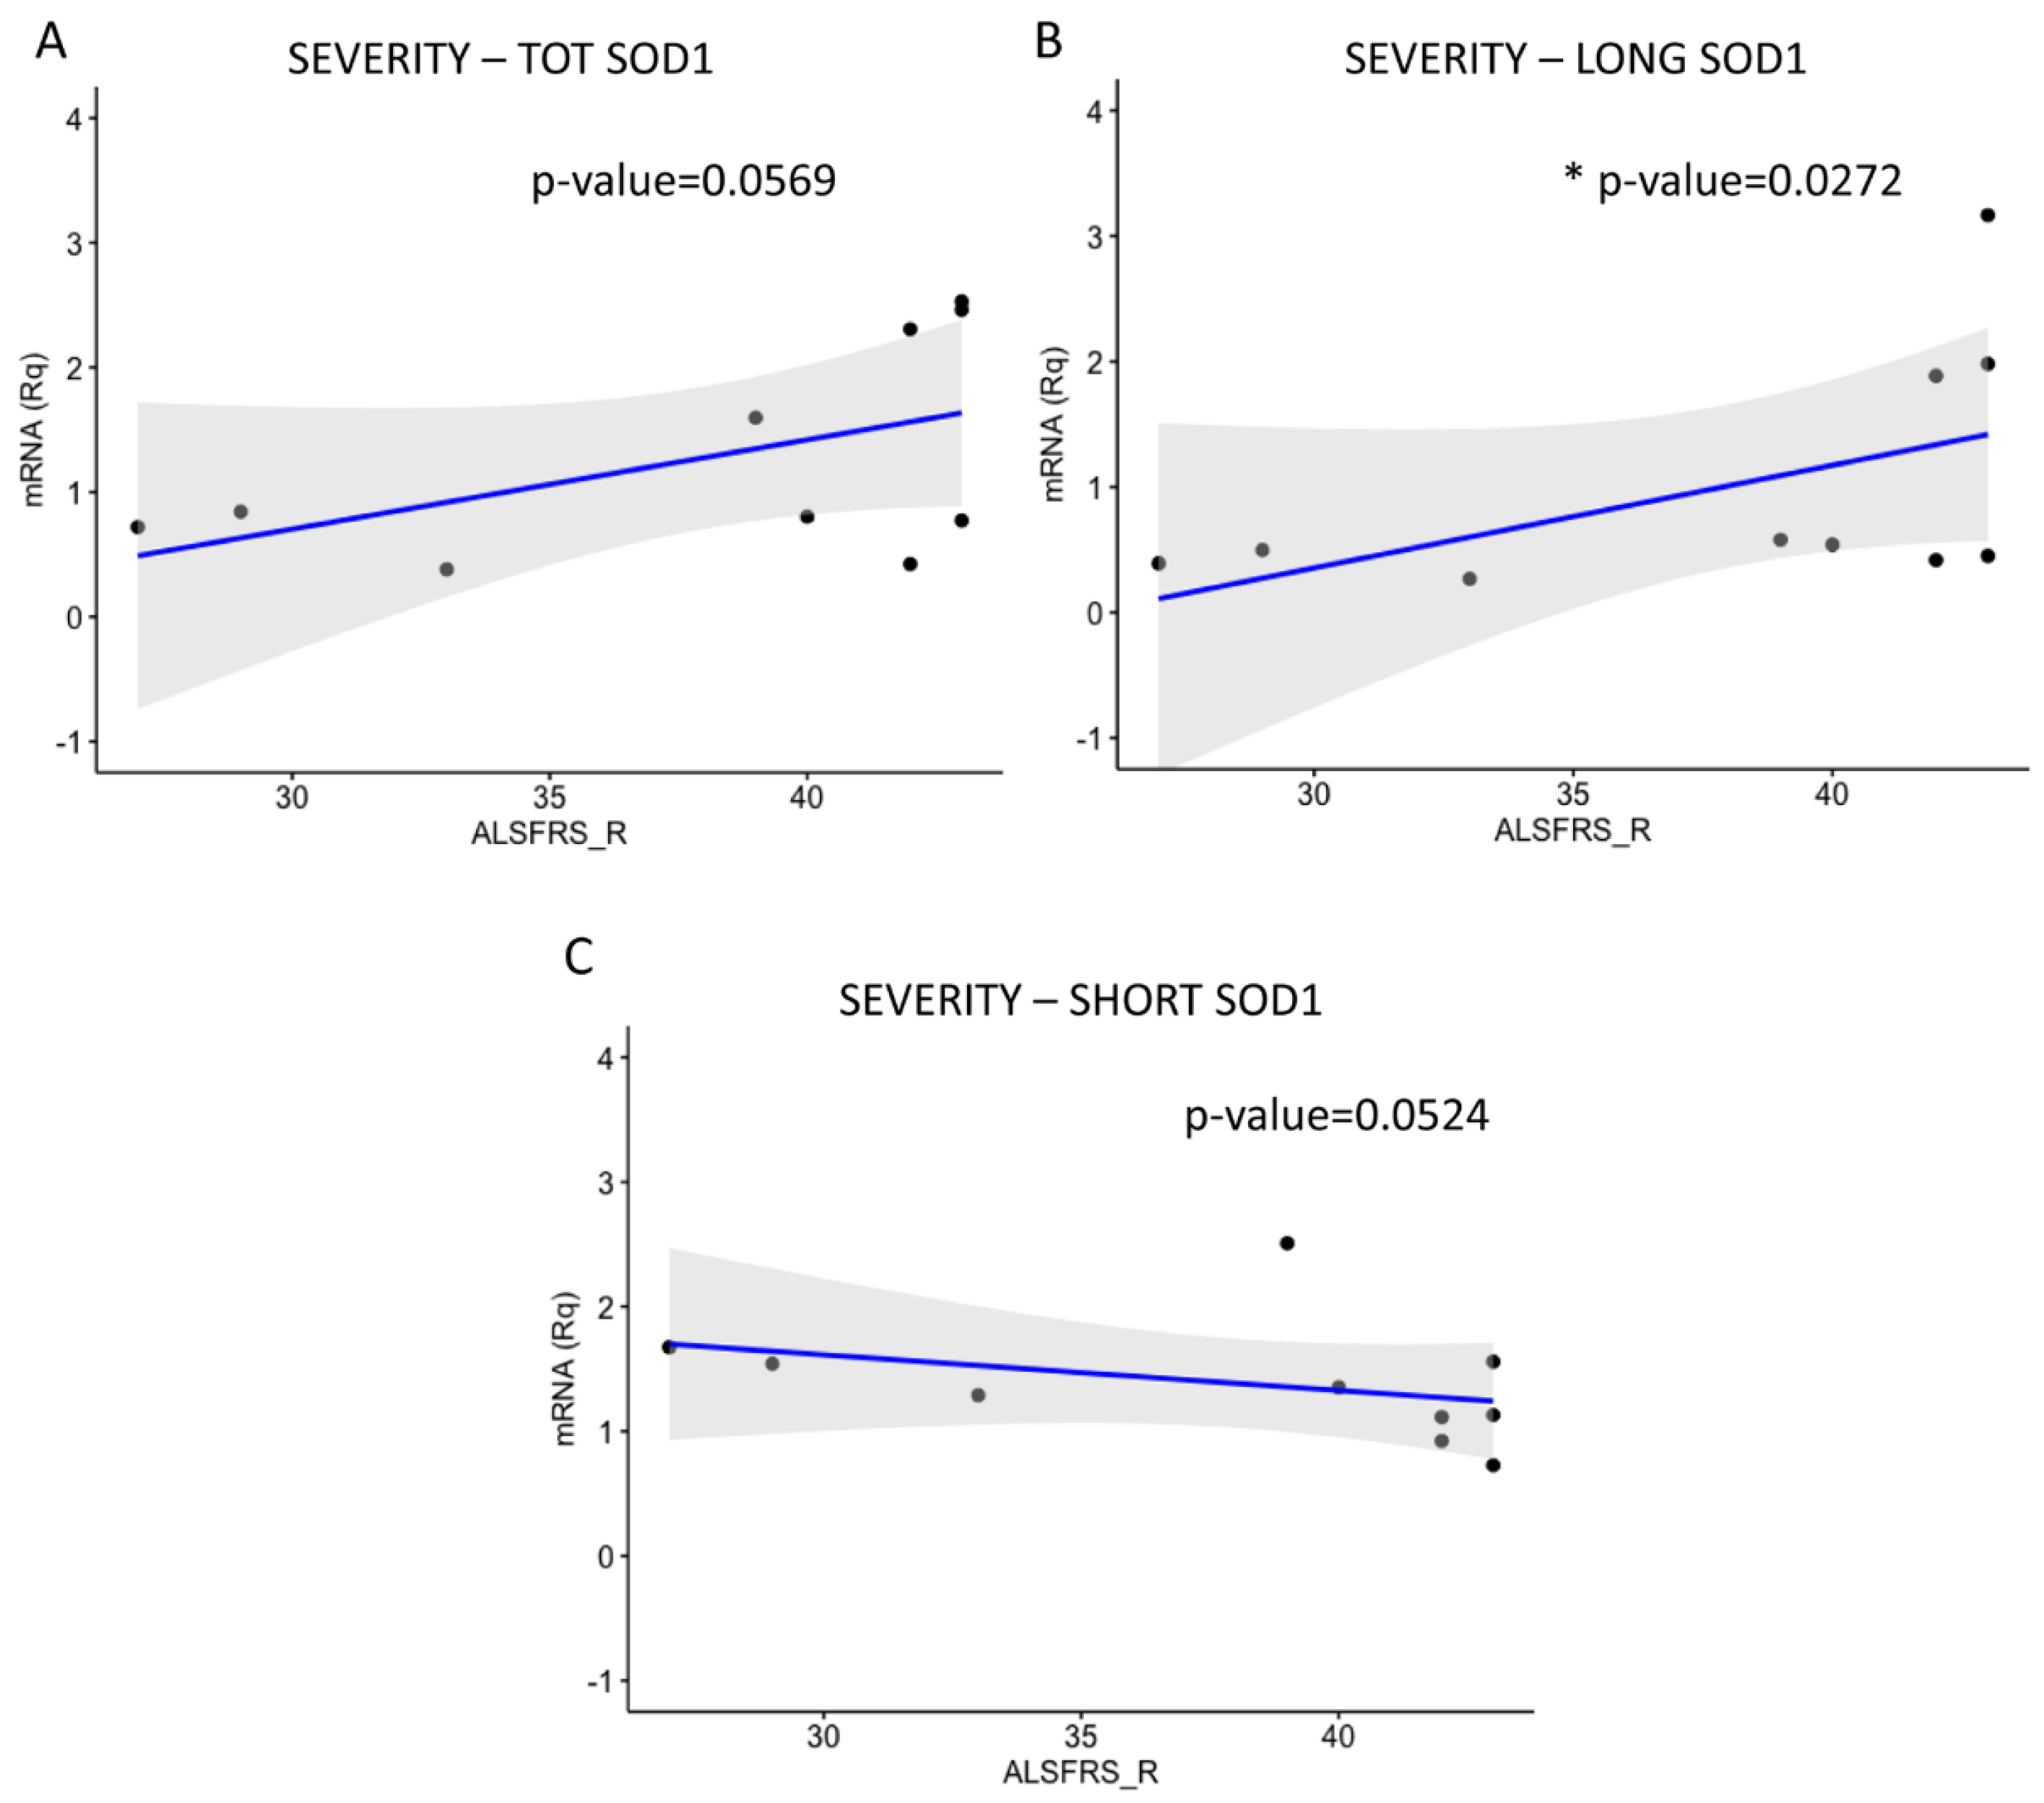
2.3. LONG SOD1 Inversely Correlates with the Severity of the Pathology

We thus correlate multiplex RT-PCR data with some of the subjects’ clinical features to point out the possible role of SOD1 transcript in ALS pathology.
Patients’ ages at symptom onset were first correlated with the severity of the pathology, calculated through the ALS Functional Rating Scale_Revised (ALSFRS_R) value (Figure 6) and then with TOT SOD1, LONG SOD1, and SHORT SOD1 levels (Figure 7). Finally, transcripts levels were correlated with the ALSFRS_R value (Figure 8), basal progression rate (PRB) (Figure S2), and late progression rate (PRL) (Figure S3).
As shown in Figure 6, we found a negative correlation between the ALSFRS_R value and patients’ age at disease onset (* p < 0.0441), indicating a positive correlation of patients’ age and the loss of physical function over time. Thus, we decided to investigate a possible correlation between SOD1 transcripts levels and both the patient’s age and ALSFRS_R value.
We found a negative correlation between patients’ ages at symptom onset and both TOT SOD1 (Figure 7A) and LONG SOD1 values (Figure 7B), although without significant differences. We did not find any correlation with SHORT SOD1 (Figure 7C).
As regards the severity of the pathology, we found a positive correlation between TOT SOD1 and the ALSFRS_R value, with a p-value near the statistical significance (Figure 8A). A positive correlation was also found between LONG SOD1 and the ALSFRS_R value (* p < 0.0272) (Figure 8B). We found a negative correlation with SHORT SOD1, although without a significant difference (Figure 8C). These data suggest that the positive correlation of TOT SOD1 with the ALSFRS_R value is mainly due to LONG SOD1. Moreover, patients with a higher value of SHORT SOD1 manifested a lower value of ALSFRS_R, indicating a possible correlation between SHORT SOD1 levels and ALS severity. These data suggest that patients’ age is correlated with a decrease in physical function and with lower values of TOT SOD1 and LONG SOD1.
Finally, we investigated possible correlations between TOT SOD1, LONG SOD1, and SHORT SOD1 values and PRB (Figure S2) and PRL (Figure S3). With regard to PRB as well as PRL, we did not find any significant correlation.

3. Discussion

In 1984, Sherman and colleagues described for the first time two SOD1 transcripts of about 0.7 and 0.9 kb. The authors found that the two transcripts differ in the length of their 3′-UTR; in particular, the long transcript contains 222 additional nucleotides beyond the 3′-polyadenylated terminus of the short mRNA [22]. Moreover, the 0.7 kb transcript is approximately four times more abundant than the 0.9 kb one [22]. Since SOD1 is known to have a pivotal role in ALS pathogenesis [15], here, we investigated for the first time the biological role of the two different transcripts of SOD1 in cellular models and in the PBMCs of sALS patients. We used both non-neural (HeLa) and neural (SH-SY5Y) cellular models to investigate whether the two transcripts of SOD1 act differently in the two tissues.
SH-SY5Y cells, after the induction of OS through 1 mM H2O2 treatment, closely mimic the molecular underpinnings characteristic of ALS [23,24,25]. Thus, they can be used as a model to test specific disease pathways and the function of ALS-related proteins and genes in a more convenient and standardized manner. Our findings point toward a change in total SOD1 mainly due to the increased expression of SHORT SOD1. In particular, by IF analysis, we found an increase in aggregated SOD1, as suggested by the puncta analysis, supporting the hypothesis that SHORT SOD1 expression has toxic and pathogenic functions. Interestingly, we found an increase in SHORT SOD1 in the PBMCs of sALS patients. However, the relevance and meaning of our findings on the SHORT SOD1 transcript in SH-SY5Y cells and in the PBMCs of sALS patients are challenging to interpret. Our guess is that they may be due to a shift in mRNA transcription under OS conditions as well as in sALS patients. Since we found aggregation of SOD1, we hypothesize that the SHORT SOD1 transcript generates a protein more susceptible to misfolding compared to the other transcript variants. In turn, the misfolded SOD1 leads to the amplification of aggregation in a prion-like manner [26,27].
We thus correlated multiplex data with some of the subjects’ clinical features to point out the possible role of SOD1 transcripts in ALS pathology. The multiplex RT-PCR results on sALS PBMCs were further investigated to pinpoint a possible correlation with patients’ age at symptom onset and with clinical scores. Interestingly, a negative correlation was found between LONG SOD1 and pathology severity, suggesting an imbalance of this form in pathological conditions, probably caused by reactive oxygen species damage as observed in ALS [15,28,29]. Additionally, several authors correlate mutations in SOD1 with a major pathology acuteness, indicating a pivotal role of this gene in ALS [30,31]. Moreover, our data indicate a more severe pathology in older patients at symptom onset, suggesting that the exacerbation of clinical symptoms is probably due to a reduction in TOT SOD1 and in the long transcript, and to an increase in the short one. To our knowledge, no previous studies have analyzed the correlation between symptom onset age and the severity of ALS pathology.
Although recent advances have clarified a more objective measure of disease progression, the phenotypic variability as well as the non-linearity during the disease course keep complicating the measurement of functional decline in ALS patients [32].
In this study, we pointed out the possible role of SOD1 variants in ALS pathology. However, this study suffers from some issues. The analysis only included a small number of sALS patients (N = 15) and healthy participants (N = 12). Additionally, the number of sALS patients was reduced for the correlation analysis to N = 10. This reduction was due to the fact that not all the patients returned for a follow-up appointment, either as a result of the worsening of their pathology, making it impossible for them to move, or because they passed away. To determine the PRL value, it is known that a second visit is necessary. For this reason, we decided to exclude patients without the second visit in all correlation analyses. The small sample size of ALS patients limits the statistical power; consequently, new studies are needed to confirm these data on a larger cohort of patients. Because of the small sample size and the high variability of ALS patients, our work is speculative, but the statistical significance found on the correlation with the severity, suggest that this research is a good starting point for further multicentric studies with a larger cohort. Likewise, the presence of outlier data, particularly in the correlation analysis, could provide additional evidence of the absence of significance and, more remarkably, of the phenotypic variability among ALS patients.
Furthermore, the SHORT SOD1 isoform appears to be upregulated in ALS. This expression pattern might reflect a fetal-like reactivation rather than a disease-specific mechanism. Unfortunately, we did not include fetal samples in our analysis, and no data are currently available to determine whether this isoform is expressed during human development. Future studies including fetal and developmental-stage tissues will be necessary to clarify this point.
Finally, a last limitation could be the low transfection efficacy of SH-SY5Y cells. This weakness could account for the lack of significance of some results.

4. Materials and Methods

4.1. HeLa and SH-SY5Y Cell Culture and Treatment

Cervical cancer HeLa cells and neuroblastoma SH-SY5Y cells were cultured in Dulbecco’s Modified Eagle’s Low Glucose Medium (Euroclone, Pero, Milan, Italy) supplemented with 15% Fetal Bovine Serum, 2 mM L-glutamine 1% streptomycin (100 U/mL; 100 mg/mL), and 1% penicillin (100 U/mL; 100 mg/mL) (all supplied by Carlo Erba, Cornaredo, Milan, Italy). Cells were grown in a humidified atmosphere containing 5% CO2 and at 37 °C.
HeLa and SH-SY5Y cells were treated with 1 mM H2O2 (Sigma-Aldrich, St. Louis, MO, USA) for the induction of OS [24,25]. Cells were exposed to 1X phosphate-buffered saline solution (Sigma-Aldrich, St. Louis, MO, USA) for the non-treated condition (T0) or treated with 1 mM H2O2 for 30 (T30) or 60 (T60) min. Cells were washed with 1X phosphate-buffered saline solution and centrifuged for the formation of pellets, and then conserved at −80 °C until further use. Each treatment was performed three times and when cells reached a confluence of 80–90%.

4.2. Enrolment of sALS Patients and Healthy Subjects

PBMCs were isolated from 15 sALS patients (eight males and seven females, mean age= 67.3 ± 7.4) after 6–9 months from disease onset. PBMCs were also isolated from 12 sex- and age-matched healthy CTRL subjects (six males and six females, mean age = 62.8 ± 4.6). sALS patients were recruited and diagnosed at IRCCS Mondino Foundation (Pavia, Italy) according to El Escorial Criteria [33]. Participants were tested for genetic mutations by Next-Generation Sequencing (Illumina, San Diego, CA, USA) as previously described [34]. A correlation was made on N = 10 sALS patients, and their clinical characterization is reported in Table S1. CTRL subjects were recruited at IRCCS Policlinico S. Matteo Foundation (Pavia, Italy) and interviewed for personal history to avoid the presence of any chronic or neurodegenerative disease, and to exclude familiarity with any motor neuron disease.

4.3. Peripheral Blood Mononuclear Cells’ Isolation

Total blood was obtained from sALS patients and CTRL subjects through venipuncture and conserved into Ethylenediaminetetraacetic acid tubes to avoid coagulation. PBMCs were isolated within 24 h using Ficoll-Histopaque®-1077 (Sigma-Aldrich, St. Louis, MO, USA) following the manufacturer’s instructions. Cell viability was evaluated through the Trypan Blue (Sigma-Aldrich, St. Louis, MO, USA) Exclusion Test using an automatic cell counter (TC20 Automated Cell Counter, BioRad, Hercules, CA, USA). Aliquots of PBMCs from both sALS patients and CTRL subjects were cryopreserved in Fetal Bovine Serum (EuroClone, Pero, Milan, Italy) and dimethyl sulfoxide (Sigma-Aldrich, St. Louis, MO, USA) to avoid cell death. PBMCs were stored at −80 °C for 24 h and then in liquid nitrogen.

4.4. Cell Transfection

In 1984, Sherman identified two SOD1 mRNA from the same gene, SHORT SOD1 and LONG SOD1, which differ in the length of their 3′-UTR regions (Figure S4). We generated four SOD1 plasmids (CDS, SHORT, LONG, and END) fused with FLAG. Plasmids were generated using Gateway technology (Invitrogen, Waltham, MA, USA) following the manufacturer’s instructions. HeLa and SH-SY5Y cells were transfected using Lipofectamine 2000 (Life Technologies, Carlsbad, CA, USA) following the manufacturer’s instructions. We then measured, via IF and WB, both endogenous and transfected SOD1 using, respectively, anti-SOD1 and anti-FLAG antibodies.

4.5. Immunofluorescence Analysis

The fixation of 3 × 10⁵ transfected HeLa and SH-SY5Y cells was performed in 4% paraformaldehyde (ThermoFisher Scientific, Waltham, MA, USA). Cells were then blocked in 5% Normal Goat Serum (ThermoFisher Scientific, Waltham, MA, USA) and 0.1% Tween (Sigma-Aldrich, St. Louis, MO, USA) and incubated in primary antibodies at 4 °C overnight (Table S2). The next day, cells were incubated in secondary antibodies at room temperature for 1 h (Table S2), mounted with Prolong®Gold anti-fade reagent DAPI (Invitrogen, Waltham, MA, USA), dried, and nail-polished. Images were acquired using an Axio Imager 2 fluorescence microscope (Zeiss, Hebron, KY, USA), and analysis was performed using ImageJ software v.1.53g (ImageJ 2022; W. Rasband, USA).

4.6. Western Blot

Proteins were extracted from HeLa and SH-SY5Y cells using RIPA buffer (150 mM sodium chloride, 1% NP-40, 0.5% sodium deoxycholate, 0.1% sodium dodecyl sulphate (SDS), 50 mM Tris, pH 8.0) and quantified by BCA assay (Sigma-Aldrich, St. Louis, MO, USA). Protein quantity and quality were assessed using a NanoDrop spectrophotometer (ThermoFisher Scientific, Waltham, MA, USA).
WB analysis was performed by SDS-polyacrylamide gel electrophoresis (SDS-PAGE). In total, 50 µg of proteins was loaded into a 12.5% SDS-PAGE gel and, after electrophoresis, the gel was transferred to nitrocellulose membrane (BioRad, Hercules, CA, USA). Membranes were blocked in 5% non-fat dry milk diluted in 1X TBS-T buffer (10 mM Tris-HCl, 100 mM NaCl, 0.1% Tween, pH 7.5) and incubated in primary antibody overnight at 4 °C (Table S3). The next day, the immunoreactivity was detected using secondary peroxidase-conjugated antibodies (Table S3) and visualized using an ECL chemiluminescence detection kit (Sigma-Aldrich, St. Louis, MO, USA). Densitometric analysis was performed using ImageJ software v.1.53g (ImageJ 2022; W. Rasband, USA).

4.7. RNA Extraction

RNA from PBMCs was extracted using Trizol® (Invitrogen, Waltham, MA, USA) and following the manufacturer’s instructions. RNA quantity and quality were assessed using a NanoDrop spectrophotometer and Qubit device (ThermoFisher Scientific, Waltham, MA, USA). RNA purity was evaluated by loading 500 ng of RNA into a 1% Agarose gel with Ethidium Bromide (ThermoFisher Scientific, Waltham, MA, USA) and running the samples for 35 min at 120 V. The resulting gel was analyzed for the presence of 28S and 18S bands. Samples that showed a degradation of the RNA or a contamination by DNA were excluded from the study. RNA was then reverse-transcribed using the iScriptcDNA Synthesis Kit (BioRad, Hercules, CA, USA) following the manufacturer’s instructions.

4.8. 3′ Rapid Amplification of cDNA Ends

In total, 1 μg of total RNA was reverse-transcribed for the first-strand cDNA synthesis with Adapter Primer, performed using SuperScript II RT (Invitrogen, Waltham, MA, USA) and followed by RNaseH treatment. PCR amplifications, with a gene-specific primer (SOD1: GCAGGTCCTCACTTTAATCCTCTATCCAG; GAPDH: TCCCTGAGCTGAACGGGAAG) and the Universal Amplification Primer, were carried out with PfU Ultra II Fusion HS DNA Polymerase (Agilent Technologies, Santa Clara, CA, USA) starting from 2 μg of cDNA and according to the manufacturer’s recommendations. PCR products were separated and analyzed on a 1.5% Agarose gel. GAPDH was used as a positive control.

4.9. Multiplex Reverse Transcription–Polymerase Chain Reaction

cDNA from SH-SY5Y cells and from patient PBMCs (50 ng) was analyzed by multiplex RT-PCR using the CFX Connect™ Real-Time PCR Detection System (BioRad, Hercules, CA, USA) and following the manufacturer’s instructions. Primers were designed for TOT SOD1, for LONG SOD1, and for the housekeeping gene UBC. The TOT SOD1 primer was attached to a FAM-BHQ1, whereas the primer for LONG SOD1 was bound to a TexasRed-BHQ2 fluorophore, and the UBC primer to a HEX-BHQ1 probe. Primers for TOT SOD1, LONG SOD1, and UBC are reported in Table S4.
Cycling conditions were set at 95 °C for 3 min, 95 °C for 45 PCR cycles of 10 s each, and 60 °C for 1 min. Cycle threshold (Ct) values were normalized to UBC, and the 2ΔCt method was used to evaluate the differences between gene expressions. The ΔCt for SHORT SOD1 was calculated by subtracting the value of the LONG SOD1 from that of TOT SOD1.
Multiplex RT-PCR values, for TOT SOD1, LONG SOD1, and SHORT SOD1 of sALS patients, were correlated with patients’ age at symptom onset, disease severity, and with PRB and PRL.
For the severity of the disease, the ALSFRS_R was used [35]. According to this scale, patients with a lower value of ALSFRS_R were considered to have a higher severity of the pathology [36].
With regard to the progression rate, both PRB and PRL were calculated as described by Kjældgaard et al. (2021), using the following formulas [37]:
P R B = 48 ( T o t a l   ALSFRS_R   a t   i n i t i a l   v i s i t ) S y m p t o m s   d u r a t i o n   ( m o n t h s )
P R L = 48 ( T o t a l   ALSFRS_R   a t   l a s t   v i s i t ) S y m p t o m s   d u r a t i o n   ( m o n t h s )

4.10. Statistical Analysis

Each experiment was performed three times. Statistical analysis was performed using GraphPad Prism (GraphPad Prism 8). Unpaired one-tailed t-tests were performed when a comparison between two groups occurred, whereas the ANOVA test followed by the Bonferroni test was used when a comparison between more than two groups occurred. In correlation analysis, the one-tailed Spearman test was performed. p-values < 0.05 were considered statistically significant. Data are reported as mean ± S.E.M.

5. Conclusions

Although the evidence gathered by this study address some limitations and needs further confirmation, a correlation between SOD1 mRNAs, especially the SHORT SOD1 transcript, and ALS diagnosis or prognosis appears promising. These findings have suitable implications for establishing a new potential biomarker for the disease, but also, as indicators of the disease progression rate, they are crucial from the perspective of drug development.

Supplementary Materials

The supporting information can be downloaded at https://www.mdpi.com/article/10.3390/ijms26146788/s1.

Author Contributions

Investigation, M.B. and E.S.; writing—original draft preparation, M.B. and E.S.; visualization, M.B. and E.S.; formal analysis, C.V.; writing—review and editing, C.V. and F.D., R.D.G., B.R., L.D., S.G. and O.P.; resources, L.D.; funding acquisition, L.D., S.G. and O.P.; supervision, O.P.; conceptualization, O.P.; project administration, O.P. All authors have read and agreed to the published version of the manuscript.

Funding

This work was supported by the Italian Ministry of Health “Ricerca Corrente 2025-2027” granted to IRCCS Mondino Foundation.

Institutional Review Board Statement

All activities that involve human subjects were conducted in accordance with the World Medical Association’s Declaration of Helsinki. The study design was examined by the ethical committee of the enrolling institutions (p-20180034329) (Approval date: 15/02/2021).

Informed Consent Statement

All participants signed, after reading the informative notes, an informed consent form.

Data Availability Statement

The datasets used and/or analyzed during the current study are available from the Zenodo repository, 10.5281/zenodo.10066963.

Acknowledgments

We want to thank Stefano Bernuzzi (Immunohematological and Transfusional Service and Centre of Transplantation Immunology, IRCCS “San Matteo Foundation”, Pavia) who provided the CTRL samples.

Conflicts of Interest

The authors declare that they have no competing interests.

Abbreviations

The following abbreviations are used in this manuscript:
ALSAmyotrophic lateral sclerosis
ALSFRS_RALS Functional Rating Scale_Revised
CtCycle threshold
CTRLControl
FLAGN’terminal-Flag sequence
H2O2Hydrogen peroxide
IFImmunofluorescence
LONG SOD1Long SOD1 transcript
NTNot transfected
OSOxidative stress
PBMCsPeripheral blood mononuclear cells
PRBBasal progression rate
PRLLate progression rate
RACE3′ rapid amplification of cDNA ends
RT-PCRReverse transcription–polymerase chain reaction
S.E.M.Standard error of mean
SDSSodium dodecyl sulphate
SDS-PAGESDS-polyacrylamide gel electrophoresis
SHOR SOD1Short SOD1 transcript
SOD1Superoxide dismutase 1
TOT SOD1Total SOD1
WBWestern blot

References

  1. Logroscino, G.; Urso, D.; Tortelli, R. The challenge of amyotrophic lateral sclerosis descriptive epidemiology: To estimate low incidence rates across complex phenotypes in different geographic areas. Curr. Opin. Neurol. 2022, 35, 678–685. [Google Scholar] [CrossRef] [PubMed]
  2. Niedermeyer, S.; Murn, M.; Choi, P.J. Respiratory Failure in Amyotrophic Lateral Sclerosis. Chest 2019, 155, 401–408. [Google Scholar] [CrossRef] [PubMed]
  3. Dhasmana, S.; Dhasmana, A.; Narula, A.S.; Jaggi, M.; Yallapu, M.M.; Chauhan, S.C. The panoramic view of amyotrophic lateral sclerosis: A fatal intricate neurological disorder. Life Sci. 2022, 288, 120156. [Google Scholar] [CrossRef] [PubMed]
  4. Zou, Z.Y.; Zhou, Z.R.; Che, C.H.; Liu, C.Y.; He, R.L.; Huang, H.P. Genetic epidemiology of amyotrophic lateral sclerosis: A systematic review and meta-analysis. J. Neurol. Neurosurg. Psychiatry 2017, 88, 540–549. [Google Scholar] [CrossRef] [PubMed]
  5. Vidovic, M.; Müschen, L.H.; Brakemeier, S.; Machetanz, G.; Naumann, M.; Castro-Gomez, S. Current State and Future Directions in the Diagnosis of Amyotrophic Lateral Sclerosis. Cells 2023, 12, 736. [Google Scholar] [CrossRef] [PubMed]
  6. Norris, S.P.; Likanje, M.N.; Andrews, J.A. Amyotrophic lateral sclerosis: Update on clinical management. Curr. Opin. Neurol. 2020, 33, 641–648. [Google Scholar] [CrossRef] [PubMed]
  7. Rosen, D.R.; Siddique, T.; Patterson, D.; Figlewicz, D.A.; Sapp, P.; Hentati, A.; Donaldson, D.; Goto, J.; P O, J.; Deng, H.X.; et al. Mutations in Cu/Zn superoxide dismutase gene are associated with familial amyotrophic lateral sclerosis. Nature 1993, 362, 59–62. [Google Scholar] [CrossRef] [PubMed]
  8. Müller, K.; Oh, K.W.; Nordin, A.; Panthi, S.; Kim, S.H.; Nordin, F.; Freischmidt, A.; Ludolph, A.C.; Ki, C.S.; Forsberg, K.; et al. De novo mutations in SOD1 are a cause of ALS. J. Neurol. Neurosurg. Psychiatry 2022, 93, 201–206. [Google Scholar] [CrossRef] [PubMed]
  9. Garcia, C.; Vidal-Taboada, J.M.; Syriani, E.; Salvado, M.; Morales, M.; Gamez, J. Haplotype Analysis of the First A4V-SOD1 Spanish Family: Two Separate Founders or a Single Common Founder? Front. Genet. 2019, 10, 1109. [Google Scholar] [CrossRef] [PubMed]
  10. Zelko, I.N.; Mariani, T.J.; Folz, R.J. Superoxide dismutase multigene family: A comparison of the CuZn-SOD (SOD1), Mn-SOD (SOD2), and EC-SOD (SOD3) gene structures, evolution, and expression. Free Radic. Biol. Med. 2002, 33, 337–349. [Google Scholar] [CrossRef] [PubMed]
  11. Taylor, J.P.; Brown RHJr Cleveland, D.W. Decoding ALS: From genes to mechanism. Nature 2016, 539, 197–206. [Google Scholar] [CrossRef] [PubMed]
  12. Fang, T.; Je, G.; Pacut, P.; Keyhanian, K.; Gao, J.; Ghasemi, M. Gene Therapy in Amyotrophic Lateral Sclerosis. Cells 2022, 11, 2066. [Google Scholar] [CrossRef] [PubMed]
  13. Zhao, X.; Feng, X.; Li, X.; Mou, J.; Liu, H.; Chen, J.; Wu, J. The G41D mutation in SOD1-related amyotrophic lateral sclerosis exhibits phenotypic heterogeneity among individuals: A case report and literature review. Medicine 2022, 101, e28771. [Google Scholar] [CrossRef] [PubMed]
  14. Scarian, E.; Bordoni, M.; Fantini, V.; Jacchetti, E.; Raimondi, M.T.; Diamanti, L.; Carelli, S.; Cereda, C.; Pansarasa, O. Patients’ Stem Cells Differentiation in a 3D Environment as a Promising Experimental Tool for the Study of Amyotrophic Lateral Sclerosis. Int. J. Mol. Sci. 2022, 23, 5344. [Google Scholar] [CrossRef] [PubMed]
  15. Pansarasa, O.; Bordoni, M.; Diamanti, L.; Sproviero, D.; Gagliardi, S.; Cereda, C. SOD1 in Amyotrophic Lateral Sclerosis: “Ambivalent” Behavior Connected to the Disease. Int. J. Mol. Sci. 2018, 19, 1345. [Google Scholar] [CrossRef] [PubMed]
  16. Pansarasa, O.; Garofalo, M.; Scarian, E.; Dragoni, F.; Garau, J.; Di Gerlando, R.; Diamanti, L.; Bordoni, M.; Gagliardi, S. Biomarkers in Human Peripheral Blood Mononuclear Cells: The State of the Art in Amyotrophic Lateral Sclerosis. Int. J. Mol. Sci. 2022, 23, 2580. [Google Scholar] [CrossRef] [PubMed]
  17. Grad, L.I.; Yerbury, J.J.; Turner, B.J.; Guest, W.C.; Pokrishevsky, E.; O’Neill, M.A.; Yanai, A.; Silverman, J.M.; Zeineddine, R.; Corcoran, L.; et al. Intercellular propagated misfolding of wild-type Cu/Zn superoxide dismutase occurs via exosome-dependent and -independent mechanisms. Proc. Natl. Acad. Sci. USA 2014, 111, 3620–3625. [Google Scholar] [CrossRef] [PubMed]
  18. Ayers, J.I.; Fromholt, S.E.; O’Neal, V.M.; Diamond, J.H.; Borchelt, D.R. Prion-like propagation of mutant SOD1 misfolding and motor neuron disease spread along neuroanatomical pathways. Acta Neuropathol. 2016, 131, 103–114. [Google Scholar] [CrossRef] [PubMed]
  19. Silverman, J.M.; Christy, D.; Shyu, C.C.; Moon, K.-M.; Fernando, S.; Gidden, Z.; Cowan, C.M.; Ban, Y.; Stacey, R.G.; Grad, L.I.; et al. CNS-derived extracellular vesicles from superoxide dismutase 1 (SOD1)G93A ALS mice originate from astrocytes and neurons and carry misfolded SOD1. J. Biol. Chem. 2019, 294, 3744–3759. [Google Scholar] [CrossRef] [PubMed]
  20. Mackenzie, I.R.; Bigio, E.H.; Ince, P.G.; Geser, F.; Neumann, M.; Cairns, N.J.; Kwong, L.K.; Forman, M.S.; Ravits, J.; Stewart, H.; et al. Pathological TDP-43 distinguishes sporadic amyotrophic lateral sclerosis from amyotrophic lateral sclerosis with SOD1 mutations. Ann. Neurol. 2007, 61, 427–434. [Google Scholar] [CrossRef] [PubMed]
  21. Benson, B.C.; Shaw, P.J.; Azzouz, M.; Highley, J.R.; Hautbergue, G.M. Proteinopathies as Hallmarks of Impaired Gene Expression, Proteostasis and Mitochondrial Function in Amyotrophic Lateral Sclerosis. Front. Neurosci. 2021, 15, 783624. [Google Scholar] [CrossRef] [PubMed]
  22. Sherman, L.; Levanon, D.; Lieman-Hurwitz, J.; Dafni, N.; Groner, Y. Human Cu/Zn superoxide dismutase gene: Molecular characterization of its two mRNA species. Nucleic Acids Res. 1984, 12, 9349–9365. [Google Scholar] [CrossRef] [PubMed]
  23. Milani, P.; Amadio, M.; Laforenza, U.; Dell, M.; Diamanti, L.; Sardone, V.; Gagliardi, S.; Govoni, S.; Ceroni, M.; Pascale, A.; et al. Posttranscriptional regulation of SOD1 gene expression under oxidative stress: Potential role of ELAV proteins in sporadic ALS. Neurobiol. Dis. 2013, 60, 51–60. [Google Scholar] [CrossRef] [PubMed]
  24. Dell’Orco, M.; Milani, P.; Arrigoni, L.; Pansarasa, O.; Sardone, V.; Maffioli, E.; Polveraccio, F.; Bordoni, M.; Diamanti, L.; Ceroni, M.; et al. Hydrogen peroxide-mediated induction of SOD1 gene transcription is independent from Nrf2 in a cellular model of neurodegeneration. Biochim. Biophys. Acta 2016, 1859, 315–323. [Google Scholar] [CrossRef] [PubMed]
  25. Bordoni, M.; Pansarasa, O.; Dell’Orco, M.; Crippa, V.; Gagliardi, S.; Sproviero, D.; Bernuzzi, S.; Diamanti, L.; Ceroni, M.; Tedeschi, G.; et al. Nuclear Phospho-SOD1 Protects DNA from Oxidative Stress Damage in Amyotrophic Lateral Sclerosis. J. Clin. Med. 2019, 8, 729. [Google Scholar] [CrossRef] [PubMed]
  26. Meiering, E.M. The threat of instability: Neurodegeneration predicted by protein destabilization and aggregation propensity. PLoS Biol. 2008, 6, e193. [Google Scholar] [CrossRef] [PubMed]
  27. McAlary, L.; Plotkin, S.S.; Yerbury, J.J.; Cashman, N.R. Prion-Like Propagation of Protein Misfolding and Aggregation in Amyotrophic Lateral Sclerosis. Front. Mol. Neurosci. 2019, 12, 262. [Google Scholar] [CrossRef] [PubMed]
  28. Cozzolino, M.; Pesaresi, M.G.; Gerbino, V.; Grosskreutz, J.; Carrì, M.T. Amyotrophic lateral sclerosis: New insights into underlying molecular mechanisms and opportunities for therapeutic intervention. Antioxid. Redox Signal. 2012, 17, 1277–1330. [Google Scholar] [CrossRef] [PubMed]
  29. Motataianu, A.; Serban, G.; Barcutean, L.; Balasa, R. Oxidative Stress in Amyotrophic Lateral Sclerosis: Synergy of Genetic and Environmental Factors. Int. J. Mol. Sci. 2022, 23, 9339. [Google Scholar] [CrossRef] [PubMed]
  30. Pal, S.; Tiwari, A.; Sharma, K.; Sharma, S.K. Does conserved domain SOD1 mutation has any role in ALS severity and therapeutic outcome? BMC Neurosci. 2020, 21, 42. [Google Scholar] [CrossRef] [PubMed]
  31. Berdyński, M.; Miszta, P.; Safranow, K.; Andersen, P.M.; Morita, M.; Filipek, S.; Żekanowski, C.; Kuźma-Kozakiewicz, M. SOD1 mutations associated with amyotrophic lateral sclerosis analysis of variant severity. Sci. Rep. 2022, 12, 103. [Google Scholar] [CrossRef] [PubMed]
  32. Couratier, P.; Lautrette, G.; Luna, J.A.; Corcia, P. Phenotypic variability in amyotrophic lateral sclerosis. Rev. Neurol. 2021, 177, 536–543. [Google Scholar] [CrossRef] [PubMed]
  33. Ludolph, A.; Drory, V.; Hardiman, O.; Nakano, I.; Ravits, J.; Robberecht, W.; Shefner, J.; WFN Research Group On ALS/MND. A revision of the El Escorial criteria—2015. Amyotroph. Lateral Scler. Front. Degener 2015, 16, 291–292. [Google Scholar] [CrossRef] [PubMed]
  34. Filosto, M.; Piccinelli, S.C.; Palmieri, I.; Necchini, N.; Valente, M.; Zanella, I.; Biasiotto, G.; Di Lorenzo, D.; Cereda, C.; Padovani, A. A Novel Mutation in the Stalk Domain of KIF5A Causes a Slowly Progressive Atypical Motor Syndrome. J. Clin. Med. 2018, 8, 17. [Google Scholar] [CrossRef] [PubMed]
  35. Gordon, P.H.; Miller, R.G.; Moore, D.H. ALSFRS-R. Amyotroph. Lateral Scler. Other Mot. Neuron Disord. 2004, 5 (Suppl. S1), 90–93. [Google Scholar] [CrossRef] [PubMed]
  36. Cunha-Oliveira, T.; Montezinho, L.; Mendes, C.; Firuzi, O.; Saso, L.; Oliveira, P.J.; Silva, F.S.G. Oxidative Stress in Amyotrophic Lateral Sclerosis: Pathophysiology and Opportunities for Pharmacological Intervention. Oxid. Med. Cell. Longev. 2020, 2020, 5021694. [Google Scholar] [CrossRef] [PubMed]
  37. Kjældgaard, A.L.; Pilely, K.; Olsen, K.S.; Lauritsen, A.Ø.; Pedersen, S.W.; Svenstrup, K.; Karlsborg, M.; Thagesen, H.; Blaabjerg, M.; Theódórsdóttir, Á.; et al. Complement Profiles in Patients with Amyotrophic Lateral Sclerosis: A Prospective Observational Cohort Study. J. Inflamm. Res. 2021, 14, 1043–1053. [Google Scholar] [CrossRef] [PubMed]
Figure 1. Schematic representation of the plasmids. The four plasmids contained four SOD1 transcript sequences differing for the 3′UTR length. The coding sequence only, which ends with the stop codon (blue square) (pDEST CDS); the SHORT SOD1 transcript, which ends with the 2nd polyA signal (pink circle) (pDEST SHORT); the LONG SOD1 transcript, which ends with the 4th polyA site (orange circle) (pDEST LONG); and the SOD1 transcript containing the entire 3′UTR (red square) (pEST END).
Ijms 26 06788 g001
Figure 2. Total and endogenous SOD1 is increased in SHORT SOD1 transfected SH-SY5Y cells. Four SOD1 plasmids were generated and transfected in SH-SY5Y cells: CDS SOD1 (coding sequence ending with the stop codon), SHORT SOD1 (transcript ending with the 2nd polyA signal), LONG SOD1 (transcript ending with the 4th polyA site), and END SOD1 (transcript ending with the 4th polyA site). NT indicates non-transfected SH-SY5Y cells. In the figure, (AD) show the WB analysis results for total SOD1, transfected SOD1, and endogenous SOD1. (A) A not significant increase was found in the expression of total SOD1 in SHORT SOD1 transfected cells compared to the other transcripts. (B) A not significant increase was found in transfected SOD1 protein expression. (C) A not significant increase was found in the expression of endogenous SOD1 in SHORT SOD1 transfected cells. (D) shows a representative WB of endogenous (16 kDa) and transfected (18 kDa) protein levels. GAPDH was used as the loading control (37 kDa). In the figure, (EH) show the IF analysis results for total SOD1, transfected SOD1, and endogenous SOD1. (E) A significant increase in endogenous SOD1 was found in SHORT SOD1 transfected cells compared to CDS (* p = 0.0120) and END SOD1 (* p = 0.0133). (F) No significant differences were found for transfected SOD1. (G) A significant increase in endogenous SOD1 was also found in SHORT SOD1 transfected cells compared to CDS (* p = 0.0215), LONG (* p = 0.0401), and END SOD1 (* p = 0.0157). (H) Representative images of IF analysis (red= transfected SOD1, green= endogenous SOD1, blue= nuclei stained by DAPI). Scale bar: 10µm. Error bars indicate the standard error of the mean (S.E.M.). N = 3. Data were analyzed using an ANOVA test followed by Bonferroni’s test.
Ijms 26 06788 g002
Figure 3. Oxidative stress treatment does not influence the levels of TOT SOD1, LONG SOD1, and SHORT SOD1. The levels of TOT SOD1, LONG SOD1, and SHORT SOD1 in SH-SY5Y were evaluated by multiplex RT-PCR at T0 (non-treated condition), T30 (after 30 min of 1 mM H2O2 treatment), and T60 (after 60 min of 1 mM H2O2 treatment). (AC) No significant differences were found in the levels of TOT SOD1, LONG SOD1, and SHORT SOD1. (D) A not significant increase was found in the ratio of SHORT SOD1 to LONG SOD1 after 60 min of 1 mM H2O2 treatment. Error bars indicate S.E.M. N = 3. Data were analyzed using an ANOVA test followed by the Bonferroni test.
Ijms 26 06788 g003
Figure 4. sALS patients’ peripheral blood mononuclear cells express less LONG SOD1 and more SHORT SOD1. 3′RACE was performed on the PBMCs of sALS patients and the CTRL. SH-SY5Y cells exposed to 1 mM H2O2 for 60 min (T60) were used as a positive control. GAPDH was used as a negative control to confirm the presence of different isoforms amplified through 3′RACE. A SHORT SOD1 amplicon had a length of about 400 bp, while a LONG SOD1 amplicon had a length of about 600 bp. CTRL and sALS PBMCs expressed both LONG and SHORT SOD1. sALS patients showed a lower expression of LONG SOD1 and a higher expression of SHORT SOD1 compared to those of the CTRL.
Ijms 26 06788 g004
Figure 5. sALS peripheral blood mononuclear cells (PBMCs) have a higher expression of SHORT SOD1 than CTRL ones. The levels of TOT SOD1, LONG SOD1, and SHORT SOD1 transcripts in sALS patients and CTRL PBMCs were evaluated by multiplex RT-PCR. (A) An increase, although not significant, was found in TOT SOD1 expression in sALS PBMCs when compared to CTRL PBMCs. (B) No changes in LONG SOD1 expression were found. (C) A significant increase (* p = 0.0429) was found in SHORT SOD1 expression in sALS PBMCs compared to CTRL PBMCs. (D) The ratio between SHORT and LONG transcript expression was calculated, finding a non-significant increase in ALS PBMCs (D). Error bars indicate S.E.M. N = 15. Data were analyzed using an unpaired one-tailed t-test.
Ijms 26 06788 g005
Figure 6. Patients’ age at symptom onset is negatively correlated with ALSFRS_R values. Patients’ ages at the onset of symptoms were correlated with the ALSFRS_R values. A significant negative correlation was found (* p = 0.0441). Data were analyzed using a one-tailed Spearman test. N = 10.
Ijms 26 06788 g006
Figure 7. Patients’ age at symptom onset is not correlated with SOD1 transcript expression. The levels of TOT SOD1, LONG SOD1, and SHORT SOD1 were correlated with the ages of patients at symptom onset. (A,B) No significant negative correlations between both TOT SOD1 and LONG SOD1 and patients’ ages at symptom onset were found. (C) No significant differences were found between SHORT SOD1 and ages at symptom onset. Data were analyzed using a one-tailed Spearman test. N = 10.
Ijms 26 06788 g007
Figure 8. ALSFRS_R value correlates with LONG SOD1 expression. The levels of TOT SOD1, LONG SOD1, and SHORT SOD1 were correlated with the ALSFRS_R values. (A) No significant positive correlation between TOT SOD1 and ALSFRS_R values was found (p = 0.0569). (B) A significant positive correlation between LONG SOD1 and ALSFRS_R was detected (* p = 0.0272). (C) No statistically significant negative correlation was found between SHORT SOD1 and ALSFRS_R values (p = 0.0524). Data were analyzed using a one-tailed Spearman test. N = 10.
Ijms 26 06788 g008
Disclaimer/Publisher’s Note: The statements, opinions and data contained in all publications are solely those of the individual author(s) and contributor(s) and not of MDPI and/or the editor(s). MDPI and/or the editor(s) disclaim responsibility for any injury to people or property resulting from any ideas, methods, instructions or products referred to in the content.

