Figure 1.
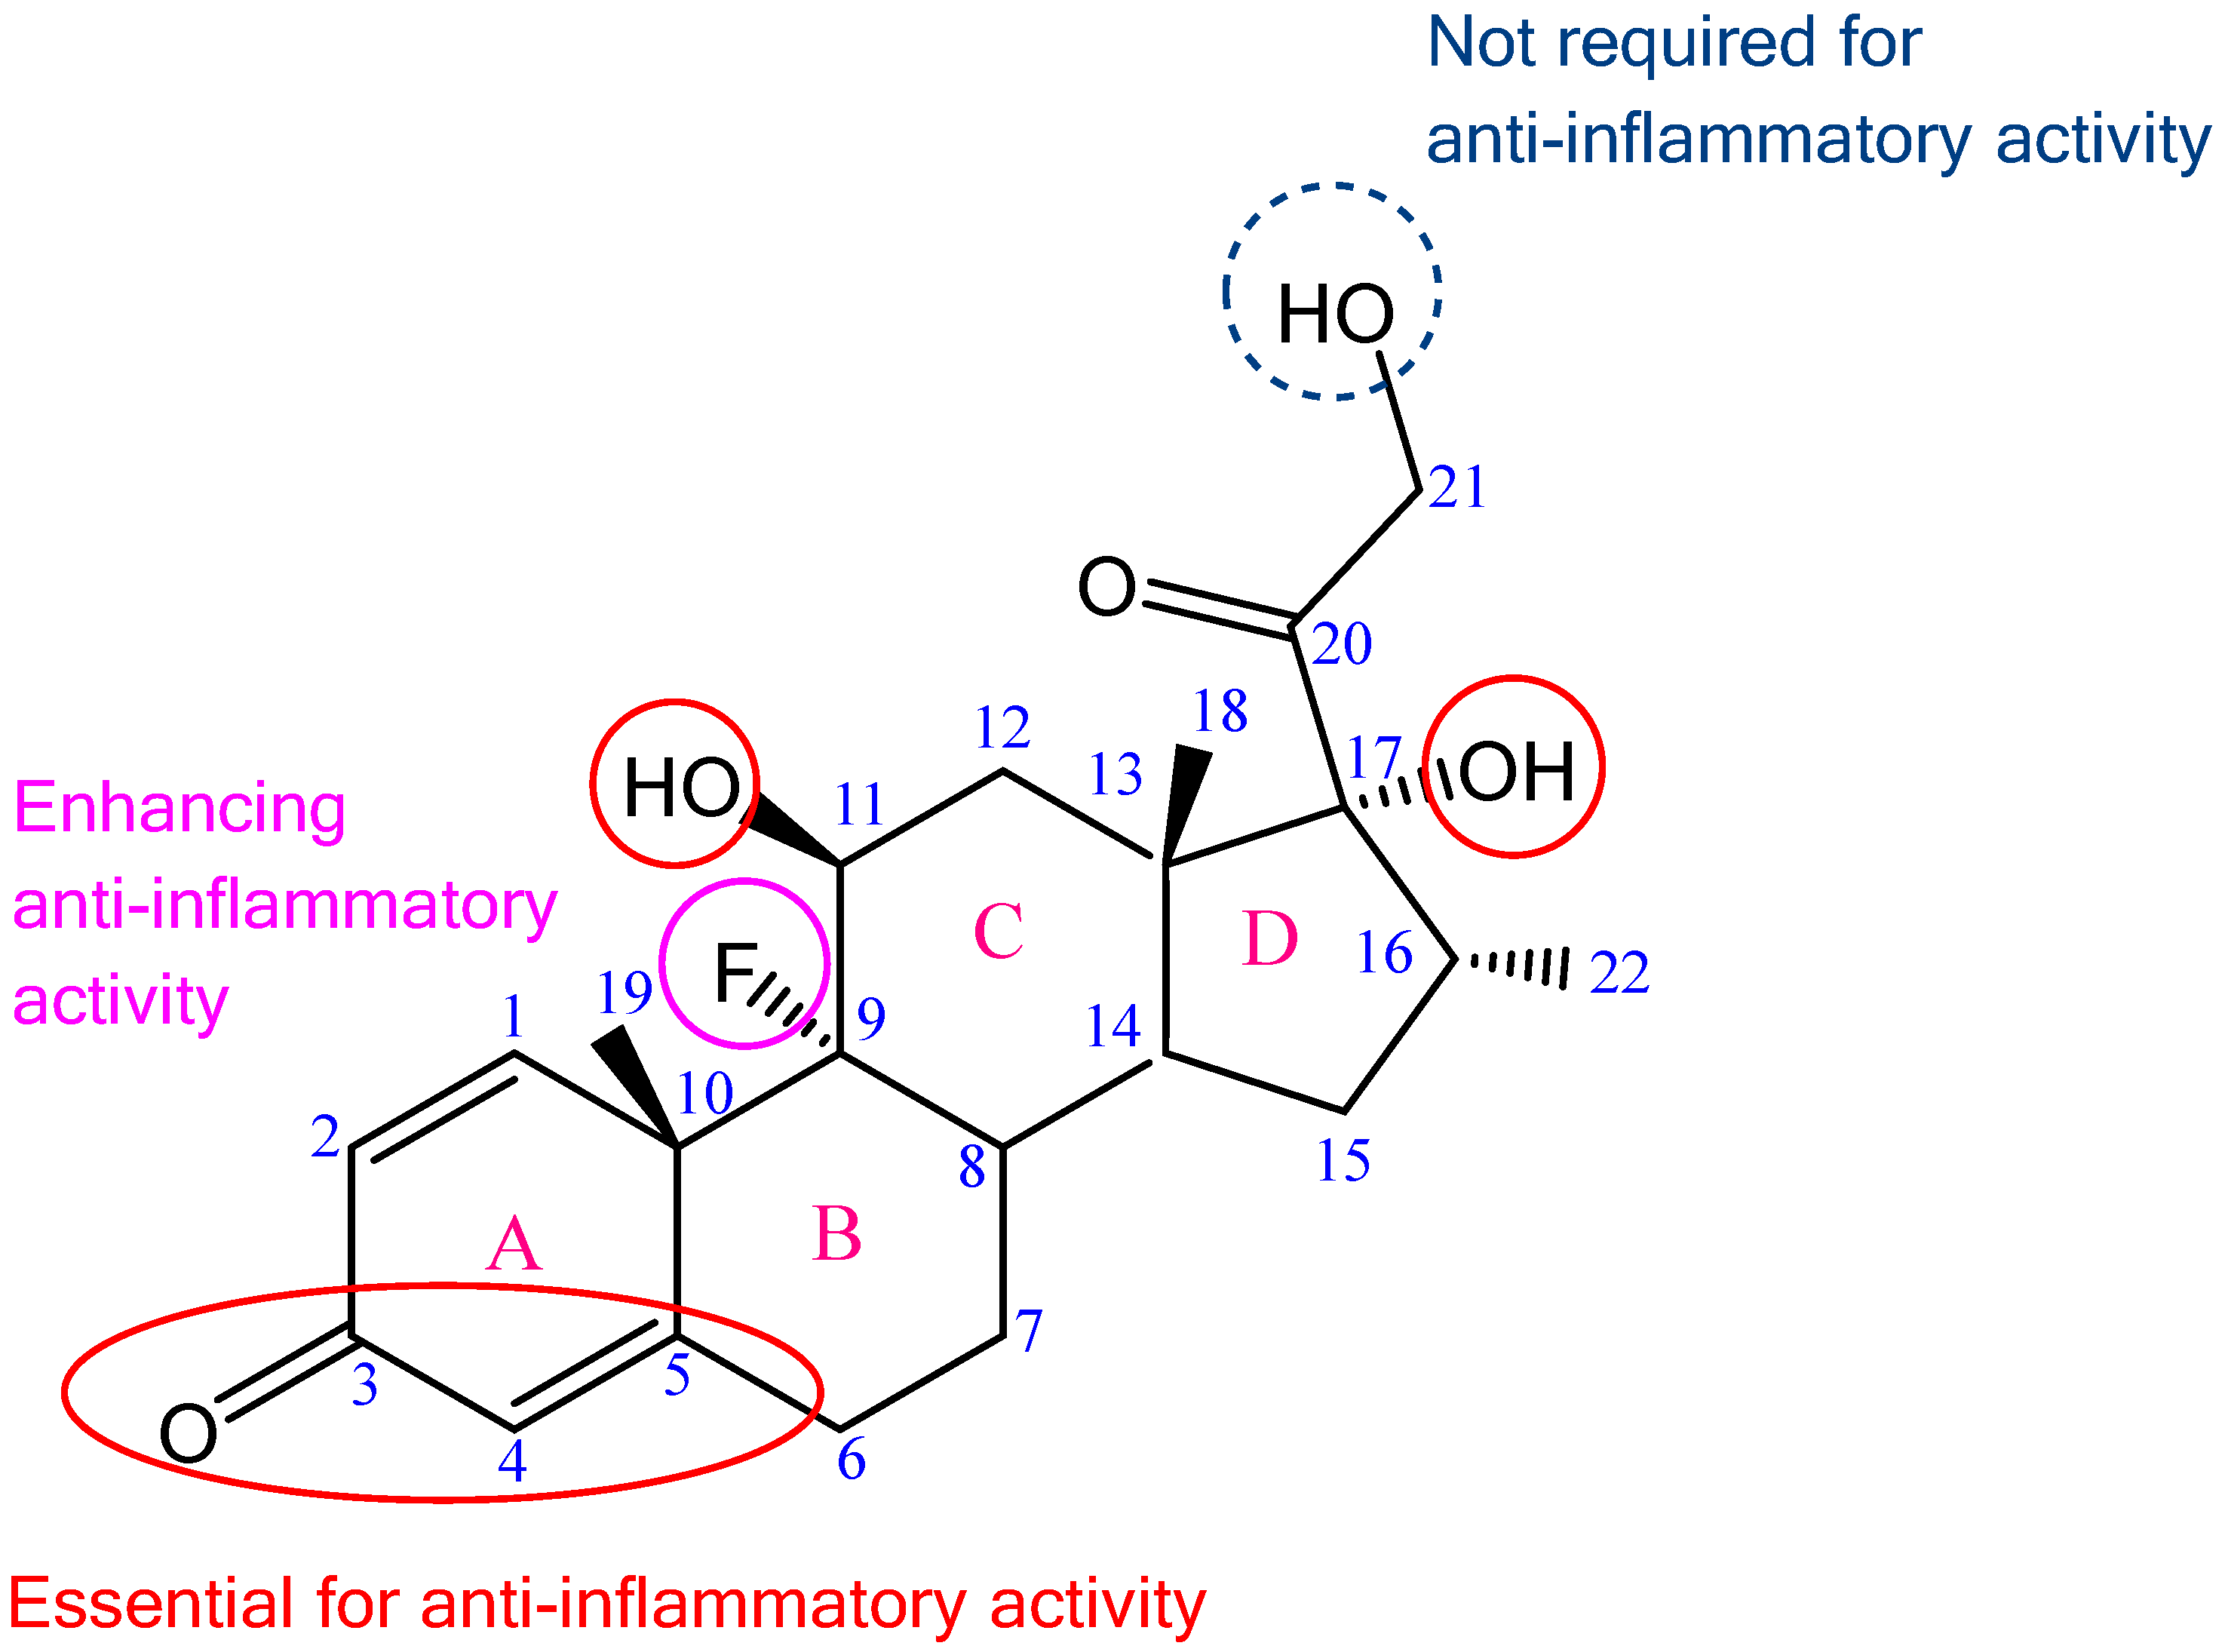
Chemical formula of DEX with highlighted structures responsible for glucocorticoid anti-inflammatory effect; adapted from [
15,
17].
Figure 1.
Chemical formula of DEX with highlighted structures responsible for glucocorticoid anti-inflammatory effect; adapted from [
15,
17].
Figure 2.
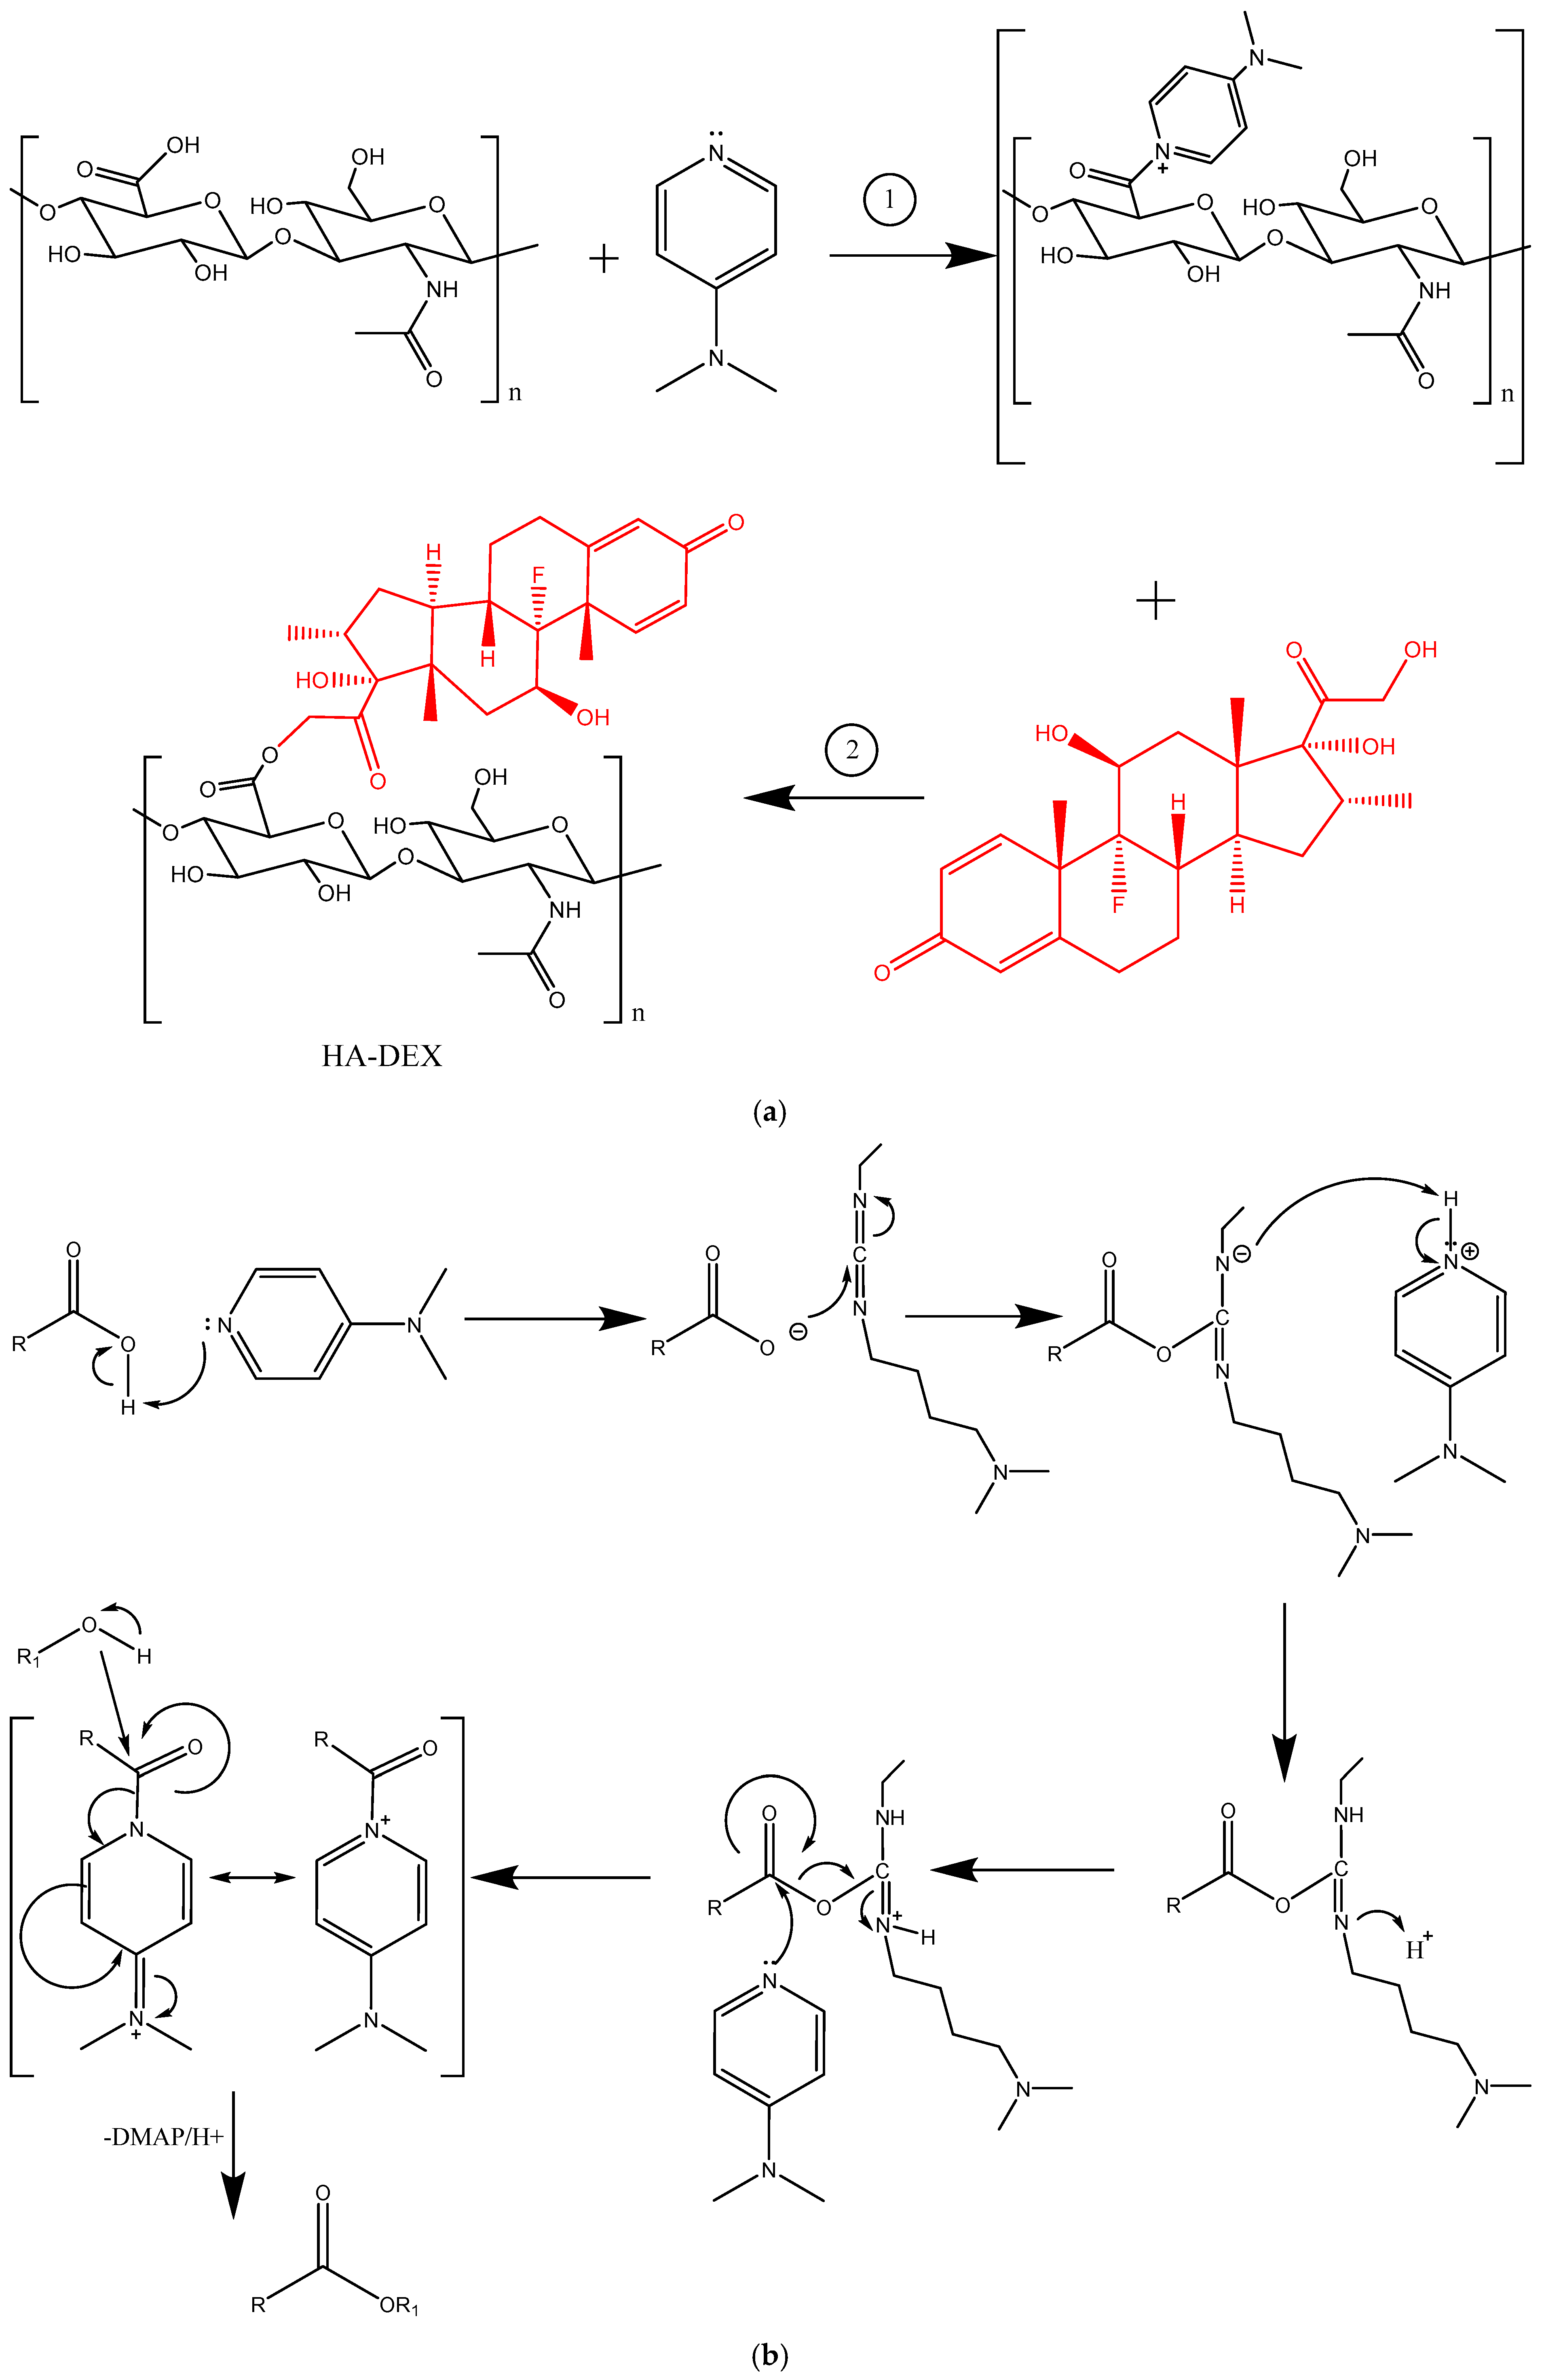
The synthesis scheme for HA-DEX (a) and the mechanism of esterification according to Steglich (b).
Figure 2.
The synthesis scheme for HA-DEX (a) and the mechanism of esterification according to Steglich (b).
Figure 3.
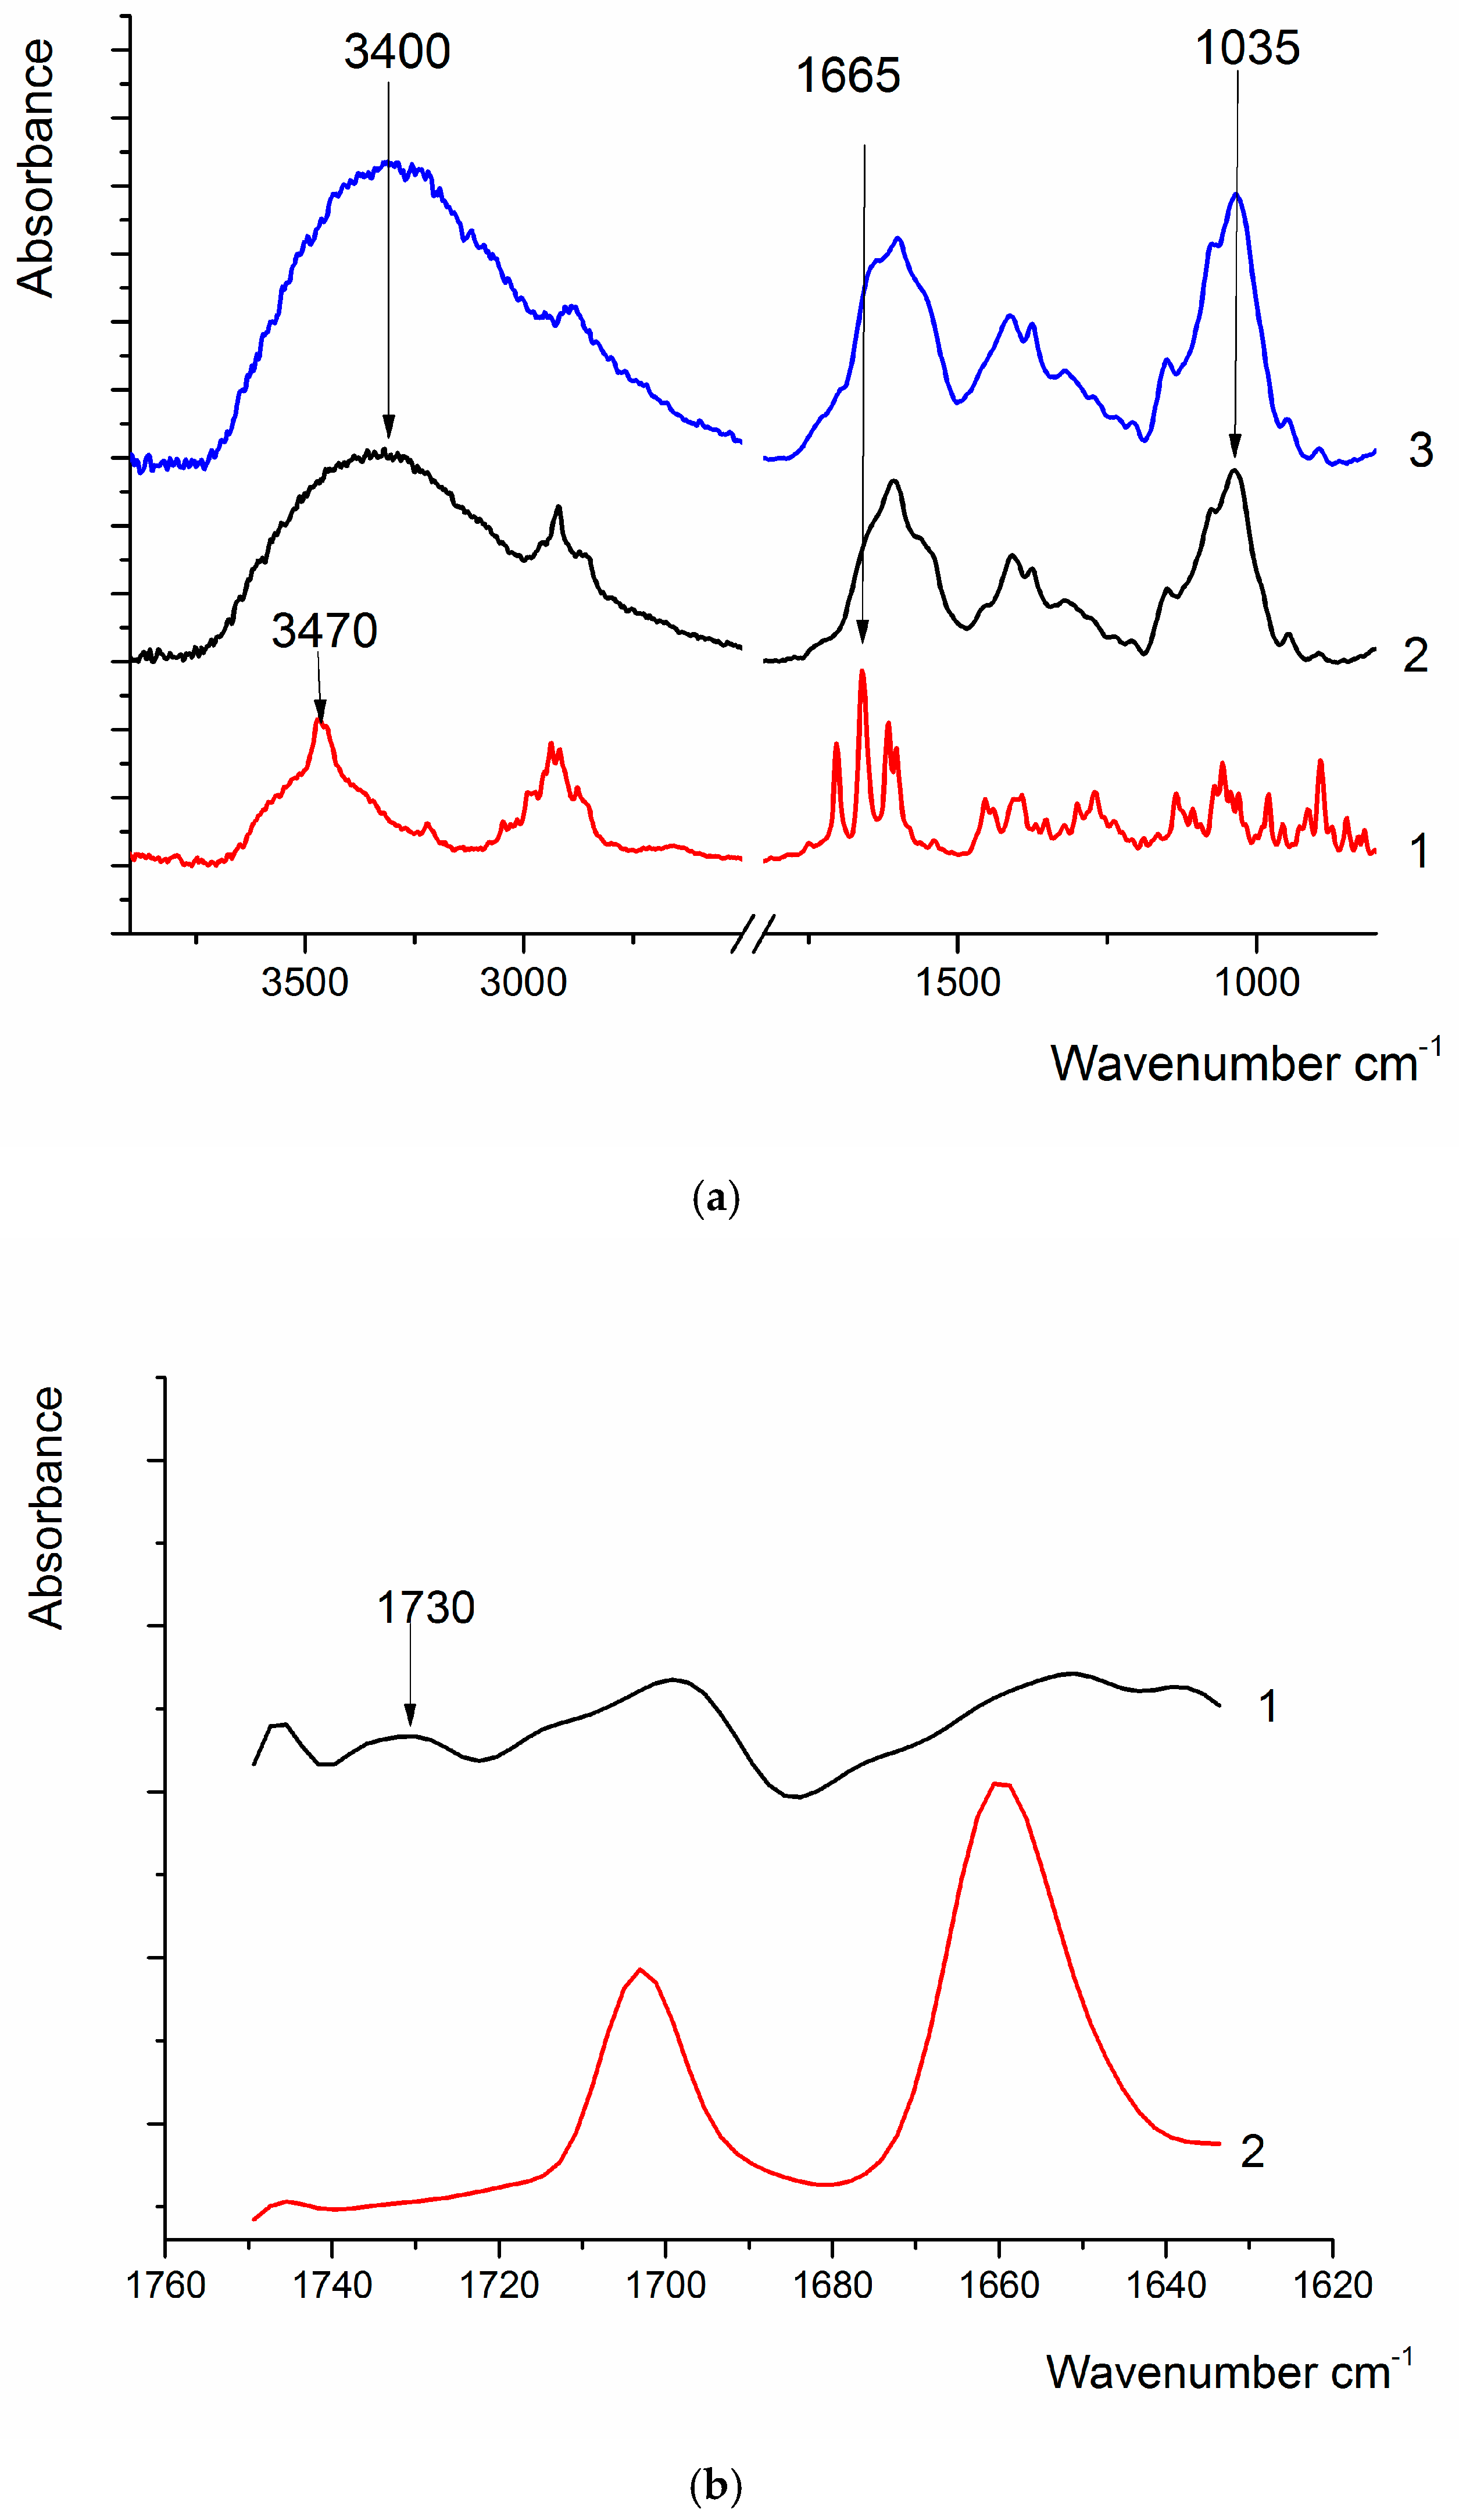
(a) FTIR spectra of DEX (1), HA (2), and HA-DEX (3); (b) FTIR spectrum of DEX (1) and the difference spectrum of HA-DEX and HA (2), obtained via spectral deconvolution.
Figure 3.
(a) FTIR spectra of DEX (1), HA (2), and HA-DEX (3); (b) FTIR spectrum of DEX (1) and the difference spectrum of HA-DEX and HA (2), obtained via spectral deconvolution.
Figure 4.
1H NMR (400 MHz, dimethyl sulfoxide -d6) spectrum of DEX, δ 7.31 (d, 1H), 6.25-6.22 (dd, 1H), 6.02 (s, 1H), 5.30-5.29 (dd, 1H), 4.97 (s, 1H), 4.71-4.68 (t, 1H), 4.53-4.48 (dd, 1H), 4.17-4.10 (m, 1H), 4.06 (d, 1H), 2.99-2.93 (m, 1H), 2.64-2.59 (m, 1H), 2.52-2.51 (t, 1H), 2.4-2.30 (m, 1H), 2.17-2.12 (m, 1H), 2.09 (d, 1H), 1.81-1.76 (m, 1H), 1.68-1.59 (m, 1H), 1.50 (s, 3H), 1.46-1.44 (m, 1H), 1.35-1.38 (dd, 1H), 1.11-1.05 (m, 1H), 0.88 (s, 3H), and 0.80 (d, 3H).
Figure 5.
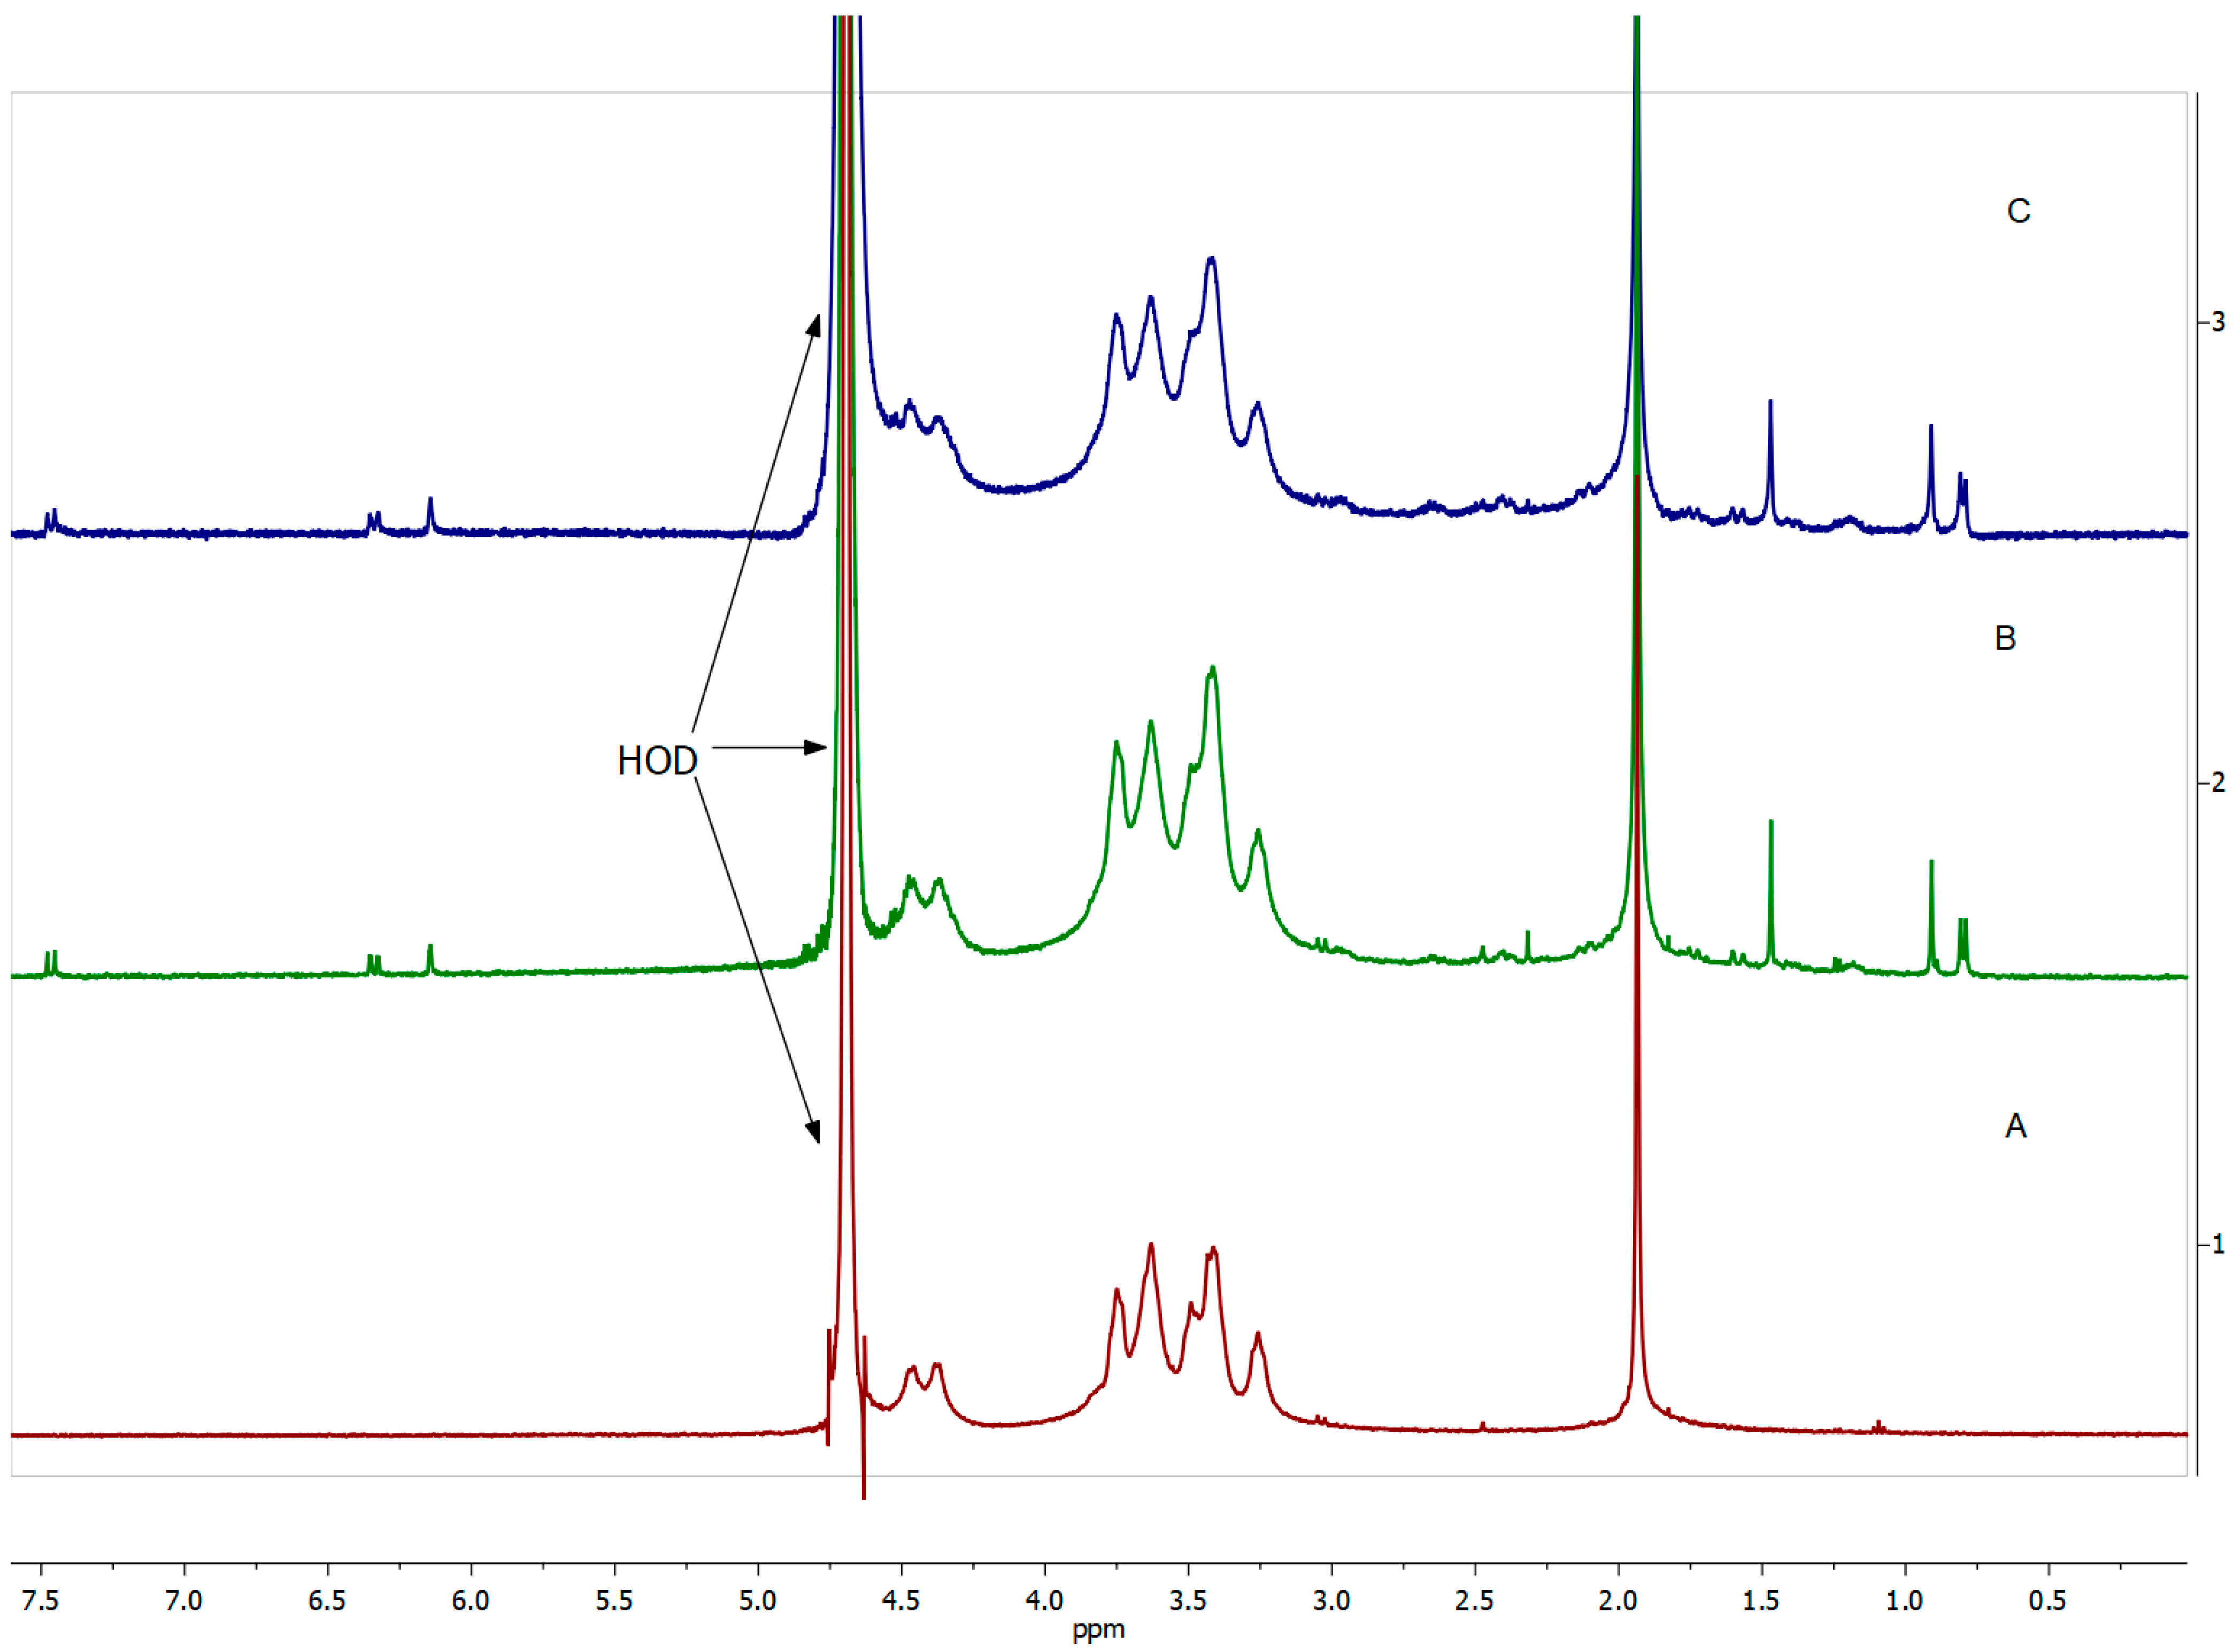
1H NMR spectra (400 MHz, D2O) of (A) HA, (B) HA-DEX-5, and (C) HA-DEX-10.
Figure 5.
1H NMR spectra (400 MHz, D2O) of (A) HA, (B) HA-DEX-5, and (C) HA-DEX-10.
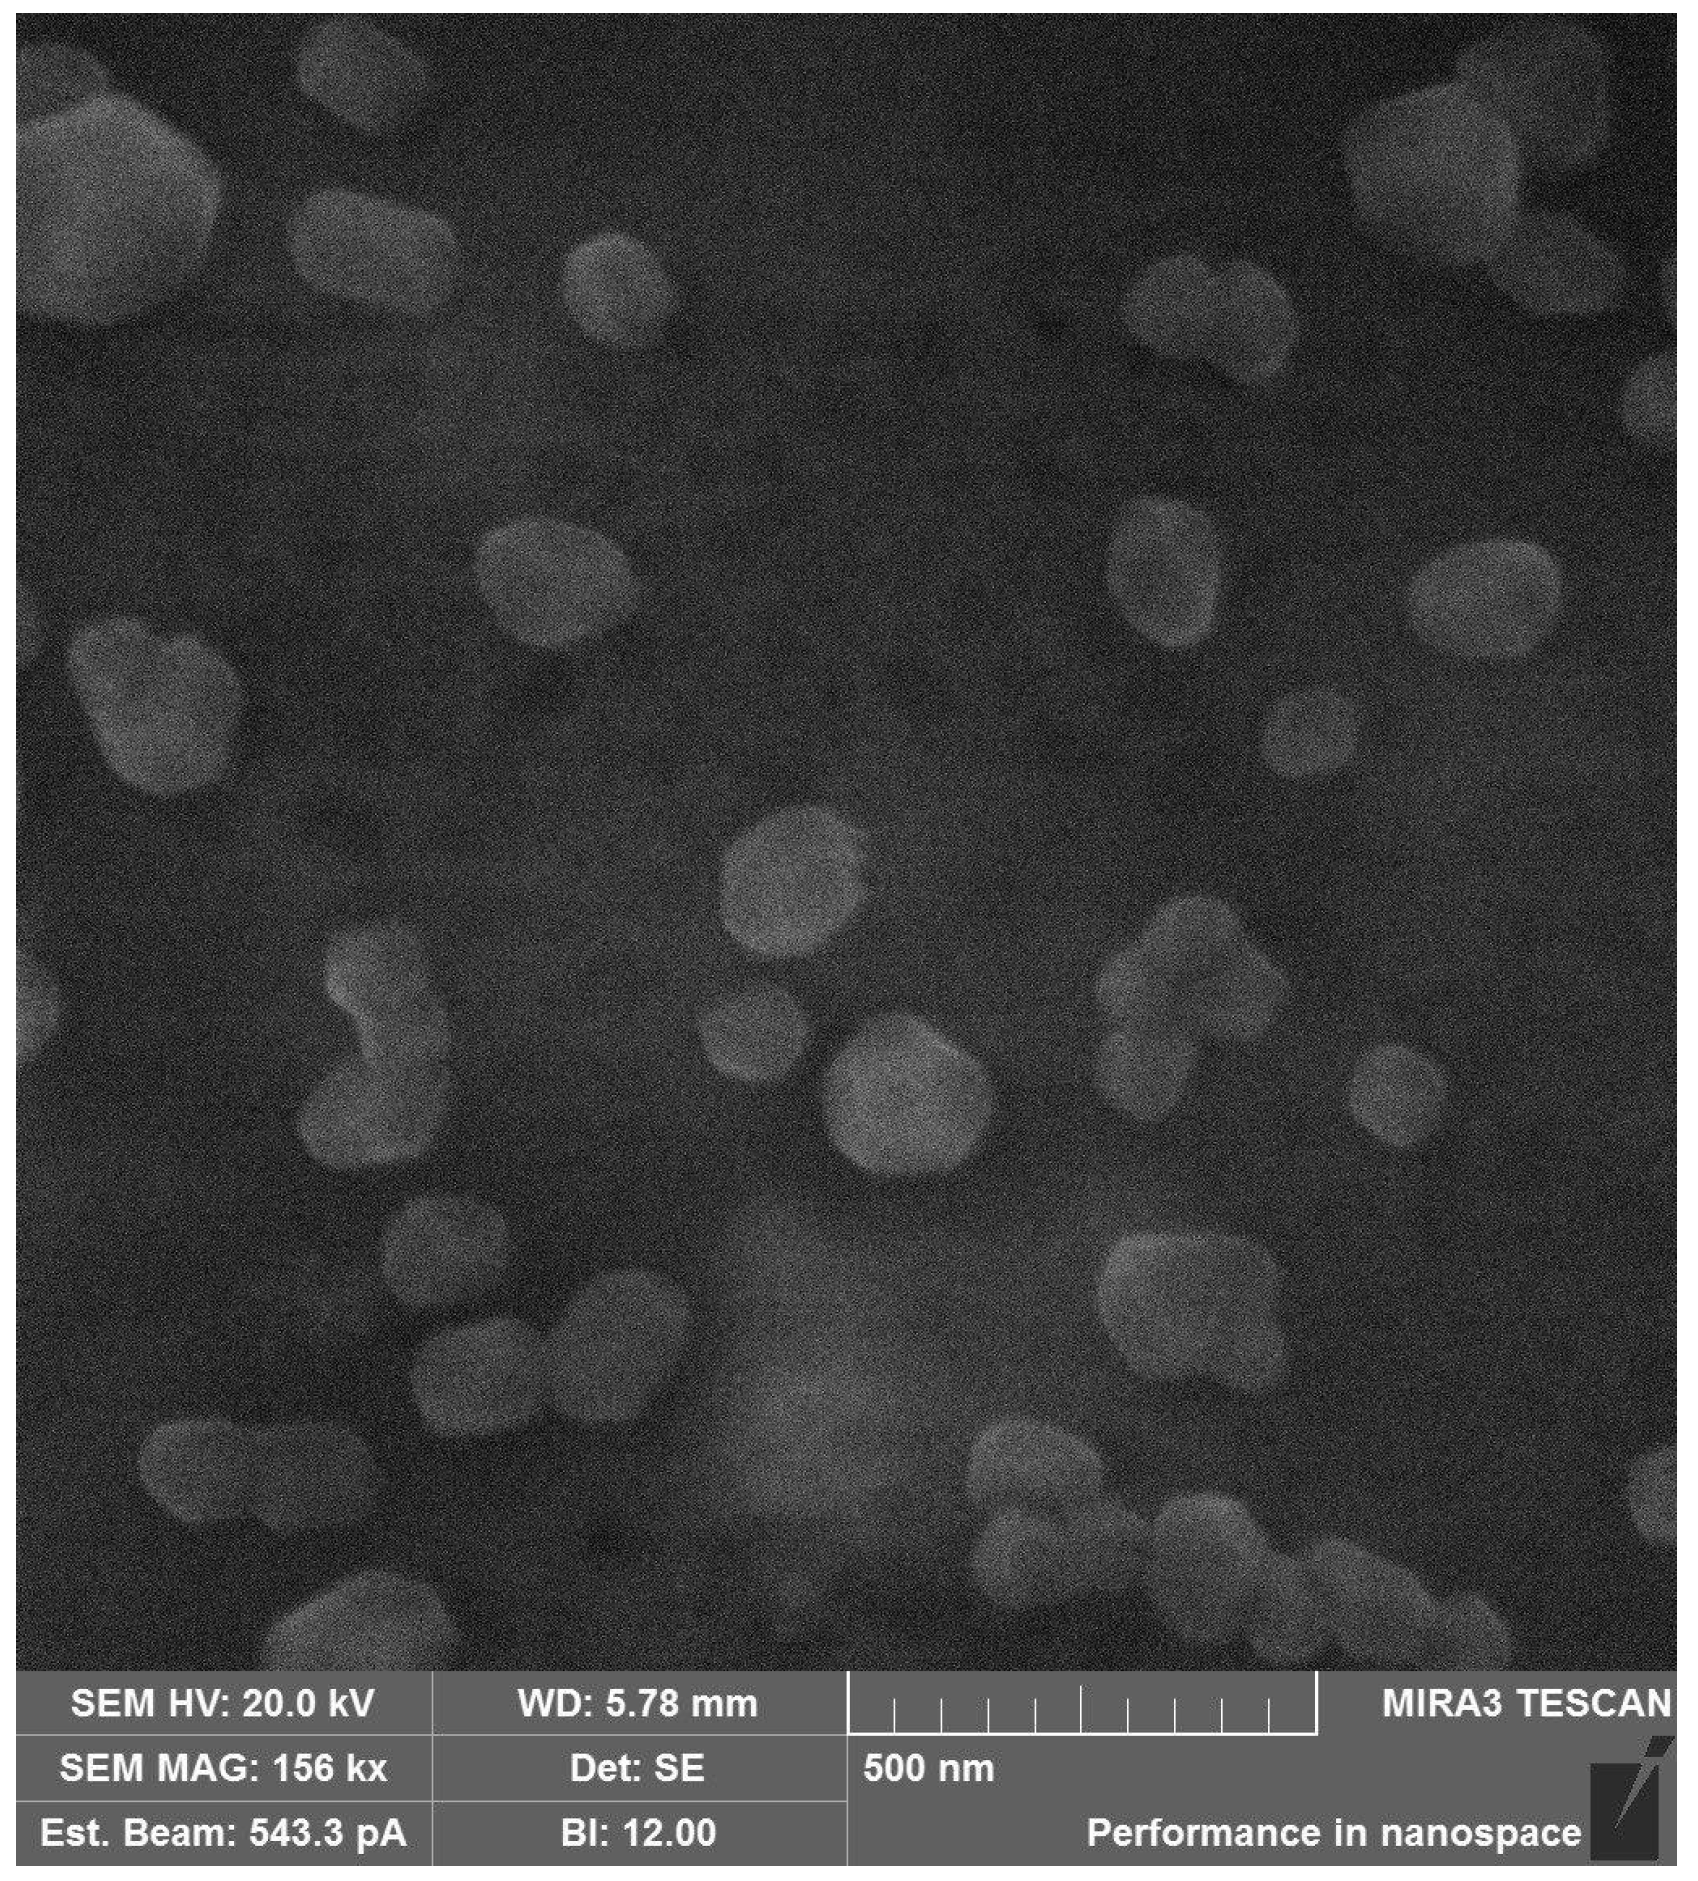
Figure 6.
SEM image of the HA-DEX-5 particles.
Figure 6.
SEM image of the HA-DEX-5 particles.
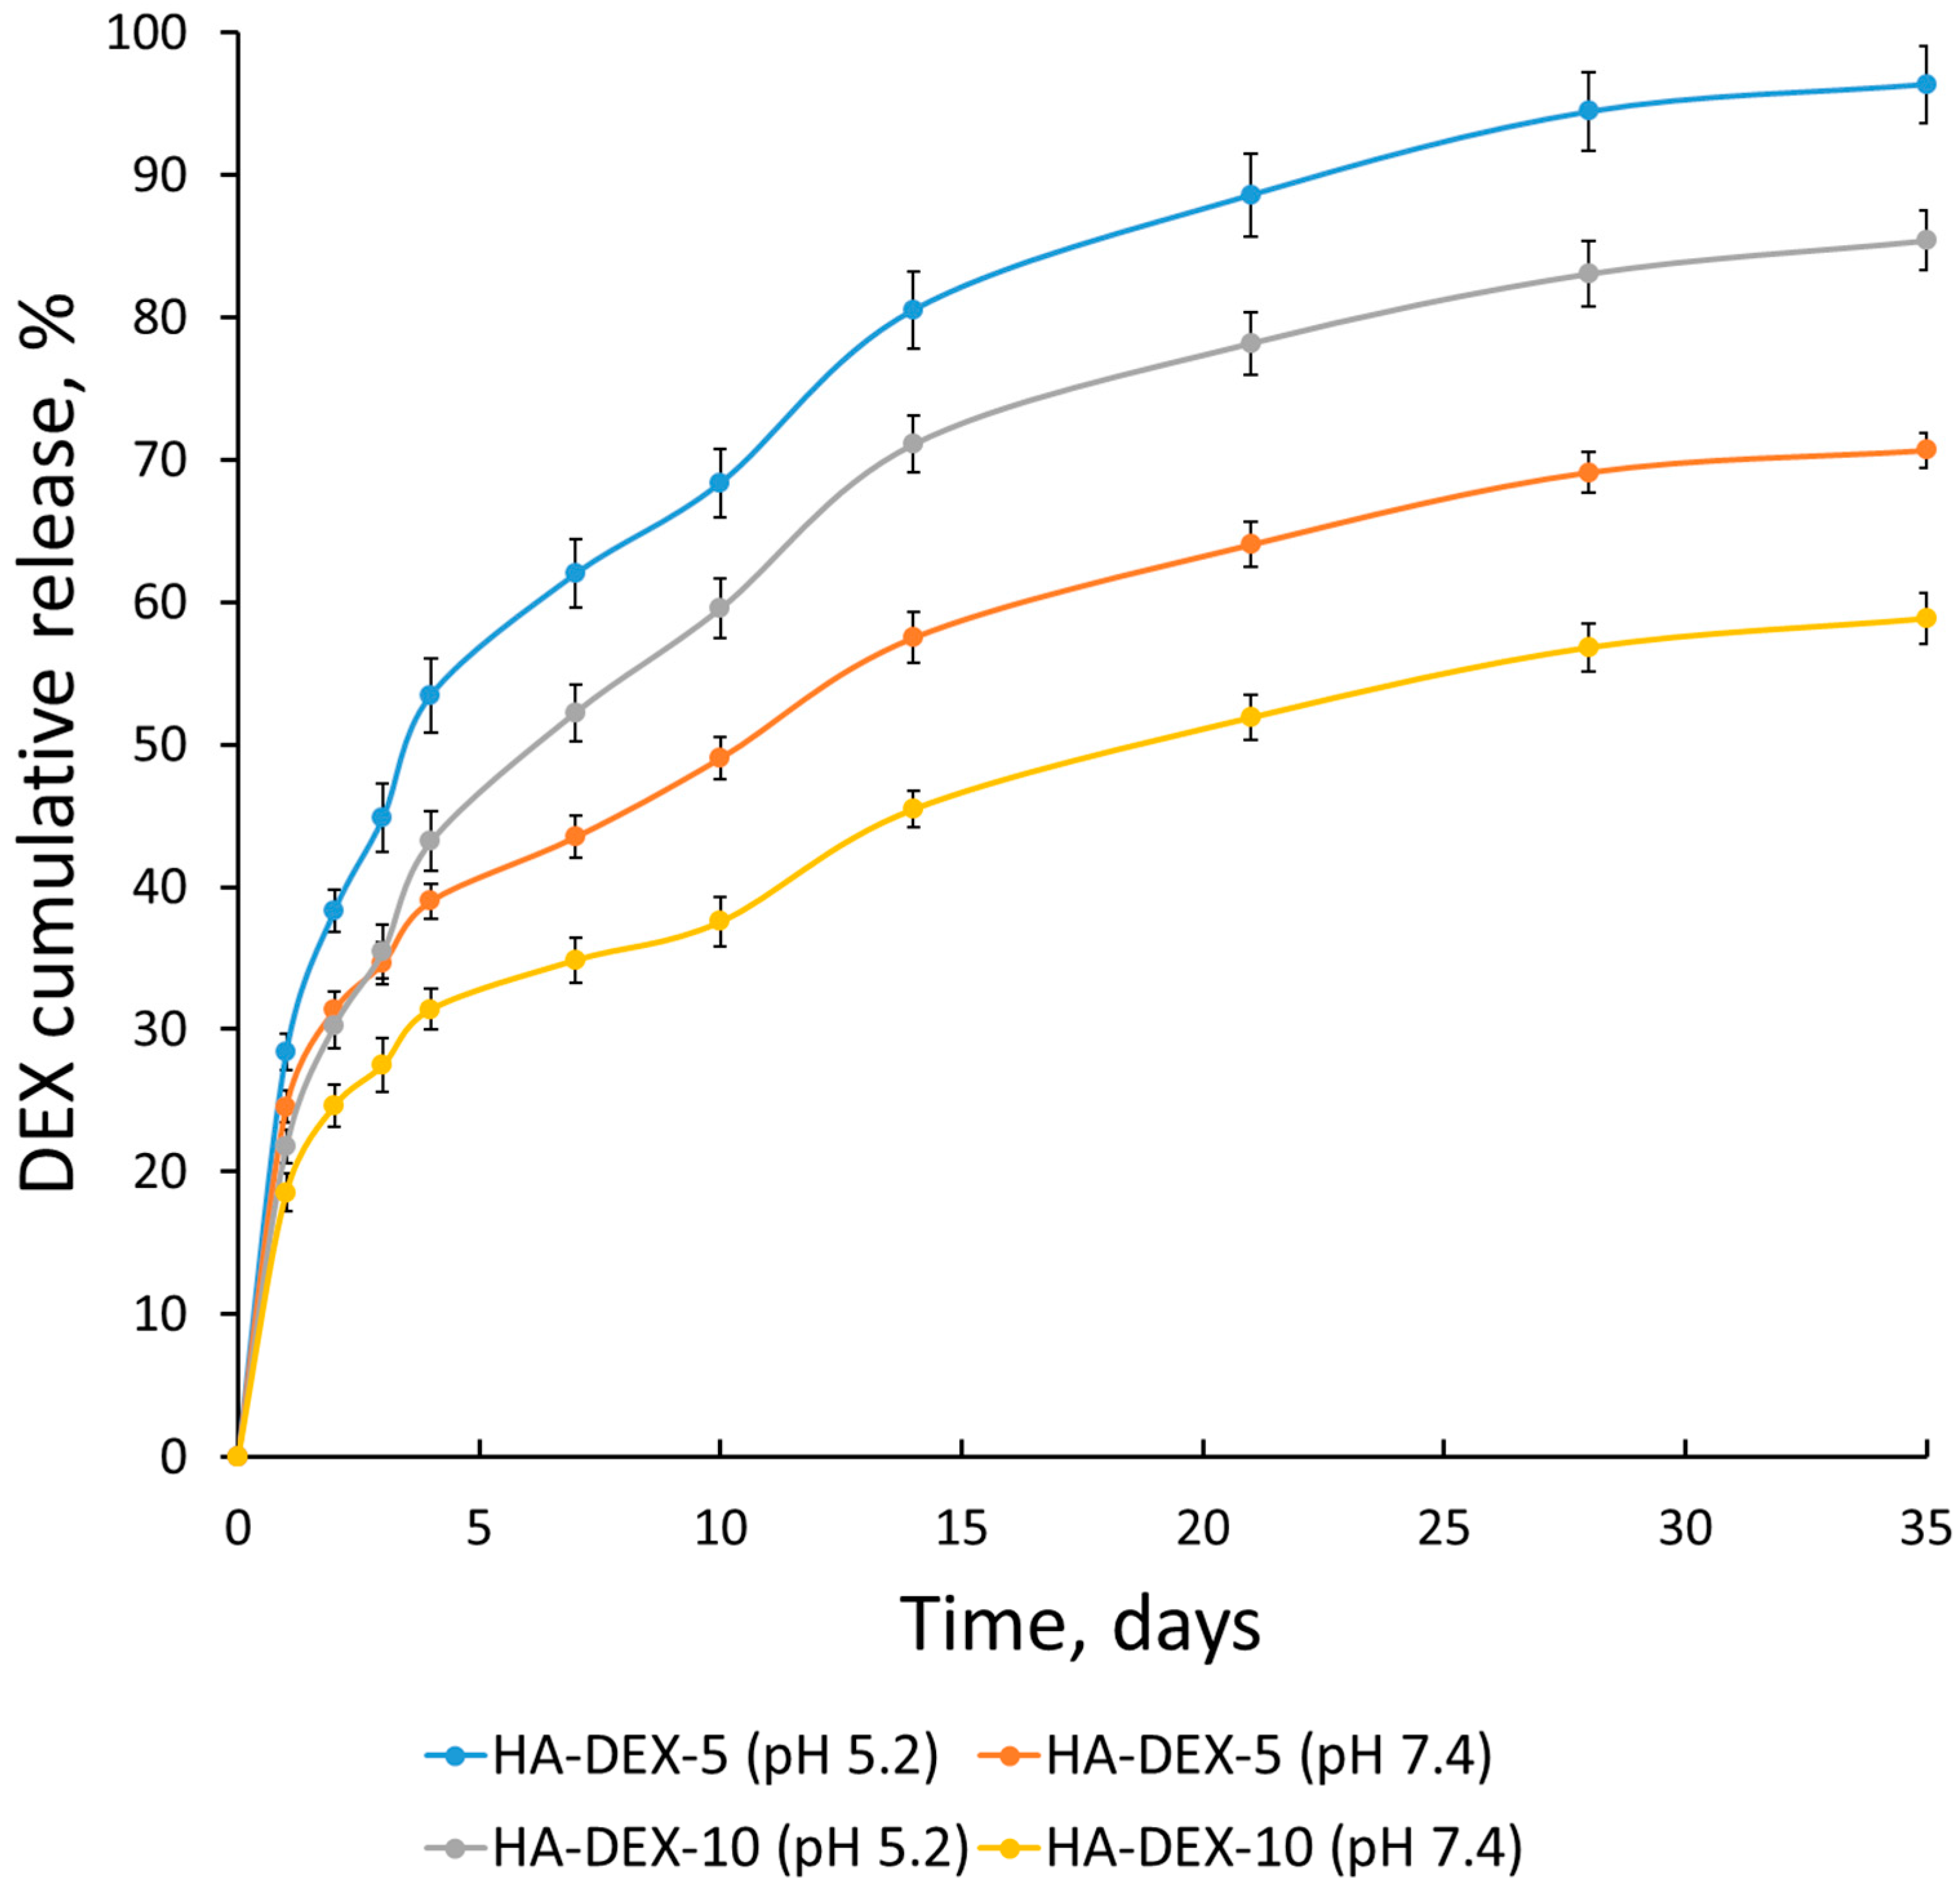
Figure 7.
Release kinetics of DEX from the HA-DEX particles in PB with pH 5.2 and PBS with pH 7.4 at 37 °C; n = 3, error bars represent standard deviation.
Figure 7.
Release kinetics of DEX from the HA-DEX particles in PB with pH 5.2 and PBS with pH 7.4 at 37 °C; n = 3, error bars represent standard deviation.
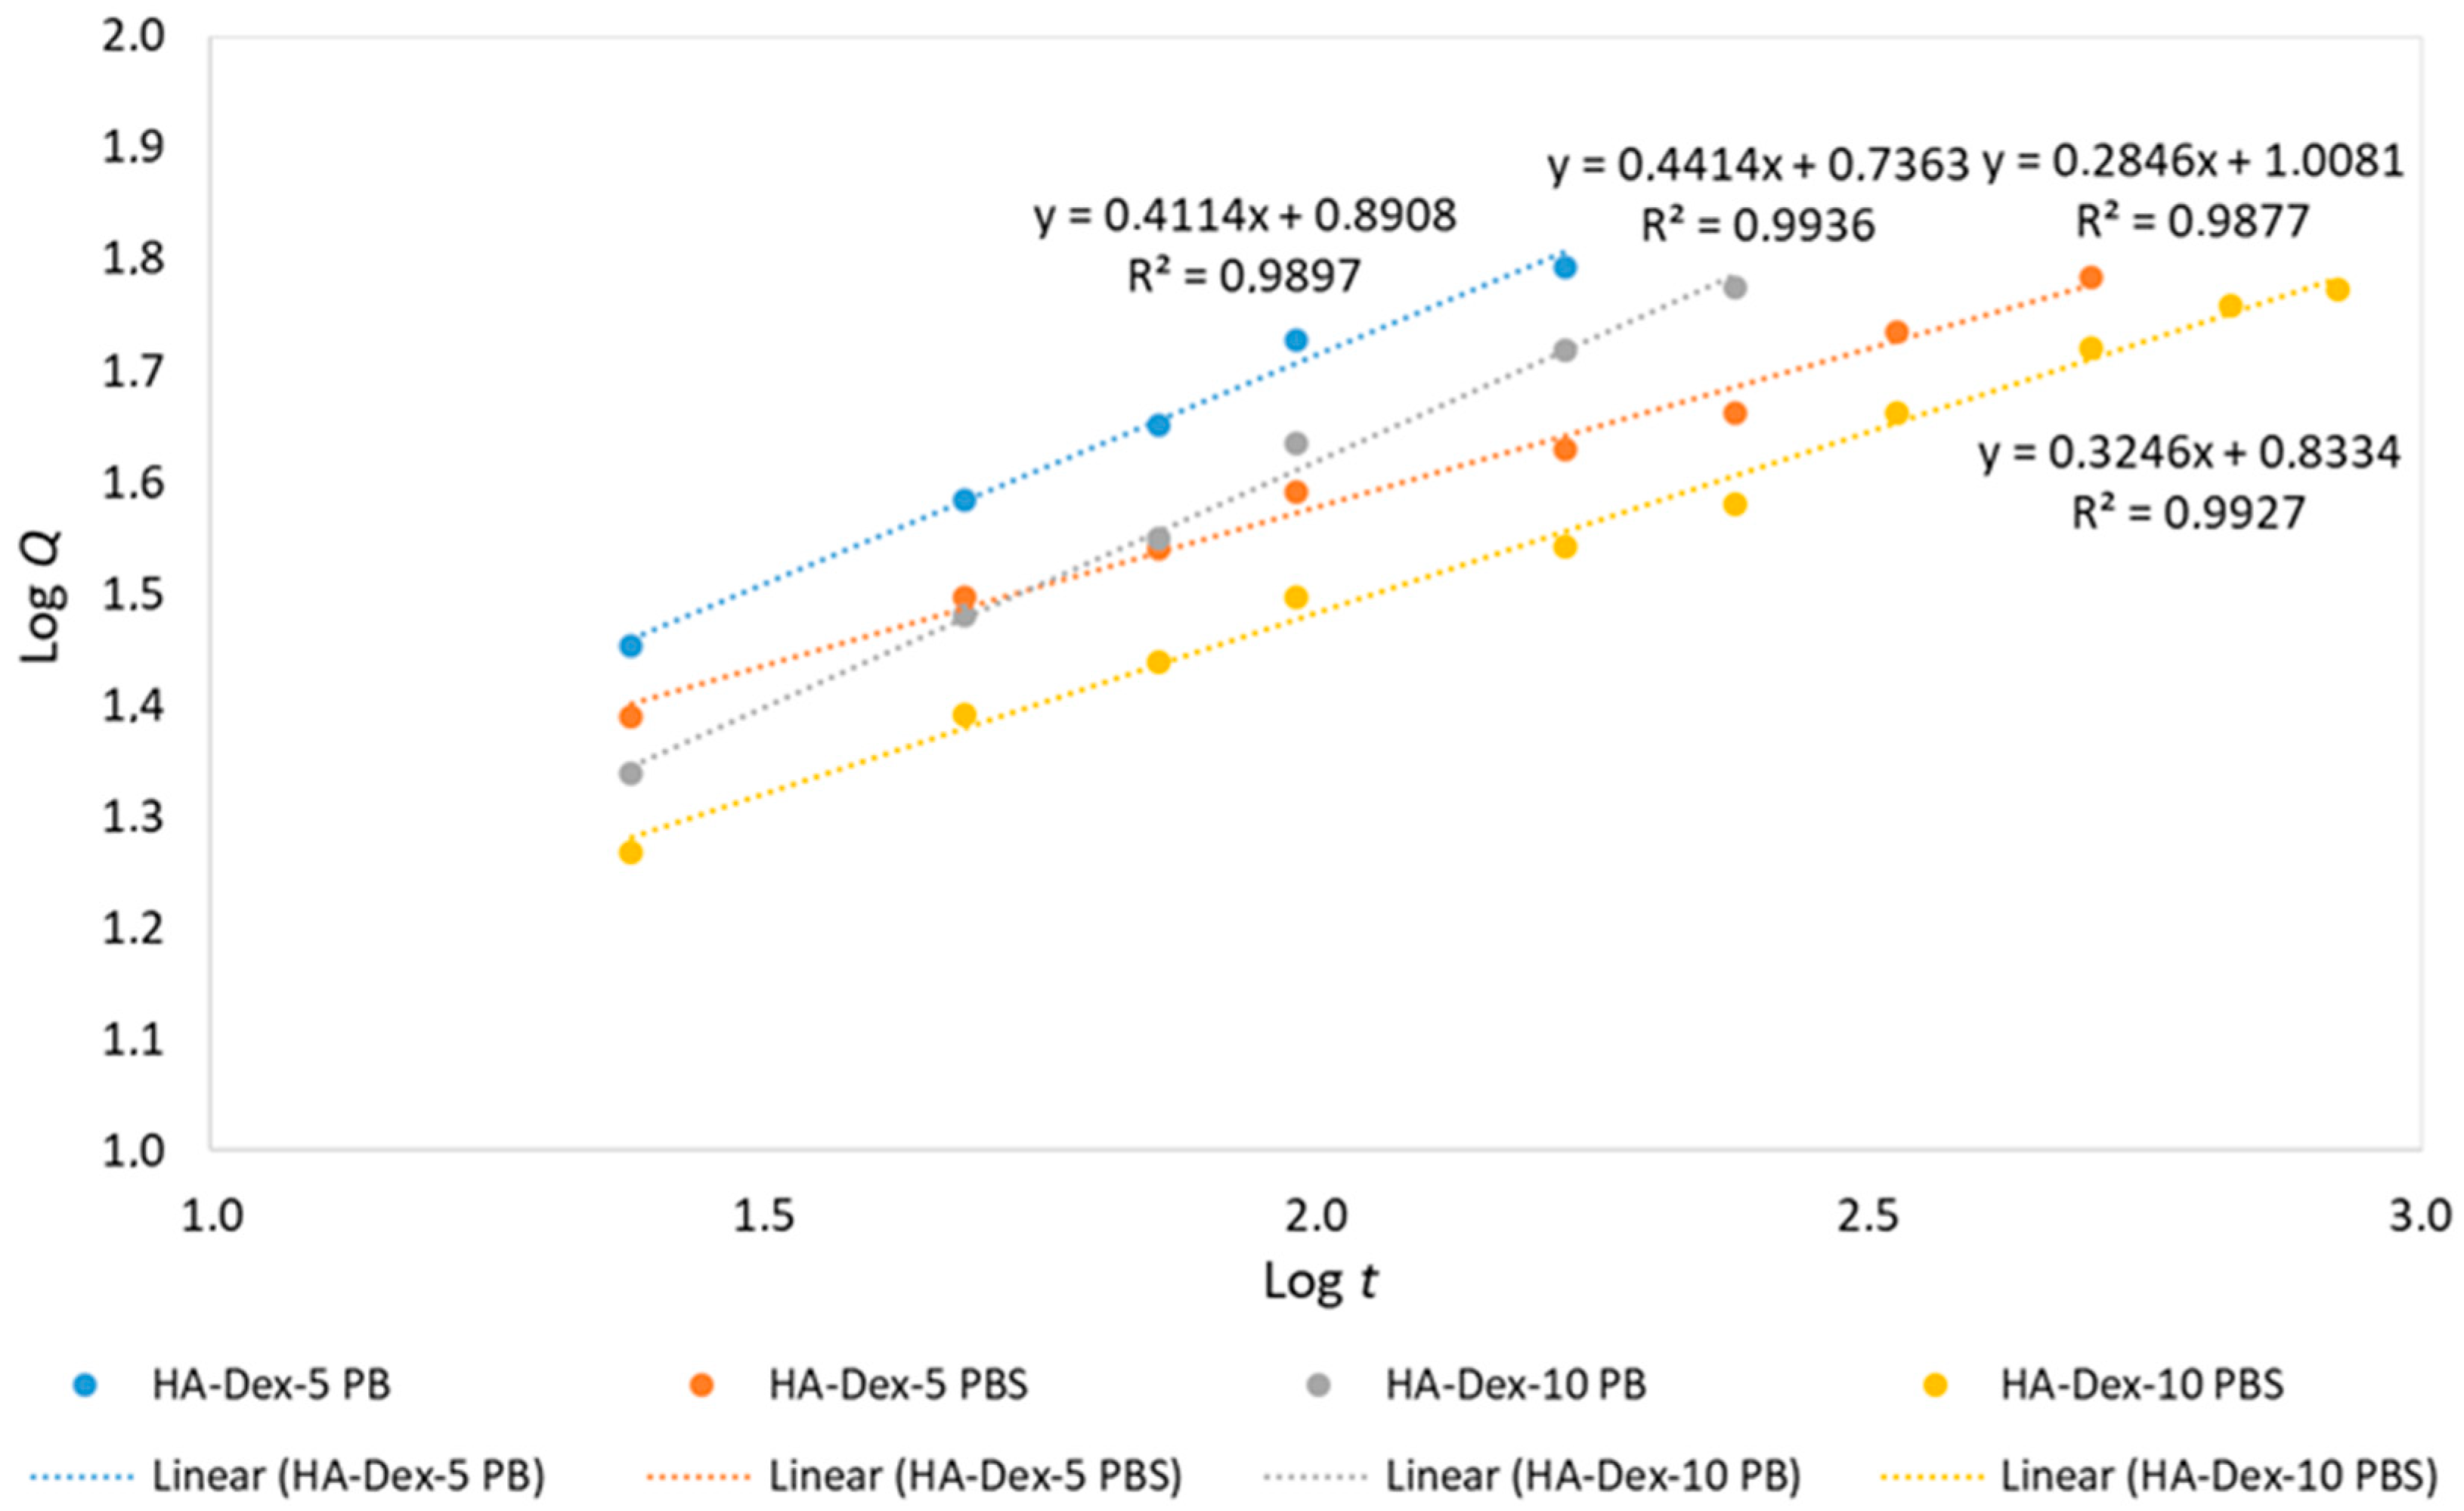
Figure 8.
Linearized release kinetics of DEX from HA-DEX conjugates.
Figure 8.
Linearized release kinetics of DEX from HA-DEX conjugates.
Table 1.
Synthesis conditions and characterization of HA-DEX conjugates.
Table 1.
Synthesis conditions and characterization of HA-DEX conjugates.
| Sample | Molar Ratio of Reagents | DS (%) by NMR | DEX-Content (μg/mg) |
|---|
| HA | DMAP | EDC | DEX |
|---|
| HA-DEX-3 | 1 | 0.2 | 4 | 0.03 | 2.1 | - |
| HA-DEX-5 | 1 | 0.2 | 4 | 0.05 | 3.1 | 31 |
| HA-DEX-10 | 1 | 0.2 | 4 | 0.1 | 5.0 | 53 |
Table 2.
Characteristics of HA-DEX particles in aqueous solutions (mean ± standard deviation, n = 3).
Table 2.
Characteristics of HA-DEX particles in aqueous solutions (mean ± standard deviation, n = 3).
| Sample | Dh (nm) | ζ-Potential (mV) |
|---|
| HA-Dex-3 | 244 ± 86 | −20.9 ± 0.9 |
| HA-Dex-5 | 330 ± 78 | −21.3 ± 0.7 |
| 259 ± 50 * |
| 348 ± 92 ** |
| HA-Dex-10 | 604 ± 166 | −25.6 ± 0.8 |
| 645 ± 54 * |
| 650 ± 80 ** |
Table 3.
Fitting parameters of DEX release kinetics based on the Korsmeyer–Peppas model.
Table 3.
Fitting parameters of DEX release kinetics based on the Korsmeyer–Peppas model.
| Sample | KKP | n | R2 |
|---|
| HA-DEX-5 (PB pH 5.2) | 7.8 | 0.411 | 0.9897 |
| HA-DEX-5 (PBS pH 7.4) | 10.2 | 0.285 | 0.9877 |
| HA-DEX-10 (PB pH 5.2) | 5.4 | 0.441 | 0.9936 |
| HA-DEX-10 (PBS pH 7.4) | 6.8 | 0.325 | 0.9927 |
Table 4.
Relative live cell content of the THP-1 cell line with YO-PRO-1–PI– phenotype after 24 h incubation in the presence of HA-DEX conjugates. Results (n ≥ 9) are shown as median and interquartile range, Me (Q25; Q75).
Table 4.
Relative live cell content of the THP-1 cell line with YO-PRO-1–PI– phenotype after 24 h incubation in the presence of HA-DEX conjugates. Results (n ≥ 9) are shown as median and interquartile range, Me (Q25; Q75).
| Sample | No TNFα | 2 ng/mL TNFα |
|---|
| Negative control | 95.82 (95.50; 96.57) | 95.87 (95.31; 96.14) |
| DEX | 96.23 (95.92; 96.35) | 95.47 (95.39; 95.64) |
| HA | 96.20 (96.18; 96.35) | 95.95 (95.42; 96.03) |
| HA-DEX-5 | 96.34 (96.20; 96.43) | 95.31 (95.17; 95.62) |
| HA-DEX-10 | 96.38 (95.90; 96.62) | 95.75 (95.46; 95.82) |
Table 5.
Relative content of THP-1 cell line cells in early stages of apoptosis (YO-PRO-1+PI– phenotype) after 24 h incubation in the presence of HA-DEX conjugates. Results (n ≥ 9) are shown as median and interquartile range, Me (Q25; Q75).
Table 5.
Relative content of THP-1 cell line cells in early stages of apoptosis (YO-PRO-1+PI– phenotype) after 24 h incubation in the presence of HA-DEX conjugates. Results (n ≥ 9) are shown as median and interquartile range, Me (Q25; Q75).
| Sample | No TNFα | 2 ng/mL TNFα |
|---|
| Negative control | 1.97 (1.56; 2.51) | 2.43 (1.78; 2.93) |
| DEX | 1.41 (1.15; 2.10) * | 2.63 (1.74; 3.34) |
| HA | 1.94 (1.64; 2.08) | 2.66 (1.98; 2.86) |
| HA-DEX-5 | 1.96 (1.84; 1.97) | 3.00 (2.63; 3.67) |
| HA-DEX-10 | 1.90 (1.27; 2.57) | 3.01 (2.38; 3.18) |
Table 6.
Relative content of THP-1 cell line cells in late stages of apoptosis and/or necrosis (YO-PRO-1+PI+ phenotype) after 24 h incubation in the presence of HA-DEX conjugates. Results (n ≥ 9) are shown as median and interquartile range, Me (Q25; Q75).
Table 6.
Relative content of THP-1 cell line cells in late stages of apoptosis and/or necrosis (YO-PRO-1+PI+ phenotype) after 24 h incubation in the presence of HA-DEX conjugates. Results (n ≥ 9) are shown as median and interquartile range, Me (Q25; Q75).
| Sample | No TNFα | 2 ng/mL TNFα |
|---|
| Negative control | 1.89 (1.71; 2.72) | 1.80 (1.48; 2.62) |
| DEX | 2.32 (1.94; 2.74) | 1.94 (1.25; 2.04) |
| HA | 1.78 (1.73; 2.17) | 1.80 (1.07; 2.01) |
| HA-DEX-5 | 1.69 (1.61; 1.84) | 1.31 (1.22; 1.75) |
| HA-DEX-10 | 1.72 (1.50; 2.05) | 1.07 (0.96; 2.08) |
Table 7.
Relative live cell content of the THP-1 cell line with YO-PRO-1–PI– phenotype after 24 h incubation in the presence of HA-DEX conjugates. Results (n ≥ 9) are shown as median and interquartile range, Me (Q25; Q75).
Table 7.
Relative live cell content of the THP-1 cell line with YO-PRO-1–PI– phenotype after 24 h incubation in the presence of HA-DEX conjugates. Results (n ≥ 9) are shown as median and interquartile range, Me (Q25; Q75).
| Sample | No TNFα | 2 ng/mL TNFα |
|---|
| Negative control | 95.82 (95.50; 96.57) | 95.87 (95.31; 96.14) |
| DEX | 95.88 (95.82; 96.19) | 95.82 (95.51; 95.92) |
| HA | 96.38 (95.73; 96.46) | 96.03 (95.80; 96.11) |
| HA-DEX-5 | 96.18 (95.79; 96.62) | 95.56 (95.42; 95.92) |
| HA-DEX-10 | 96.16 (96.01; 96.56) | 95.98 (95.89; 96.01) |
Table 8.
Relative content of THP-1 cell line cells in early stages of apoptosis (YO-PRO-1+PI– phenotype) after 24 h incubation in the presence of HA-DEX conjugates. Results (n ≥ 9) are shown as median and interquartile range, Me (Q25; Q75).
Table 8.
Relative content of THP-1 cell line cells in early stages of apoptosis (YO-PRO-1+PI– phenotype) after 24 h incubation in the presence of HA-DEX conjugates. Results (n ≥ 9) are shown as median and interquartile range, Me (Q25; Q75).
| Sample | No TNFα | 2 ng/mL TNFα |
|---|
| Negative control | 1.97 (1.56; 2.51) | 2.43 (1.78; 2.93) |
| DEX | 2.68 (0.77; 2.80) | 2.97 (1.32; 3.19) |
| HA | 1.93 (1.54; 2.24) | 2.18 (2.02; 2.54) |
| HA-DEX-5 | 2.47 (1.79; 3.15) | 3.05 (2.76; 3.47) * |
| HA-DEX-10 | 1.90 (1.67; 2.71) | 3.11 (2.42; 3.31) |
Table 9.
Relative content of THP-1 cell line cells in late stages of apoptosis and/or necrosis (YO-PRO-1+PI+ phenotype) after 24 h incubation in the presence of HA-DEX conjugates. Results (n ≥ 9) are shown as median and interquartile range, Me (Q25; Q75).
Table 9.
Relative content of THP-1 cell line cells in late stages of apoptosis and/or necrosis (YO-PRO-1+PI+ phenotype) after 24 h incubation in the presence of HA-DEX conjugates. Results (n ≥ 9) are shown as median and interquartile range, Me (Q25; Q75).
| Sample | No TNFα | 2 ng/mL TNFα |
|---|
| Negative control | 1.89 (1.71; 2.72) | 1.80 (1.48; 2.62) |
| DEX | 1.45 (1.38; 2.84) | 1.80 (1.26; 2.71) |
| HA | 1.98 (1.60; 2.16) | 1.79 (1.35; 2.05) |
| HA-DEX-5 | 1.36 (0.74; 1.83) * | 1.21 (1.06; 1.60) |
| HA-DEX-10 | 1.72 (1.23; 2.14) | 1.11 (0.67; 1.70) * |
Table 10.
Effect of HA-DEX conjugates (1 μg/mL DEX) on the activation level of the THP-1 cell line. Results (n = 9) are presented as conditional CD54 fluorescence units (MFI units) and summarized as median and interquartile range, Me (Q25; Q75).
Table 10.
Effect of HA-DEX conjugates (1 μg/mL DEX) on the activation level of the THP-1 cell line. Results (n = 9) are presented as conditional CD54 fluorescence units (MFI units) and summarized as median and interquartile range, Me (Q25; Q75).
| Sample | No TNFα | 2 ng/mL TNFα |
|---|
| Negative control | 0.609 (0.551; 0.679) | 4.452 (4.164; 5.232) |
| DEX | 0.583 (0.567; 0.593) | 2.122 (1.357; 2.330) *** |
| HA | 0.561 (0.444; 0.583) | 5.573 (3.430; 6.332) |
| HA-DEX-5 | 0.549 (0.520; 0.592) | 1.694 (1.270; 2.353) *** |
| HA-DEX-10 | 0.566 (0.528; 0.567) | 1.791 (1.300; 2.125) *** |
Table 11.
Effect of HA-DEX conjugates (10 μg/mL DEX) on the activation level of the THP-1 cell line. Results (n = 9) are presented as conditional CD54 fluorescence units (MFI units) and summarized as median and interquartile range, Me (Q25; Q75).
Table 11.
Effect of HA-DEX conjugates (10 μg/mL DEX) on the activation level of the THP-1 cell line. Results (n = 9) are presented as conditional CD54 fluorescence units (MFI units) and summarized as median and interquartile range, Me (Q25; Q75).
| Sample | No TNFα | 2 ng/mL TNFα |
|---|
| Negative control | 0.609 (0.551; 0.679) | 4.452 (4.164; 5.232) |
| DEX | 3.203 (2.307; 3.748) | 5.129 (3.983; 6.054) |
| HA | 0.550 (0.437; 0.590) | 4.715 (3.981; 6.346) |
| HA-DEX-5 | 0.772 (0.650; 0.864) | 2.514 (2.057; 2.597) |
| HA-DEX-10 | 0.606 (0.594; 0.641) | 2.237 (1.428; 2.485) |
