1. Introduction
Systemic and myocardial inflammation plays a central role in the pathophysiology of myocardial infarction (MI) and post-MI recovery. Following the ischemic insult of MI, there is a rapid and robust activation of the innate immune system, with leukocyte mobilization critical to both injury propagation and subsequent repair. In the 24 to 48 h after MI, acute leukocytosis occurs, characterized by an initial surge in circulating neutrophils followed by a rise in monocytes [
1,
2,
3]. These myeloid-derived cells originate from hematopoietic reservoirs such as the bone marrow and spleen and are actively recruited to the ischemic myocardium via chemokine-mediated signaling [
4,
5]. While their role is initially reparative—clearing necrotic debris and promoting tissue remodeling—prolonged or dysregulated inflammation can contribute to adverse left ventricular (LV) remodeling, scar expansion, and ultimately, heart failure (HF) [
6,
7].
Prior observational studies have demonstrated that elevated neutrophil counts or neutrophil-to-lymphocyte ratios (NLRs) at the time of MI are associated with an increased risk of subsequent HF and mortality [
8,
9]. These findings underscore the potential of neutrophils to act as biomarkers of adverse outcomes. However, these studies generally rely on static measurements of immune cells at a single time point—either pre- or post-MI—which limits our understanding of the dynamic trajectory of leukocyte subsets in the acute peri-MI window. Such temporal patterns may more accurately reflect the inflammatory phenotype of individual patients and its relationship to myocardial injury and recovery [
10,
11].
Recent studies suggest that immune cell kinetics—especially early shifts in neutrophil and monocyte populations—may influence infarct healing and predict long-term outcomes, such as LV dysfunction and mortality [
12]. Yet, few investigations have leveraged serial immune profiling to explore how MI severity and clinical covariates relate to these dynamic changes and whether such shifts are independently associated with post-MI survival [
13,
14].
In this study of patients with ST-elevation myocardial infarction (STEMI) confirmed by laboratory markers of acute myocardial injury, we leveraged high-resolution, individual-level serial measurements of circulating immune cell subsets. Our goals were twofold: first, examine how MI severity and clinical features influence acute changes in immune subsets, and second, assess the prognostic significance of these immune responses—particularly the peri-STEMI dynamics of neutrophils and monocytes—on post-MI mortality.
Perspective
We observed that higher intra-individual serial increases in neutrophil counts and proportions within 24 h of ST-elevation myocardial infarction are significantly associated with mortality, independent of the extent of troponin elevation.
These findings suggest that acute changes in circulating immune subsets during myocardial infarction may provide important prognostic information for subsequent adverse events.
Future investigations of the factors driving acute alterations in neutrophil response during myocardial infarction, as well as how intervening in these responses may alter post-myocardial infarction remodeling and outcomes, may be warranted.
2. Results
2.1. Sample Characteristics
The study design and cohort selection method is shown in
Figure 1. After screening 25,114 individuals with a diagnosis of MI in the NMEDW, all individuals who did not have a STEMI diagnosis and troponin peak of ≥5 ng/mL were excluded, leaving 1725 individuals with STEMI. Of these, 1031 individuals met the additional inclusion criteria of having pre-peak troponin levels measured < 10 ng/mL and a lowest pre-peak troponin level less than or equal to half of the peak troponin value. Finally, when we further restricted analyses to individuals with a complete immune count and proportional data both pre- and post-peak during the STEMI hospitalization, 694 individuals remained and were included for analysis.
Of the 694 STEMI patients across the Northwestern Medicine system included for analysis (
Table 1), approximately one-third were hospitalized at Northwestern Memorial Hospital (NMH), an urban tertiary care center, and the other two-thirds were hospitalized at non-NMHs. The cohort had a mean age of 64.57 ± 12.84 years, with non-NMH patients being older (mean 65.64 ± 12.10 vs. 62.32 ± 12.03 years,
p = 0.001). Demographics differed between the NMH and non-NMH sites, as shown in
Table 1. The mean troponin peak of the entire cohort was 52.93 ng/mL, with no significant difference between NMH and non-NMH patients.
Overall, our selection of patients across various centers in the Northwestern Medicine system resulted in 694 patients diagnosed with STEMI, multiple troponin values, and immune cell data available for analysis. Most baseline characteristic data did not significantly differ across patient sites.
2.2. Higher Peak Troponin Levels During STEMI Are Associated with a Higher Neutrophil Proportion Increase Within 24 h
We first investigated the associations between peak troponin levels and the post-peak proportions of each immune cell subset, adjusted for the same individual’s baseline proportion of that subset (a “peri-STEMI [cell subset] proportion change or increase”). Each 1 ng/mL higher peak of troponin was associated with a 0.05% peri-STEMI neutrophil proportion increase or a 5% higher neutrophil proportion per 100 ng/mL of the higher troponin peak (
p < 0.001;
Table 2); associations and significance were unchanged with multivariable adjustment. A higher troponin peak was also associated with a significantly higher peri-STEMI immature granulocyte proportion increase (
p < 0.05;
Table 2). Peak troponin levels were not associated with peri-STEMI increases or decreases in other immune cell subsets within 24 h of the troponin peak, including no significant change in monocytes (our other co-primary immune proportion endpoints of interest). Sensitivity analyses that were separately stratified by sex, DM status, BMI group, and medical center (NMH versus non-NMH) yielded similar associations across subgroups (
Supplementary Table S2). The troponin peak was not associated with peri-STEMI changes in absolute cell counts for neutrophils or other cell subsets (
Table 2).
These data suggest a shift in the relative proportion of peripheral immune cell subsets, including a significant increase in the neutrophil proportion during the peri-STEMI timeframe and a direct association with the increasing troponin peak.
2.3. Acute Peri-STEMI Changes in Immune Subsets and Mortality at 1 Year and 3 Years Post-STEMI
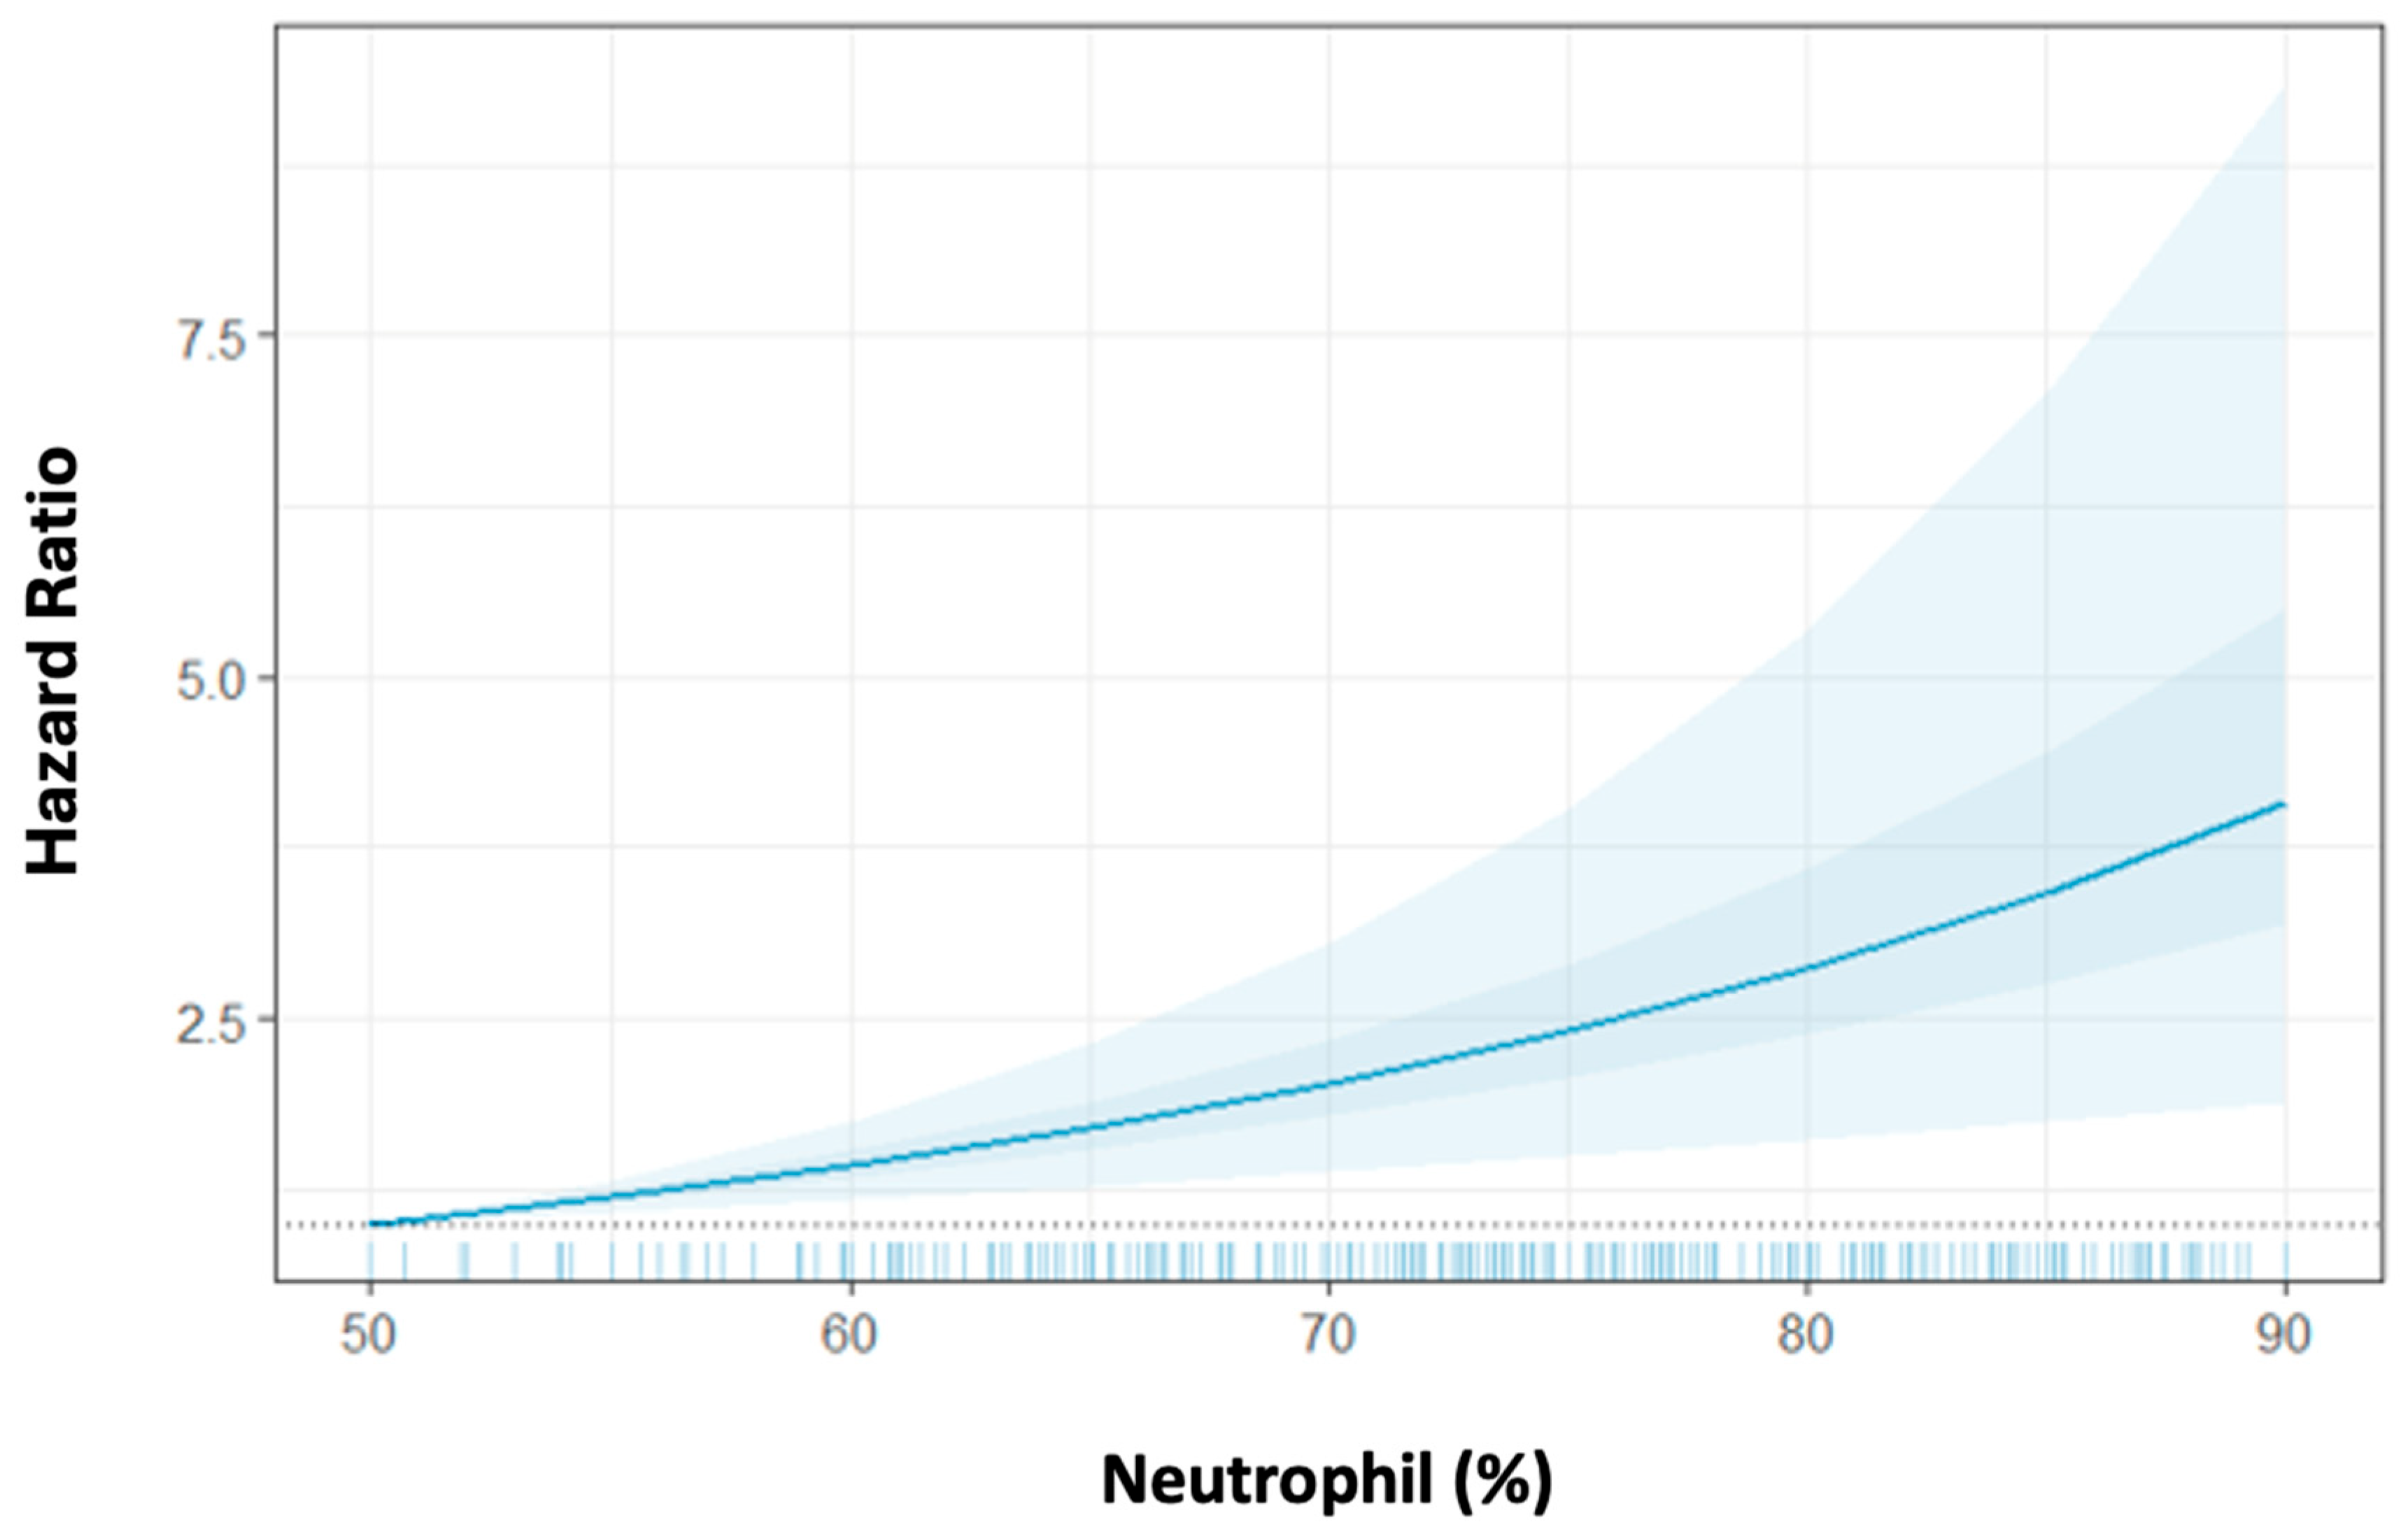
Given the significant association of the troponin peak with the peri-STEMI neutrophil proportion increase, we next assessed the association between post-peak neutrophil proportion with mortality and the extent to which this association is independent of the troponin peak. We observed that a higher peri-STEMI neutrophil proportion increase was associated with significantly increased 1-year mortality after adjustment for age, sex, DM, BMI, the troponin peak, and NLR. The HR for 1-year mortality was 1.05 [95% confidence interval (CI) = 1.03–1.08] per 1% higher post-peak neutrophil proportion, corresponding to a 50% increased risk for mortality per 10% peri-STEMI neutrophil proportion increase (
Table 3,
Figure 2). Similarly, the higher peri-STEMI neutrophil proportion increase was also associated with a significantly increased 3-year mortality rate after adjusting for covariates. Interestingly, the peri-STEMI neutrophil absolute count increase was also associated with increased 1-year and 3-year mortality rates [HR = 1.31 (95% CI 1.15–1.49) and HR = 1.27 (95% CI 1.14–1.45) per 1000 cells/µL absolute neutrophil increase, respectively]. These neutrophil associations were similar when analyzed separately by each medical center (NMHs vs. non-NMHs;
Supplementary Table S3). We also observed that the peri-STEMI absolute monocyte count increased significantly and was associated with 1- and 3-year mortality [HR = 5.18 (95% CI 2.21–12.11) and HR = 4.83 (95% CI 2.14–10.91) per 1000 cells/µL absolute monocyte increase, respectively].
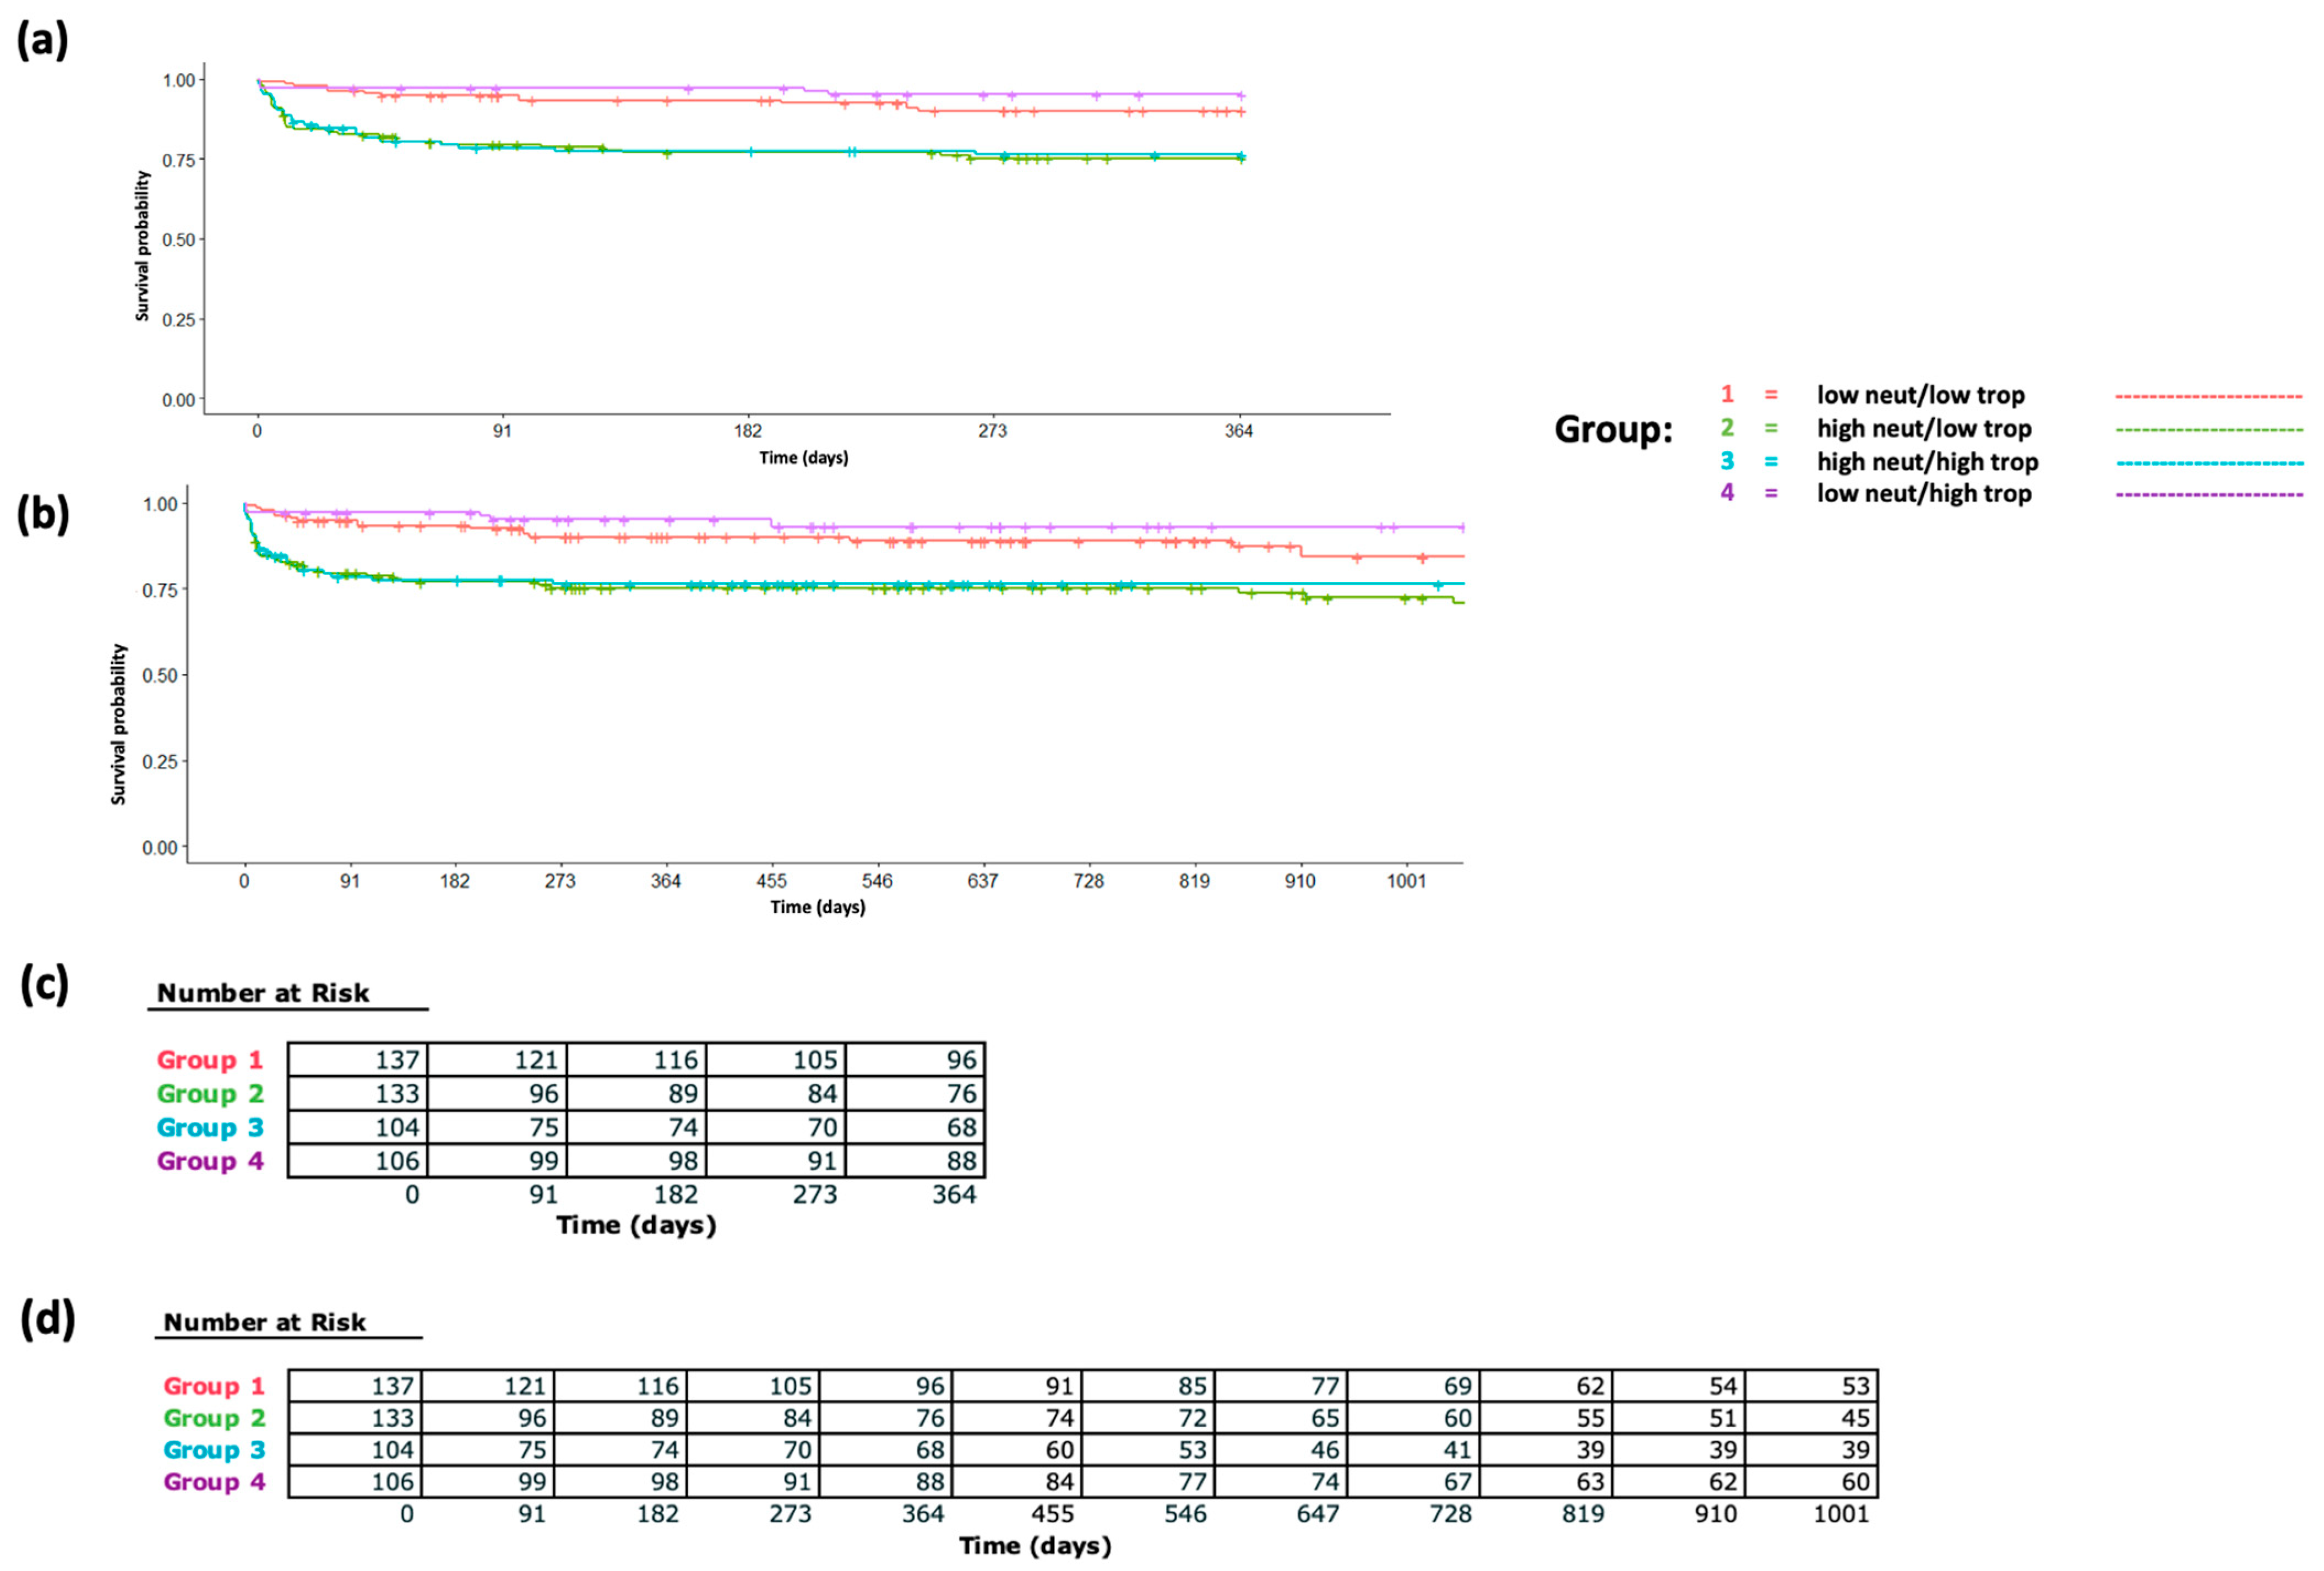
To further investigate the extent to which these acute STEMI-associated immune cell proportions and count changes are associated with mortality independently from the troponin peak, we split our cohort based on median levels of the troponin peak and peri-STEMI neutrophil proportion increase and analyzed survival differences (
Figure 3a,b) and mortality hazard ratios (
Supplementary Table S4). In multivariable-adjusted Cox proportional hazards models, individuals with a lower (less than median) peri-STEMI neutrophil proportion change and lower (less than median) troponin peak were used as reference, and individuals in the significant neutrophil increase/high troponin peak group, significant neutrophil increase/low troponin peak group, and insignificant neutrophil increase/high troponin peak group had hazard ratios of 2.78 (95% CI 1.44, 5.4), 2.54 (1.27, 5.08), and 0.5 (0.18, 1.41), respectively, for 1-year mortality. Findings were similar for 3-year mortality. Finally, in our separate Cox models exploring the relative predictive value of acute peri-STEMI neutrophil changes for mortality (
Supplementary Table S5), the model without this parameter had a C-statistic of 0.62, whereas the model incorporating post-troponin-peak neutrophil proportions had a C-statistic of 0.74, indicating significant improvement in predictive value when incorporating acute peri-STEMI neutrophil changes.
Our results highlight the association between neutrophil (%) and mortality risk in the peri-STEMI time period. We found that higher peri-STEMI neutrophil proportions were significantly associated with increased mortality at 1 and 3 years, independent of the troponin peak.
3. Discussion
In this study of patients with STEMI, we observed that acute serial changes in neutrophil proportion and count were significantly associated with mortality at 1 and 3 years. Furthermore, these associations remained consistent and significant after adjusting for common clinical covariates as well as troponin peaks, as demonstrated by secondary analyses treating the troponin peak as a continuous variable for adjustment as well as in the analysis of mortality for individuals grouped by high versus low troponin peaks and high versus low acute peri-STEMI neutrophil changes. Taken together, these findings suggest that STEMI-related changes in circulating neutrophil counts and proportions may represent an important negative prognostic factor, irrespective of other STEMI-related factors such as the troponin peak.
In addition to the neutrophil findings, we observed that increases in monocyte count were associated with significantly higher mortality at 1 year and 3 years. The hazard ratios were comparatively larger than for neutrophil counts, which likely reflects the variable’s normal distribution rather than being indicative of a stronger effect of one cell subset or another. Normal absolute monocyte counts were 200–800 cells/µL, whereas normal absolute neutrophil counts were 2500–7000 cells/µL; thus, an increase of 1000 cells/µL for monocytes is dramatic, representing a several-fold increase from the normal range, whereas a similar increase in neutrophil counts is less dramatic. Because we focused on the acute peri-STEMI change in cell populations within 24 h and focused on neutrophils as the most acute responder, our secondary analysis focused on neutrophils rather than both neutrophils and monocytes. Therefore, future investigation into how changes in both cell populations may impact post-MI recovery, in addition to a robust review of the existing literature in non-human experimental models, is warranted.
In the context of the prior literature, our findings are plausible and add an important new dimension regarding dynamic peri-MI immune responses. Prior studies showing associations between neutrophil counts or proportions and adverse outcomes, such as heart failure and mortality, either assessed neutrophil proportions at a single time point following MI or at hospital admission [
8,
9,
10]. While these findings suggest the adverse role of neutrophils in the peri-MI setting and underscore the plausibility of our findings, the single assessment of immune cell subsets used makes it possible that chronic differences in immune proportions—rather than MI-related changes—underlie the previously observed association. Meanwhile, our assessment of dynamic, acute intra-individual changes in immune subsets provides new and important insights highlighting how acute cellular alterations during the peri-MI period, e.g., an individual’s peri-STEMI neutrophil elevation, could be associated with post-MI outcomes.
This study has several limitations that should be considered. First, we relied on available laboratory values to define a peak troponin measurement, which may not always reflect the true maximum extent of myocardial injury during STEMI. We aimed to address this by restricting our analyses to individuals with an abrupt (at least two-fold) increase in troponin to a high absolute level (≥5 ng/mL), thus enhancing the likelihood that we included only individuals with significant acute myocardial injury during their STEMI from measurements. This likely resulted in the exclusion of individuals with STEMI who did not have a significant troponin elevation captured due to emergent percutaneous coronary intervention upon presentation without subsequent troponin measurement. A separate unavoidable limitation relates to this cohort. Although we included patients from multiple institutions, all were within the Northwestern Medicine health system, which may limit generalizability. Nevertheless, our sensitivity analyses somewhat enhance external validity, as we observed that key associations between the troponin peak and post-peak neutrophil elevations are similar for NMH versus non-NMH sites despite these sites’ systematically differing in patient populations (
Supplementary Table S2). Our findings remained consistent and robust across a diverse spectrum of patient demographics and risk factors. Our selection criteria only included STEMI patients while excluding non-ST elevation (NSTEMI) cases, which may introduce selection bias since STEMI is generally associated with greater myocardial damage and higher 28-day mortality [
15,
16]. Finally, while our immune cell measurements were derived from standardized complete blood counts with a differential performed in clinical laboratories, we did not have the ability to assess additional markers of interest (such as neutrophil activation or migration markers), thus limiting granular insights beyond the immune cell phenotype.
4. Materials and Methods
4.1. Study Design and Data Source
This retrospective cohort study of prospectively collected data investigating immune cell subset dynamics in the peri-STEMI period study was approved by the Northwestern University Institutional Review Board (IRB# STU00214494). Demographic and clinical data from STEMI patients were extracted through the Northwestern Medicine Enterprise Data Warehouse (NMEDW), which codifies the electronic health records of patients in a searchable format. NMEDW is an integrated database of clinical and research data from patients receiving treatment through Northwestern Medicine (NM) healthcare affiliates and distinct sites throughout the Northeastern Illinois region. These affiliate sites are within metropolitan Chicago, IL, USA: NM Prentice Women’s Hospital, NM Central DuPage Hospital, NM Delnor Hospital, NM Huntley Hospital, NM McHenry Hospital, NM Woodstock Hospital, NM Valley West Hospital, NM Kishwaukee Hospital, Northwestern Memorial Foundation and NM Lake Forest Hospital, Northwestern Memorial Hospital (NMH), and Northwestern University Feinberg School of Medicine.
4.2. Study Population
From the NMEDW, we queried patients who were admitted to hospitals within the NM system with STEMI between 1 January 2002 and 1 August 2024. Eligibility criteria included patients aged 18 to <100 years who were not institutionalized in a prison and had non-missing race data. We included the first STEMI hospitalization in the NM health system based on validated administrative codes (see
Supplementary Table S1 for a list of ICD-9 and ICD-10 codes relevant for clinical diagnoses) [
17].
We further restricted the cohort in several ways to enhance internal validity. To increase the likelihood that STEMI cases were restricted to those with an abrupt rise in troponin consistent with significant, acute myocardial injury, we further restricted the analysis to patients with troponin values during their index STEMI hospitalization that met each of the following criteria: (1) a troponin peak ≥ 5 ng/mL (≥5000 ng/L) during their STEMI hospitalization; (2) at least one additional troponin measurement within 24 h before the peak that was less than or equal to half the troponin peak value; and (3) a first baseline/pre-peak troponin value < 10 ng/mL [
18]. For those who met these criteria, to ensure serial immune cell measurement data, we only included STEMI patients who had both a baseline and post-troponin peak complete blood count (CBC) with a differential. For survival analyses of post-MI mortality, we only included individuals who survived at least 24 h after the troponin peak. For individuals with several qualifying STEMI events over distinct hospitalizations, we only included their first such STEMI for this analysis. Distinct admissions that were less than 24 h apart were merged and treated as a single admission.
4.3. Immune Cell Components
We extracted white blood cell (WBC) differential count data from NMEDW to obtain the percentages (%) and counts of neutrophils, monocytes, and immature granulocytes as well as neutrophil–lymphocyte ratios (NLR) at the peri-MI period. We identified both the baseline and post-peak values of these immune cell components. The baseline is the last measurement during the 24 h period before the troponin peak. The post-peak value is the last measurement from the time of the troponin peak up to 24 h after the peak.
4.4. In-Health System Mortality
We assessed mortality from 24 h post-troponin peaks for up to 1 year and 3 years of follow-up. Death data was based on mortality recorded by the NMEDW for a clinical inpatient or outpatient record of death.
4.5. Statistical Analysis
Our first set of analyses assessed the associations of troponin peak values with the changes in immune cell subsets described above, with our pre-specified co-primary endpoints for these analyses being neutrophil and monocyte subsets as a proportion of total WBCs. We used linear regression models that included both the post-peak and mean-centered baseline values of the immune cell component of interest (e.g., neutrophil (%)) as predictors [
19]. We also ran the same models but adjusted for sex and age. Separate models were calculated for each immune cell component. Because we were interested in the dynamics of circulating immune cells peri-MI, each post-peak immune cell proportion was normalized to the same individual’s baseline/pre-peak proportion of that immune cell subset; this enabled us to account for baseline differences in WBC subsets and focus on intra-individual changes in WBC subsets during the STEMI period as our primary WBC subset-related variable of interest. Post-peak cell proportions, adjusted for pre-peak proportions for the same individual, are referred to as the “peri-STEMI [cell subset] proportion change or increase” for consistency. Marginal differences were calculated using the marginal effects package [
20].
We used Cox proportional hazards models to assess associations between post-peak immune cell proportions and mortality at 1 year and 3 years post-peak with follow-up starting at 1-day post-peak troponin. Records were administratively censored at the earliest date until 12 August 2024 or the date of death. Base models were adjusted for age, sex, diabetes mellitus (DM), and body mass index (BMI), given the potential for these to confound the immune cell proportion–mortality relationship. Primary analyses treated immune cell parameters—count and proportion—as continuous variables, with mortality as the outcome variable. Next, given the expected associations between myocardial injury severity (as proxy-measured by the troponin peak) and peri-MI neutrophil changes, we aimed to disentangle the potential effects of myocardial injury from those of neutrophil changes on mortality in several ways. First, we additionally adjusted the base Cox models for the troponin peak when examining associations between peri-STEMI neutrophil changes and mortality. Separately, we categorized individuals based on the median split of peri-STEMI neutrophil changes and troponin peaks, comparing mortality for each category (a significant neutrophil change and high troponin peak; a significant neutrophil change and low troponin peak; an insignificant neutrophil change and high troponin peak) versus the insignificant neutrophil change and low troponin peak reference group. To further assess if the post-peak neutrophil (%) predicted mortality independent of the troponin peak, we calculated the C-statistics of three Cox models with varying specifications based on the presence or absence of troponin and neutrophil parameters [
21]. The first model included a troponin peak and baseline neutrophil (%), the second model was adjusted for the troponin peak, baseline neutrophil (%), and post-peak neutrophil (%), and the third model was adjusted for baseline and post-peak neutrophils (%)—all models were adjusted for legal sex, DM status, and BMI.
Given the fact that multiple hospitals and medical centers contributed data, we also performed sensitivity analyses stratified by patients admitted to the NMH, an urban tertiary care facility in Chicago, IL, versus non-NMH patients; the purpose of this was to ensure that findings were consistent in non-randomly different settings, thus avoiding bias toward optimism if similar findings were observed across distinct settings. Additionally, to test whether associations between neutrophil count or proportion and mortality were consistent across centers (NMH versus non-NMH patients), we employed Cox proportional hazard models incorporating interaction terms between the site and neutrophil metrics while allowing for site-specific baseline hazard functions [
22]. The model fit improvement from the inclusion of the interaction term was evaluated using ANOVA tests (using
p < 0.10 as the threshold). When interactions were significant, site-specific hazard ratios (HRs) were calculated using linear combinations of model coefficients. Survival analyses and related C-statistics were computed using the survival package [
23]. HRs from models with interaction terms were calculated using the glht function in the multcomp package [
24].
5. Conclusions and Clinical Perspective
In an analysis of multiple medical centers within a single health system, we aimed to study how immune cell subsets associate with troponin peak and long-term mortality in the peri-MI timeframe. We observed that STEMI-related neutrophil increases are independently proportional to peak troponin in the acute timeframe—more severe myocardial infarction results were seen in cases with increased acute peripheral neutrophil mobilization. We are also the first to show that the acute neutrophil proportion following peak troponin is significantly associated with mortality at 1 year and 3 years and is so independent of the troponin peak. In the context of the prior literature, this suggests a pathological role behind peripheral neutrophil increases in the setting of MI and warrants further mechanistic and clinical study.
Author Contributions
Conceptualization, H.A., R.N. and M.J.F.; Methodology, H.A., R.N., A.S.R., A.P., E.B.T. and M.J.F.; Data Acquisition, A.P.; Formal Analysis, A.S.R., H.A. and R.N., Writing—Original Draft Manuscript, H.A. and R.N., Writing—Review and Editing; H.A., R.N., A.S.R., A.P., E.B.T. and M.J.F.; Supervision, E.B.T. and M.J.F. All authors have read and agreed to the published version of the manuscript.
Funding
Matthew J. Feinstein reports funding relevant to this manuscript from the National Heart, Lung, and Blood Institute (NHLBI R01 HL175893) and the American Heart Association (24SFRNPCN1291224, 24SFRNCCN1276086).
Institutional Review Board Statement
The study was conducted according to the guidelines of the Declaration of Helsinki and approved by the Institutional Review Board of Northwestern University (STU00200433) on 11 February 2022.
Informed Consent Statement
Patient consent was waived as de-identified data were collected from an existing institutional database.
Data Availability Statement
The original contributions presented in this study are included in the article/
Supplementary Materials. Further inquiries can be directed at the corresponding author.
Acknowledgments
We thank the Northwestern Medicine Enterprise Data Warehouse for their assistance with cohort development.
Conflicts of Interest
Matthew J. Feinstein reports consulting/advisory board fees not related to this project from Novo Nordisk, NewAmsterdam Pharma, and Gilead.
Abbreviations
| BMI | body mass index |
| CI | confidence interval |
| CBC | complete blood count |
| DM | diabetes mellitus |
| HF | heart failure |
| HR | hazard ratio |
| LV | left ventricular |
| MI | myocardial infarction |
| NLR | neutrophil–lymphocyte ratio |
| NMH | Northwestern Memorial Hospital |
| NMEDW | Northwestern Enterprise Data Warehouse |
| NSTEMI | non-ST elevation MI |
| STEMI | ST-elevation MI |
| WBC | white blood cell |
References
- Husser, O.; Bodi, V.; Sanchis, J.; Nunez, J.; Mainar, L.; Chorro, F.J.; Lopez-Lereu, M.P.; Monmeneu, J.V.; Chaustre, F.; Forteza, M.J.; et al. White blood cell subtypes after STEMI: Temporal evolution, association with cardiovascular magnetic resonance--derived infarct size and impact on outcome. Inflammation 2011, 34, 73–84. [Google Scholar] [CrossRef] [PubMed]
- Mariani, M.; Fetiveau, R.; Rossetti, E.; Poli, A.; Poletti, F.; Vandoni, P.; D'Urbano, M.; Cafiero, F.; Mariani, G.; Klersy, C.; et al. Significance of total and differential leucocyte count in patients with acute myocardial infarction treated with primary coronary angioplasty. Eur. Heart J. 2006, 27, 2511–2515. [Google Scholar] [CrossRef]
- Chia, S.; Nagurney, J.T.; Brown, D.F.; Raffel, O.C.; Bamberg, F.; Senatore, F.; Wackers, F.J.; Jang, I.K. Association of leukocyte and neutrophil counts with infarct size, left ventricular function and outcomes after percutaneous coronary intervention for ST-elevation myocardial infarction. Am. J. Cardiol. 2009, 103, 333–337. [Google Scholar] [CrossRef] [PubMed]
- Sreejit, G.; Abdel-Latif, A.; Athmanathan, B.; Annabathula, R.; Dhyani, A.; Noothi, S.K.; Quaife-Ryan, G.A.; Al-Sharea, A.; Pernes, G.; Dragoljevic, D.; et al. Neutrophil-Derived S100A8/A9 Amplify Granulopoiesis After Myocardial Infarction. Circulation 2020, 141, 1080–1094. [Google Scholar] [CrossRef]
- Swirski, F.K.; Nahrendorf, M. Leukocyte behavior in atherosclerosis, myocardial infarction, and heart failure. Science 2013, 339, 161–166. [Google Scholar] [CrossRef]
- Frangogiannis, N.G. The immune system and cardiac repair. Pharmacol. Res. 2008, 58, 88–111. [Google Scholar] [CrossRef]
- Rashidi, F.; Rashidi, A.; Golmohamadi, A.; Hoseinzadeh, E.; Mohammadi, B.; Mirzajani, H.; Kheiri, M.; Jamshidi, P. Does absolute neutrophilia predict early congestive heart failure after acute myocardial infarction? A cross-sectional study. South. Med. J. 2008, 101, 19–23. [Google Scholar] [CrossRef] [PubMed]
- Arruda-Olson, A.M.; Reeder, G.S.; Bell, M.R.; Weston, S.A.; Roger, V.L. Neutrophilia predicts death and heart failure after myocardial infarction: A community-based study. Circ. Cardiovasc. Qual. Outcomes 2009, 2, 656–662. [Google Scholar] [CrossRef]
- Meissner, J.; Irfan, A.; Twerenbold, R.; Mueller, S.; Reiter, M.; Haaf, P.; Reichlin, T.; Schaub, N.; Winkler, K.; Pfister, O.; et al. Use of neutrophil count in early diagnosis and risk stratification of AMI. Am. J. Med. 2011, 124, 534–542. [Google Scholar] [CrossRef]
- Karabinos, I.; Koulouris, S.; Kranidis, A.; Pastromas, S.; Exadaktylos, N.; Kalofoutis, A. Neutrophil count on admission predicts major in-hospital events in patients with a non-ST-segment elevation acute coronary syndrome. Clin. Cardiol. 2009, 32, 561–568. [Google Scholar] [CrossRef]
- Hallen, J.; Buser, P.; Schwitter, J.; Petzelbauer, P.; Geudelin, B.; Fagerland, M.W.; Jaffe, A.S.; Atar, D. Relation of cardiac troponin I measurements at 24 and 48 hours to magnetic resonance-determined infarct size in patients with ST-elevation myocardial infarction. Am. J. Cardiol. 2009, 104, 1472–1477. [Google Scholar] [CrossRef] [PubMed]
- Tzivoni, D.; Koukoui, D.; Guetta, V.; Novack, L.; Cowing, G.; Investigators, C.S. Comparison of Troponin T to creatine kinase and to radionuclide cardiac imaging infarct size in patients with ST-elevation myocardial infarction undergoing primary angioplasty. Am. J. Cardiol. 2008, 101, 753–757. [Google Scholar] [CrossRef] [PubMed]
- Tsujioka, H.; Imanishi, T.; Ikejima, H.; Kuroi, A.; Takarada, S.; Tanimoto, T.; Kitabata, H.; Okochi, K.; Arita, Y.; Ishibashi, K.; et al. Impact of heterogeneity of human peripheral blood monocyte subsets on myocardial salvage in patients with primary acute myocardial infarction. J. Am. Coll. Cardiol. 2009, 54, 130–138. [Google Scholar] [CrossRef]
- Dutta, P.; Courties, G.; Wei, Y.; Leuschner, F.; Gorbatov, R.; Robbins, C.S.; Iwamoto, Y.; Thompson, B.; Carlson, A.L.; Heidt, T.; et al. Myocardial infarction accelerates atherosclerosis. Nature 2012, 487, 325–329. [Google Scholar] [CrossRef] [PubMed]
- Garcia-Garcia, C.; Subirana, I.; Sala, J.; Bruguera, J.; Sanz, G.; Valle, V.; Aros, F.; Fiol, M.; Molina, L.; Serra, J.; et al. Long-term prognosis of first myocardial infarction according to the electrocardiographic pattern (ST elevation myocardial infarction, non-ST elevation myocardial infarction and non-classified myocardial infarction) and revascularization procedures. Am. J. Cardiol. 2011, 108, 1061–1067. [Google Scholar] [CrossRef]
- O'Gara, P.T.; Kushner, F.G.; Ascheim, D.D.; Casey, D.E.J.; Chung, M.K.; de Lemos, J.A.; Ettinger, S.M.; Fang, J.C.; Fesmire, F.M.; Franklin, B.A.; et al. 2013 ACCF/AHA guideline for the management of ST-elevation myocardial infarction: A report of the American College of Cardiology Foundation/American Heart Association Task Force on Practice Guidelines. J. Am. Coll. Cardiol. 2013, 61, e78–e140. [Google Scholar] [CrossRef]
- Prasada, S.; Rivera, A.; Nishtala, A.; Pawlowski, A.E.; Sinha, A.; Bundy, J.D.; Chadha, S.A.; Ahmad, F.S.; Khan, S.S.; Achenbach, C.; et al. Differential Associations of Chronic Inflammatory Diseases With Incident Heart Failure. JACC Heart Fail. 2020, 8, 489–498. [Google Scholar] [CrossRef]
- McIlvennan, C.K.; Urra, M.; Helmkamp, L.; Messenger, J.C.; Raymer, D.; Ream, K.S.; Oldemeyer, J.B.; Ambardekar, A.V.; Barnes, K.; Allen, L.A. Magnitude of troponin elevation in patients with biomarker evidence of myocardial injury: Relative frequency and outcomes in a cohort study across a large healthcare system. BMC Cardiovasc. Disord. 2023, 23, 151. [Google Scholar] [CrossRef]
- Dukes, O.; Shahn, Z.; Renson, A. Change scores and baseline adjustment: Splitting the difference (in differences). Int. J. Epidemiol. 2025, 54, dyaf042. [Google Scholar] [CrossRef]
- Arel-Bundock, V.; Greifer, N.; Heiss, A. How to Interpret Statistical Models Using marginaleffects for R and Python. J. Stat. Softw. 2024, 111, 1–32. [Google Scholar] [CrossRef]
- Caetano, S.J.; Sonpavde, G.; Pond, G.R. C-statistic: A brief explanation of its construction, interpretation and limitations. Eur. J. Cancer 2018, 90, 130–132. [Google Scholar] [CrossRef] [PubMed]
- Vatcheva, K.P.; Lee, M.; McCormick, J.B.; Rahbar, M.H. The Effect of Ignoring Statistical Interactions in Regression Analyses Conducted in Epidemiologic Studies: An Example with Survival Analysis Using Cox Proportional Hazards Regression Model. Epidemiology 2015, 6, 216. [Google Scholar] [CrossRef] [PubMed]
- Therneau, T.M. Survival Analysis. Available online: https://github.com/therneau/survival (accessed on 24 June 2025).
- Hothorn, T. Multcomp. Available online: http://multcomp.R-forge.R-project.org (accessed on 24 June 2025).
| Disclaimer/Publisher’s Note: The statements, opinions and data contained in all publications are solely those of the individual author(s) and contributor(s) and not of MDPI and/or the editor(s). MDPI and/or the editor(s) disclaim responsibility for any injury to people or property resulting from any ideas, methods, instructions or products referred to in the content. |
© 2025 by the authors. Licensee MDPI, Basel, Switzerland. This article is an open access article distributed under the terms and conditions of the Creative Commons Attribution (CC BY) license (https://creativecommons.org/licenses/by/4.0/).


 ,
, 
