Article

Low-Temperature Uniaxial Orientation Effect on the Structure and Piezoelectric Properties of the Vinylidene Fluoride-Tetrafluoroethylene Copolymer Films

by
Stanislav V. Kondrashov
1,
Evgeniya L. Buryanskaya
1,2,
Aleksey S. Osipkov
1,
Vladimir S. Kirkin
1,
Maria V. Butina
1,
Pavel A. Mikhalev
1,
Dmitry S. Ryzhenko
1 and
Mstislav O. Makeev
1,*
1
Laboratory of Technologies of Polymer Ferroelectrics, Bauman Moscow State Technical University, Moscow 105005, Russia
2
Laboratory of Physics of Oxide Ferroelectrics, National University of Science and Technology MISIS, Moscow 119049, Russia
*
Author to whom correspondence should be addressed.
Int. J. Mol. Sci. 2025, 26(13), 6309; https://doi.org/10.3390/ijms26136309
Submission received: 30 May 2025 / Revised: 26 June 2025 / Accepted: 27 June 2025 / Published: 30 June 2025
(This article belongs to the Collection State-of-the-Art Macromolecules in Russia)

Abstract

This paper considers the uniaxial orientation effect on the structure and piezoelectric properties of vinylidene fluoride-tetrafluoroethylene copolymer ferroelectric films. The films were exposed to uniaxial orientation stretching in a temperature range from 20 °C to 60 °C; then, they were contact polarized under normal conditions. The temperature dependence of the electric strength was determined. The longitudinal piezoelectric coefficient d33 values were measured by the quasi-static Berlincourt method. The piezoresponse force microscopy (PFM) method was used to investigate the film domain structure before and after polarization, and the local piezoelectric coefficient values were also calculated. Phase composition was studied using differential scanning calorimetry and infrared spectroscopy with the Fourier transform. It was found that uniaxial orientation stretching contributed to an increase in the piezoelectric coefficient d33 from 5 pC/N to 16–20 pC/N. The results obtained indicate the importance of the amorphous phase contribution to the formation of the piezoelectric properties in polymeric materials.

1. Introduction

Despite the fact that piezoelectric ceramics remain the main material in piezoelectric engineering today, ferroelectric polymers based on polyvinylidene fluoride (PVDF) are finding increasingly wider application in science and technology [1,2,3] due to their relatively high values of pyro- and piezoresponse, chemical resistance, biocompatibility, mechanical and technological flexibility, high impact strength, and transparency [4]. Due to its low density and relatively low speed of sound propagation, the acoustic impedance of PVDF is close to that of liquid media and biological tissues. As a result, films based on PVDF demonstrate high efficiency in electroacoustic transducers (EATs) for biomedical applications. These films are used to develop sensors and devices for monitoring and ultrasonic diagnostics [5,6,7,8], such as measuring blood flow or the mechanical properties of tissues and for imaging organs or a fetus. Therapeutic and surgical applications include physiotherapy, lithotripsy, transcranial neuromodulation, and thermal or mechanical ablation of tumors [9].
PVDF-based EATs show the highest efficiency in hydrostatic (volumetric) mode when the acoustic pressure acts on the sensitive element simultaneously and uniformly from all directions [10]. The sensitivity of such an EAT, denoted as m0, is determined by the film thickness t and the hydrostatic piezoelectric voltage coefficient gh:
m0 = gh·t [V/Pa],
The coefficient gh can be expressed in terms of the macroscopic piezoelectric coefficients d33, d31, and d32 as follows:
gh = (d33 + d31 + d32)/ε0ε′,
where ε0 is the vacuum permittivity, and ε′ is the real part of the dielectric permittivity. For PVDF films, gh is an order of magnitude higher than in ceramic materials. However, while the electroactive properties of piezoceramics are mainly determined by their chemical composition, in such polymer ferroelectrics, the material’s structure—formed during technological processes like orientation (stretching) or annealing—has a significant impact on these properties.
According to the generally accepted assumptions of today [11,12], cooling the melt in a PVDF or its copolymers extraction leads to polymer matrix crystallization in TGTG′ conformation (α-phase), which is not electroactive. During orientation and as the polymer chains straighten, a polymorphic transition of the α-phase to the electroactive conformation -TT- (β-phase) occurs. Dipoles appear in the polymer volume, orienting and causing the appearance of the piezoelectric properties with the application of the electric field. In addition to the phase transition, orientation increases the polymer material’s electric strength [13], making it possible to raise the orienting electric field intensity and the material piezoresponse [14].
In the overwhelming majority of works devoted to the PVDF film orientation, the researchers focus their attention primarily on selecting the technological process parameters (degree and temperature) in stretching, which ensures the most complete transition of the α-phase [15,16,17,18] to the β-phase and studying the crystallinity degree and the relaxation processes. As a rule, a PVDF homopolymer is considered, and to obtain films with a high level of electroactive properties, they are uniaxially oriented at temperatures of 60–90 °C with a stretching ratio of 3–4 [14,19] and subsequent annealing at a temperature of 120 °C [20,21]. Despite the fact that a number of works show the influence of the polymer supramolecular structure phase composition on the material piezoelectric response [22,23,24], the literature practically misses any information on the orientation the technological process influence on the response magnitude. While it is important for further practical application of the films obtained. In addition, the literature poorly covers the aspect of the amorphous phase influence on the piezoelectric response magnitude, where the reversible transitions “paraelectric → ferroelectric” are quite possible during the mechanical stretching [25].
This paper considers the vinylidene fluoride copolymer with 6 mol% tetrafluoroethylene (VDF-TFE). Compared to other better-studied VDF copolymers, this material has a few advantages, making it possible to simplify the technological process in obtaining the polarized films. Unlike, for example, the PVDF homopolymer, it dissolves in a larger number of solvents and has lower melting points, facilitating the film formation process. Unlike the VDF/TrFE copolymer, it has a significantly lower cost. At the same time, there are significantly fewer works devoted to studying the mechanical treatment effect and thermal history of the VDF/TFE on its structure and electrophysical properties. Paper [26], for example, considers a VDF copolymer with 30 mol% TFE; however, only the stretching influence on the material’s crystallinity degree and dielectric properties is analyzed.
This paper applies the methods of scanning electron microscopy, piezoresponse force microscopy, differential scanning calorimetry, and IR spectroscopy to study the uniaxial orientation temperature influence on the structure and electroactive properties of the extruded VDF/TFE copolymer films. In addition, it discusses the molecular and supramolecular mechanisms of such orientation.

2. Results

This paper discusses films made from commercial VDF-TFE (HaloPolymer, Kirovo-Chepetsk, Russia). These films were produced by extrusion and then subjected to uniaxial orientation and uniaxial stretching at temperatures of 20, 40, 50, and 60 °C. After uniaxial stretching, the samples were polarized by the contact method at room temperature. The thickness of the samples under consideration was approximately 30 microns.

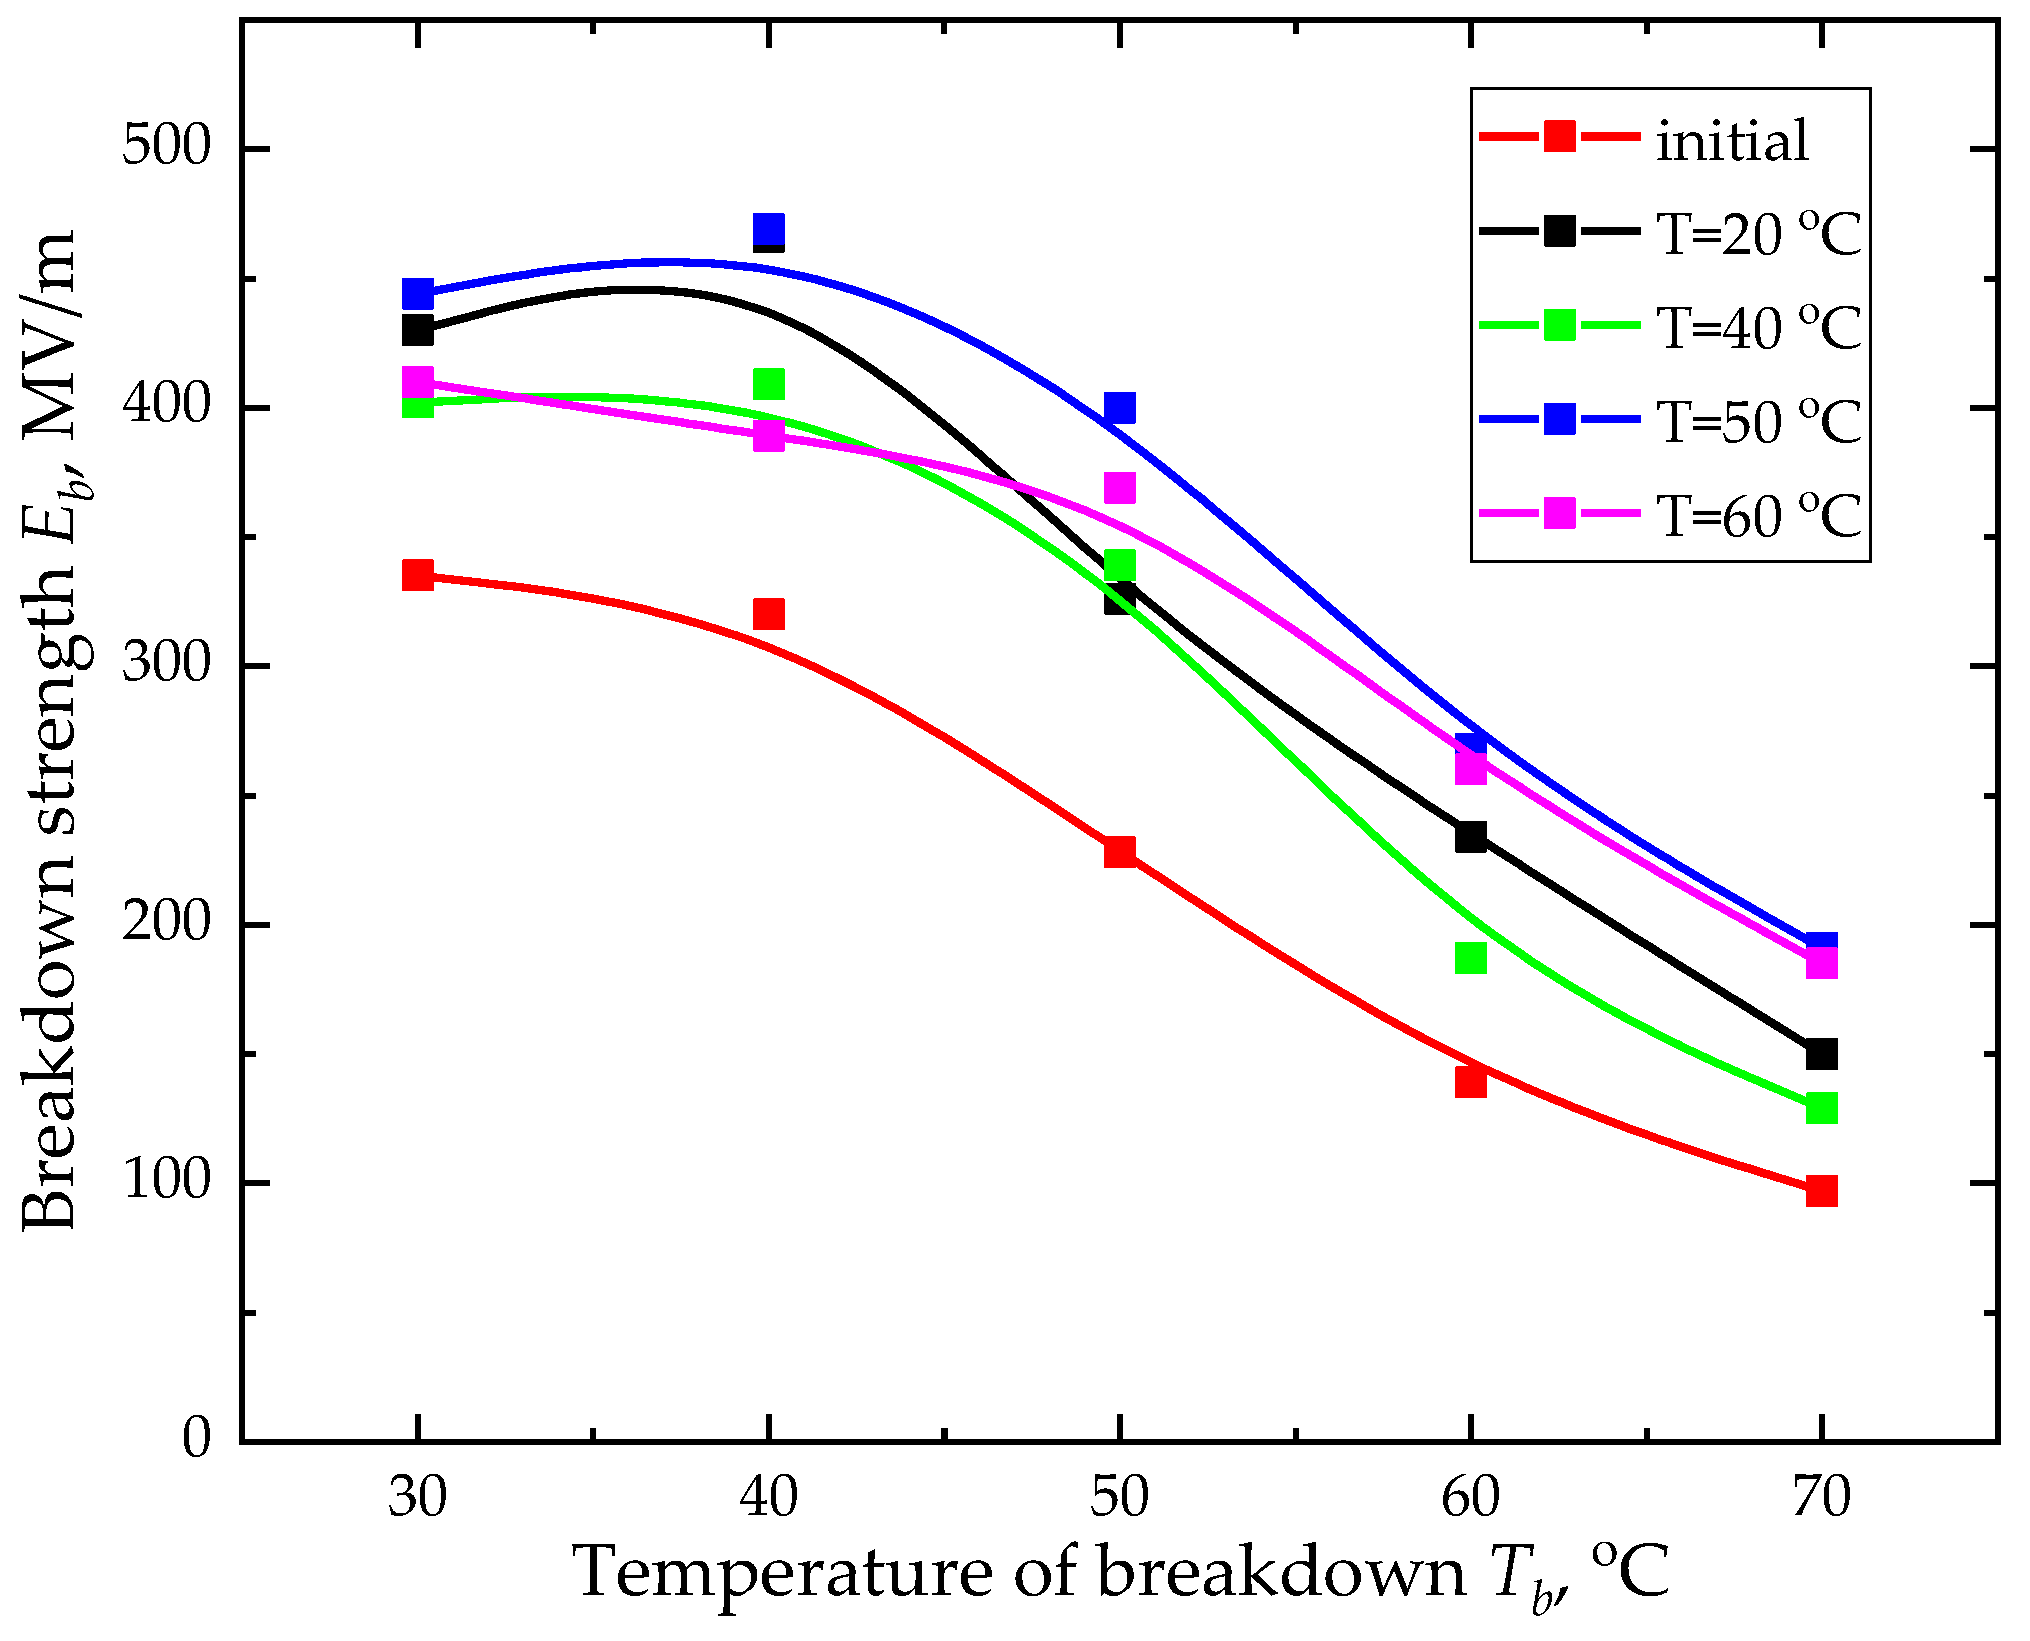
2.1. Electrical Strength Research

The orientation stretching temperature provides the strongest effect on the electrical strength dependence on the breakdown temperature. The electrical strength temperature dependence for the studied samples is not linear (Figure 1).
Most likely, this type of temperature dependence is associated with the structure alteration in stretching. It is found that orientation stretching increases the electrical strength value, thereby allowing polarization saturation to be achieved.
This paper notes that increasing the test temperature up to 40 °C leads to the growing electrical strength of the oriented samples. With the further increase in temperature, the electrical strength decreases. Such behavior of the electrical strength temperature dependence could be explained by the αc relaxation process being characteristic for the vinylidene fluoride copolymers, which, according to the literature data [27,28], lies in the temperature range of 40–50 °C. The αc-process is associated with alteration in the molecular mobility of the polymer amorphous phase and the segmental motion of chains in the crystallites. At temperatures above the αc-relaxation, local overheating appears due to the energy dissipation, which reduces the electrical material strength.

2.2. Contact Polarization (Measuring the Macroscopic Piezoelectric Coefficients by the Berlincourt Method)

The piezoelectric coefficient dependence on the uniaxial stretching temperature is expressed to a lesser extent. The results obtained (Table 1) demonstrate that the d33 value dependence on the sample stretching temperature is non-monotonic.
Uniaxial orientation stretching provides for an increase in the piezoelectric coefficient from 5 pC/N to 20 pC/N, which allows us to use polarized film as an active element in sensors and actuators.
The piezoelectric coefficient maximum value is achieved at the stretching temperature of 20 °C. At the orientation temperature of 40 °C, the d33 value passes through its minimum: d33 is 13% less than the piezoelectric coefficient at the stretching temperature of 20 °C.
The piezoelectric coefficient values are also computed from the PFM data.

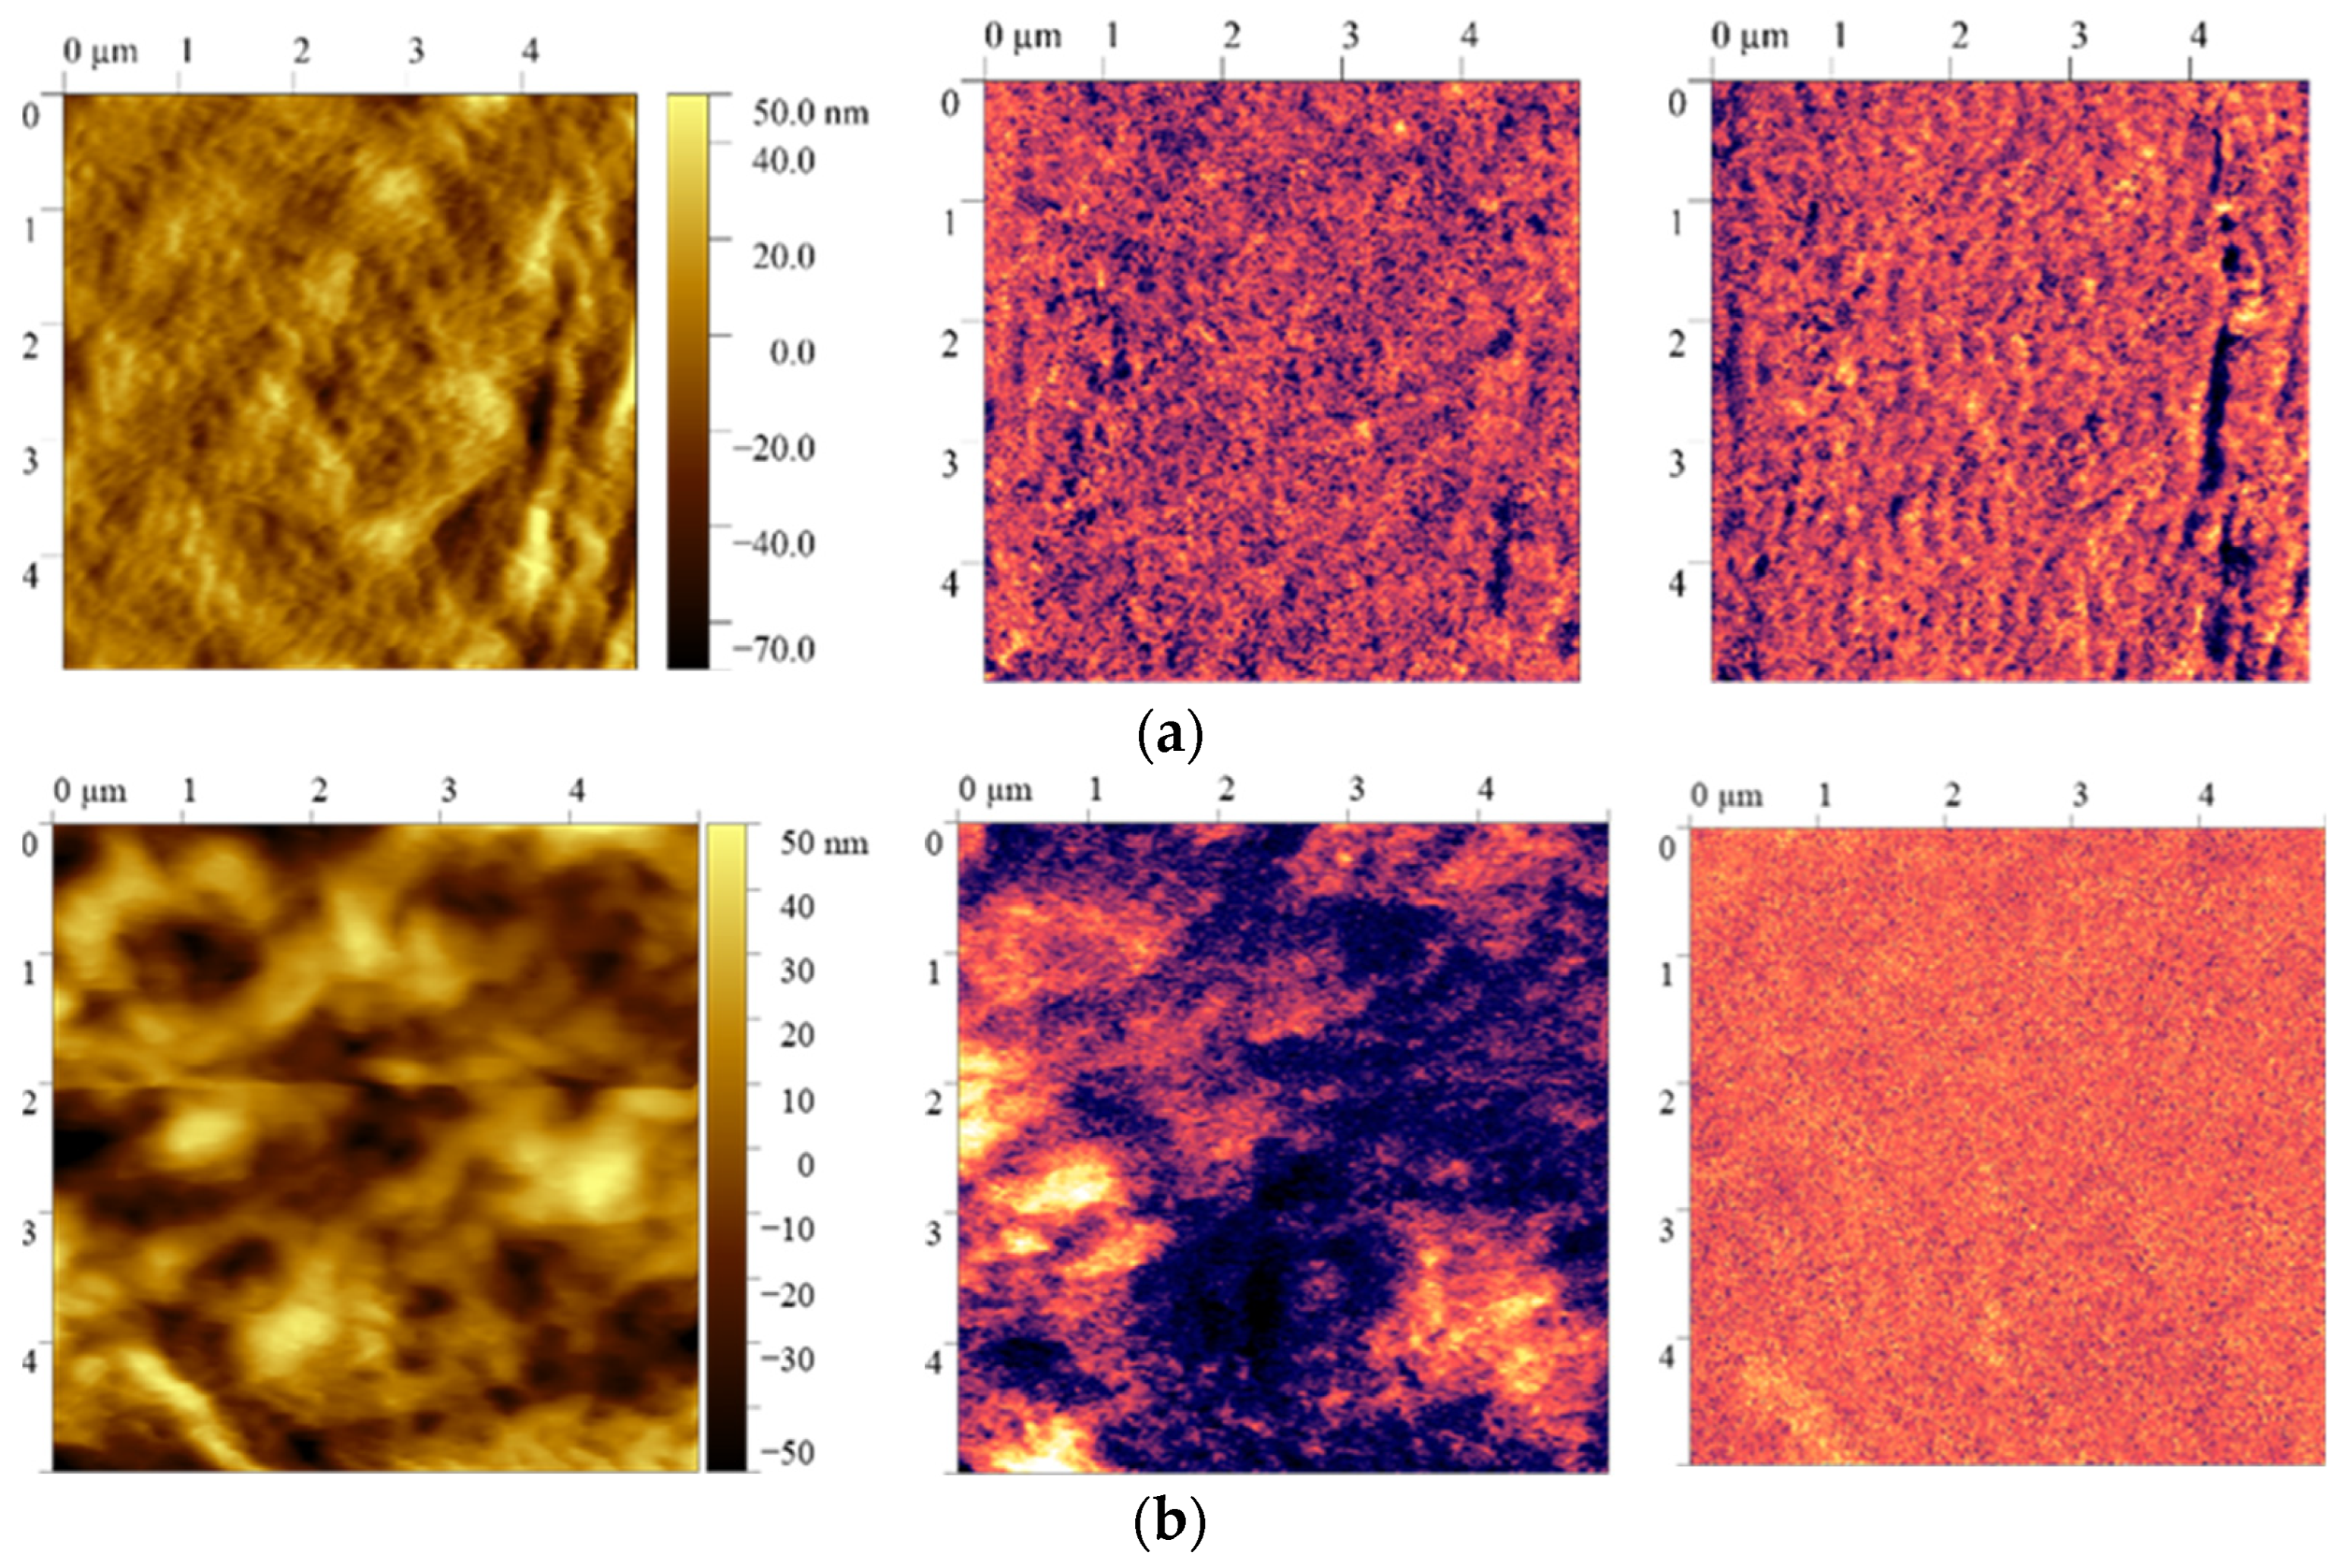
2.3. Piezoresponse Force Microscopy

The piezoresponse force microscopy method is used to obtain distribution patterns of the vertical and lateral piezoresponse signals and compute the local piezoelectric coefficient values before and after film polarization. The data are presented in Table 2 and Figure 2.
It follows from the piezoresponse force microscopy data that the films after polarization have the most pronounced vertical piezoresponse signal, and their local piezoelectric coefficient value increases from 5 pm/V to 21 pm/V (film stretched at 20 °C).
As can be seen from the data in Figure 3, the vertical piezoelectric response contrast changes after polarization and consequently changes the ferroelectric domains’ size. The observed effect is characteristic of all the samples. To compute the ferroelectric domain sizes in the film before and after polarization, an autocorrelation function is constructed (Figure 3).
The characteristic domain size ξ is found by computing the correlation function of the vertical piezoresponse signal distribution depending on the r coordinate:
C r = A · exp r ξ 2 h ,
where A is the constant; r is the distance from the central peak (nm) determined from the autocorrelation function image; ξ is the average value of the domain size (nm); and h (0 < h < 1) is the parameter [29,30].
Figure 3 presents an example of the autocorrelation function for a film oriented at 20 °C, showing the difference in correlation length of the topographic parameter ξtop and the size of the ferroelectric domain ξVPFM. It is found that the domain size increases significantly after polarization from 54 nm to 490 nm. The measured domain size appears to be an order of magnitude higher than the characteristic crystallite size of the ferroelectric β-phase (l001 = 10 nm) [31], which indicates the contribution of the amorphous phase chains to the mechanism of ferroelectric domains formation in the VDF/TFE films.
An increase in the ferroelectric domain size of the oriented film after polarization could be explained by the contribution of the amorphous component chains. The macromolecule regions of the crystallite end surfaces form the intermediate ordering phase [26]. Therefore, when loaded along the drawing axis, these regions could lose mobility and become a part of the crystallite. If in the oriented state, the copolymer crystalline phase exists in both the ferroelectric and paraelectric forms, the external mechanical stress could initiate local reversible “paraelectric → ferroelectric” transitions.

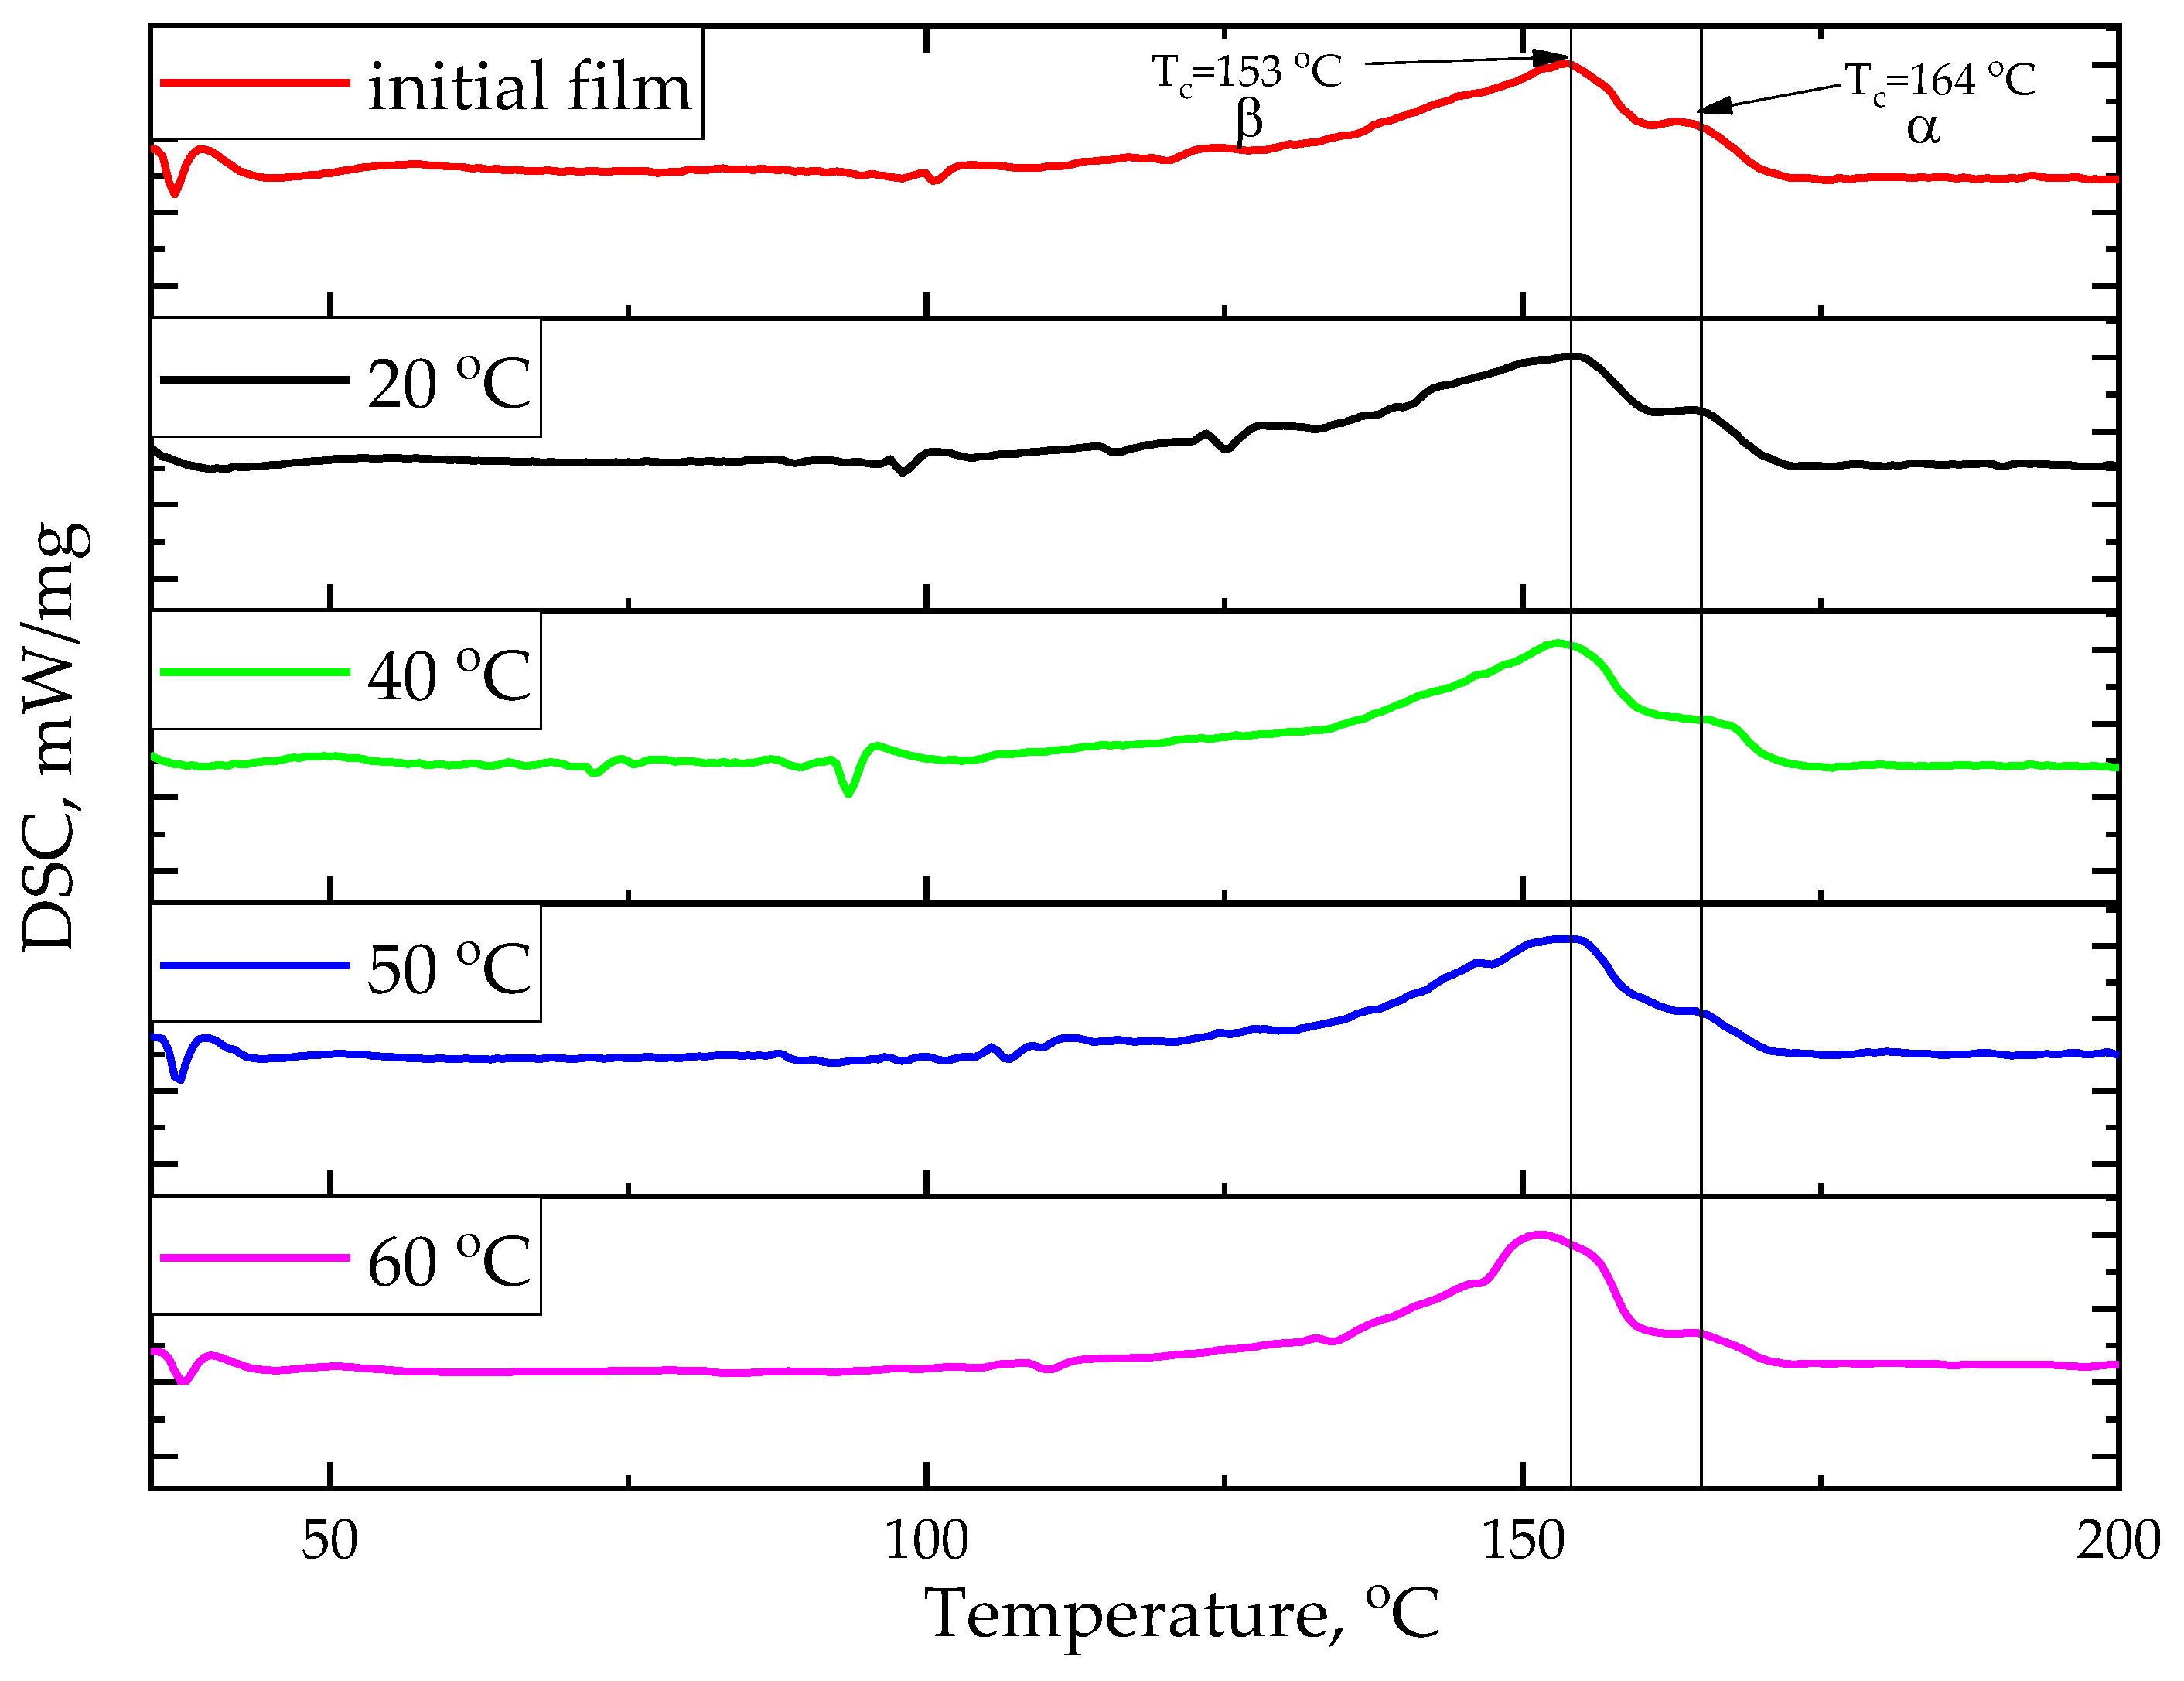
2.4. Differential Scanning Calorimetry

It is natural to assume that the dependence of the VDF/TFE copolymer film’s electroactive properties on the stretching temperature is connected to an alteration in its structure during this process.
Using differential scanning calorimetry makes it possible to analyze the samples’ structure after stretching. Three endothermic peaks corresponding to the crystallite melting are found on the curves of the first heating (Table 3). This indicates the presence of several crystalline phases in the sample. For the samples stretched at 20 °C and 50 °C, the peak corresponding to 145 °C is weakly expressed (Figure 4).
This paper notes that uniaxial stretching insignificantly influences the crystallinity degree of the studied samples. All films are characterized by the presence of several crystalline phases. Films stretched at 20 °C and 50 °C demonstrate maximum crystallinity.
It is also worth mentioning the existence of a long, low-temperature “tail” in the crystallization processes, which could indicate the crystallite defectiveness formed during extrusion and the subsequent stretching.

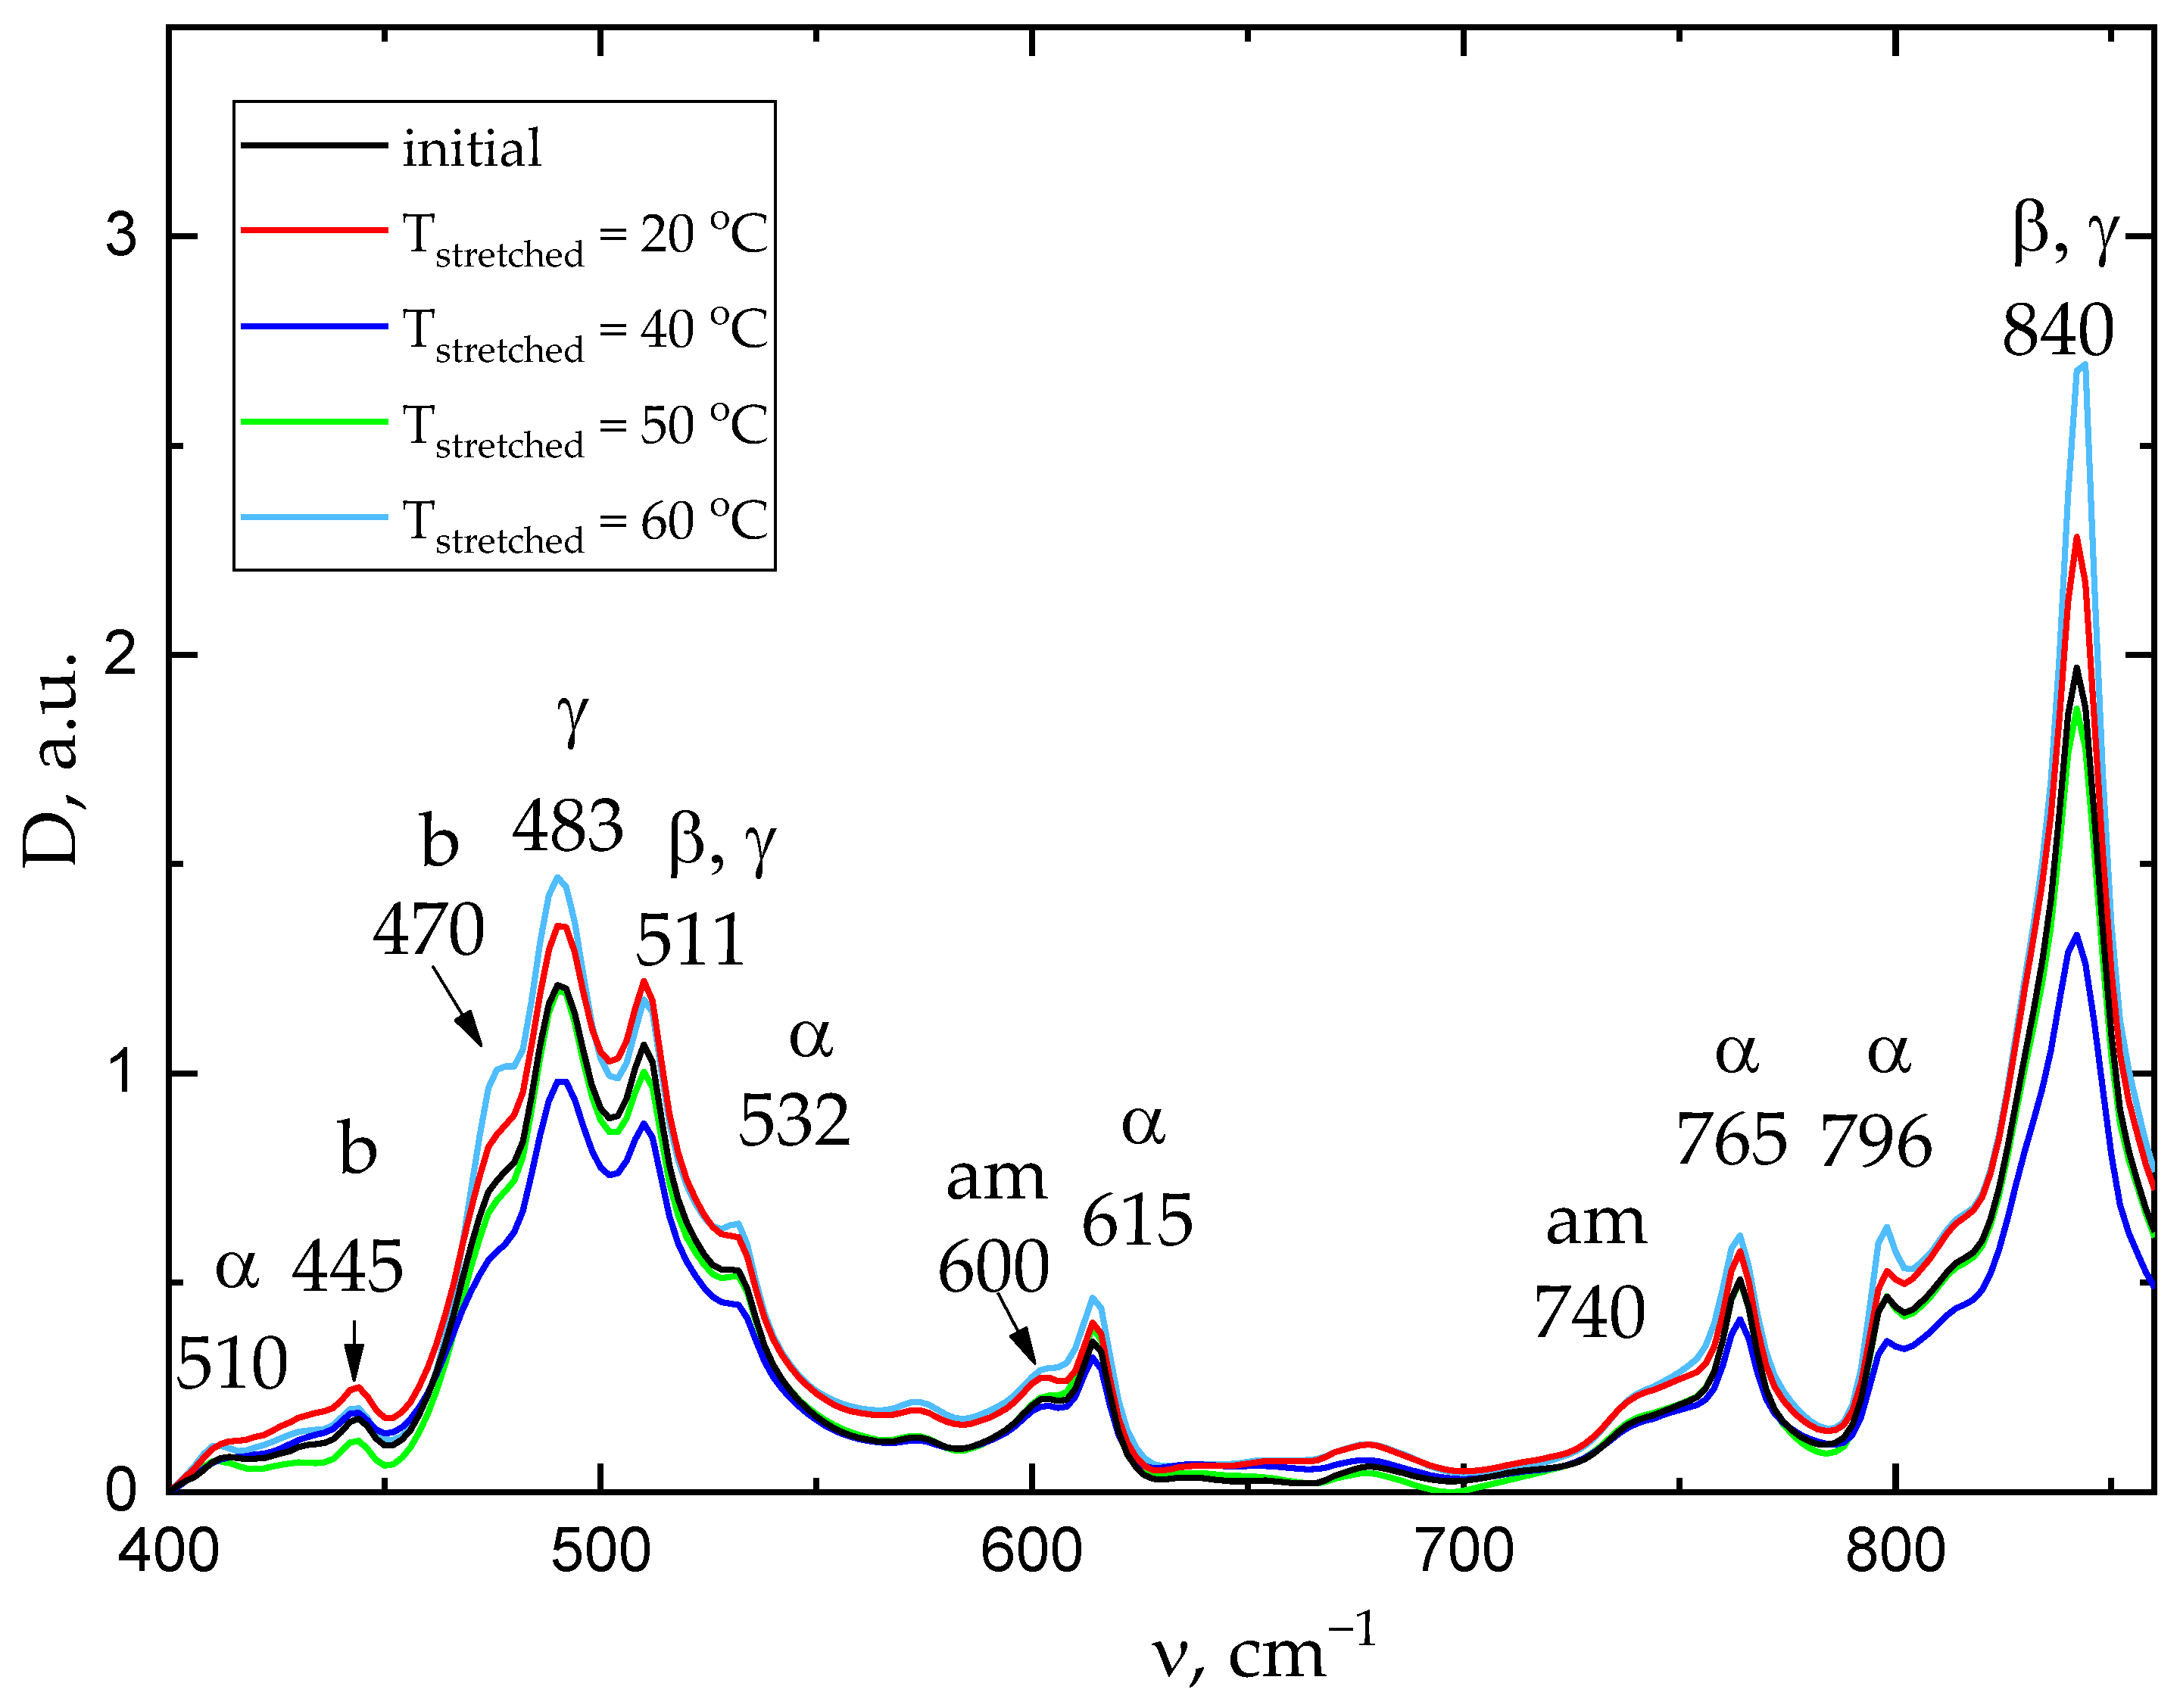
2.5. IR Fourier Spectroscopy

The measured IR spectra are shown in Figure 5. The electroactive and α-phases content changes slightly (up to 3.5%) and non-monotonically depending on the stretching temperature (Table 4). In general, phase composition also changes slightly as a result of mechanical stretching. The sample stretched at a temperature of 40 °C has the lowest proportion of the ferroelectric phase. It is also characterized by the minimum piezoelectric coefficient among the stretched samples.

2.6. Density Measurement by the Hydrostatic Weighing Method

The sample density after stretching is measured by the hydrostatic weighing method (Table 5).
The paper shows that uniaxial orientation stretching significantly increases the film density. In this case, the density value depends nonlinearly on the stretching temperature. The maximum density value (1.94 g/cm3) is typical for a film oriented at 40 °C. It was shown previously that the piezoelectric coefficient at this stretching temperature was minimal (16 pC/N).

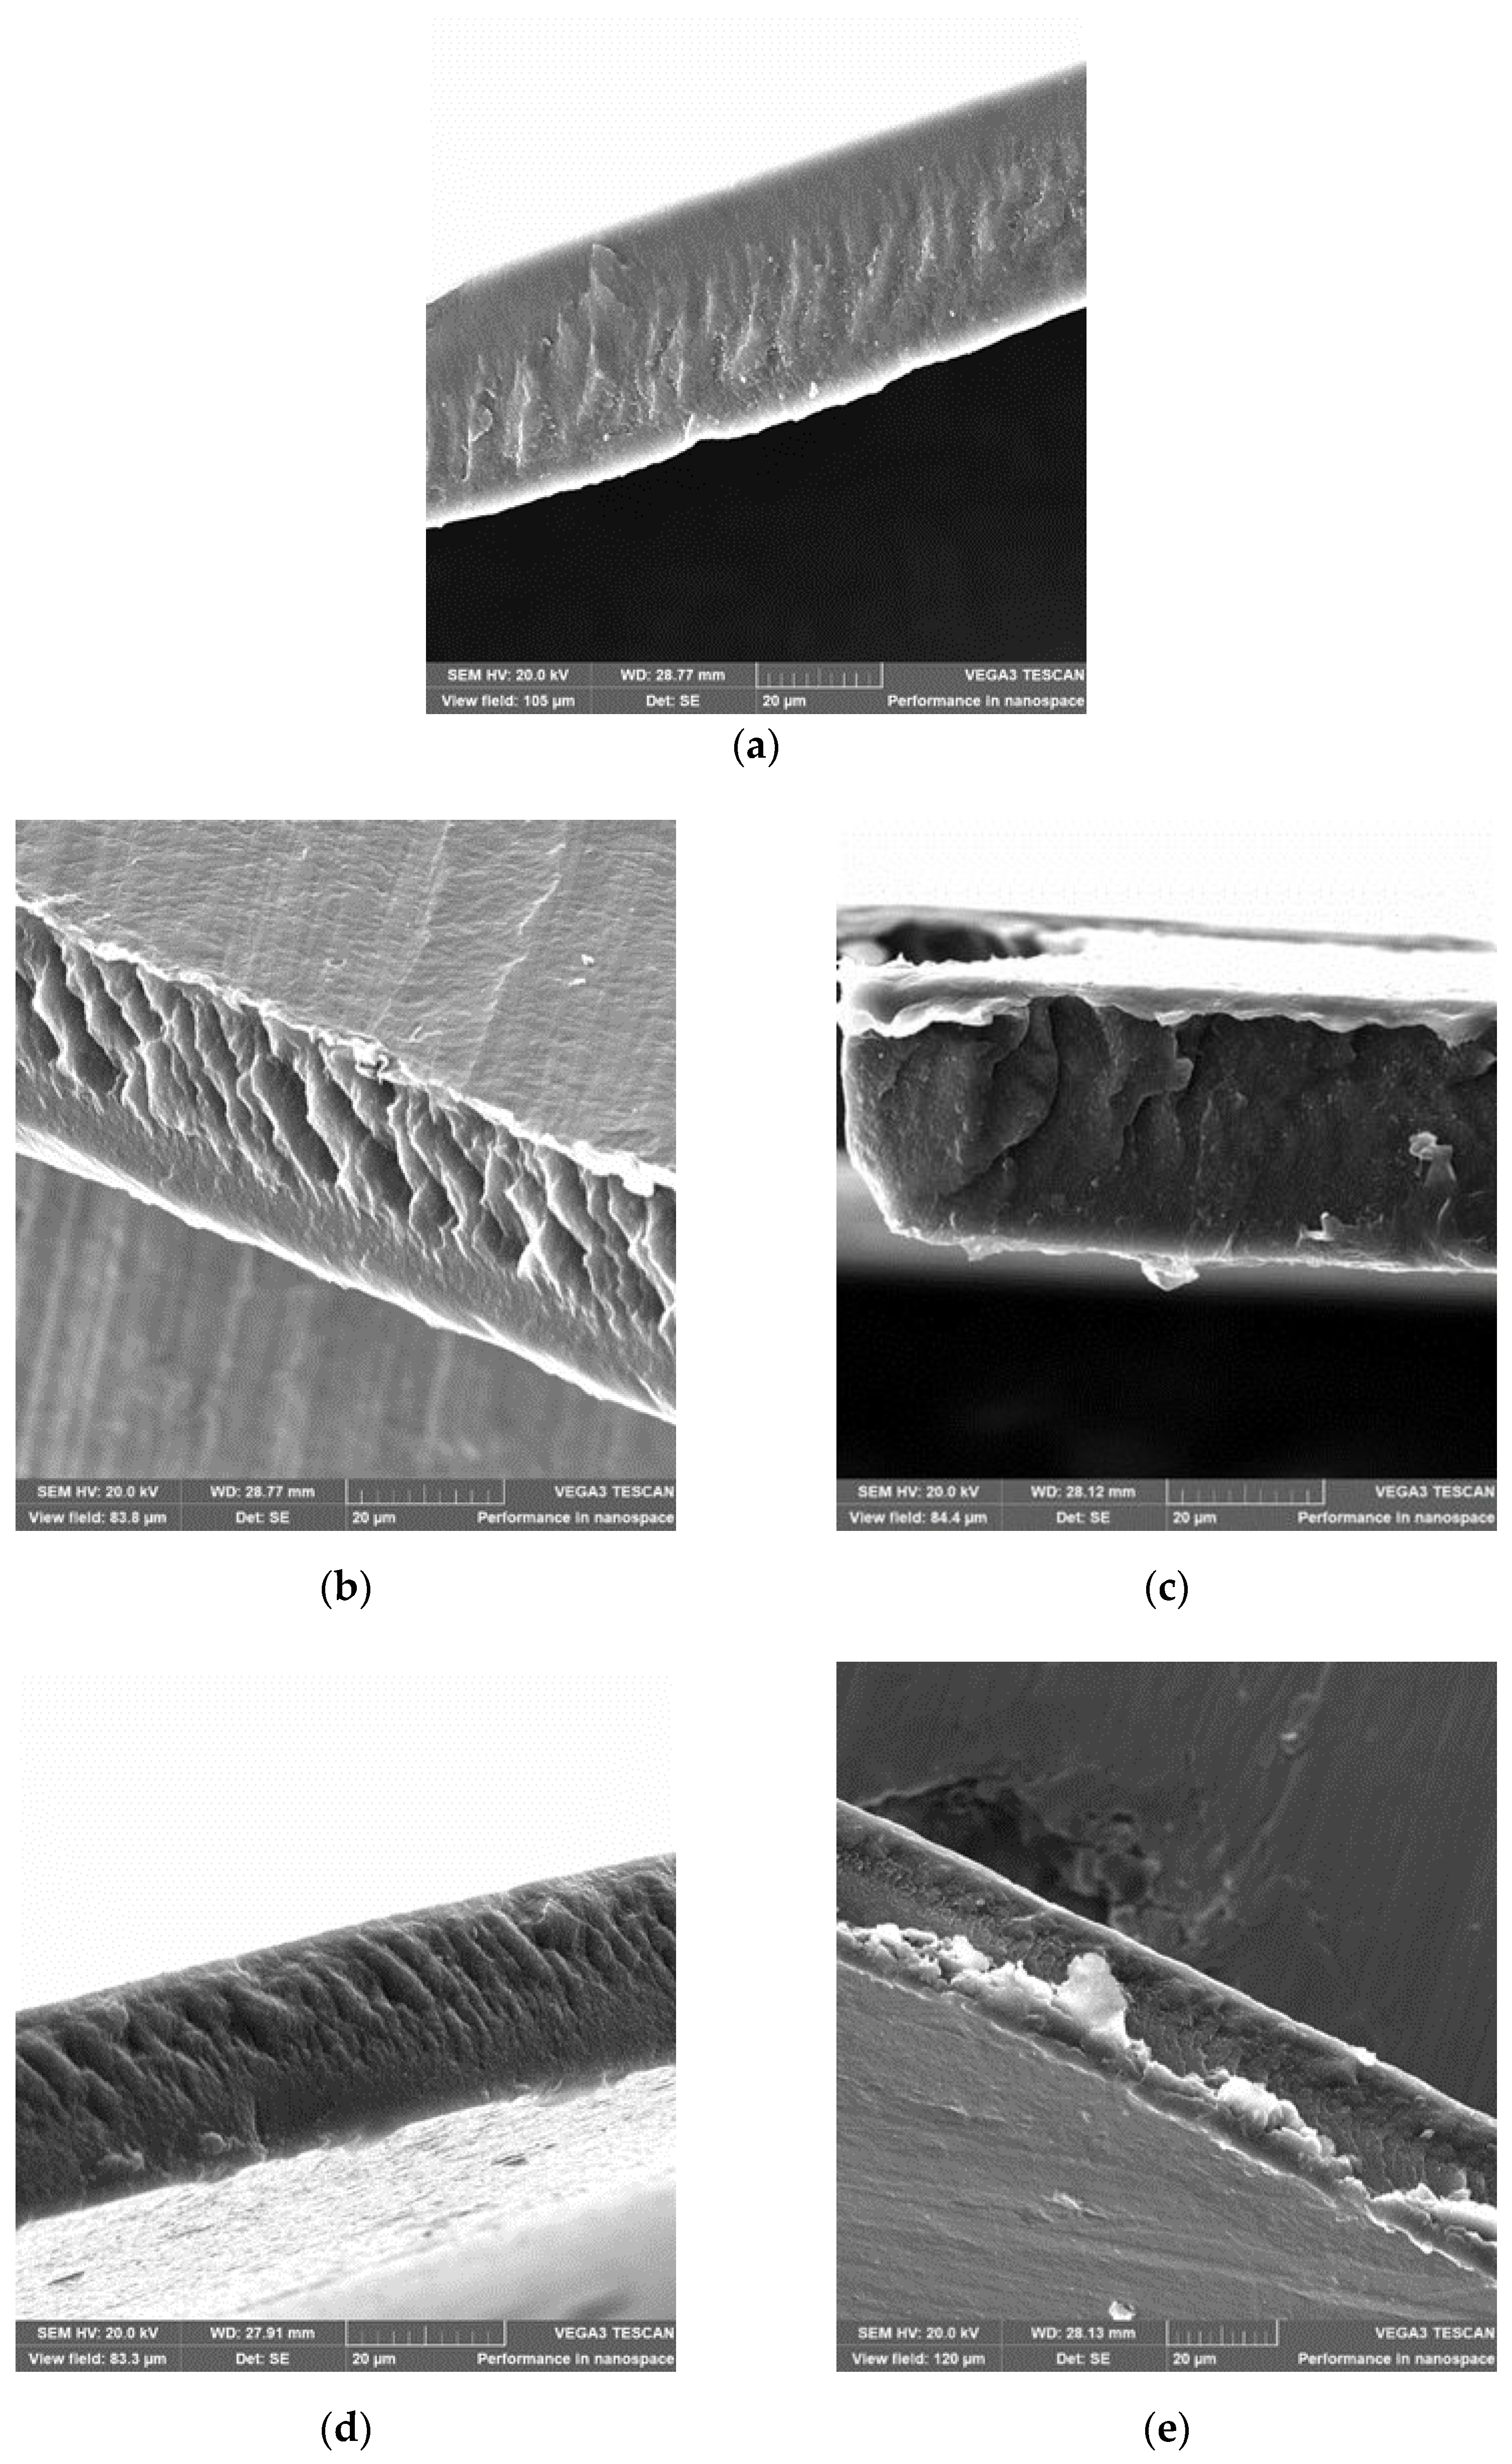
2.7. Scanning Electron Microscopy

The presented data demonstrates that the crystallinity degree and density of the uniaxially oriented film (with a generally non-monotonic nature of dependences with alteration in the stretching temperature) are changing antibatically and reach the extreme point at the stretching temperature of 40 °C. This confirms the previously advanced assumption that the structure of the film oriented at a temperature of 40 °C differs from its structure formed at the other stretching temperatures.
The SEM micrographs of “cold” cleavage of the films oriented at different temperatures could be considered as an indirect confirmation of this conclusion (Figure 6).
The presented results show that surfaces of all the studied samples contain layers inclined at an angle to the surface, which are characteristic of the uniaxially oriented polymers [32]. Probably, the shear bands are filled with the highly dispersed oriented fibrilized material. The fibrillary structure characteristic picture is mostly indicative of the samples stretched at temperatures of 20 °C and 50 °C, which have the highest piezoelectric coefficients.

3. Discussion

The mechanical uniaxial stretching results in compacting the material structure, as evidenced by an increase in density by 11–21%. The increase in density probably means that the fibrils formed during the uniaxial orientation are compacted under the compressive forces acting in the transverse direction. Under such conditions, the deformation mode changes; i.e., the lamellas spreading turns into the interlamellar shear. The amorphous component is compressed between the lamellae, which leads to a decrease in the material’s free volume and, consequently, to an increase in its density. Apparently, the orientation of the amorphous phase chains occurs during the uniaxial stretching. This in turn causes a decrease in the amorphous component mobility, which contributes to the formation of the larger domains due to the transition of the metastable paraelectric phase regions to the ferroelectric state under the mechanical stress action. As a result, the domain size increases from 40 to 350 nm in the stretched samples under the electric field action.
In addition, an increase in the material electrical strength by ~20% after the mechanical stretching is identified. This could be explained by the fact that the polymer free volume decreases in the acting compressive stress field, and the mobility of the injected charges consequently decreases [30]. Since counter motion of the oppositely charged traps determines the electrical strength magnitude, a decrease in mobility leads to an increase in the field strength at which an electrical breakdown occurs. As a result, the material polarization efficiency increases, and the stretched films acquire piezoelectric coefficients d33 at the level of 16–20 pC/N, which is comparable with the β-PVDF piezoelectric coefficient values. The obtained piezoelectric response values make it possible to manufacture devices based on the VDF-TFE copolymer film.
In this case, the d33 value depends on the crystallinity degree and the ferroelectric phase proportion. The sample stretched at a temperature of 40 °C has the lowest piezoelectric coefficient (16 pC/N). It is also characterized by the minimum ferroelectric phase proportion and crystallinity degree among the stretched samples. The samples stretched at the temperatures of 20 °C and 50 °C have the highest piezoelectric coefficients (20 and 19 pC/N, respectively). They are also characterized by the highest crystallinity degree.

4. Materials and Methods

This paper studied VDF/TFE copolymer films obtained by melt extrusion. Fluoroplastic powder F2m grade B (HaloPolymer, Kirovo-Chepetsk, Russia) was used to receive the film; extrusion was performed by the IIPT SPE “Plastic”. The initial film thickness was 30 μm.

4.1. Uniaxial Stretching Technique

Uniaxial stretching was carried out at four different temperatures of 20, 40, 50, and 60 °C, and the stretching ratio was 3. It was noted that the stretched film thickness differed from that of the original film by few microns, indicating the non-trivial material texturing process.
A laboratory machine for polymer film orientation (DACA Instrument, Santa Barbara, CA, USA) was used to stretch the extruded film.
The required deformation value was determined by adjusting speeds of the receiving and feeding rollers. The film was heated in orientation on a flat heater, along which the film was displaced during rewinding.

4.2. Contact Polarization

After uniaxial stretching, the samples were polarized by the contact method at room temperature for 30 s. The polarizing field voltage was 300 MV/m.
Contact polarization was carried out using a laboratory bench, which schematic representation is provided in Figure 1. In addition, the bench was introduced to measure electrical strength of the samples.
The samples were placed in the Vaseline oil bath, and the 2.5 mm diameter aluminum electrode was positioned on the sample top. The polarizing voltage was supplied to the sample from the high-voltage electrode.

4.3. Research Methods

4.3.1. Macroscopic Piezoelectric Coefficient d33 Measurement

Macroscopic piezoelectric coefficients d33 values were measured by the quasi-static Berlincourt method using the YE2730A d33-meter (Sinocera Piezotronics, Yangzhou, China).

4.3.2. Electrical Strength Measurement

Electrical strength temperature dependences were computed for all the samples under study. The measurements were taken in the temperature range from 20 °C to 110 °C and the breakdown field characteristic values at the polarization temperature (30 °C). Electrical strength was measured using the laboratory bench (Figure 7) in the Vaseline oil bath to avoid breakdown in the air.
The breakdown field values at each temperature were obtained using the two-parameter Weibull model [1,33,34,35,36,37], according to which a statistical set of a large number of field values Eb could be described by the following function:
F x = 1 exp [ x α β b ] ,
where x is the breakdown field current value; α is a certain characteristic field, at least 63.2% of the test samples are broken down; and the β b parameter characterizes the breakdown field dispersion relative to the average value.

4.3.3. Piezoresponse Force Microscopy

Ferroelectric properties and morphology alteration were studied by the scanning probe microscopy (SPM) methods using the NTEGRA Prima atomic force microscope (NT-MDT SI, Zelenograd, Russia) with cantilevers with the FMG01/Pt platinum conductive coating (Tipsnano, Tallinn, Estonia). Experimental data were processed using the Gwiddion 2.67 software (Czech Metrology Institute, Brno, Czech Republic).
SPM was used to obtain the film surface topographies and compute the root-mean-square (RMS) roughness values for the samples stretched at different temperatures. In the piezoresponse force microscopy mode, vertical and lateral piezoresponse signal distribution maps were obtained, and the local piezoelectric coefficients d33 were computed before and after contact polarization. HA_HR/Pt conducting cantilevers (NT-MDT SI, Zelenograd, Russia) with the strength constant of 17 N/m were used to measure the local piezoelectric coefficients. The local piezoelectric coefficients were determined by direct measurement of deformation when applying the alternating voltage from 0 to 10 V at the fixed frequency of 890 kHz. Measurements were taken at two points: near the breakdown point and at a certain distance. The piezoelectric coefficients d33 values were computed from the Mag1n signal:
d 33 * = Mag   1 n U · Q ,
where U is the voltage supplied in scanning (B); Q is the quality factor shows the quality of the oscillatory system; and the Mag 1n signal corresponds to the sample deformation (pm).
The single-crystal lithium niobate with the known value of d33 = 18 pm/V was chosen as the calibration sample.

4.3.4. Scanning Electron Microscopy

The film surface morphology was studied using scanning electron microscopy (SEM) with the TESCAN VEGA3 microscope (TESCAN Brno s.r.o., Brno, Czech Republic). Images of the cold cleavage were obtained using a secondary electron detector (SE). Before scanning, a thin layer (about 20 nm) of the conductive coating (gold) was deposited on the sample’s surface to prevent charge spreading over the dielectric surface. The metal coating was deposited using the SPI-MODULE Sputter Coater magnetron sputtering device (SPI supplies, West Chester, PA, USA). Micrographs of the cold cleavage were also obtained for the films stretched in different modes. The films were cooled in liquid nitrogen for 5 min. Before scanning, the samples were mounted onto special vertical holders using carbon tape, allowing us to remove the ends of the film.

4.3.5. Differential Scanning Calorimetry

The samples’ thermal properties and crystallinity degree were determined by differential scanning calorimetry (DSC) on the NETZSCH DSC 204F1 Phoenix device (NETZSCH-Gerätebau GmbH, Selb, Germany). The samples were placed for measurement in the aluminum crucibles, and they were heated in the temperature range of 25–200 °C at a heating rate of 2 K/min in the argon medium.
The DSC curves are applied to compute the film crystallinity degree, considering the melting enthalpy of all crystallizing comonomers and their ratios [38]:
χ c = H m ω V D F · H P V D F + ω T F E · H P T F E ,
where ∆Hm is the film melting enthalpy; ω V D F   is mol% of VDF monomer; H P V D F is the melting enthalpy of the fully crystalline PVDF, which is 104.5 J/g [39,40]; ω T F E -is mol% of TFE monomer; and H P T F E -is the melting enthalpy of the fully crystalline PTFE (82 J/g).

4.3.6. Fourier Transform Infrared Spectroscopy and Computation Based on It

Phase composition of the experimental samples was determined by Fourier transform IR spectroscopy. The transmission coefficients were measured using the PerkinElmer 1760X FTIR IR Fourier spectrometer (PerkinElmer Inc., Waltham, MA, USA) in the wavelength range of 400–4000 cm−1.
The spectra were processed and decomposed in the Systat PeakFit 4.12.00 (Systat Software Inc., San Jose, CA, USA) software program. The film phase composition (electroactive phase and α-phase proportions) was computed according to the method provided in [41].
The electroactive phase proportion was determined by the following formula:
F EA = I EA K 840 K 763 I 763 + I EA · 100 % ,
where I 763 is the amplitude at the 763 cm−1 peak (alpha-phase peak); I E A is the amplitude at the 840 cm−1 peak (electroactive phase peak (β- and γ-phases)); and K 840   = 7.7   ×   10 4   cm 2 vol , K 763 = 6.1   ×   10 4   cm 2 mol are the absorption coefficients at the corresponding wave values.
The F α   alpha phase proportion was computed assuming that the material contained 3 phases (α, β, and γ):
F α = 100   F EA

4.3.7. Density Measurement by the Hydrostatic Weighing

Density was measured by the hydrostatic weighing method according to ISO 1183-1:2025 [42] “Plastics—Methods for determining the density of non-cellular plastics—Part 1: Immersion method, liquid pycnometer method and titration method”. Weighing was carried out in liquid with the known density, i.e., in distilled water. The M-ER 123 ACFJR “SENSOMATIC” TFT analytical scales (Mertech, Seoul, Republic of Korea) with the weighing accuracy of up to 0.0001 g were used in weighing.

5. Conclusions

This paper examines the effect of uniaxial orientation stretching on the piezoelectric properties and electrical strength of VDF/TFE copolymer film. It found that orientation stretching increases the electrical strength, thereby allowing the achievement of polarization saturation. At the same time, electrical strength decreases at temperatures above 40 °C, where the relaxation αc-process appears, leading to an increase in the cooperative mobility and local overheating. This determines technological modes of film polarization and limits operating conditions of the functional devices based on it.
Uniaxial orientation stretching contributes to an increase in the piezoelectric coefficient d33 from 5 pC/N to 16–20 pC/N. Apparently, this is associated with the orientation of the amorphous phase chains, which leads to a decrease in their mobility. In addition, it promotes the formation of the larger domains due to the transition of the metastable paraelectric phase regions to the ferroelectric phase under the mechanical stress action. This paper shows that the domain size increases significantly from 40 to 350 nm after polarization.
The obtained results indicate the importance of the amorphous phase contribution to the formation of the polymer material’s piezoelectric properties.
In addition, this paper shows that in the case of the film contact polarization at 30 °C, the piezoelectric coefficient d33 value measured by the quasi-static Berlincourt method is almost equal to the d33 value of the commercial PVDF homopolymer (20 pC/N) polarized at 80 °C. This makes it possible to use polarized VDF-TFE film as an active element in sensors and actuators.

Author Contributions

Conceptualization, S.V.K., E.L.B., A.S.O. and M.O.M.; methodology, E.L.B., S.V.K. and M.O.M.; software, E.L.B. and V.S.K.; validation, M.O.M. and A.S.O.; formal analysis, E.L.B.; investigation, E.L.B., V.S.K. and M.V.B.; resources, P.A.M. and D.S.R.; data curation, S.V.K.; writing—original draft preparation, S.V.K., E.L.B. and M.O.M.; writing—review and editing, E.L.B.; visualization, E.L.B.; supervision, E.L.B. and M.O.M.; project administration, P.A.M. and M.O.M.; funding acquisition, P.A.M. and D.S.R. All authors have read and agreed to the published version of this manuscript.

Funding

This research was carried out within the State Assignment of the Ministry of Science and Higher Education of the Russian Federation (Theme No. FSFN-2024-0014).

Institutional Review Board Statement

Not applicable.

Informed Consent Statement

Not applicable.

Data Availability Statement

The original contributions presented in this study are included in the article. Further inquiries can be directed to the corresponding author(s).

Acknowledgments

The domain structure study was performed using the scanning probe microscopy methods on the equipment of the Center for Collective Use of Materials Science and Metallurgy of the MISIS University of Science and Technology. Contact polarization and measurement of the film electrical strength were carried out on a bench developed with the support of the Ministry of Science and Higher Education of the Russian Federation within the framework of the State Assignment (Theme FSFN-2025-0004). The authors would like to thank Alexander N. Ozerin and Mikhail Yu. Yablokov from the N. S. Enikolopov Institute of Synthetic Polymer Materials of the Russian Academy of Sciences for scientific advice.

Conflicts of Interest

The authors declare no conflict of interest.

References

  1. Kochervinskii, V.V.; Gradov, O.V.; Gradova, M.A. Fluorine-containing ferroelectric polymers: Applications in engineering and biomedicine. Russ. Chem. Rev. 2022, 91, RCR5037. [Google Scholar] [CrossRef]
  2. Andrey, V.; Koshevaya, E.; Mstislav, M.; Parfait, K. Piezoelectric PVDF and its copolymers in biomedicine: Innovations and applications. Biomater. Sci. 2024, 12, 5164–5185. [Google Scholar] [CrossRef] [PubMed]
  3. Liu, G.; Zhang, S.; Jiang, W.; Cao, W. Losses in ferroelectric materials. Mater. Sci. Eng. R Rep. 2015, 89, 1–48. [Google Scholar] [CrossRef] [PubMed]
  4. Kochervinskii, V.V.; Gradova, M.A.; Gradov, O.V.; Kiselev, D.A.; Ilina, T.S.; Kozlova, N.V.; Shmakova, N.A.; Kalabukhova, A.V.; Bedin, S.A. Structural, optical, and electrical properties of ferroelectric copolymer of vinylidenefluoride doped with Rhodamine 6G dye. J. Appl. Phys. 2019, 125, 044103. [Google Scholar] [CrossRef]
  5. Kochervinskii, V.V.; Buryanskaya, E.L.; Makeev, M.O.; Mikhalev, P.A.; Kiselev, D.A.; Ilina, T.S.; Lokshin, B.V.; Zvyagina, A.I.; Kirakosyan, G.A. Effect of Composition and Surface Microstructure in Self-Polarized Ferroelectric Polymer Films on the Magnitude of the Surface Potential. Nanomaterials 2023, 13, 2851. [Google Scholar] [CrossRef]
  6. Harris, G.R.; Howard, S.M.; Hurrell, A.M.; Lewin, P.A.; Schafer, M.E.; Wear, K.A.; Zeqiri, B. Hydrophone measurements for biomedical ultrasound applications: A review. IEEE Trans. Ultrason. Ferroelectr. Freq. Control 2022, 70, 85–100. [Google Scholar] [CrossRef]
  7. Xin, Y.; Sun, H.; Tian, H.; Guo, C.; Li, X.; Wang, S.; Wang, C. The use of polyvinylidene fluoride (PVDF) films as sensors for vibration measurement: A brief review. Ferroelectrics 2016, 502, 28–42. [Google Scholar] [CrossRef]
  8. O’Reilly, M.A.; Hynynen, K.A. PVDF receiver for ultrasound monitoring of transcranial focused ultrasound therapy. IEEE Trans. Biomed. Eng. 2010, 57, 2286–2294. [Google Scholar] [CrossRef]
  9. Lin, Y.; O’Reilly, M.A.; Hynynen, K.A. PVDF Receiver for Acoustic Monitoring of Microbubble-Mediated Ultrasound Brain Therapy. Sensors 2023, 23, 1369. [Google Scholar] [CrossRef]
  10. Kharat, D.; Mitra, S.; Akhtar, S.; Kumar, V. Polymeric Piezoelectric Transducers for Hydrophone Applications. Def. Sci. J. 2007, 57, 7–22. [Google Scholar] [CrossRef]
  11. Sessler, G.M. Piezoelectricity in polyvinylidenefluoride. J. Acoust. Soc. Am. 1981, 70, 1596–1608. [Google Scholar] [CrossRef]
  12. Saxena, P.; Shukla, P. A comprehensive review on fundamental properties and applications of poly (vinylidene fluoride) (PVDF). Adv. Compos. Hybrid Mater. 2021, 4, 8–26. [Google Scholar] [CrossRef]
  13. Bagirov, M.A.; Abasov, S.A.; Malin, V.P.; Jalilov, A.Y. Effect of orientation on electrical properties of polymers. J. Appl. Polym. Sci. 1976, 20, 1069–1075. [Google Scholar] [CrossRef]
  14. Guo, R.; Luo, H.; Zhou, X.; Xiao, Z.; Xie, H.; Liu, Y.; Zhang, D. Ultrahigh energy density of poly (vinylidene fluoride) from synergistically improved dielectric constant and withstand voltage by tuning the crystallization behavior. J. Mater. Chem. A 2021, 9, 27660–27671. [Google Scholar] [CrossRef]
  15. Li, L.; Wu, X.; Wu, Y.; Zhang, Q.; Zhang, Y.; Zhang, J.; Wu, Y. Studies on the transformation process of PVDF from α to β phase by stretching. RSC Adv. 2014, 4, 3938–3943. [Google Scholar] [CrossRef]
  16. Sencadas, V.; Pereira, J.; Oliveira, M. α-to β transformation on PVDF films obtained by uniaxial stretch. Mater. Sci. Forum 2006, 514, 872–876. [Google Scholar] [CrossRef]
  17. Guan, F.; Wang, J.; Pan, J.; Wang, Q.; Zhu, L. Effects of polymorphism and crystallite size on dipole reorientation in poly(vinylidene fluoride) and its random copolymers. Macromolecules 2010, 43, 6739–6748. [Google Scholar] [CrossRef]
  18. Constantino, C.J.L.; Magalhães, J.M.; Dias, N.J.J.; Murtinho, D.; Tavares, P. Phase transition in poly(vinylidene fluoride) investigated with micro-Raman spectroscopy. Appl. Spectrosc. 2005, 59, 275–279. [Google Scholar] [CrossRef]
  19. Elyashevich, G.K.; Kuryndin, I.S.; Rozova, E.Y.; Saprykina, N.Y. Polymer piezoelements based on porous polyvinylidene fluoride films and contact electrode polyaniline layers. Phys. Solid State 2020, 62, 566–573. [Google Scholar] [CrossRef]
  20. Tasaka, S.; Miyata, S. The origin of piezoelectricity in poly (vinylidenefluoride). Ferroelectrics 1981, 32, 17–23. [Google Scholar] [CrossRef]
  21. Ohigashi, H. Electromechanical properties of polarized polyvinylidene fluoride films as studied by the piezoelectric resonance method. J. Appl. Phys. 1976, 47, 949–955. [Google Scholar] [CrossRef]
  22. Das-Gupta, D.K.; Doughty, K.; Shier, D.B. A study of structural and electrical properties of stretched polyvinylidene fluoride films. J. Electrost. 1979, 7, 267–282. [Google Scholar] [CrossRef]
  23. Liu, Y.; Han, Z.; Xu, W.; Haibibu, A.; Wang, Q. Composition-dependent dielectric properties of poly (vinylidene fluoride-trifluoroethylene) s near the morphotropic phase boundary. Macromolecules 2019, 52, 6741–6747. [Google Scholar] [CrossRef]
  24. Liu, Y.; Aziguli, H.; Zhang, B.; Xu, W.; Lu, W.; Bernholc, J.; Wang, Q. Ferroelectric polymers exhibiting behaviour reminiscent of a morphotropic phase boundary. Nature 2018, 562, 96–100. [Google Scholar] [CrossRef]
  25. Kochervinskii, V.V.; Buryanskaya, E.L.; Osipkov, A.S.; Makeev, M.O.; Kiselev, D.A.; Gradova, M.A.; Gradov, O.V.; Lokshin, B.V.; Korlyukov, A.A. The Effect of Electric Aging on Vinylidene Fluoride Copolymers for Ferroelectric Memory. Nanomaterials 2024, 14, 1002. [Google Scholar] [CrossRef]
  26. Kochervinskii, V.V.; Glukhov, V.A.; Sokolov, V.G.; Ostrovskii, B.I. Cold drawing of films made from a vinylidene fluoride-tetraflouroethylene copolymer. Polym. Sci. U.S.S.R. 1989, 31, 172–178. [Google Scholar] [CrossRef]
  27. Venkatesan, T.R.; Gulyakova, A.A.; Gerhard, R. Influence of film stretching on crystalline phases and dielectric properties of a 70/30 mol% poly (vinylidenefluoride-tetrafluoroethylene) copolymer. J. Adv. Dielectr. 2020, 10, 2050023. [Google Scholar] [CrossRef]
  28. Osipkov, A.S.; Makeev, M.O.; Solodilov, V.I.; Moiseev, K.M.; Mikhalev, P.A.; Makarova, K.T.; Emanov, D.P.; Parshin, B.A.; Khromova, M.A. Stability of the properties of an acousto-optical converter based on polyvinylidene fluoride films under external influence. J. Opt. Technol. 2024, 91, 502–508. [Google Scholar] [CrossRef]
  29. Dmitriev, I.Y.; Gladchenko, S.V.; Afanasyeva, N.V.; Lavrent’ev, V.K.; Bukošek, V.; Baldrian, J.; Elyashevich, G.K. Molecular mobility of polyvinylidene fluoride in an anisotropic state. Polym. Sci. Ser. A 2008, 50, 265–272. [Google Scholar] [CrossRef]
  30. Munoz, R.C.; Vidal, G.; Mulsow, M.; Lisoni, J.G.; Arenas, C.; Concha, A. Surface roughness and surface-induced resistivity of gold films on mica: Application of quantitative scanning tunneling microscopy. Phys. Rev. 2000, 62, 4686–4697. [Google Scholar] [CrossRef]
  31. Kiselev, D.A.; Bdikin, I.K.; Selezneva, E.K.; Bormanis, K.; Sternberg, A.; Kholkin, A.L. Grain size effect and local disorder in polycrystalline relaxers via scanning probe microscopy. J. Phys. D Appl. Phys. 2007, 40, 7109–7112. [Google Scholar] [CrossRef]
  32. Kochervinskii, V.V.; Buryanskaya, E.L.; Osipkov, A.S.; Ryzhenko, D.S.; Kiselev, D.A.; Lokshin, B.V.; Kirakosyan, G.A. The domain and structural characteristics of ferroelectric copolymers based on vinylidene fluoride copolymer with tetrafluoroethylene composition (94/6). Polymers 2024, 16, 233. [Google Scholar] [CrossRef] [PubMed]
  33. Volynskii, A.L.; Efimov, A.V.; Bakeev, N.F. Structural aspects of physical aging of polymer glasses. Polym. Sci. Ser. C 2007, 49, 301–320. [Google Scholar] [CrossRef]
  34. Lushcheikin, G.A. The Electret Effect in Polymers. Advances in the Preparation and Application of Electrets. Russ. Chem. Rev. 1983, 52, 804. [Google Scholar] [CrossRef]
  35. Kochervinskii, V.V. The structure and properties of block poly (vinylidene fluoride) and systems based on it. Russ. Chem. Rev. 1996, 65, 865. [Google Scholar] [CrossRef]
  36. Tao, R.; Shi, J.; Rafiee, M.; Akbarzadeh, A.; Therriault, D. Fused filament fabrication of PVDF films for piezoelectric sensing and energy harvesting applications. Mater. Adv. 2022, 3, 4851. [Google Scholar] [CrossRef]
  37. Laurent, C.; Chauvet, C.; Berdala, J. The significance of the Weibull threshold in short-term breakdown statistics. IEEE Trans. Dielectr. Electr. Insul. 2002, 1, 160–162. [Google Scholar] [CrossRef]
  38. Kleimyuk, E.A.; Kosyakova, A.I.; Buzin, A.I.; Shevchenko, V.G.; Luponosov, Y.N.; Ponomarenko, S.A. Polyvinylidene Fluoride Copolymers with Grafted Polyethyl Methacrylate Chains: Synthesis and Thermal and Dielectric Properties. Polym. Sci. Ser. C 2022, 64, 200–210. [Google Scholar] [CrossRef]
  39. Satapathy, S.; Pawar, S.; Gupta, P.K.; Varma, K.B.R. Effect of annealing on phase transition in poly (vinylidene fluoride) films prepared using polar solvent. Bull. Mater. Sci. 2011, 34, 727–733. [Google Scholar] [CrossRef]
  40. Wu, L.; Jin, Z.; Liu, Y.; Ning, H.; Liu, X.; Alamusi; Hu, N. Recent advances in the preparation of PVDF-based piezoelectric materials. Nanotechnol. Rev. 2022, 11, 1386–1407. [Google Scholar] [CrossRef]
  41. Cai, X.; Lei, T.; Sun, D.; Lin, L.A. critical analysis of the α, β and γ phases in poly (vinylidene fluoride) using FTIR. RSC Adv. 2017, 7, 15382–15389. [Google Scholar] [CrossRef]
  42. ISO 1183-1:2025; Plastics—Methods for Determining the Density of Non-Cellular Plastics—Part 1: Immersion Method, Liquid Pycnometer Method and Titration Method. ISO: Geneva, Switzerland, 2025.
Figure 1. Electrical strength temperature dependence.
Ijms 26 06309 g001
Figure 2. PFM data for a film stretched at 20 °C before (a) and after (b) polarization.
Ijms 26 06309 g002
Figure 3. Autocorrelation function for topography and ferroelectric domains in the VDF/TFE film stretched at 20 °C showing differences in the correlation length for the unpolarized (a) and polarized (b) films.
Ijms 26 06309 g003
Figure 4. DSC curves of the first heating.
Ijms 26 06309 g004
Figure 5. IR Fourier spectroscopy transmission spectra.
Ijms 26 06309 g005
Figure 6. Micrographs of cold cleavages of the films stretched at different temperatures: (a) initial film, (b) temperature of stretching 20 °C, (c) temperature of stretching 40 °C, (d) temperature of stretching 50 °C, and (e) temperature of stretching 60 °C.
Ijms 26 06309 g006
Figure 7. Laboratory bench for the contact polarization: 1—high-voltage electrode; 2—voltage unit; 3—temperature control unit; 4—Vaseline oil bath; and 5—heating table.
Ijms 26 06309 g007
Table 1. Material piezoelectric properties.
Stretching Temperature, °CEb(30°C), MV/md33, pC/N
Initial film3355
2043020
4040216
5044019
6041018
Table 2. Piezoelectric response force microscopy data.
Stretching Temperature, °CRMS, nmd33loc pm/VξVPFM, nm
UnpoledPoledUnpoledPoledUnpoledPoled
Initial film683041142183
2036404,52154490
40285551921350
5045594,52337270
60423341728380
Table 3. Crystallinity degree computed from the DSC data.
Stretching Temperature, °CMelting Enthalpy ΔHm, J/gCrystallinity Degree χc, %Melting Temperature
βα
Initial 44.042.7153.5162.8
2047.746.2154.1164.0
4043.542.2153.1165.1
5048.747.2153.1164.0
6046.745.3151.4164.2
Table 4. Results of the IR Fourier spectroscopy study.
Tstretching, °CInitial20405060
Electroactive phase proportion, %80.678.177.080.080.5
α-phase proportion, %19.421.923.020.019.5
Table 5. Material density measurements.
Tstretching, °CInitial20405060
ρ, g/cm31.601.781.941.801.82
Disclaimer/Publisher’s Note: The statements, opinions and data contained in all publications are solely those of the individual author(s) and contributor(s) and not of MDPI and/or the editor(s). MDPI and/or the editor(s) disclaim responsibility for any injury to people or property resulting from any ideas, methods, instructions or products referred to in the content.

