
Metabolomic Profiles During and After a Hypertensive Disorder of Pregnancy: The EPOCH Study

 , , , , , , ,
Abstract
1. Introduction
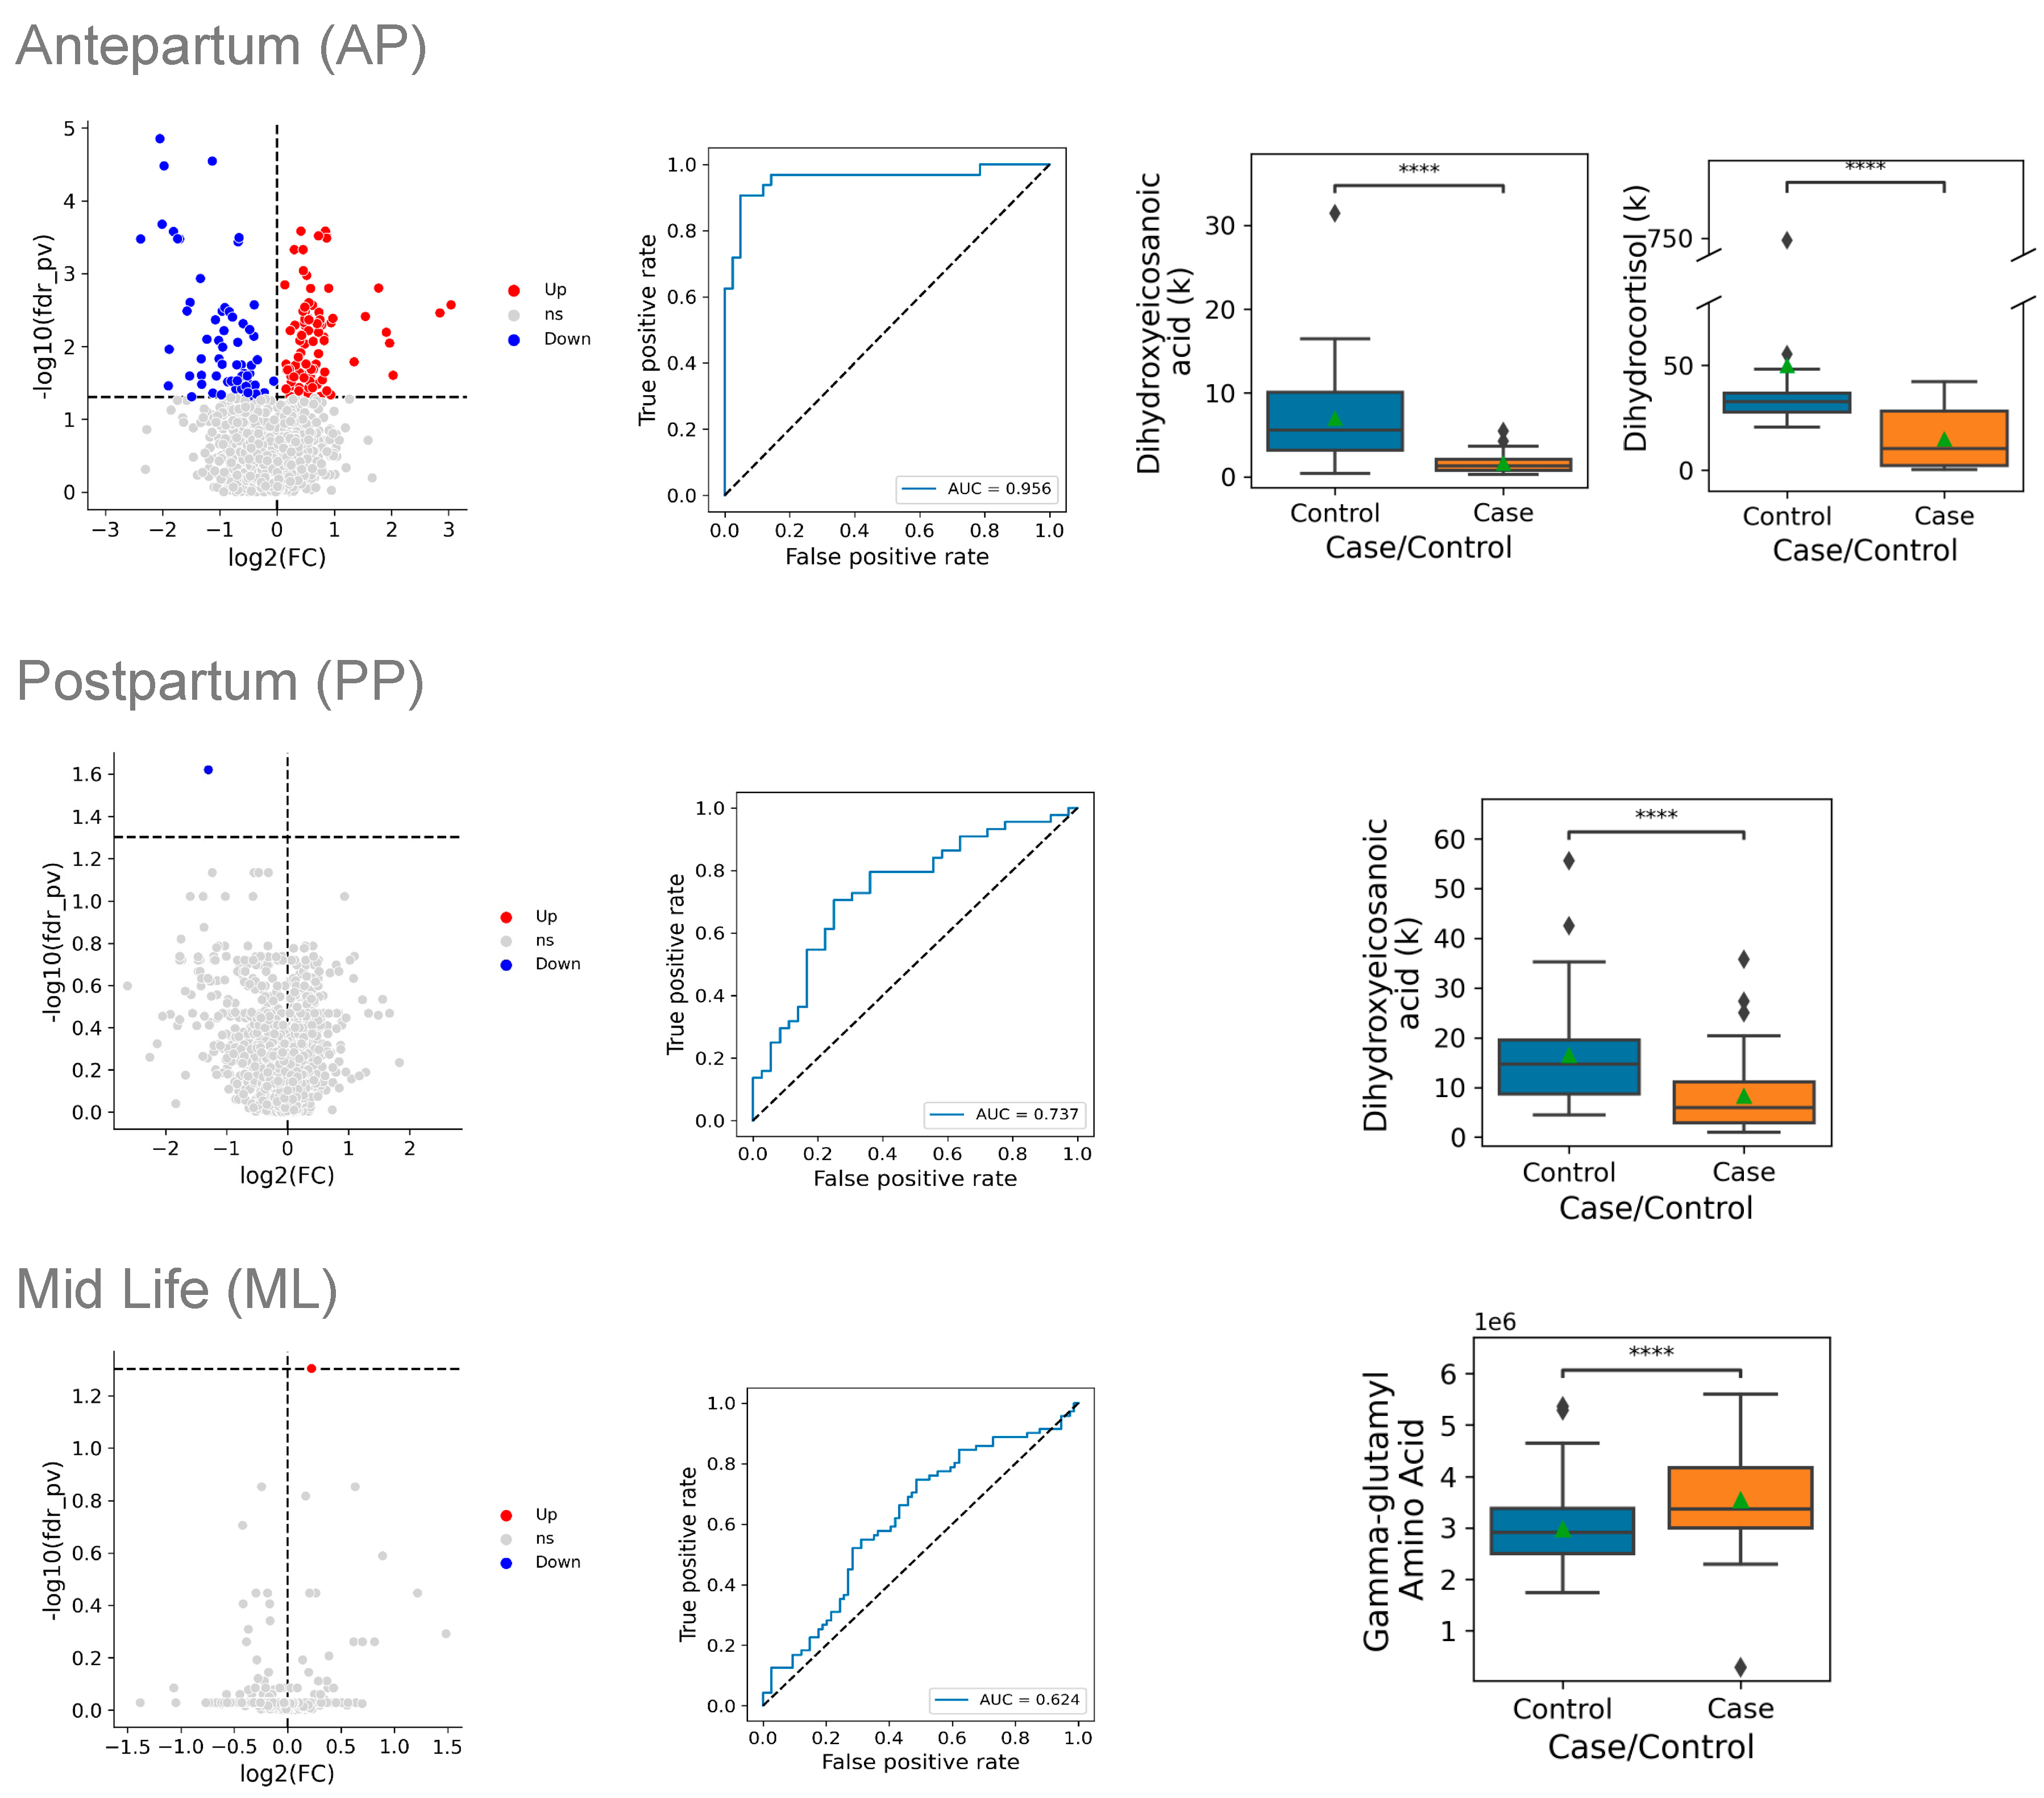
2. Results
2.1. Study Participants
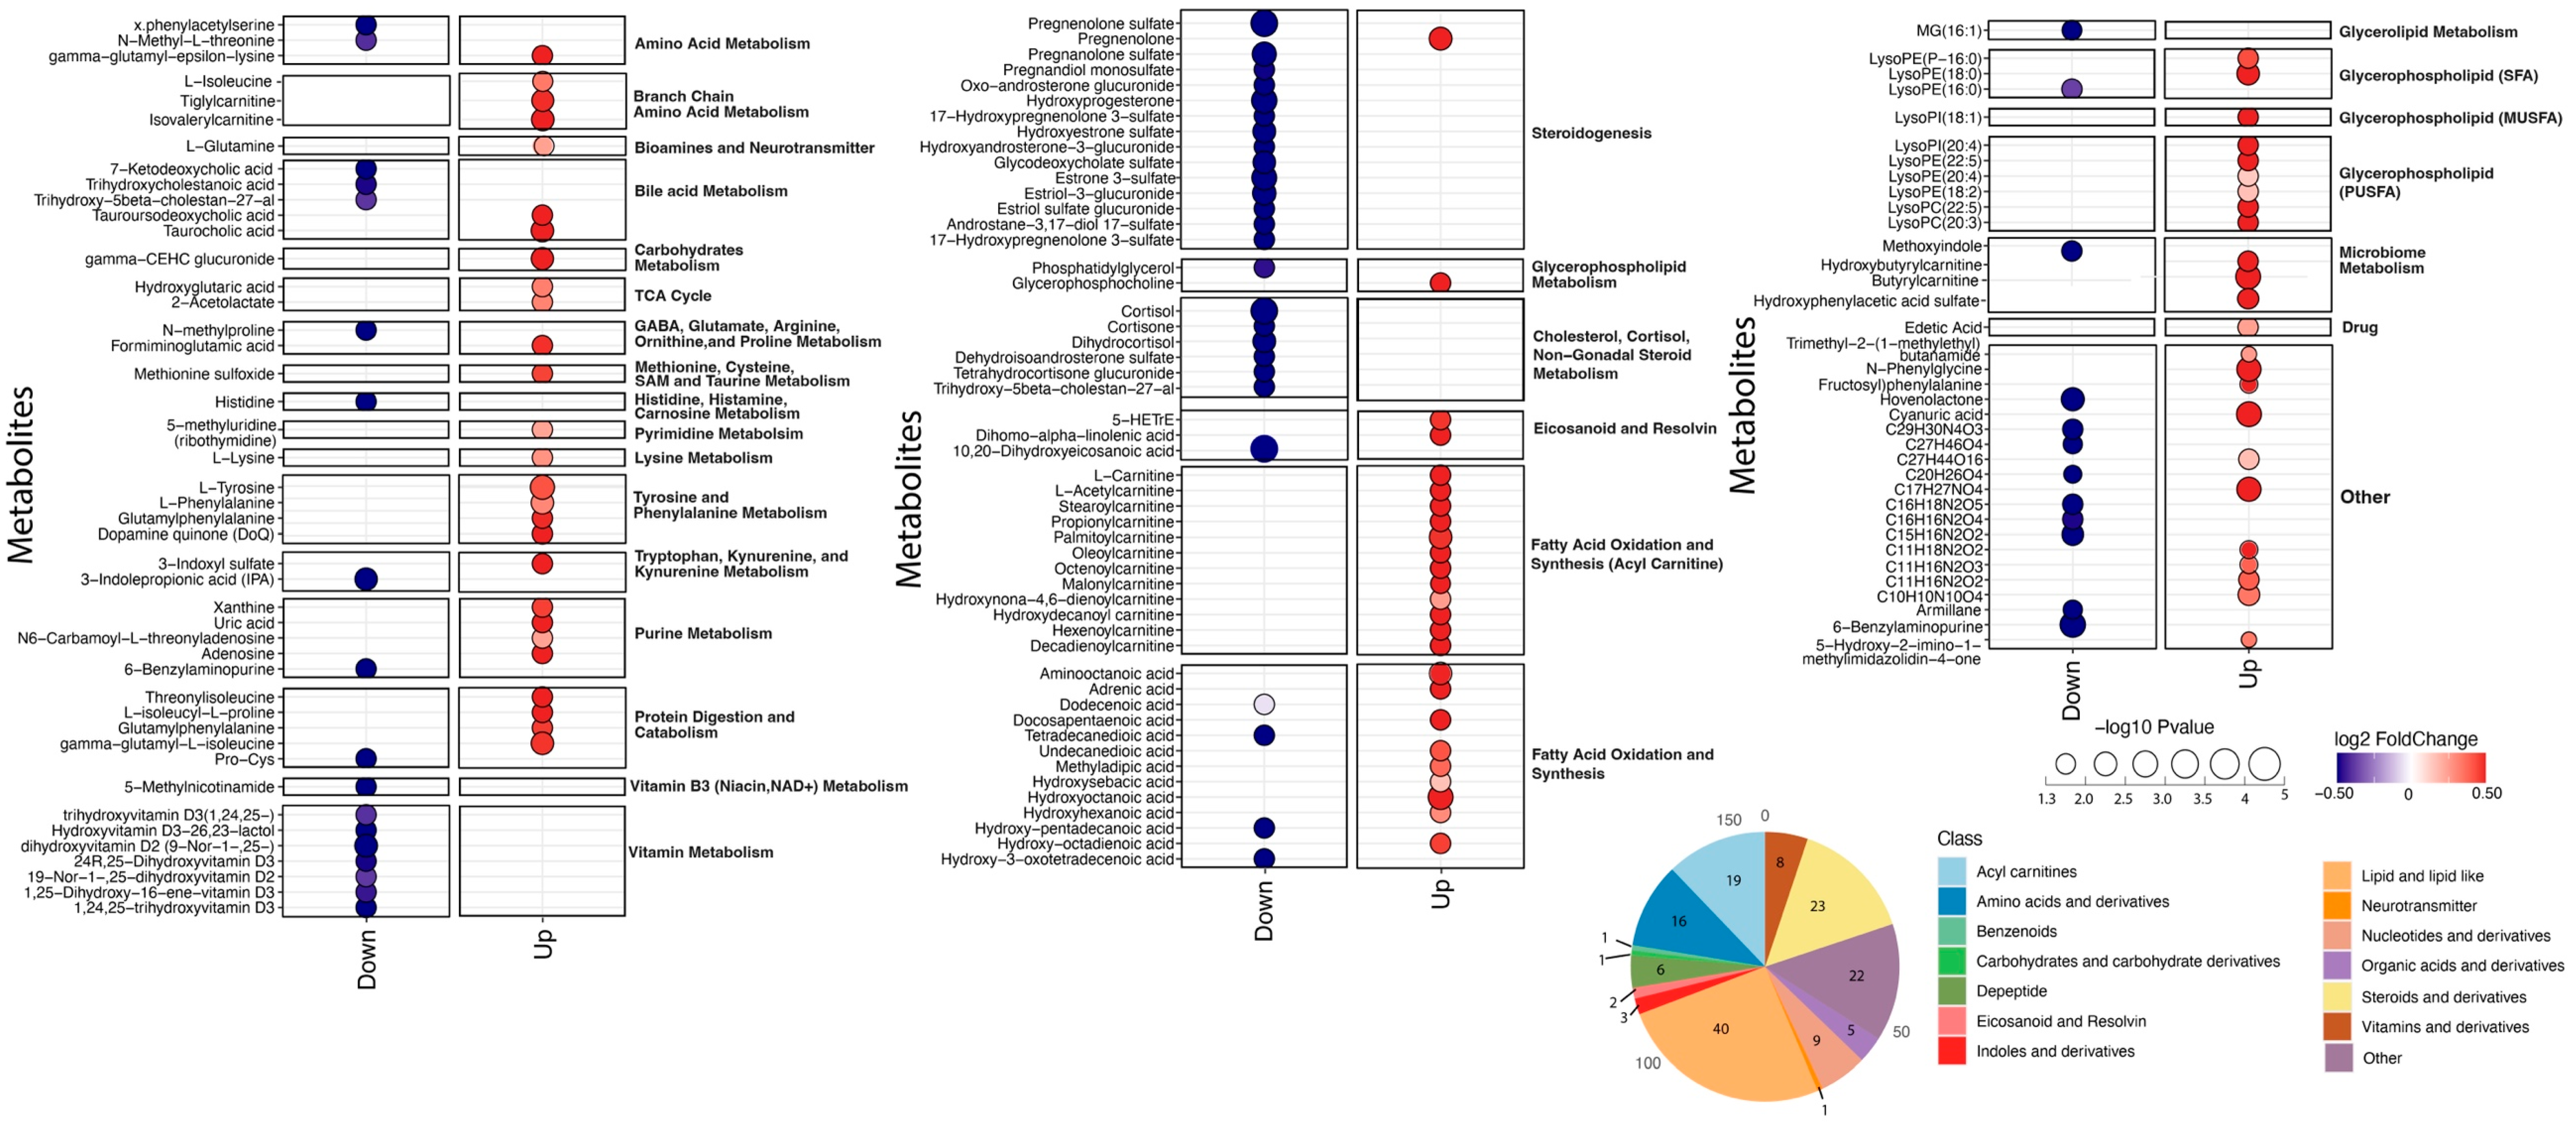
2.2. Antepartum Comparisons
2.3. Postpartum Comparisons
2.4. Mid-Life Comparisons
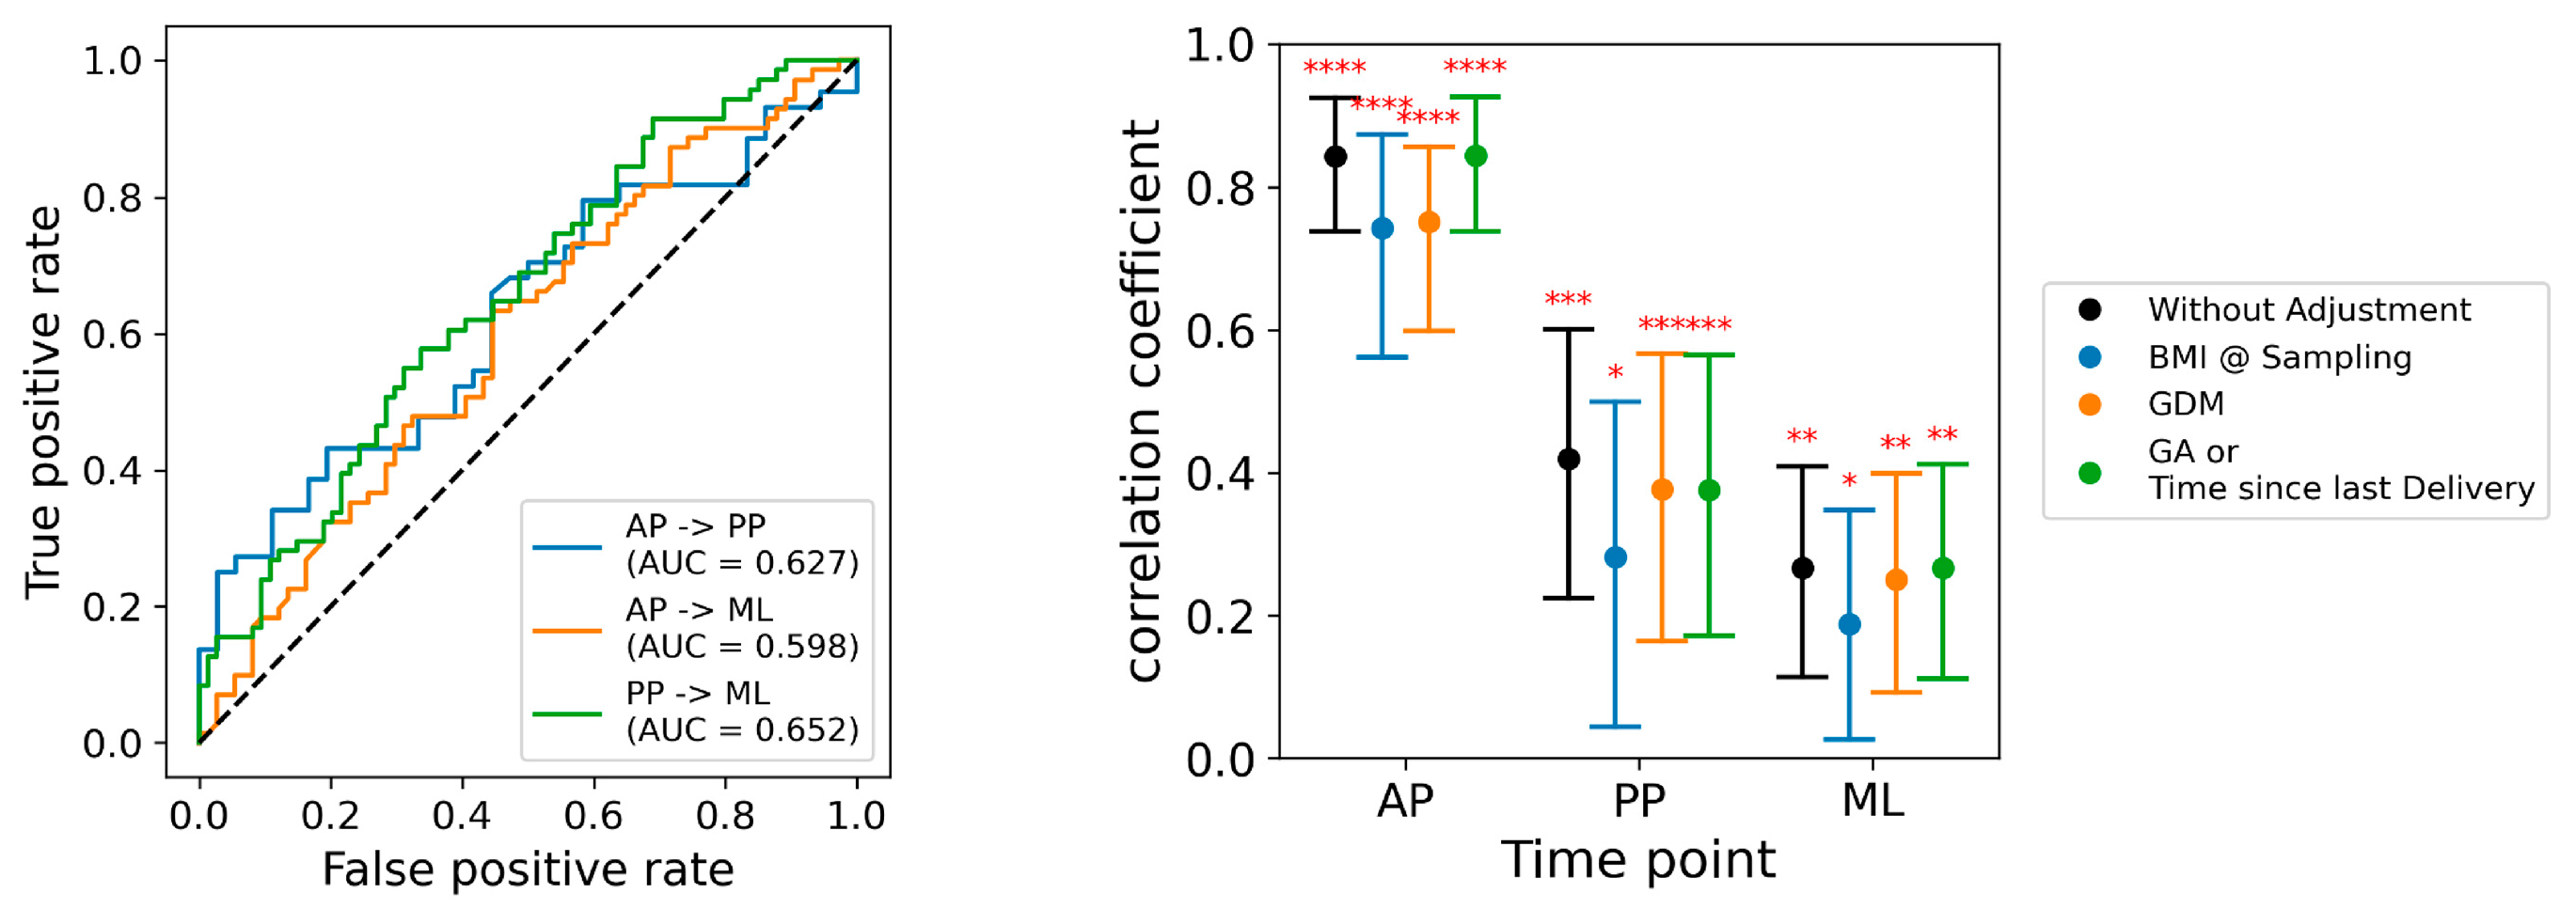
2.5. Temporal Analyses
2.6. Covariates
3. Discussion
3.1. Prior Studies
3.2. Limitations
3.3. Conclusions
4. Materials and Methods
4.1. Study Design
4.2. Sample Collection
4.3. Metabolomic Assays
4.4. Case–Control Comparisons
4.5. Multivariate Modeling
4.6. Temporal Analyses
Supplementary Materials
Author Contributions
Funding
Institutional Review Board Statement
Informed Consent Statement
Data Availability Statement
Acknowledgments
Conflicts of Interest
References
- American College of Obstetricians and Gynecologists. Hypertension in Pregnancy. Report of the American College of Obstetricians and Gynecologists’ Task Force on Hypertension in Pregnancy. Obstet. Gynecol. 2013, 122, 1122–1131. [Google Scholar] [CrossRef]
- Melchiorre, K.; Sharma, R.; Thilaganathan, B. Cardiovascular implications in preeclampsia: An overview. Circulation 2014, 130, 703–714. [Google Scholar] [CrossRef] [PubMed]
- Wu, P.; Haththotuwa, R.; Kwok, C.S.; Babu, A.; Kotronias, R.A.; Rushton, C.; Zaman, A.; Fryer, A.A.; Kadam, U.; Chew-Graham, C.A.; et al. Preeclampsia and future cardiovascular health: A systematic review and meta-analysis. Circ. Cardiovasc. Qual. Outcomes 2017, 10, e003497. [Google Scholar] [CrossRef] [PubMed]
- Cirillo, P.M.; Cohn, B.A. Pregnancy complications and cardiovascular disease death: 50-year follow-up of the Child Health and Development Studies pregnancy cohort. Circulation 2015, 132, 1234–1242. [Google Scholar] [CrossRef] [PubMed]
- Hallum, S.; Basit, S.; Kamper-Jørgensen, M.; Sehested, T.S.G.; Boyd, H.A. Risk and trajectory of premature ischaemic cardiovascular disease in women with a history of pre-eclampsia: A nationwide register-based study. Eur. J. Prev. Cardiol. 2023, 30, 506–516. [Google Scholar] [CrossRef]
- Miller, H.E.; Tierney, S.; Stefanick, M.L.; Mayo, J.A.; Sedan, O.; Rosas, L.G.; Melbye, M.; Boyd, H.A.; Stevenson, D.K.; Shaw, G.M.; et al. Vascular health years after a hypertensive disorder of pregnancy: The EPOCH study. Am. Heart J. 2024, 272, 96–105. [Google Scholar] [CrossRef]
- Hlatky, M.A.; Shu, C.H.; Stevenson, D.K.; Shaw, G.M.; Stefanick, M.L.; Boyd, H.A.; Melbye, M.; Plummer, X.D.; Sedan, O.; Wong, R.J.; et al. Persistence of a proteomic signature after a hypertensive disorder of pregnancy. Hypertension 2025, 82, 872–882. [Google Scholar] [CrossRef] [PubMed]
- Cheng, S.; Shah, S.H.; Corwin, E.J.; Fiehn, O.; Fitzgerald, R.L.; Gerszten, R.E.; Illig, T.; Rhee, E.P.; Srinivas, P.R.; Wang, T.J.; et al. Potential impact and study considerations of metabolomics in cardiovascular health and disease: A Scientific Statement from the American Heart Association. Circ. Cardiovasc. Genet. 2017, 10, e000032. [Google Scholar] [CrossRef]
- Liang, L.; Rasmussen, M.H.; Piening, B.; Shen, X.; Chen, S.; Röst, H.; Snyder, J.K.; Tibshirani, R.; Skotte, L.; Lee, N.C.; et al. Metabolic dynamics and prediction of gestational age and time to delivery in pregnant women. Cell 2020, 181, 1680–1692.e15. [Google Scholar] [CrossRef]
- Wang, Z.H.; Davis, B.B.; Jiang, D.Q.; Zhao, T.T.; Xu, D.Y. Soluble epoxide hydrolase inhibitors and cardiovascular diseases. Curr. Vasc. Pharmacol. 2013, 11, 105–111. [Google Scholar] [CrossRef] [PubMed]
- Kosicka, K.; Siemiątkowska, A.; Główka, F.K. 11β-hydroxysteroid dehydrogenase 2 in preeclampsia. Int. J. Endocrinol. 2016, 2016, 5279462. [Google Scholar] [CrossRef]
- Kapoor, A.; Dunn, E.; Kostaki, A.; Andrews, M.H.; Matthews, S.G. Fetal programming of hypothalamo-pituitary-adrenal function: Prenatal stress and glucocorticoids. J. Physiol. 2006, 572, 31–44. [Google Scholar] [CrossRef] [PubMed]
- Wu, X.; Li, Q.; Lin, D.; Cai, J.; Huang, H.; Tan, H. Gut microbiota and hypertensive disorders in pregnancy: Evidence from the Mendelian randomization study. Aging 2023, 15, 9105–9127. [Google Scholar] [CrossRef] [PubMed]
- Lin, H.; Chen, J.; Ma, S.; An, R.; Li, X.; Tan, H. The association between gut microbiome and pregnancy-induced hypertension: A nested case-control study. Nutrients 2022, 14, 4582. [Google Scholar] [CrossRef] [PubMed]
- Bartho, L.A.; McKeating, D.R.; Walker, S.P.; Nijagal, B.; MacDonald, T.M.; Pritchard, N.; Hannan, N.J.; Perkins, A.V.; Tong, S.; Kaitu’u-Lino, T.J. Plasma metabolites are altered before and after diagnosis of preeclampsia or fetal growth restriction. Sci. Rep. 2024, 14, 15829. [Google Scholar] [CrossRef]
- Yao, M.; Xiao, Y.; Yang, Z.; Ge, W.; Liang, F.; Teng, H.; Gu, Y.; Yin, J. Identification of biomarkers for preeclampsia based on metabolomics. Clin. Epidemiol. 2022, 14, 337–360. [Google Scholar] [CrossRef]
- Hong, X.; Zhang, B.; Liang, L.; Zhang, Y.; Ji, Y.; Wang, G.; Ji, H.; Clish, C.B.; Burd, I.; Pearson, C.; et al. Postpartum plasma metabolomic profile among women with preeclampsia and preterm delivery: Implications for long-term health. BMC Med. 2020, 18, 277. [Google Scholar] [CrossRef]
- Marić, I.; Contrepois, K.; Moufarrej, M.N.; Stelzer, I.A.; Feyaerts, D.; Han, X.; Tang, A.; Stanley, N.; Wong, R.J.; Traber, G.M.; et al. Early prediction and longitudinal modeling of preeclampsia from multiomics. Patterns 2022, 3, 100655. [Google Scholar] [CrossRef]
- Koster, M.P.; Vreeken, R.J.; Harms, A.C.; Dane, A.D.; Kuc, S.; Schielen, P.C.; Hankemeier, T.; Berger, R.; Visser, G.H.; Pennings, J.L. First-trimester serum acylcarnitine levels to predict preeclampsia: A metabolomics approach. Dis. Markers 2015, 2015, 857108. [Google Scholar] [CrossRef]
- Contrepois, K.; Jiang, L.; Snyder, M. Optimized analytical procedures for the untargeted metabolomic profiling of human urine and plasma by combining hydrophilic interaction (HILIC) and reverse-phase liquid chromatography (RPLC)-mass spectrometry. Mol. Cell Proteom. 2015, 14, 1684–1695. [Google Scholar] [CrossRef]
- Benjamini, Y.; Hochberg, Y. Controlling the false discovery rate: A practical and powerful approach to multiple testing. J. R. Stat. Soc. Ser. B Stat. Methodol. 1995, 57, 289–300. [Google Scholar] [CrossRef]
- Chen, T.; Guestrin, C. XGBoost: A scalable tree boosting system. In Proceedings of the KDD ’16 22nd ACM SIGKDD International Conference on Knowledge Discovery and Data Mining, San Francisco, CA, USA, 13–17 August 2016; pp. 785–794. [Google Scholar] [CrossRef]


| Antepartum Visit | Postpartum Visit | Mid-Life Visit | |||||||
|---|---|---|---|---|---|---|---|---|---|
| Cases (n = 32) | Controls (n = 42) | p- Value | Cases (n = 44) | Controls (n = 36) | p-Value | Cases (n = 71) | Controls (n = 74) | p-Value | |
| Clinical characteristics | |||||||||
| Race * | |||||||||
| White | 12 (38%) | 25 (60%) | 0.10 | 22 (50%) | 23 (64%) | 0.31 | 38 (54%) | 45 (61%) | 0.47 |
| Asian/Pacific Islander | 7 (22%) | 12 (29%) | 0.70 | 10 (23%) | 10 (28%) | 0.80 | 17 (24%) | 25 (34%) | 0.26 |
| Black/African American | 1 (3%) | 2 (5%) | 1.00 | 1 (2%) | 2 (6%) | 0.59 | 3 (4%) | 3 (4%) | 1.00 |
| Native American/Alaskan | 0 (0%) | 0 (0%) | 1.00 | 1 (2%) | 0 (0%) | 1.00 | 1 (1%) | 2 (3%) | 1.00 |
| Not reported | 12 (38%) | 5 (12%) | 0.005 | 11 (25%) | 2 (6%) | 0.03 | 16 (23%) | 8 (11%) | 0.09 |
| Hispanic ethnicity | 9 (28%) | 6 (14%) | 0.14 | 14 (32%) | 4 (11%) | 0.03 | 19 (27%) | 14 (19%) | 0.26 |
| Gestational diabetes | 8 (25%) | 0 (0%) | 0.0004 | 9 (20%) | 0 (0%) | 0.003 | 6 (8%) | 0 (0%) | 0.01 |
| Preterm HDP onset (<37 weeks) | 31 (97%) | 0 (0%) | NA | 25 (57%) | 0 (0%) | NA | 31 (44%) | 0 (0%) | NA |
| Gestational age at delivery (weeks) | 34.6 (2.6) | 39.2 (1.3) | <0.0001 | 36.5 (3.2) | 39.1 (1.6) | 0.0001 | 37.0 (3.2) | 38.4 (2.8) | 0.006 |
| Characteristics at study visit | |||||||||
| Study visit timing † | 33.3 (3.2) | 33.0 (3.8) | 0.68 | 16.9 (12.3) | 9.7 (5.6) | 0.002 | 6.0 (3.5) | 5.9 (3.8) | 0.88 |
| Age (years) | 33.4 (5.5) | 32.9 (4.4) | 0.65 | 34.3 (4.4) | 33.5 (3.7) | 0.41 | 40.6 (6.3) | 41.0 (5.3) | 0.54 |
| Parity | 0.8 (1.1) | 0.4 (0.5) | 0.05 | 1.6 (1.0) | 1.4 (0.5) | 0.21 | 2 (1.2) | 2 (0.8) | 0.63 |
| Nulliparous/primiparous ‡ | 19 (59%) | 25 (60%) | 0.99 | 28 (64%) | 23 (64%) | 0.98 | 26 (37%) | 22 (30%) | 0.35 |
| Gravidity | 2.6 (1.6) | 1.8 (0.8) | 0.005 | 2.3 (1.3) | 1.8 (0.8) | 0.04 | 3 (1.9) | 3 (1.6) | 0.52 |
| Body mass index (kg/m2) | 33.2 (6.8) | 26.2 (3.6) | <0.0001 | 28.5 (6.6) | 24.2 (3.6) | 0.002 | 27 (4.9) | 24 (4.9) | 0.005 |
| Blood pressure § | |||||||||
| Systolic | 132 (14.6) | 105 (7.0) | <0.0001 | 115 (9.1) | 106 (7.9) | 0.0006 | 119 (10.7) | 112 (11.5) | 0.0003 |
| Diastolic | 82 (5.9) | 64 (6.7) | <0.0001 | 73 (7.3) | 68 (5.9) | 0.005 | 75 (8.5) | 70 (9.3) | 0.001 |
| Antihypertensive treatment || | 9 (28%) | 0 (0%) | 0.0002 | 2 (5%) | 0 (0%) | 0.21 | 7(10%) | 2 (3%) | 0.006 |
| Metabolite Name | Class | Pathway | Log2 (Fold-Change) | Adjusted p-Value |
|---|---|---|---|---|
| 10,20-Dihydroxyeicosanoic acid * | Eicosanoid and resolvin | Eicosanoid and resolvin metabolism | −2.05 | 0.00001 |
| Pregnenolone sulfate | Gonadal steroid | Gonadal steroid metabolism/xenobiotic metabolism | −1.13 | 0.00003 |
| Cortisol | Steroids and derivatives | Cholesterol, cortisol, non-gonadal steroid metabolism | −1.98 | 0.00003 |
| 11β-Hydroxyprogesterone | Steroids and derivatives | Gonadal steroid metabolism | −2.01 | 0.00021 |
| Butyrylcarnitine | Acyl carnitines | Fatty Acid Oxidation and Synthesis | 0.84 | 0.00026 |
| L-Tyrosine | Amino acids and derivatives | Tyrosine and phenylalanine metabolism | 0.42 | 0.00026 |
| Estrone 3-sulfate | Steroids and derivatives | Gonadal steroid metabolism/xenobiotic metabolism | −1.81 | 0.00027 |
| Hydroxyoctadienoic acid | Lipid and lipid-like | Fatty acid oxidation and synthesis | 0.72 | 0.00030 |
| C7H15N3O2 | NA | NA | 0.87 | 0.00030 |
| Pregnanolone sulfate | Steroids and derivatives | Gonadal steroid metabolism/xenobiotic metabolism | −0.67 | 0.00032 |
| C17H27NO4 | NA | NA | 0.87 | 0.00033 |
| Estriol-3-glucuronide | Steroids and derivatives | Gonadal steroid metabolism/xenobiotic metabolism | −1.74 | 0.00033 |
| Dihydrocortisol ** | Steroids and derivatives | Cholesterol, cortisol, non-gonadal steroid Metabolism | −2.38 | 0.00034 |
| Hydroxyestrone sulfate | Steroids and derivatives | Gonadal steroid metabolism/xenobiotic metabolism | −1.70 | 0.00034 |
| 9-Nor-1-,25-dihydroxyvitamin D2 | Vitamins and derivatives | Vitamin metabolism | −0.68 | 0.00037 |
| L-Phenylalanine | Amino acids and derivatives | Tyrosine and phenylalanine metabolism | 0.30 | 0.00047 |
| Gamma-glutamyl-L-isoleucine | Dipeptide | Protein digestion or protein catabolism | 0.46 | 0.00047 |
| Glutamylphenylalanine | Dipeptide | Protein digestion or protein catabolism | 0.46 | 0.00092 |
Disclaimer/Publisher’s Note: The statements, opinions and data contained in all publications are solely those of the individual author(s) and contributor(s) and not of MDPI and/or the editor(s). MDPI and/or the editor(s) disclaim responsibility for any injury to people or property resulting from any ideas, methods, instructions or products referred to in the content. |
© 2025 by the authors. Licensee MDPI, Basel, Switzerland. This article is an open access article distributed under the terms and conditions of the Creative Commons Attribution (CC BY) license (https://creativecommons.org/licenses/by/4.0/).
Share and Cite
Hlatky, M.A.; Shu, C.-H.; Bararpour, N.; Murphy, B.M.; Sorondo, S.M.; Leeper, N.J.; Wong, F.; Stevenson, D.K.; Shaw, G.M.; Stefanick, M.L.; et al. Metabolomic Profiles During and After a Hypertensive Disorder of Pregnancy: The EPOCH Study. Int. J. Mol. Sci. 2025, 26, 6150. https://doi.org/10.3390/ijms26136150
Hlatky MA, Shu C-H, Bararpour N, Murphy BM, Sorondo SM, Leeper NJ, Wong F, Stevenson DK, Shaw GM, Stefanick ML, et al. Metabolomic Profiles During and After a Hypertensive Disorder of Pregnancy: The EPOCH Study. International Journal of Molecular Sciences. 2025; 26(13):6150. https://doi.org/10.3390/ijms26136150
Chicago/Turabian StyleHlatky, Mark A., Chi-Hung Shu, Nasim Bararpour, Brenna M. Murphy, Sabina M. Sorondo, Nicholas J. Leeper, Frank Wong, David K. Stevenson, Gary M. Shaw, Marcia L. Stefanick, and et al. 2025. "Metabolomic Profiles During and After a Hypertensive Disorder of Pregnancy: The EPOCH Study" International Journal of Molecular Sciences 26, no. 13: 6150. https://doi.org/10.3390/ijms26136150
APA StyleHlatky, M. A., Shu, C.-H., Bararpour, N., Murphy, B. M., Sorondo, S. M., Leeper, N. J., Wong, F., Stevenson, D. K., Shaw, G. M., Stefanick, M. L., Boyd, H. A., Melbye, M., Sedan, O., Wong, R. J., Snyder, M. P., Aghaeepour, N., & Winn, V. D. (2025). Metabolomic Profiles During and After a Hypertensive Disorder of Pregnancy: The EPOCH Study. International Journal of Molecular Sciences, 26(13), 6150. https://doi.org/10.3390/ijms26136150