
Soy Protein Isolate Affects Blood and Brain Biomarker Expression in a Mouse Model of Fragile X


Abstract
1. Introduction
2. Results
2.1. Differentially Expressed Proteins in Cortex
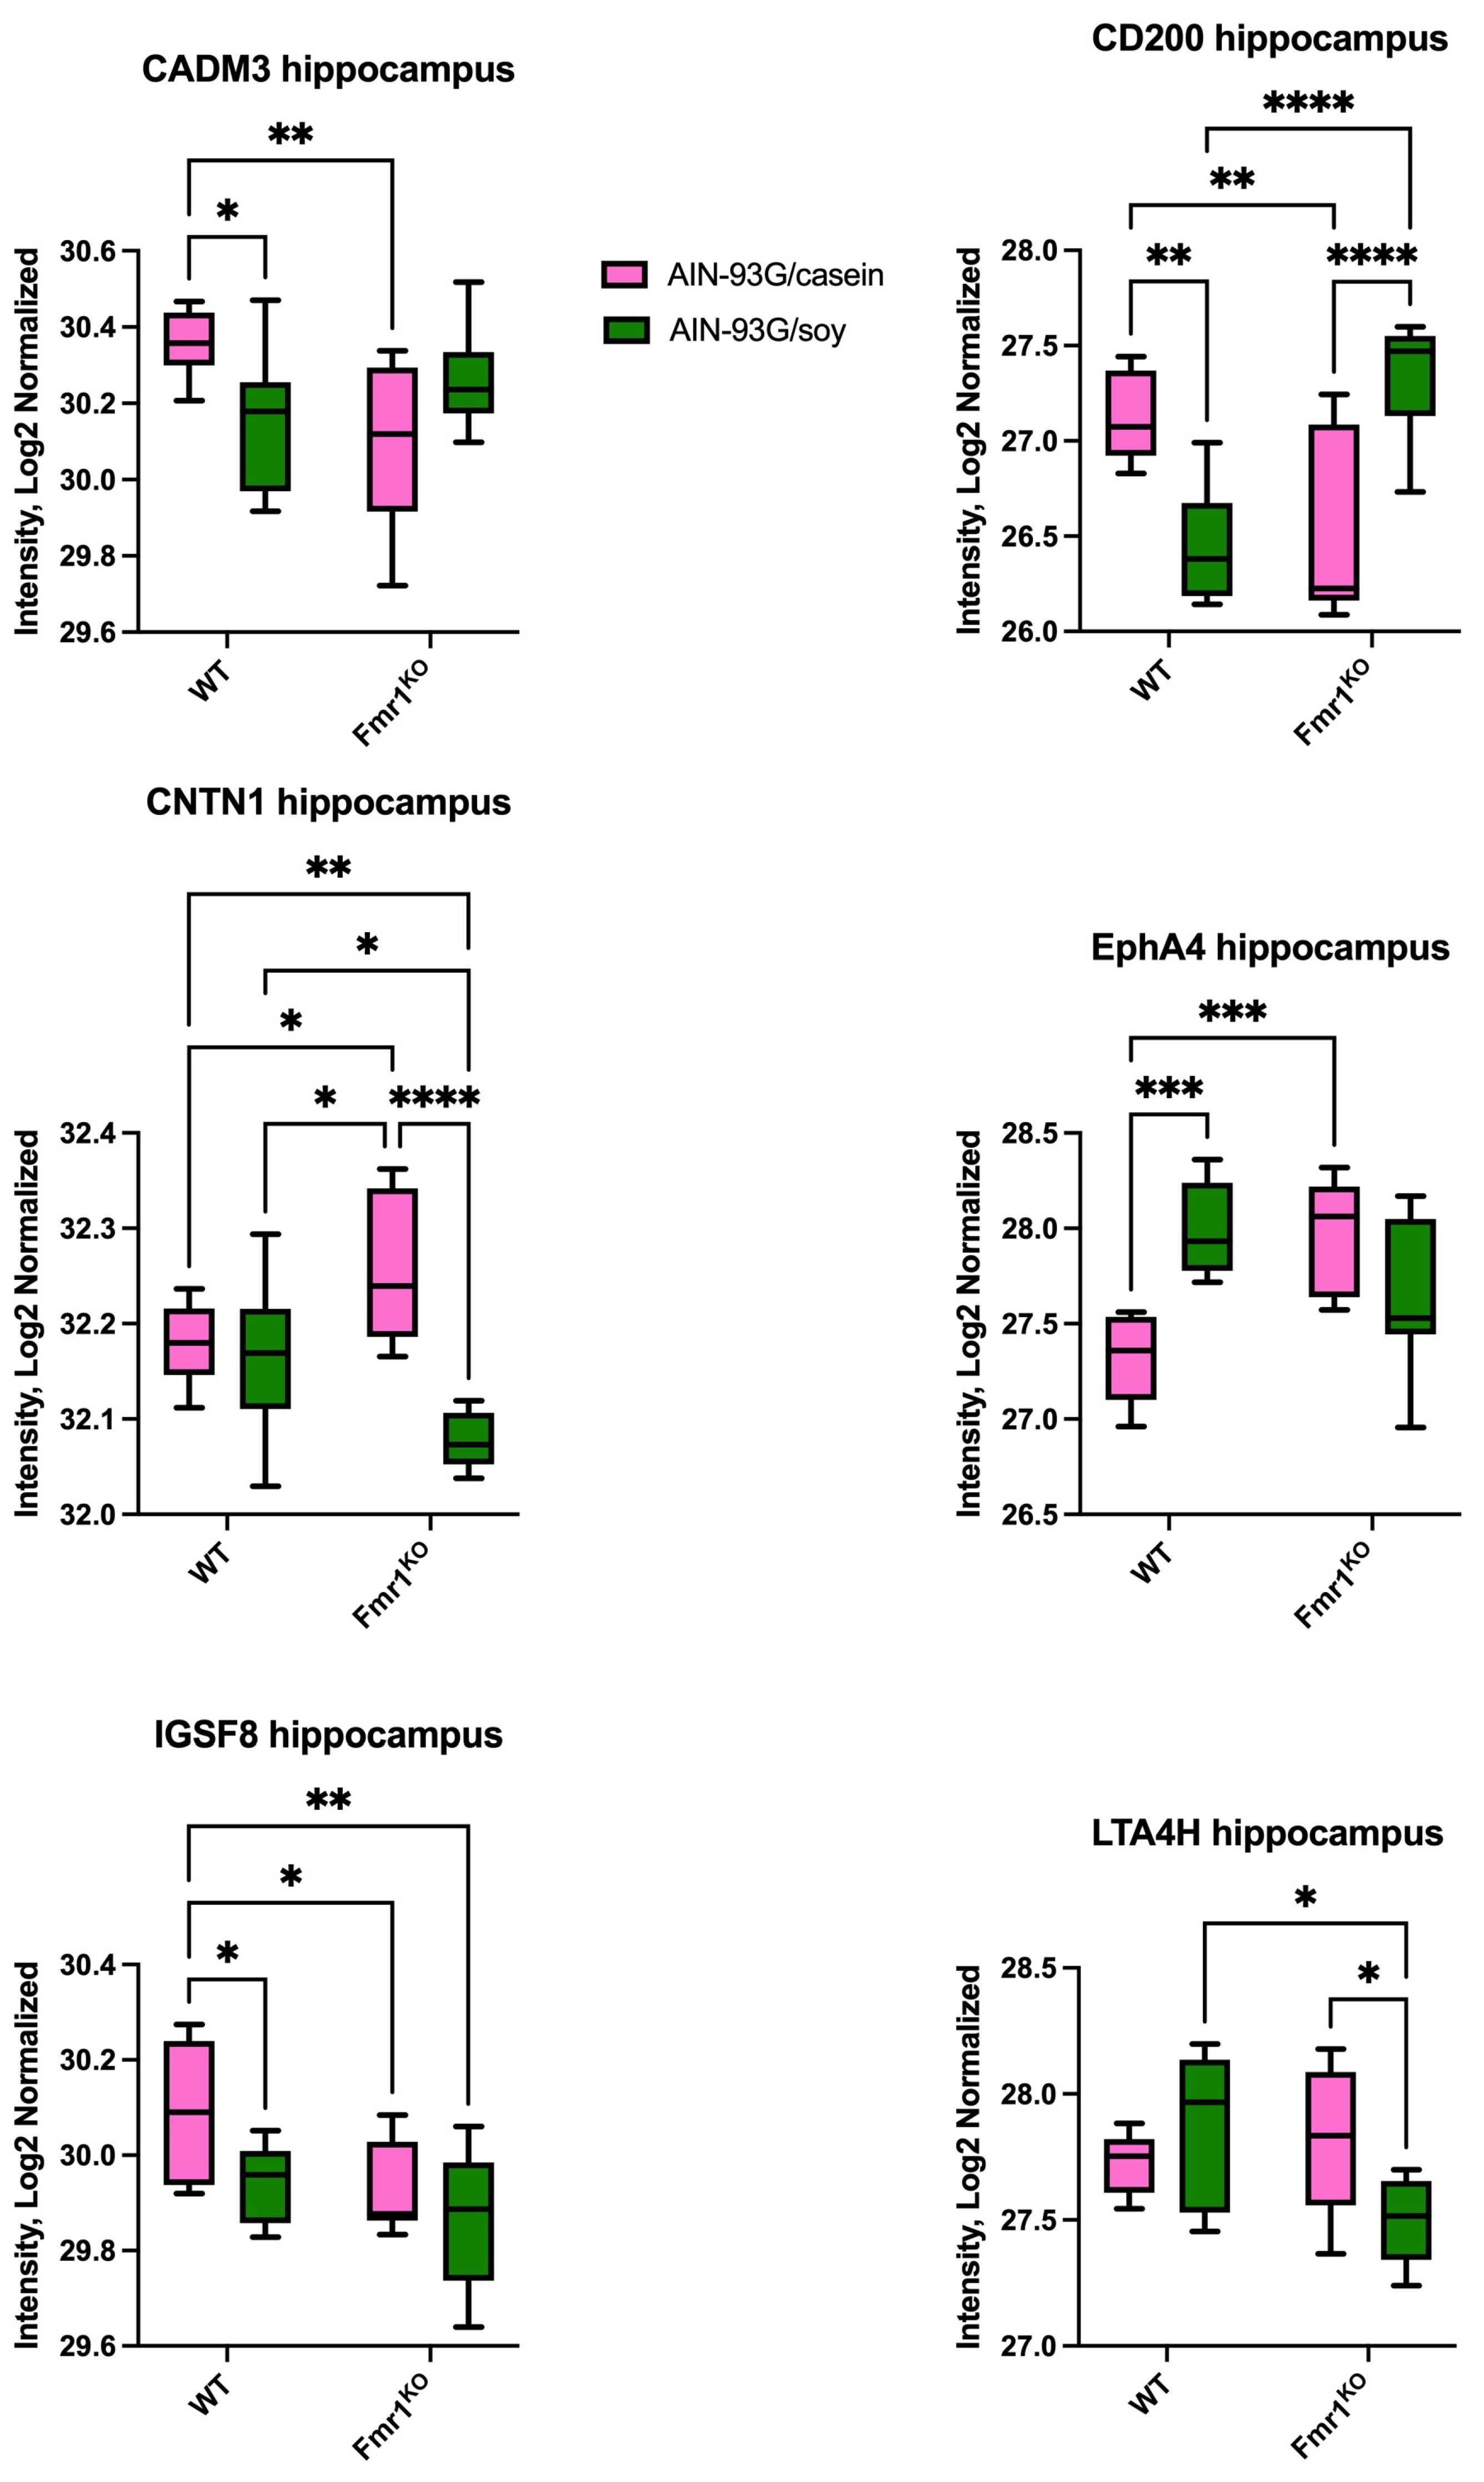
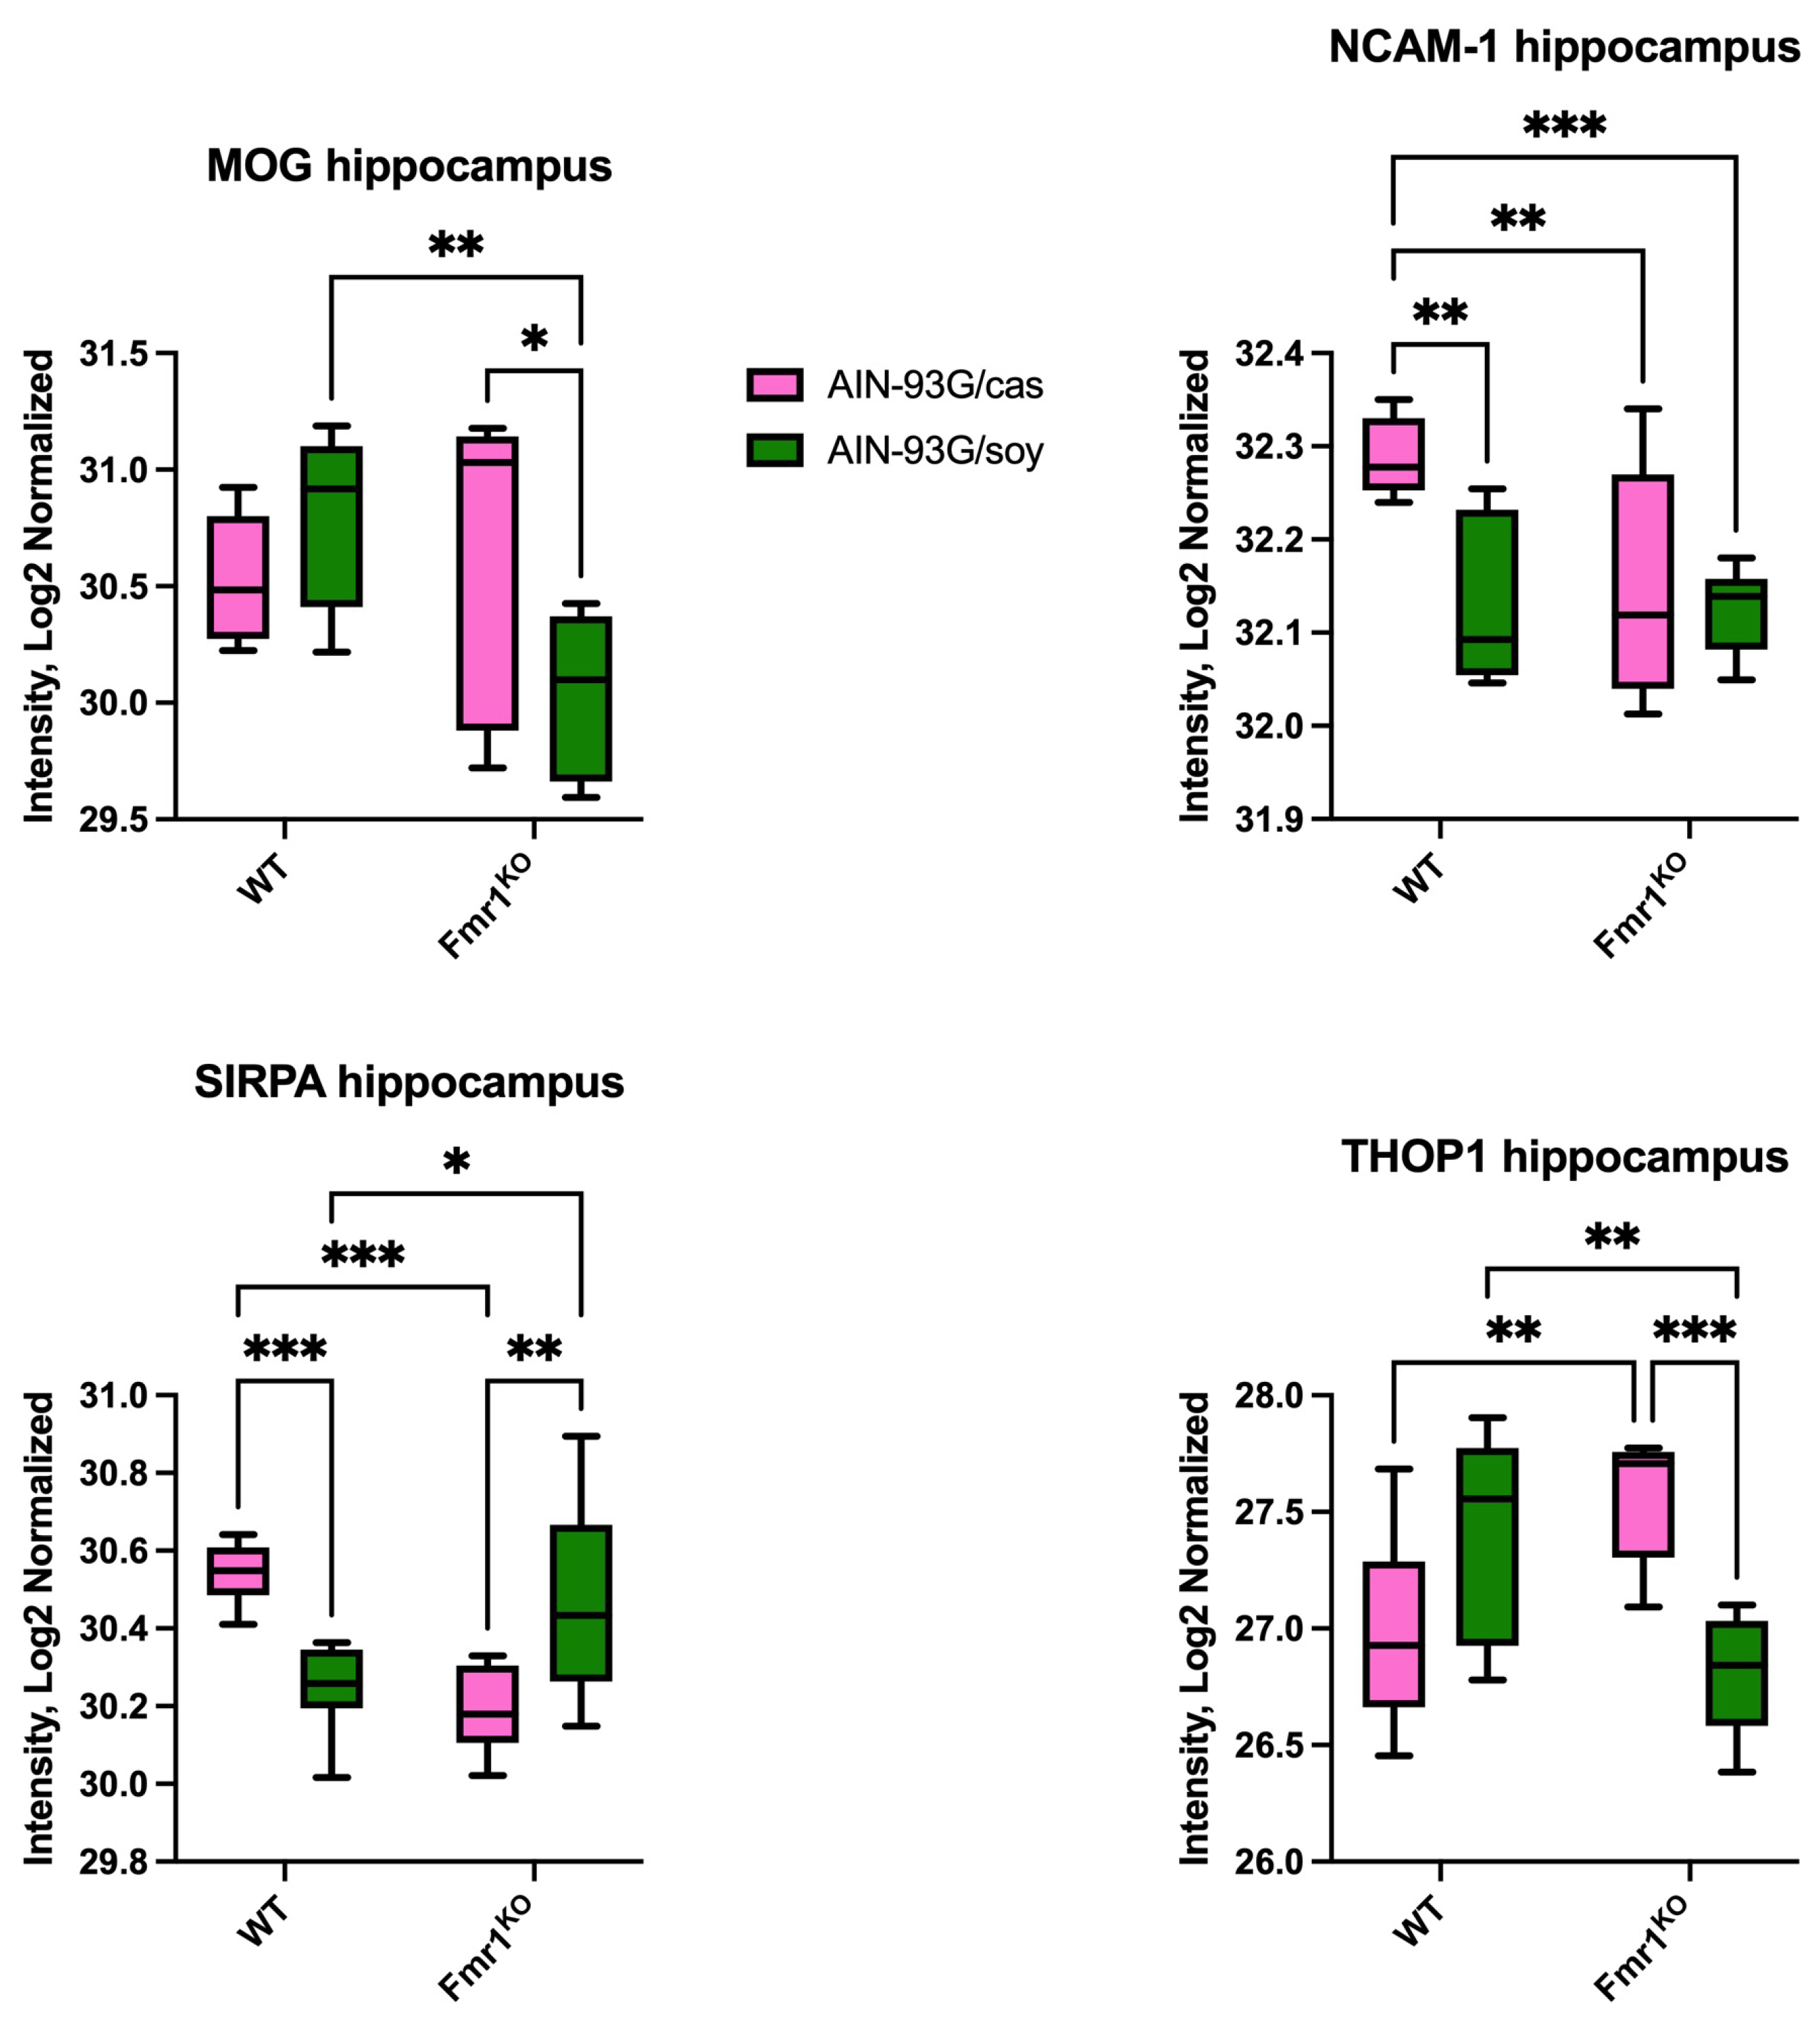
2.2. Differentially Expressed Proteins in Hippocampus
2.3. Differentially Expressed Proteins in Hypothalamus
2.4. Differentially Expressed Proteins in Blood Plasma
2.5. Differentially Expressed Proteins in Blood Plasma Comparing Two Diet Studies
2.6. Differentially Expressed Top Proteins as a Function of Fmr1 Genotype and AIN-93G Diets
2.7. Differentially Expressed Proteins in Hippocampus and Hypothalamus Comparing Mass Spectrometry and Quantibody Arrays
3. Discussion
4. Materials and Methods
4.1. Mouse Husbandry
4.2. Diets
4.3. Study Design and Tissue Collection
4.4. Quantibody Cytokine Arrays
4.5. Data Analysis
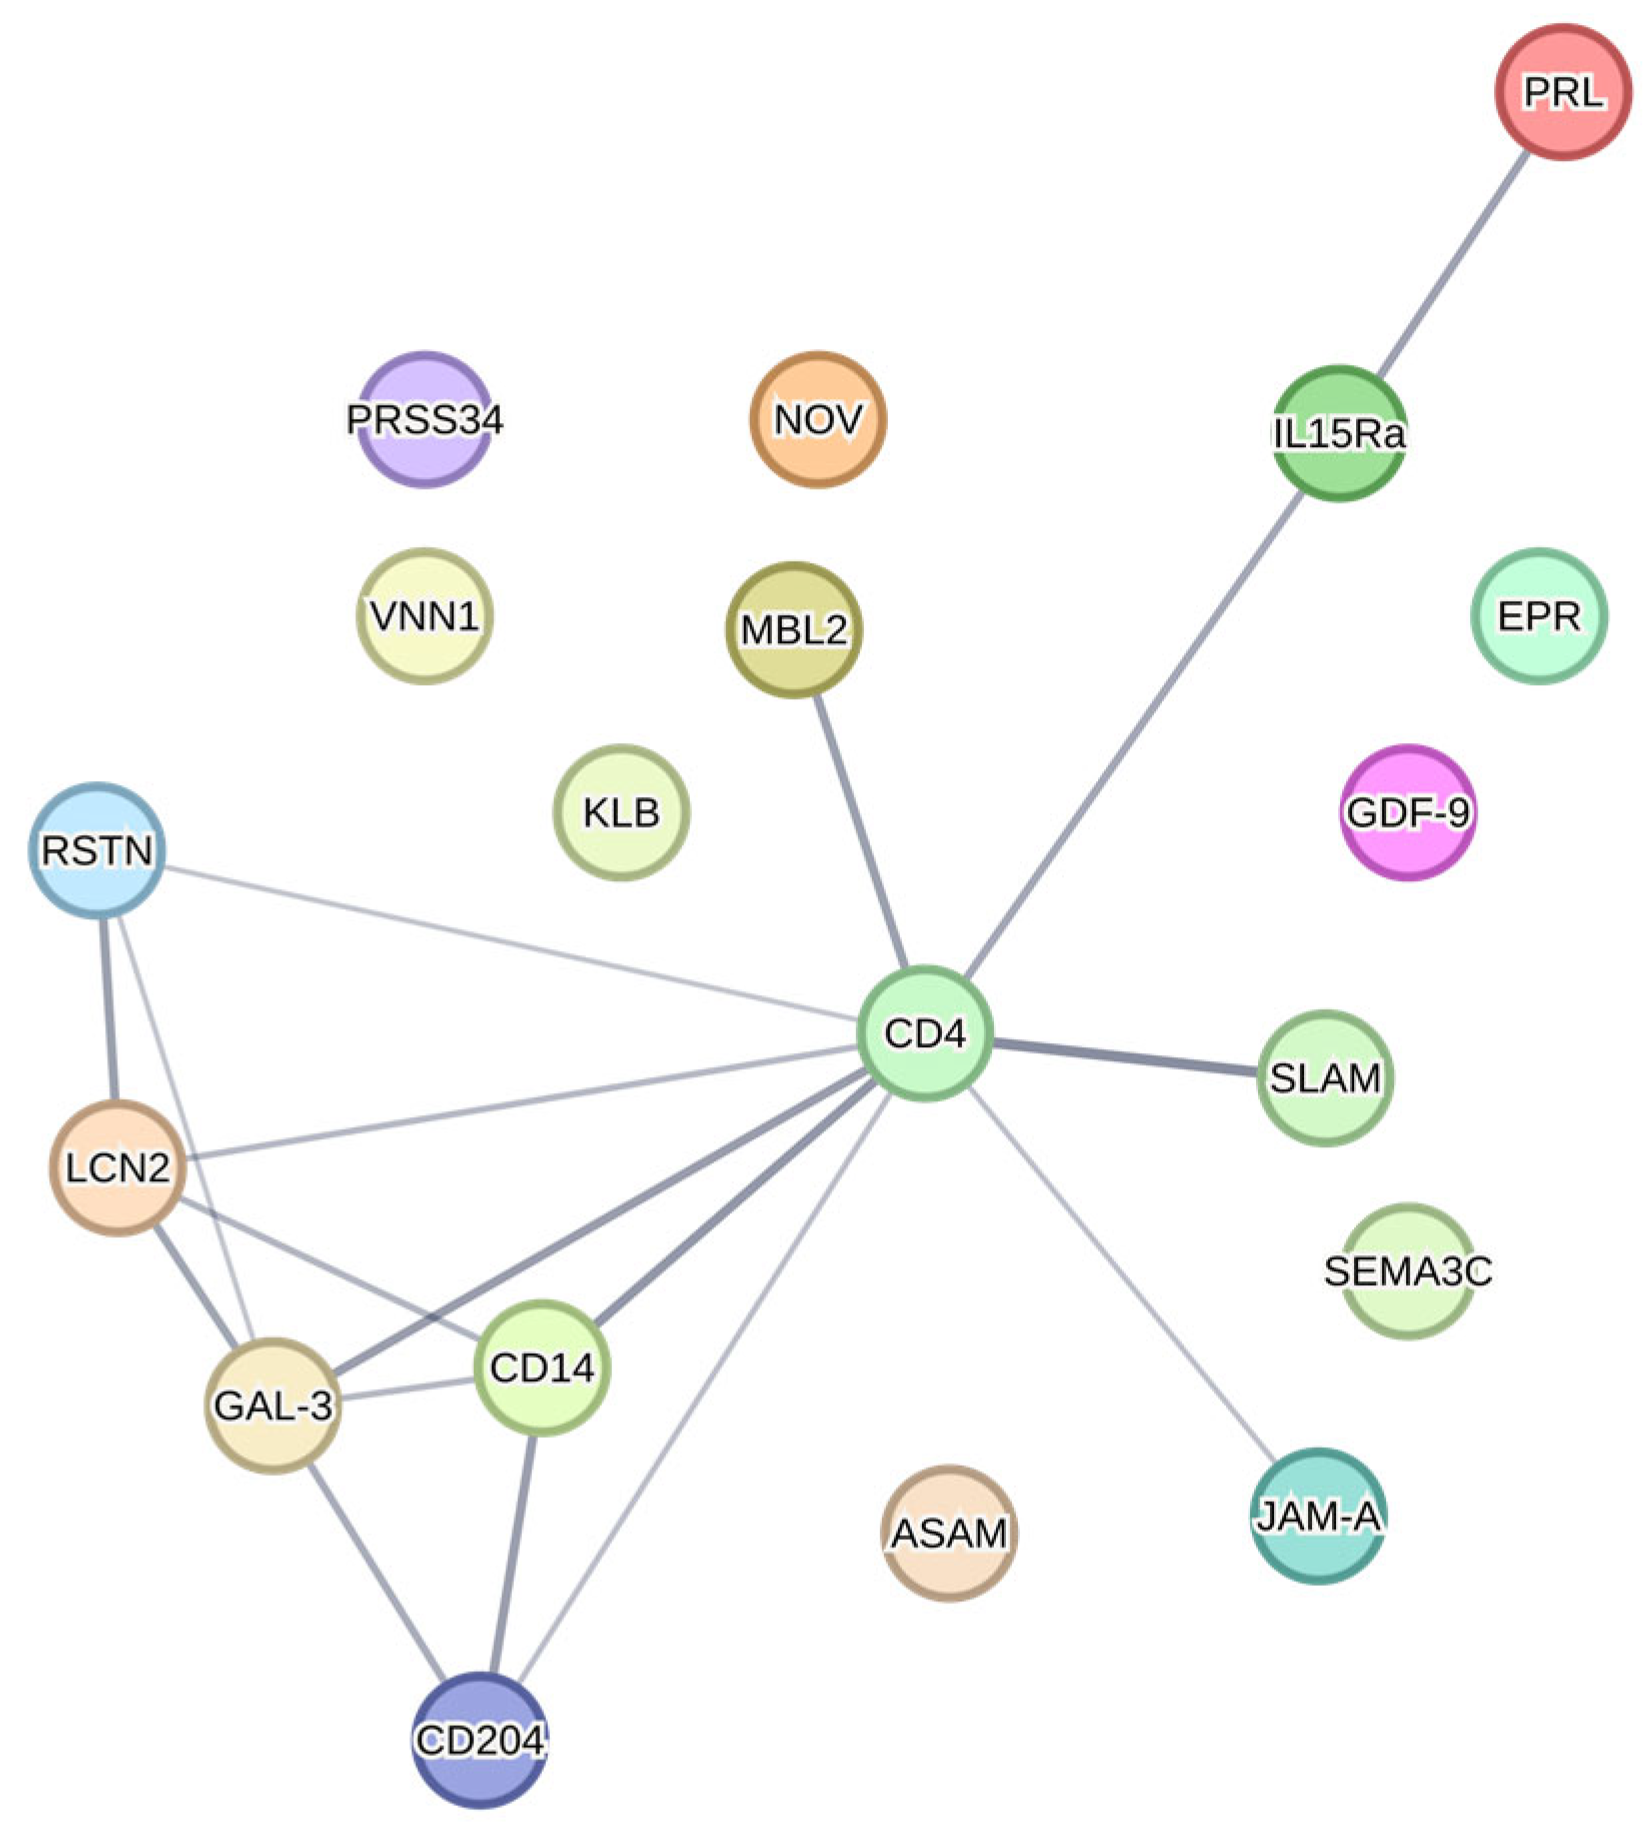
4.6. STRING Protein Interaction Analysis
5. Conclusions
Supplementary Materials
Author Contributions
Funding
Institutional Review Board Statement
Informed Consent Statement
Data Availability Statement
Acknowledgments
Conflicts of Interest
References
- Verkerk, A.J.; Pieretti, M.; Sutcliffe, J.S.; Fu, Y.H.; Kuhl, D.P.; Pizzuti, A.; Reiner, O.; Richards, S.; Victoria, M.F.; Zhang, F.P. Identification of a gene (FMR-1) containing a CGG repeat coincident with a breakpoint cluster region exhibiting length variation in fragile X syndrome. Cell 1991, 65, 905–914. [Google Scholar] [CrossRef] [PubMed]
- Oberlé, I.; Rousseau, F.; Heitz, D.; Kretz, C.; Devys, D.; Hanauer, A.; Boué, J.; Bertheas, M.F.; Mandel, J.L. Instability of a 550-base pair DNA segment and abnormal methylation in fragile X syndrome. Science 1991, 252, 1097–1102. [Google Scholar] [CrossRef] [PubMed]
- Hagerman, R.J.; Hagerman, P.J. Fragile X Syndrome: Diagnosis, Treatment, and Research, 3rd ed.; Johns Hopkins University Press: Baltimore, MD, USA, 2002; p. xii. 540p. [Google Scholar]
- Davis, J.K.; Broadie, K. Multifarious Functions of the Fragile X Mental Retardation Protein. Trends Genet. 2017, 33, 703–714. [Google Scholar] [CrossRef]
- Consortium. Fmr1 knockout mice: A model to study fragile X mental retardation. The Dutch-Belgian Fragile X Consortium. Cell 1994, 78, 23–33. [Google Scholar]
- Westmark, C.J.; Westmark, P.R.; Malter, J.S. Soy-based diet exacerbates seizures in mouse models of neurological disease. J. Alzheimers Dis. 2013, 33, 797–805. [Google Scholar] [CrossRef] [PubMed]
- Westmark, C.J. Soy Infant Formula may be Associated with Autistic Behaviors. Autism Open Access 2013, 3, 20727. [Google Scholar] [CrossRef] [PubMed]
- Westmark, C.J. Soy infant formula and seizures in children with autism: A retrospective study. PLoS ONE 2014, 9, e80488. [Google Scholar] [CrossRef]
- Westmark, C.J. Parental Reports on Early Autism Behaviors in Their Children with Fragile X Syndrome as a Function of Infant Feeding. Nutrients 2021, 13, 2888. [Google Scholar] [CrossRef]
- Westmark, C.J. Increased Incidence of Epilepsy in Response to Soy-Based Infant Formula in a National Korean Cohort Study. J. Nutr. 2022, 152, 1378–1379. [Google Scholar] [CrossRef]
- Westmark, C.J.; Brower, J.; Held, P.K. Improving Reproducibility to Enhance Scientific Rigor through Consideration of Mouse Diet. Animals 2022, 12, 3448. [Google Scholar] [CrossRef]
- Westmark, C.J.; Filon, M.J.; Maina, P.; Steinberg, L.I.; Ikonomidou, C.; Westmark, P.R. Effects of Soy-Based Infant Formula on Weight Gain and Neurodevelopment in an Autism Mouse Model. Cells 2022, 11, 1350. [Google Scholar] [CrossRef] [PubMed]
- Westmark, C.J.; Kniss, C.; Sampene, E.; Wang, A.; Milunovich, A.; Elver, K.; Hessl, D.; Talboy, A.; Picker, J.; Haas-Givler, B.; et al. Soy-Based Infant Formula is Associated with an Increased Prevalence of Comorbidities in Fragile X Syndrome. Nutrients 2020, 12, 3136. [Google Scholar] [CrossRef] [PubMed]
- Ma, M.; Yu, Q.; Delafield, D.G.; Cui, Y.; Li, Z.; Li, M.; Wu, W.; Shi, X.; Westmark, P.R.; Gutierrez, A.; et al. On-Tissue Spatial Proteomics Integrating MALDI-MS Imaging with Shotgun Proteomics Reveals Soy Consumption-Induced Protein Changes in a Fragile X Syndrome Mouse Model. ACS Chem. Neurosci. 2024, 15, 119–133. [Google Scholar] [CrossRef]
- Westmark, P.R.; Lyon, G.; Gutierrez, A.; Boeck, B.; Van Hammond, O.; Ripp, N.; Pagan-Torres, N.A.; Brower, J.; Held, P.K.; Scarlett, C.; et al. Effects of Soy Protein Isolate on Fragile X Phenotypes in Mice. Nutrients 2024, 16, 284. [Google Scholar] [CrossRef]
- Westmark, C.J. Soy-Based Therapeutic Baby Formulas: Testable Hypotheses Regarding the Pros and Cons. Front. Nutr. 2016, 3, 59. [Google Scholar] [CrossRef]
- Westmark, C.J. Soy-based purified ingredient diet affects mouse gut permeability and the microbiome in fragile X mice. Front. Mol. Neurosci. 2025, 18, 1520211. [Google Scholar] [CrossRef]
- Westmark, C.J. A hypothesis regarding the molecular mechanism underlying dietary soy-induced effects on seizure propensity. Front. Neurol. 2014, 5, 169. [Google Scholar] [CrossRef] [PubMed]
- Westmark, C.J. Toward an understanding of the role of the exposome on fragile X phenotypes. Int. Rev. Neurobiol. 2023, 173, 141–170. [Google Scholar] [CrossRef]
- Freeman, M.E.; Kanyicska, B.; Lerant, A.; Nagy, G. Prolactin: Structure, function, and regulation of secretion. Physiol. Rev. 2000, 80, 1523–1631. [Google Scholar] [CrossRef]
- Elsayed, A.S.I. The Role of Oxytocin, Prolactin, and Estrogen in Male Sexual Functions. J. Clin. Res. Rep. 2022, 10, 2690-1919. [Google Scholar] [CrossRef]
- Colao, A.; De Rosa, M.; Sarnacchiaro, F.; Di Sarno, A.; Landi, M.L.; Iervolino, E.; Zarrilli, S.; Merola, B.; Lombardi, G. Chronic treatment with CV 205-502 restores the gonadal function in hyperprolactinemic males. Eur. J. Endocrinol. 1996, 135, 548–552. [Google Scholar] [CrossRef] [PubMed]
- Schams, D.; Karg, H. Hormones in milk. Ann. N. Y. Acad. Sci. 1986, 464, 75–86. [Google Scholar] [CrossRef]
- Oláh, S.; Cservenák, M.; Keller, D.; Fazekas, E.A.; Renner, É.; Lőw, P.; Dobolyi, A. Prolactin-induced and neuronal activation in the brain of mother mice. Brain Struct. Funct. 2018, 223, 3229–3250. [Google Scholar] [CrossRef] [PubMed]
- Salais-López, H.; Abellán-Álvaro, M.; Bellés, M.; Lanuza, E.; Agustin-Pavon, C.; Martínez-García, F. Maternal Motivation: Exploring the Roles of Prolactin and Pup Stimuli. Neuroendocrinology 2021, 111, 805–830. [Google Scholar] [CrossRef]
- Bregman, J.D.; Leckman, J.F.; Ort, S.I. Thyroid function in fragile-X syndrome males. Yale J. Biol. Med. 1990, 63, 293–299. [Google Scholar] [PubMed]
- Nielsen, K.B.; Tommerup, N.; Dyggve, H.V.; Schou, C. Macroorchidism and fragile X in mentally retarded males. Clinical, cytogenetic, and some hormonal investigations in mentally retarded males, including two with the fragile site at Xq28, fra(X)(q28). Hum. Genet. 1982, 61, 113–117. [Google Scholar] [CrossRef]
- Slegtenhorst-Eegdeman, K.E.; de Rooij, D.G.; Verhoef-Post, M.; van de Kant, H.J.; Bakker, C.E.; Oostra, B.A.; Grootegoed, J.A.; Themmen, A.P. Macroorchidism in FMR1 knockout mice is caused by increased Sertoli cell proliferation during testicular development. Endocrinology 1998, 139, 156–162. [Google Scholar] [CrossRef]
- Guillaumot, P.; Tabone, E.; Benahmed, M. Sertoli cells as potential targets of prolactin action in the testis. Mol. Cell Endocrinol. 1996, 122, 199–206. [Google Scholar] [CrossRef]
- Berkovitz, G.D.; Wilson, D.P.; Carpenter, N.J.; Brown, T.R.; Migeon, C.J. Gonadal function in men with the Martin-Bell (fragile-X) syndrome. Am. J. Med. Genet. 1986, 23, 227–239. [Google Scholar] [CrossRef]
- Monyak, R.E.; Emerson, D.; Schoenfeld, B.P.; Zheng, X.; Chambers, D.B.; Rosenfelt, C.; Langer, S.; Hinchey, P.; Choi, C.H.; McDonald, T.V.; et al. Insulin signaling misregulation underlies circadian and cognitive deficits in a Drosophila fragile X model. Mol. Psychiatry 2017, 22, 1140–1148. [Google Scholar] [CrossRef]
- Song, C.; Broadie, K. Dysregulation of BMP, Wnt, and Insulin Signaling in Fragile X Syndrome. Front. Cell Dev. Biol. 2022, 10, 934662. [Google Scholar] [CrossRef] [PubMed]
- Wise, T.L. Changes in insulin-like growth factor signaling alter phenotypes in Fragile X Mice. Genes Brain Behav. 2017, 16, 241–249. [Google Scholar] [CrossRef] [PubMed]
- Lv, Z.; Fan, H.; Zhang, B.; Ning, C.; Xing, K.; Guo, Y. Dietary genistein supplementation in laying broiler breeder hens alters the development and metabolism of offspring embryos as revealed by hepatic transcriptome analysis. FASEB J. 2018, 32, 4214–4228. [Google Scholar] [CrossRef]
- Mashayekhi, F. Comparison of serum IGF1, IGF2 and IGFBP1-6 concentration in the children with different stages of autism spectrum disorders. Arch. Psychiatry Psychother. 2022, 24, 20–24. [Google Scholar] [CrossRef]
- Fernández-Pereira, C.; Agís-Balboa, R.C. The Insulin-like Growth Factor Family as a Potential Peripheral Biomarker in Psychiatric Disorders: A Systematic Review. Int. J. Mol. Sci. 2025, 26, 2561. [Google Scholar] [CrossRef]
- Liu, M.N.; Zhang, K.; Xu, T.M. The role of BMP15 and GDF9 in the pathogenesis of primary ovarian insufficiency. Hum. Fertil. 2021, 24, 325–332. [Google Scholar] [CrossRef]
- França, M.M.; Mendonca, B.B. Genetics of ovarian insufficiency and defects of folliculogenesis. Best Pract. Res. Clin. Endocrinol. Metab. 2022, 36, 101594. [Google Scholar] [CrossRef] [PubMed]
- Shen, J.; Qu, D.; Gao, Y.; Sun, F.; Xie, J.; Sun, X.; Wang, D.; Ma, X.; Cui, Y.; Liu, J.; et al. Genetic etiologic analysis in 74 Chinese Han women with idiopathic premature ovarian insufficiency by combined molecular genetic testing. J. Assist. Reprod. Genet. 2021, 38, 965–978. [Google Scholar] [CrossRef]
- Nicholls, P.K.; Harrison, C.A.; Gilchrist, R.B.; Farnworth, P.G.; Stanton, P.G. Growth differentiation factor 9 is a germ cell regulator of Sertoli cell function. Endocrinology 2009, 150, 2481–2490. [Google Scholar] [CrossRef]
- Tang, K.Q.; Yang, W.C.; Zhang, X.X.; Yang, L.G. Effects of polymorphisms in the bovine growth differentiation factor 9 gene on sperm quality in Holstein bulls. Genet. Mol. Res. 2013, 12, 2189–2195. [Google Scholar] [CrossRef]
- Abdel-Ghani, M.A.; Alhaider, A. High concentration of growth differentiation factor-9 (GDF-9) to the ram semen had a negative effect on the sperm positive rheotaxis. Reprod. Domest. Anim. 2022, 57, 1093–1098. [Google Scholar] [CrossRef] [PubMed]
- Taki, F.; Lopez, K.; Zupan, B.; Bergin, P.; Docampo, M.D.; Alves-Bezerra, M.; Toth, J.G.; Chen, Q.; Argyropoulos, K.V.; Barboza, L.; et al. Maternal Programming of Social Dominance via Milk Cytokines. iScience 2020, 23, 101357. [Google Scholar] [CrossRef] [PubMed]
- Zupan, B.; Toth, M. Fmr-1 as an offspring genetic and a maternal environmental factor in neurodevelopmental disease. Results Probl. Cell Differ. 2012, 54, 243–253. [Google Scholar] [CrossRef]
- Zupan, B.; Sharma, A.; Frazier, A.; Klein, S.; Toth, M. Programming social behavior by the maternal fragile X protein. Genes Brain Behav. 2016, 15, 578–587. [Google Scholar] [CrossRef]
- Zupan, B.; Toth, M. Wild-type male offspring of fmr-1+/- mothers exhibit characteristics of the fragile X phenotype. Neuropsychopharmacology 2008, 33, 2667–2675. [Google Scholar] [CrossRef] [PubMed]
- Nelson, J.F.; Felicio, L.S.; Randall, P.K.; Sims, C.; Finch, C.E. A longitudinal study of estrous cyclicity in aging C57BL/6J mice: I. Cycle frequency, length and vaginal cytology. Biol. Reprod. 1982, 27, 327–339. [Google Scholar] [CrossRef]
- Tan, X.; Liu, R.; Dan, L.; Huang, H.; Duan, C. Effects of anesthetics on mitochondrial quality control: Mechanisms and clinical implications. Anesthesiol. Perioper. Sci. 2024, 2, 31. [Google Scholar] [CrossRef]
- Westmark, C.J.; Hervey, C.M.; Berry-Kravis, E.M.; Malter, J.S. Effect of Anticoagulants on Amyloid β-Protein Precursor and Amyloid Beta Levels in Plasma. J. Alzheimers Dis. Park. 2011, 1, 101. [Google Scholar] [CrossRef]
- Westmark, P.R.; Gutierrez, A.; Gholston, A.K.; Wilmer, T.M.; Westmark, C.J. Preclinical testing of the ketogenic diet in fragile X mice. Neurochem. Int. 2020, 134, 104687. [Google Scholar] [CrossRef]
- Mao, Y.; Yen, H.H.; Sun, Y.; Lv, Z.; Huang, R. Development of non-overlapping multiplex antibody arrays for the quantitative measurement of 640 Mouse and 200 mouse proteins in parallel (TECH1P.849). J. Immunol. 2014, 192, 69. [Google Scholar] [CrossRef]
- Szklarczyk, D.; Kirsh, R.; Koutrouli, M.; Nastou, K.; Mehryary, F.; Hachilif, R.; Gable, A.L.; Fang, T.; Doncheva, N.T.; Pyysalo, S.; et al. The STRING database in 2023: Protein-protein association networks and functional enrichment analyses for any sequenced genome of interest. Nucleic Acids Res. 2022, 51, D638. [Google Scholar] [CrossRef] [PubMed]


| Diet a | Fmr1HET Female b | Fmr1KO Female b | WT Male b | Fmr1KO Male b |
|---|---|---|---|---|
| AIN-93G/casein | CCL6 FCRL5 OLFM-1 | CT-1 Eotaxin IGFBP-2 KC LEP MIG OPG SCF | BAMBI BID BMP-7 EPHA1 FAM3C | CD99-L2 |
| AIN-93G/soy | IL-1β | PODXL | CD164 CST3 |
| Array a | Protein b | Fmr1HET Female | Fmr1KO Female | WT Male | Fmr1KO Male |
|---|---|---|---|---|---|
| 4 | OPG | ↑ 9-fold casein | |||
| SCF | ↑ 2.4-fold casein | ||||
| 5 | Eotaxin | ↑ 3.2-fold casein | |||
| LEP | ↑ 38-fold casein | ||||
| MIG | ↑ 63-fold casein | ||||
| 6 | CT-1 | ↑ 2.7-fold casein | |||
| IL-3 Rb | ↑ 22-fold casein | ||||
| 9 | B7-2 | ↑ 4.1-fold soy | |||
| 10 | CD14 | ↑ 11-fold casein | |||
| 12 | OLFM-1 | ↓ 1.6-fold casein | |||
| 14 | CD164 | ↑ 2.4-fold soy | |||
| 15 | CAMK4 | ↓ 6.9-fold casein | |||
| 17 | GHR | ↑ 41-fold casein | |||
| 18 | FCRL5 | ↑ 49-fold casein | |||
| 19 | BID | ↑ 26-fold casein | |||
| BMP-7 | ↑ 10-fold casein | ||||
| EPHA1 | ↑ 11-fold casein | ||||
| FAM3C | ↑ 11-fold casein |
| Diet a | Fmr1HET Female b | Fmr1KO Female b | WT Male b | Fmr1KO Male b |
|---|---|---|---|---|
| AIN-93G/casein | CHST4 MMP-10 PRSS34 SPB10 TRANCE | IL-20 Rb IL-15 Ra LIF KLB | CD45 EGF | CD74 IP-10 |
| AIN-93G/soy | IL-30 EMMPRIN | CD4 EpCAM FGF-4 FGF-6 FGF-10 FST NAALADL-1 S1000A9 Tie-2 |
| Array a | Protein b | Fmr1HET Female | Fmr1KO Female | WT Male | Fmr1KO Male |
|---|---|---|---|---|---|
| Q8 | TRANCE | ↑ 43-fold casein | |||
| Q9 | CD45 | ↑ 1.9-fold casein | |||
| Q10 | IL-1F8 | ↑ 7.9-fold casein | |||
| IL-15 Ra | ↑ 5.0-fold casein | ||||
| KLB | ↑ 38-fold casein | ||||
| Q11 | CD4 EpCAM EPHA5 FGF4 FGF6 | ↑ 9.5-fold soy ↑ 2.3-fold soy ↑ 5.4-fold soy ↑ 3.3-fold soy ↑ *-fold soy | |||
| Q12 | PRSS34 | ↑ *-fold casein | |||
| Q14 | S100A9 | ↑ 3.9-fold soy | |||
| Q16 | BMP-6 | ↑ 3.7-fold soy | |||
| Q19 | CD74 CD160 CMG-2 | ↑ 6.2-fold casein ↑ 17.3-fold casein ↑ 2.9-fold casein | |||
| EPHB3 | ↑ 23.9-fold casein | ||||
| FZD9 | ↑ 10.3-fold casein | ||||
| IP-10 | ↑ 4.4-fold casein | ||||
| MMP-7 | ↑ 228-fold casein |
| Diet a | Fmr1HET Female b | Fmr1KO Female b | WT Male b | Fmr1KO Male b |
|---|---|---|---|---|
| AIN-93G/casein | BID CA2 EPI IL-12p40 Marapsin MBL-2 PSPN SLAM TRANCE VNN1 | ASAM BChE DAN IGFBP-5 IL-20 NOV NTB-A PRL Siglec-3 TIM-3 TNF R1 uPAR | ||
| AIN-93G/soy | CXCL16 RSTN | VLDL R RSTN | E-selectin GAL-3 LCN2 | bFGF GAL-3 GAL-4 GDF-9 EPHB1 IL-22 Ra1 JAM-A RGM-C SEMA-3C SR-A1 |
| Array a | Protein b | Fmr1HET Female | Fmr1KO Female | WT Male | Fmr1KO Male |
|---|---|---|---|---|---|
| Q4 | IL-17F | ↑ 5.7-fold casein | |||
| Q4 | IL-20 | ↑ 37-fold casein | |||
| Q5 | bFGF | ↑ 1.1-fold soy | |||
| TNF R1 | ↑ 1.3-fold casein | ||||
| Q6 | JAM-A | ↑ 1.1-fold soy | |||
| Q8 | PSPN | ↑ 6.7-fold casein | |||
| SLAM | ↑ 7.4-fold casein | ||||
| TRANCE | ↑ 44-fold casein | ||||
| EPI | ↑ 6.2-fold casein | ||||
| Q9 | BAFF | ↑ *-fold casein | |||
| Q12 | ASAM | ↑ 2.6-fold casein | |||
| Q13 | SEMA3C | ↑ 5.5-fold soy | |||
| Siglec-3 | ↑ 6.1-fold casein | ||||
| SR-AI | ↑ 1500-fold soy | ||||
| TIM-3 | ↑ 260-fold casein | ||||
| Q14 | VLDL R | ↑ 8.8-fold soy | |||
| Q15 | BCHE | ↑ 1.7-fold cas | |||
| Q16 | CA2 | ↑ 2.7-fold casein | |||
| NTB-A | ↑ 5.5-fold casein | ||||
| VNN-1 | ↑ 3.1-fold soy | ||||
| Q17 | GAL-4 | ↑ 18-fold soy | |||
| EPHB1 | ↑ 6.9-fold soy | ||||
| GDF-9 | ↑ 3.5-fold soy | ||||
| IL-22 Ra1 | ↑ 19-fold soy | ||||
| NTN-4 | ↑ 7.4-fold casein | ||||
| Q19 | ANG | ↑ 4.2-fold casein | |||
| BID | ↑ 1.4-fold casein |
| Protein a | WT IF b | Fmr1KO IF b | WT AIN c | Fmr1KO AIN c | Studies Concur |
|---|---|---|---|---|---|
| B7-1 | 0.73 (p ≤ 0.05) | 0.49 (p = 0.15) | -- | ||
| CD36 | 2.37 (p ≤ 0.05) | 1.15 (p = 0.46) | -- | ||
| ICAM-1 | 3.68 (p ≤ 0.05) | 0.74 (p = 0.47) | -- | ||
| IGFBP5 | 0.73 (p ≤ 0.05) | 0.63 (p = 0.04) | YES | ||
| LEP | 0.11 (p ≤ 0.02) | 1.11 (p = 0.93) | -- | ||
| MFG-E8 | 4.34 (p = 0) | 1.14 (p = 0.81) | -- | ||
| MMP-10 | 2.04 (p ≤ 0.04) | 1.10 (p = 0.94) | -- | ||
| NEP | 0.25 (p ≤ 0.05) | 0.94 (p = 0.84) | -- |
| Tissue | Protein a | Fmr1HET Female | Fmr1KO Female | WT Male | Fmr1KO Male |
|---|---|---|---|---|---|
| Cortex | CD14 | ↑casein vs. soy | |||
| Hippocampus | CD4 | ↑ soy vs. casein | |||
| IL-15 Ra | ↑ casein vs. soy | ||||
| ↑ vs. male KO (casein) | |||||
| KLB | ↑ casein vs. soy | ||||
| ↑ vs. male KO (casein) | |||||
| PRSS34 | ↑ casein vs. soy | ||||
| ↑ vs. male KO (casein) | |||||
| Hypothalamus | NOV | ↑ vs. male WT (soy) | |||
| Plasma | ASAM | ↑ vs. KO male (casein) | |||
| EPI | ↑ casein vs. soy | ||||
| ↑ vs. KO male (casein) | |||||
| GAL-3 | ↑ vs. HET (soy) | ||||
| GDF-9 | ↑ vs. male WT (soy) | ||||
| ↑ vs. fem KO (soy) | |||||
| JAM-A | ↑ vs. fem KO (soy) | ||||
| LCN2 | ↑ vs. HET (soy) | ||||
| MBL-2 | ↑ vs. WT (casein) | ||||
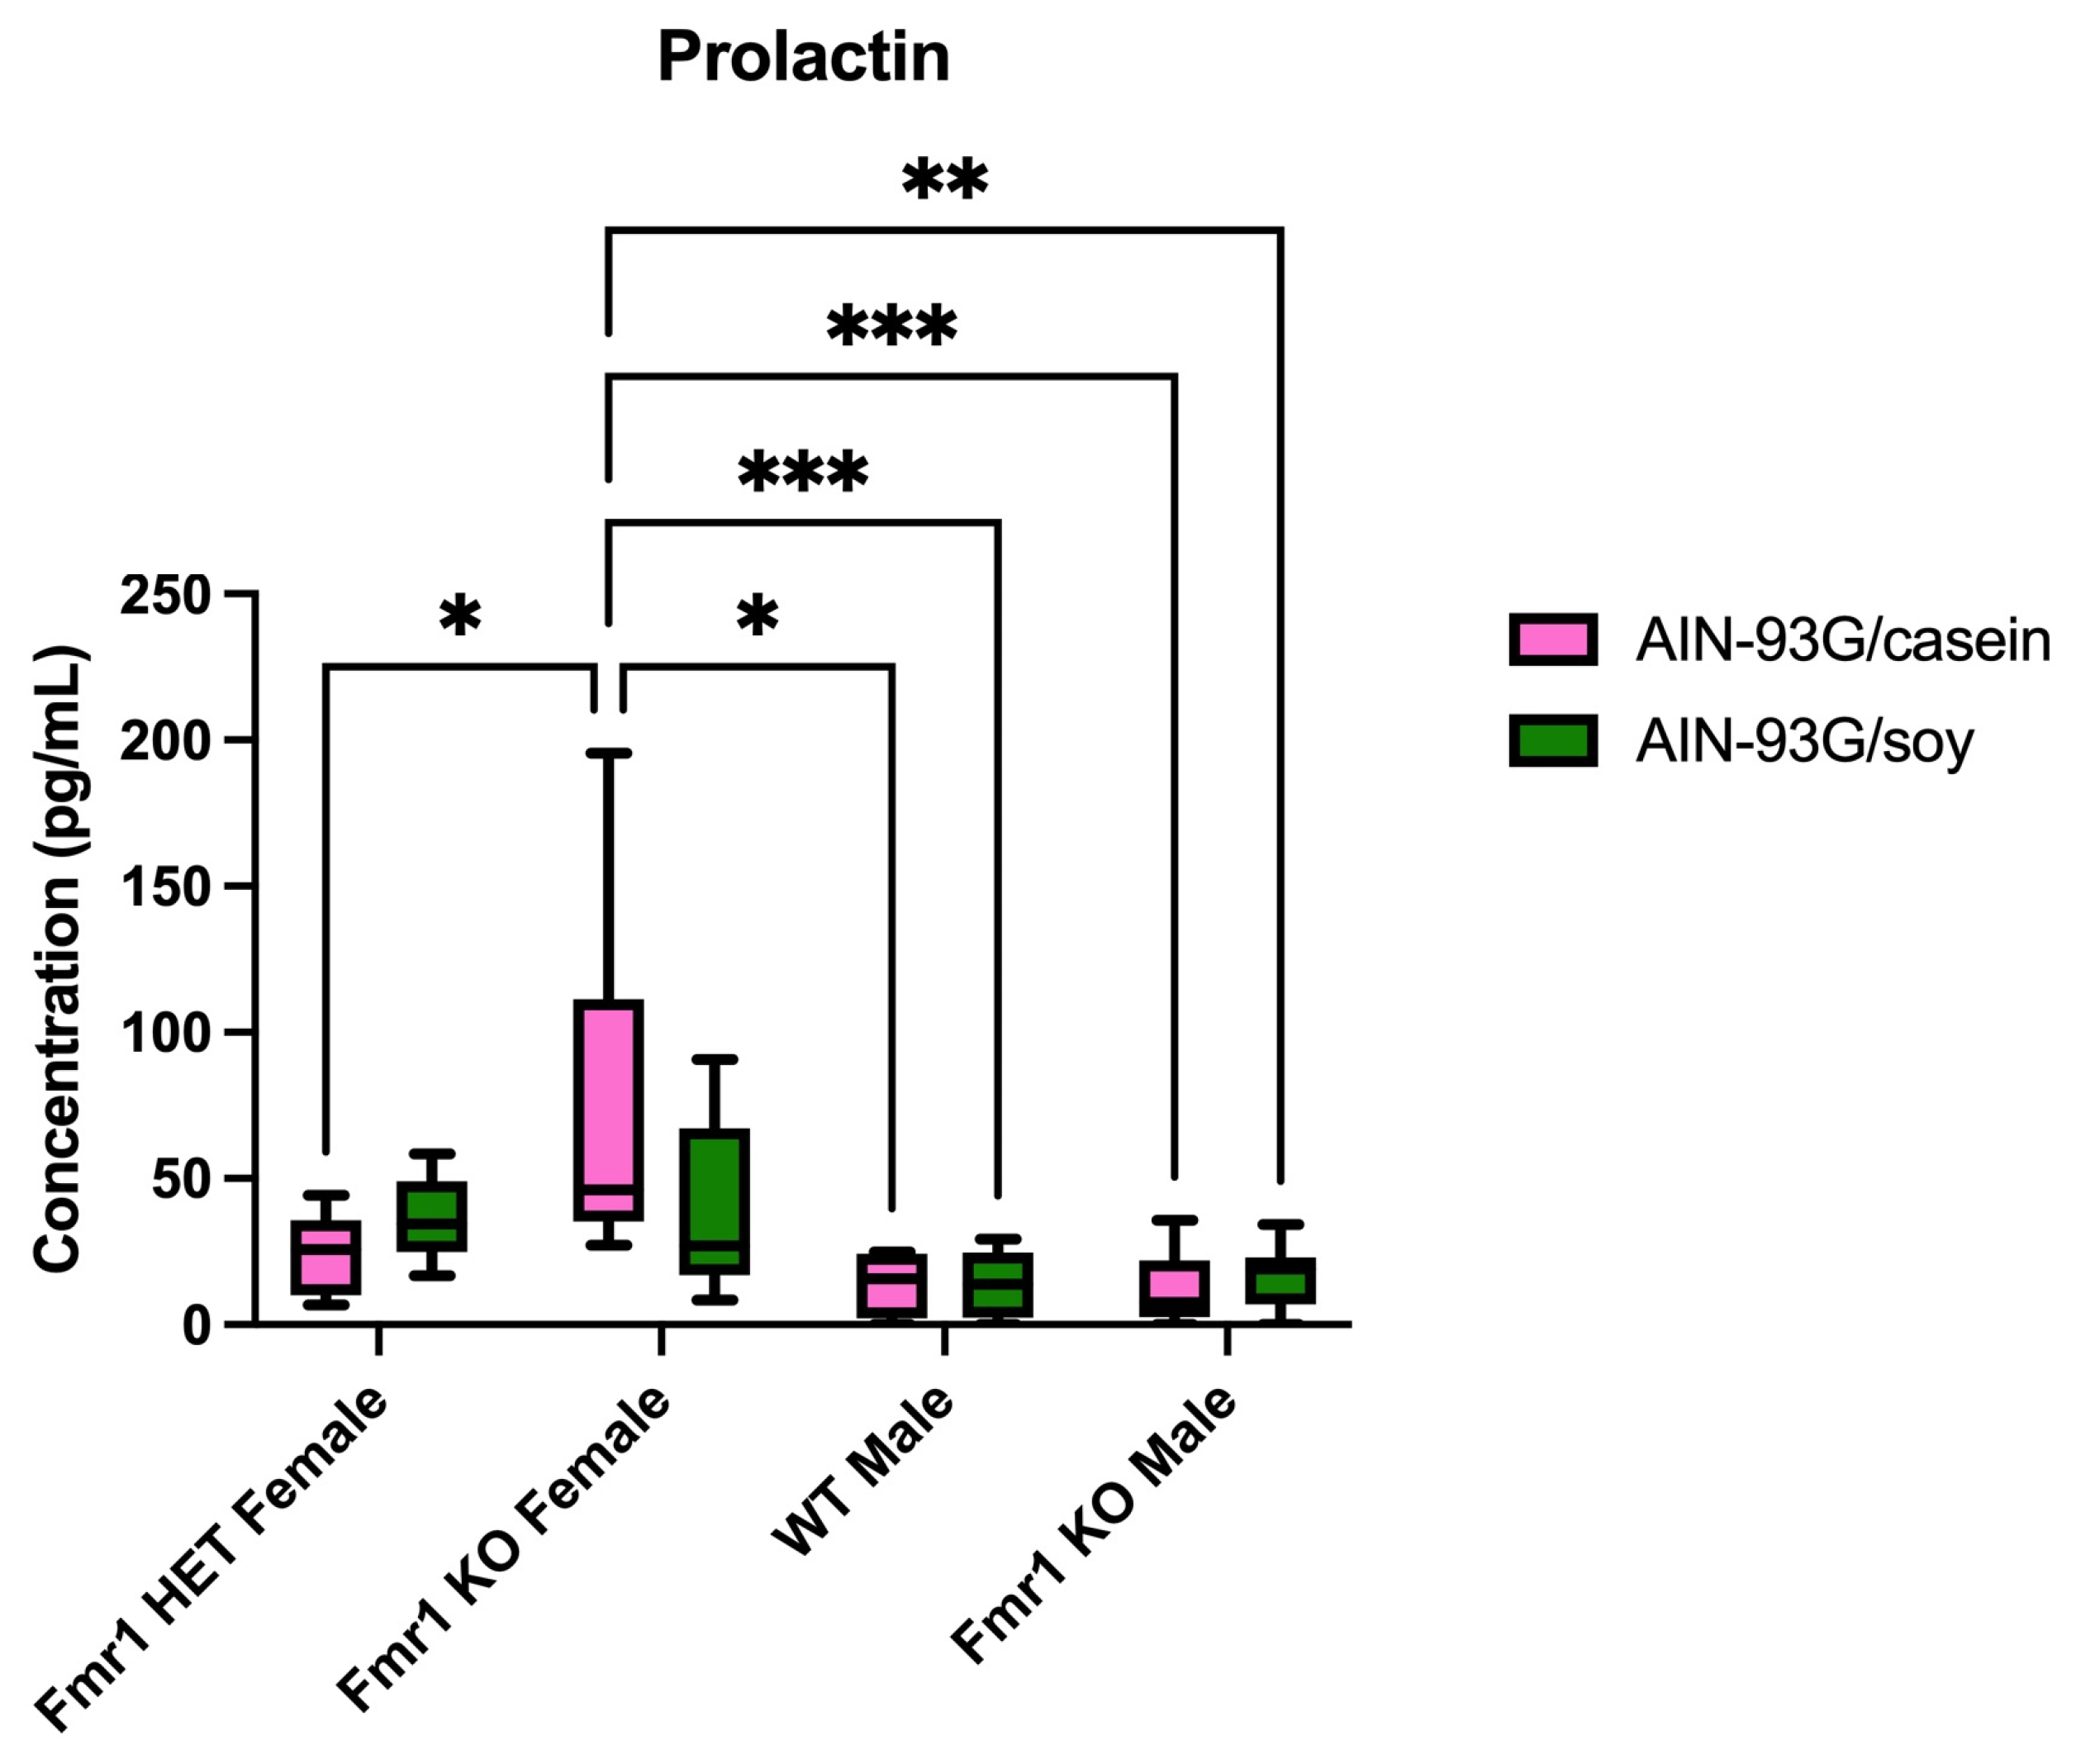
| PRL | ↑ vs. male KO (casein) | ||||
| RSTN | ↑ vs. WT (soy) | ||||
| ↑ vs. male KO (soy) | |||||
| SEMA3C | ↑ soy vs. casein | ||||
| ↑ vs. HET (soy) | |||||
| ↑ vs. fem KO (soy) | |||||
| SLAM | ↑ vs. fem KO (casein) | ||||
| SR-A1 | ↑ soy vs. casein | ||||
| VNN1 | ↑ vs. male KO (casein) |
Disclaimer/Publisher’s Note: The statements, opinions and data contained in all publications are solely those of the individual author(s) and contributor(s) and not of MDPI and/or the editor(s). MDPI and/or the editor(s) disclaim responsibility for any injury to people or property resulting from any ideas, methods, instructions or products referred to in the content. |
© 2025 by the authors. Licensee MDPI, Basel, Switzerland. This article is an open access article distributed under the terms and conditions of the Creative Commons Attribution (CC BY) license (https://creativecommons.org/licenses/by/4.0/).
Share and Cite
Boeck, B.; Mao, Y.; Huang, R.-P.; Westmark, C.J. Soy Protein Isolate Affects Blood and Brain Biomarker Expression in a Mouse Model of Fragile X. Int. J. Mol. Sci. 2025, 26, 6137. https://doi.org/10.3390/ijms26136137
Boeck B, Mao Y, Huang R-P, Westmark CJ. Soy Protein Isolate Affects Blood and Brain Biomarker Expression in a Mouse Model of Fragile X. International Journal of Molecular Sciences. 2025; 26(13):6137. https://doi.org/10.3390/ijms26136137
Chicago/Turabian StyleBoeck, Brynne, Yingqing Mao, Ruo-Pan Huang, and Cara J. Westmark. 2025. "Soy Protein Isolate Affects Blood and Brain Biomarker Expression in a Mouse Model of Fragile X" International Journal of Molecular Sciences 26, no. 13: 6137. https://doi.org/10.3390/ijms26136137
APA StyleBoeck, B., Mao, Y., Huang, R.-P., & Westmark, C. J. (2025). Soy Protein Isolate Affects Blood and Brain Biomarker Expression in a Mouse Model of Fragile X. International Journal of Molecular Sciences, 26(13), 6137. https://doi.org/10.3390/ijms26136137