Article

DNA Methylation and Transcript Variant Analysis of CDKN2A Exon 2 Despite High Sequence Identity with CDKN2B Exon 2

1
Department of Analytical Chemistry, Faculty of Chemistry, University of Vienna, 1090 Vienna, Austria
2
Center for Cancer Research and Comprehensive Cancer Center, Medical University of Vienna, 1090 Vienna, Austria
*
Author to whom correspondence should be addressed.
Int. J. Mol. Sci. 2025, 26(13), 6128; https://doi.org/10.3390/ijms26136128
Submission received: 11 May 2025 / Revised: 22 June 2025 / Accepted: 23 June 2025 / Published: 26 June 2025
(This article belongs to the Section Molecular Genetics and Genomics)

Abstract

The tumor suppressor p16INK4a, encoded by CDKN2A, is frequently inactivated in cancer through genetic or epigenetic mechanisms. While promoter hypermethylation is the most common epigenetic cause, aberrant methylation of CDKN2A exon 2 has also been associated with various tumor types. However, analyzing DNA methylation of exon 2 is challenging due to its high sequence similarity with CDKN2B. We developed a pyrosequencing assay to analyze CpGs in CDKN2A exon 2, which was previously found to be hypermethylated in breast cancer. Our novel primer set enabled co-amplification of the homologous regions in CDKN2A, including CpGs 1–24, and CDKN2B CpGs 1–23. By quantifying the proportion of CDKN2A, we could accurately determine methylation levels for CpGs in CDKN2A exon 2. This method was applied to patient-derived glioma cells and commercial breast cancer cell lines. To reveal the role of exon 2 methylation in gene regulation, we additionally examined CDKN2AINK4a promoter methylation and expression at both mRNA and protein levels in breast cancer cell lines. We observed a range of (epi)genetic alterations, including homozygous deletions, transcript-specific expression, and exon 2 skipping. Our findings indicate that both promoter and exon 2 methylation contribute to regulation of CDKN2A expression. This novel method provides a valuable tool for future studies seeking a deeper understanding of CDKN2A regulation in cancer.

1. Introduction

Cyclin-dependent kinases (CDKs) play a crucial role in cell cycle regulation by tightly controlling progression from one cell cycle phase to another. The activity of CDKs is modulated by cyclins, which function as cofactors of CDKs, and by CDK inhibitors (CDKIs) [1]. The CDKI p16INK4a, for example, inhibits CDK4/6 (INK4, inhibitor of CDK4/6) by inducing a structural change in the cyclin binding site of CDK4/6, resulting in inhibition of the G1/S phase transition of the cell cycle. When p16INK4a is inactivated, CDK4/6 binds to cyclin D, driving the G1/S phase transition of the cell cycle. Uncontrolled cell division due to cell cycle deregulation is a hallmark of human cancer [1]. Inactivation of p16INK4a has been reported for a variety of cancer types, including glioblastoma [2], breast cancer [3], and non-small-cell lung cancer [4].
CDKN2A (CDK inhibitor 2A), the gene encoding p16INK4a, is located on chromosome 9q21. In addition to p16INK4a, the CDKN2A gene generates several transcript variants differing in their first exons, including p12INK4a and p14ARF (ARF, alternative reading frame) [5].
Inactivation of p16INK4a can occur through genetic and epigenetic mechanisms. Genetic mechanisms include homozygous deletion of the p16INK4a locus and loss-of-function mutations within coding regions [6]. Hypermethylation of the CDKN2AINK4a promoter, the most frequently described epigenetic aberration of CDKN2A, has been found to silence CDKN2A in various cancer types [7,8]. However, in breast cancer, the situation remains unclear. Some studies report a higher frequency of CDKN2AINK4a promoter methylation in breast tumors [9,10,11,12,13], whereas others have not found a difference between malignant and non-malignant breast tissues [14].
In addition to the CDKN2AINK4a promoter, CDKN2A exon 1α and exon 2 have been targets of DNA methylation analysis [15]. Hypermethylation of CDKN2A exon 2 has been linked to late-stage esophageal cancer, with CDKN2A exon 2 being methylated in eight out of 16 esophageal tumors but in none of 16 normal tissue samples. The methylation frequency was higher in late-stage (III and IV) than in early-stage tumors [15]. By targeting the CDKN2AINK4a promoter and CDKN2A exon 2 in breast cancer samples, Spitzwieser et al. found exon 2 to be more frequently methylated than the promoter [16]. Moreover, the methylation status of exon 2 was significantly higher in tumors than in tumor-adjacent and tumor-distant tissues from the same patients and in normal breast tissues from healthy women. In addition, CDKN2A exon 2 hypermethylation was associated with the molecular subtype of the tumor [16].
However, the high-resolution melting (HRM) assay for exon 2 used in the study by Spitzwieser et al. is not specific for CDKN2A exon 2. Due to high sequence identity between CDKN2A and CDKN2B, the HRM assay previously developed [16] yields the average methylation status of CDKN2A exon 2 and CDKN2B exon 2. CDKN2B, located within the same 35 kb multigene region as CDKN2A, encodes p15INK4b and p10INK4b.
In this study, we aimed to develop a pyrosequencing (PSQ) assay to enable specific DNA methylation analysis of CDKN2A exon 2. The target region should include CpGs 5–14 of CDKN2A exon 2, previously analyzed by HRM [16]. Our strategy was to co-amplify the target region for CDKN2A and CDKN2B using a novel primer set. Within the target region, we attempted to identify positions that allow evaluation of the proportion of CDKN2A and thus accurately determine DNA methylation levels for CDKN2A exon 2. To demonstrate the applicability of our approach, patient-derived tumor cells from glioma patients (sample set 1) and commercial breast cancer cell lines (sample set 2) were analyzed. With the second sample set, we also aimed to elucidate how CDKN2A exon 2 methylation is associated with CDKN2A expression. Thus, we also performed DNA methylation analysis of the CDKN2AINK4a promoter by using a novel primer set designed in-house. In addition, we designed primer sets enabling transcript variant analysis of CDKN2A exon 2 despite the high sequence identity with CDKN2B exon 2.

2. Results and Discussion

Figure 1 shows a scheme of chromosome 9, including the positions of the CDKN2AINK4a promoter, the second exons of CDKN2A (blue) and CDKN2B (orange), the CpGs in these regions, and respective transcript variants. However, all transcripts of CDKN2A and CDKN2B result from the lower strand.

2.1. DNA Methylation Analysis of CDKN2A Exon 2—Method Development and Validation

2.1.1. Primer Design and Characteristics of the Target Region

Designing primers for specific DNA methylation analysis of CDKN2A exon 2 was particularly challenging due to the high sequence identity between the second exons of CDKN2A and CDKN2B (254/307 bp, 83%, referring to non-bisulfite converted DNA). The target region should include CpGs 5–14 of CDKN2A exon 2, since these CpGs were previously found to be aberrantly methylated in breast cancer samples [16]. Due to the sequence similarity between the second exons of CDKN2A and CDKN2B, we anticipated that PCR might generate products for both genes. To cope with this problem, we tried to identify positions within the target region that would allow us to estimate the ratio of PCR products derived from CDKN2A and CDKN2B exon 2. By using the proportion of PCR products resulting from CDKN2A exon 2, one should be able to reliably determine the DNA methylation status of CDKN2A exon 2 despite the high sequence identity with CDKN2B exon 2.
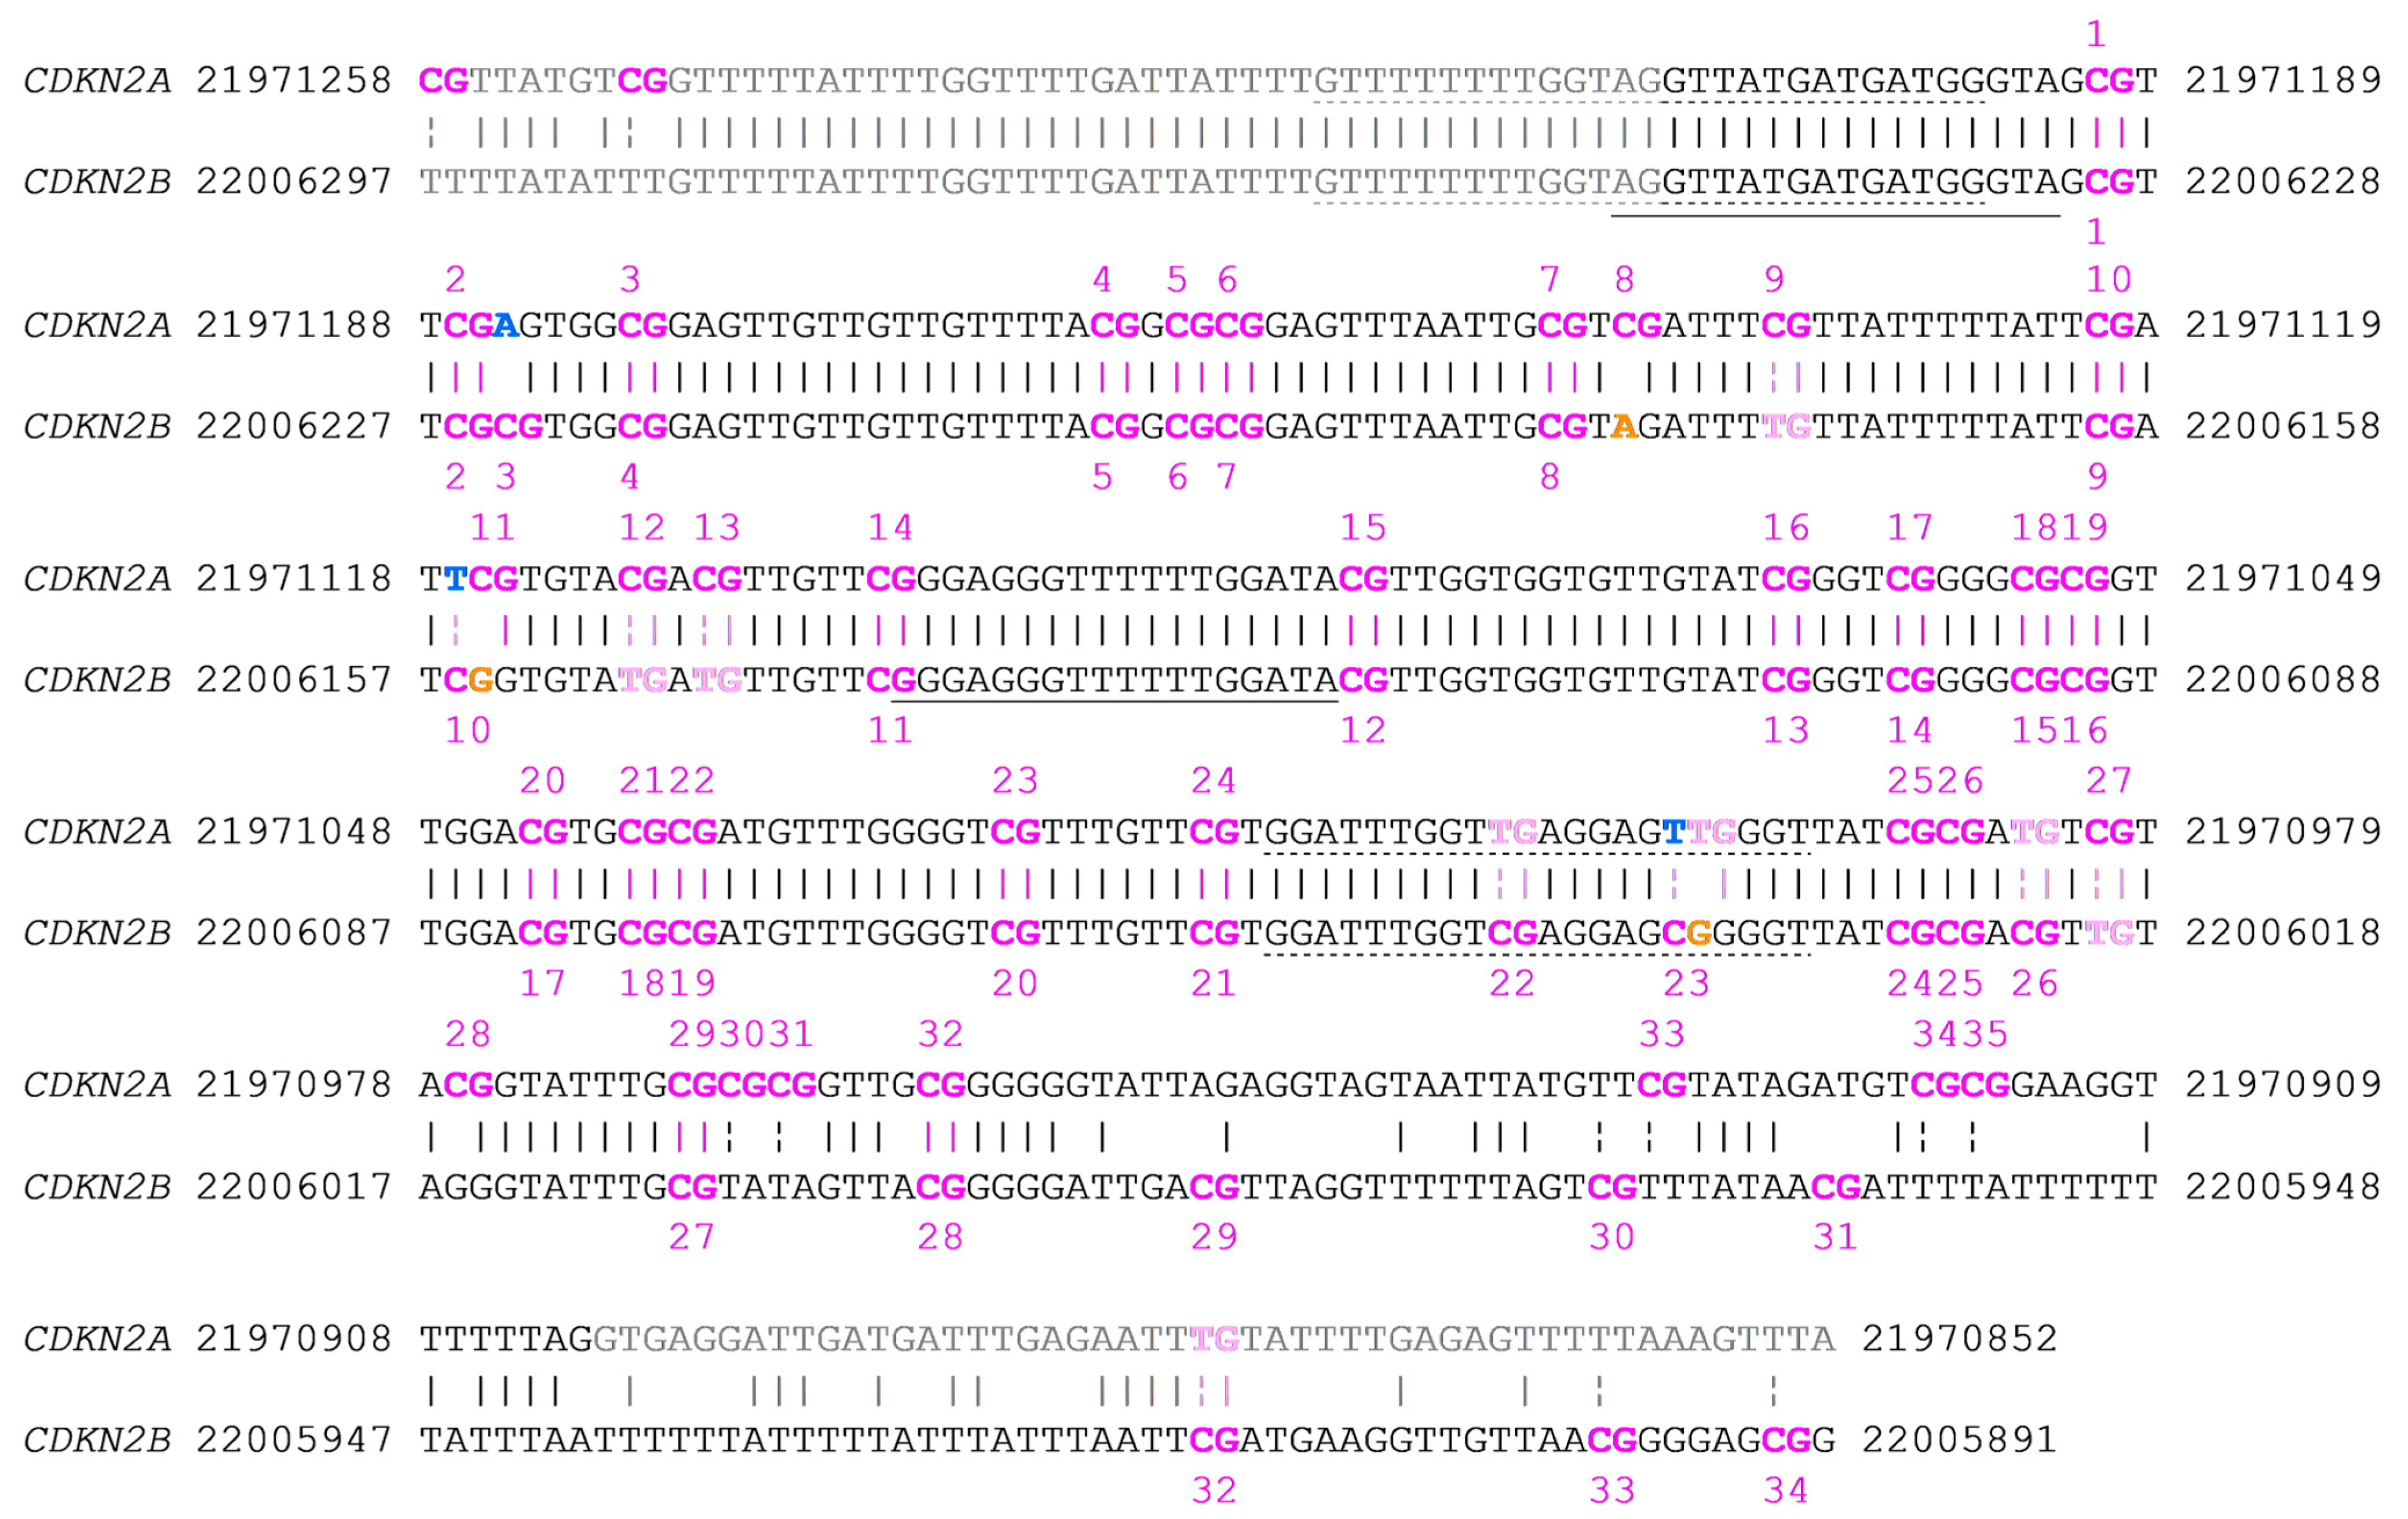
The region including CpGs 5–14 targeted by the novel primer set (Table 1) has a sequence identity of 95% (219/230 bp), referring to non-bisulfite converted DNA. The differences between the sequences are due to seven cytosine (C)-to-thymine (T) transitions, two C-to-adenine (A) transversions, one C-to-guanine (G) transversion, and one G-to-T transversion. However, since DNA methylation analysis by PSQ includes a bisulfite conversion step, the sequence identity after bisulfite conversion was more relevant. Following bisulfite conversion (of the lower DNA strand), the sequence identity between CDKN2A and CDKN2B exon 2 was 98% for originally methylated DNA and 96% for originally unmethylated DNA. In the bisulfite converted target region, CDKN2A and CDKN2B exon 2 differ at ten positions, all involving CpGs. Of these, six differences result from C-to-T transitions, while two involve C-to-A transversions. In the remaining two cases, base replacements led to either a shift in the CpG position or the formation of a new CpG (Figure 2).
The reverse primer (Table 1) showed several mismatches for CDKN2B exon 2, one (chr9:22006036) for originally unmethylated and three (chr9:22006036, chr9:22006037, and chr9:22006044) for originally methylated DNA (Figure 1 and Figure 2). Two mismatches occur at CpGs (in CDKN2B, Figure 1), where in CDKN2A, the CpG is replaced by TG.
The two C-to-A transversions (chr9:21971185 and chr9:22006179) are characteristic for CDKN2A and CDKN2B exon 2, respectively (Figure 1 and Figure 2). The third difference (chr9:22006155) in the sequenced region results from the shift of the position of the CpG.
PCR products for unmethylated (0%) DNA, methylated (100%) DNA, and mixtures thereof (25%, 50%, 75%) were subjected to agarose gel electrophoresis. PCR products obtained for CDKN2A and CDKN2B exon 2 were expected to be 230 bp long. Figure 3a indicates that PCR products of the correct length were obtained.

2.1.2. Evaluation of Reliable DNA Methylation Levels Despite High Sequence Identity Between the Second Exons of CDKN2A and CDKN2B

Since HRM is highly suitable for detecting the co-occurrence of different alleles [18], PCR products were subjected to HRM before they were used for PSQ. HRM analysis of the PCR products obtained for 0%, 25%, 50%, 75%, and 100% methylated DNA standards resulted in the negative derivative of normalized HRM curves shown in Figure 3b. HRM curves obtained for DNA standards indicate that for the unmethylated standard, products for CDKN2A and CDKN2B exon 2 were obtained. In case of the 100% methylated DNA standard, the proportion of CDKN2B was too low and thus did not result in a shoulder.
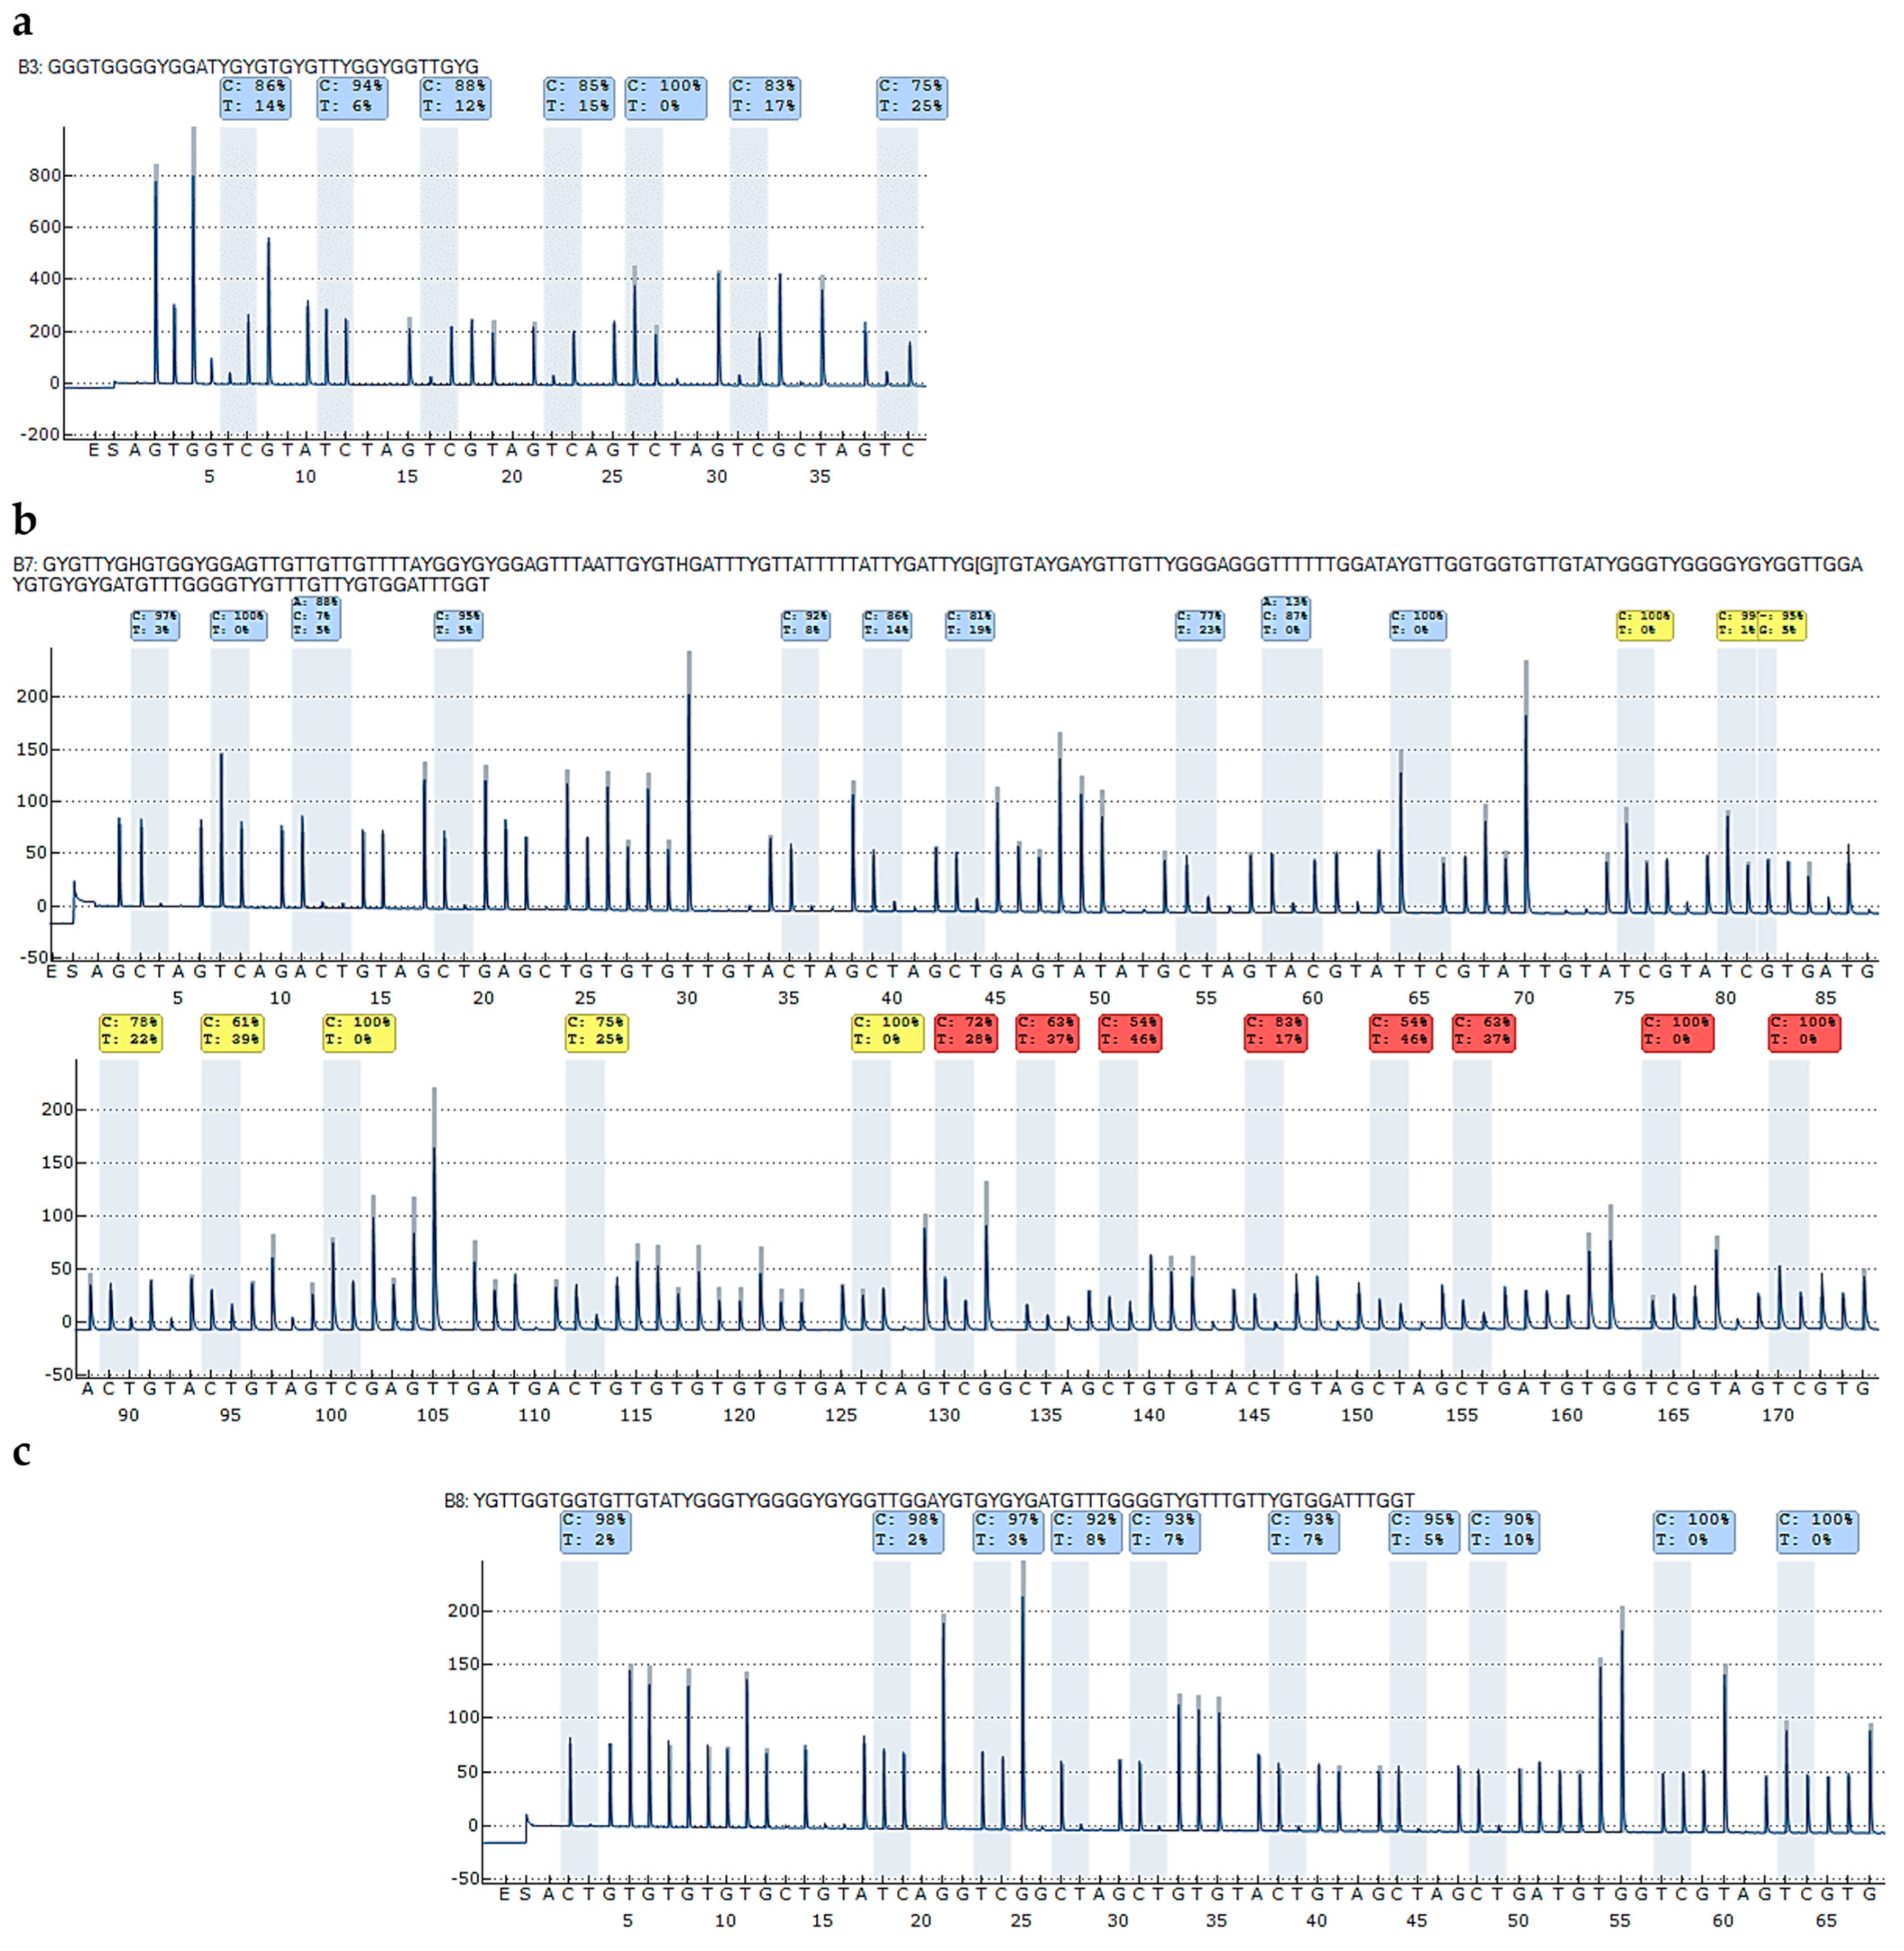
Figure 4b,c show representative pyrograms, obtained for the 100% methylated DNA standard. By using only one sequencing primer (Figure 4b), DNA methylation levels of variable positions 19–26 could not be determined accurately since the signal to noise ratio was too low. This problem could be solved by applying a second sequencing primer (Figure 4c).
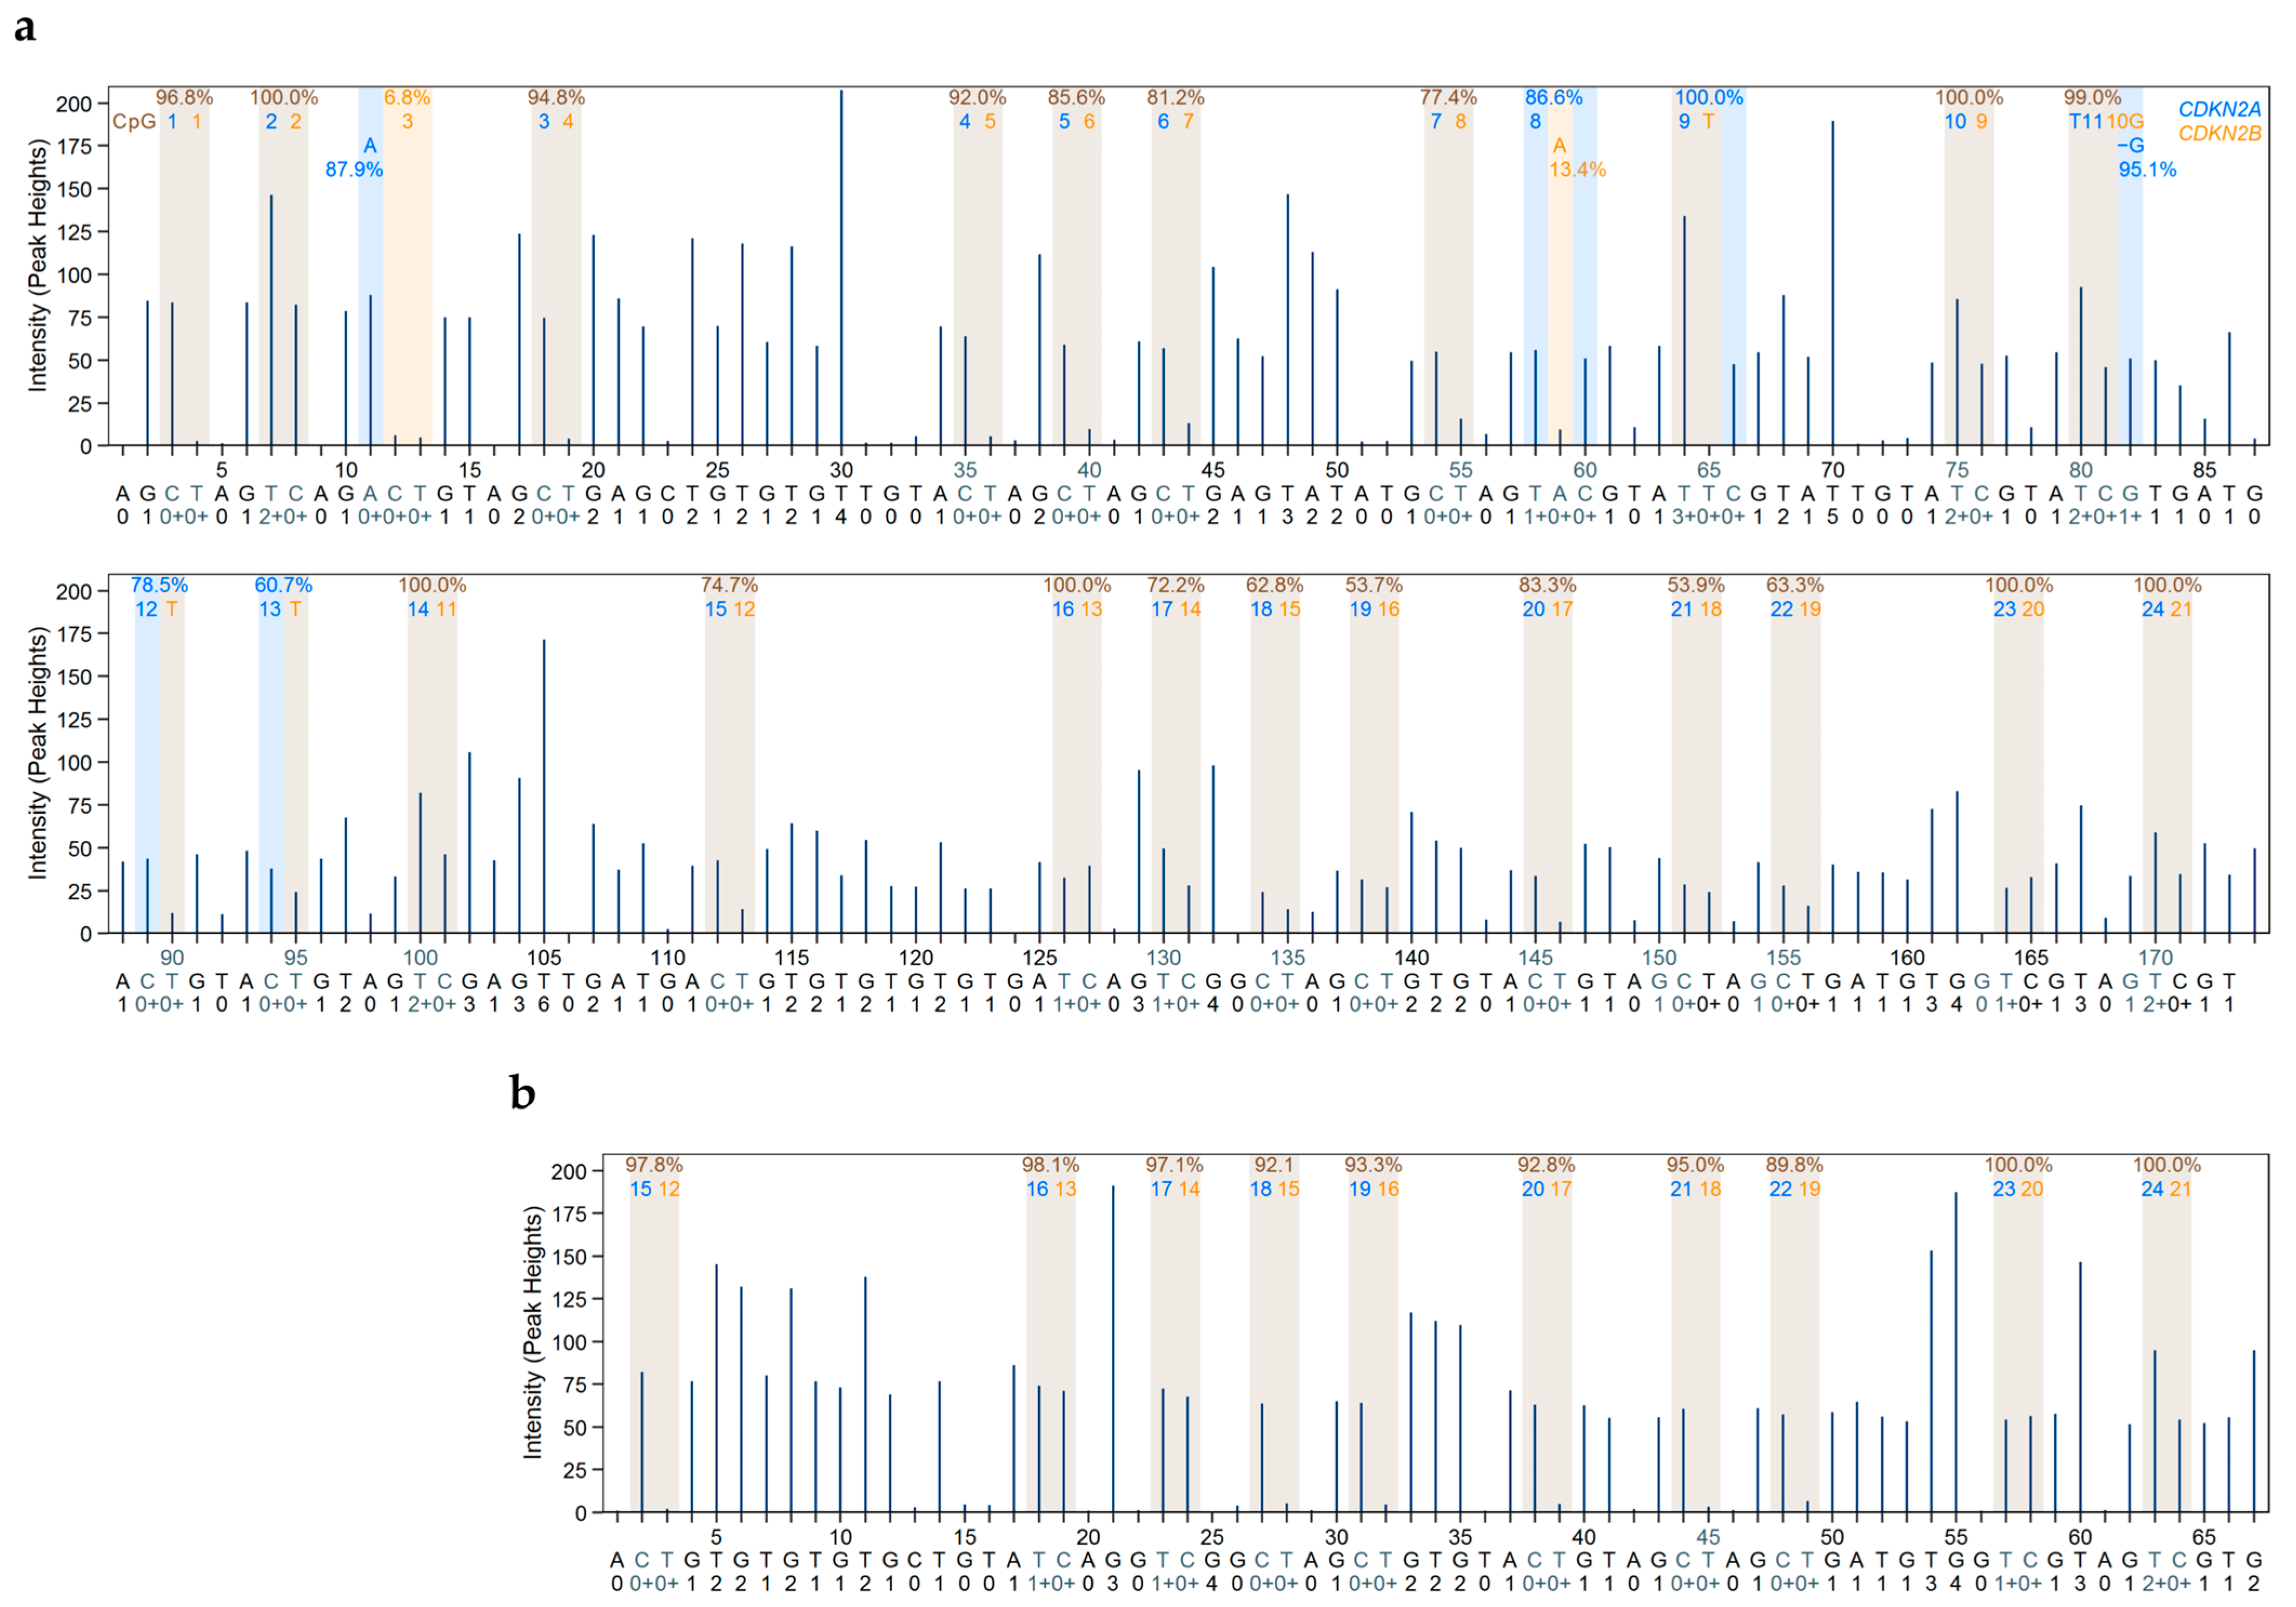
Figure 5 shows the translation of the variable positions in the pyrogram to the respective CpGs in CDKN2A and CDKN2B exon 2. In addition, it indicates the positions (chr9:21971185, chr9:22006179, and chr9:22006155, Figure 2) that are specific for CDKN2A exon 2 or CDKN2B exon 2.
We tested these three variable positions for their suitability to indicate the ratio of PCR products derived from CDKN2A and CDKN2B exon 2. Position (pos) 3 A (CDKN2A; chr9:21971185) and pos 9 A (CDKN2B; chr9:22006179) show the respective ratio (Figure 1 and 2). At pos 13, there are two Gs in CDKN2B exon 2 (chr9:22006155–22006154) but only one G in CDKN2A exon 2 (chr9:21971115). This position (chr9:22006155/chr9:21971116) turned out to be less suitable, and thus, the proportion of CDKN2A was calculated from pos 3 and pos 9.
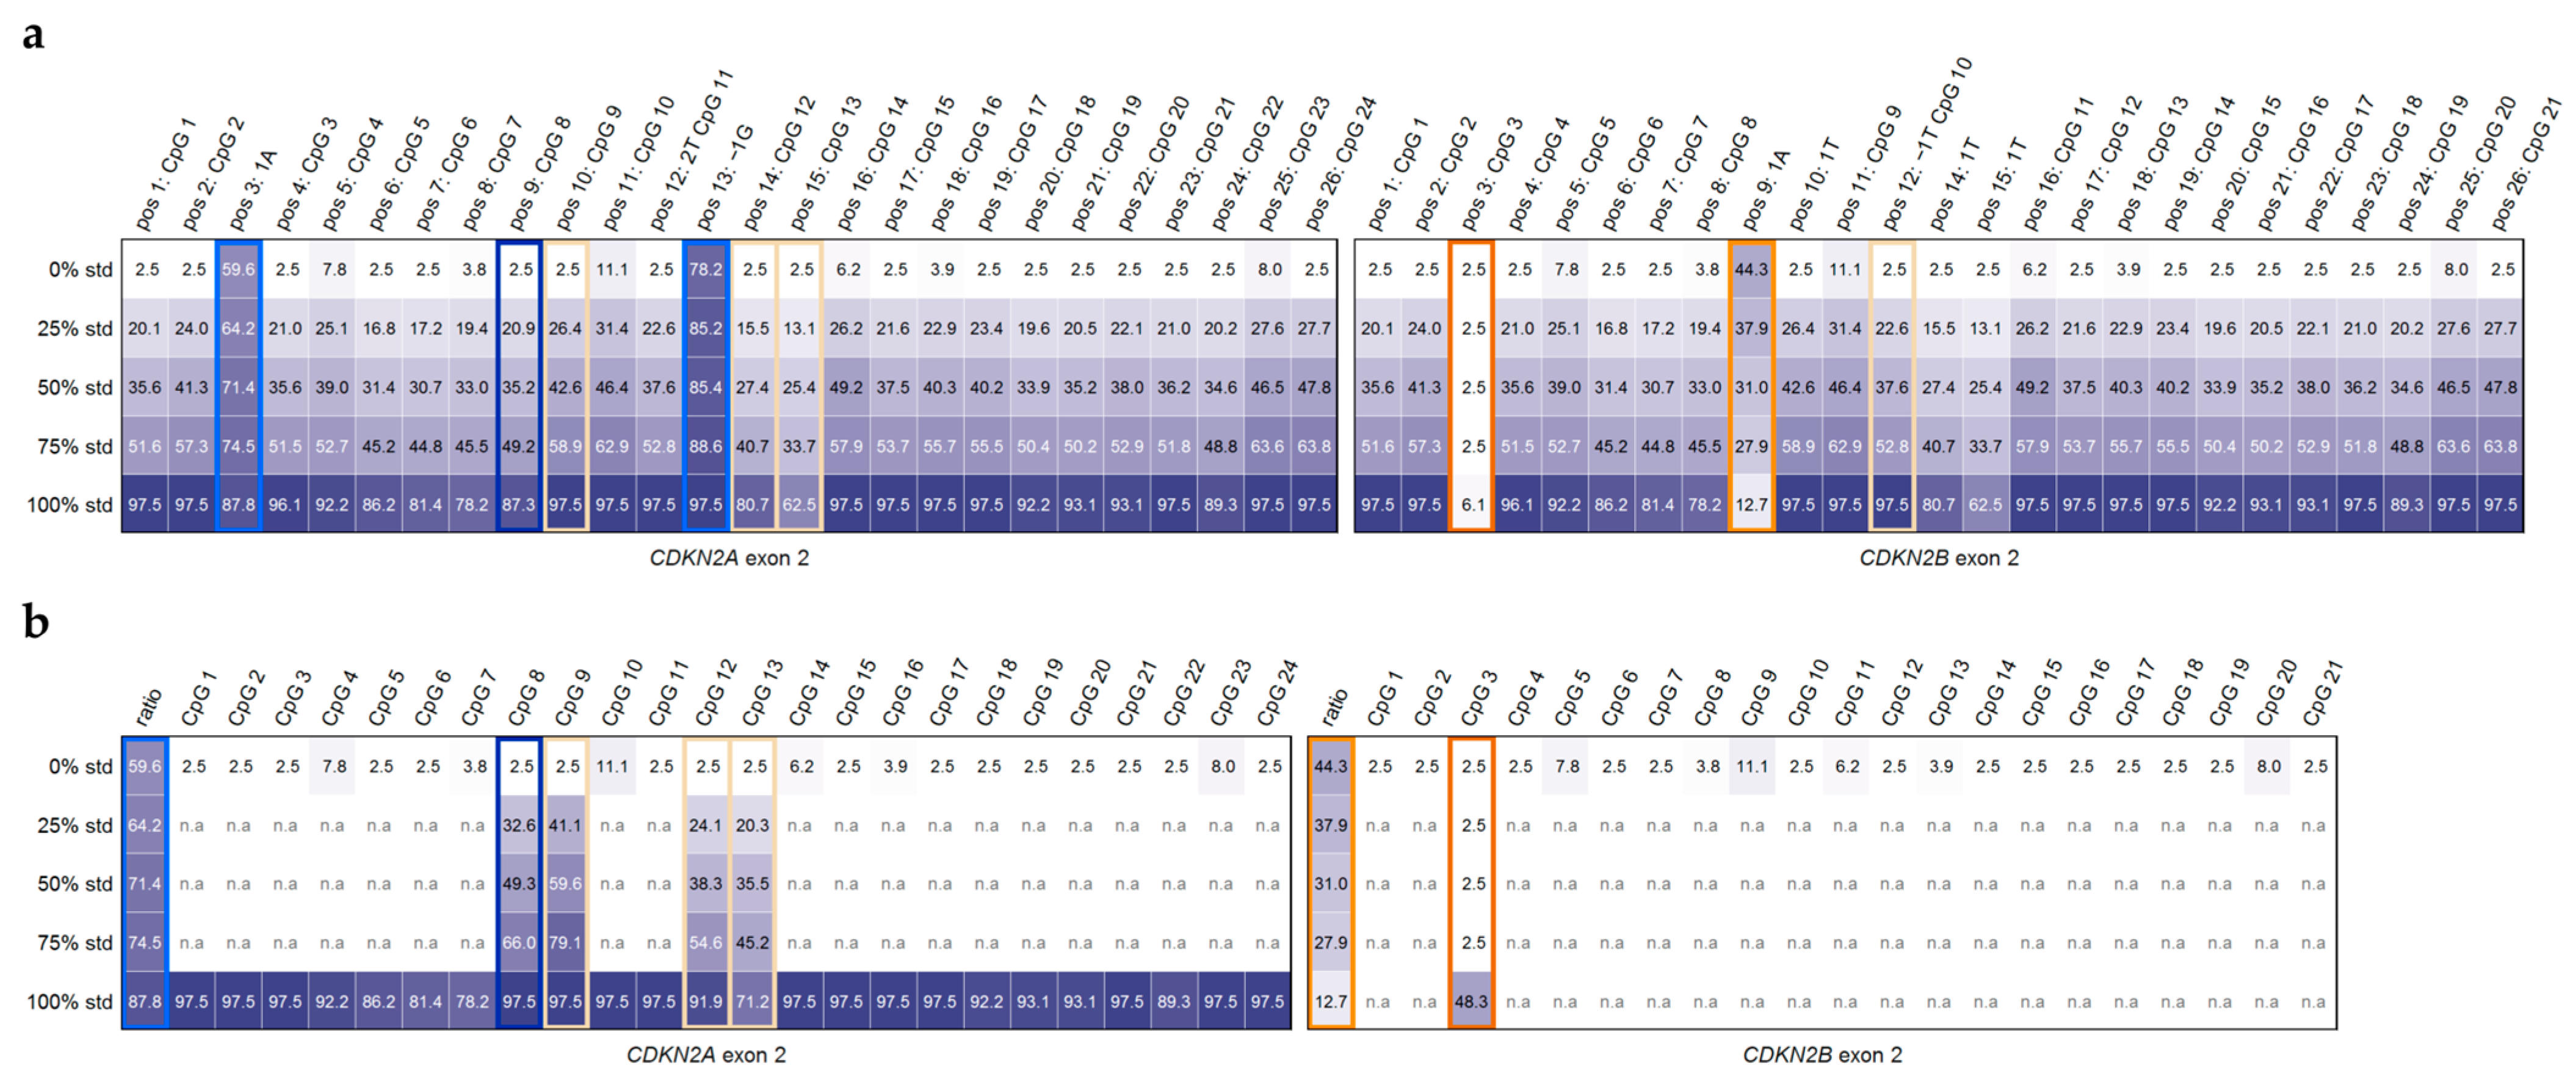
The DNA methylation levels for 0%, 25%, 50%, 75%, and 100% methylated DNA standards, obtained by our approach, are given in Figure 6a. For pos 9 CpG 8 (chr9:21971140), which is specific for CDKN2A, our results indicate that in the presence of a higher proportion of CDKN2B, the results have to be corrected by eliminating the contribution of CDKN2B (Figure 6a,b). The correct DNA methylation level of the respective CpG in CDKN2A exon 2 is obtained by multiplying the DNA methylation given by 100 and dividing it by the proportion of CDKN2A exon 2 (pos 3 A, chr9:21971185). These corrections are necessary for pos 10 CpG 9, pos 14 CpG 12, and pos 15 CpG 13 because the DNA methylation status given refers to CDKN2A, whereas the DNA sequence of CDKN2B contains a T.
Similarly, the methylation level of pos 3 CpG 3 (chr9:22006224), which is specific for CDKN2B, has to be corrected by the proportion of CDKN2B exon 2 (pos 9 A, chr9:22006179).
The corrected methylation levels indicate that unmethylated strands are preferentially amplified in case both unmethylated and methylated strands are present for CDKN2B, as it is the case in DNA standard mixtures. Even in the methylated (100%) standard, a low number of unmethylated strands was amplified due to the three mismatches of the reverse primer with methylated strands.
However, the specific methylation status of the other CpGs could not be assigned to either CDKN2A or CDKN2B for the 25%, 50%, and 75% DNA methylation standard mixtures.

2.2. DNA Methylation Analysis of the CDKN2AINK4a Promoter—Method Development and Validation

Since we were interested in elucidating the role of DNA methylation of CDKN2A exon 2 in gene expression, we also determined the DNA methylation status of the CDKN2AINK4a promoter. We designed a novel primer set (Table 1) that is specific for the CDKN2AINK4a promoter. Subjecting PCR products obtained with this primer set for unmethylated and methylated DNA standards and mixtures thereof to agarose gel electrophoresis indicated that PCR products of the correct length (75 bp) were obtained (Figure 3a). Figure 4a shows a representative pyrogram obtained for the 100% methylated DNA standard. Since the target region, containing seven CpGs, was rather short, it could be analyzed with one sequencing primer.

2.3. Transcript Variant Analysis of CDKN2A Exon 2—Method Development and Validation

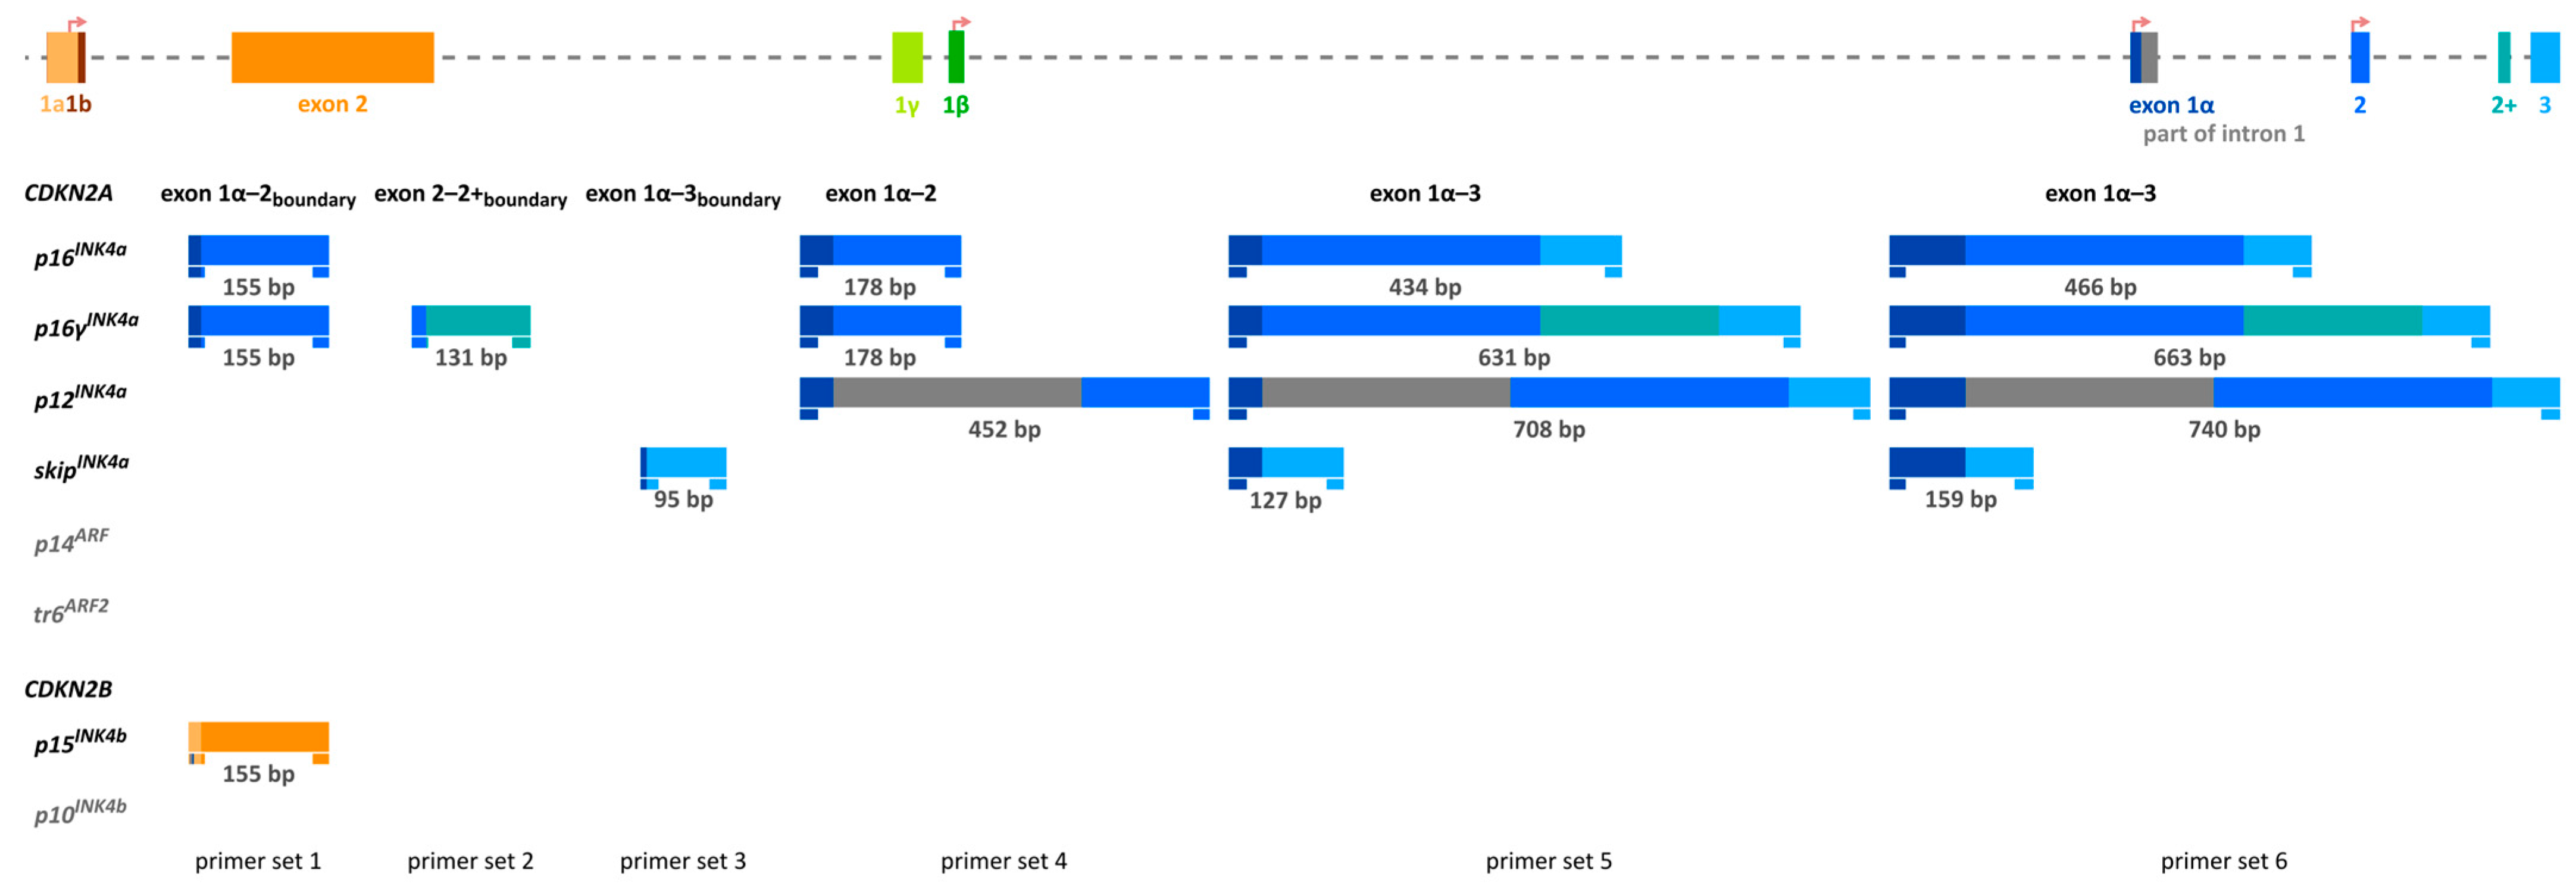
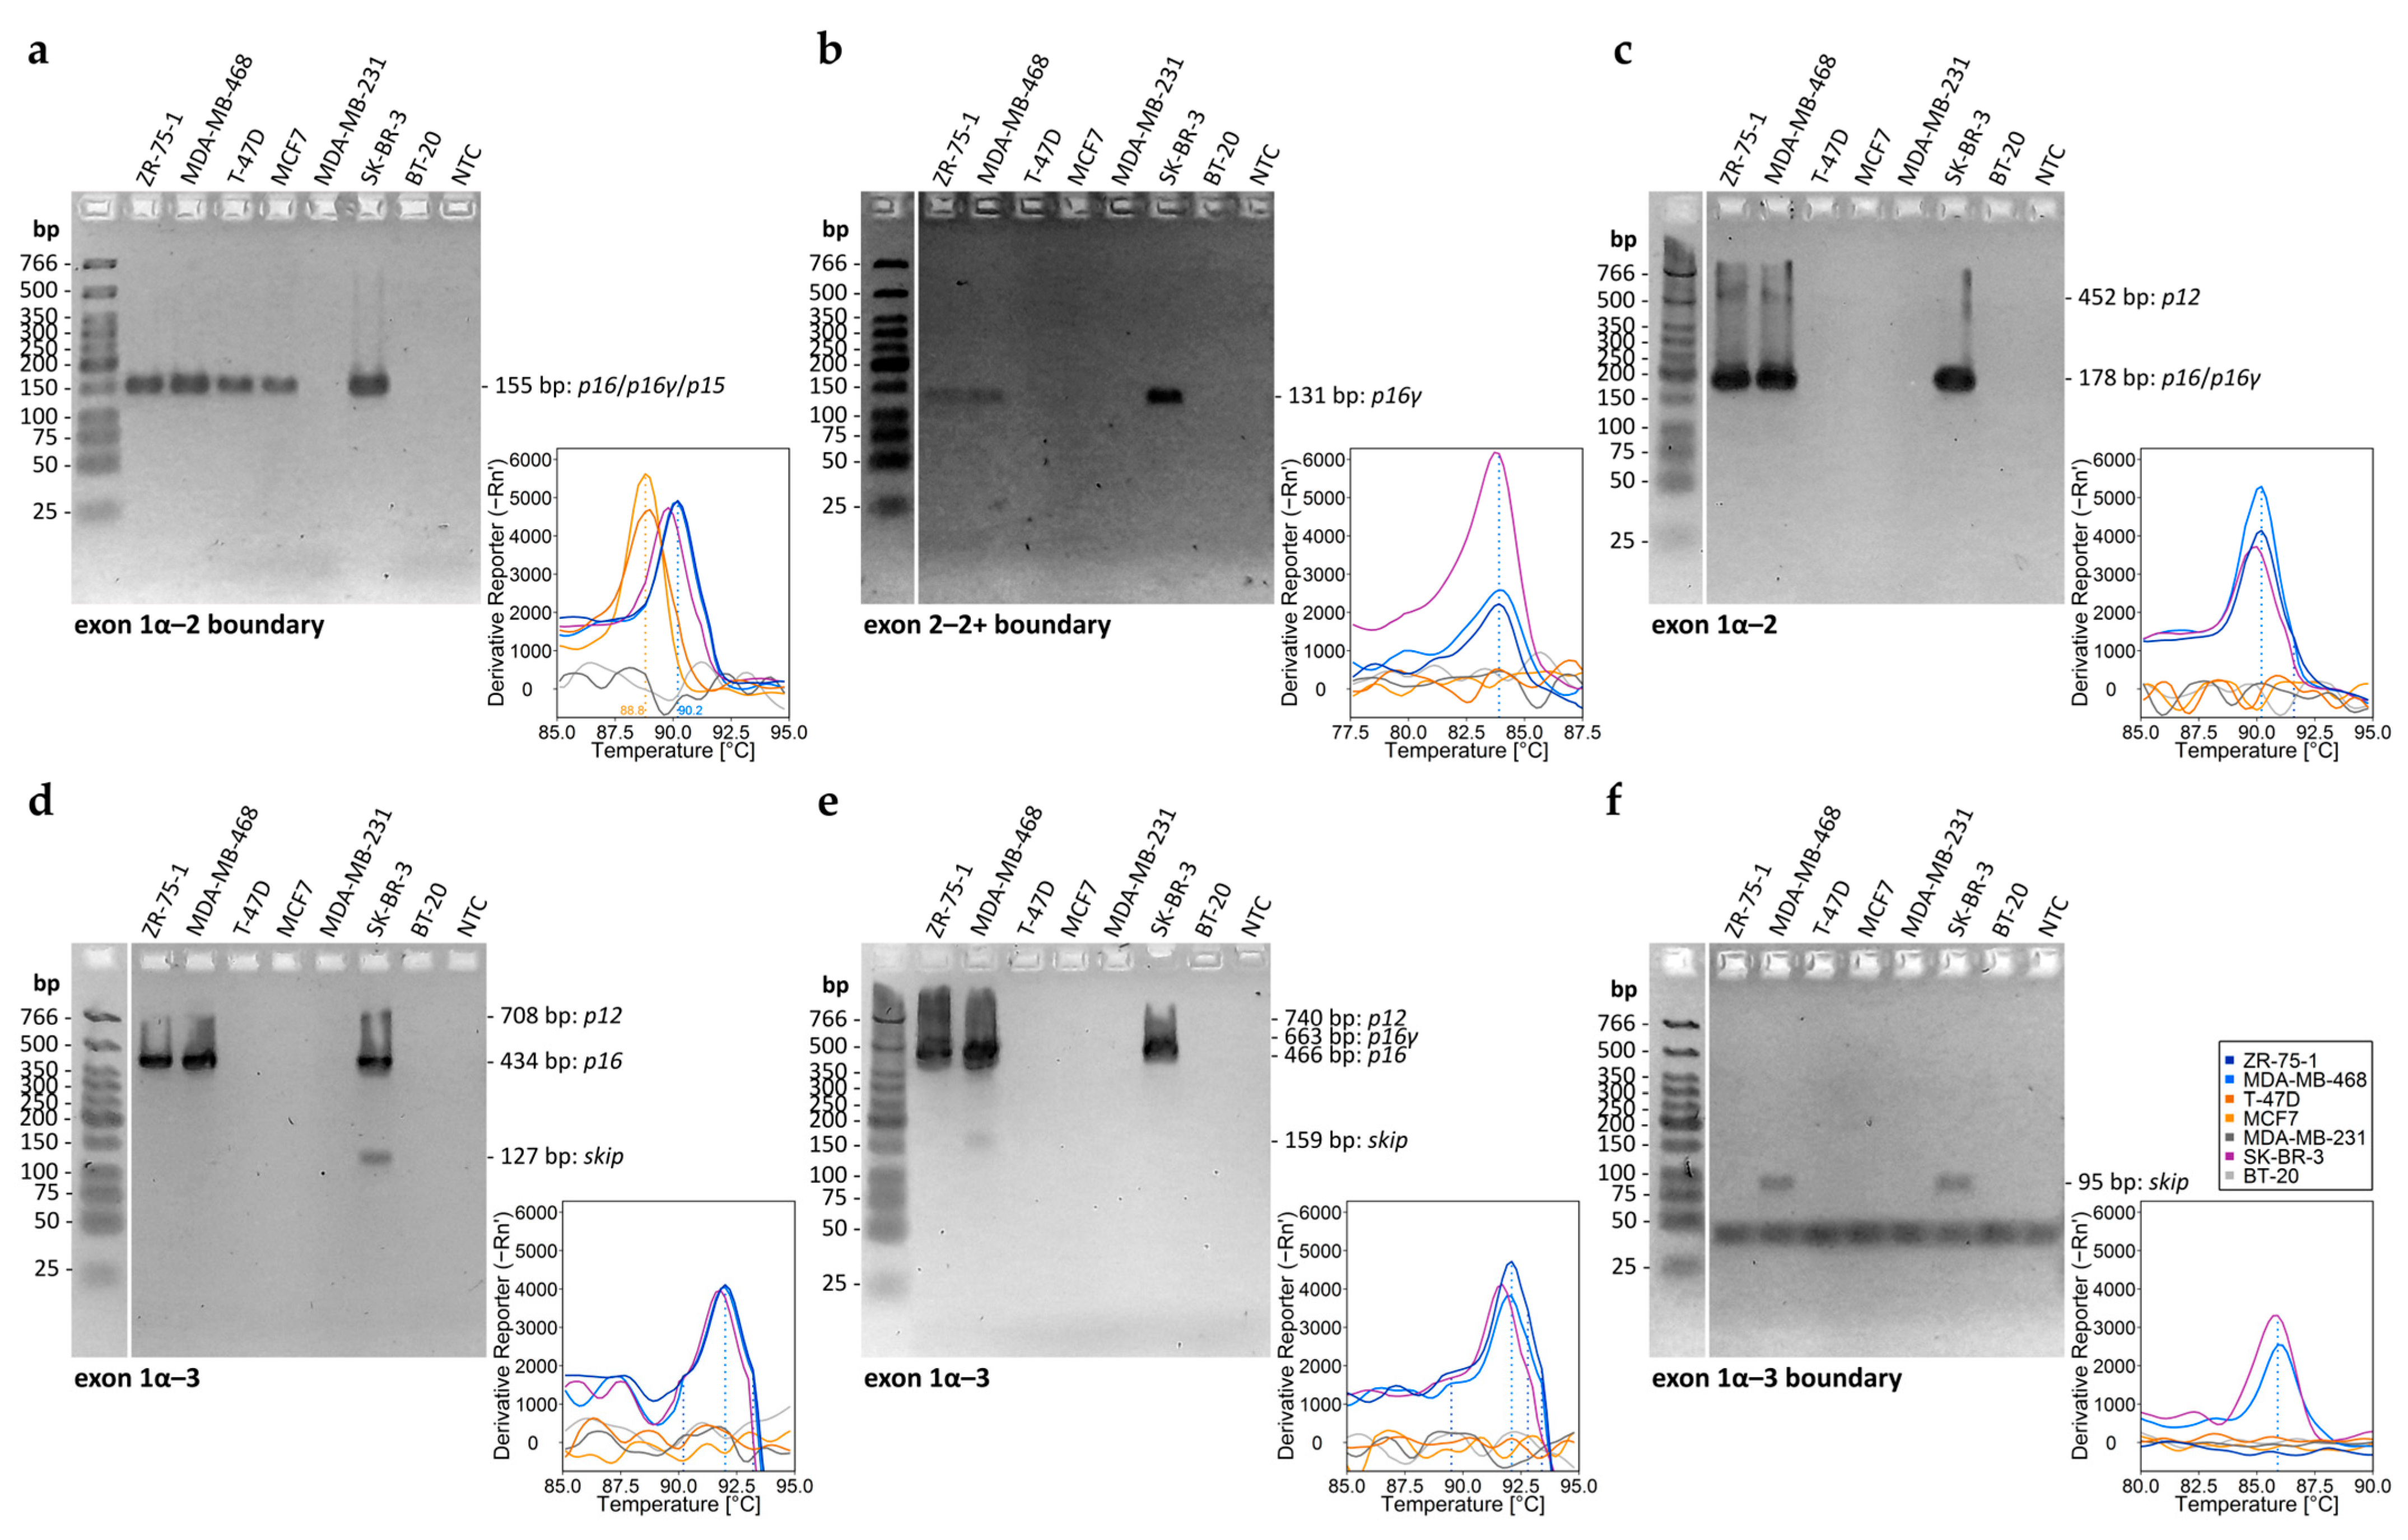
In order to investigate the association of DNA methylation of CDKN2A exon 2 with gene expression, we aimed at detecting CDKN2AINK4a transcripts that contain CDKN2A exon 2 as well as exon 2 skipping. We designed six primer sets, with primer sets 1–3 (Table 2) targeting CDKN2A exon–exon boundaries and primer sets 4–6 (Table 3) targeting CDKN2A exons. The high number of primer sets was necessary due to the variety of CDKN2AINK4a transcripts that can be generated (Figure 1). The PCR products for the different transcript variants obtained with primer sets 1–6 are shown in Figure 7.

2.4. DNA Methylation Analysis of CDKN2AINK4a Promoter and CDKN2A Exon 2 in Primary Cell Lines from Glioma

We applied our primer set for CDKN2A exon 2 methylation to a sample set comprising 27 primary cell lines (PCLs) from glioma (sample set 1). To obtain a more comprehensive view of CDKN2A methylation, we also determined the methylation status of the CDKN2AINK4a promoter. Unfortunately, no RNA was available from this sample set, precluding further analysis of the functional relevance of CDKN2A exon 2 methylation.
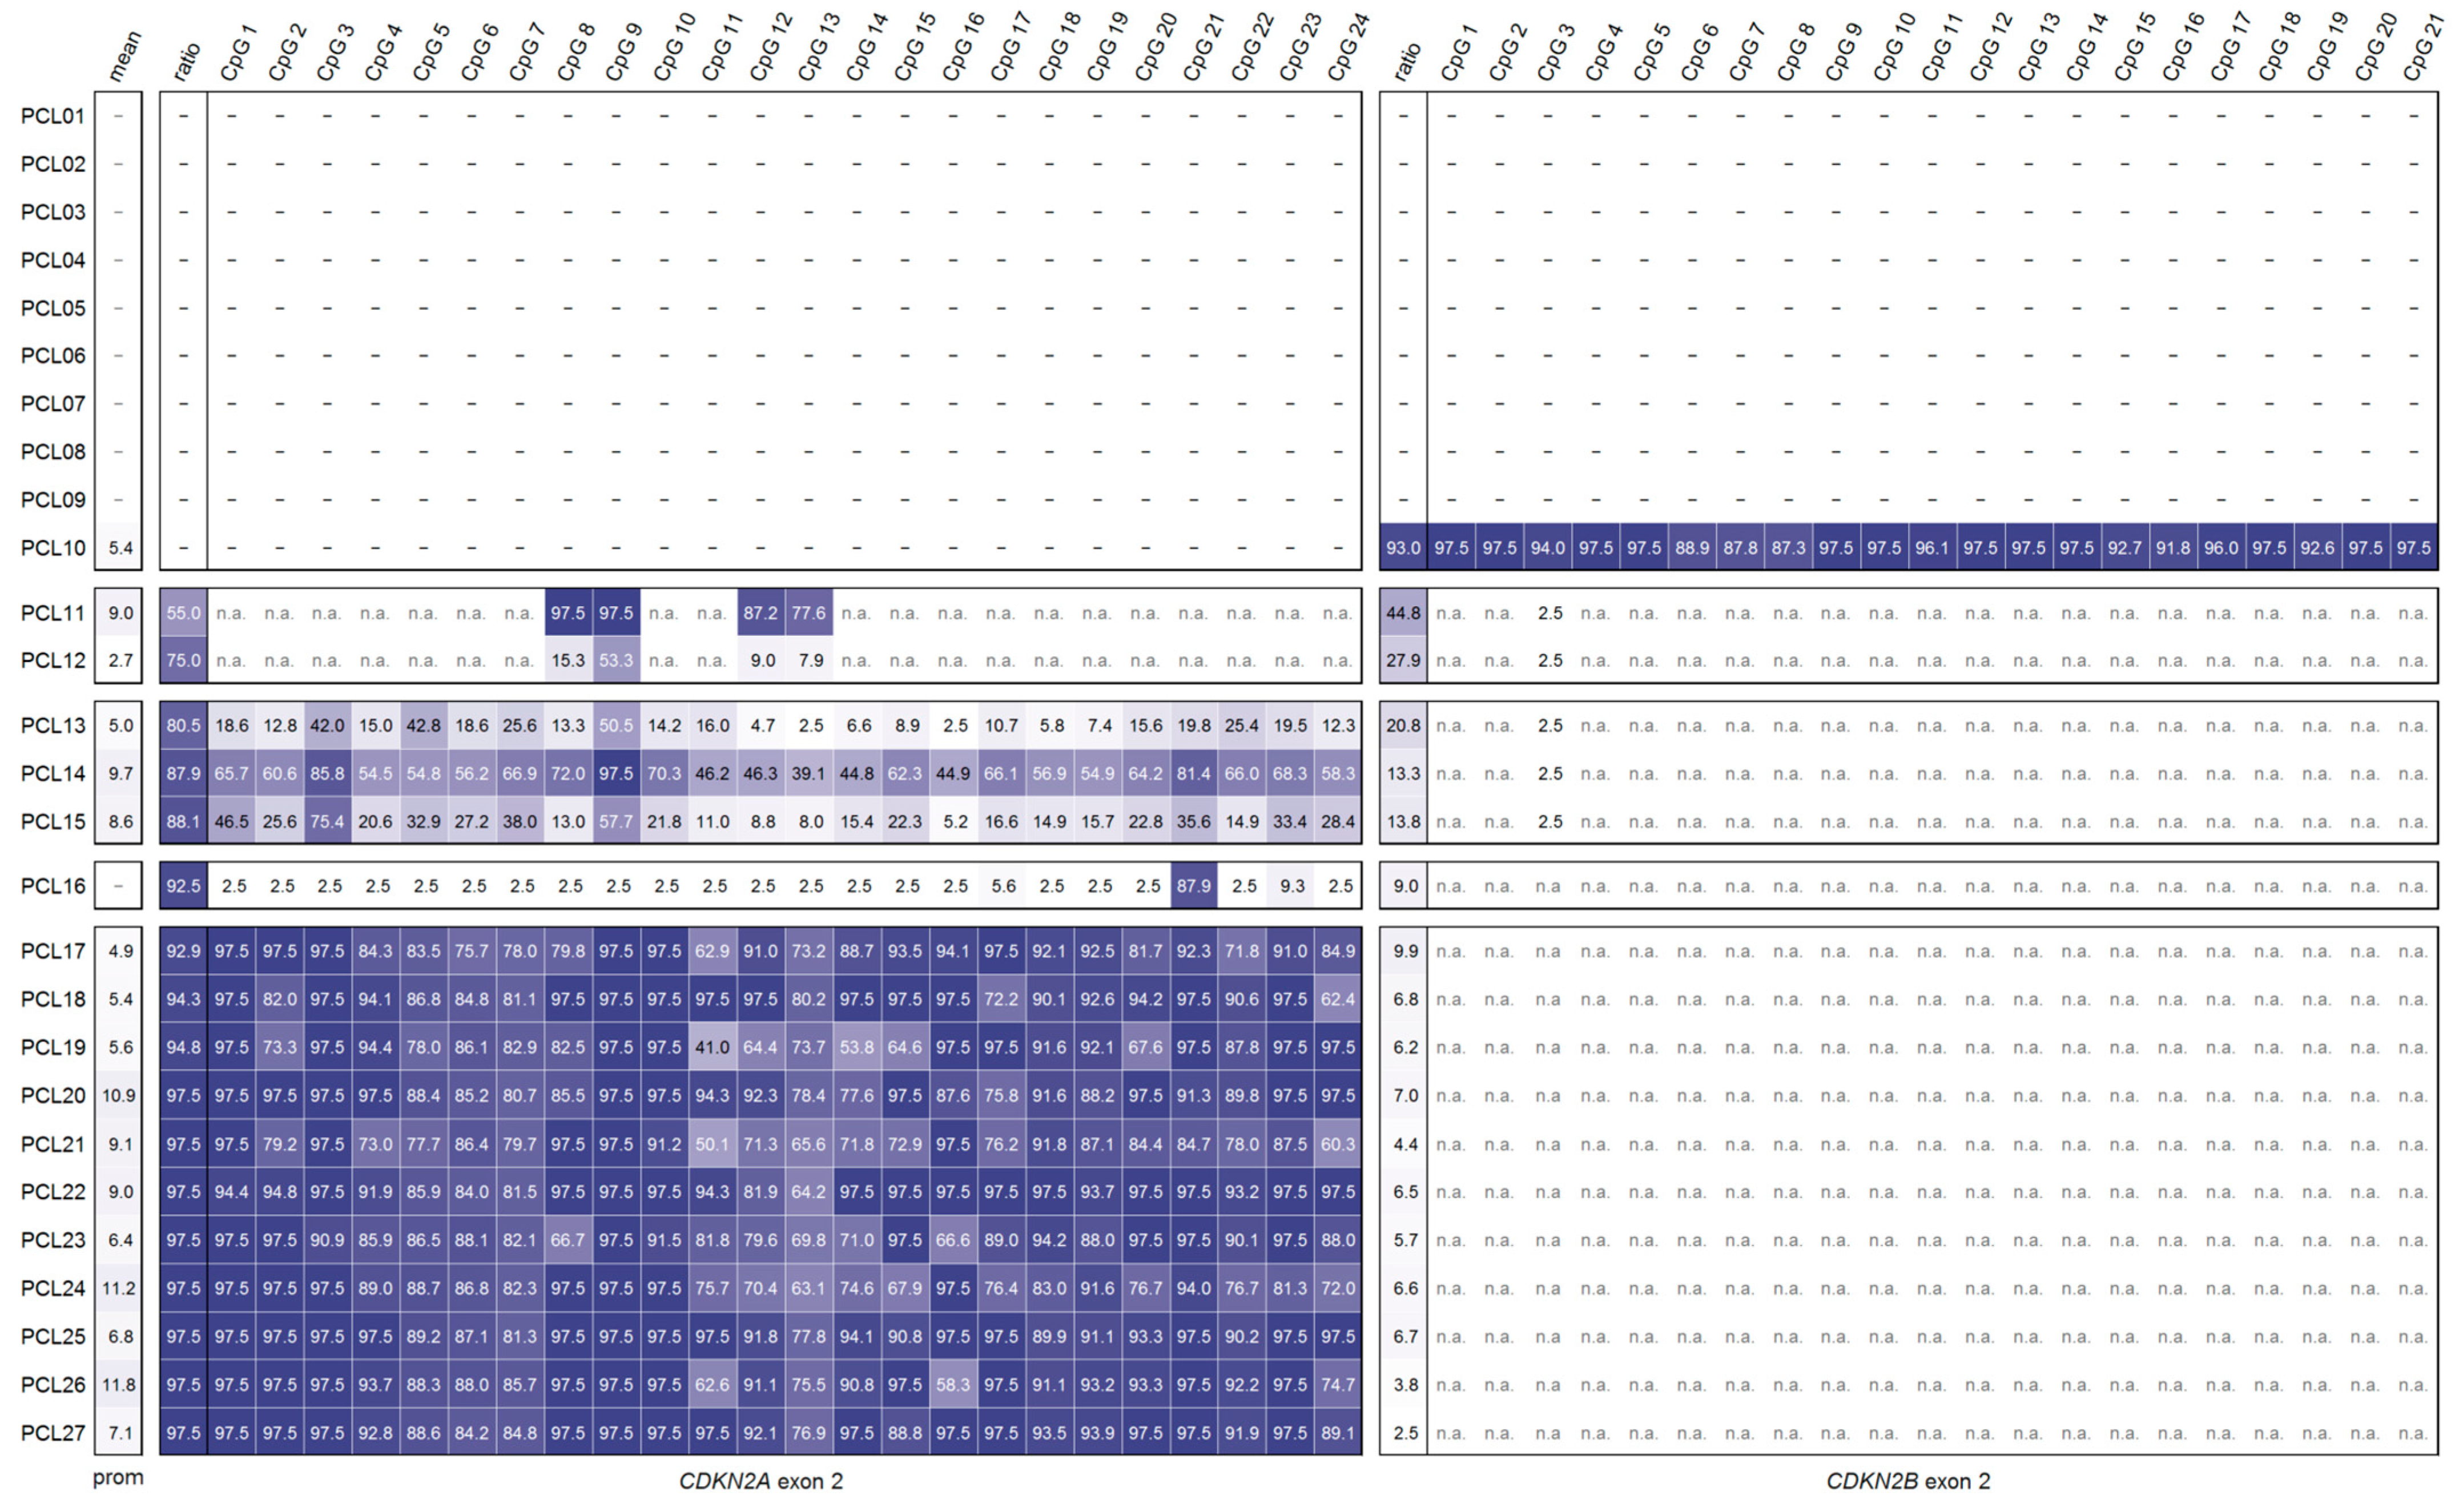
In nine PCLs (PCL01–PCL09), no PCR products were obtained for either the promoter or exon 2 (Figure 8). We hypothesize that the absence of PCR amplification for both regions is due to deletion. Homozygous deletion of the CDKN2A gene, or even larger parts of chromosome 9, is a frequent event in glioma and has been associated with poor prognosis [19,20,21].
In one PCL (PCL10), a PCR product was obtained for the CDKN2AINK4a promoter but not for CDKN2A exon 2. The promoter was unmethylated in this sample. Notably, a product was also generated for CDKN2B exon 2. HRM and PSQ data revealed that CDKN2B exon 2 was highly methylated. This finding demonstrates that our novel method successfully amplified the target region in originally methylated DNA despite the presence of three mispriming sites in the reverse primer.
For one PCL (PCL16), we obtained a PCR product for CDKN2A exon 2 but not for the promoter, suggesting a partial gene deletion. Interestingly, CDKN2A exon 2 was largely unmethylated, except for CpG 21, which was highly methylated (87.9%). Such isolated hypermethylation in an otherwise unmethylated region may result from aberrant de novo methylation and could indicate a regulatory role of CpG 21. In general, methylation of a single CpG can affect transcription factor binding, nucleosome positioning, or RNA splicing. However, the biological relevance of CpG 21 hypermethylation in this context remains unclear.
In nine PCLs (PCL10, PCL12, PCL13, PCL17-19, PCL23, PCL25, PCL27), the CDKN2AINK4a promoter was unmethylated (cut-off 8%), while in eight PCLs (PCL11, PCL14, PCL15, PCL20-22, PCL24, PCL26), it showed slight methylation. In two of these samples (PCL11, PCL12), the ratio of PCR products for CDKN2A exon 2 and CDKN2B exon 2 was <80%. Thus, reliable methylation levels were only obtained for five CpGs—those that are specific for CDKN2A exon 2 and CDKN2B exon 2, as described above for mixtures of methylated and unmethylated DNA standards. In three samples (PCL13–PCL15), the proportion of CDKN2A exon 2 was between 80% and 90%. These samples showed moderate and relatively heterogeneous methylation across the 24 CpGs. In twelve PCLs (PCL16–PC27), the proportion of CDKN2A exon 2 was >90%, and these samples generally showed high methylation of CDKN2A exon 2.
In all PCLs analyzed in this study, mean CDKN2AINK4a promoter methylation was <12%. While high promoter methylation is commonly associated with transcriptional silencing of CDKN2A in glioma [22], low or moderate methylation levels may result in partial inactivation. However, due to the lack of expression data for this sample set, the functional consequences of low/moderate promoter methylation and exon 2 methylation remain speculative.
To address this limitation, we next examined the relationship between CDKN2A exon 2 methylation and gene expression in commercial breast cancer cell lines for which DNA, RNA, and protein fractions were available.

2.5. DNA Methylation Analysis of the CDKN2AINK4a Promoter and CDKN2A Exon 2 and Transcript Variant Analysis of CDKN2A Exons in Commercial Breast Cancer Cell Lines

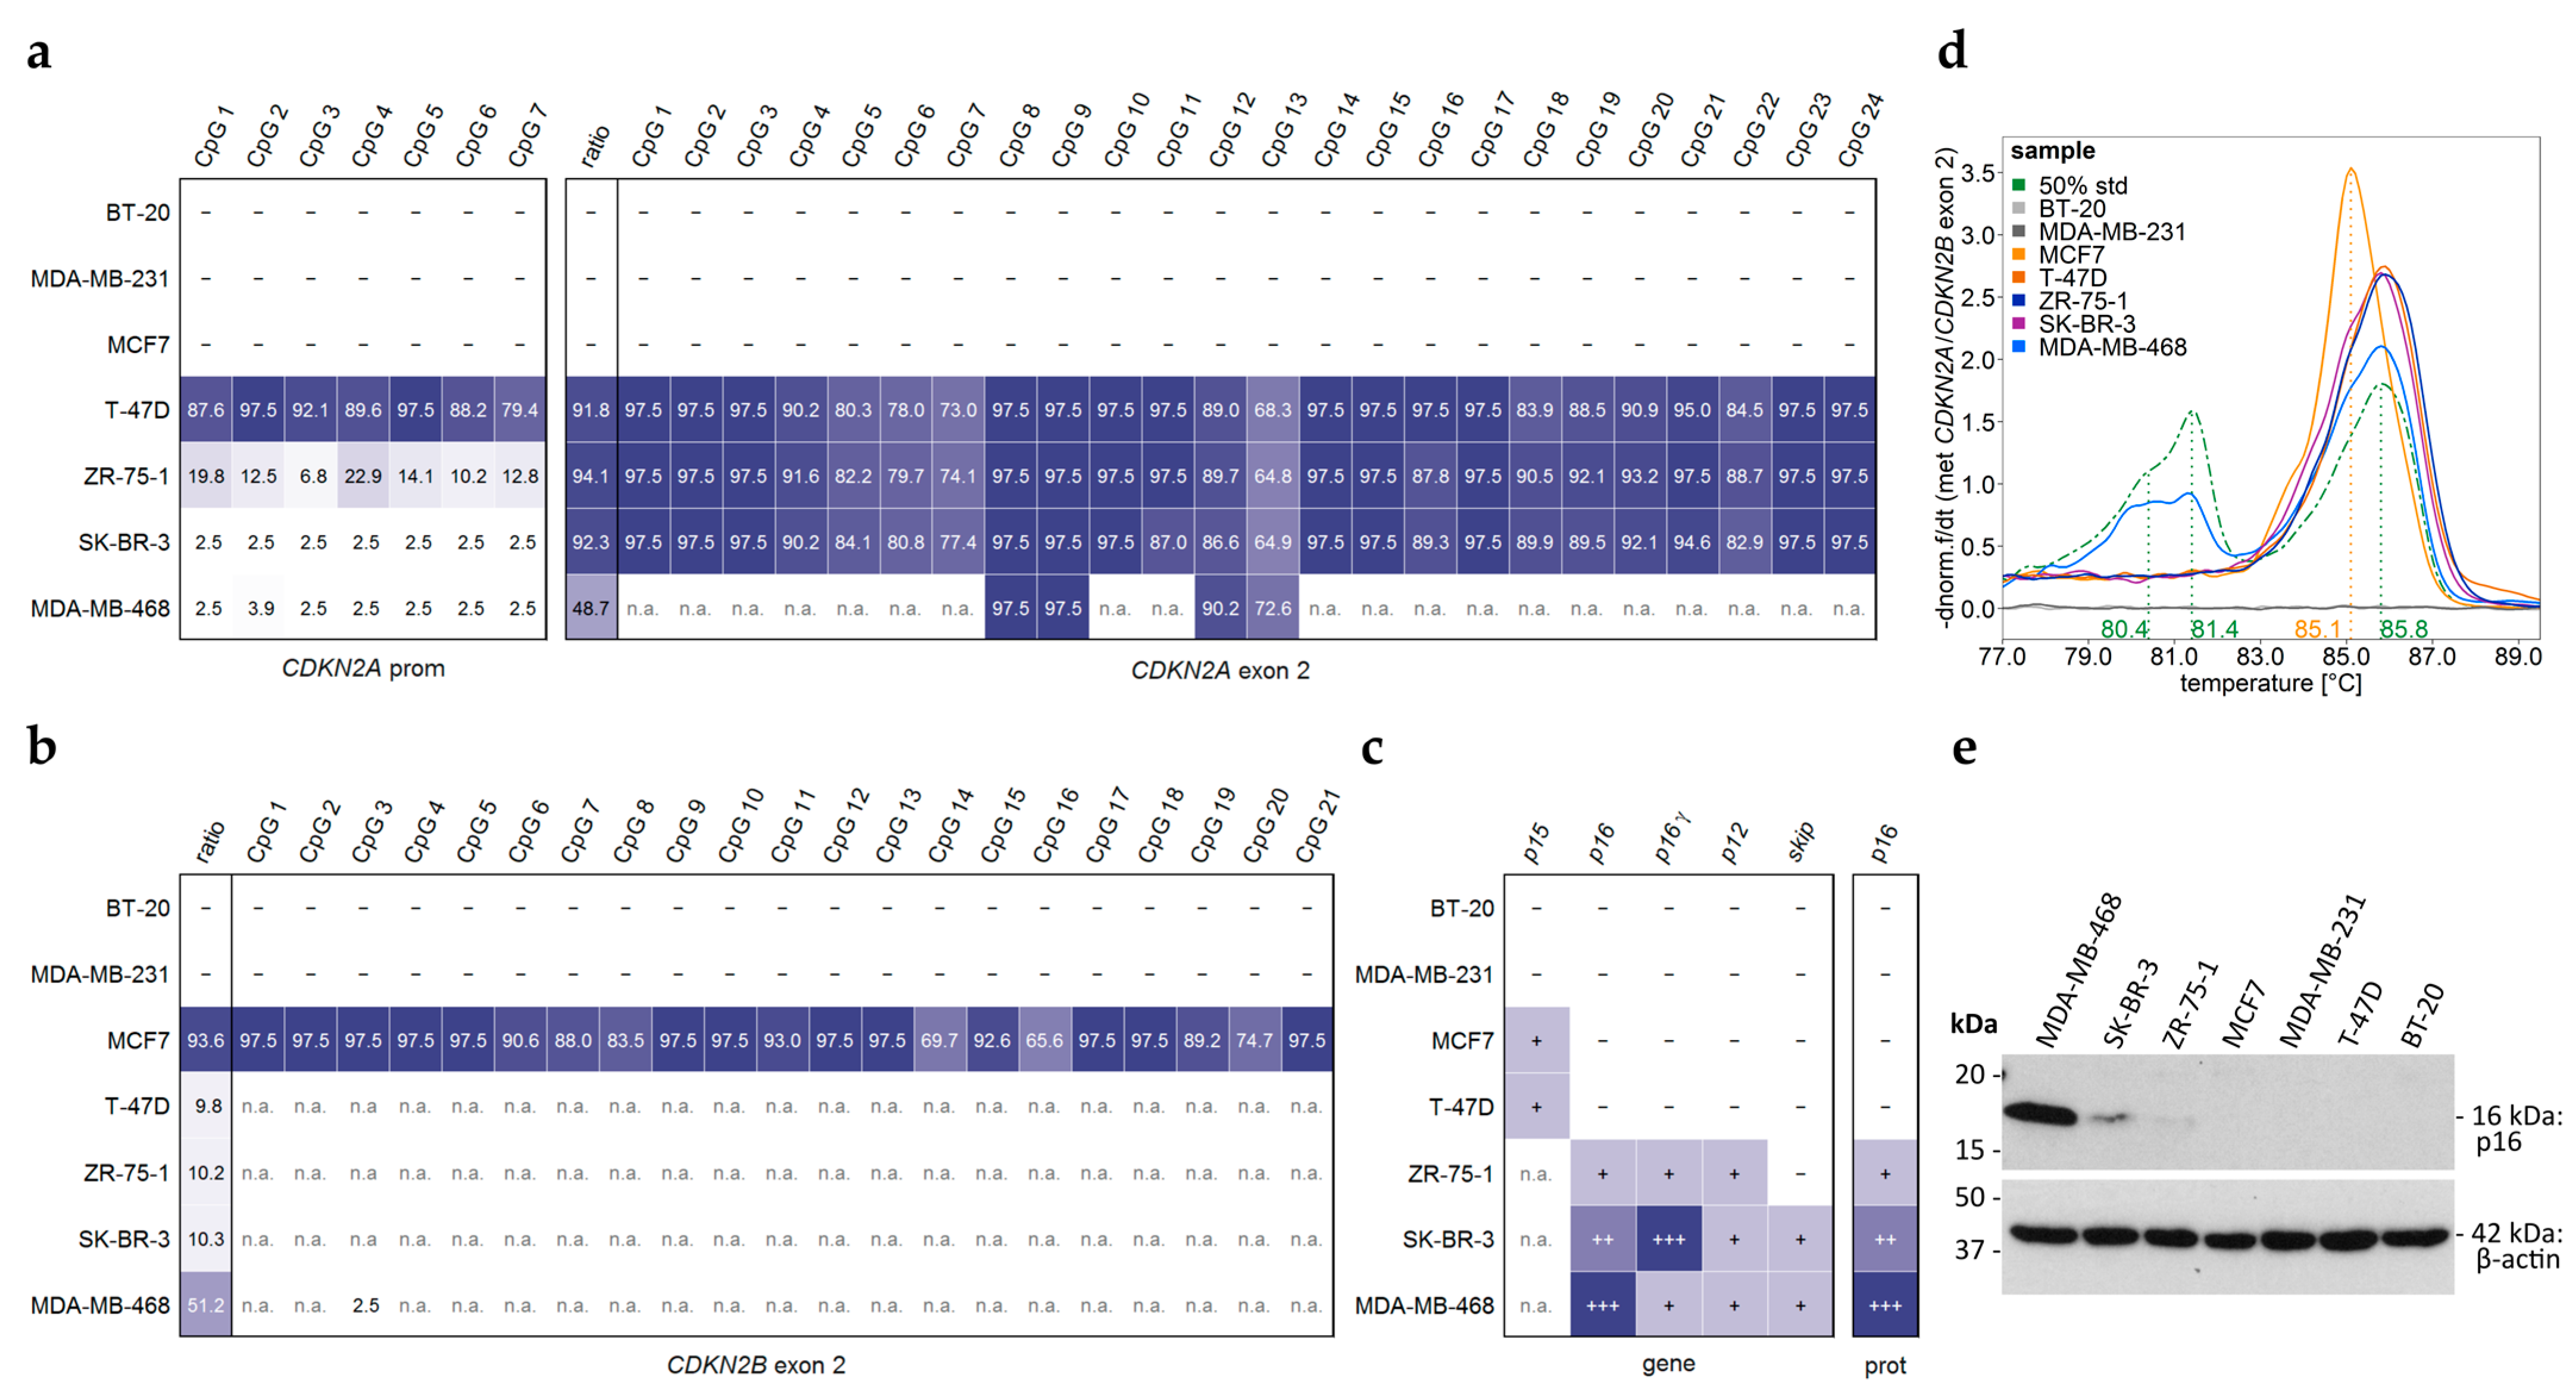
Seven commercial breast cancer cell lines (BT-20, MCF7, MDA-MB-231, T-47D, ZR-75-1, SK-BR-3, and MDA-MB-468) were analyzed for CDKN2AINK4a promoter and CDKN2A exon 2 methylation (Figure 9a–d). Unlike sample set 1, RNA and protein fractions were also available for these cell lines, enabling us to investigate potential associations between the DNA methylation status of the CDKN2AINK4a promoter and CDKN2A exon 2 and gene transcription at both the mRNA and protein levels (Figure 9 and Figure 10).
In breast cancer, the role of p16INK4a is less clearly defined than in other tumor types, as both deletions at 9p21 and overexpression of p16INK4a have been proposed as markers of breast cancer progression [23]. The relevance of CDKN2AINK4a promoter methylation in breast cancer remains controversial [9,10,11,12,13,14], whereas hypermethylation of CDKN2A exon 2 methylation has been linked to breast tumorigenesis [16].
For two cell lines, BT-20 and MDA-MB-231, no PCR products were obtained for either CDKN2AINK4a promoter or CDKN2A/CDKN2B exon 2 in the DNA methylation assays (Figure 9a). Correspondingly, no CDKN2AINK4a transcripts were detected (Figure 9c and Figure 10). Our results support the literature [24] and ATCC [25] data that report homozygous deletion of CDKN2A in these cell lines. In addition, we did not obtain p15 (CDKN2BInk4b) transcripts in these two cell lines.
MCF-7 also showed no PCR products for the CDKN2AINK4a promoter, CDKN2A exon 2, nor any CDKN2A transcripts (Figure 9a,c and Figure 10), consistent with a homozygous deletion. However, a PCR product was obtained for CDKN2B exon 2, which was highly methylated (Figure 9b). Notably, the melting temperature of the CDKN2B product was 0.7 °C lower than that of the PCR product for methylated CDKN2A exon 2 (Figure 9d), reflecting a slightly lower GC content (47.8% vs. 48.7%) after bisulfite conversion. We also detected a transcript of p15 (CDKN2BInk4b), inferred by exclusion: when transcripts for neither p16 nor p16γ were detected, and the melting temperature corresponded to the GC content of p15 (88.8° C, 70.3% GC) rather than p16/p16γ (90.2 °C, 71.6% GC), the product from the exon 1α–exon 2 boundary primer set was attributed to p15 (Figure 10).
In T-47D, ZR-75-1, and SK-BR-3, PCR products for both CDKN2AINK4a promoter and CDKN2A exon 2 were detected. The proportion of CDKN2A exon 2 product exceeded 90%, enabling reliable DNA methylation analysis. All three cell lines exhibited high CDKN2A exon 2 methylation but differed in promoter methylation: high in T-47D, intermediate in ZR-75-1, and absent in SK-BR-3. Transcripts of CDKN2A and p16INK4a expression were detected in ZR-75-1 and SK-BR-3 but not in T-74D (Figure 9e). In T-74-D, p15 (CDKN2BInk4b) was detected instead. Results shown in Figure 10d–f suggest exon 2 skipping in SK-BR-3.
In MDA-MB-468, the CDKN2AINK4a promoter was unmethylated. PCR amplification resulted in a high proportion (51.2%) of CDKN2B product, limiting reliable methylation analysis to four CpGs, which were highly methylated. Our results suggest exon 2 skipping in MDA-MB-468. Transcripts of CDKN2A and p16INK4a expression were detected (Figure 9e). Differentiation of p16INK4a expression from the formation of other CDKN2A transcripts required multiple SYBR green-based PCRs, agarose gel electrophoresis, and melt curve analysis.
CDKN2A (and CDKN2B) inactivation, via deletion or epigenetic silencing, has been associated with breast cancer [9,10,11,12,13,26,27]. In our study, BT-20 and MDA-MB-231 showed complete inactivation of both genes via homozygous deletion. In MCF7 and T-47D, CDKN2A transcripts were absent, but p15 (CDKN2BInk4b) was detected, suggesting a compensatory role for CDKN2BInk4b. This is in line with a mouse study hypothesizing that p15INK4b can substitute for p16INK4a in stress conditions, possibly explaining their frequent co-deletion in cancer [28].
In contrast, ZR-75-1, SK-BR-3, and MDA-MB-468 expressed multiple CDKN2A transcripts by having high CDKN2A exon 2 methylation. However, promoter methylation was different: intermediate in ZR-75-1, absent in SKBR3 and MDA-MB-468. These observations suggest that high promoter methylation is associated with transcriptional silencing, whereas intermediate or low methylation does not preclude gene expression. Notably, neither promoter nor exon 2 methylation consistently predicted mRNA or protein levels, indicating that regulation of CDKN2A gene expression is even more complex.
Our cell line panel comprised three breast cancer molecular subtypes: luminal A (MCF7, T-47D, and ZR-75-1), HER-2-positive (SK-BR-3), and triple negative (BT-20, MDA-MB-231, and MDA-MB-468). BT-20 and MDA-MB-231, both triple negative, lacked CDKN2A due to homozygous deletion, while MDA-MB-468 (also triple negative) highly expressed CDKN2A. Among the luminal A cell lines, MCF7 and T-47D expressed p15 (CDKN2BInk4b), whereas ZR-75-1 expressed p16Ink4a. These results suggest that CDKN2A is not regulated in a molecular subtype-specific manner. This variability suggests that CDKN2A regulation is not strictly molecular subtype-specific.
Previous studies have linked breast cancer subtypes to distinct DNA methylation patterns [29,30]. We observed high CDKN2A exon 2 methylation in luminal A (T-47D, ZR-75-1), HER2-positive (SK-BR-3), and triple-negative (MDA-MB-468) cell lines. Promoter methylation varied: high in T-47D, intermediate in ZR-75-1, and absent in SK-BR-3 and MDA-MB-468. These findings suggest that neither CDKN2AINK4a promoter nor CDKN2A exon 2 methylation follows a clear subtype specific pattern. However, a recent study reported CDKN2AINK4a promoter hypermethylation in triple-negative compared to non-triple-negative breast cancer patients [31].
Our approach provides a practical tool for the locus-specific analysis of CDKN2A exon 2 in cancer despite the high sequence identity with CDKN2B. Since CDKN2A methylation is a well-established biomarker in several tumor types, including glioblastoma and melanoma, reliable discrimination between CDKN2A and CDKN2B is critical for both research and diagnostic applications. The combined analysis of methylation and transcript variants from the same exon region may also provide insights into epigenetic regulation and transcript diversity with potential clinical relevance.
One limitation of our approach is the need to estimate CDKN2A-specific methylation levels based on nucleotide differences at at least one position within the target sequence. Although PSQ is widely considered a reliable and quantitative method for DNA methylation analysis, sequence context and assay design can influence signal intensities, and minor variability cannot be excluded. We did not identify a restriction enzyme that selectively digests CDKN2B exon 2 while leaving CDKN2A intact, which would be a theoretically attractive strategy to improve locus specificity.
Long-read DNA nanopore of RNA sequencing (RNA-seq) as well as whole-genome bisulfite sequencing (WGBS) and short-read RNA-seq using 2 × 150 bp paired-end reads would allow for a comprehensive, genome-wide assessment of DNA methylation and alternative splicing events. However, these approaches require substantial sequencing depth and bioinformatic resources, particularly when aiming to analyze regions with high sequence identity such as CDKN2A and CDKN2B exon 2. In our study, we deliberately chose targeted approaches for DNA methylation and transcript variant analysis to accurately discriminate between these highly homologous regions. Despite the challenges associated with primer design, these methods enable precise locus-specific analysis and are more readily applicable when large-scale sequencing is not feasible.

3. Materials and Methods

3.1. Primary Cell Lines from Glioma Patients

The sample set consisted of primary human tumor cell lines (PCLs) established from 27 glioma patients as described previously [32]. The study was approved by the local Ethics Commission of the Faculty of Medicine at the Johannes Kepler University Linz (application number E-39-15). All patients signed a written informed consent form.

3.2. Commercial Breast Cancer Cell Lines

Seven breast cancer cell lines were obtained from ATCC (American Type Culture Collection; Manassas, VA, USA). The molecular subtypes were luminal A (MCF7, T-47D, and ZR-75-1), Her2-positive (SK-BR-3), and triple negative (BT-20, MDA-MB-231, and MDA-MB-468). Cells were cultured as described previously [18]. Cells were harvested at ~70% confluency and cell pellets were stored at −80 °C until DNA extraction.

3.3. DNA/RNA Extraction and Bisulfite Conversion

Genomic DNA and RNA (only from commercial breast cancer cell lines) were isolated simultaneously using an AllPrep DNA/RNA Mini Kit (Qiagen, Hilden, Germany) following the manufacturer’s protocol for cultured cells and quantified with a Nanodrop 2000c spectrophotometer (Thermo Fisher Scientific, Vienna, Austria). The DNA and RNA extracts were stored at −20 °C until reverse transcription (RNA) or bisulfite conversion (DNA).
Reverse transcription of RNA was performed with a QuantiTect Reverse Transcription Kit (Qiagen) following the manufacturer’s instructions. cDNA was stored at −20 °C until real-time PCR.
For bisulfite conversion, the EpiTect Fast Bisulfite Conversion Kit (Qiagen, Hilden, Germany) was used according to the manufacturer’s protocol. The converted DNA was quantified using the Qubit 4 instrument with a Qubit ssDNA Assay Kit (Thermo Fisher Scientific, Vienna, Austria) and stored at −20 °C until PCR.

3.4. Primer Design and PCR Conditions for DNA Methylation Analysis

The assays were developed in-house. Nucleotide sequences were retrieved from the National Center for Biotechnology Information (NCBI) database [17]. NCBI reference sequences were used for exon annotation (CDKN2A p16Ink4a transcript: NM_000077.5; CDKN2B p14Ink4b transcript: NM_004936.4). For the CDKN2A p16Ink4a promoter, the seven CpGs upstream of exon 1α were targeted. For exon 2, CpGs 1–24 and CpGs 1–21 of the CDKN2A and CDKN2B gene were targeted, respectively. The CpGs of exon 2 are part of CpG islands according to the University of California at Santa Cruz (UCSC) Genome Browser [33] (CDKN2A: Genbank GRCh38.p13 chr9 NC_000009.12:c21970915–21971191, 35 CpGs; CDKN2B: Genbank GRCh38.p13 chr9 NC_000009.12:c22005889–22006230, 35 CpGs). Primers were designed with PyroMark Assay Design Software 2.0.1.15 (Qiagen, Hilden, Germany) and purchased from Sigma-Aldrich (Steinheim, Germany). The primer sequences are given in Table 1 and their location is visualized in Figure 1.
Table 1. Overview of HRM-PSQ assays.
RegionPrimer Sequence (5′→3′)Length [bp]CpGs Analyzed
CDKN2ACDKN2B
promoterF: GAGGGGTTGGTTGGTTATTAG75
R: [Btn] TACCTACTCTCCCCCTCTC
S: GGTTGGTTGGTTATTAGA 1–7-
exon 2F: GTTTTTTTTGGTAGGTTATGATGATGG230
R: [Btn] ACCCAACTCCTCAACCAAATCC
S1: AGGTTATGATGATGGGTA 1–141–11
S2: GGGAGGGTTTTTTGGATA 15–2412–21
[Btn]: biotin, length: PCR product length; bp: base pairs, F: forward primer, R: reverse primer, and S: sequencing primer.
For each primer set, concentration and annealing temperature (Ta) were optimized by using bisulfite-converted in-house-prepared unmethylated and methylated control DNA. In-house preparation by whole-genome amplification and enzymatic in vitro methylation was performed as described previously [34], where all details of the protocol are provided.
Each reaction was performed in a total volume of 20 μL, consisting of 1× PCR mix, forward and reverse primer, and 5 ng of bisulfite converted DNA using a Rotor-Gene Q instrument with a 72-well rotor (Qiagen, Hilden, Germany). For the exon 2 region, 400 nM of each primer with 10 µL PyroMark PCR Master Mix (2×), 2 µL CoralLoad Concentrate (10×), and 1 µL EvaGreen dye (20×) (Biotium, Fremont, CA, USA) were used for HRM-PSQ. For the promoter region, 400 nM of each primer with either 10 µL PyroMark PCR Master Mix (2×) and 2 µL CoralLoad Concentrate (10×) were used for PSQ or 10 µL EpiTect HRM Master Mix (2×) for HRM. Amplification was performed with initial activation at 95 °C for 15 min (PyroMark PCR Master Mix) or 5 min (EpiTect HRM Master Mix), followed by 50 cycles of denaturation at 94 °C for 30 s, annealing at 62.1 °C (exon 2) or 59.5 °C (promoter) for 30 s, elongation at 72 °C for 30 s, and final elongation at 72 °C for 10 min.
For HRM, the following program was applied directly after final elongation: strand separation for 1 min at 95 °C, strand hybridization for 1 min at 40 °C and HRM with a ramp from 65 °C to 95 °C with 0.1 °C/hold (2 s) and gain optimization (70% before melt).
Each PCR run included bisulfite-converted human non-methylated and methylated DNA; 25%, 50%, and 75% mixtures thereof; and a no template control (2 μL nuclease-free H2O). Identity, quality, and yield of PCR products obtained for standards were assessed by gel electrophoresis (3% agarose gel in 1× TBE (Tris-borate-EDTA) buffer. The gel was post-stained with 3× GelRed (Biotium, Fremont, CA, USA), and bands were visualized with a UVT-20 M transilluminator (Herolab, Wiesloch, Germany).

3.5. PSQ of PCR Products

For PSQ, the PyroMark Q24 Vacuum Workstation, the PyroMark Q24 Advanced instrument with PyroMark Q24 Advanced Accessories, PyroMark Q24 Advanced CpG Reagents (all Qiagen, Hilden, Germany), and Sepharose High-Performance beads (GE Healthcare, Vienna, Austria; Thermo Fisher Scientific, Vienna, Austria) were used according to the manufacturer’s instructions.
For the promoter and exon 2 (sequencing primer 1), the dispensation order was adapted, e.g., to overcome sequencing frameshifts. The dispensation orders were as follows: promoter: AGCTGGTCGTATCTAGTCGTAGTCAGTCTAGTCGTAGTCGAG; exon 2 S1: AGCTAGTCAGACTGTAGCTGAGCTGTGTGTTGTACTAGCTAGCTGAGTATATGCTAGTACGTATTCGTATTGTATCGTATCGTGATGACTGTACTGTAG-TCGAGTTGATGACTGTGTGTGTGTGATCAGTCGGCTAGCTGTGTACTGTAGCTAG-CTGATGTGGTCGTAGTCGTG; exon 2 S2: ACTGTGTGTGTGCTGTATCAGGTCGGCT-AGCTGTGTACTGTAGCTAGCTGATGTGGTCGTAGTCGTG).
For the promoter region, 1 μL Streptavidin Sepharose High Performance (GE Healthcare, Vienna, Austria), 40.0 μL PyroMark Binding Buffer, 24.0 µL high-purity water (18.2 MΩ cm, ELGA PURELAB Ultra MK 2, Veolia, Celle, Germany), and 15.0 μL of biotinylated PCR product were mixed by agitating for 10 min at 1400 rpm. For each sequencing primer for the exon 2 region, 0.6 μL Streptavidin Sepharose High Performance (GE Healthcare, Vienna, Austria), 24.0 μL PyroMark Binding Buffer, and 14.4 µL high-purity water (18.2 MΩ) were mixed with 9.0 μL of biotinylated PCR product (same PCR well for both sequencing primers). All following steps were performed as described previously [35].

3.6. Analysis of Transcript Variants

All real-time-PCR assays for analysis of transcript expression were developed in-house. NCBI reference sequences [17] were used for exon annotation (CDKN2A: p16Ink4a transcript NM_000077.5, p16γInk4a transcript NM_001195132.2, p12Ink4a transcript NM_058197.5, p14ARF transcript, tr6ARF2 transcript NM_001363763.2, CDKN2B: p14Ink4b transcript NM_004936.4, and p10Ink4b transcript NM_078487.2). Primers were designed with the web interface Primer3Plus [36] and purchased from Sigma-Aldrich (Steinheim, Germany).
Primer sets 1–3 (Table 2) target CDKN2A exon–exon boundaries, whereas primers from sets 4–6 (Table 3) do not bind exon–exon boundaries. Transcript variants targeted by the respective primer set are shown in Figure 2.
Table 2. Primer sets for gene expression analysis targeting CDKN2A exon–exon boundaries.
SetRegionPrimer Sequence (5′→3′)LocationLength [bp]
1exon 1α–exon 2F: GGAGGCCGATCCAGGTCAboundary155
R: CAGCACCACCAGCGTGTCexon 2
2exon 2–exon 2+F: GCGGAAGGTCCCTCAGAAboundary131
R: CAGCCAGCTTGCGATAACCAexon 2+
3exon 1α–exon 3F: GATCCAGACATCCCCGATTGboundary95
R: CCTGTAGGACCTTCGGTGAexon 3
bp: base pairs, F: forward primer, R: reverse primer.
Table 3. Primer sets for gene expression analysis targeting CDKN2A exons.
SetRegionPrimer Sequence (5′→3′)LocationLength [bp]
4exon 1α–exon 2F: CAACGCACCGAATAGTTACGexon 1α178/452
R: CAGCACCACCAGCGTGTCexon 2
5exon 1α–exon 3F: CAACGCACCGAATAGTTACGexon 1α434/631/
R: CAGTTGTGGCCCTGTAGGAexon 3708/127
6exon 1α–exon 3F: GGTCGGGTAGAGGAGGTGexon 1α466/663/
R: AGGACCTTCGGTGACTGATGAexon 3740/159
bp: base pairs, F: forward primer, R: reverse primer.
Each reaction was performed in a total volume of 20 µL, consisting of 10 µL QuantiTect SYBR Green PCR Master Mix, RNase-free water, forward and reverse primer (final concentration of 300 nM each), and 10 ng cDNA using the QuantStudio 5 instrument (Thermo Fisher Scientific, Vienna, Austria) and fast ramp speed. The temperature program included an initial activation step of 15 min at 95 °C, followed by a repeated 3-step cycling of 10 s denaturation at 94 °C, annealing for 20 s at 60 °C, and elongation at 72 °C. For primer sets targeting exon–exon boundaries, 40 cycles and an elongation time of 20 s were used. For primer sets targeting exons, 45 cycles and 45 s elongation were applied. Subsequent melt curve acquisition was performed from 60 °C to 95 °C in 0.1 °C/s steps. For each primer set assay, the identity and purity of the PCR products were checked by gel electrophoresis (3% agarose gel in TBE buffer and post-staining using 3× GelRed (Biotium, Fremont, CA, USA) and a UVT-20 M transilluminator (Herolab, Wiesloch, Germany)).

3.7. Western Blot Analysis

Analysis of p16Ink4a expression, cell fractionation, protein separation, and Western blotting were performed as described previously [37]. The following antibodies were used: rabbit anti-p16ink4a (RM267, Sigma Aldrich, Steinheim, Germany) dilution 1:1000, mouse anti-beta actin (Sigma Aldrich, Steinheim, Germany) dilution 1:2000. The anti-mouse IgG (#A0168; 1:10,000) horseradish peroxidase (HRP)-coupled secondary antibody was purchased from Sigma-Aldrich (Steinheim, Germany), and the anti-rabbit IgG (#7074; 1:5000) HRP-linked secondary antibody was obtained from Cell Signaling Technology (Danvers, MA, USA).

3.8. Data Analysis

Melting curves obtained by PCR-HRM were assessed and exported using Rotor-Gene Q Series Software 2.3.1 (Qiagen, Hilden, Germany). PSQ data was evaluated and exported with PyroMark Q24 Advanced software 3.0.0 (Qiagen, Hilden, Germany). Exported data was analyzed and presented graphically using R version 3.6.2 [38]. The R-packages used, including corrplot, ggplot2, and polynom, are listed in the Supplementary Materials R-packages.
For HRM analysis, derivative melting curves were calculated from normalized melting curves by applying Savitzky–Golay filtering for third-degree polynomials.
DNA methylation levels of the promoter region obtained by HRM were calculated from normalized melting curves using temperature-wise calibration as described previously [34]. Polynomial grade 3 calibration functions were calculated from standards with a methylation status of 0–75% for the temperatures 79.6–81–6 °C and applied on normalized fluorescence data from samples.
DNA methylation levels and nucleotide ratios obtained by PSQ ≤ 5.00% (lower limit of quantification, LLOQ) and ≥95.00% (upper limit of quantification, ULOQ) were substituted with default values, namely 2.50% and 97.50%, respectively [39].

4. Conclusions

In this study, we established a novel strategy to reliably determine the methylation status of CDKN2A exon 2 despite its high sequence similarity with CDKN2B. The target region for CDKN2A and CDKN2B was co-amplified using a novel primer set. By evaluating the ratio of CDKN2A and CDKN2B products, DNA methylation levels for CDKN2A exon 2 could be determined accurately.
This approach was successfully applied to a panel of breast cancer and glioma cell lines, revealing diverse genetic and epigenetic alterations of CDKN2A. In particular, we identified homozygous deletions, transcript-specific expression patterns, and instances of exon 2 skipping. Our findings underscore the complexity of CDKN2A regulation in cancer and demonstrate that neither promoter nor exon 2 methylation alone is predictive of gene expression. Importantly, the lack of consistent subtype-specific methylation patterns in breast cancer cell lines highlights the need for a deeper understanding of CDKN2A silencing mechanisms. This method can support future studies aiming to dissect the functional consequences of CDKN2A alterations in various tumor types.

Supplementary Materials

The following supporting information can be downloaded at: https://www.mdpi.com/article/10.3390/ijms26136128/s1.

Author Contributions

Conceptualization: K.Z., P.H. and M.C.-M.; methodology, investigation, and validation: K.Z., A.J., D.B. and L.U.; writing—original draft preparation: K.Z. and M.C.-M.; writing—review and editing: K.Z. and M.C.-M.; visualization: K.Z.; funding acquisition: M.C.-M. All authors have read and agreed to the published version of the manuscript.

Funding

This research received no external funding. This article was supported by the Open-Access Publishing Fund of the University of Vienna.

Institutional Review Board Statement

The study was conducted in accordance with the Declaration of Helsinki and approved by the Ethics Commission of the Faculty of Medicine at the Johannes Kepler University Linz (application number E-39-15, approval date 15 May 2019).

Informed Consent Statement

Informed consent was obtained from all subjects involved in the study.

Data Availability Statement

All data generated during this study are included in this published article. Further inquiries can be directed to the corresponding author.

Acknowledgments

We acknowledge Sabine Spiegl-Kreinecker for providing DNA extracts from primary cell lines of glioma patients.

Conflicts of Interest

The authors declare no conflicts of interest.

References

  1. Malumbres, M.; Barbacid, M. Cell cycle, CDKs and cancer: A changing paradigm. Nat. Rev. Cancer 2009, 9, 153–166. [Google Scholar] [CrossRef] [PubMed]
  2. Labuhn, M.; Jones, G.; Speel, E.J.M.; Maier, D.; Zweifel, C.; Gratzl, O.; Van Meir, E.G.; Hegi, M.E.; Merlo, A. Quantitative real-time PCR does not show selective targeting of p14ARF but concomitant inactivation of both p16INK4A and p14ARF in 105 human primary gliomas. Oncogene 2001, 20, 1103–1109. [Google Scholar] [CrossRef]
  3. Aftab, A.; Shahzad, S.; Hussain, H.M.J.; Khan, R.; Irum, S.; Tabassum, S. CDKN2A/P16INK4A variants association with breast cancer and their in-silico analysis. Breast Cancer 2019, 26, 11–28. [Google Scholar] [CrossRef] [PubMed]
  4. Shapiro, G.I.; Park, J.E.; Edwards, C.D.; Mao, L.; Rollins, B.J.; Sidransky, D.; Ewen, M.E. Multiple Mechanisms of p16INK4A Inactivation in Non-Small Cell Lung Cancer Cell Lines. Cancer Res. 1995, 55, 6200–6209. [Google Scholar]
  5. Sharpless, N.E. INK4a/ARF: A multifunctional tumor suppressor locus. Mutat. Res. 2005, 576, 22–38. [Google Scholar] [CrossRef]
  6. Okamoto, A.; Demetrick, D.J.; Spillare, E.A.; Hagiwara, K.; Hussain, S.P.; Bennett, W.P.; Forrester, K.; Gerwin, B.; Serrano, M.; Beach, D.H.; et al. Mutations and altered expression of p16INK4 in human cancer. Proc. Natl. Acad. Sci. USA 1994, 91, 11045–11049. [Google Scholar] [CrossRef] [PubMed]
  7. Mitomi, H.; Fukui, N.; Tanaka, N.; Kanazawa, H.; Saito, T.; Matsuoka, T.; Yao, T. Aberrant p16INK4a methylation is a frequent event in colorectal cancers: Prognostic value and relation to mRNA expression and immunoreactivity. J. Cancer Res. Clin. Oncol. 2010, 136, 323–331. [Google Scholar] [CrossRef]
  8. Bhagat, R.; Kumar, S.S.; Vaderhobli, S.; Premalata, C.S.; Pallavi, V.R.; Ramesh, G.; Krishnamoorthy, L. Epigenetic alteration of p16 and retinoic acid receptor beta genes in the development of epithelial ovarian carcinoma. Tumor Biol. 2014, 35, 9069–9078. [Google Scholar] [CrossRef]
  9. Woodcock, D.M.; Linsenmeyer, M.E.; Doherty, J.P.; Warren, W.D. DNA methylation in the promoter region of the p16 (CDKN2/MTS-1/INK4A) gene in human breast tumours. Br. J. Cancer 1999, 79, 251–256. [Google Scholar] [CrossRef]
  10. Krassenstein, R.; Sauter, E.; Dulaimi, E.; Battagli, C.; Ehya, H.; Klein-Szanto, A.; Cairns, P. Detection of Breast Cancer in Nipple Aspirate Fluid by CpG Island Hypermethylation. Clin. Cancer Res. 2004, 10, 28–32. [Google Scholar] [CrossRef]
  11. Sinha, S.; Chunder, N.; Mukherjee, N.; Alam, N.; Roy, A.; Roychoudhury, S.; Kumar Panda, C. Frequent deletion and methylation in SH3GL2 and CDKN2A loci are associated with early- and late-onset breast carcinoma. Ann. Surg. Oncol. 2008, 15, 1070–1080. [Google Scholar] [CrossRef]
  12. Tao, M.H.; Shields, P.G.; Nie, J.; Millen, A.; Ambrosone, C.B.; Edge, S.B.; Krishnan, S.S.; Marian, C.; Xie, B.; Winston, J.; et al. DNA hypermethylation and clinicopathological features in breast cancer: The Western New York Exposures and Breast Cancer (WEB) Study. Breast Cancer Res. Treat. 2009, 114, 559–568. [Google Scholar] [CrossRef] [PubMed]
  13. Askari, M.; Sobti, R.C.; Nikbakht, M.; Sharma, S.C. Promoter hypermethylation of tumour suppressor genes (p14/ARF and p16/INK4a): Case-control study in North Indian population. Mol. Biol. Rep. 2013, 40, 4921–4928. [Google Scholar] [CrossRef]
  14. Di Vinci, A.; Perdelli, L.; Banelli, B.; Salvi, S.; Casciano, I.; Gelvi, I.; Allemanni, G.; Margallo, E.; Gatteschi, B.; Romani, M. p16INK4a promoter methylation and protein expression in breast fibroadenoma and carcinoma. Int. J. Cancer 2005, 114, 414–421. [Google Scholar] [CrossRef] [PubMed]
  15. Kempster, S.; Phillips, W.A.; Baindur-Hudson, S.; Thomas, R.J.S.; Dow, C.; Rockman, S.P. Methylation of exon 2 of p16 is associated with late stage oesophageal cancer. Cancer Lett. 2000, 150, 57–62. [Google Scholar] [CrossRef]
  16. Spitzwieser, M.; Entfellner, E.; Werner, B.; Pulverer, W.; Pfeiler, G.; Hacker, S.; Cichna-Markl, M. Hypermethylation of CDKN2A exon 2 in tumor, tumor-adjacent and tumor-distant tissues from breast cancer patients. BMC Cancer 2017, 17, 260. [Google Scholar] [CrossRef] [PubMed]
  17. Genbank. Available online: https://www.ncbi.nlm.nih.gov/nucleotide/ (accessed on 20 February 2025).
  18. Zappe, K.; Pirker, C.; Miedl, H.; Schreiber, M.; Heffeter, P.; Pfeiler, G.; Hacker, S.; Haslik, W.; Spiegl-Kreinecker, S.; Cichna-Markl, M. Discrimination between 34 of 36 possible combinations of three C>T SNP genotypes in the MGMT promoter by high resolution melting analysis coupled with pyrosequencing using a single primer set. Int. J. Mol. Sci. 2021, 22, 12527. [Google Scholar] [CrossRef]
  19. Appay, R.; Dehais, C.; Maurage, C.-A.; Alentorn, A.; Carpentier, C.; Colin, C.; Ducray, F.; Escande, F.; Idbaih, A.; Kamoun, A.; et al. CDKN2A homozygous deletion is a strong adverse prognosis factor in diffuse malignant IDH-mutant gliomas. Neuro-Oncol. 2019, 21, 1519–1528. [Google Scholar] [CrossRef]
  20. Lu, V.M.; O’Connor, K.P.; Shah, A.H.; Eichberg, D.G.; Luther, E.M.; Komotar, R.J.; Ivan, M.E. The prognostic significance of CDKN2A homozygous deletion in IDH-mutant lower-grade glioma and glioblastoma: A systematic review of the contemporary literature. J. Neuro-Oncol. 2020, 148, 221–229. [Google Scholar] [CrossRef]
  21. Noack, D.; Wach, J.; Barrantes-Freer, A.; Nicolay, N.H.; Güresir, E.; Seidel, C. Homozygous CDKN2A/B deletions in low- and high-grade glioma: A meta-analysis of individual patient data and predictive values of p16 immunohistochemistry testing. Acta Neuropathol. Commun. 2024, 12, 180. [Google Scholar] [CrossRef]
  22. Wang, J.; Xi, Y.F.; Zhao, Q.; Guo, J.-h.; Zhang, Z.; Zhang, M.-b.; Chang, J.; Wu, Y.-q.; Su, W. CDKN2A promoter methylation enhances self-renewal of glioblastoma stem cells and confers resistance to carmustine. Mol. Biol. Rep. 2024, 51, 385. [Google Scholar] [CrossRef] [PubMed]
  23. Lebok, P.; Roming, M.; Kluth, M.; Koop, C.; Özden, C.; Taskin, B.; Hussein, K.; Lebeau, A.; Witzel, I.; Wölber, L.; et al. p16 overexpression and 9p21 deletion are linked to unfavorable tumor phenotype in breast cancer. Oncotarget 2016, 7, 81322–81331. [Google Scholar] [CrossRef]
  24. Hui, R.; Macmillan, R.D.; Kenny, F.S.; Musgrove, E.A.; Blamey, R.W.; Nicholson, R.I.; Robertson, J.F.R.; Sutherland, R.L. INK4a gene expression and methylation in primary breast cancer: Overexpression of p16INK4a messenger RNA is a marker of poor prognosis. Clin. Cancer Res. 2000, 6, 2777–2787. [Google Scholar]
  25. ATCC. American Type Culture Collection. Available online: https://www.atcc.org/ (accessed on 20 February 2025).
  26. ShahidSales, S.; Mehramiz, M.; Ghasemi, F.; Aledavood, A.; Shamsi, M.; Hassanian, S.M.; Ghayour-Mobarhan, M.; Avan, A. A genetic variant in CDKN2A/B gene is associated with the increased risk of breast cancer. J. Clin. Lab. Anal. 2018, 32, e22190. [Google Scholar] [CrossRef]
  27. Seifi, S.; Pouya, F.; Rahmani, M.; Mehramiz, M.; Rastgar-Moghadam, A.; Gharib, M.; Rahmani, F.; Shahidsales, S.; Hassanian, S.M.; Khazaei, M.; et al. Association of cyclin-dependent kinase inhibitor 2A/B with increased risk of developing breast cancer. J. Cell Physiol. 2020, 235, 5141–5145. [Google Scholar] [CrossRef]
  28. Krimpenfort, P.; Ijpenberg, A.; Song, J.-Y.; Van Der Valk, M.; Nawijn, M.; Zevenhoven, J.; Berns, A. p15Ink4b is a critical tumour suppressor in the absence of p16Ink4a. Nature 2007, 448, 943–946. [Google Scholar] [CrossRef] [PubMed]
  29. Holm, K.; Hegardt, C.; Staaf, J.; Vallon-Christersson, J.; Jönsson, G.; Olsson, H.; Borg, Å.; Ringnér, M. Molecular subtypes of breast cancer are associated with characteristic DNA methylation patterns. Breast Cancer Res. 2010, 12, R36. [Google Scholar] [CrossRef] [PubMed]
  30. Bediaga, N.G.; Acha-Sagredo, A.; Guerra, I.; Viguri, A.; Albaina, C.; Ruiz Diaz, I.; Rezola, R.; Alberdi, M.J.; Dopazo, J.; Montaner, D.; et al. DNA methylation epigenotypes in breast cancer molecular subtypes. Breast Cancer Res. 2010, 12, R77. [Google Scholar] [CrossRef]
  31. Mohanad, M.; Hamza, H.M.; Bahnassy, A.A.; Shaarawy, S.; Ahmed, O.; El-Mezayen, H.A.; Ayad, E.G.; Tahoun, N.; Abdellateif, M.S. Molecular profiling of breast cancer methylation pattern in triple negative versus non- triple negative breast cancer. Sci. Rep. 2025, 15, 6894. [Google Scholar] [CrossRef]
  32. Spiegl-Kreinecker, S.; Pirker, C.; Marosi, C.; Buchroithner, J.; Pichler, J.; Silye, R.; Fischer, J.; Micksche, M.; Berger, W. Dynamics of chemosensitivity and chromosomal instability in recurrent glioblastoma. Br. J. Cancer 2007, 96, 960–969. [Google Scholar] [CrossRef]
  33. James Kent, W.; Sugnet, C.W.; Furey, T.S.; Roskin, K.M.; Pringle, T.H.; Zahler, A.M.; Haussler, D. The human genome browser at UCSC. Genome Res. 2002, 12, 996–1006. [Google Scholar] [CrossRef] [PubMed]
  34. Zappe, K.; Cichna-Markl, M. Temperature-Wise Calibration Increases the Accuracy of DNA Methylation Levels Determined by High-Resolution Melting (HRM). Int. J. Mol. Sci. 2024, 25, 5082. [Google Scholar] [CrossRef] [PubMed]
  35. Zappe, K.; Pühringer, K.; Pflug, S.; Berger, D.; Böhm, A.; Spiegl-Kreinecker, S.; Cichna-Markl, M. Association between MGMT Enhancer Methylation and MGMT Promoter Methylation, MGMT Protein Expression, and Overall Survival in Glioblastoma. Cells 2023, 12, 1639. [Google Scholar] [CrossRef] [PubMed]
  36. Untergasser, A.; Nijveen, H.; Rao, X.; Bisseling, T.; Geurts, R.; Leunissen, J.A.M. Primer3Plus, an enhanced web interface to Primer3. Nucleic Acids Res. 2007, 35, W71–W74. [Google Scholar] [CrossRef]
  37. Berger, W.; Elbling, L.; Micksche, M. Expression of the major vault protein LRP in human non-small-cell lung cancer cells: Activation by short-term exposure to antineoplastic drugs. Int. J. Cancer 2000, 88, 293–300. [Google Scholar] [CrossRef]
  38. R Core Team, R. R: A Language and Environment for Statistical Computing. Available online: https://www.R-project.org/ (accessed on 20 February 2025).
  39. Assigning Values to Non-Detected/Non-Quantified Pesticide Residues in Human Health Food Exposure Assessments; Office of Pesticide Programs, US Environmental Protection Agency: Washington, DC, USA, 2000.
Figure 1. Chromosome 9 upper strand showing the CDKN2A (blue) and CDKN2B (orange) locus and the respective transcripts. For DNA methylation analysis, the seven CpGs directly upstream of exon 1α in the CDKN2AINK4a promoter and 24 CpGs of CDKN2A exon 2/21 CpGs of CDKN2B exon 2 were targeted. Pink vertical lines indicate CpG positions. PCR primers are indicated by upper horizontal bars (promoter: dark purple, exon 2: dark pink) and sequencing primers by lower bars (promoter: light purple, exon 2: light pink; arrow shows the sequencing direction). Differences between CDKN2A and CDKN2B exon 2 in the target region are highlighted by squares (cyan); three of them are also mispriming sites of CDKN2B for the reverse primer (highlighted). Black arrows show the three genomic positions allowing quantification of CDKN2A and CDKN2B PCR products by PSQ. Transcripts: horizontal bars show their exon composition, light red arrows translation starts, and light red box the coding sequence (CDS). The representation of chromosome 9, including the CDKN2A/CDKN2B transcript location, was taken from NCBI Genome Data Viewer [17], GRCh38.p14 primary assembly. The CpG line schemes were generated using Methyl Primer Express Software v1.0 (Thermo Fisher Scientific) and adapted manually.
Ijms 26 06128 g001
Figure 2. Sequence alignment of the bisulfite converted lower strand of chromosome 9 CDKN2A exon 2 (black), plus 50 bp up- and downstream (gray), respectively, with CDKN2B, using NCBI blastn. Alignment was annotated using coordinates from GRCh38.p14 primary assembly and highlighted manually. CpGs (pink; numbered according to their position in CDKN2A exon 2). PCR primers are indicated by dotted horizontal lines, sequencing primers by straight horizontal lines. C-to-T transitions affecting CpGs are indicated by dashed vertical lines. Bases specific for CDKN2A and CDKN2B are highlighted in blue and orange, respectively.
Ijms 26 06128 g002
Figure 3. Verification of the formation of correct PCR products. (a) Agarose gel indicating that PCR products obtained for CDKN2A/CDKN2B exon 2 and CDKN2AINK4a promoter had the expected length. (b) Negative derivative of normalized HRM curves obtained for DNA standards (0%, 100% methylated) and mixtures thereof. Target region: CDKN2A/CDKN2B exon 2. Vertical dotted lines indicate the distinct melting temperatures. Together with data from PSQ, melting temperatures from left to right were assigned to unmethylated CDKN2B exon 2 (80.4 °C) and CDKN2A exon 2 (81.4 °C) alleles present in the 0–75% standards and fully methylated CDKN2A exon 2 (85.8 °C) alleles in the 25–100% standards. NTC: no template control; standards (std): non-methylated (0%) DNA, methylated (100%) DNA, and 25%, 50%, and 75% mixtures thereof.
Ijms 26 06128 g003
Figure 4. Representative pyrograms for the methylated (100%) DNA standard. (a) CDKN2AINK4a promoter CpGs 1–7 and (b,c) CDKN2A/CDKN2B exon 2 with (b) sequencing primer 1, targeting CpGs 1–24/CpGs 1–21, and (c) sequencing primer 2, targeting CpGs 15–24/CpGs 12–21. Peaks highlighted in blue–grey indicate the position to analyze; grey bars represent the expected heights according to the dispensation order (histogram). Nucleotide frequencies are shown above the respective position to analyze. Blue, yellow, and red colors indicate the quality of the result (blue: passed, yellow: check, red: failed).
Ijms 26 06128 g004
Figure 5. Translation of the position to analyze from pyrograms for CDKN2A/CDKN2B exon 2 (a) with sequencing primer 1 targeting CpGs 1–24/CpGs 1–21 and (b) with sequencing primer 2 targeting CpGs 15–24/CpGs 12–21 to the respective CpG (methylation shown above the region highlighted in brown or specific bases of CDKN2A (blue) and CDKN2B (orange)). Peak heights obtained from PSQ were plotted against the dispensation order and number of nucleotides incorporated. Data shown for the methylated (100%) standard.
Ijms 26 06128 g005
Figure 6. CDKN2A/CDKN2B exon 2 methylation levels of DNA standards sorted by their expected methylation status. DNA standards (std): non-methylated (0%) DNA, methylated (100%) DNA, and 25%, 50%, and 75% mixtures thereof. (a) Methylation status of the respective variable position (pos) in the pyrogram was assigned to the respective CpGs/alternative nucleotides. (b) Resulting heatmap for CDKN2A/CDKN2B exon 2 showing the specific methylation levels. n.a.: not analyzable due to simultaneous measurement of CDKN2A and CDKN2B. Specific positions for CDKN2A (blue frames) and CDKN2B (orange frames); for alternative nucleotides (lighter color) and CpGs (darker color). DNA methylation levels of specific CpGs were manually corrected by the proportion of CDKN2A/CDKN2B exon 2. Positions (ocher frame) were adjusted manually due to alternative T nucleotides.
Ijms 26 06128 g006
Figure 7. Lower strand showing the PCR products for the different transcript variants obtained with primer sets 1–6 (left to right). Bar colors symbolize the corresponding exons. The specific binding sites for exon–exon boundary-specific primer sets 1–3 (Table 2) and for primer sets 4–6 not targeting exons (Table 3) are shown below the transcript bars in the same color as the exon site. 5′-end of forward primer from primer set 1 targeting the CDKN2A exon 1α–exon 2 boundary is mispriming (dark blue) with CDKN2B exon 1a.
Ijms 26 06128 g007
Figure 8. Heatmap for the CDKN2AINK4a promoter (HRM) and CDKN2A/CDKN2B exon 2 (PSQ) methylation levels of primary cell lines. —not present/detected; n.a.: not analyzable due to simultaneous determination of methylation levels of CDKN2A and CDKN2B.
Ijms 26 06128 g008
Figure 9. Heatmap for the CDKN2AINK4a promoter and CDKN2A/CDKN2B exon 2 methylation levels of commercial cell lines (a) CDKN2A, (b) CDKN2B. (c) Gene expression of CDKN2A and CDKN2B transcripts as well as p16INK4a protein expression determined by (e) Western blotting. (d) Negative derivative of normalized HRM curves for CDKN2A/CDKN2B exon 2 methylation. —not present/detected, intensity of expression from + to +++. n.a.: not analyzable due to simultaneous determination of methylation levels of CDKN2A and CDKN2B.
Ijms 26 06128 g009
Figure 10. Identification of CDKN2AINK4a/CDKN2BINK4b transcripts by (af) agarose gel electrophoresis and melt curve analysis in commercial cell lines by applying different primer sets. Dotted lines: melting temperatures. The expected product length is shown on the right of the gel.
Ijms 26 06128 g010
Disclaimer/Publisher’s Note: The statements, opinions and data contained in all publications are solely those of the individual author(s) and contributor(s) and not of MDPI and/or the editor(s). MDPI and/or the editor(s) disclaim responsibility for any injury to people or property resulting from any ideas, methods, instructions or products referred to in the content.