
Untargeted Metabolomics to Harness Ideal Protein Concept and Mitigate Environmental Impact in Rabbit Models

 ,
, 
 ,
,  ,
,  and
and 
Abstract
1. Introduction
2. Results
3. Discussion
4. Materials and Methods
4.1. Animal Ethics Statement
4.2. Experimental Diets
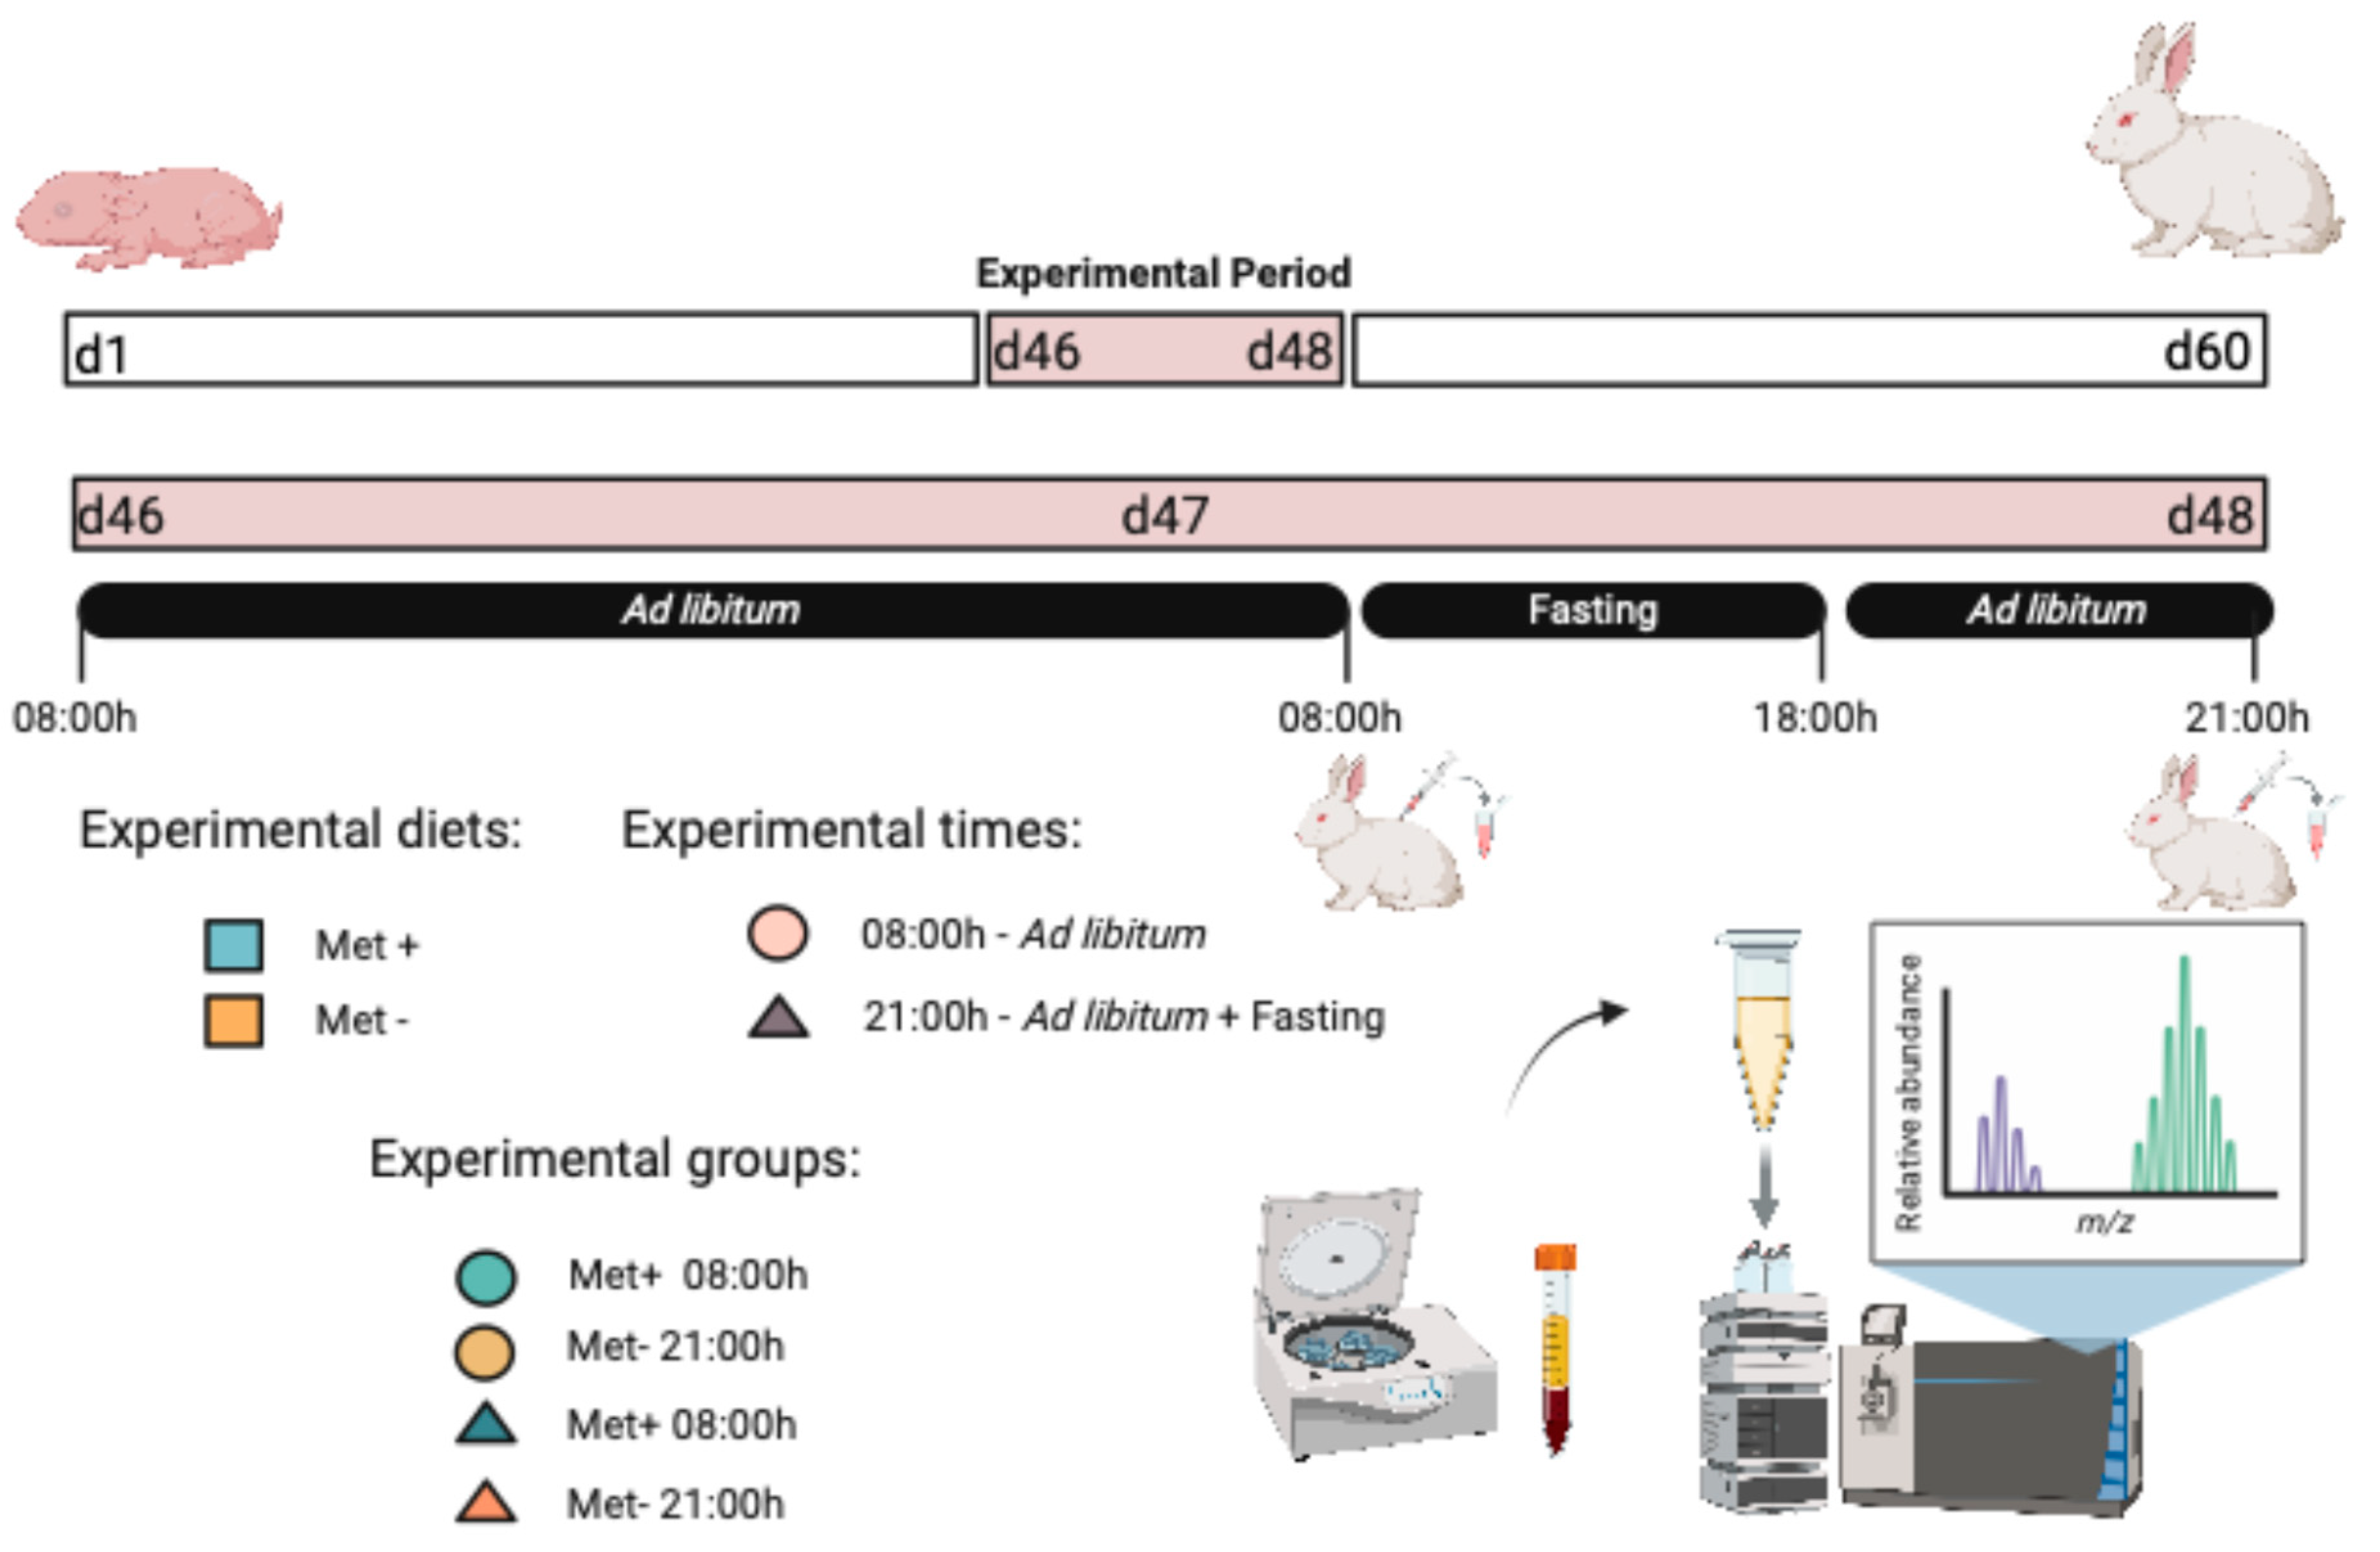
4.3. Experimental Design
4.4. Chemical Analysis
4.5. LC-MS Metabolomics Analysis of Plasma
4.5.1. Chemical Solvents and Standards for Metabolomics Analysis
4.5.2. Sample Preparation and LC-MS Analysis
4.5.3. Sample Quality Control and Metabolomics Data Pre-Processing
4.5.4. Metabolite Identification
4.5.5. Metabolites Statistical Analysis
5. Conclusions
Author Contributions
Funding
Institutional Review Board Statement
Data Availability Statement
Conflicts of Interest
Abbreviations
| AA | Amino acid |
| LC−MS | liquid chromatography−mass spectrometry |
| PCA | principal component analysis |
| PLS-DA | partial least-squares discriminant analysis |
| ACN | acetonitrile |
| IS | internal standards |
| HPLC | high-performance liquid chromatography |
| m/z | mass to charge ratio |
| QC | quality control |
| LPCs | lysophosphatidylcholines |
References
- Velthof, G.L.; Hou, Y.; Oenema, O. Nitrogen excretion factors of livestock in the European Union: A review: Nitrogen excretion factors of livestock in EU. J. Sci. Food Agric. 2015, 95, 3004–3014. [Google Scholar] [CrossRef]
- Ravishankara, A.R.; Daniel, J.S.; Portmann, R.W. Nitrous Oxide (N2O): The Dominant Ozone-Depleting Substance Emitted in the 21st Century. Science 2009, 326, 123–125. [Google Scholar] [CrossRef]
- Webb, J.; Sørensen, P.; Velthof, G.; Amon, B.; Pinto, M.; Rodhe, L.; Salomon, E.; Hutchings, N.; Burczyk, P.; Reid, J. An Assessment of the Variation of Manure Nitrogen Efficiency throughout Europe and an Appraisal of Means to Increase Manure-N Efficiency. In Advances in Agronomy; Elsevier: Amsterdam, The Netherlands, 2013; Volume 119, pp. 371–442. [Google Scholar]
- Langner, J.; Bergström, R.; Foltescu, V. Impact of climate change on surface ozone and deposition of sulphur and nitrogen in Europe. Atmos. Environ. 2005, 39, 1129–1141. [Google Scholar] [CrossRef]
- Van Milgen, J.; Dourmad, J.-Y. Concept and application of ideal protein for pigs. J. Anim. Sci. Biotechnol. 2015, 6, 15. [Google Scholar] [CrossRef]
- Hou, Y.; Bai, Z.; Lesschen, J.P.; Staritsky, I.G.; Sikirica, N.; Ma, L.; Velthof, G.L.; Oenema, O. Feed use and nitrogen excretion of livestock in EU-27. Agric. Ecosyst. Environ. 2016, 218, 232–244. [Google Scholar] [CrossRef]
- Matsumoto, S.; Häberle, J.; Kido, J.; Mitsubuchi, H.; Endo, F.; Nakamura, K. Urea cycle disorders—Update. J. Hum. Genet. 2019, 64, 833–847. [Google Scholar] [CrossRef] [PubMed]
- Marín-García, P.J.; Ródenas, L.; Martínez-Paredes, E.; Cambra-López, M.; Blas, E.; Pascual, J. A moderate protein diet does not cover the requirements of growing rabbits with high growth rate. Anim. Feed. Sci. Technol. 2020, 264, 114495. [Google Scholar] [CrossRef]
- Emmert, J.L.; Baker, D.H. Use of the Ideal Protein Concept for Precision Formulation of Amino Acid Levels in Broiler Diets. J. Appl. Poult. Res. 1997, 6, 462–470. [Google Scholar] [CrossRef]
- Puntmann, V.O. How-to guide on biomarkers: Biomarker definitions, validation and applications with examples from cardiovascular disease. Postgrad. Med. J. 2009, 85, 538–545. [Google Scholar] [CrossRef]
- Esko, T.; Hirschhorn, J.N.; AFeldman, H.; Hsu, Y.-H.H.; ADeik, A.; Clish, C.B.; Ebbeling, C.B.; Ludwig, D.S. Metabolomic profiles as reliable biomarkers of dietary composition. Am. J. Clin. Nutr. 2017, 105, 547–554. [Google Scholar] [CrossRef]
- Playdon, M.C.; Moore, S.C.; Derkach, A.; Reedy, J.; Subar, A.F.; Sampson, J.N.; Albanes, D.; Gu, F.; Kontto, J.; Lassale, C.; et al. Identifying biomarkers of dietary patterns by using metabolomics. Am. J. Clin. Nutr. 2017, 105, 450–465. [Google Scholar] [CrossRef] [PubMed]
- Marín-García, P.J.; López-Luján, M.C.; Ródenas, L.; Martínez-Paredes, E.M.; Blas, E.; Pascual, J.J. Plasmatic Urea Nitrogen in Growing Rabbits with Different Combinations of Dietary Levels of Lysine, Sulphur Amino Acids and Threonine. Animals 2020, 10, 946. [Google Scholar] [CrossRef] [PubMed]
- Marín-García, P.J.; López-Luján, M.d.C.; Ródenas, L.; Martínez-Paredes, E.M.; Blas, E.; Pascual, J.J. Plasma urea nitrogen as an indicator of amino acid imbalance in rabbit diets. World Rabbit. Sci. 2020, 28, 63. [Google Scholar] [CrossRef]
- Marín-García, P.J.; Llobat, L.; López-Lujan, M.C.; Cambra-López, M.; Blas, E.; Pascual, J.J. Urea Nitrogen Metabolite Can Contribute to Implementing the Ideal Protein Concept in Monogastric Animals. Animals 2022, 12, 2344. [Google Scholar] [CrossRef]
- He, Q.; Kong, X.; Wu, G.; Ren, P.; Tang, H.; Hao, F.; Huang, R.; Li, T.; Tan, B.; Li, P.; et al. Metabolomic analysis of the response of growing pigs to dietary l-arginine supplementation. Amino Acids 2009, 37, 199–208. [Google Scholar] [CrossRef]
- Marín-García, P.J.; Llobat, L.; Cambra-López, M.; Blas, E.; Larsen, T.; Pascual, J.J.; Hedemann, M.S. Biomarkers for ideal protein: Rabbit diet metabolomics varying key amino acids. Commun. Biol. 2024, 7, 712. [Google Scholar] [CrossRef]
- Marín-García, P.J.; Piles, M.; Sánchez, J.P.; Pascual, M.; Llobat, L.; Pascual, J.J.; Hedemann, M.S. Untargeted urine metabolomics suggests that ascorbic acid may serve as a promising biomarker for reduced feed intake in rabbits. Sci. Rep. 2024, 14, 29180. [Google Scholar] [CrossRef]
- Taboada, E.; Mendez, J.; De Blas, J. The response of highly productive rabbits to dietary sulphur amino acid content for reproduction and growth. Reprod. Nutr. Dev. 1996, 36, 191–203. [Google Scholar] [CrossRef]
- Berchiche, M.; Lebas, F. Supplémentation en Méthionine dun aliment a base de féverole: Effets sur la croissance, le rendement a l’abattage et la composition de la carcasse chez le lapin. World Rabbit. Sci. 2010, 2, 135–140. [Google Scholar] [CrossRef]
- Adamson, I.; Fisher, H. Amino Acid Requirement of the Growing Rabbit: An Estimate of Quantitative Needs. J. Nutr. 1973, 103, 1306–1310. [Google Scholar] [CrossRef]
- Marín-García, P.J.; López-Luján, M.C.; Ródenas, L.; Martínez-Paredes, E.; Cambra-López, M.; Blas, E.; Pascual, J.J. Do Growing Rabbits with a High Growth Rate Require Diets with High Levels of Essential Amino Acids? A Choice-Feeding Trial. Animals 2021, 11, 824. [Google Scholar] [CrossRef] [PubMed]
- Wang, H.; Ren, E.; Xiang, X.; Su, Y.; Zhu, W. Dynamic Changes in Serum Metabolomic Profiles of Growing Pigs Induced by Intravenous Infusion of Sodium Butyrate. Metabolites 2020, 10, 20. [Google Scholar] [CrossRef] [PubMed]
- Liu, H.; Chen, Y.; Wang, W.; Jiang, Z.; Ma, X.; Wang, F. Comparison of Global Metabolite for Growing Pigs Fed at Metabolizable Energy Requirement for Maintenance. Front. Vet. Sci. 2022, 9, 917033. [Google Scholar] [CrossRef]
- Metzler-Zebeli, B.U.; Siegerstetter, S.-C.; Magowan, E.; Lawlor, P.G.; O’connell, N.E.; Zebeli, Q. Feed Restriction Reveals Distinct Serum Metabolome Profiles in Chickens Divergent in Feed Efficiency Traits. Metabolites 2019, 9, 38. [Google Scholar] [CrossRef]
- Katafuchi, A.; Shimamoto, S.; Kawaguchi, M.; Tomonaga, S.; Nakashima, K.; Ishihara, S.; Ohtsuka, A.; Ijiri, D. Effects of Delaying Post-hatch Feeding on the Plasma Metabolites of Broiler Chickens Revealed by Targeted and Untargeted Metabolomics. J. Poult. Sci. 2023, 60, 2023032. [Google Scholar] [CrossRef]
- Triba, M.N.; Le Moyec, L.; Amathieu, R.; Goossens, C.; Bouchemal, N.; Nahon, P.; Rutledge, D.N.; Savarin, P. PLS/OPLS models in metabolomics: The impact of permutation of dataset rows on the K-fold cross-validation quality parameters. Mol. BioSyst. 2015, 11, 13–19. [Google Scholar] [CrossRef]
- Wang, Y.; Xu, H.; Sun, G.; Xue, M.; Sun, S.; Huang, T.; Zhou, J.; Loor, J.J.; Li, M. Transcriptome Analysis of the Effects of Fasting Caecotrophy on Hepatic Lipid Metabolism in New Zealand Rabbits. Animals 2019, 9, 648. [Google Scholar] [CrossRef]
- Li, R.; Li, X.; Huang, T.; Wang, Y.; Xue, M.; Sun, S.; Yan, D.; Song, G.; Sun, G.; Li, M. Influence of cecotrophy on fat metabolism mediated by caecal microorganisms in New Zealand white rabbits. Anim. Physiol. Nutr. 2020, 104, 749–757. [Google Scholar] [CrossRef] [PubMed]
- Bellier, R.; Gidenne, T.; Vernay, M.; Colin, M. In vivo study of circadian variations of the cecal fermentation pattern in postweaned and adult rabbits. J. Anim. Sci. 1995, 73, 128. [Google Scholar] [CrossRef]
- Prud’Hon, M.; Chérubin, M.; Goussopoulos, J.; Carles, Y. Évolution, au cours de la croissance, des caractéristiques de la consommation d’aliments solide et liquide du lapin domestique nourri ad libitum. Ann. Zootech. 1975, 24, 289–298. [Google Scholar] [CrossRef]
- Hirakawa, H. Coprophagy in leporids and other mammalian herbivores. Mammal Rev. 2001, 31, 61–80. [Google Scholar] [CrossRef]
- Wang, Z.; He, H.; Chen, M.; Ni, M.; Yuan, D.; Cai, H.; Chen, Z.; Li, M.; Xu, H. Impact of coprophagy prevention on the growth performance, serum biochemistry, and intestinal microbiome of rabbits. BMC Microbiol. 2023, 23, 125. [Google Scholar] [CrossRef] [PubMed]
- Martínez-Reyes, I.; Chandel, N.S. Mitochondrial TCA cycle metabolites control physiology and disease. Nat. Commun. 2020, 11, 102. [Google Scholar] [CrossRef]
- Romero, C.G.; Rebollar, P.; Dal Bosco, A.; Castellini, C.; Cardinali, R. Dietary effect of short-chain organic acids on growth performance, mortality and development of intestinal lymphoid tissues in young non-medicated rabbits. World Rabbit. Sci. 2011, 19, 133–142. [Google Scholar] [CrossRef]
- Smith, A.H.; Meyer, C.E. The influence of diet on the endogenous production of citric acid. J. Biol. Chem. 1939, 131, 45–55. [Google Scholar] [CrossRef]
- Lillefosse, H.H.; Clausen, M.R.; Yde, C.C.; Ditlev, D.B.; Zhang, X.; Du, Z.Y.; Bertram, H.C.; Madsen, L.; Kristiansen, K.; Liaset, B. Urinary Loss of Tricarboxylic Acid Cycle Intermediates As Revealed by Metabolomics Studies: An Underlying Mechanism to Reduce Lipid Accretion by Whey Protein Ingestion? J. Proteome Res. 2014, 13, 2560–2570. [Google Scholar] [CrossRef]
- Axelrod, D.R. Ascorbic Acid and Urinary pH. JAMA 1985, 254, 1310. [Google Scholar] [CrossRef]
- Gabriele, S.; Sacco, R.; Altieri, L.; Neri, C.; Urbani, A.; Bravaccio, C.; Riccio, M.P.; Iovene, M.R.; Bombace, F.; De Magistris, L.; et al. Slow intestinal transit contributes to elevate urinary p -cresol level in I talian autistic children. Autism Res. 2016, 9, 752–759. [Google Scholar] [CrossRef]
- Gidenne, T.; Feugier, A. Feed restriction strategy in the growing rabbit. 1. Impact on digestion, rate of passage and microbial activity. Animal 2009, 3, 501–508. [Google Scholar] [CrossRef]
- Roager, H.M.; Hansen, L.B.S.; Bahl, M.I.; Frandsen, H.L.; Carvalho, V.; Gøbel, R.J.; Dalgaard, M.D.; Plichta, D.R.; Sparholt, M.H.; Vestergaard, H.; et al. Colonic transit time is related to bacterial metabolism and mucosal turnover in the gut. Nat. Microbiol. 2016, 1, 16093. [Google Scholar] [CrossRef]
- Cummings, J.; Hill, M.; Bone, E.; Branch, W.; Jenkins, D.J.A. The effect of meat protein and dietary fiber on colonic function and metabolism II. Bacterial metabolites in feces and urine. Am. J. Clin. Nutr. 1979, 32, 2094–2101. [Google Scholar] [CrossRef] [PubMed]
- Letertre, M.P.; Myridakis, A.; Whiley, L.; Camuzeaux, S.; Lewis, M.R.; Chappell, K.E.; Thaikkatil, A.; Dumas, M.-E.; Nicholson, J.K.; Swann, J.R.; et al. A targeted ultra performance liquid chromatography—Tandem mass spectrometric assay for tyrosine and metabolites in urine and plasma: Application to the effects of antibiotics on mice. J. Chromatogr. B 2021, 1164, 122511. [Google Scholar] [CrossRef] [PubMed]
- Portman, O.W.; Alexander, M. Influence of lysophosphatidylcholine on the metabolism of plasma lipoproteins. Biochim. Et. Biophys. Acta (BBA)—Lipids Lipid Metab. 1976, 450, 322–334. [Google Scholar] [CrossRef]
- Simons, K.; Toomre, D. Lipid rafts and signal transduction. Nat. Rev. Mol. Cell Biol. 2000, 1, 31–39. [Google Scholar] [CrossRef] [PubMed]
- Lee, S.H.; Jung, B.H.; Kim, S.Y.; Chung, B.C. A rapid and sensitive method for quantitation of nucleosides in human urine using liquid chromatography/mass spectrometry with direct urine injection. Rapid Commun. Mass. Spectrom. 2004, 18, 973–977. [Google Scholar] [CrossRef]
- Colonna, A.; Russo, T.; Esposito, F.; Salvatore, F.; Cimino, F. Determination of pseudouridine and other nucleosides in human blood serum by high-performance liquid chromatography. Anal. Biochem. 1983, 130, 19–26. [Google Scholar] [CrossRef]
- Hamma, T.; Ferré-D’Amaré, A.R. Pseudouridine Synthases. Chem. Biol. 2006, 13, 1125–1135. [Google Scholar] [CrossRef]
- Brito, A.F.; Zang, Y. A Review of Lignan Metabolism, Milk Enterolactone Concentration, and Antioxidant Status of Dairy Cows Fed Flaxseed. Molecules 2018, 24, 41. [Google Scholar] [CrossRef]
- Marín-García, P.; Llobat, L.; Aguayo-Adán, J.A.; Larsen, T.; Cambra-López, M.; Blas, E.; Pascual, J.J.; Rouco, C. The Nutritional Strategy of European Rabbits Is Affected by Age and Sex: Females Eat More and Have Better Nutrient Optimisation. Anim. Physiol. Nutr. 2023, jpn.13826. [Google Scholar] [CrossRef]
- Marín-García, P.J.; Llobat, L.; Aguayo-Adán, J.A.; Franch, J.; Cambra-López, M.; Blas, E.; Pascual, J.J.; Rouco, C. Nutritional Ecology of European Rabbit ( Oryctolagus Cuniculus ): Factors Affecting Chemical Composition of Gastric Content. Anim. Physiol. Nutr. 2023, jpn.13849. [Google Scholar] [CrossRef]
- Llobat, L.; Marín-García, P.J. Application of Protein Nutrition in Natural Ecosystem Management for European Rabbit (Oryctolagus Cuniculus) Conservation. Biodivers Conserv 2022, 31, 1435–1444. [Google Scholar] [CrossRef]
- Boletín Oficial del Estado. Real Decreto 53/2013, por el que se establecen las normas básicas aplicables para la protección de los animales utilizados en experimentación y otros fines científicos, incluyendo la docencia. BOE 2013, 34, 11370–11421. [Google Scholar]
- Marín-García, P.J.; Ródenas, L.; Martínez-Paredes, E.; Moya, V.J.; Cambra-López, M.; Blas, E.; Pascual, J.J. Effect of Increasing the Methionine Level and Reducing the Threonine Level in the Diet of Fast-Growing Rabbits. Animals 2023, 13, 1471. [Google Scholar] [CrossRef] [PubMed]
- AOAC International. Official Methods of Analysis of the Association of Official Analytical Chemists. AOAC International: Rockville, MD, USA, 2000. [Google Scholar]
- Batey, I.L. Starch Analysis Using Thermostable alpha-Amylases. Starch/Stärke 1982, 34, 125–128. [Google Scholar] [CrossRef]
- Mertens, D.R. Gravimetric determination of amylase-treated neutral detergent fibre in feed with refluxing beakers or crucibles: Collaborative study. J. AOAC Int. 2002, 85, 1217–1240. [Google Scholar] [CrossRef]
- Van Soest, P.J.; Robertson, J.B.; Lewis, B.A. Methods for Dietary Fiber, Neutral Detergent Fiber, and Nonstarch Polysaccharides in Relation to Animal Nutrition. J. Dairy. Sci. 1991, 74, 3583–3597. [Google Scholar] [CrossRef]
- Bosch, L.; Alegría, A.; Farré, R. Application of the 6-aminoquinolyl-N-hydroxysccinimidyl carbamate (AQC) reagent to the RP-HPLC determination of amino acids in infant foods. J. Chromatogr. B Anal. Technol. Biomed. Life Sci. 2006, 831, 176–183. [Google Scholar] [CrossRef]
- Tsugawa, H.; Cajka, T.; Kind, T.; Ma, Y.; Higgins, B.; Ikeda, K.; Kanazawa, M.; VanderGheynst, J.; Fiehn, O.; Arita, M. MS-DIAL: Data-independent MS/MS deconvolution for comprehensive metabolome analysis. Nat. Methods 2015, 12, 523–526. [Google Scholar] [CrossRef]


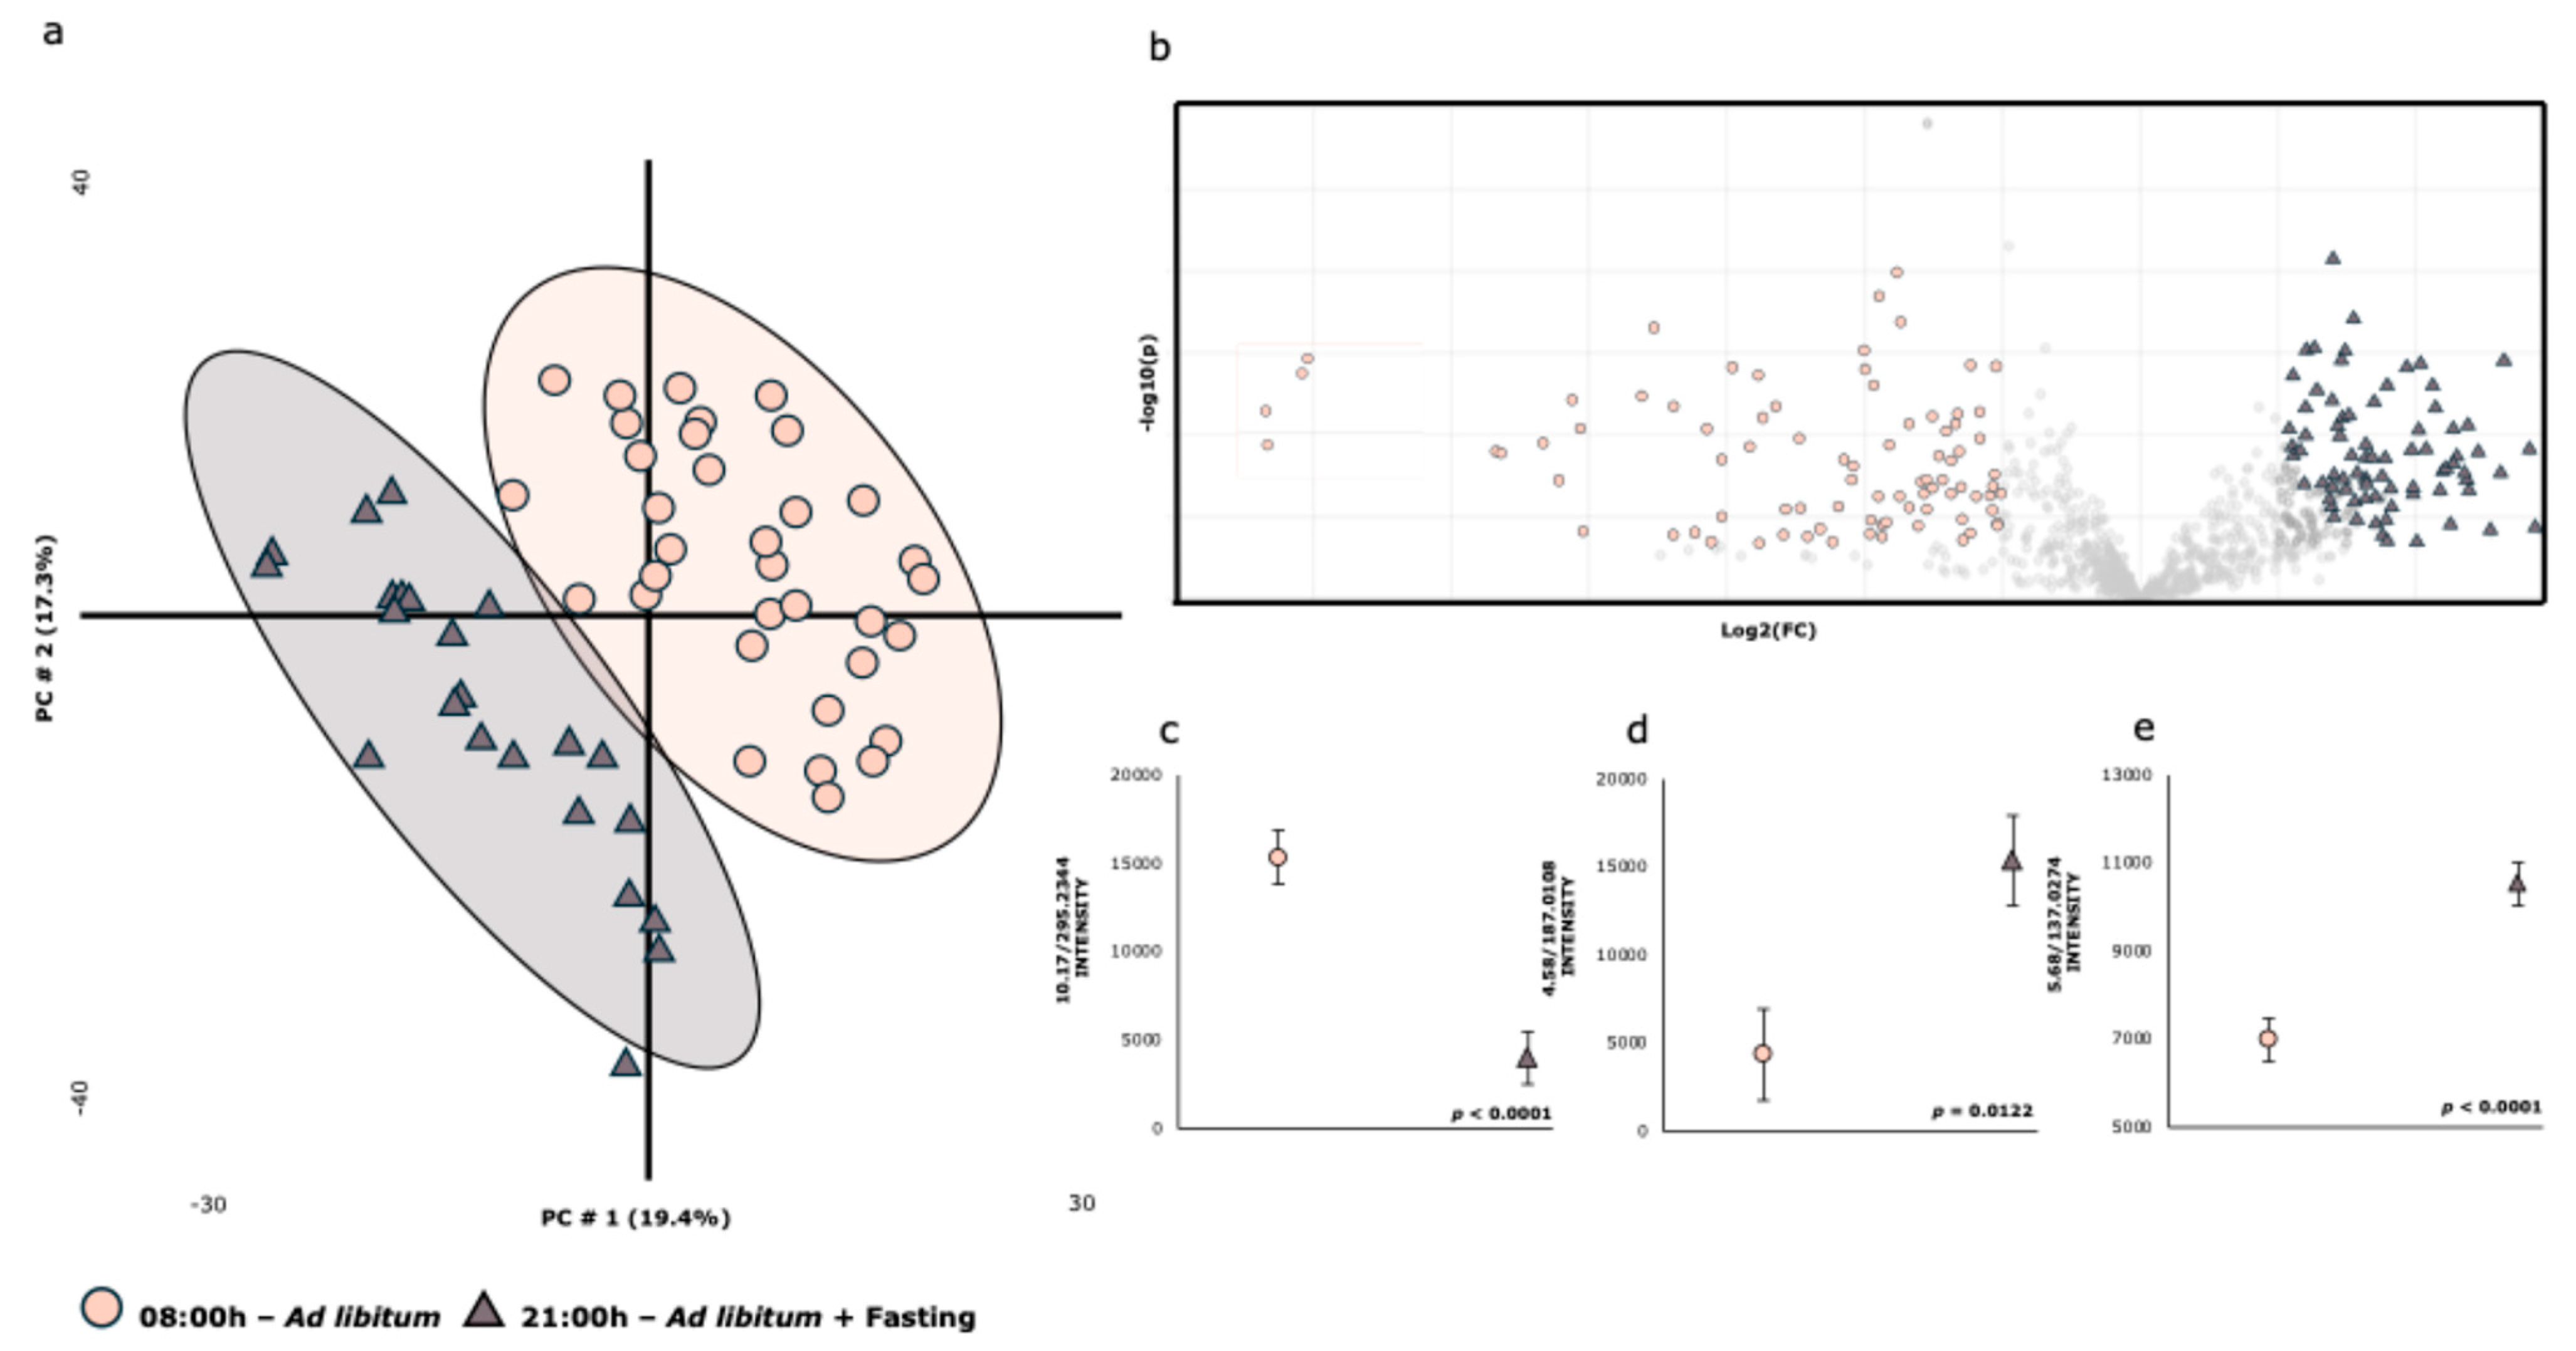
| 08:00 h | 21:00 h | |||||||
|---|---|---|---|---|---|---|---|---|
| RT-m/z | ION | Metabolite ** | X | SE | X | SE | Fold | p-Value |
| 1.05/243.0655 | [M-H]- | Pseudouridine | 3832 | ±148 | 3414 | ±193 | 1.122 | 0.0926 |
| 1.30/191.0235 | [M-H]- | Citric acid | 79,074 | ±5111 | 51,472 | ±6664 | 1.536 | 0.0018 |
| 2.00/243.0670 | [M-H]- | Uridine | 7559 | ±772 | 5592 | ±1006 | 1.351 | 0.1271 |
| 3.20/218.1077 | [M-H]- | Panthothenic acid | 5469 | ±196 | 4412 | ±256 | 1.240 | 0.0019 |
| 3.99/212.0073 | [M-H]- | Indoxylsulfate | 4270 | ±684 | 8175 | ±892 | 0.522 | 0.0011 |
| 4.13/178.0550 | [M-H]- | Hippuric acid | 44,145 | ±1561 | 39,954 | ±2036 | 1.105 | 0.1083 |
| 5.38/187.1013 | [M-H]- | Azelaic acid | 12,267 | ±1057 | 7407 | ±1379 | 1.656 | 0.0072 |
| 5.68/137.0274 | [M-H]- | 4-Hydroxybenzoic acid | 6990 | ±487 | 10,529 | ±634 | 0.664 | <0.0001 |
| 6.94/329.2392 | [M-H]- | Octadecenoic acid *** | 97,105 | ±21,496 | 28,878 | ±28,027 | 3.363 | 0.0589 |
| 7.23/229.1472 | [M-H]- | Dodecanedioic acid | 7407 | ±469 | 4837 | ±611 | 1.531 | 0.0016 |
| 10.36/566.3580 | [M+HCOO]- | LysoPC(18:1(11Z)/0:0) | 168,409 | ±8863 | 116,908 | ±11,557 | 1.441 | 0.0009 |
| 8.57/391.2913 | [M-H]- | Deoxycholic acid | 9823 | ±579 | 6434 | ±754 | 1.527 | 0.0008 |
| 10.17/295.2344 | [M-H]- | 9-Hydroxylinoleic acid | 15,357 | ±1517 | 4008 | ±1978 | 3.832 | <0.001 |
| 9.64/564.3369 | [M-H]- | LysoPC(18:2/0:0) | 304,386 | ±13,309 | 227,654 | ±17,353 | 1.337 | 0.0009 |
| 9.64/564.4826 | [M-H]- | LysoPC | 2787 | ±411 | 4445 | ±536 | 0.623 | 0.0175 |
| 9.07/562.3211 | [M+HCOO]- | LysoPC(18:3(9Z,12Z,15Z)/0:0) | 14,797 | ±812 | 9477 | ±1059 | 1.561 | 0.0002 |
| 8.01/407.2851 | [M-H]- | Allocholic acid | 14,915 | ±1598 | 2135 | ±2084 | 6.986 | <0.0001 |
| 11.25/568.3632 | [M+Fa-H]- | LysoPC(18:0/0:0) | 263,130 | ±12,369 | 214,175 | ±16,127 | 1.229 | 0.0196 |
| 4.58/187.0108 | [M-H]- | P-cresol sulfate | 4350 | ±2583 | 15,376 | ±3368 | 0.283 | 0.0122 |
| 11.25/508.3527 | [M-H]- | LysoPC(18:0/0:0)—Fragment | 61,711 | ±3043 | 47,903 | ±3967 | 1.288 | 0.0079 |
| 5.85/377.0747 | [M-H]- | Enterolactone sulfate | 14,640 | ±920 | 8749 | ±1200 | 1.673 | 0.0003 |
| 0.66/92.9288 | [M-H]- | Chloroacetic acid | 7160 | ±53 | 6664 | ±69 | 1.074 | <0.0001 |
| 9.18/311.2288 | [M-H]- | 11-HpODE **** | 13,833 | ±3042 | 3091 | ±3966 | 4.475 | 0.0363 |
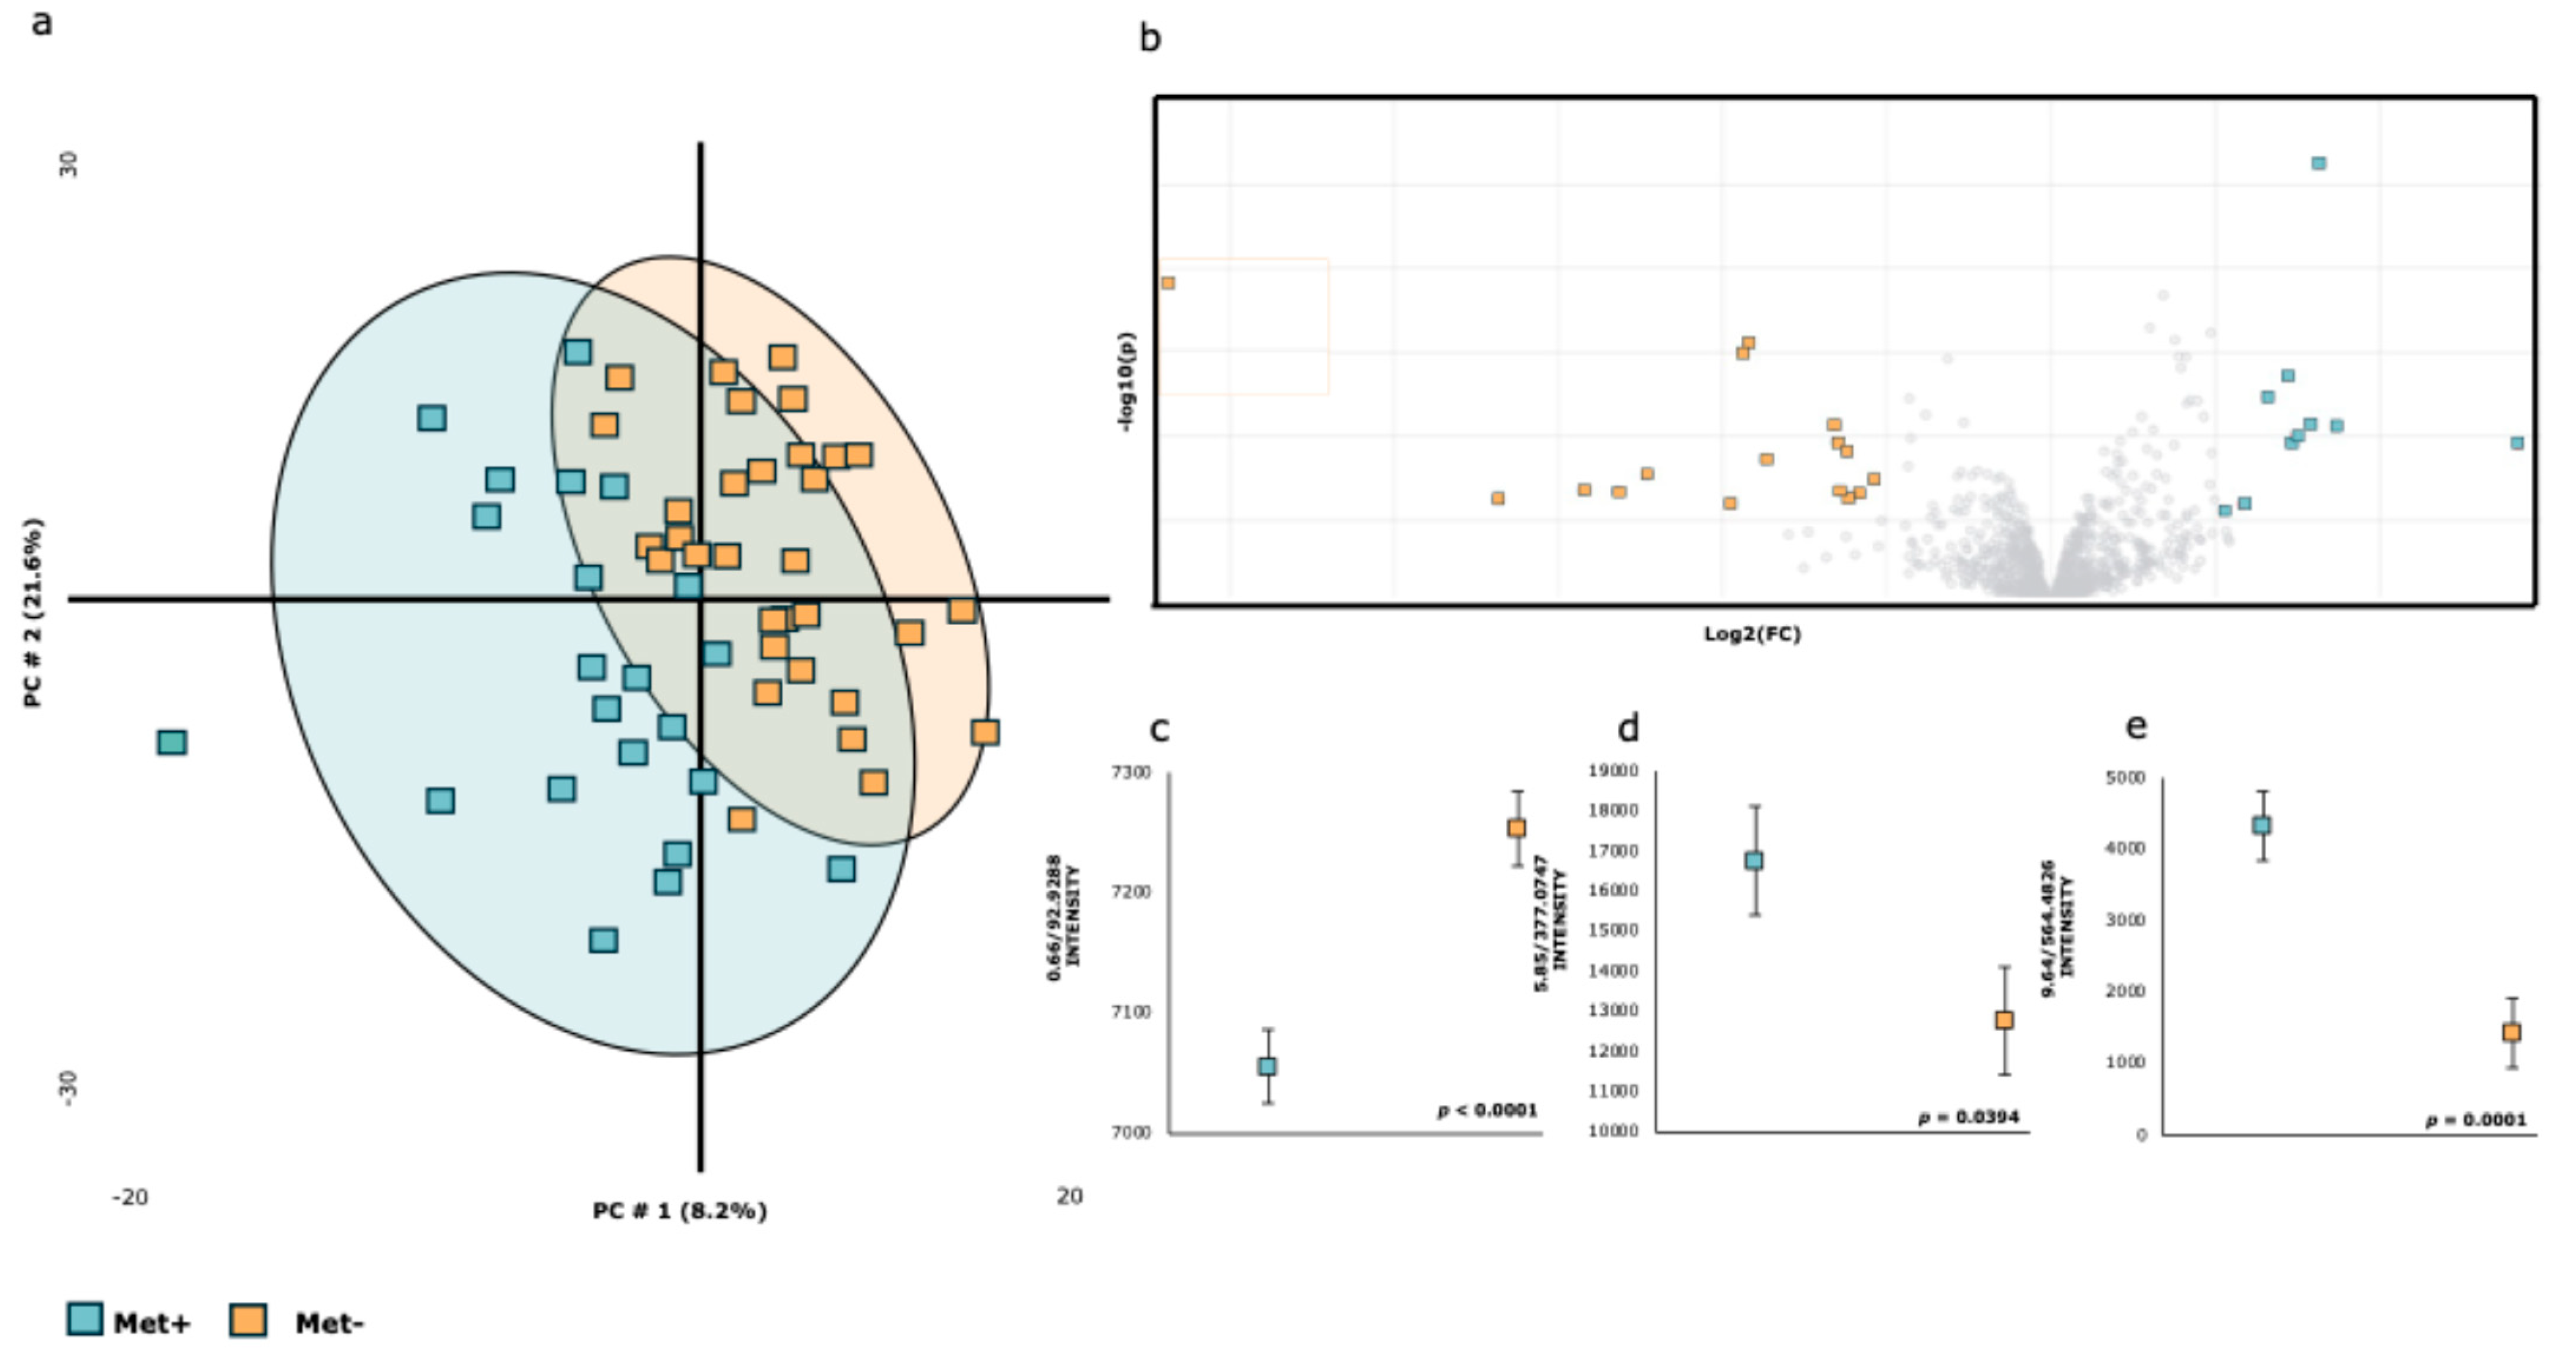
| Met+ | Met− | |||||||
|---|---|---|---|---|---|---|---|---|
| RT-m/z | ION | Metabolite * | X | SE | X | SE | Fold | p-Value |
| 1.05/243.0655 | [M-H]- | Pseudouridine | 3726 | ±215 | 3926 | ±203 | 0.949 | 0.5043 |
| 1.30/191.0235 | [M-H]- | Citric acid | 72,695 | ±7373 | 84,743 | ±6952 | 0.858 | 0.2432 |
| 2.00/243.0670 | [M-H]- | Uridine | 7543 | ±1219 | 7574 | ±1150 | 0.996 | 0.9857 |
| 3.20/218.1077 | [M-H]- | Panthothenic acid | 5434 | ±274 | 5501 | ±258 | 0.988 | 0.8599 |
| 3.99/212.0073 | [M-H]- | Indoxylsulfate | 4767 | ±746 | 3829 | ±703 | 1.245 | 0.3669 |
| 4.13/178.0550 | [M-H]- | Hippuric acid | 45,038 | ±1972 | 43,353 | ±1860 | 1.039 | 0.5384 |
| 5.38/187.1013 | [M-H]- | Azelaic acid | 12,329 | ±1909 | 12,213 | ±1800 | 1.009 | 0.9650 |
| 5.68/137.0274 | [M-H]- | 4-Hydroxybenzoic acid | 7252 | ±669 | 6758 | ±632 | 1.073 | 0.5984 |
| 6.94/329.2392 | [M-H]- | Octadecenoic acid ** | 86,309 | ±37,309 | 106,702 | ±35,175 | 0.809 | 0.6935 |
| 7.23/229.1472 | [M-H]- | Dodecanedioic acid | 8083 | ±733 | 6808 | ±691 | 1.187 | 0.2147 |
| 10.36/566.3580 | [M+HCOO]- | LysoPC(18:1(11Z)/0:0) | 157,480 | ±14,462 | 178,124 | ±13,635 | 0.884 | 0.3068 |
| 8.57/391.2913 | [M-H]- | Deoxycholic acid | 9689 | ±964 | 9943 | ±909 | 0.974 | 0.8493 |
| 10.17/295.2344 | [M-H]- | 9-Hydroxylinoleic acid | 14,240 | ±2670 | 17,238 | ±2545 | 0.826 | 0.2893 |
| 9.64/564.3369 | [M-H]- | LysoPC(18:2/0:0) | 287,263 | ±21,681 | 319,608 | ±20,441 | 0.899 | 0.2858 |
| 9.64/564.4826 | [M-H]- | LysoPC | 4328 | ±490 | 1418 | ±462 | 3.052 | 0.0001 |
| 9.07/562.3211 | [M+HCOO]- | LysoPC(18:3(9Z,12Z,15Z)/0:0) | 13,964 | ±1381 | 15,538 | ±1303 | 0.899 | 0.4137 |
| 8.01/407.2851 | [M-H]- | Allocholic acid | 15,682 | ±2957 | 14,281 | ±2787 | 1.098 | 0.7423 |
| 11.25/568.3632 | [M+Fa-H]- | LysoPC(18:0/0:0) | 238,330 | ±20,434 | 285,174 | ±19,265 | 0.836 | 0.1051 |
| 4.58/187.0108 | [M-H]- | P-cresol sulfate | 4008 | ±1584 | 4654 | ±1493 | 0.861 | 0.7685 |
| 11.25/508.3527 | [M-H]- | LysoPC(18:0/0:0)—Fragment | 55,592 | ±4856 | 67,151 | ±4579 | 0.828 | 0.0929 |
| 5.85/377.0747 | [M-H]- | Enterolactone sulfate | 16,751 | ±1351 | 12,763 | ±1274 | 1.312 | 0.0394 |
| 0.66/92.9288 | [M-H]- | Chloroacetic acid | 7055 | ±31 | 7253 | ±29 | 0.973 | <0.001 |
| 9.18/311.2288 | [M-H]- | 11-HpODE *** | 12,554 | ±5395 | 14,969 | ±5086 | 0.839 | 0.7467 |
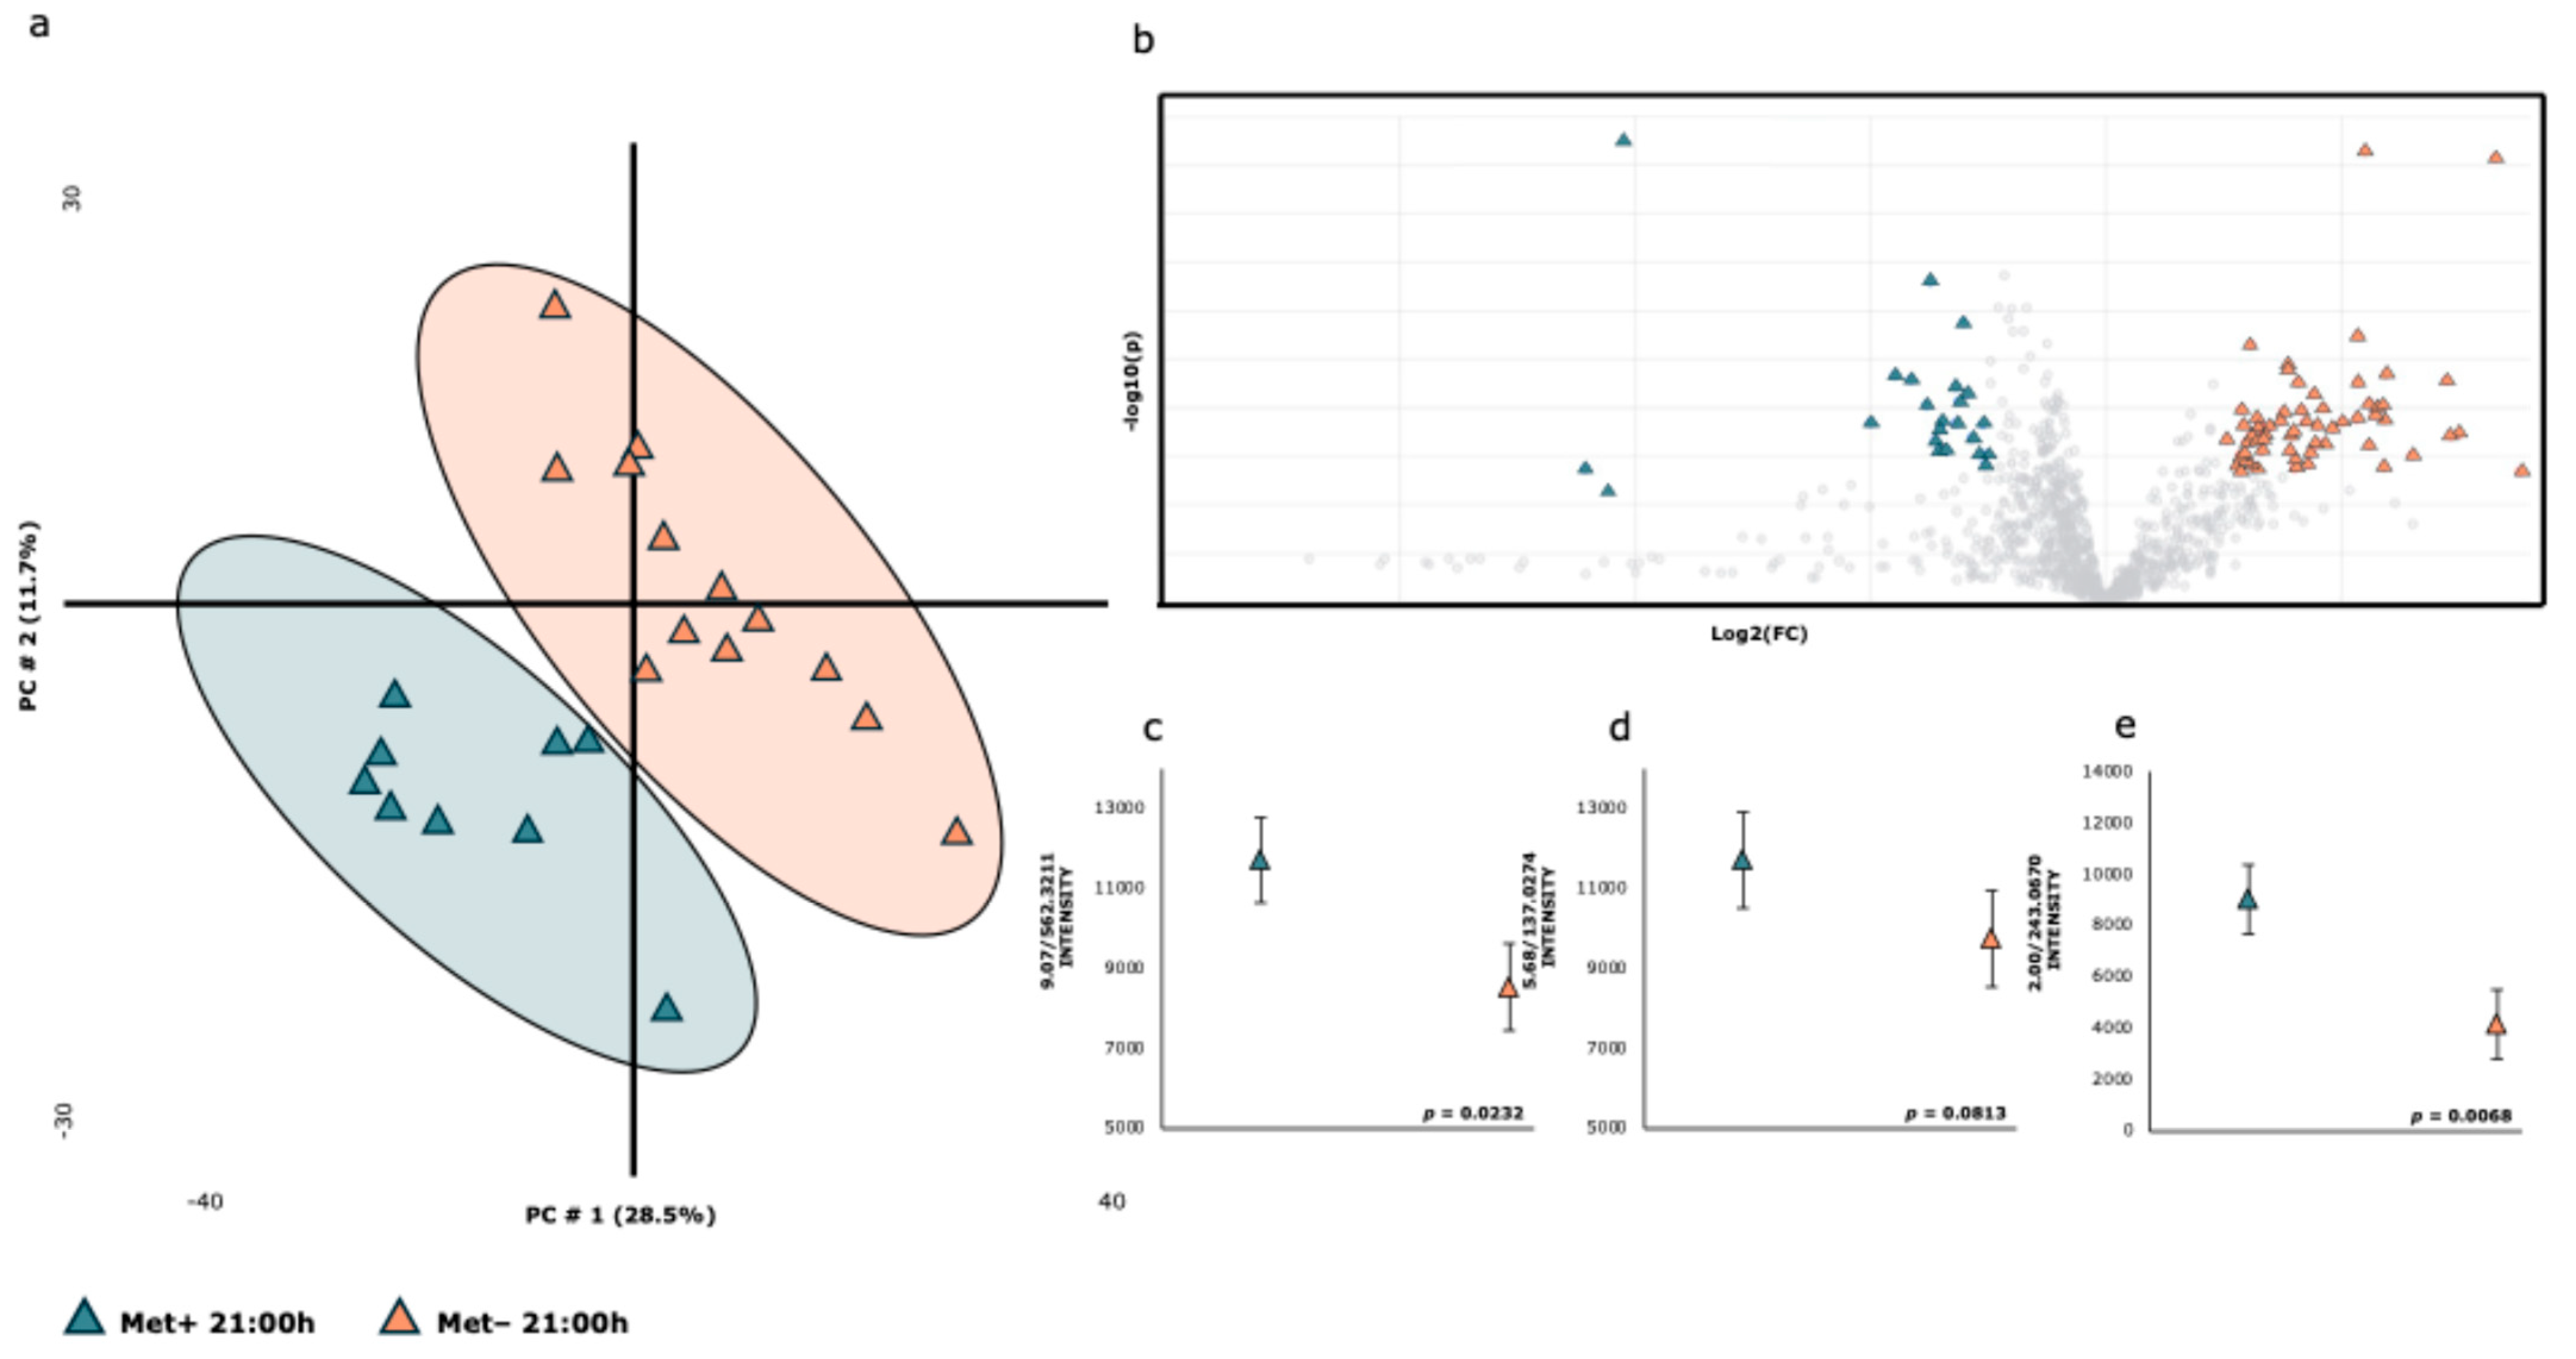
| Met+ | Met− | |||||||
|---|---|---|---|---|---|---|---|---|
| RT-m/z | ION | Metabolite * | X | SE | X | SE | Fold | p-Value |
| 1.05/243.0655 | [M-H]- | Pseudouridine | 3405 | ±372 | 3418 | ±243 | 0.996 | 0.9762 |
| 1.30/191.0235 | [M-H]- | Citric acid | 40,552 | ±12,211 | 56,153 | ±7994 | 0.722 | 0.2992 |
| 2.00/243.0670 | [M-H]- | Uridine | 9008 | ±1335 | 4129 | ±874 | 2.182 | 0.0068 |
| 3.20/218.1077 | [M-H]- | Panthothenic acid | 4959 | ±501 | 41,777 | ±328 | 0.119 | 0.2087 |
| 3.99/212.0073 | [M-H]- | Indoxylsulfate | 9418 | ±2200 | 7642 | ±1440 | 1.232 | 0.5080 |
| 4.13/178.0550 | [M-H]- | Hippuric acid | 45,581 | ±4327 | 37,541 | ±2833 | 1.214 | 0.1375 |
| 5.38/187.1013 | [M-H]- | Azelaic acid | 8137 | ±70,983 | 7093 | ±647 | 1.147 | 0.3884 |
| 5.68/137.0274 | [M-H]- | 4-Hydroxybenzoic acid | 12,399 | ±1210 | 9728 | ±792 | 1.275 | 0.0813 |
| 6.94/329.2392 | [M-H]- | Octadecenoic acid ** | 8914 | ±30,025 | 37,435 | ±19,656 | 0.238 | 0.4371 |
| 7.23/229.1472 | [M-H]- | Dodecanedioic acid | 6075 | ±895 | 4306 | ±586 | 1.411 | 0.1157 |
| 10.36/566.3580 | [M+HCOO]- | LysoPC(18:1(11Z)/0:0) | 139,923 | ±14,803 | 99,346 | ±7634 | 0.131 | 0.0083 |
| 8.57/391.2913 | [M-H]- | Deoxycholic acid | 7883 | ±951 | 5813 | ±623 | 1.356 | 0.0854 |
| 10.17/295.2344 | [M-H]- | 9-Hydroxylinoleic acid | 4108 | ±1370 | 3963 | ±897 | 1.037 | 0.9306 |
| 9.64/564.3369 | [M-H]- | LysoPC(18:2/0:0) | 261,742 | ±22,293 | 202,718 | ±12,460 | 1.229 | 0.0164 |
| 9.64/564.4826 | [M-H]- | LysoPC | 965 | ±389 | 1583 | ±255 | 0.610 | 0.2010 |
| 9.07/562.3211 | [M+HCOO]- | LysoPC(18:3(9Z,12Z,15Z)/0:0) | 11,709 | ±1075 | 8521 | ±704 | 1.374 | 0.0232 |
| 8.01/407.2851 | [M-H]- | Allocholic acid | 2091 | ±505 | 2154 | ±331 | 0.971 | 0.9188 |
| 11.25/568.3632 | [M+Fa-H]- | LysoPC(18:0/0:0) | 226,973 | ±18,439 | 208,690 | ±12,071 | 1.088 | 0.4176 |
| 4.58/187.0108 | [M-H]- | P-cresol sulfate | 9371 | ±9720 | 17,949 | ±6363 | 0.522 | 0.4698 |
| 11.25/508.3527 | [M-H]- | LysoPC(18:0/0:0)—Fragment | 50,689 | ±5351 | 46,709 | ±3503 | 1.085 | 0.5416 |
| 5.85/377.0747 | [M-H]- | Enterolactone sulfate | 12,891 | ±1611 | 6974 | ±1055 | 1.848 | 0.0066 |
| 0.66/92.9288 | [M-H]- | Chloroacetic acid | 6771 | ±194 | 6618 | ±127 | 1.023 | 0.5180 |
| 9.18/311.2288 | [M-H]- | 11-HpODE *** | 538 | ±3542 | 4186 | ±2319 | 0.129 | 0.4003 |
| Ingredients | Chemical Composition | Met+ | Met− | |
|---|---|---|---|---|
| Wheat gran | 300 | Dry matter 2 | 907 | 907 |
| DDGS corn | 50 | Ash 2 | 104 | 104 |
| Bakery by-product | 30 | Crude protein 2 | 155 | 155 |
| Sunflower meal | 36 | Crude fat 2 | 29.7 | 29.7 |
| Alfalfa meal | 334 | Neutral detergent fiber (NDF) 2 | 455 | 455 |
| Beet pulp | 80 | Acid detergent fiber (FAD) 2 | 29.7 | 29.7 |
| Straw | 136 | Acid detergent lignin (ADL) 2 | 455 | 455 |
| Beet molasses | 13.9 | Digestible energy 2 | 262 | 262 |
| L-Arginine | 3.1 | Amino acid composition 3: | ||
| L-Histidine | 1.5 | Aspartic acid | 12.95 | 12.95 |
| Calcium carbonate | 6.5 | Serine | 5.74 | 5.74 |
| Sodium clorhide | 4 | Glutamic acid | 22.96 | 22.96 |
| Vitamine/mineral 1 | 5 | Glycine | 6.53 | 6.53 |
| Histidine | 3.57 | 3.57 | ||
| Arginine | 9.28 | 9.28 | ||
| Threonine | 6.90 | 6.90 | ||
| Alanine | 6.69 | 6.69 | ||
| Proline | 8.04 | 8.04 | ||
| Cystine | 2.37 | 2.37 | ||
| Tyrosine | 2.90 | 2.90 | ||
| Valine | 7.03 | 7.03 | ||
| Methionine 4 + Cystine | 6.60 | 4.90 | ||
| Isoleucine | 5.07 | 5.07 | ||
| Lysine | 8.10 | 8.10 | ||
| Leucine | 9.70 | 9.70 | ||
| Phenylalanine | 5.58 | 5.58 |
Disclaimer/Publisher’s Note: The statements, opinions and data contained in all publications are solely those of the individual author(s) and contributor(s) and not of MDPI and/or the editor(s). MDPI and/or the editor(s) disclaim responsibility for any injury to people or property resulting from any ideas, methods, instructions or products referred to in the content. |
© 2025 by the authors. Licensee MDPI, Basel, Switzerland. This article is an open access article distributed under the terms and conditions of the Creative Commons Attribution (CC BY) license (https://creativecommons.org/licenses/by/4.0/).
Share and Cite
Marín-García, P.J.; Mateo-López, J.; Cortés-García, C.; Llobat, L.; Huertas-Herrera, A.; Toro-Manríquez, M.; Cambra-López, M.; Pascual, J.J.; Hedemann, M.S. Untargeted Metabolomics to Harness Ideal Protein Concept and Mitigate Environmental Impact in Rabbit Models. Int. J. Mol. Sci. 2025, 26, 6047. https://doi.org/10.3390/ijms26136047
Marín-García PJ, Mateo-López J, Cortés-García C, Llobat L, Huertas-Herrera A, Toro-Manríquez M, Cambra-López M, Pascual JJ, Hedemann MS. Untargeted Metabolomics to Harness Ideal Protein Concept and Mitigate Environmental Impact in Rabbit Models. International Journal of Molecular Sciences. 2025; 26(13):6047. https://doi.org/10.3390/ijms26136047
Chicago/Turabian StyleMarín-García, Pablo Jesús, Jorge Mateo-López, César Cortés-García, Lola Llobat, Alejandro Huertas-Herrera, Mónica Toro-Manríquez, María Cambra-López, Juan José Pascual, and Mette Skou Hedemann. 2025. "Untargeted Metabolomics to Harness Ideal Protein Concept and Mitigate Environmental Impact in Rabbit Models" International Journal of Molecular Sciences 26, no. 13: 6047. https://doi.org/10.3390/ijms26136047
APA StyleMarín-García, P. J., Mateo-López, J., Cortés-García, C., Llobat, L., Huertas-Herrera, A., Toro-Manríquez, M., Cambra-López, M., Pascual, J. J., & Hedemann, M. S. (2025). Untargeted Metabolomics to Harness Ideal Protein Concept and Mitigate Environmental Impact in Rabbit Models. International Journal of Molecular Sciences, 26(13), 6047. https://doi.org/10.3390/ijms26136047