1. Introduction
Phosphorylation has been identified as playing a pivotal role in all cellular signaling pathways, including those associated with post-translational modifications of plasma membrane structures (including ion channels or transporters). These modifications result in alterations to the structural conformation and function of the proteins concerned [
1]. Maintenance of phosphorylation is characterized by the opposite transfer (input/output) of γ-phosphate (P
i) with adenosine triphosphate (ATP) to target amino acid residues, which are catalyzed by protein kinases (PKs) and protein phosphatases (PPs), respectively. Phosphorylation and dephosphorylation are highly dynamic processes targeted at specific molecular substrates. Questions regarding how these sites are recognized and the mechanisms that coordinate the balance of the enzymes involved are significant for elucidating their physiological functions and for the treatment of diseases [
2].
γ-Aminobutyric acid type A receptors (GABA
ARs) are members of the pentameric ligand-gated ion channels (pLGICs) family that mediate rapid neurotransmission in the nervous system [
3]. Their dysfunction is associated with neurodegenerative and psychiatric processes, including memory, epilepsy, tremor, anxiety, and sedation [
4]. Several studies have demonstrated the critical role of protein tyrosine kinases (PTKs) [
5] and protein tyrosine phosphatases (PTPs) [
6] in the regulation of pLGICs (including GABA
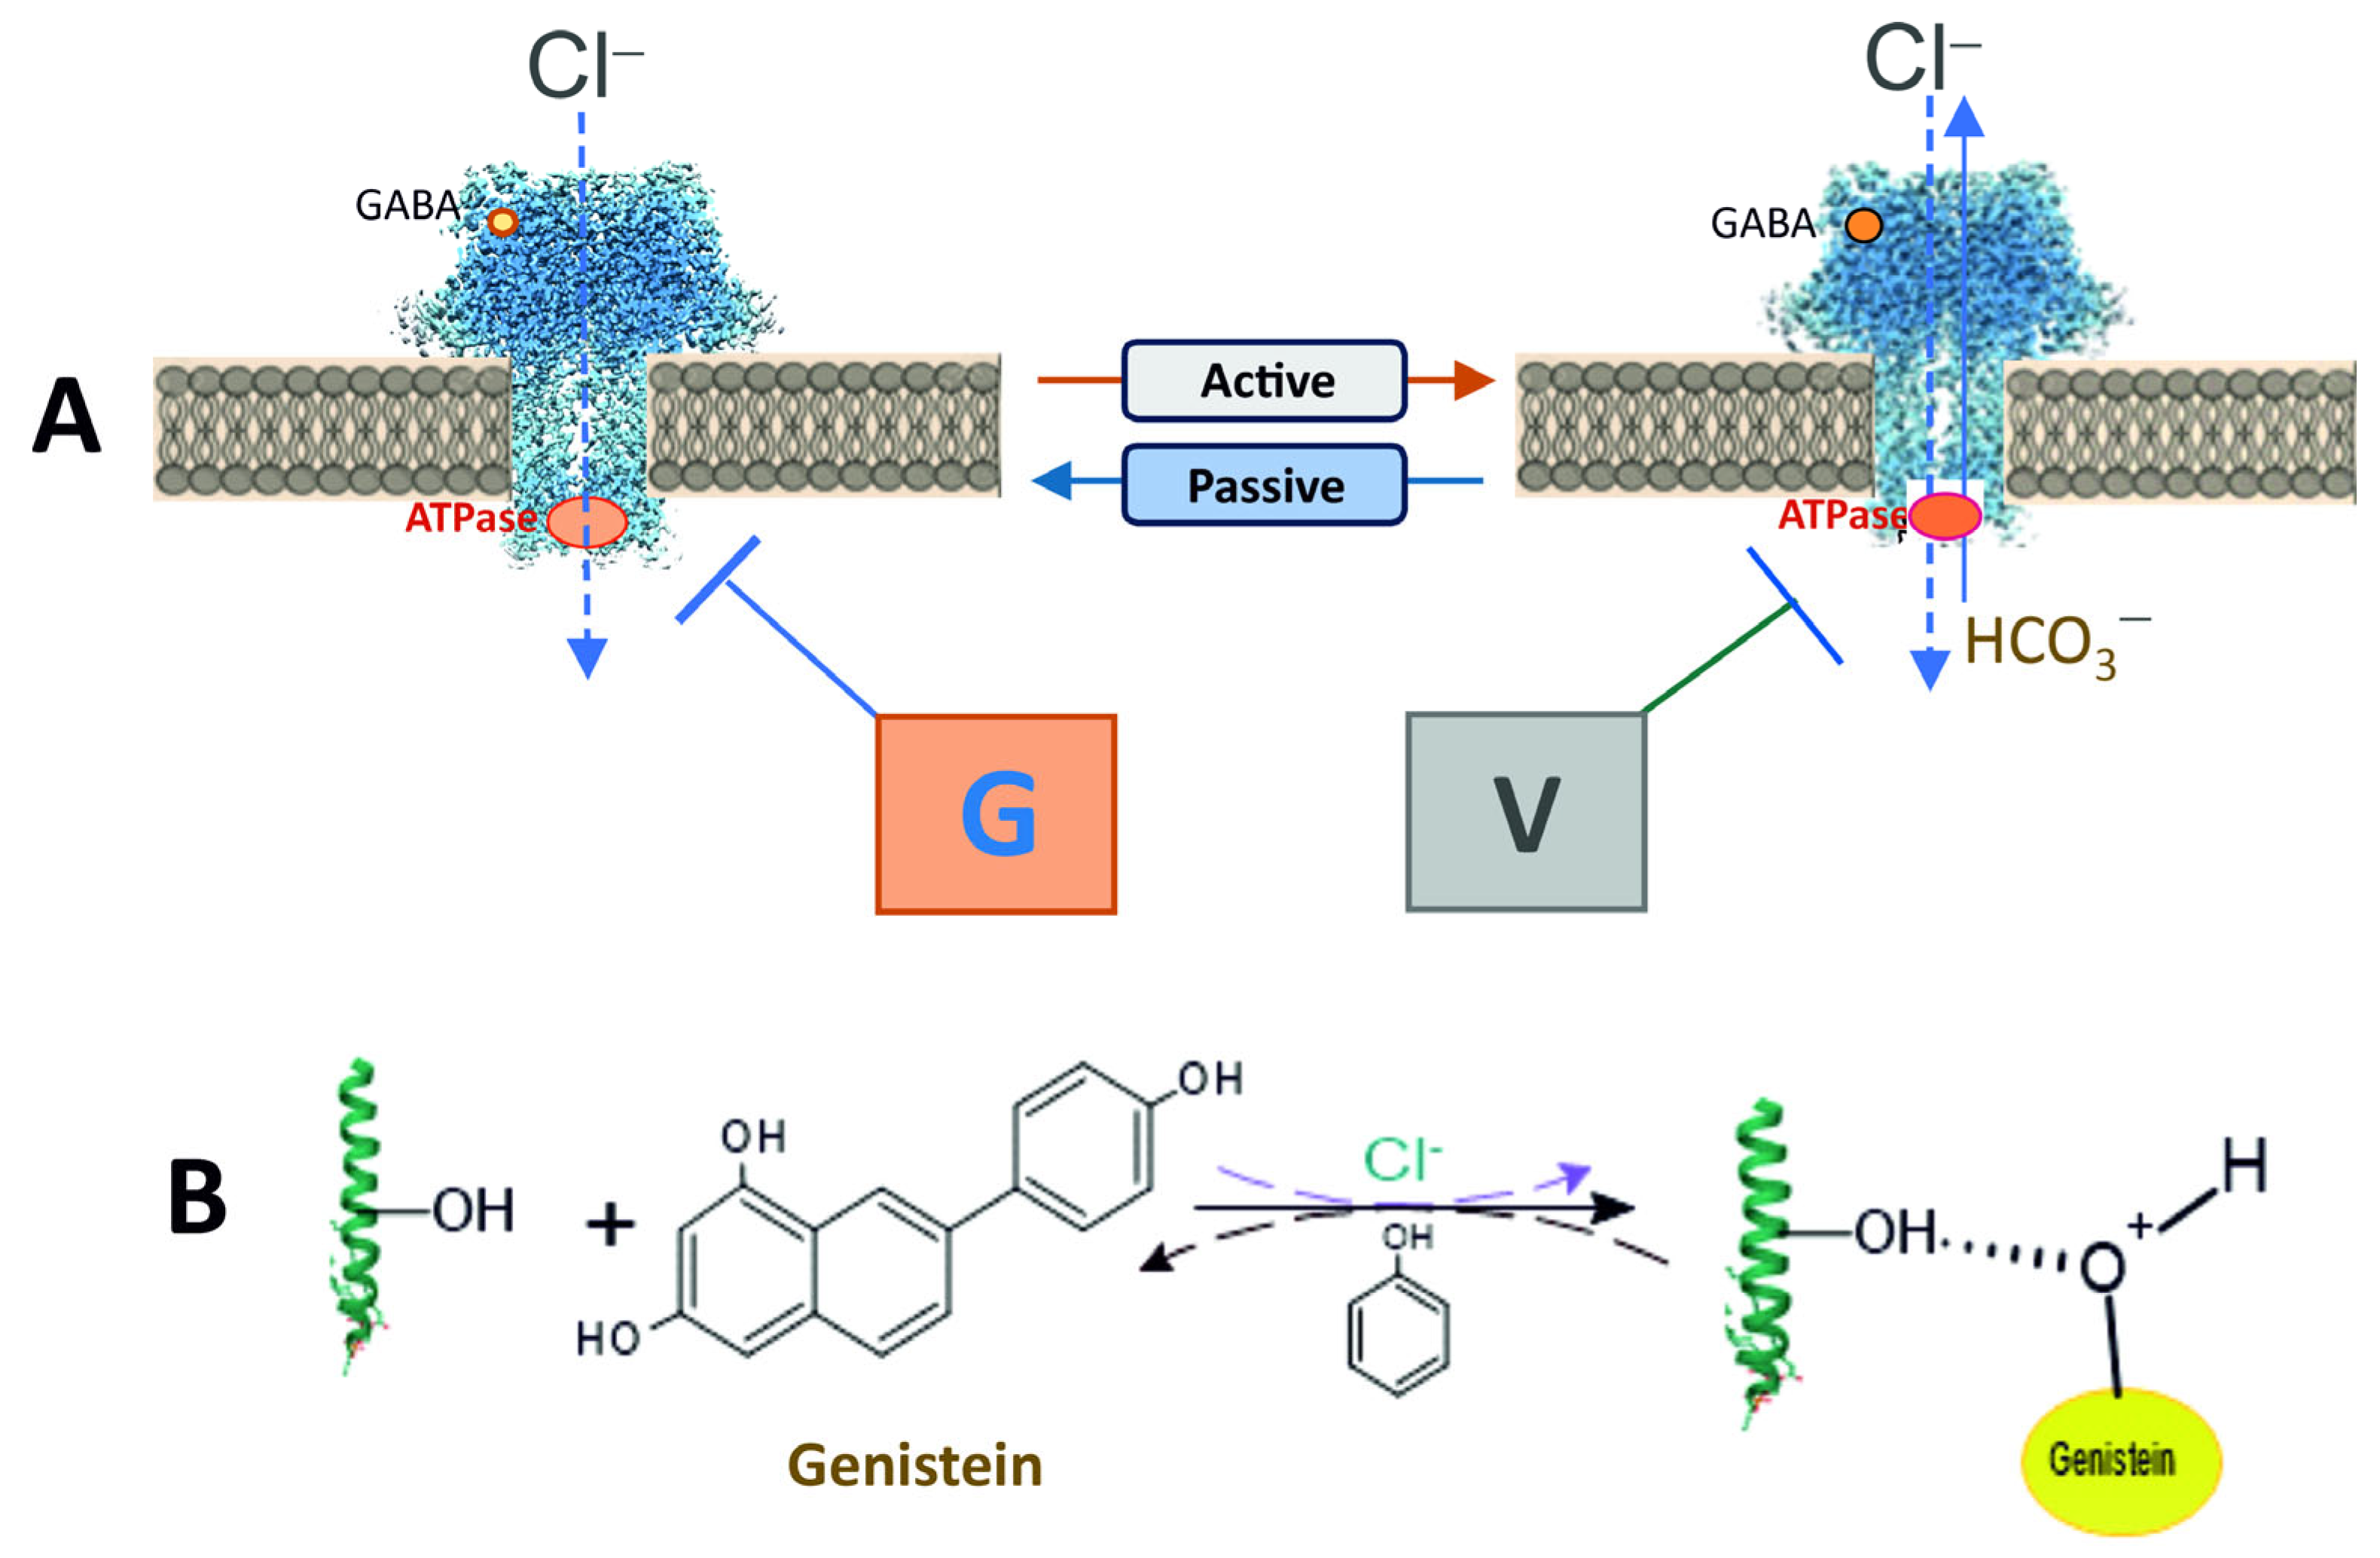
ARs) (see
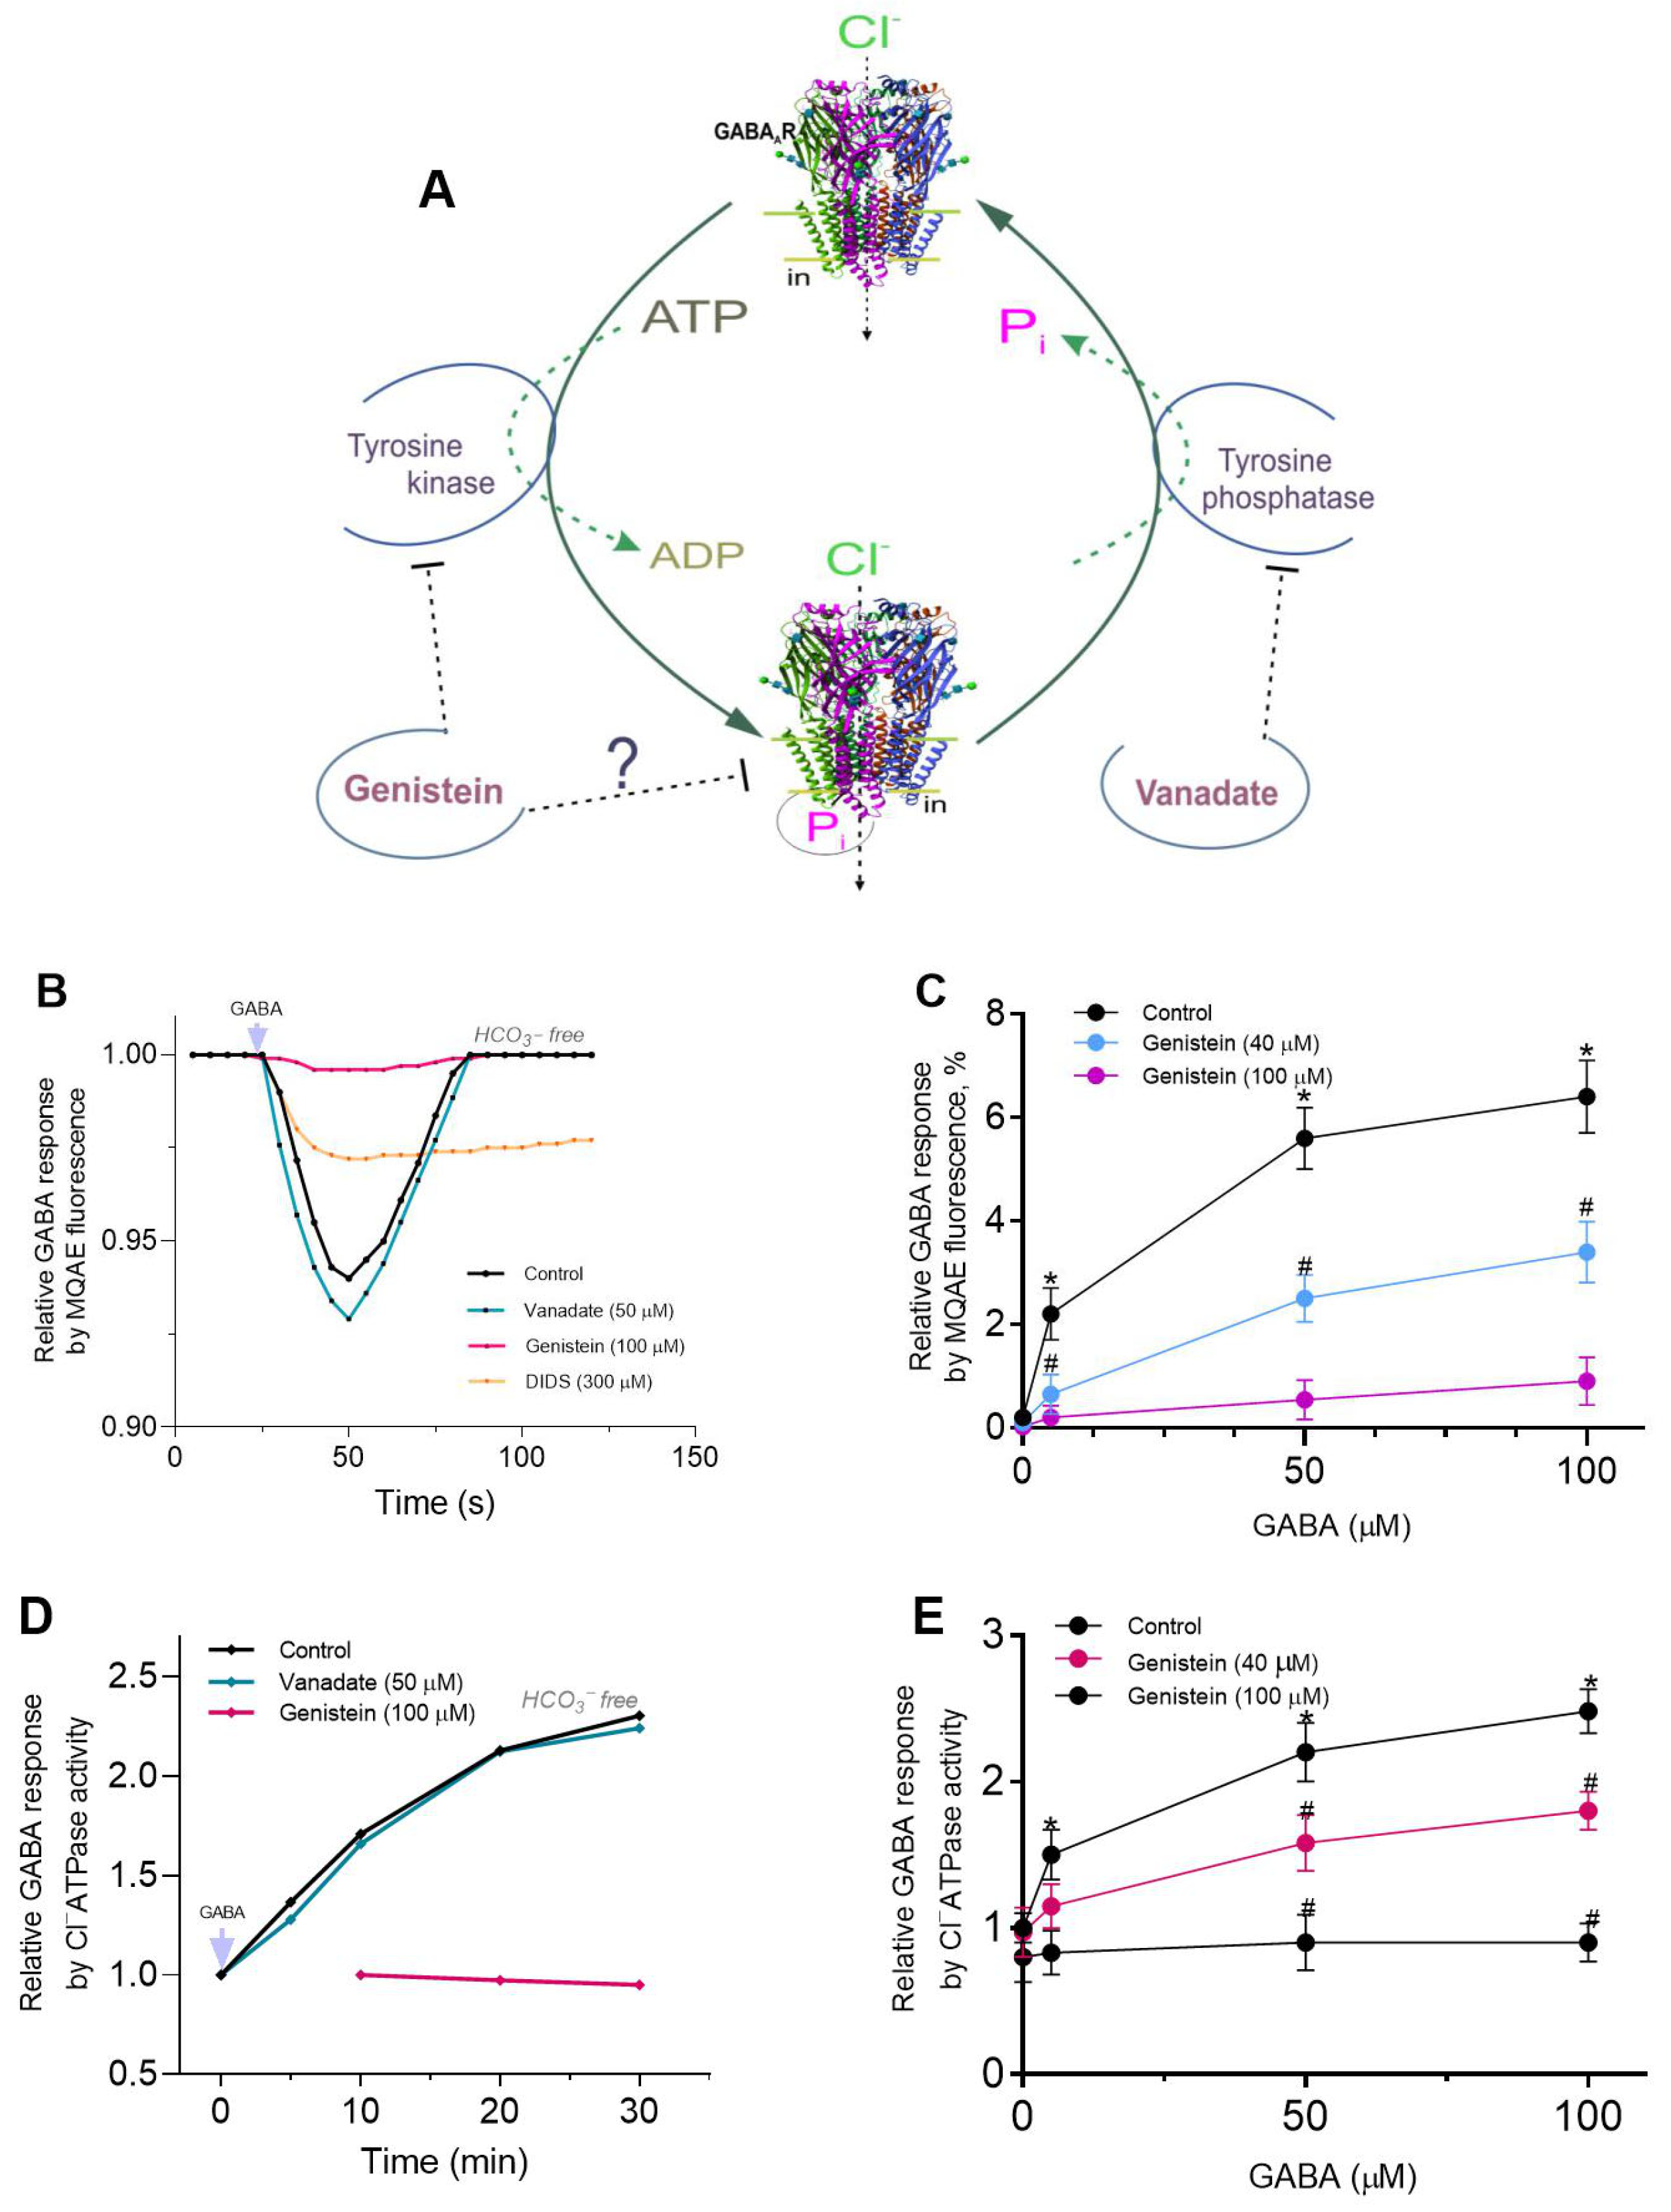
Figure 1A). As demonstrated by several reports, genistein (a PTK inhibitor) has been shown to depress GABA-mediated Cl
− inflow in neuronal and recombinant GABA
ARs [
6,
7]. Conversely, vanadate (a PTP and P-type ATPase inhibitor) has been observed to produce a modest increase in GABA
AR activity [
8,
9,
10]. Genistein, in conjunction with other isoflavones, has been shown in some works to exert a direct inhibitory effect on GABA
ARs, independent of kinase involvement [
11,
12]. Notwithstanding the fact that the molecular mechanisms of direct genistein action on receptor activity remain unclear, it has been proposed that this chemical acts as an estrogen agonist via allosteric interaction with the receptor [
4]. While there are multiple pathways by which phenols can interact with membrane structures, the predominant pathway is the formation of hydrogen bonds. Specifically, the OH groups in phenol chemicals have the capacity to interact with receptors via the formation of H-bonds with amino acid residues (for example, the phenolic hydroxyl group of tyrosine residue) [
4,
13]. Conversely, certain authors have demonstrated that vanadate engages in an interaction with tyrosine or phenol, resulting in the esterification of hydroxyl groups, thereby yielding vanadate esters [
14]. It was hypothesized that, given the established importance of phenol in the modulation of GABA
AR activity [
15,
16], genistein and vanadate could regulate receptor function via a phenol-sensitive mechanism.
GABA
ARs in mature neurons are the primary inhibitory receptors, a consequence of the permeability of chloride (Cl
−) ions through the ion channel pore [
17]. However, under certain circumstances (for example, intensive or prolonged activation), GABAergic signaling has been demonstrated to exhibit depolarization/excitatory responses. This is due to the formation of a high intracellular chloride concentration ([Cl
−]
i) and outflow of not only Cl
− but also bicarbonate (HCO
3−) ions via receptor pore [
18,
19]. The pentameric assemblies of GABA
ARs are composed of nineteen possible subunits, of which the most common subtypes observed in the vertebrate brain have a 2α:2β:1γ composition [
20]. As demonstrated in some studies, the sites for phosphorylation by PTKs and dephosphorylation by PTPs have been identified in β subunits [
8,
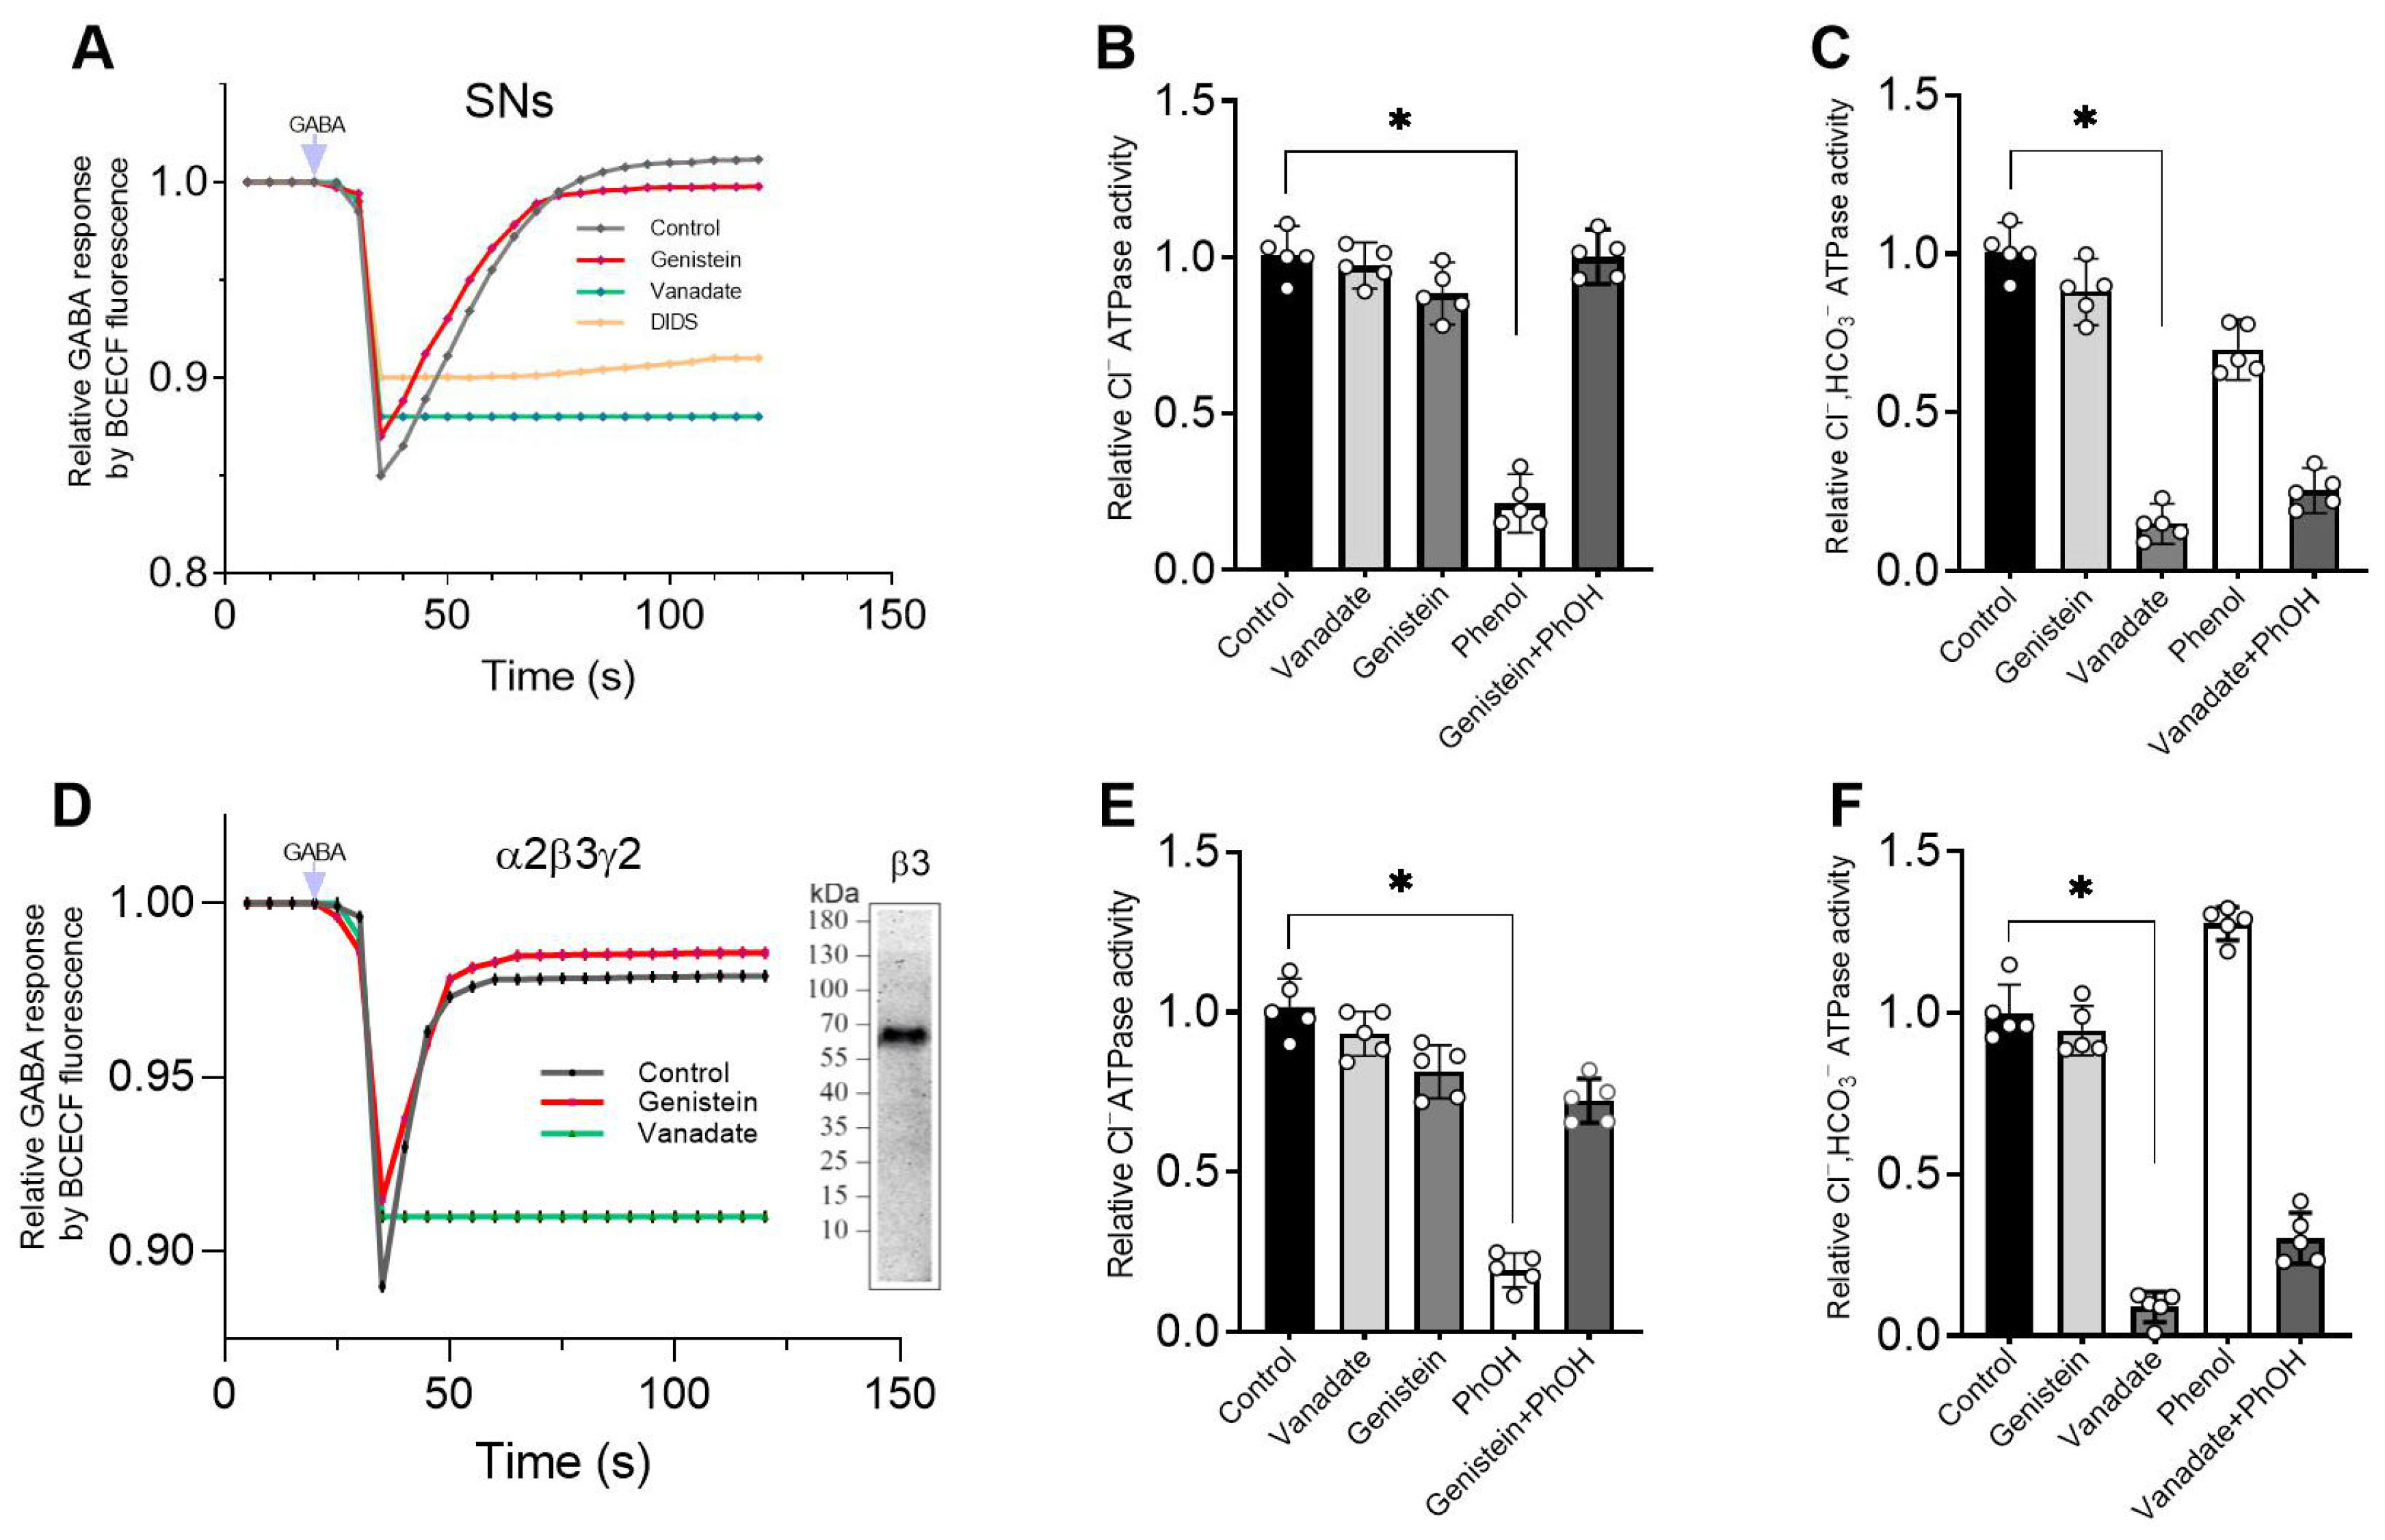
9]. Moreover, an accumulation of data has demonstrated the unique role of the β3 subunit in the manifestation of receptor properties at both the molecular and circuit level (for example, ionic/ligand selectivity, pharmacological characteristics, etc.) [
20,
21]. Recent studies have demonstrated that the GABA
AR β3 subunit possesses a phenol-sensitive ATPase, which provides the transition of GABA
ARs from a desensitization to resensitization state [
22,
23]. As genistein and vanadate target sites implicated in ATP-dependent processes within the receptor structure, it was imperative to investigate their impact on passive anion permeability via ion channel pore, as well as on GABA
AR-coupled ATPase activity. It is evident that the physiological level of genistein is minimal (i.e., ≤5 µM), and it is able to act only as a modulator at the endoplasmic reticulum [
11,
12]. Nevertheless, in instances where a diet may comprise high doses of isoflavones (≤20 µM) in the blood, genistein has been demonstrated to mediate neuroprotection in cases of status tremor, seizures and Alzheimer’s disease [
24,
25]. It is improbable that the direct inhibition of GABA
ARs by genistein (with effective concentrations of greater than 70 µM) will occur in humans at dietary concentrations of genistein that are relevant to humans [
26,
27,
28]. However, the molecular mechanisms through which genistein exerts its effects on neurodegenerative processes remain to be fully elucidated [
16,
26]. Given the role of GABA
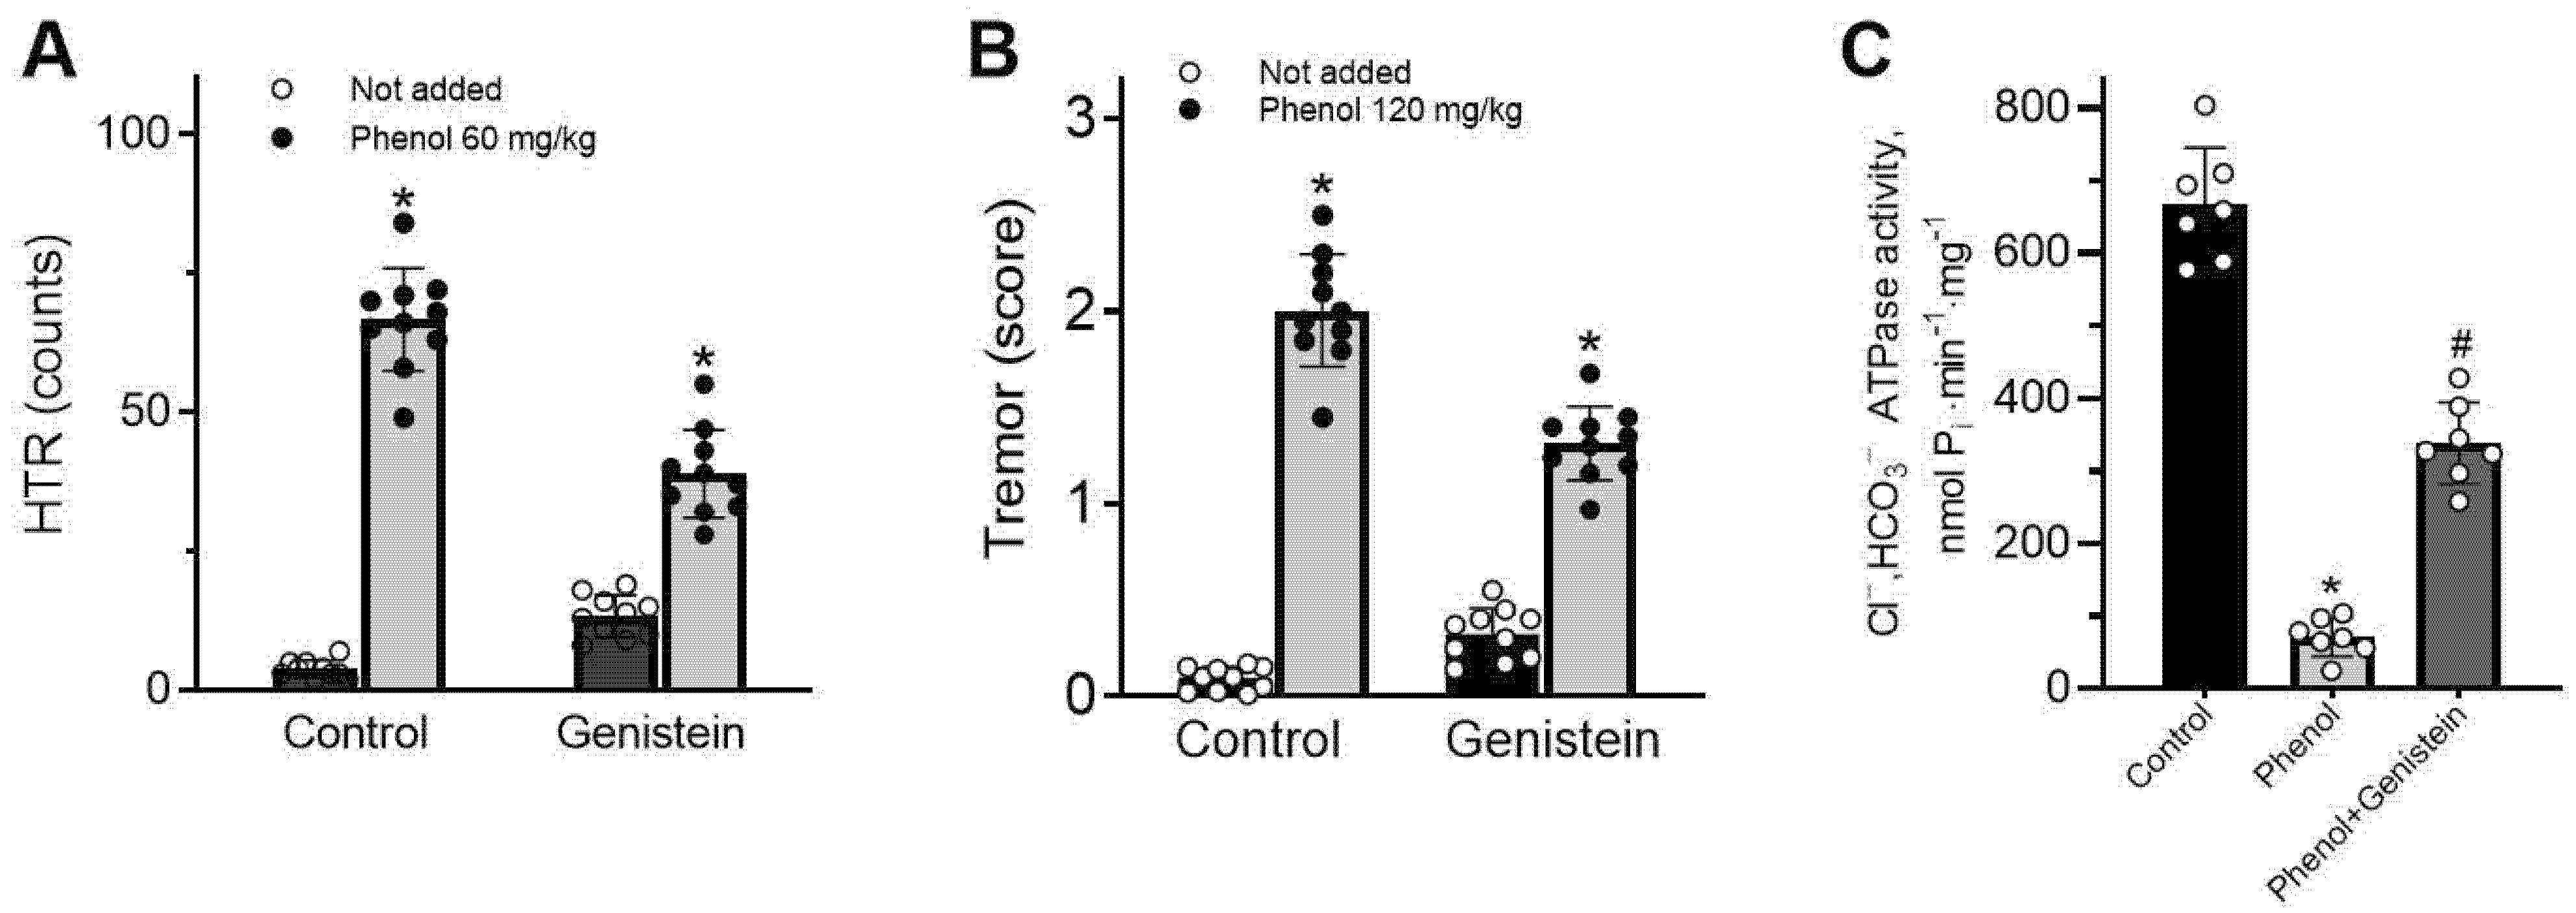
AR/ATPase effect in phenol-induced behavioral symptoms, it seemed important to investigate genistein action on phenol-induced tremor and seizures.
In this work, we used the fluorescence measurements (by dyes for Cl− and HCO3−) to evaluate the role of genistein and vanadate in the modulation of the GABAAR-mediated [Cl−]i/[HCO3−]i changes and ATPase activity in the cortex synaptoneurosomes (SNs) of rats and HEK 293 FT cells expressing the heteropentameric α2β3γ2 GABAAR subtype isoform. Here, we illustrated that genistein plays an essential role in the inhibition of the GABAAR-mediated Cl− influx and Cl−ATPase activity in the neurons in an HCO3−-free environment, whereas vanadate plays an important role in the inhibition of these processes in the presence of a physiologic bicarbonate concentration. We showed that genistein and vanadate produce an increase in phosphoprotein formation at the membrane-bound receptor but lead to the recovery of anion-induced dephosphorylation. In addition, we showed the role of genistein in producing a decrease in phenol-induced neurological disorders in rats. Overall, our data reveal the essential role of bicarbonate in coordinating the effects of genistein and vanadate on cortical GABAAR/ATPase activity via a phenol-sensitive mechanism.
3. Discussion
In our study, increasing the time interval resulted in a decrease in GABA responses, similar to the desensitizing state observed in receptors during electrophysiological studies [
31]. However, this is not entirely typical of such a process, since desensitization of the receptor would lead to a sustained decrease in fluorescence in the absence of anion exchanger activity. Probably, such kinetic behavior is also not related to disruption of cellular structure and the subsequent release of the dye into the extracellular environment (
Supplement Data, Figure S1). At the same time, the literature data demonstrate that stilbene derivatives (e.g., DIDS or SITS) inhibit Cl
−/HCO
3− exchange transport carried out by various membrane structures when present at concentrations of 100–300 μM [
34]. Here, in the presence of a DIDS, the bell-shaped kinetics are significantly leveled out (see
Figure 1A and
Figure 3A), which suggests that the Cl
−/HCO
3− transport process is involved in restoring anion homeostasis after receptor activation.
Genistein, targeting the ATP binding site or the substrate binding site, appeared to antagonize responses to GABA. Concentration-response curves were noncompetitively depressed, suggesting that competition at the agonist binding site between GABA and genistein is unlikely. Whereas vanadate slightly activates the GABA-mediated Cl
− influx into neurons. These data are comparable to those in the literature [
11,
12]. In particular, it was demonstrated that vanadate results in a modest increase in the GABA-induced Cl
− current in neurons [
8,
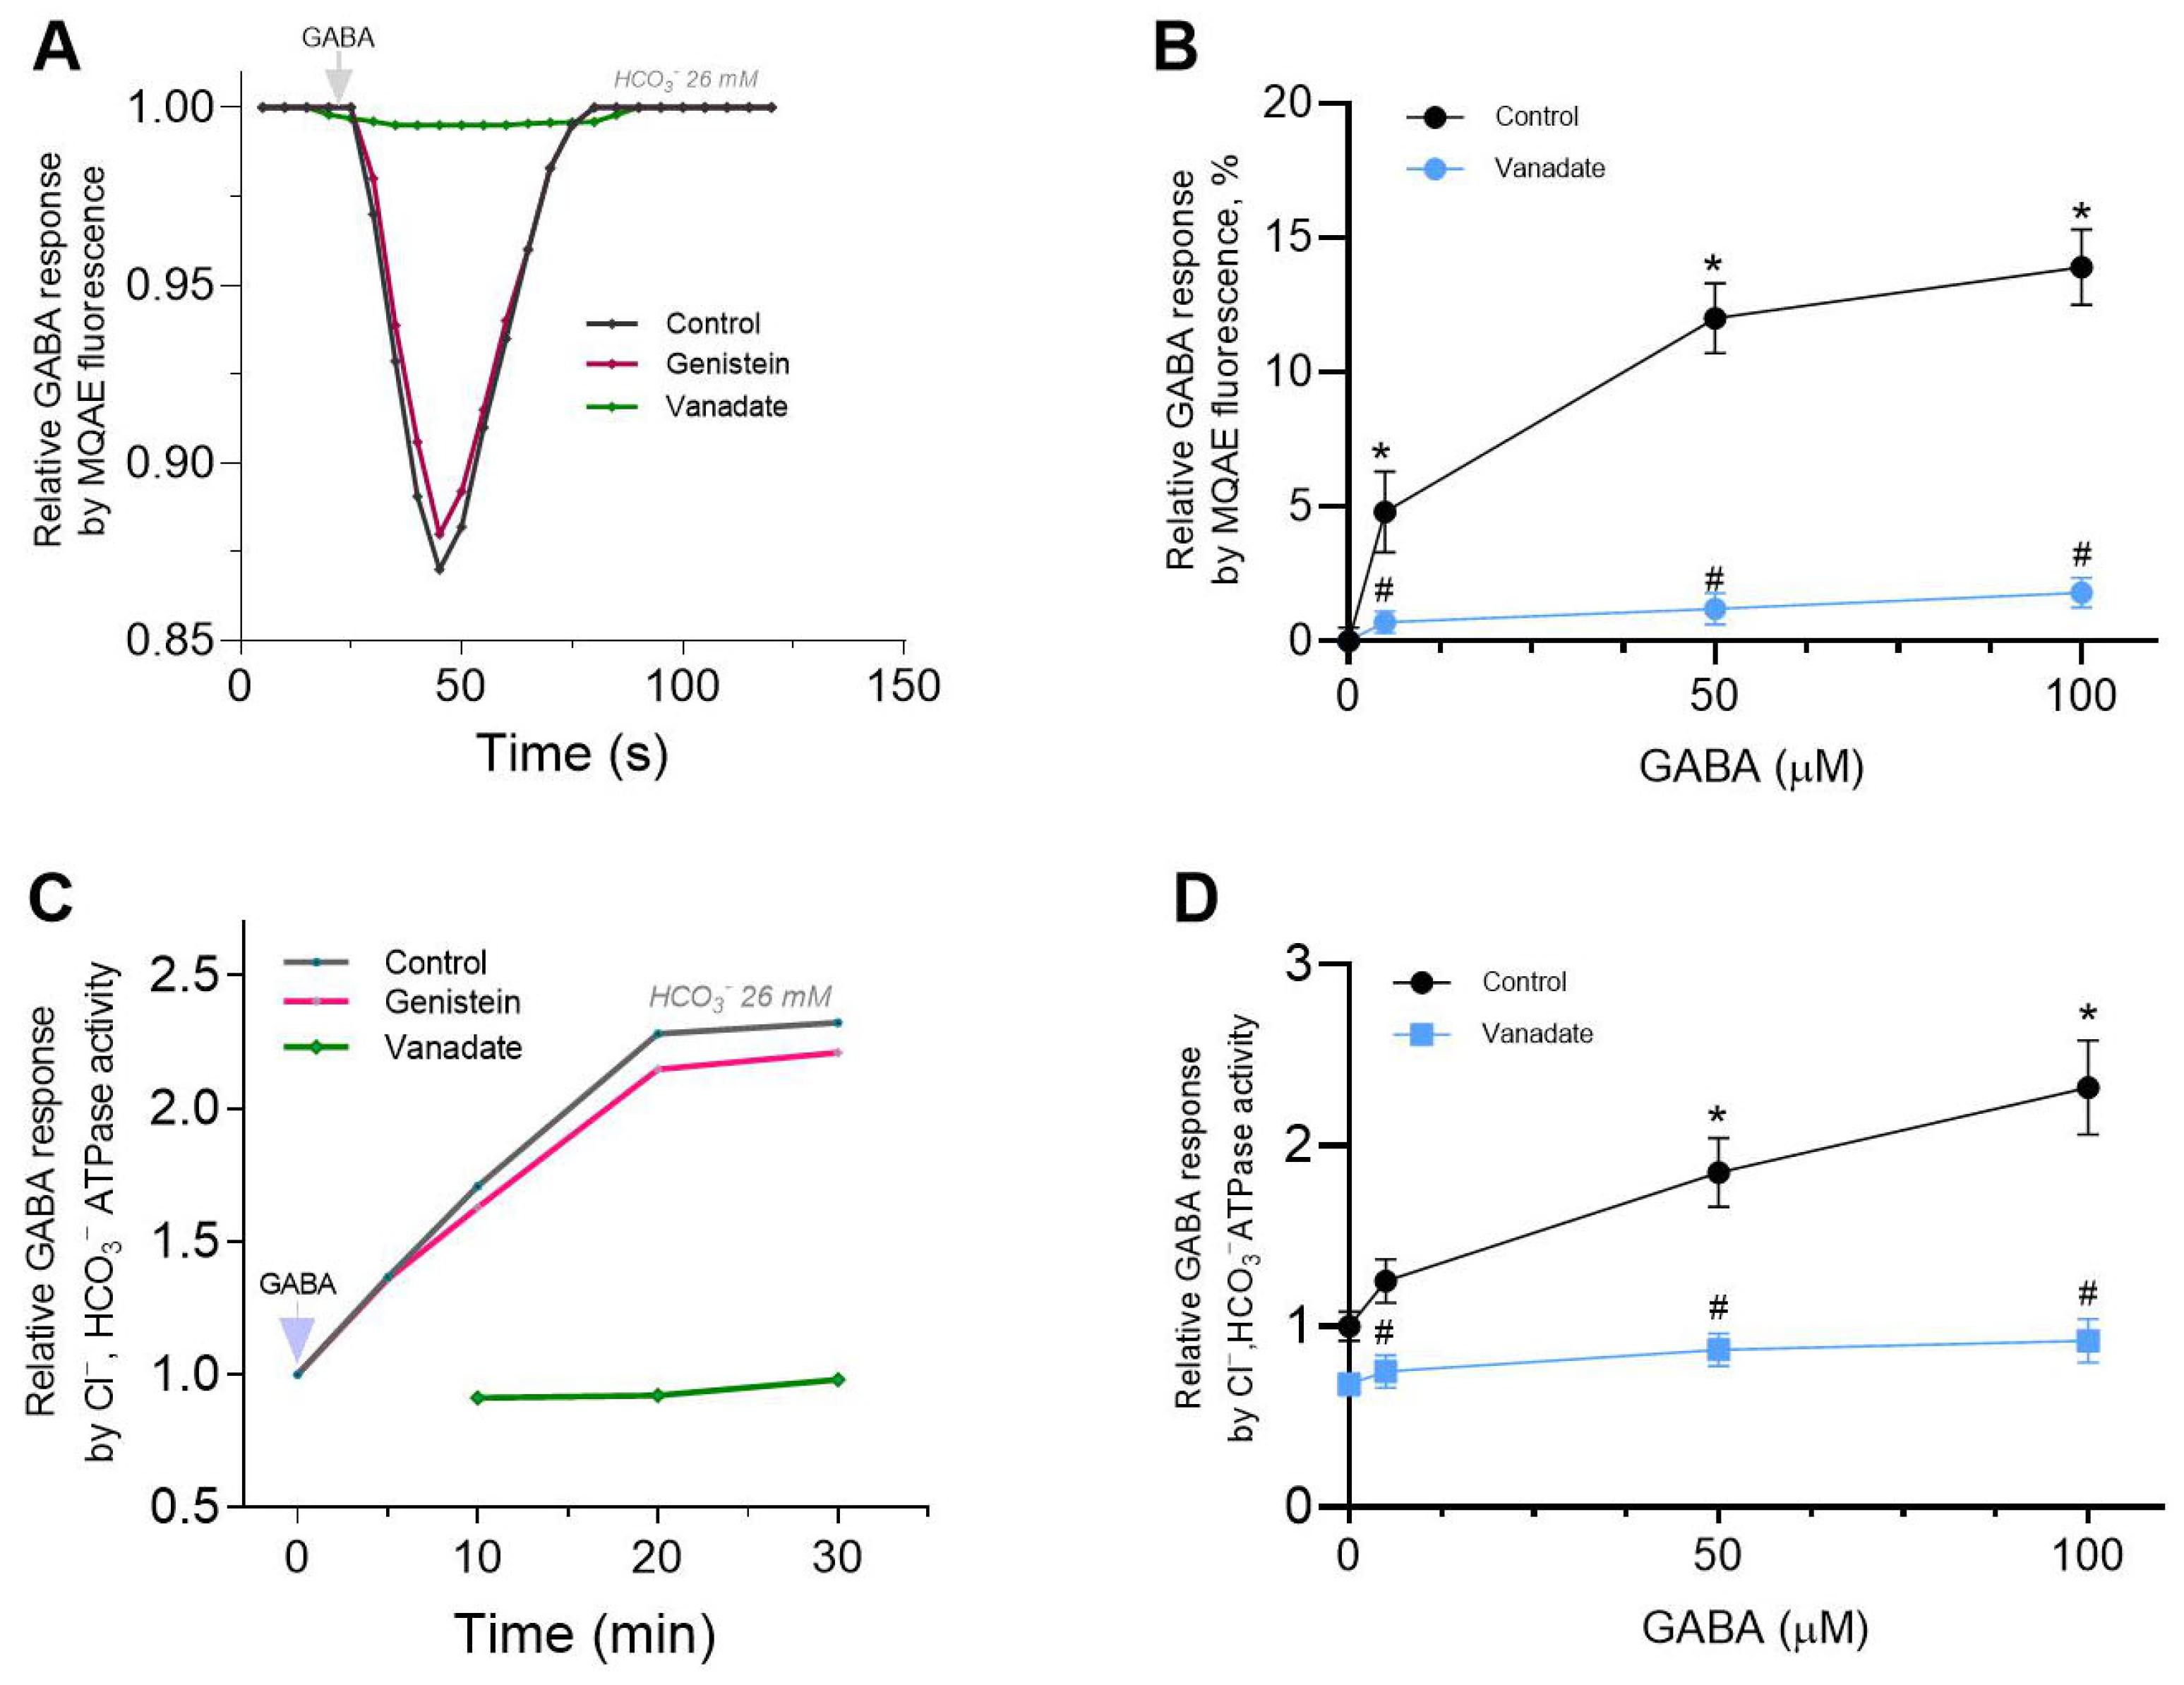
9]. Both types of inhibitor appeared to block GABA responses via different mechanisms. The data obtained in this work also indicate that genistein directly inhibits GABA-mediated chloride influx and chloride ATPase activities in neurons, assuming that no PTKs are involved in its action, only PPs. The way these chemicals act is affected by the presence of a physiological concentration of bicarbonate. Specifically, vanadate inhibits GABA
AR-mediated Cl
− inflow into neurons in the presence of HCO
3− but does not affect this process in their absence. Thus, genistein and vanadate have contrary effects on GABA
AR/ATPase activities in a bicarbonate-dependent manner. Moreover, these data indicate not only a coordinating role for HCO
3− in the differential manifestation of genistein and vanadate actions on receptor activity but also confirm a differential role for Cl
− and HCO
3− in passive or ATP-dependent permeability via ion channel pore. Data on the impact of genistein and vanadate on GABA-mediated pH
i changes also supports this. Specifically, vanadate completely inhibited GABA
A-mediated HCO
3− recovery, whereas genistein had no effect on such fluorescence changes (see
Figure 3D).
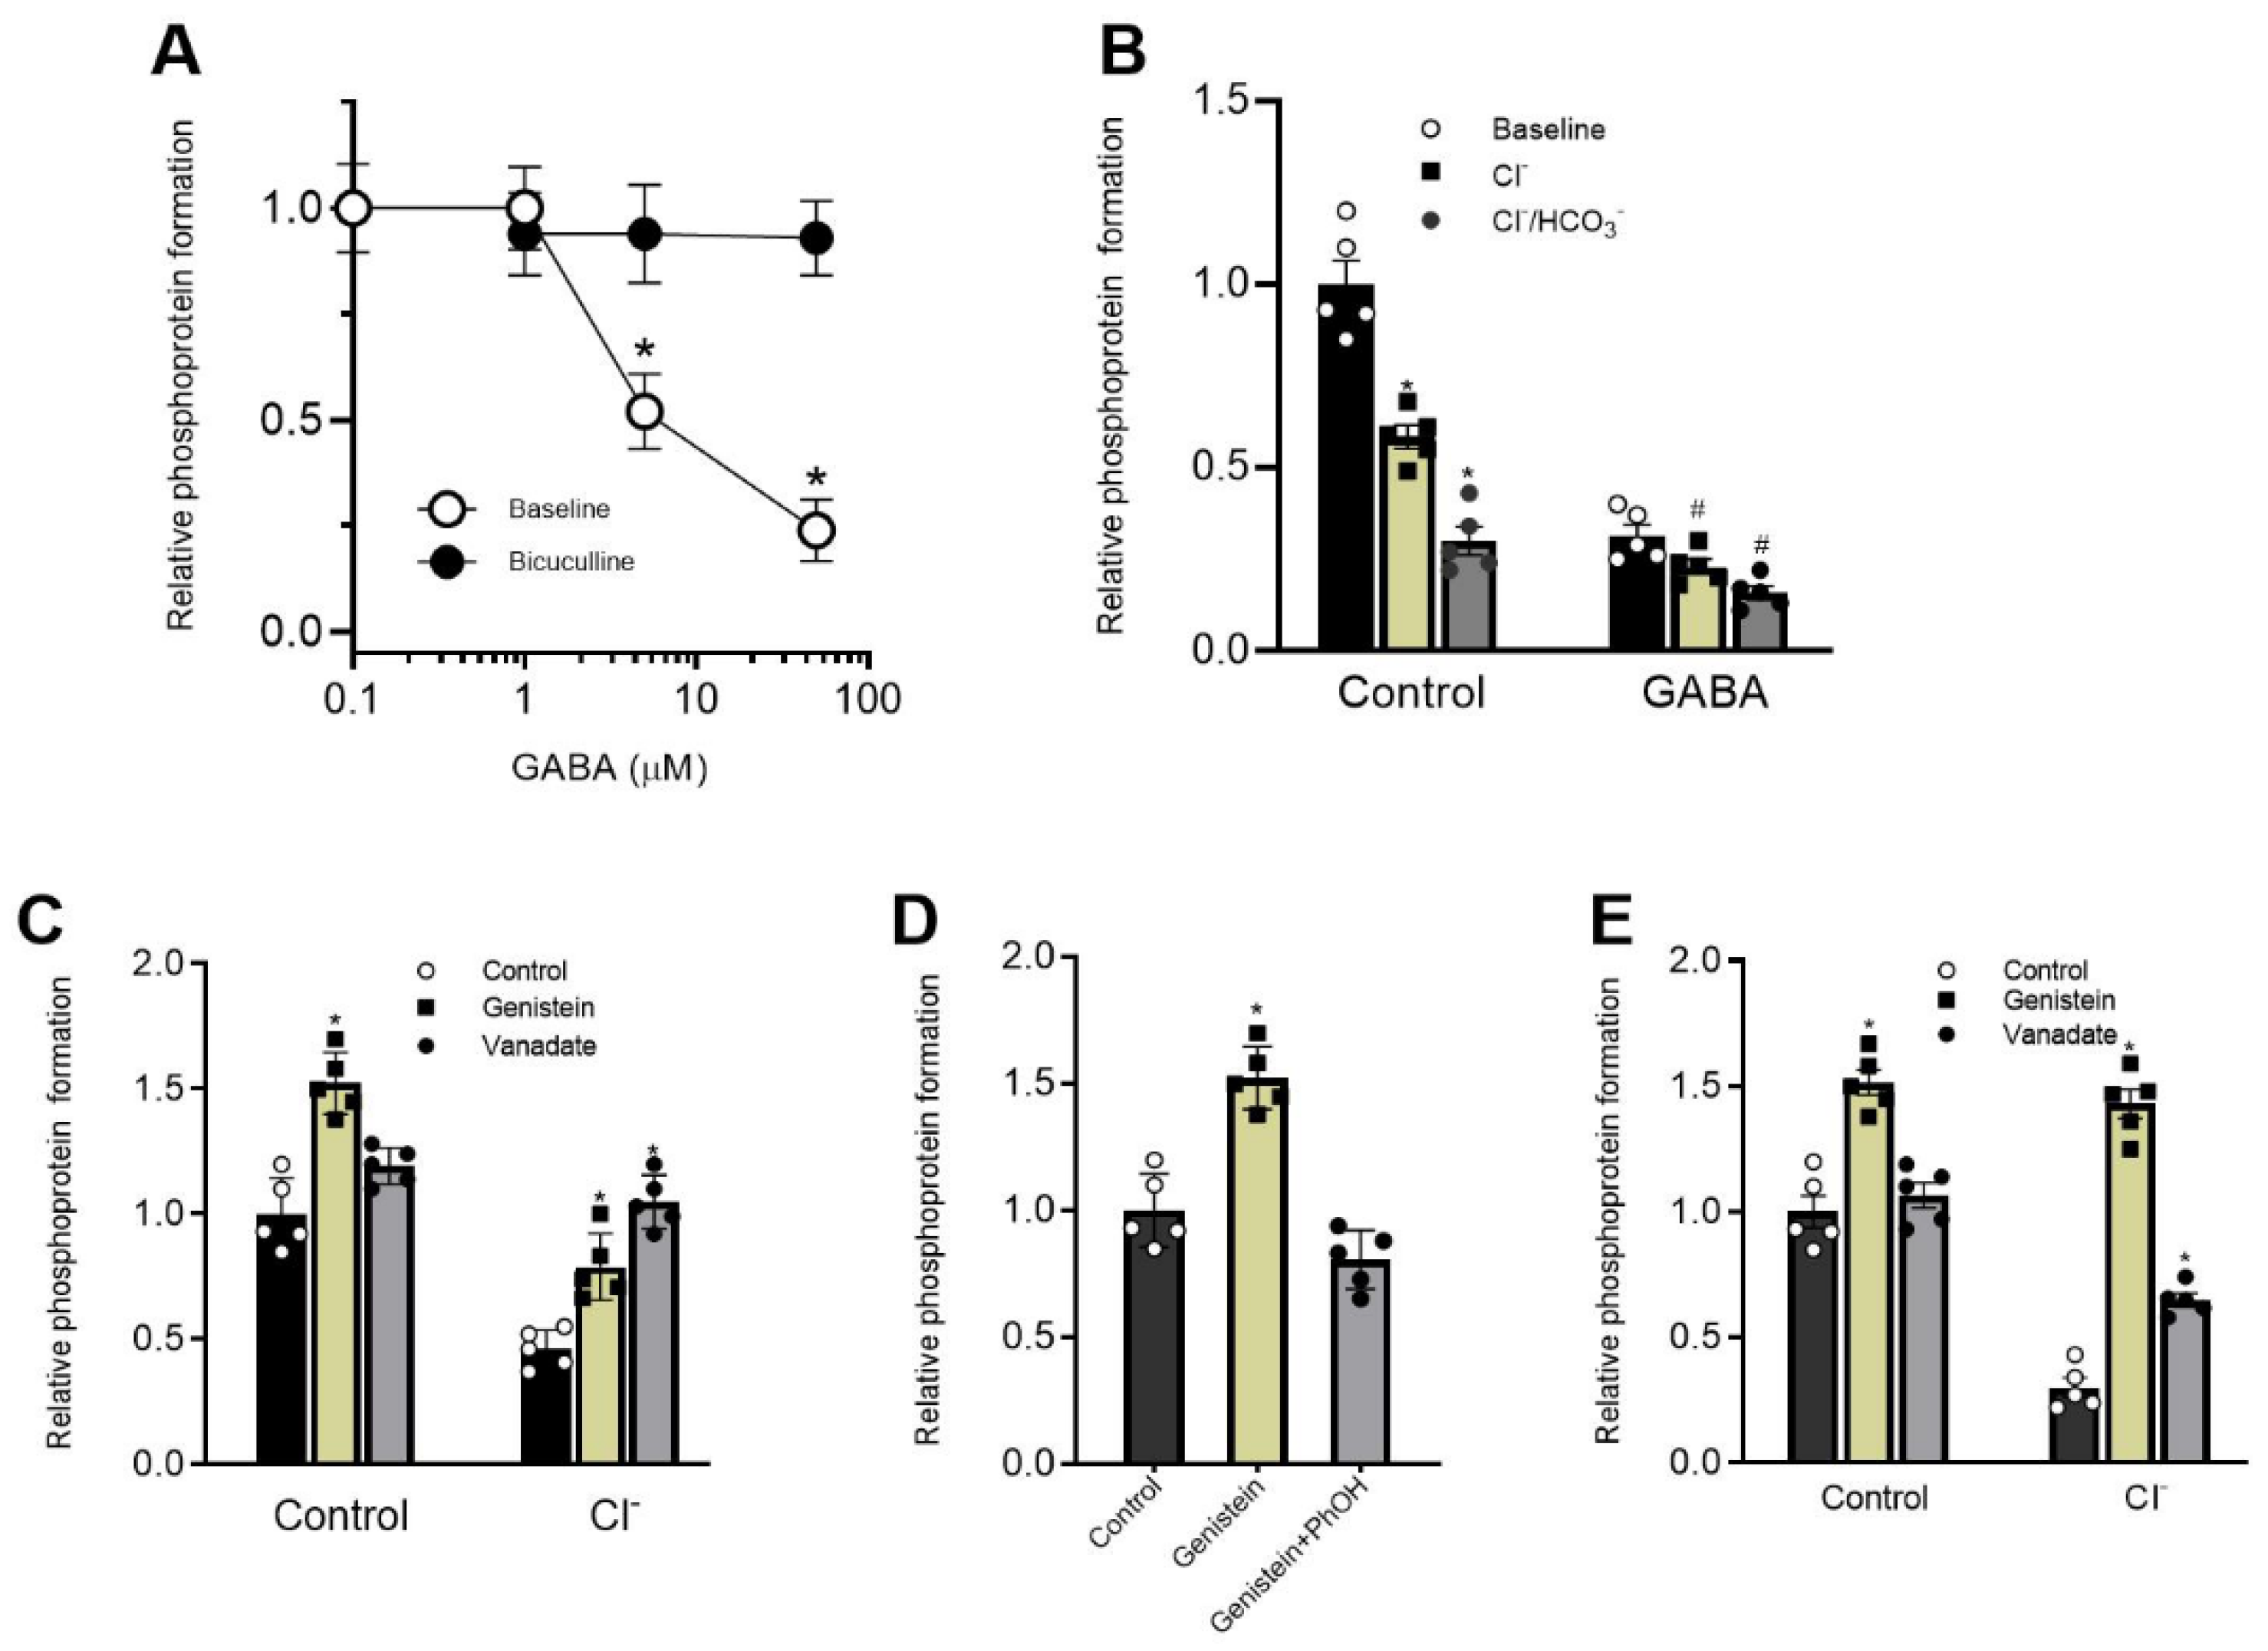
Here we showed that genistein’s inhibitory action on ATPase activity was significantly restored in the presence of phenol, unlike vanadate (
Figure 3B,E). These data suggest that genistein’s effect on the receptor occurs via its interaction with the hydroxyl groups of amino acid residues (most likely, tyrosine) with the formation of H-bonds and, as a result, modulation of phosphoprotein formation [
4,
38]. Indeed, chemicals containing -OH groups in their structure can interact with receptors via H-bond formation. Specifically, some studies demonstrate that a direct interaction between phenol compounds and the aromatic hydroxyl of a tyrosine in the structure of pLGICs occurs [
39]. While some authors have shown that phosphorylation regulates the activity of the proteins by creating a network of hydrogen bonds among specific amino acid residues nearby [
38]. Genistein and vanadate produce an increase in the basal phosphoprotein level, suggesting that such an effect could be associated not only with inhibition of the activity of the receptor-bound phosphatases but also with modulation of the formation of the hydrogen bonds. Moreover, data received assume different mechanisms of interaction of these ligands with ATP-binding sites within the receptor molecule. However, it cannot be ruled out that phenol binds to a site different from the binding sites of the tested blockers in the β3 subunit structure, and their interaction occurs via the allosteric pathway. Indeed, the GABA
ARs can interact with a wide variety of phenol chemicals with diverse structures, and it is possible that the interaction with genistein, vanadate and phenol represents opportunistic binding of these agents to receptor molecules, involving the ion channel pore. The interaction of these chemicals at the receptor molecule is confirmed by the decrease in phenol-induced neuropsychiatric disorders in rats by genistein. These data are similar to literature data. For example, flavonoids have been shown to reduce phenol-induced tremor in mice [
36,
37].
Overall, our data demonstrate the opposing roles of genistein and vanadate in modulating GABA
AR/ATPase function. Such multidirectional systems are considered to be bistable elements involved in the regulatory mechanisms of synaptic plasticity [
1]. In addition, our study has established an essential role for HCO
3− in regulating the action of these chemicals with different structures and modes of action (
Figure 6). However, our data do not address the mechanism by which HCO
3− eliminates the effect of genistein on GABA
AR/ATPase function. Given that HCO
3− has specific properties, including the regulation of neuronal activity Via interactions with cAMP or protein kinases [
40], these findings suggest that HCO
3− can bind directly to amino acid residues and thereby modulate their conformation. This hypothesis is supported by data on direct interactions of HCO
3− with chemosensitive neurons and subsequent changes in their functional activity [
40]. A detailed study of the phenol-sensitive mechanism by which isoflavones can interact directly with GABA
ARs will contribute to the design of new pharmacological agents.
4. Materials and Methods
4.1. Animals
Animal experiments were carried out using adult male Wistar rats purchased from the Institute of General Pathology and Pathophysiology vivarium and weighing 130–160 g at the time of arrival unless otherwise stated. Rats were always group-housed (5 per cage) and maintained in a temperature-controlled environment (23 ± 1) on a 12:12 h light-dark cycle and had access to food and water ad libitum.
4.2. Synaptoneurosomes and Plasma Membrane Preparation
Synaptoneurosomes (SNs) and plasma membranes (PMs) were prepared from freshly dissected rat forebrains (cortex) or HEK 293FT cells as previously described.
4.3. Cell Cultures and Transfection
For the expression of homo- or heteromeric GABAAR ensembles, human embryonic kidney 293FT cells (American Type Culture Collection) were used. The cells were purchased from Invitrogen (Carlsbad, CA, USA) as part of the MembraneProTM Functional Protein Expression System (A11667), and the cell line identity was not further authenticated. The cells were grown and maintained in an incubator (Sanyo, Osaka, Japan) at 37 °C in a humidified atmosphere with 5% CO2, in DMEM media (41965-039, Gibco, Inchinnan, UK) supplemented with 0.1 mM MEM NEAA (11140035, Gibco, Inchinnan, UK), 4 mM l-glutamine, 1 mM sodium pyruvate, 4.5 g/L d-glucose (15023021), and 10% FBS (10270-106, Gibco, Waltham, MA, USA) until the 20th passage, as suggested by the vendor. HEK 293FT cells were transfected by Lipofectamine TM 2000 or 3000 (Invitrogen, Thermo Fisher Scientific, Waltham, MA, USA and Lithuania) transfection reagents according to the manufacturer’s instructions. Cells were harvested and analyzed 24 h after transfection. For transfection procedures and virus-like particle (VLP) production, the same growth medium with decreased FBS content up to 4% was used according to the manufacturer’s recommendations. Geneticin G418 sulfate (11811031, Invitrogen, Waltham, MA, USA) was present in the growth medium at a concentration of 500 mg/mL constantly except during the transfection. The cells were subcultured at confluence by treatment with 0.05% trypsin and 0.02% EDTA in PBS. For selection purposes and improving the yield of VLPs, the transfection medium was removed after 24 h, and a fresh growth medium with 10 µg/mL blasticidin (R21001 Gibco, Waltham, MA, USA) was added. Transfected cells and VLPs were collected and analyzed 24–48 h after transfection.
4.4. Molecular Biology
The genes encoding the full-length rat GABAAR α2, β3, or γ2 subunits were amplified by PCR from the cDNA library (Evrogen, Moscow, Russia) using gene-specific primers with Kozak sequence at the 5′ end of the forward primer based on ‘GenBank:NM_001135779.2’, ‘GenBank:NM_X15468.1’, and ‘GenBank:NM_183327.1’ sequences, respectively. The PCR products were cloned into the pEF6/V5-His TOPO TA vector (K961020, Invitrogen, Waltham, MA, USA) separately and verified by DNA sequencing. Each vector was amplified using E. coli TOP10 strain in LB medium supplemented with 20 µg/mL ampicillin. Isolation and purification of plasmids were performed with the PureYieldTM Plasmid Miniprep System (Promega, Madison, WI, USA) and Plasmid Midiprep 2.0 (Evrogen, Moscow, Russia). The sterilization of plasmids was implemented Via 0.22-µm filtration. The concentration of plasmids was evaluated on a spectrophotometer NanoDrop 1000 (Thermo Fisher Scientific, Waltham, MA, USA). The quality validation of cloning and growth was performed additionally through enzymatic restriction by XbaI and BamHI in BamHI buffer (Thermo Fisher Scientific, Waltham, MA, USA), and the following electrophoresis in 1% agarose gel.
The typical transfection procedure of GABAAR subunit-containing constructs for the subsequent biochemical, spectrofluorometric, and Western blot analyses was as follows. Approximately 5 × 10⁵ HEK293FT cells were suspended in 8 mL DMEM, plated into a 90 mm culture dish, and maintained for approximately 24 h until 50–90% confluence. Then, 5 μg of plasmid DNA (β3 alone) was added combined with Lipofectamine® 3000 Reagent (Invitrogen, Thermo Fisher Scientific, Waltham, MA, USA) in Opti-MEM® I (1×) + GlutaMAXTM-I medium (51985-026, Gibco, Inchinnan, UK) according to the manufacturers’ recommendations. For microscopy, the cells were plated in 35 mm dishes and were incubated with a proportional amount of reagents and vectors.
For VLP production, GABAAR subunit-containing constructs were transfected together with Membrane Pro TM Reagent (Invitrogen, Waltham, MA, USA) amenably. Transfected HEK293FT started to bud off VLPs from the cell membrane approximately 24 h after transfection. The harvesting procedure was executed in conformity with the manufacturer’s recommendations. Briefly, the VLP-containing medium was mixed with Membrane ProTM Precipitation Mix in the ratio of 5 to 1, where 5 refers to the medium. Then, the mix was incubated at 4 °C overnight. After incubation, VLPs were pelleted by centrifugation at 5500× g for 30 min and resuspended in HEPES buffer for subsequent analysis or stored at −80 °C.
4.5. GABAAR-Mediated Cl−/HCO3− Transport Monitoring
Cl
−-sensitive fluorescent dye MQAE (N-(Ethoxycarbonyl-methyl)-6-Methoxyquinolinium Bromide) or pH-sensitive fluorescent dye BCECF, AM (2′,7′-Bis-(2-Carboxyethyl)-5-(and-6)-Carboxyfluorescein, Acetoxy methyl Ester) were obtained from Thermo Fisher Scientific, USA (E3101) or B1170, respectively. A stock solution was prepared in H
2O, aliquoted, and stored in the freezer (−20 °C) protected from light. For cases in which fluorescence measurements were conducted, the HEK 293FT cells or SNs with loaded dye were stored in an opaque test tube at RT or 4 °C. Sodium bicarbonate (144-55-8), γ-aminobutyric acid, GABA (56-12-2), bicuculline (485-49-4), genistein (446-72-0) and (13721-39-6) were obtained from Sigma-Aldrich (St. Louis, MI, USA). SNs were loaded with dye (MQAE or BCECF) in BSS for 1 h at 37 °C and stored in an opaque test tube at RT or 4 °C. For that, the control HEK 293FT cells and GABA
AR β3 isoform cells were trypsinized by adding 0.05% trypsin-EDTA solution (25200056, Gibco BRL, Waltham, MA, USA), washed with PBS twice, resuspended in the BSB, and then loaded with MQAE for 1 h at 37 °C. After loading, the suspension was centrifuged at 200×
g for 5 min at RT and kept in the aforementioned medium at RT in the opaque test tubes. For analysis, the pellet was resuspended in the BSB. Monitoring was performed with cells continuously superfused with incubation medium composed of (mM):135 NaCl (or 135 NaCl and 25 NaHCO
3), 0.5 KH
2PO
4, 0.8 MgCl
2, and 5 mM Hepes (pH 7.4). Dye-loaded cells (SNS or HEK 293FT) were equilibrated in the test tube in the incubation medium (V = 200 µL) in the absence or presence of compounds for about 10 min at 37 °C before initial fluorescence measurements, and then 150 μL of the suspension was added into a quartz microcuvette (non-flow cell) and stirred. The GABA-mediated Cl
− or HCO
3− transport was initiated directly by the addition of GABA in a final concentration of 1–100 µM in the cuvette by an in-house solution supply system. GABA
AR-mediated Cl
− or HCO
3− transport was assessed by the dynamic measurements of the variations in the fluorescence intensity of Cl
—sensitive fluorescent dye MQAE-loaded or BCECF-loaded HEK 293FT cells or SNs using a FluoroMax
®-4 spectrofluorometer (HORIBA Scientific Edison, Piscataway, NJ, USA), respectively. The excitation and emission wavelengths were 350 nm and 480 nm for the measurement of Cl
− transport or 490 nm and 535 nm for the measurement of HCO
3− transport, respectively. The Δ
F/
F of each trial was calculated as (
F−
F0)/
F0, where
F0 is the baseline fluorescence signal averaged over a 10 s period (this was the control measurement) immediately before the start of the application of GABA and supplement compounds. The value of 100% was obtained as the fluorescence intensity before the application of GABA (it was considered as non-specific change in fluorescence), in the absence or presence of test compounds. The maximum amplitude of GABA-mediated fluorescence responses was calculated as the maximal difference in fluorescence intensity in the absence or presence of an agonist. In addition, we performed several tests to assess whether cell integrity was maintained during the experiments (
Supplementary Data).
Bicarbonate in the buffer was determined by an acid-base titration, where the sample is titrated against a standard acid solution (H2SO4) using phenolphthalein and methyl orange. Phenolphthalein is added as an indicator to detect the presence of carbonates (which will turn the solution pink). Methyl orange is then added to detect the bicarbonate. The solution will turn yellow, and the titration continues until it changes to orange, indicating the end point.
4.6. ATPase Activity Monitoring
The ATPase activity in PMs of neurons or HEK 293FT cells expressing the various constructs was measured as previously described [
22]. PMs (~8 µg) or VLPs (~16 µg) were added into a glass tube with 0.5 mL of an incubation medium containing 20 mM HEPES-Tris pH 7.3, 5 mM NaCl/25 mM NaHCO
3 (or 25 mM NaCl), 40 mM NaNO
3 (neutral salt) and 0.5 mM EGTA and/or 50 µM ruthenium red (to eliminate the effect of Ca
2+ATPase) to measure enzyme activity. The PMs or VLPs were preincubated at 37 °C for ~20 min with the relevant compounds in the incubation medium. Preparation of the test tube with bicarbonate–NaHCO
3 (1 mM) was previously dissolved in HEPES (20 mM) and then added to the 20 mM HEPES-Tris buffer (pH 6.7). After preincubation, the enzyme reaction was started by the addition of Mg
2+-ATP 2 mM (final concentration) in the incubation medium. After 15–20 min of incubation, the ATPase activity was stopped by the addition of reagents for measuring inorganic phosphorus (P
i). The Cl
−- and Cl
−, HCO
3−ATPase activities were determined as a difference in the formation of P
i in the absence and in the presence of NaCl (2–60 mM) or NaHCO
3 (2.5–25 mM) in the incubation medium, respectively. Adenosine 5′-triphosphate (ATP) disodium salt hydrate (34369-07-8) and adenosine 5′-triphosphate disodium salt hydrate (A26209) were obtained from Merck (Kenilworth, NJ, USA). The concentration of P
i in the incubation medium was measured by a modified method of Chen et al. (1956) [
15,
22] using a Cary 60 UV–vis spectrophotometer (Agilent, Santa Clara, CA, USA) at a wavelength of 650 nm. The γ-phosphate analog, orthovanadate (VO
43−) (Sigma-Aldrich, St. Louis, MI, USA), was obtained by boiling the vanadate solution (pH 10; 10 min), and freshly boiled stock was diluted to the final concentration (pH 7.3) prior to use.
4.7. Protein Phosphorylation
The plasma membranes were phosphorylated in 30 μL of incubation medium containing 25 mM MOPS–Tris (pH 6.0), 3 mM MgSO4, and protein (approximately 40 μg). The phosphorylation reaction was started by the addition to the incubation medium of 70 μM ATP-γ-32P (specific radioactivity, 5 × 10⁻⁶ dpm/nmol) (Amersham, Biosciences, London, UK). The mixture was incubated at 0–1 °C for 2 min. To study the effect of 5 mM Cl−/25 mM HCO3−, genistein, vanadate or phenol on the phosphoprotein formation, the membrane preparation was preincubated with the ligands at 0–1 °C for 15 min.
4.8. Detection of the Phenol-Induced Behavioral Responses
Behavioral testing was conducted in a clear Plexiglas box (35 × 35 × 25 cm). On the day of experimentation, the animals were transferred to the testing room and left for 1 h for acclimatization. They were randomly assigned to experimental groups, and experimental HTR and tremors were produced in animals (the total number was 50 rats) by a single injection of phenol intraperitoneally (i.p.) as previously described [
15]. In head twitching responses (HTR) and tremor tests, rats were divided into eight groups of five animals each. Group 1 (control) was treated with vehicle (NaCl 0.9%) i.p. Immediately after injections, animals returned to the monitoring chamber. HTR and tremor were recorded manually for 15 min post-injections. The number of animals in experimental groups regarding time points was five. The time period of analysis was selected from previous experiments showing that phenol-induced disorders occurred mainly within 15 min. HTR was defined as a rapid rhythmic shaking of the head in a radial motion. The tremor was assessed as the involuntary quivering movement of the whole body. To evaluate tremor, animals were placed individually in an observation box. The occurrence of tremors was rated by an observer blinded to the treatment protocol. The period between the injection of phenol and the appearance of the first symptoms of tremors was recorded at the time of onset of tremors. The duration of tremors was recorded as the time between onset and complete disappearance of tremors. Tremor intensity was evaluated using a four-point ranked scale: no tremor—0, mild tremor—1, moderate intermittent tremor—2, moderate persistent tremor—3, and pronounced severe tremor—4 [
15].
4.9. Western Blot Analysis
Western blot was carried out as previously described [
22]. The plasma membranes or VLPs of transfected 293FT cells, as well as the His-tagged purified receptor elution fractions, were subjected to SDS/PAGE using the SDS-PAGE Reagent Starter Kit (1615100 Bio-Rad, Hercules, CA, USA) and to Western blot analysis by the Pierce™ Fast Western Blot Kit (35055 Thermo Scientific) and the ECL Plus Western Blotting Detection System Substrate (GE Healthcare, Chicago, IL, USA). Samples were SDS-treated using boiling for 5 min in a buffer consisting of 62.5 mm Tris, 10% glycerol, 5% 2-mercaptoethanol, 4% SDS, and 0.001% bromophenol blue, and then ~20 µg of total protein was loaded into SDS/PAGE. Electrophoresis’ parameters were as follows: 70 V for 10 min on 4% SDS/PAGE stacking gel and 120 V for 50 min on 12.5% SDS/PAGE resolving gel. Proteins were transferred onto the PVDF membrane by the semidry method using 0.09 A·cm
−2 for 1 h. After that, membranes were incubated for 1 h in a blocking solution containing 5% milk and then incubated at 4 °C overnight with primary GABRB3 monoclonal antibodies (MA5-27698 Thermo Fisher Scientific), diluted 1:2000 with the blocking solution. After incubation, the membranes were washed with TBS-T four times for 15 min each washing and then incubated at RT for 1 h with secondary HRP-conjugated antibodies (62-6520 Thermo Fisher Scientific), diluted 1:5000 with the blocking solution. Then, the membrane was washed with TBS-T four times, and the GE Healthcare ECL Plus Western Blotting Detection System (Amersham™, GE Healthcare) was applied according to the manufacturer’s instructions. The visualization of the bands was obtained on a Kodak Image Station 440 (Kodak, Rochester, NY, USA).
4.10. Statistical Analysis
The data are expressed as the mean ± SEM, and differences were considered significant for p < 0.05. Statistical differences were determined by a two-tailed Student’s unpaired t-test for data with equal variances and which were assessed as normally distributed with the Shapiro–Wilk test. Graphs and statistical analysis were obtained by using GraphPad Prism 9.3 (GraphPad Software, San Diego, CA, USA).


 ,
, 