Article

Ibuprofen Does Not Prevent Inhibition of Fetal Breathing Movements Caused by Intrauterine Inflammation in Fetal Sheep

by
Nhi T. Tran
1,2,†,
Vanesa Stojanovska
1,2,†,
Sharmony B. Kelly
1,2,
Kayla Vidinopoulos
1,2,
John Atta
1,2,
Eva Matthews-Staindl
1,
Valerie A. Zahra
1,2,
Yen Pham
1,2,
Eric A. P. Herlenius
3,4,
Stuart B. Hooper
1,2,
Beth J. Allison
1,2,
Robert Galinsky
1,2,*,‡ and
Graeme R. Polglase
1,5,*,‡
1
The Ritchie Centre, Hudson Institute of Medical Research, Clayton, VIC 3168, Australia
2
Department of Obstetrics and Gynaecology, Monash University, Clayton, VIC 3168, Australia
3
Department of Women’s and Children’s Health, Karolinska Institutet, 17176 Solna, Sweden
4
Astrid Lindgren Children’s Hospital, Karolinska University Hospital Stockholm, 17176 Solna, Sweden
5
Department of Pediatrics, Monash University, Clayton, VIC 3168, Australia
*
Authors to whom correspondence should be addressed.
These authors contributed equally to this work.
These authors also contributed equally to this work.
Int. J. Mol. Sci. 2025, 26(12), 5591; https://doi.org/10.3390/ijms26125591
Submission received: 13 February 2025 / Revised: 21 May 2025 / Accepted: 4 June 2025 / Published: 11 June 2025

Abstract

Antenatal inflammation/infection is a major cause of neonatal apnoea and hypoventilation. Prostaglandin E2 (PGE2) is a key inflammatory mediator associated with depression of fetal and neonatal breathing. We aimed to determine whether antenatal ibuprofen, a cyclooxygenase inhibitor that reduces synthesis of PGE2, restores fetal breathing movements (FBM) in late-gestation fetal sheep exposed to systemic lipopolysaccharide (LPS). Fetal sheep (125 days gestation, d; term ~148 d) were instrumentally monitored for continuous measurement of FBM and physiological parameters. At 130 d fetuses were randomly allocated between groups receiving i.v. saline (CTLSAL, n = 9), escalating doses of LPS (i.v.) over 3 days (LPSSAL, n = 8), or ibuprofen one hour after each LPS dose (LPSIBU, n = 8). Regular plasma samples were collected for PGE2 assessment. At 135 d, cerebrospinal fluid and brainstem tissue were collected at autopsy for assessments of PGE2 expression, and immunohistochemical quantification of astrocytes and microglia within key brainstem respiratory centres was performed to assess inflammation. LPS exposure increased PGE2 levels in plasma, cerebrospinal fluid and the RTN/pFRG (p < 0.05) and decreased the incidence, amplitude and amount of the accentuated (>5 mmHg) FBMs. Ibuprofen reduced plasma and RTN/pFRG PGE2 expression (p < 0.01 and p = 0.031, respectively) but did not restore FBMs. Astrocyte and microglial density increased in the RTN/pFRG, NTS and raphe nucleus in LPSIBU fetuses, compared to LPSSAL (p < 0.05). Antenatal ibuprofen treatment did not restore depressed FBM, despite reducing the circulating and brainstem PGE2 levels in LPS-exposed fetal sheep. Other inflammatory pathways or more specific targeting of PGE2 may be more effective in preventing apnoea caused by exposure to intrauterine infection/inflammation.

1. Introduction

Preterm infants exposed to antenatal infection/inflammation often suffer from respiratory depression and subsequently have increased risks of apnoea and hypoxemia, and in some cases, require prolonged respiratory support [1,2,3,4]. One way to reduce respiratory depression and subsequently improve neonatal outcomes would be to stimulate spontaneous breathing.
Ibuprofen is an FDA-approved drug used clinically for the treatment of patent ductus arteriosus in newborn infants [5]. The mechanism of action of this non-steroidal anti-inflammatory drug involves the non-selective inhibition of cyclooxygenases 1 and 2 (COX1 and COX2), thereby decreasing the synthesis of prostaglandins such as prostaglandin E2 (PGE2). PGE2 is notably involved in the regulation of breathing during the perinatal period [6,7].
The brainstem is made up of a complex network of respiratory centres comprised of densely interconnected neurons that govern breathing, and is highly sensitive to PGE2 [8]. For example, systemic infusion of PGE2 causes marked inhibition of breathing movements (FBMs) in fetal sheep [9,10,11], and apnoea and altered breathing rhythmicity in mice [12]. Moreover, newborn infants with elevated PGE2 in their cerebrospinal fluid have increased apnoea frequency [3]. Intravenous infusion of lipopolysaccharide (LPS) to fetal sheep increases PGE2 within the circulation, cerebrospinal fluid and brainstem, and results in depressed FBMs [13]. These findings suggests that regulation of central PGE2 levels is a potential target for the restoration of breathing after infection/inflammation-induced respiratory depression.
The aim of this study was to assess whether ibuprofen could prevent the inhibition of FBMs in late-gestation fetal sheep exposed to LPS-induced inflammation. We hypothesised that intravenous injection of ibuprofen after LPS exposure would reduce PGE2 concentration in the circulation and brainstem respiratory centres and restore FBMs.

2. Results

2.1. Fetal Characteristics: Fetal Breathing Movement Characterisation

Fetal characteristics at post-mortem (135± d) are presented in Table 1. LPSIBU fetuses had increased heart weight compared to CTLSAL and LPSSAL fetuses (p = 0.0019 and p = 0.0061, respectively) and a higher heart/body ratio compared to CTLSAL fetuses (p = 0.015). There were no differences in body, brain, lung, liver, and right kidney weight between groups.

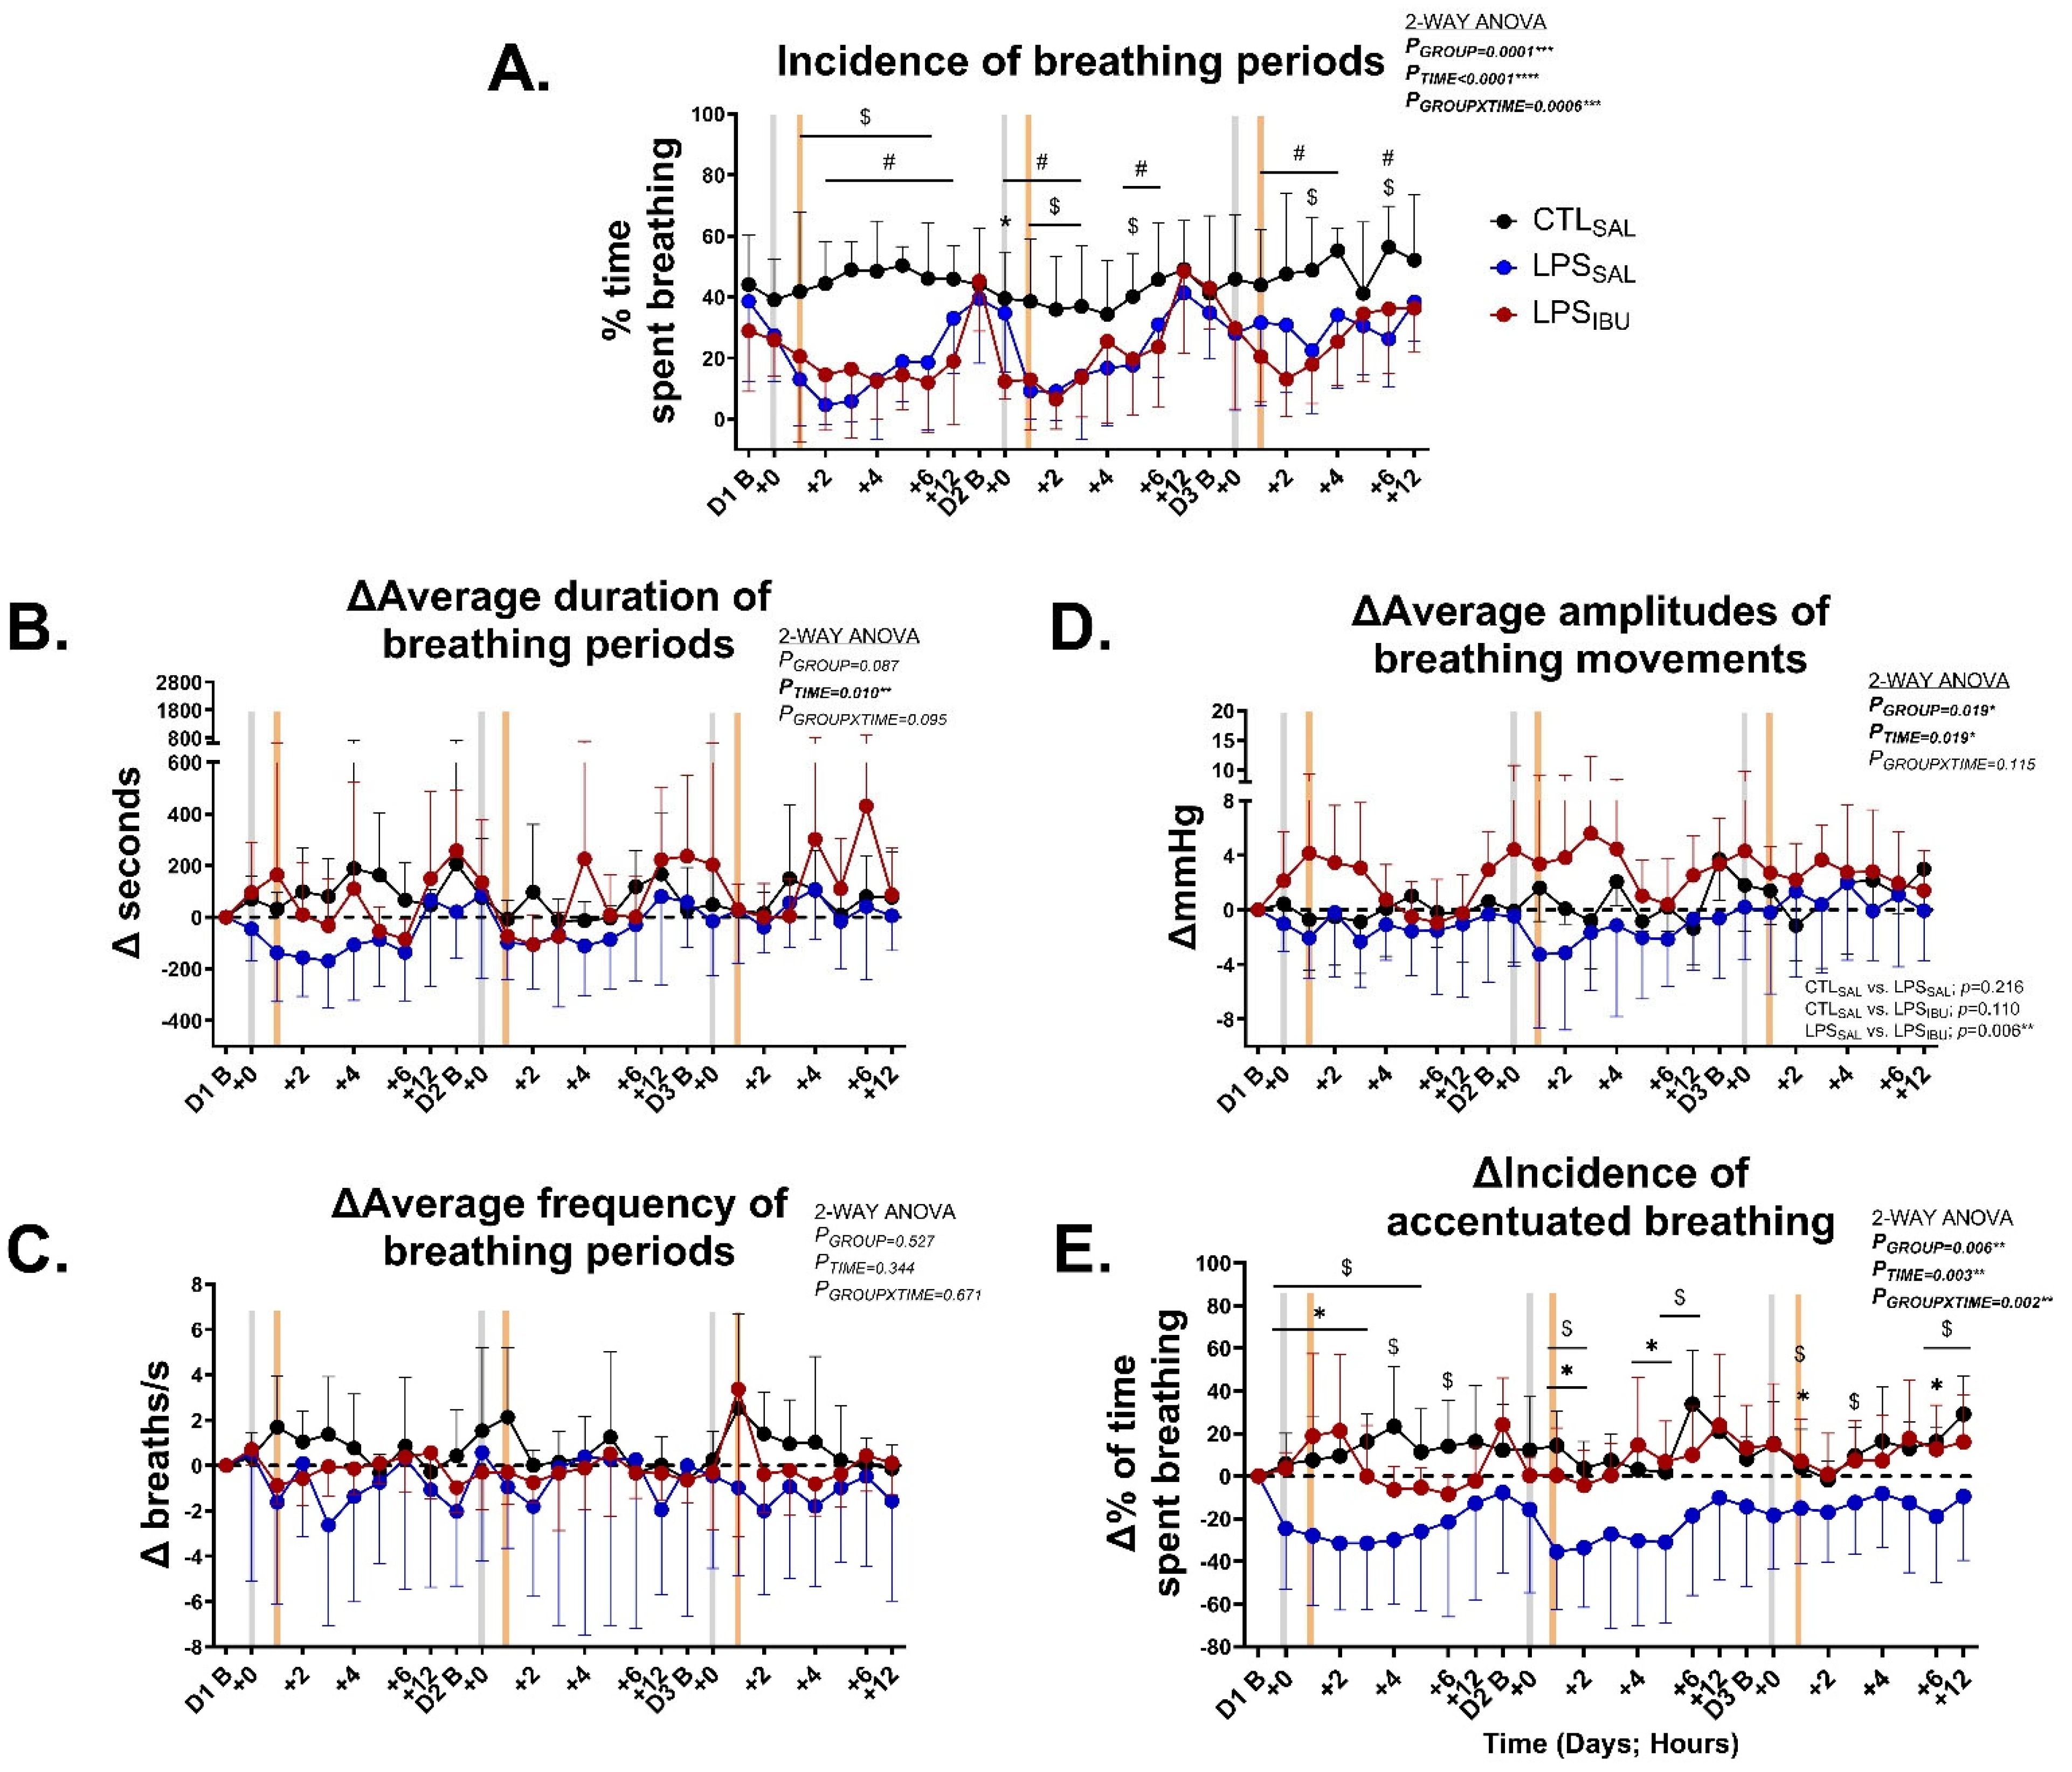
2.2. Fetal Breathing Movement Characterisation

At baseline, one hour (h) prior to the first LPS/saline infusion, all groups had similar FBM characteristics (incidence, duration, frequency, amplitude, and % of time spent exhibiting accentuated breathing) (Table 2).
The incidence of FBMs significantly decreased in LPSSAL fetuses between 1 and 6 h after the first LPS infusion, 1–3 and 5 h after the second LPS infusion, and 3 and 6 h after the third LPS infusion (all p < 0.05; Figure 1A). FBM were inhibited in LPSIBU fetuses between 2 and 12 h after the first LPS infusion, 0–3 and 5–6 h after the second LPS infusion, and 1–4 and 6 h after the third LPS infusion (all p < 0.05; Figure 1A). At the onset of the second LPS infusion, FBM were significantly lower in LPSIBU fetuses compared to both LPSSAL and CTLSAL fetuses (p = 0.013 and 0.0005, respectively; Figure 1A).
The average duration of breathing periods and average frequency of breathing periods were similar between groups (Figure 1B,C). The amplitude of FBMs in LPSIBU fetuses was higher than in LPSSAL fetuses (Figure 1D; p = 0.006). The amplitude of FBMs was similar between CTLSAL and LPSSAL fetuses. During FBMs, the proportion of accentuated breathing was significantly lower in LPSSAL fetuses intermittently between 0 and 6 h after each LPS infusion, compared to CTLSAL and LPSIBU fetuses (all p < 0.05; Figure 1E). There was no difference between the CTLSAL and LPSIBU groups.

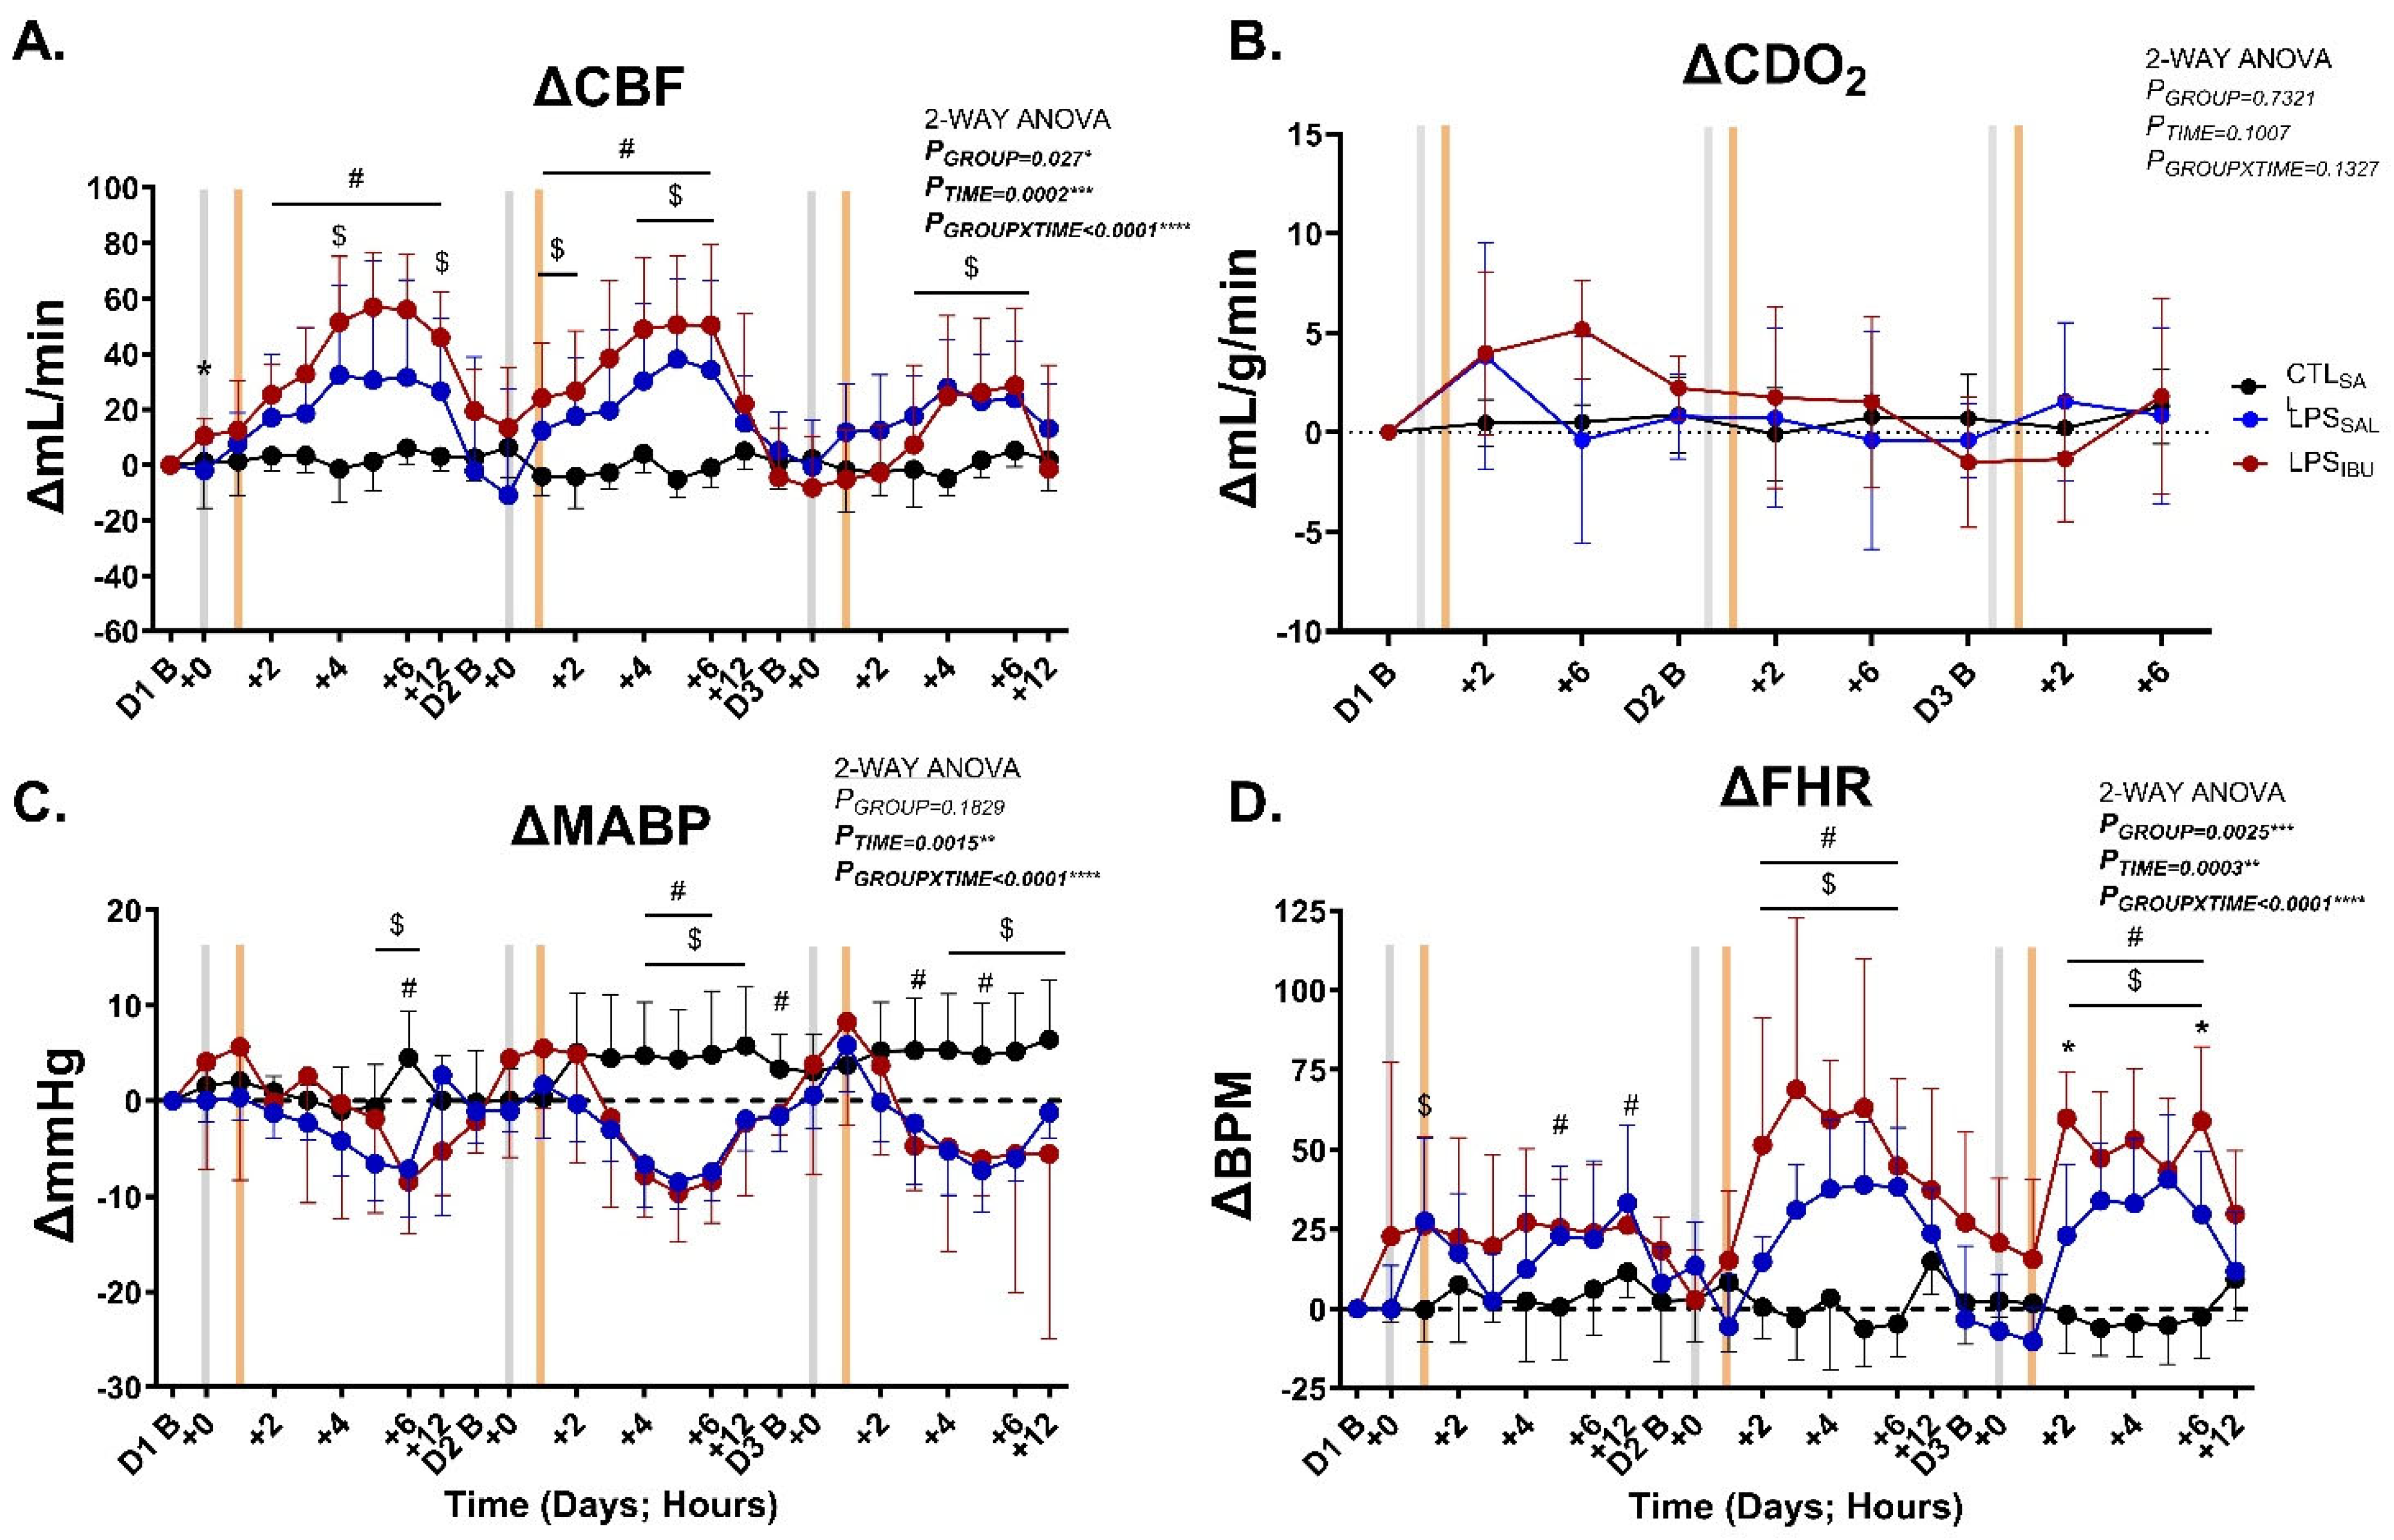
2.3. Systemic Hemodynamics

All groups had similar baseline carotid blood flow (CBF), cerebral oxygen delivery (CDO2), mean arterial blood pressure (MABP) and fetal heart rate (FHR) (Table 2).
CBF increased in LPSSAL and LPSIBU fetuses, compared to CTLSAL fetuses, after LPS infusions (Figure 2A), though CBF increased consistently in LPSIBU fetuses between 2 and 12 h after the first LPS dose and at 1 to 6 h following the second dose. There were no differences in CBF between the LPSIBU and LPSSAL groups throughout the experimental period.
CDO2 was unchanged following LPS exposure and ibuprofen administration and was not different between groups (Figure 2B).
After the first LPS infusion, MABP was reduced at 5–6 h in LPSSAL and at 6 h in LPSIBU fetuses compared to CTLSAL (Figure 2C), and FHR was significantly higher at 1, 5 and 12 h in LPSIBU fetuses compared to CTLSAL (Figure 2D). After the second and third LPS infusions, the reduction in MABP and rise in FHR was more prominent, occurring between 2 and 6 h after each LPS infusion in both LPS-exposed groups. There was a greater rise in FHR in LPSIBU fetuses compared to LPSSAL fetuses at 2 and 6 h after the third LPS infusion (p = 0.009 and 0.043, respectively).

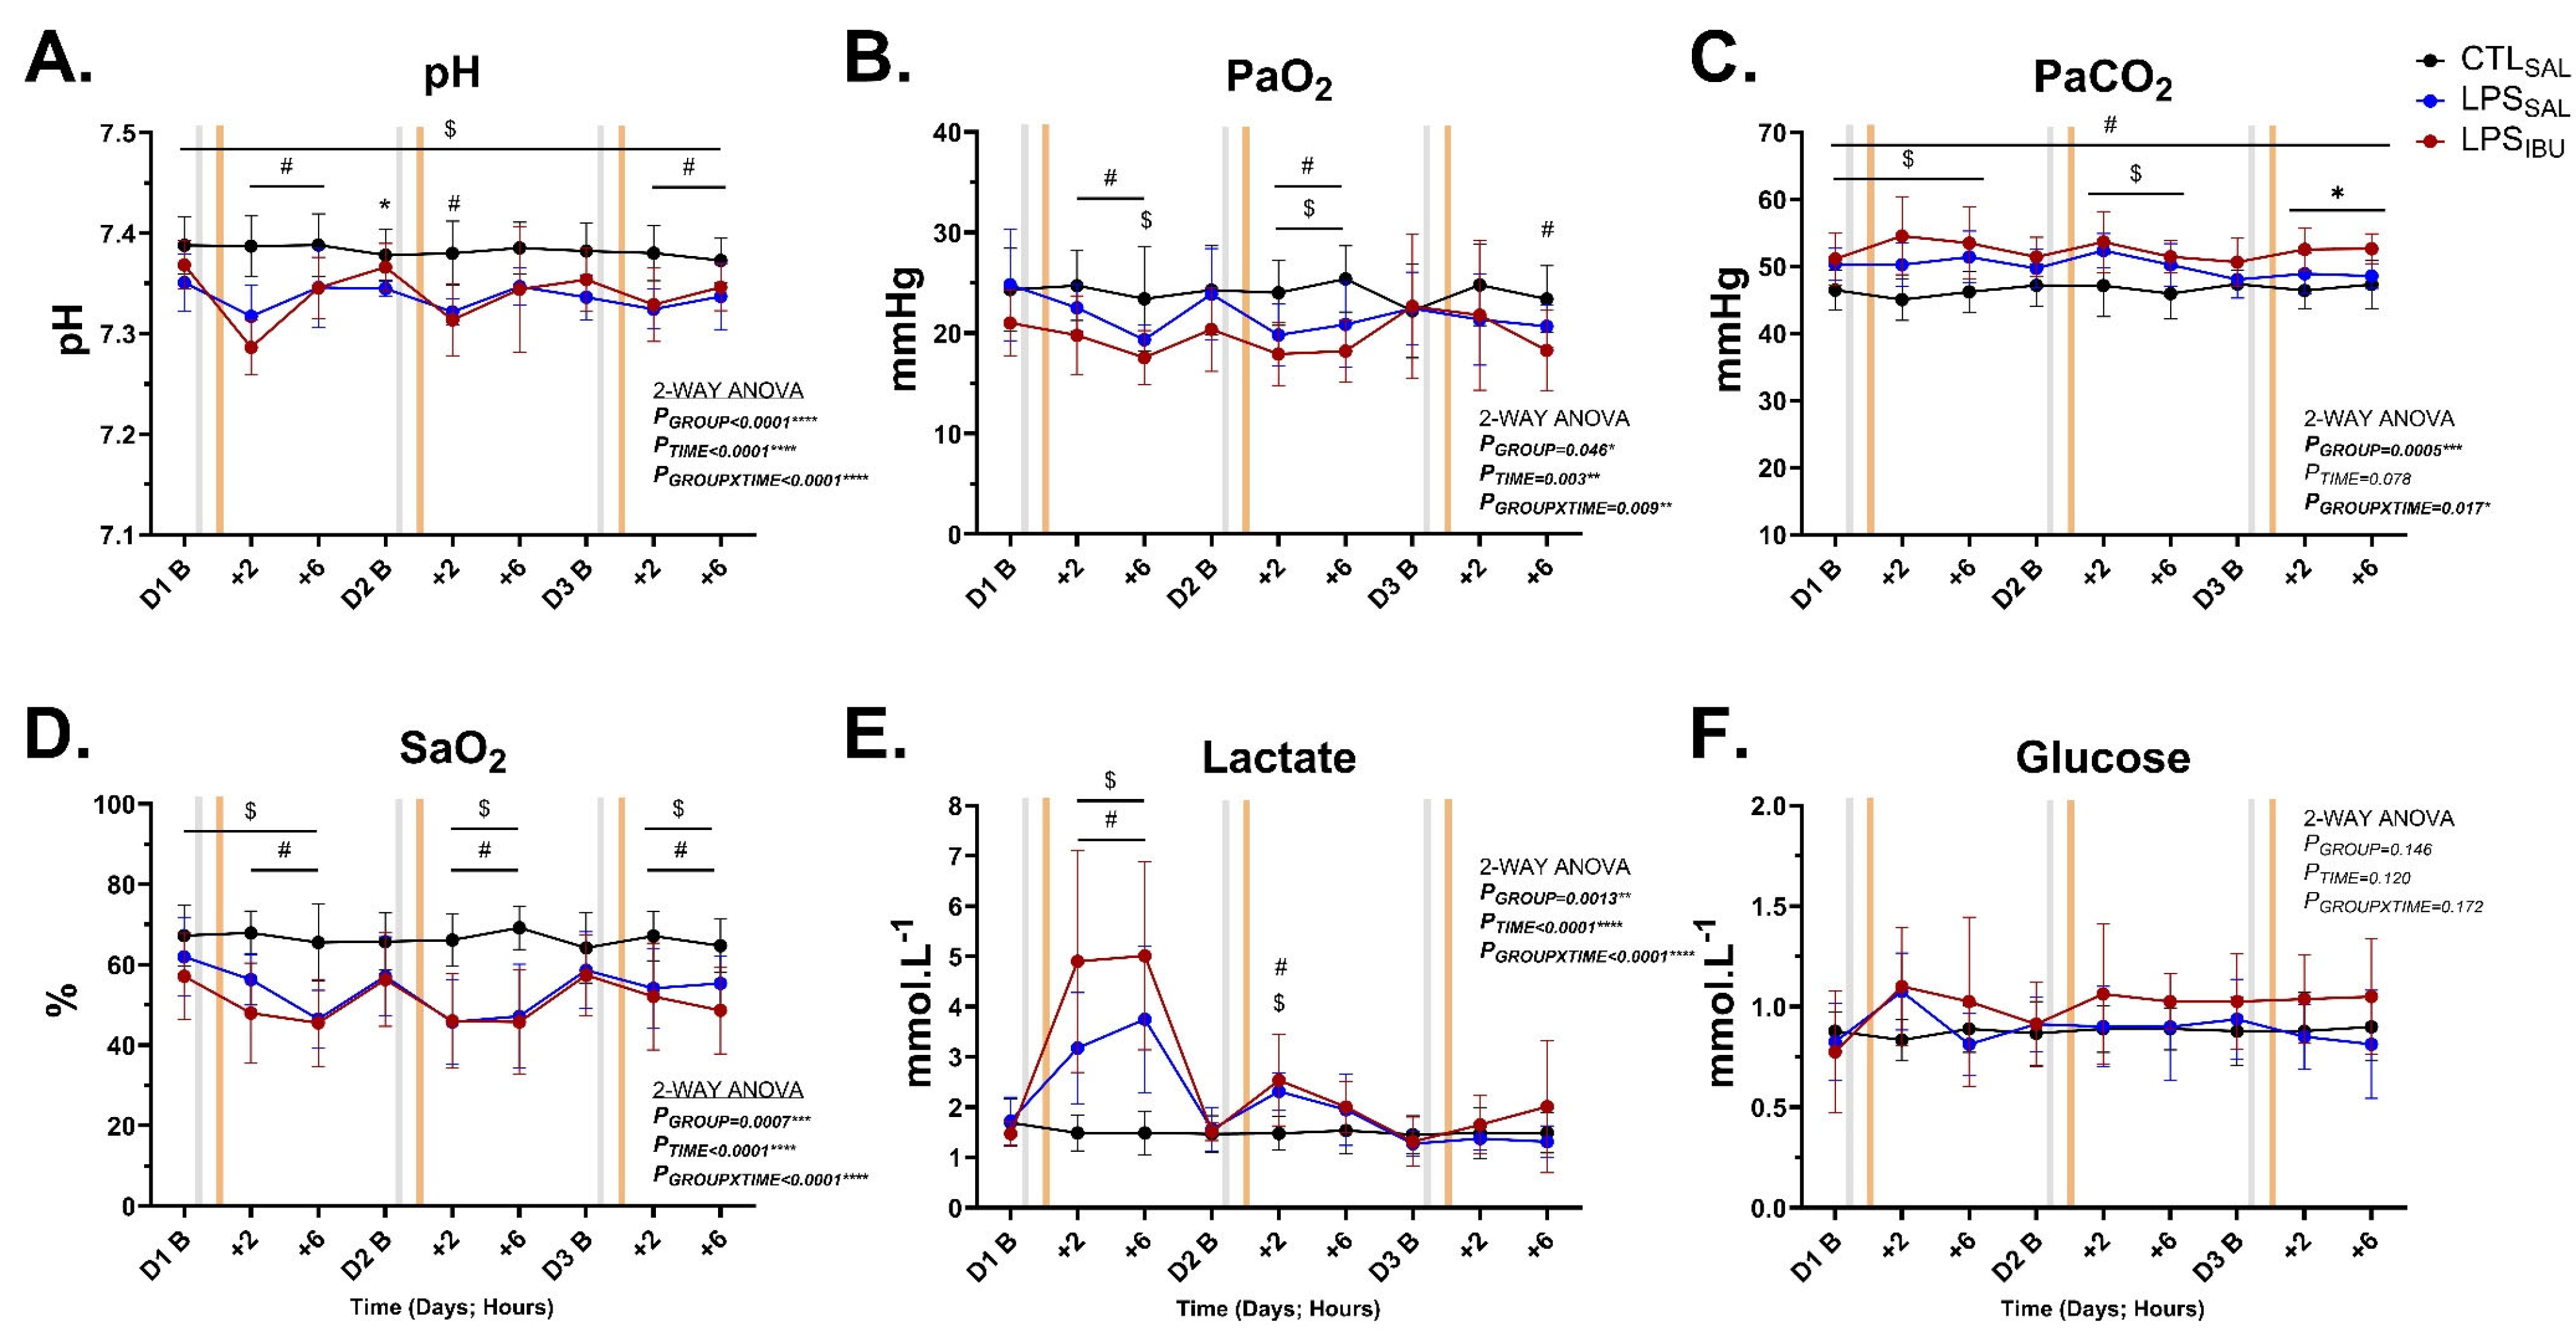
2.4. Fetal Blood Gases and Metabolites
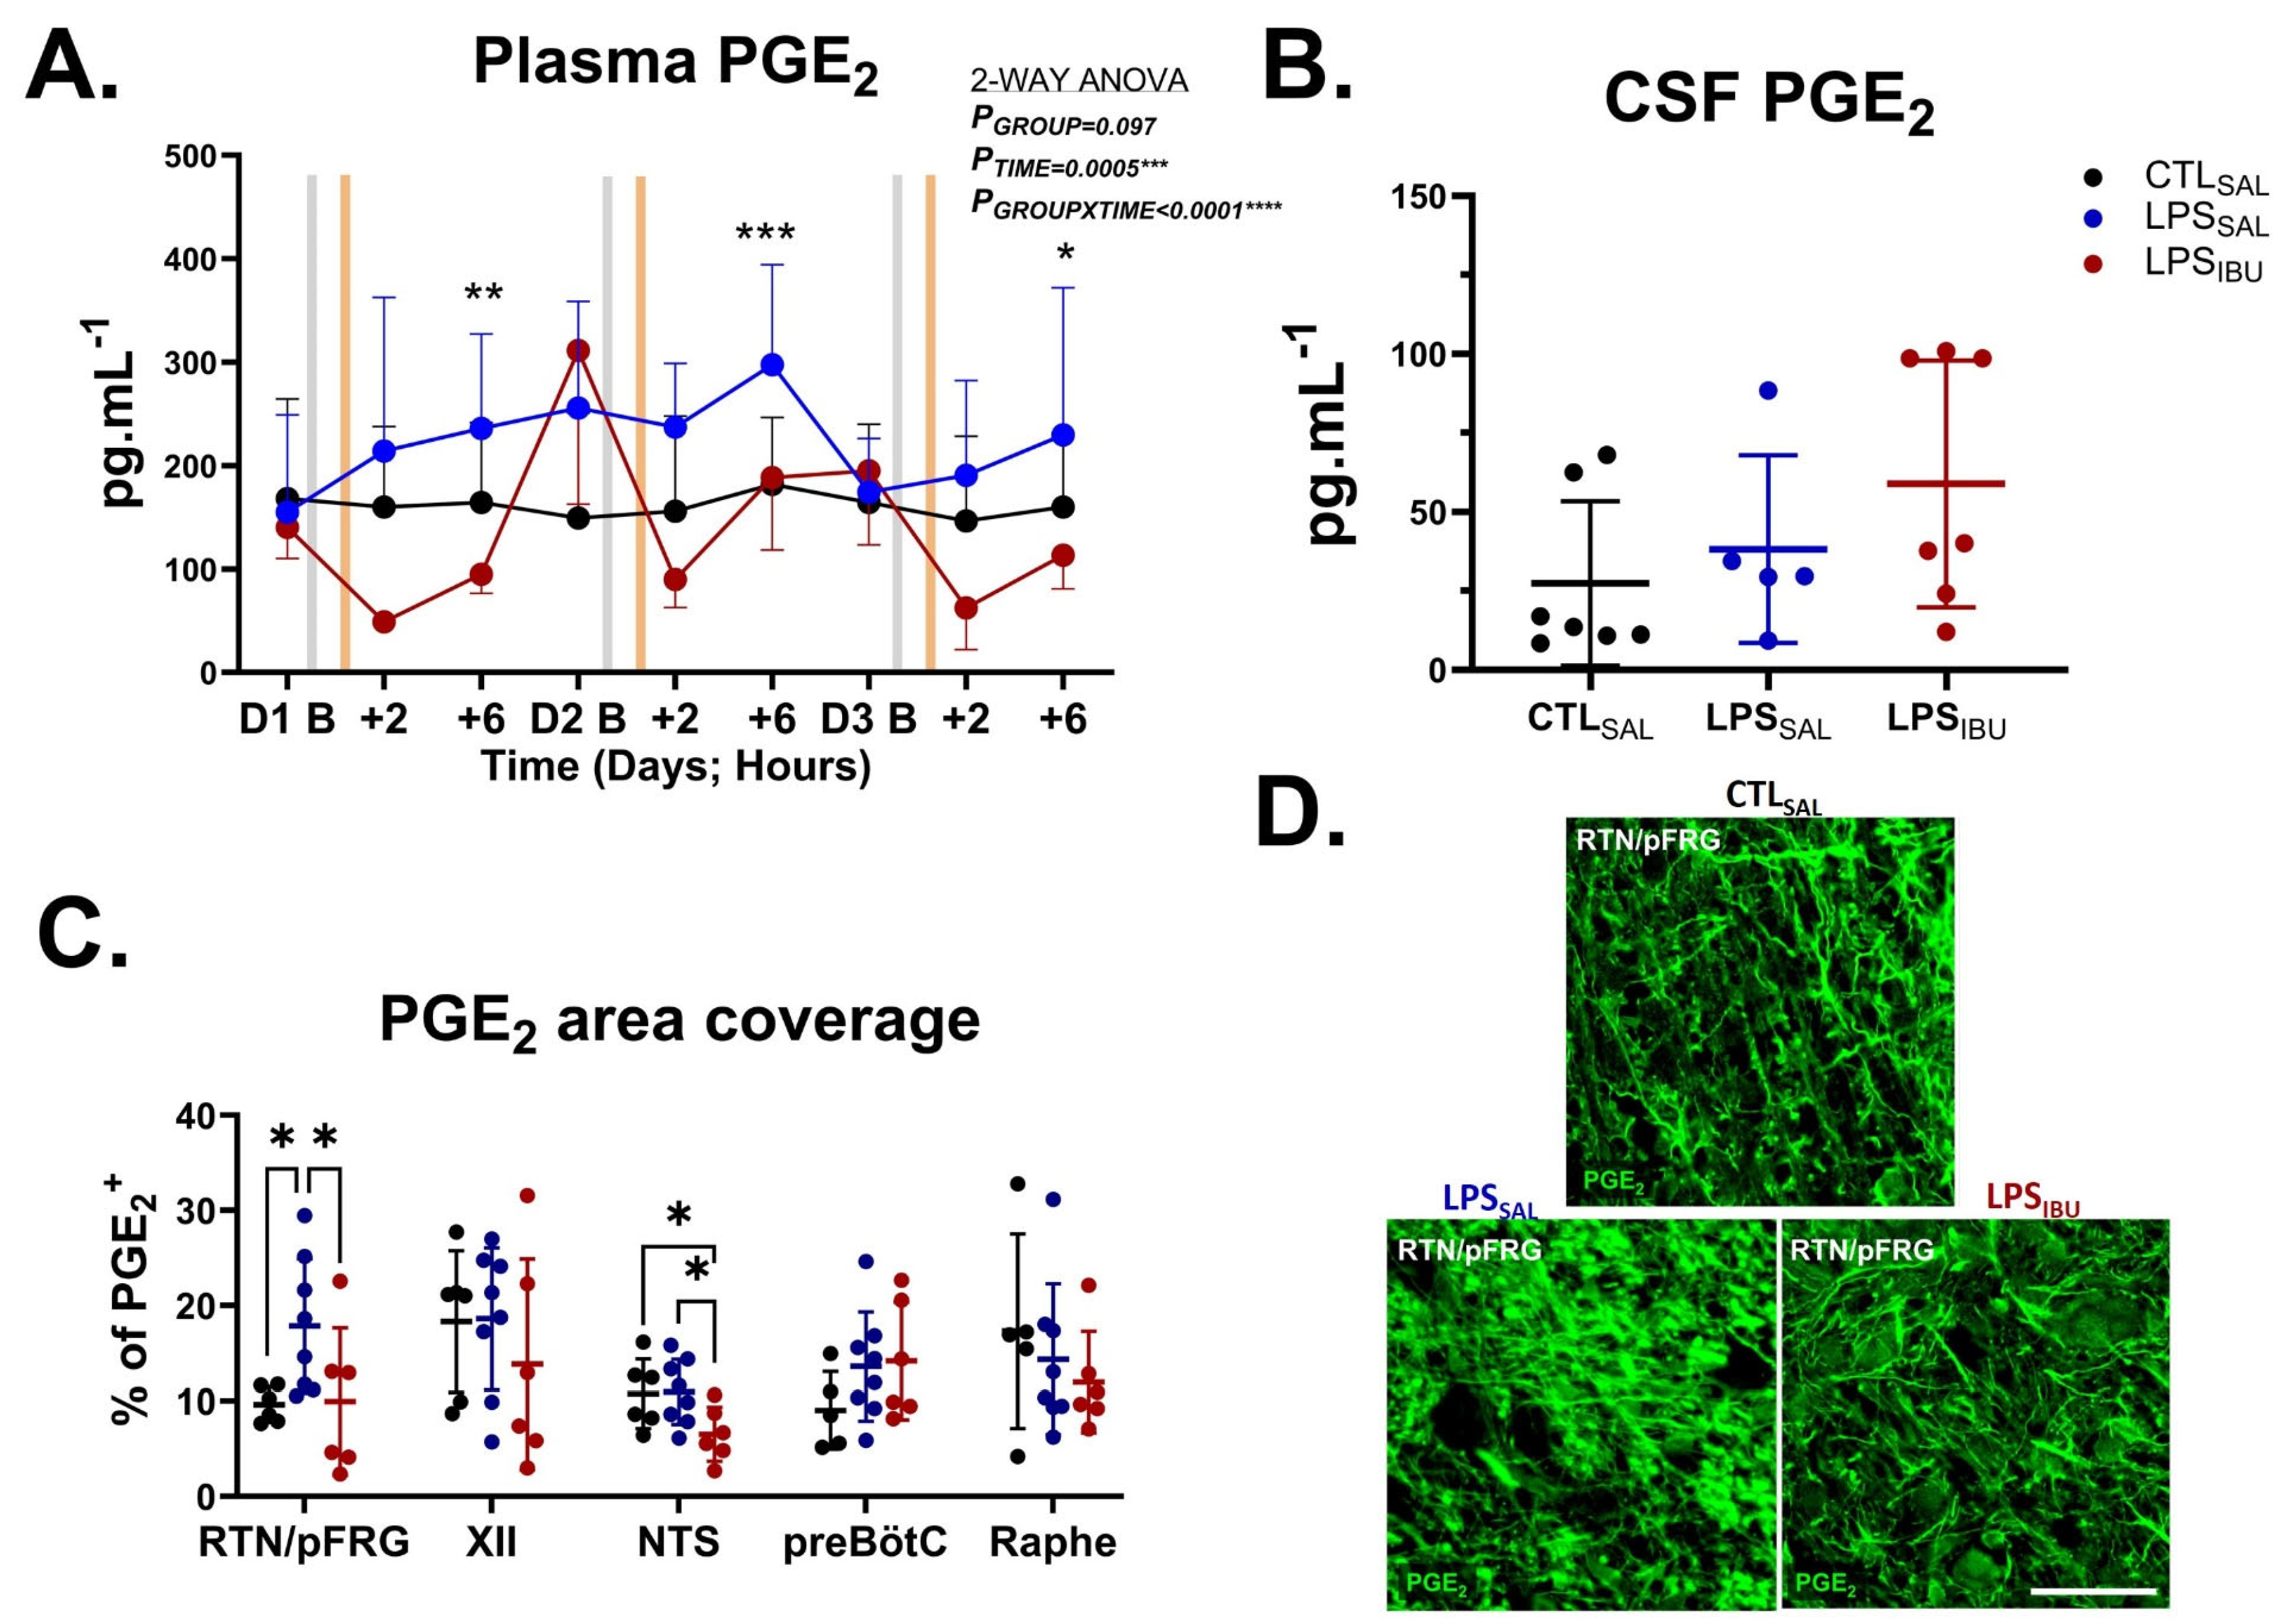
Escalating doses of LPS decreased arterial pH, PaO2 and SaO2 and increased arterial PaCO2 and lactate concentrations (Figure 3A–E). The pH was lower in LPSSAL fetuses compared to CTLSAL fetuses throughout the experimental timeline, while pH in LPSIBU fetuses was lower than CTLSAL from 2 and 6 h after each the first and 3rd LPS infusion (p < 0.05). At day 2 baseline, the pH of LPSIBU fetuses was higher than LPSSAL fetuses.
PaO2 in LPSSAL fetuses was lower compared to CTLSAL 6 h after the first LPS infusion and at 2 and 6 h after the second LPS infusion, while PaO2 in LPSIBU fetuses was significantly lower than CTLSAL at 2 and 6 h after the first and second LPS infusions and 6 h after the third LPS infusion (all p < 0.05; Figure 3B). PaCO2 levels in LPSIBU fetuses were significantly higher than in the CTLSAL fetuses throughout the experiment. PaCO2 levels in LPSSAL fetuses were higher than CTLSAL fetuses at 2 and 6 h after the first and second LPS infusions, as well as at day 1 baseline (Figure 3C). At 2 and 6 h after the third LPS infusion, PaCO2 level in LPSIBU fetuses was significantly higher than in LPSSAL fetuses (Figure 2C). SaO2 was lower in both LPSSAL and LPSIBU fetuses 2 and 6 h after each of the daily LPS infusions (all p < 0.05 compared to CTLSAL; Figure 3D). Lactate was higher at 2 and 6 h after the first LPS infusion and at 2 h after the second LPS infusion in both the LPSSAL and the LPSIBU groups (Figure 3E). No differences in arterial glucose levels were found between groups (Figure 3F).
At the end of experiment (48 h after last saline/IBU dose), PaCO2 was significantly higher in LPSIBU fetuses, compared to CTLSAL (p = 0.038) (Table 1), but arterial pH, PaO2, SaO2, lactate and glucose levels were not different between groups.

2.5. PGE2 Levels

PGE2 levels were assessed within the systemic circulation, the CSF, and key respiratory centres of the brainstem (Figure 4). Circulating PGE2 levels at baseline were not different between groups. LPS exposure increased plasma PGE2 levels, which peaked at 6 h after the second LPS infusion, though this did not reach statistical significance (p = 0.062 LPSSAL vs. CTLSAL; Figure 4A). Ibuprofen treatment decreased circulating PGE2 levels to levels below CTLSAL and was significantly lower than in LPSSAL fetuses at 6 h after the first LPS infusion and 2 h after the second and third LPS infusions (p < 0.05; Figure 5A). CSF PGE2 levels were not different between groups (Figure 4B).
PGE2 immunostaining was increased in the retrotrapezoid/parafacial respiratory group (RTN/pFRG) in LPSSAL fetuses, compared to both CTLSAL (p = 0.026) and LPSIBU fetuses (p = 0.031), but did not differ between CTLSAL-treated and LPSIBU-treated fetuses (Figure 4C,D). In the nucleus tractus solitarius (NTS), LPSIBU fetuses had decreased PGE2 immunostaining compared to CTLSAL (p = 0.041) and LPSSAL fetuses (p = 0.024). No differences in PGE2 immunostaining were found between groups in the hypoglossal nucleus (XII), preBötzinger complex (preBötC), or raphe nucleus.

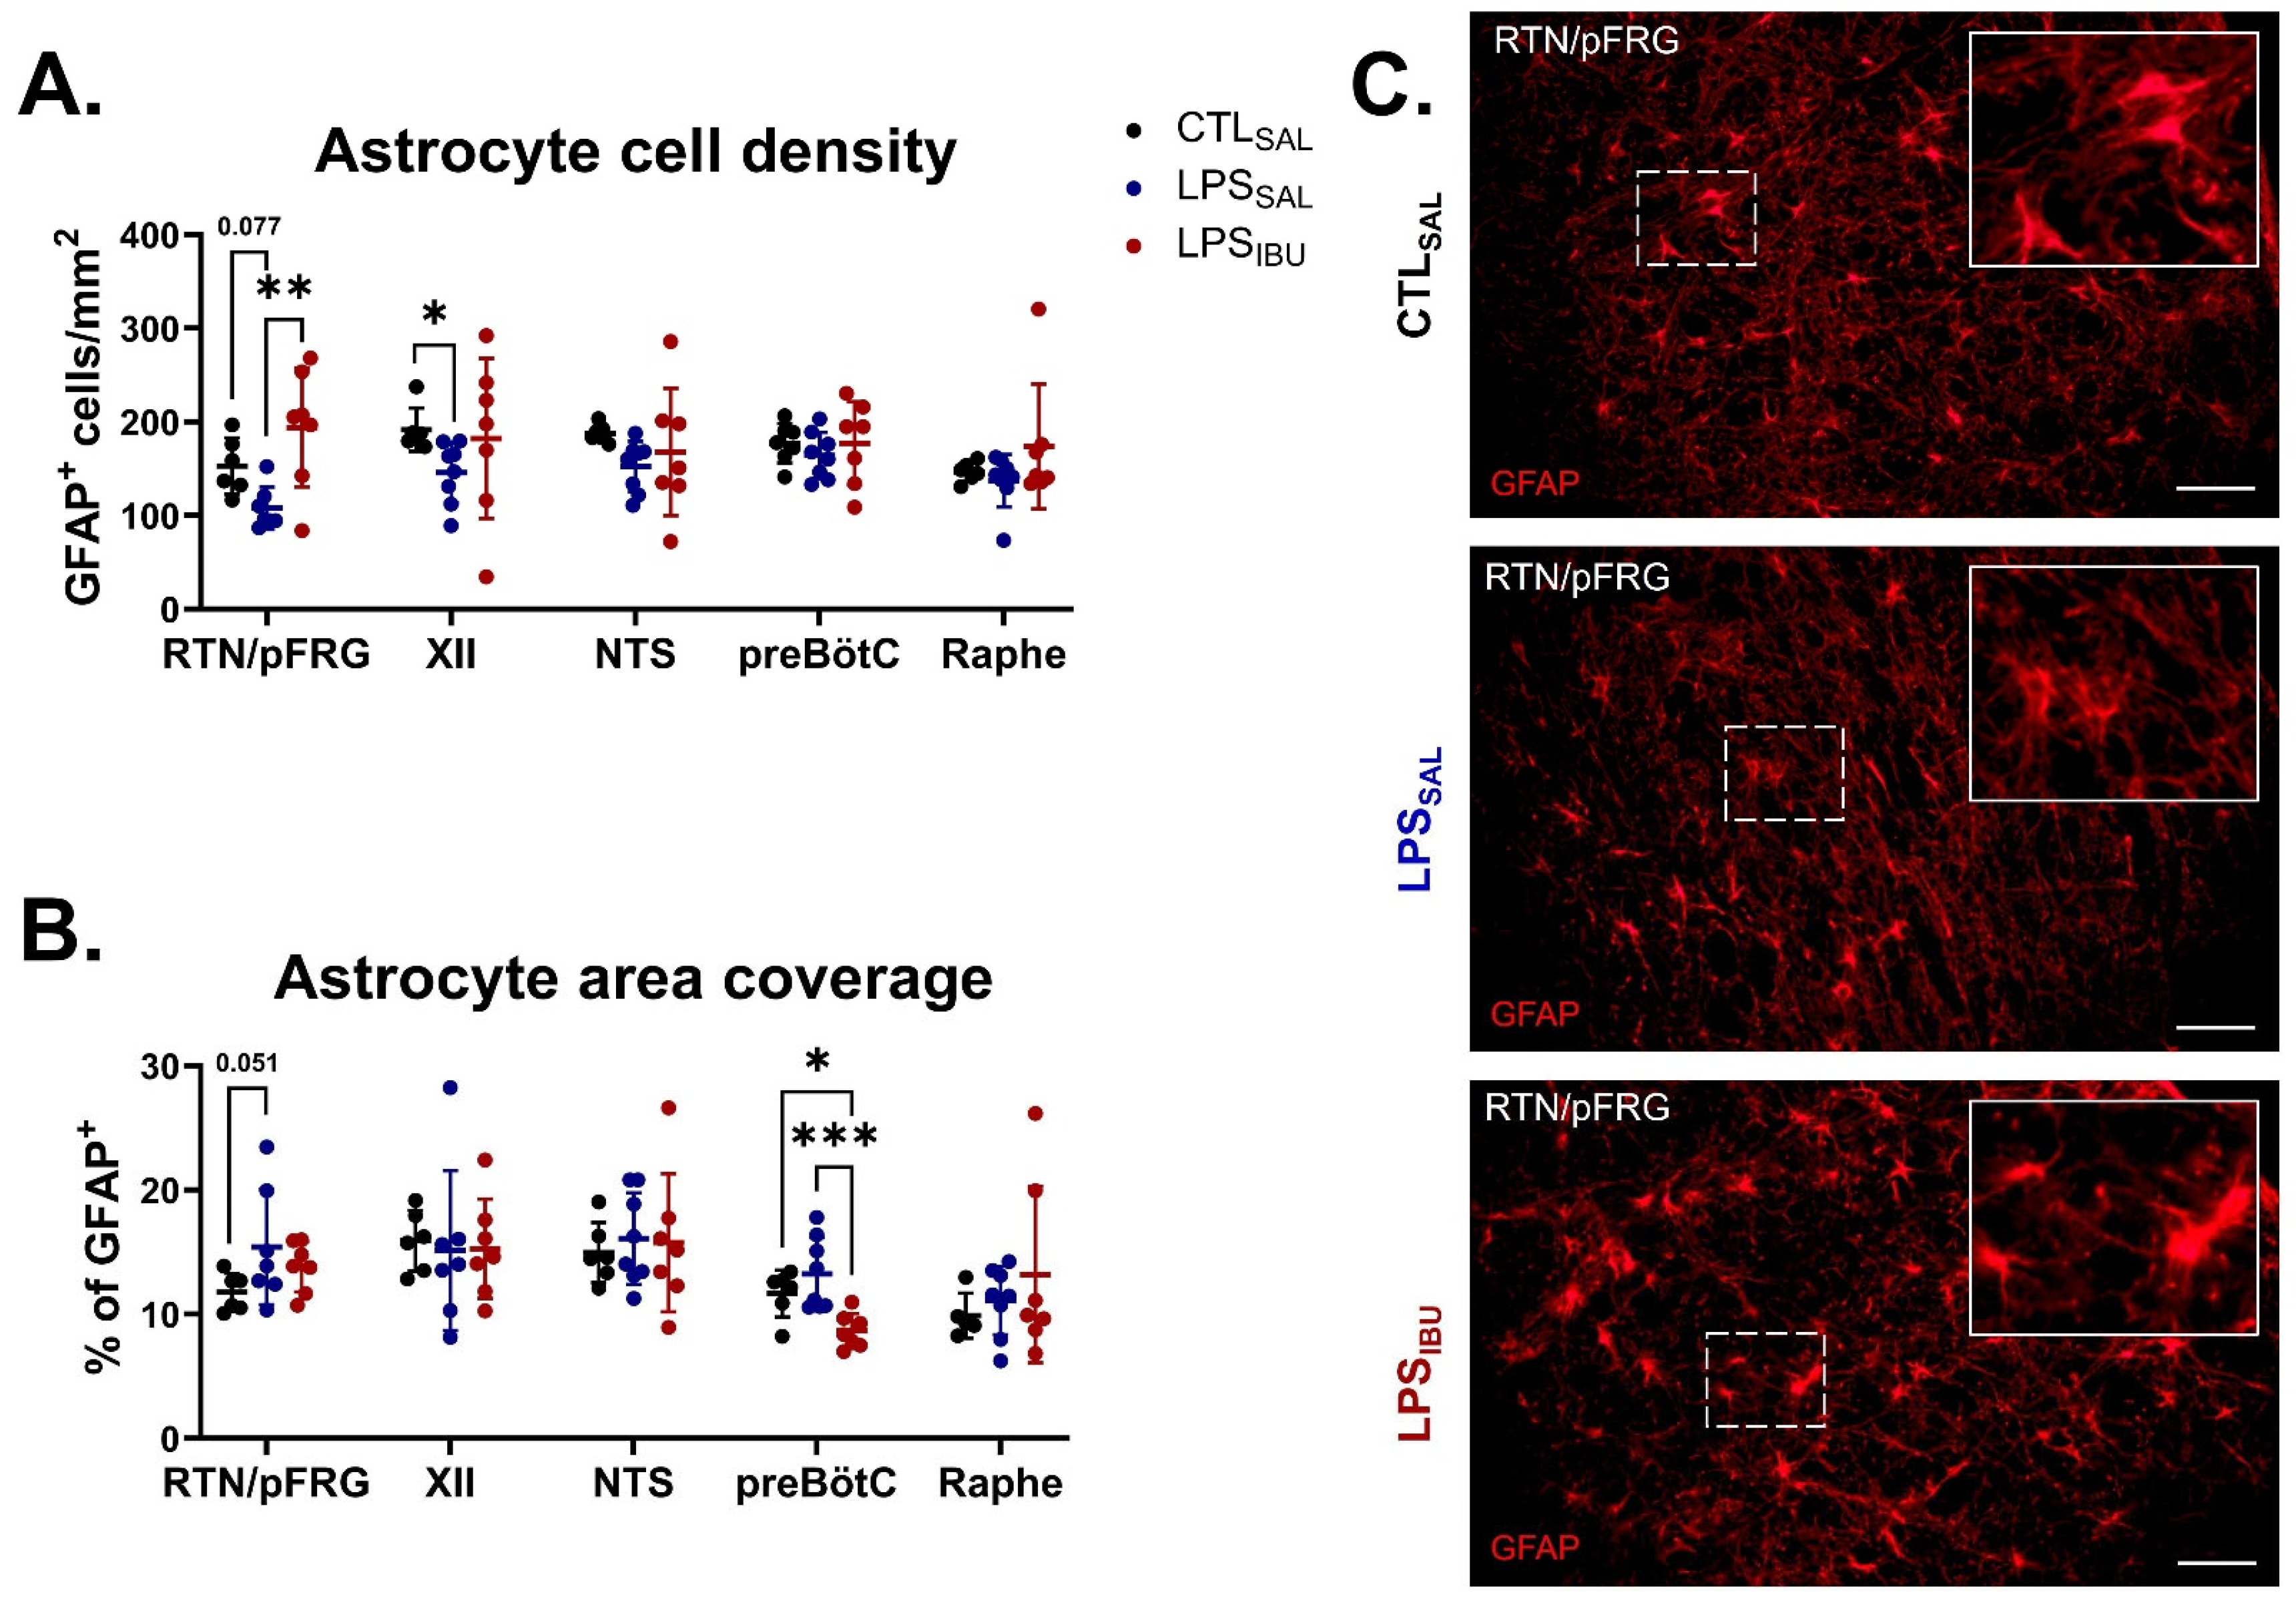
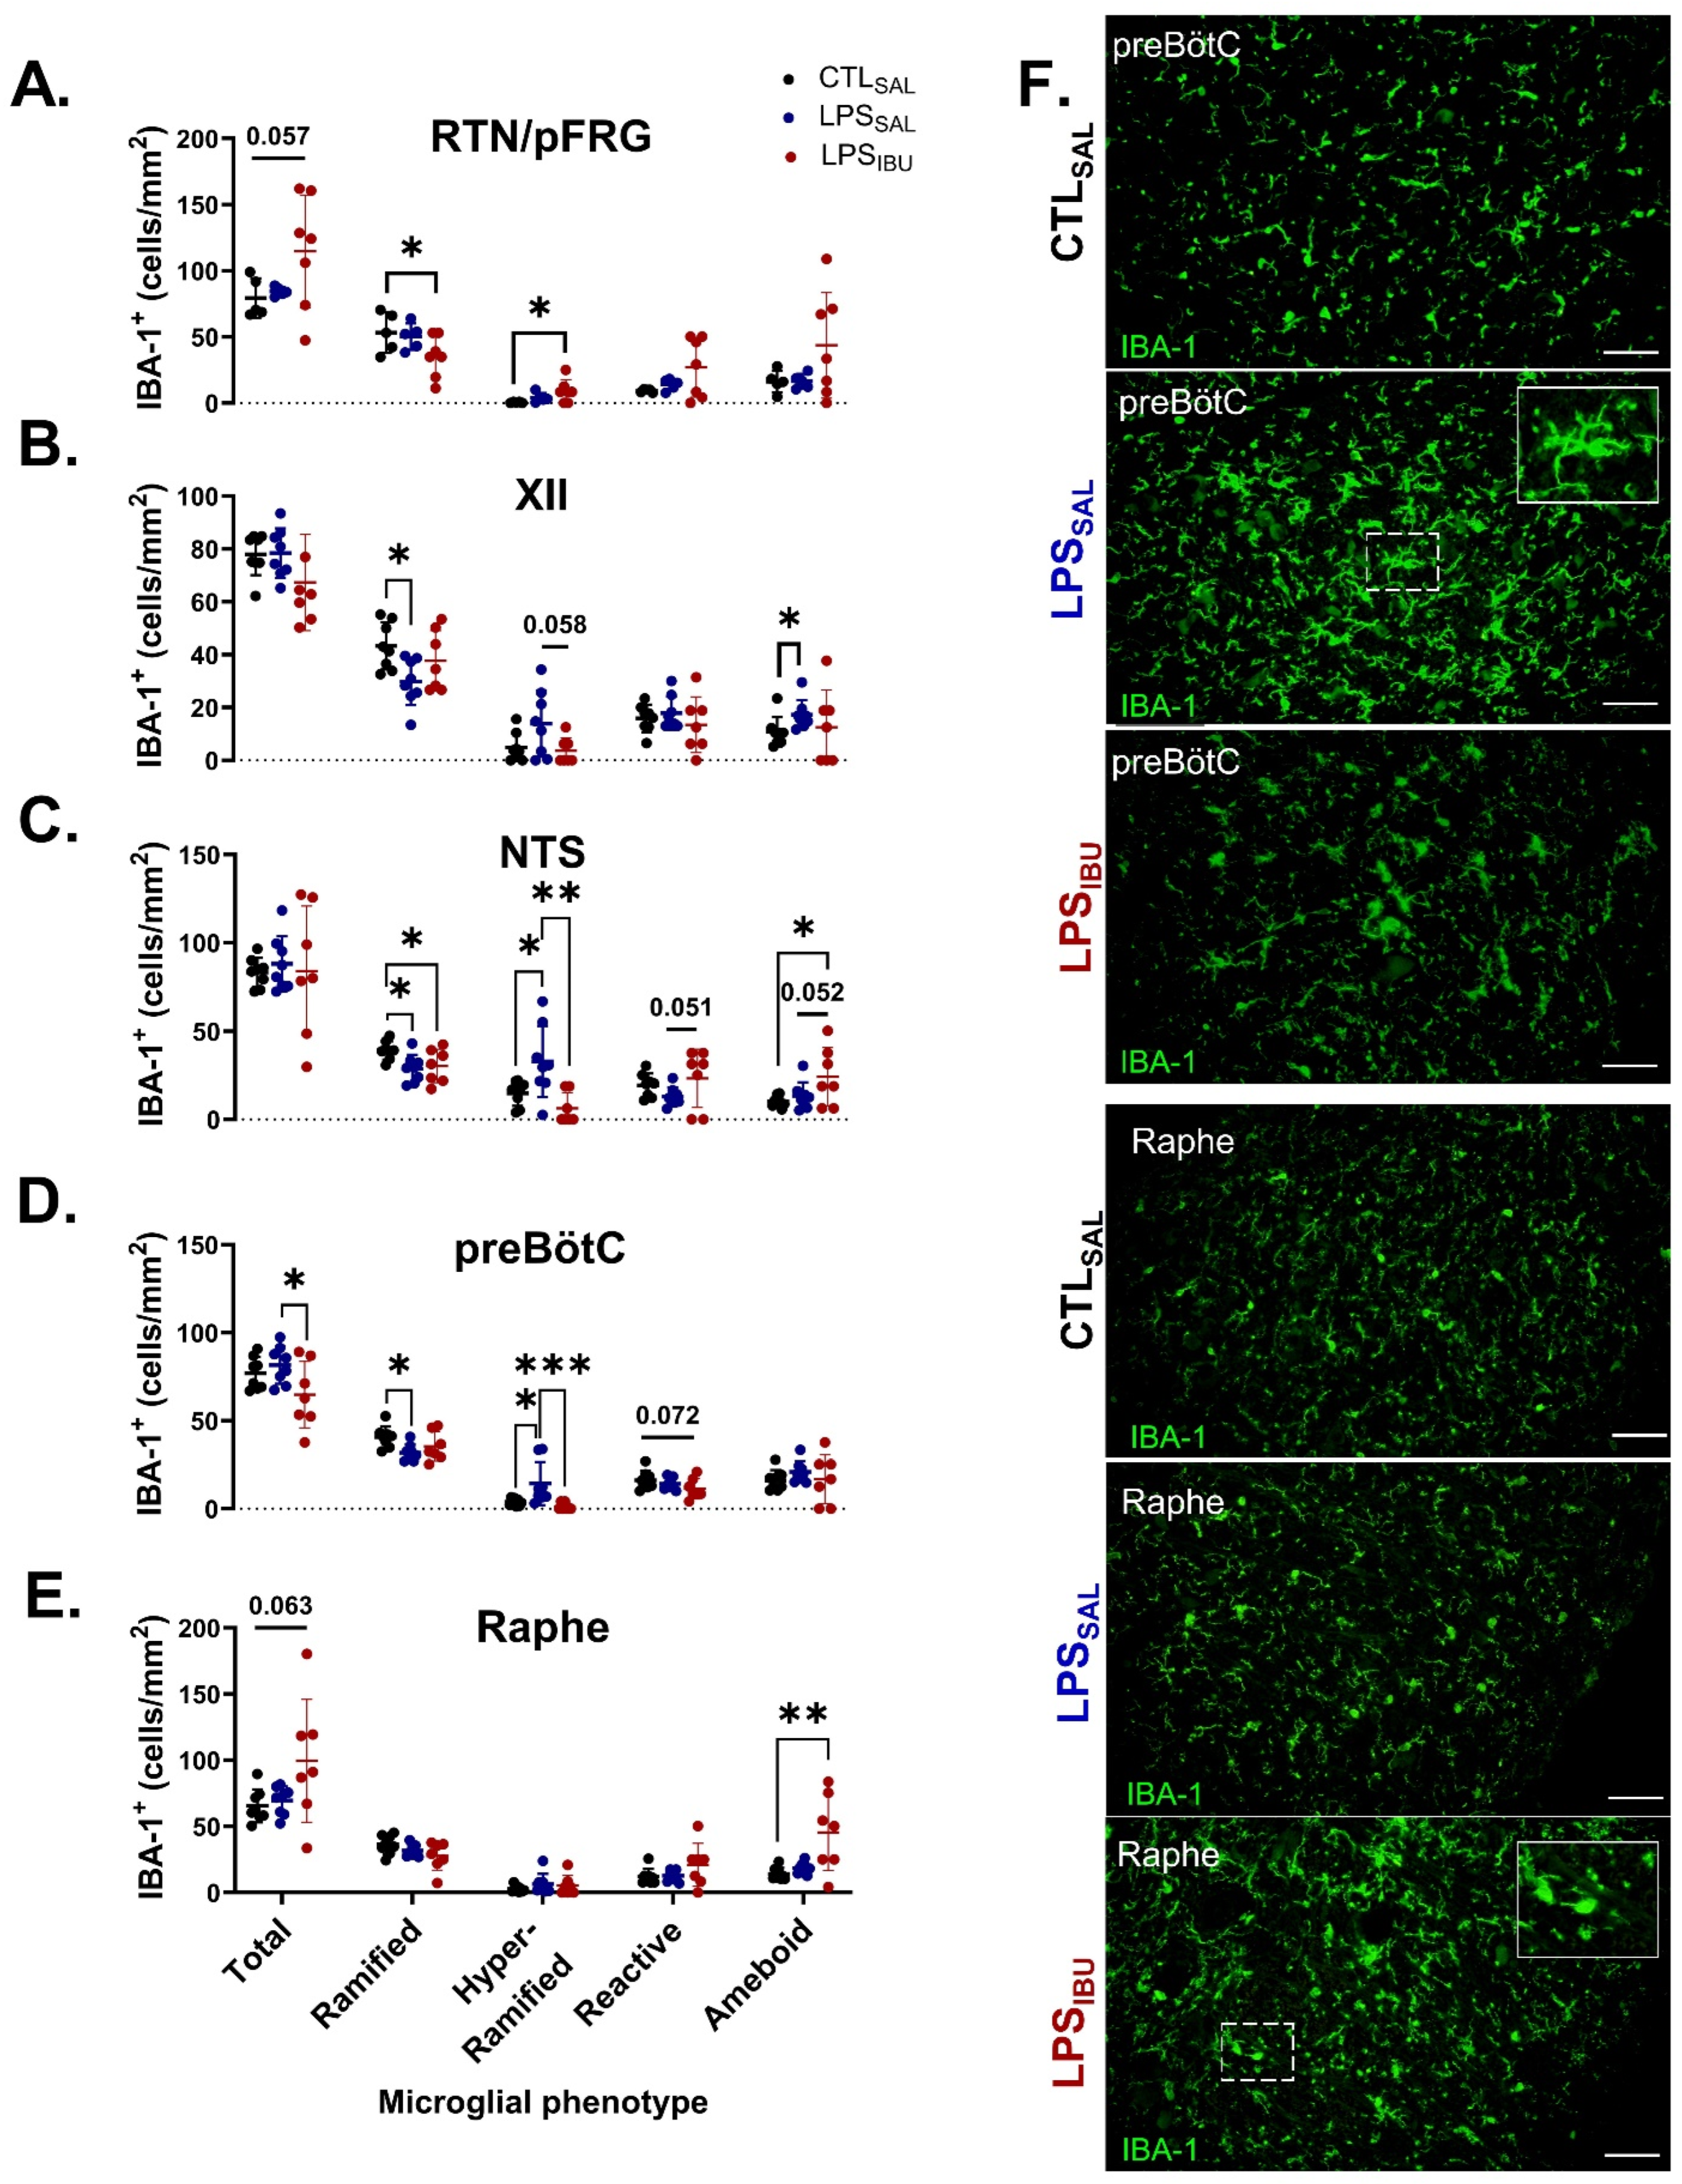
2.6. Microglia and Astrocyte Assessments

In LPSSAL fetuses, glial fibrillary acidic protein (GFAP)+ cell density in the XII nucleus was reduced, compared to CTLSAL fetuses (p = 0.026). Moreover, a trend towards reduced GFAP+ cell density also occurred in the RTN/pFRG (p = 0.077; Figure 5A). GFAP+ area coverage tended to be higher in the RTN/pFRG in LPSSAL fetuses, compared to CTLSAL fetuses (p = 0.051; Figure 5B). In LPSIBU fetuses, GFAP+ cell density in the RTN/pFRG was significantly higher than in LPSSAL fetuses (p = 0.002; Figure 5A), but was not different from that in CTLSAL fetuses. Similarly, the GFAP+ cell density of LPSIBU fetuses in the XII nucleus was also not different from that in CTLSAL fetuses. Ibuprofen reduced the GFAP+ area coverage in the preBötC of LPSIBU fetuses, compared to both CTLSAL and LPSSAL fetuses (p = 0.026 and 0.0009, respectively; Figure 5B). No differences in GFAP+ cell density or area coverage between groups were found in the NTS or raphe nucleus.
In the RTN/pFRG nucleus, LPS exposure did not alter microglial density. However, LPSIBU fetuses tended to increase total microglia (p = 0.057). Moreover, the density of hyper-ramified microglia was significantly higher compared to CTLSAL (p = 0.027), concordant with a decrease in the density of ramified microglia (p = 0.045; Figure 6A). LPS exposure decreased the density of ramified microglia in the XII, NTS and preBötC (Figure 6B–D). In the XII nucleus, specifically in LPSSAL fetuses, there was a higher density of ameboid microglia compared to that in CTLSAL (p = 0.039), and a trend towards a higher density of hyper-ramified microglia, compared to LPSIBU fetuses (p = 0.058; Figure 6B). In the NTS, LPSSAL fetuses had an increased density of hyper-ramified microglia, compared to CTLSAL fetuses (p = 0.015 Figure 6C). Ibuprofen reduced the hyper-ramified microglia to control levels; however, LPSIBU fetuses had increased densities of reactive (compared to LPSSAL) and ameboid (compared to CTLSAL and LPSSAL) microglia (Figure 6C). Similarly, in the preBötC, LPSSAL fetuses had increased density of hyper-ramified microglia, compared to CTLSAL fetuses (p = 0.029), with ibuprofen restoring the density of hyper-ramified microglia in the preBötC (p = 0.0002); this resulted in a reduction in total microglia density and reactive microglia in LPSIBU fetuses (Figure 6D). In the raphe nucleus, there was an increase in the number of ameboid microglia in LPSIBU fetuses and a trend towards increased total microglial density (p = 0.003 and 0.063, respectively; Figure 6E).
Figure 5. GFAP immunostaining for astrocytes in brainstem respiratory centres. (A) Cell density and (B) area coverage analysis of GFAP immuno-positive staining in brainstem regions. Values are mean ± SD. Significant differences are indicated as * p < 0.05, ** p < 0.01 and *** p < 0.001. (C) Representative GFAP immunofluorescent staining within the RTN/pFRG of the brainstem at 40× magnification. Scale bars are 50 µm.
Ijms 26 05591 g005

3. Discussion

Antenatal exposure to infection/inflammation is associated with fetal [14,15] and newborn [12,16,17] respiratory depression. We previously showed that a course of escalating doses of intravenous LPS inhibits FBM incidence, concurrent with upregulation of PGE2 within brainstem respiratory centres [13]. In this study, we aimed to determine whether ibuprofen, a non-selective COX inhibitor, could restore FBMs though the reduction of systemic and brainstem respiratory centre PGE2 levels. In contrast to our hypothesis, and despite ibuprofen reducing the LPS-induced increase in circulating and brainstem PGE2, ibuprofen did not restore FBMs in LPS-exposed fetuses compared to controls. Moreover, while ibuprofen reduced markers of astrocytosis and microgliosis in the preBötC, there were increased numbers of morphologically activated microglia and total astrocytes in the raphe nucleus, NTS and RTN/pFRG of the brainstem. Overall, this suggests that ibuprofen, at the dosage used, had limited effects on histological markers of brainstem gliosis. Collectively, these data indicate that ibuprofen does not restore inflammation-mediated inhibition of FBMs, and that LPS-induced inhibition of FBMs is not exclusively driven by high PGE2 levels in the circulation and brainstem respiratory centres.
Given that the upregulation of PGE2 has been associated with the suppression of breathing in infants exposed to inflammation/infection [3,12], we utilised ibuprofen to determine whether inhibition of PGE2 would restore FBM. Ibuprofen is a commonly used drug in neonatal medicine, predominately utilised for the treatment of hemodynamically significant patent ductus arteriosus. Ibuprofen is a non-selective COX inhibitor that inhibits the conversion of arachidonic acid to prostaglandin H2, thus preventing downstream conversion to several prostaglandins, including PGE2. Ibuprofen works promptly when given intravenously, but is metabolised and eliminated rapidly, within a 24 h period [18]. Ibuprofen has been shown to cross the blood–brain barrier [19] and to reduce neuroinflammation in neonatal [20,21,22] and adult [23] animal studies investigating neuroinflammatory conditions. In our study, we show that despite reducing PGE2 expression systemically and within key respiratory centres (NTS and RTN/pFRG), ibuprofen did not restore FBMs, suggesting it is not the dominant promoter of FBM inhibition following intrauterine inflammation.
The likely reason why ibuprofen did not restore FBMs is the potential involvement of other pro-inflammatory mediators induced in parallel to PGE2, and having a stronger influence on inflammation-induced inhibition of breathing. In this experimental model we showed that progressive LPS-induced inflammation causes an increase in systemic and central pro-inflammatory cytokines, including IL-1β, TNF, IL-8 and IL-6 [24,25]. Pro-inflammatory mediators, particularly IL-1β, can affect neuronal signalling within the brainstem respiratory centres to depress respiratory behaviour [26,27]. Indeed, IL-1β induces mPGES-1 (inducible microsomal Prostaglandin-1) and subsequent PGE2 release within brainstem respiratory centres and is associated with respiratory inhibition in mice and humans [12,28]. However, IL-1β can directly increase excitatory signalling in the brainstem and depress inhibitory synaptic transmission [29], and alter chemosensory responses to hypercapnia and hypoxia [30,31]. TNF and IL-6 can also modulate neuronal function within the central nervous system by potentiating excitatory signalling and depressing inhibitory transmission, particularly within the preBötC [32]. It is possible that these proinflammatory cytokines, independent of PGE2, are exerting a stronger influence on inflammation-induced respiratory inhibition. Indeed, despite the reduction in PGE2 within the RTN/pFRG and NTS with ibuprofen in LPS-exposed fetuses compared to controls, we observed increased numbers of astrocytes (RTN/pFRG) and a shift in microglial morphology from a more quiescent state towards an activated state within the RTN/pFRG and NTS. Overall, these data suggest there is limited relationship between ibuprofen-induced PGE2 inhibition and histological markers of brainstem gliosis.
Ibuprofen administration resulted in higher carotid blood flow and heart rate in LPS-exposed fetuses. These effects are likely consequences of the haemodynamic effects of ibuprofen on the fetal circulation. PGE2 is a major regulator of ductus arteriosus patency [5]. We were unable to confirm whether ibuprofen affected patency of the ductus arteriosus, but we did observe greater heart weights in LPSIBU fetuses. It is possible that ibuprofen-induced narrowing of the ductus arteriosus promoted cardiac hypertrophy by means of increasing the pulmonary perfusion, which, in turn, increased ventricular pressure. Another interesting finding was that LPSIBU had higher PaCO2 compared to LPSSAL fetuses. The increased CBF observed in ibuprofen-treated fetuses could also be explained by an increased arterial CO2 concentration in the LPSIBU group, which may have promoted greater vasodilation of cerebral arteries and arterioles.
Hypercapnia, in itself, stimulates FBMs [33]. Despite the higher PCO2 after ibuprofen, the FBM incidence did not change, suggesting that under these conditions, a moderate increase in arterial CO2 concentration (~5 mmHg above baseline) has limited effects on FBMs. Interestingly, we did observe an increase in the proportion of accentuated or “deep” breathing in ibuprofen-treated fetuses. The brainstem contains central chemoreceptors that drive respiration in a CO2-dependant manner to increase inspiratory depth [34,35]. This may explain the increase in FBM amplitude in the LPSIBU group.
Future directions for study in this area include investigating different doses of ibuprofen or other, more selective, PGE2 inhibitors, such as indomethacin, and performing a more specific interrogation of the biochemical pathways of fetal breathing inhibition. For example, we were not able to measure the different subtypes of PGE2 metabolites or receptors within the brainstem respiratory centres due to species-related limitations with respect to antibodies. PGE2 is implicated in a number of neuropathological conditions due to its capacity to bind to several G-protein-coupled receptors [36,37]. These receptors are differentially expressed spatially across brainstem regions, and binding to them results in distinct signalling pathways, all of which can induce damage or dysfunction, and ameliorate or potentiate inflammation and alter breathing. Investigating further the inflammatory pathways that dictate respiratory depression, particularly those involved in driving the production of the key inflammatory proteins (e.g., IL-1 and IL-6) associated with exposure to perinatal infection/inflammation and respiratory depression, may reveal future therapeutic targets. Further, the optimal dose of ibuprofen is not known. We used the lowest effective dose which has demonstrated clinical efficacy and safety in humans. Higher doses may be more effective, but whether these have physiological effects, particularly on the patent ductus arteriosus, is not well understood, and warrants further investigation. Indeed, there are limited data on ibuprofen pharmacokinetics and pharmacodynamics during fetal development. Importantly, we were able to demonstrate a reduction in systemic PGE2 at the dose used. Fetal sheep, and not neonatal lambs, were used for this study to eliminate the confounding effects of prostaglandins on the transition at birth and the respiratory-depressive effects of anaesthesia. Moreover, reduced FBM are associated with later diagnosis of antenatal exposure to infection/inflammation [14,15] and respiratory depression in newborns [12,16,17]. Utilising a neonatal model will determine whether systemic inflammation and the subsequent depression of FBMs translate into impaired respiratory function at birth, and whether therapies targeting restoration of fetal breathing movements translate into the newborn paradigm.

4. Materials and Methods

4.1. Ethics Statement

Experimental procedures were approved by the Monash Medical Centre Animal Ethics Committee, Monash University, Australia (MMCA/2017/13 and MMCA/2018/17) and conducted in accordance with the Australian code for the care and use of animals for scientific purposes established by the National Health and Medical Research Council of Australia.

4.2. Animal Experimental Procedures

Twenty-five pregnant Border Leicester ewes carrying singletons or twins at a gestational age of 125 ± 1 days (d; term is ∼148 d) were utilised for this study. All methodology pertaining to preoperative procedures, sterile surgery, anaesthesia and analgesia has been described previously [13,24,25]. The fetus was instrumentally monitored with
  • Tracheal catheter to measure fetal breathing movements (FBM);
  • Right brachial arterial catheter to measure mean arterial blood pressure (MABP) and fetal heart rate (FHR), and for sampling arterial blood gases;
  • Right axillary vein catheter to administer postoperative antibiotics, LPS/saline, and ibuprofen;
  • Amniotic catheter for fetal MABP correction from maternal movement;
  • A right carotid artery ultrasonic flow probe (3 mm) to measure carotid arterial blood flow (CBF; Transonic Systems, Ithaca, NY, USA) and fetal heart rate, which was derived from the carotid arterial beat-to-beat interval.
At ~130 ± 1 d fetal sheep were randomly assigned, using an online number generator, to either control and saline (CTLSAL, n = 9); LPS and saline (LPSSAL, n = 8); or LPS and ibuprofen (IBU) (LPSIBU, n = 8). Fetuses assigned to LPS groups received daily intravenous (i.v.) escalating doses of infusions of lipopolysaccharide (LPS; E. Coli O55:B5; Sigma-Aldrich, Australia) at doses of 300 ng on experimental day 1, 600 ng on experimental day 2 and 1200 ng on experimental day 3; these were diluted in 2 mL saline to induce a progressive systemic inflammatory response, as described previously [24]. Ibuprofen-treated fetuses (LPSIBU) received an i.v. bolus of ibuprofen (5 mg.kg−1.d−1; diluted in sterile water; 2 mL) 1 h after each LPS infusion. This dose of ibuprofen was chosen since it is the lowest dose given to human preterm infants for treatment of a patent ductus arteriosus. CTLSAL fetuses received isovolumetric saline (2 mL) intravenously at the time of LPS/IBU interventions. Ewes and fetuses were euthanised at 135 d (4 days after the start of infusions) with an intravenous overdose of pentobarbital sodium to the ewe (100 mg.kg−1; Lethabarb; Virbac, Milperra, NSW, Australia) (Figure 7A).

4.3. Physiology Measurements and Sample Collection

Fetal catheters were connected to pressure transducers (DTX Plus, BD Medical Systems, North Ryde, NSW, Australia) and the carotid arterial flow probe connected to a flow-meter, and all physiological data were continuously digitally recorded using a PowerLab A-D converter and stored using LabChart pro software (version 8, ADInstruments, Bella Vista, NSW, Australia). All physiological analyses were performed offline by an investigator who was blinded to the treatment group. One-hour epochs of physiological recordings were sampled on days 1, 2 and 3 at baseline (defined as 1 h prior to LPS dose); +0 (at LPS dose); +1; +2; +3; +4; +5; +6; and +12 h (relative to LPS dose). Within each one-hour epoch, all periods of breathing and apnoea were individually selected and recorded. FBM were defined as consistent breathing movements with tracheal pressures less than −1.5 mmHg. Multiple FBM characteristics were analysed, including (i) incidence, the total time spent breathing expressed as the % of time FBMs occurred per hour; (ii) duration, the average duration of FBMs (s) per hour; (iii) frequency, the average number of breaths/second during an episode of FBMs per hour; (iv) amplitude, average depth of individual breaths (mmHg) per hour; and (v) accentuated breathing, the total time spent breathing with an average amplitude > 5 mmHg, expressed as the % of time FBMs occurred per hour [38]. Average CBF, MABP and FHR during apnoeic periods were calculated at the same timepoints. Cerebral oxygen delivery (CDO2) was calculated using CBF and blood gas measurements [39]:
C D O 2 = C B F a v e r a g e × a r t e r i a l   o x y g e n   c o n t e n t b r a i n   w e i g h t   ( k g )
where arterial oxygen content is calculated as described in the following, in which Hb is the hemoglobin concentration (g/dL):
A r t e r i a l   o x y g e n   c o n t e n t = ( 1.3 × H b × S a O 2 100 + 0.03 × P a O 2 )
Daily arterial blood samples were collected to monitor fetal blood biochemistry and for plasma collection at baseline, +2 and +6 h after each saline or LPS infusion. Blood gas values for pH, partial pressure of carbon dioxide (PaCO2), partial pressure of oxygen (PaO2), oxygen saturation (SaO2), and lactate were measured using an ABL90 Flex Pus analyser (Radiometer, Brønshøj, Denmark). Blood plasma samples were obtained by centrifuging the blood sample at 3000× g for 10 min; the plasma collected was then stored at −80 °C.
At post-mortem, cerebrospinal fluid (CSF) was collected from a cisternae magna puncture and centrifuged, and then the supernatant was collected and immediately frozen in liquid nitrogen. All organs were weighed. The whole brainstem was collected and immersion-fixed in 10% neutral buffered formalin for 6 days at 4 °C prior to paraffin processing and embedding. Serial brainstem sections were cut at an 8 µm thickness. Brainstem respiratory centres were identified using the Michigan State sheep brain atlas [40] and a rat brain atlas [41]. The putative retrotrapezoid/parafacial respiratory group (RTN/pFRG) area was identified ventral to the facial nucleus in sections of the medulla oblongata and inferior cerebellar peduncle. In the same section, the raphe nucleus (pallidus) was identified as medial to the RTN/pFRG. The nucleus tractus solitarius (NTS) and the putative preBötzinger complex (preBötC) were identified at a level caudal to the cerebellar peduncle; all were above the central canal. Anatomical landmarks for identifying the preBötC included the NTS and hypoglossal nucleus (XII) (Figure 7B,C).

4.4. Immunohistochemistry

Brainstem sections were immunolabelled for PGE2, ionized calcium binding adaptor molecule-1 (IBA-1; microglia) and glial fibrillary acidic protein (GFAP; astrocytes), as previously reported [13]. Briefly, sections were dewaxed and subjected to antigen retrieval with Proteinase K (Sigma-Aldrich, Bayswater, Australia) for PGE2 immunolabelling, and heat-mediated citrate buffer for IBA-1 and GFAP immunolabelling. Sections were blocked and then incubated with the primary antibodies anti-rabbit PGE2 (1:200; Abcam, Melbourne, Australia), anti-mouse GFAP (1:500; Abcam, Australia), and anti-rabbit IBA-1 (1:500; WAKO Chemicals, Japan) overnight, at 4 °C. Sections were washed, then incubated with a respective secondary antibody: anti-rabbit Alexa Fluor 488 for PGE2 (1:150) and IBA-1 (1:200), and anti-mouse Alexa Fluor 594 for GFAP (1:200); all were sourced from Jackson Immuno Research, USA. Sections were also incubated with the nuclear stain HOESCHT (1:1000 dilution in 1x PBS; Invitrogen, Waltham, MA, USA) for 5 min, then washed for 5 min in PBS. Sections were cover-slipped using DAKO anti-fade fluorescent mounting medium (Agilent Technologies, Mulgrave, Australia). In the PGE2 immunostaining, four samples from the CTLSAL and two samples from the IBULPS group could not be assessed

4.5. Fluorescent Imaging and Quantitative Analysis

All fluorescent images were obtained at 40× magnification using an Olympus BX50 microscope and Cell Sense imaging software (Version 2.3, Olympus, Notting Hill, Australia). A total of four non-overlapping fields of view (FOV; 200 µm × 200 µm) were taken per respiratory centre per subject. No staining was observed in negative controls where the primary antibody was omitted. Slides and images were coded, and the assessor was blinded to the group allocation. The % area coverage of PGE2+ and GFAP+ labelling was measured using a set intensity threshold (FIJI; ImageJ, version 2.00, NIH Image, Bethesda, MD, USA). The total number of GFAP+ astrocytes and IBA-1+ microglia in each FOV from each respiratory centre was counted and expressed as mean total number of cells/mm2. Microglia (IBA-1 + cells) showing ramified (small cell body with >1 branching process) or amoeboid morphology (large cell bodies, with ≤1 branching process) were included in our assessment [23].

4.6. Plasma and CSF PGE2

To determine PGE2 levels within CSF and blood plasma, a monoclonal PGE2 enzyme-linked immunosorbent assay (ELISA) kit (Cayman Chemicals, Ann Arbor, MI, USA) was utilised according to the manufacturer’s instructions and the results were expressed as % binding activity. Three replicates were used per sample at each time point. The intra-assay and inter-assay coefficients of variability (%CV) were set to <20%. Due to technical difficulties relating to sample collection, two CSF and three plasma samples from CTLSAL, three CSF samples from LPSSAL, and one CSF and two plasma samples from LPSIBU were not included in the analyses of PGE2 levels.

4.7. Statistical Analysis

Average physiological measurements (FBM characteristics, CBF, CDO2, MABP and FHR) at baseline (i.e., 1 h prior to first LPS infusion) were compared between groups using a one-way ANOVA (for parametric data) or the Kruskal–Wallis test (for non-parametric data). Normality was assessed using the Shapiro–Wilk test. Due to small but non-significant differences in the baseline FBM characteristics (except for FBM incidence), CBF, CDO2, MABP and FHR data are expressed as delta change from day one baseline. Physiological data were analysed using a mixed-effects two-way ANOVA with repeated measures. The independent variables assessed were group (PGROUP) and time of measurement (PTIME). Where there was a significant interaction, a post hoc analysis with Fisher’s least significant difference (LSD) test was used to determine differences between groups at specific time points. Animal characteristics, immunohistochemical data, and CSF PGE2 data were analysed using a one-way ANOVA (for parametric data) or the Kruskal–Wallis test (for non-parametric data); normality was assessed using the Shapiro–Wilk test. Significant effects were the subjects of follow-up to identify differences between groups using Fisher’s LSD test or an uncorrected Dunn’s test, for parametric and non-parametric data, respectively. All analyses were performed using GraphPad Prism v9 (GraphPad Software, La Jolla, CA, USA). Data are presented as mean ± standard deviation (SD). A p < 0.05 determined statistical significance.

5. Conclusions

We found that reducing systemic and localised PGE2 within key brainstem respiratory centres using intravenous ibuprofen did not mitigate the inflammation-induced depression of FBMs in late-gestation fetal sheep. The mediators of breathing inhibition associated with intrauterine inflammation are likely to involve a complex interplay of pro-inflammatory mediators beyond PGE2. Understanding their effects on dynamic network connectivity in brainstem respiratory centres will be key to elucidating why respiratory failure occurs in preterm infants exposed to intrauterine inflammation.

Author Contributions

N.T.T., V.S., E.A.P.H., S.B.K., S.B.H., B.J.A., R.G. and G.R.P. conceptualised and designed the study. N.T.T., V.S., S.B.K., K.V., J.A., E.M.-S., V.A.Z., Y.P., B.J.A., R.G. and G.R.P. undertook the experiments and the formal analysis of the data. N.T.T., V.S., V.A.Z. and Y.P. designed and undertook the ELISA analysis. N.T.T., V.S. and K.V. undertook the immunohistochemistry, cell quantification, analysis, and preparation of figures. R.G. and G.R.P. provided overall oversight for the research. All authors have read and agreed to the published version of the manuscript.

Funding

This study was supported by the National Health and Medical Research Council of Australia (R.G. #1164954, G.R.P. #1105526, B.J.A. #1175843), the Cerebral Palsy Alliance, and the Victorian Government’s Operational Infrastructure Support Program.

Institutional Review Board Statement

All procedures were approved by the Hudson Institute of Medical Research Animal Ethics Committee and were conducted in accordance with the National Health and Medical Research Council’s Australian code of practice for the care and use of animals for scientific purposes (Eighth Edition).

Informed Consent Statement

Not applicable.

Data Availability Statement

Data is provided within the manuscript. The datasets used during the current study are available from the corresponding author upon reasonable request.

Acknowledgments

The authors acknowledge the use of the facilities and technical assistance of MARP, Monash Histology Platform, and the Department of Anatomy and Developmental Biology, Monash University.

Conflicts of Interest

The authors declare no conflicts of interest.

Abbreviations

The following abbreviations are used in this manuscript:
%Percent
°CDegrees Celsius
µmMicrometre
ANOVAAnalysis of variance
CBFCarotid blood flow
CDO2Cerebral oxygen delivery
COXCyclooxygenase
CSFCerebral spinal fluid
CTLControl
CVCoefficient of variability
d/DDays
dGADays gestational age
ELISAEnzyme-linked immunosorbent assay
FBMFetal breathing movement
FDAFederal drug administration
FHRFetal heart rate
GFAPGlial fibrillary acidic protein
gGrams
hHour
IBAIonized calcium binding adaptor molecule
IBUIbuprofen
ILInterleukin
i.v.Intravenous
KgKilogram
LPSLipopolysaccharide
MABPMean arterial blood pressure
mgMilligram
MinMinute
mmMillimetre
mmHgMillimetres of mercury
mPGES-1Microsomal prostaglandin E synthase-1
nNumber of
NTSNucleus tractus solitarius
PGE2Prostaglandin E2
PaCO2Arterial partial pressure of carbon dioxide
PaO2Arterial partial pressure of oxygen
PBSPhosphate-buffered saline
PDAPatent ductus arteriosus
pFRGParafacial respiratory group
preBötCpreBötzinger
RTNRetrotrapezoid
sSecond
SDStandard deviation
SALSaline
SO2Arterial oxygen saturation
TNFTumor necrosis factor
XIIHypoglossal nucleus

References

  1. Tita, A.T.N.; Andrews, W.W. Diagnosis and Management of Clinical Chorioamnionitis. Clin. Perinatol. 2010, 37, 339–354. [Google Scholar] [CrossRef] [PubMed]
  2. Polglase, G.R.; Nitsos, I.; Baburamani, A.A.; Crossley, K.J.; Slater, M.K.; Gill, A.W.; Allison, B.J.; Moss, T.J.; Pillow, J.J.; Hooper, S.B.; et al. Inflammation in utero exacerbates ventilation-induced brain injury in preterm lambs. J. Appl. Physiol. 2012, 112, 481–489. [Google Scholar] [CrossRef] [PubMed]
  3. Siljehav, V.; Hofstetter, A.M.; Leifsdottir, K.; Herlenius, E. Prostaglandin E2 Mediates Cardiorespiratory Disturbances During Infection in Neonates. J. Pediatr. 2015, 167, 1207–1213.e1203. [Google Scholar] [CrossRef]
  4. Chow, S.S.W.; Creighton, P.; Chambers, G.M.; Lui, K. Report of the Australian and New Zealand Neonatal Network 2020; ANZNN: Sydney, Australia, 2022. [Google Scholar]
  5. Ohlsson, A.; Walia, R.; Shah, S.S. Ibuprofen for the treatment of patent ductus arteriosus in preterm or low birth weight (or both) infants. Cochrane Database Syst. Rev. 2020, 2, Cd003481. [Google Scholar] [CrossRef]
  6. Guerra, F.A.; Savich, R.D.; Wallen, L.D.; Lee, C.H.; Clyman, R.I.; Mauray, F.E.; Kitterman, J.A. Prostaglandin E2 causes hypoventilation and apnea in newborn lambs. J. Appl. Physiol. 1988, 64, 2160–2166. [Google Scholar] [CrossRef] [PubMed]
  7. Dawes, G.S. The central control of fetal breathing and skeletal muscle movements. J. Physiol. 1984, 346, 1–18. [Google Scholar] [CrossRef]
  8. Tai, T.C.; MacLusky, N.J.; Adamson, S.L. Ontogenesis of prostaglandin E2 binding sites in the brainstem of the sheep. Brain Res. 1994, 652, 28–39. [Google Scholar] [CrossRef]
  9. Wlodek, M.E.; Hooper, S.B.; Thorburn, G.D.; Tester, M.L.; Harding, R. Effects of prostaglandin E2 on renal function and lung liquid dynamics in foetal sheep. Clin. Exp. Pharmacol. Physiol. 1998, 25, 805–812. [Google Scholar] [CrossRef]
  10. Murai, D.T.; Clyman, R.I.; Mauray, F.E.; Lee, C.C.; Kitterman, J.A. Meclofenamate and prostaglandin E2 affect breathing movements independently of glucose concentrations in fetal sheep. Am. J. Obstet. Gynecol. 1984, 150, 758–764. [Google Scholar] [CrossRef]
  11. Savich, R.D.; Guerra, F.A.; Lee, C.C.; Kitterman, J.A. Prostaglandin E2 decreases fetal breathing movements, but not pulmonary blood flow, in fetal sheep. J. Appl. Physiol. 1995, 78, 1477–1484. [Google Scholar] [CrossRef]
  12. Hofstetter, A.O.; Saha, S.; Siljehav, V.; Jakobsson, P.J.; Herlenius, E. The induced prostaglandin E2 pathway is a key regulator of the respiratory response to infection and hypoxia in neonates. Proc. Natl. Acad. Sci. USA. 2007, 104, 9894–9899. [Google Scholar] [CrossRef] [PubMed]
  13. Stojanovska, V.; Atta, J.; Kelly, S.B.; Zahra, V.A.; Matthews-Staindl, E.; Nitsos, I.; Moxham, A.; Pham, Y.; Hooper, S.B.; Herlenius, E.; et al. Increased Prostaglandin E2 in Brainstem Respiratory Centers Is Associated with Inhibition of Breathing Movements in Fetal Sheep Exposed to Progressive Systemic Inflammation. Front. Physiol. 2022, 13, 841229. [Google Scholar] [CrossRef] [PubMed]
  14. Sherer, D.M.; Spong, C.Y.; Salafia, C.M. Fetal breathing movements within 24 hours of delivery in prematurity are related to histologic and clinical evidence of amnionitis. Am. J. Perinatol. 1997, 14, 337–340. [Google Scholar] [CrossRef]
  15. Vintzileos, A.M.; Campbell, W.A.; Nochimson, D.J.; Weinbaum, P.J. Fetal breathing as a predictor of infection in premature rupture of the membranes. Obs. Gynecol. 1986, 67, 813–817. [Google Scholar] [CrossRef] [PubMed]
  16. Panneflek, T.J.R.; Kuypers, K.; Polglase, G.R.; Hooper, S.B.; van den Akker, T.; Te Pas, A.B. Effect of clinical chorioamnionitis on breathing effort in premature infants at birth: A retrospective case-control study. Arch. Dis. Child. Fetal Neonatal Ed. 2023, 108, 280–285. [Google Scholar] [CrossRef]
  17. Panneflek, T.J.R.; Kuypers, K.; Polglase, G.R.; Derleth, D.P.; Dekker, J.; Hooper, S.B.; van den Akker, T.; Pas, A.B.T. The influence of chorioamnionitis on respiratory drive and spontaneous breathing of premature infants at birth: A narrative review. Eur. J. Pediatr. 2024, 183, 2539–2547. [Google Scholar] [CrossRef]
  18. Bushra, R.; Aslam, N. An overview of clinical pharmacology of Ibuprofen. Oman Med. J. 2010, 25, 155–1661. [Google Scholar] [CrossRef]
  19. Parepally, J.M.; Mandula, H.; Smith, Q.R. Brain uptake of nonsteroidal anti-inflammatory drugs: Ibuprofen, flurbiprofen, and indomethacin. Pharm. Res. 2006, 23, 873–881. [Google Scholar] [CrossRef]
  20. Wixey, J.A.; Sukumar, K.R.; Pretorius, R.; Lee, K.M.; Colditz, P.B.; Bjorkman, S.T.; Chand, K.K. Ibuprofen Treatment Reduces the Neuroinflammatory Response and Associated Neuronal and White Matter Impairment in the Growth Restricted Newborn. Front. Physiol. 2019, 10, 541. [Google Scholar] [CrossRef]
  21. Chand, K.K.; Miller, S.M.; Cowin, G.J.; Mohanty, L.; Pienaar, J.; Colditz, P.B.; Bjorkman, S.T.; Wixey, J.A. Neurovascular Unit Alterations in the Growth-Restricted Newborn Are Improved Following Ibuprofen Treatment. Mol. Neurobiol. 2022, 59, 1018–1040. [Google Scholar] [CrossRef]
  22. Richardson, R.L.; Kim, E.M.; Shephard, R.A.; Gardiner, T.; Cleary, J.; O’Hare, E. Behavioural and histopathological analyses of ibuprofen treatment on the effect of aggregated Abeta(1–42) injections in the rat. Brain Res. 2002, 954, 1–10. [Google Scholar] [CrossRef] [PubMed]
  23. Liu, R.; Wu, S.; Guo, C.; Hu, Z.; Peng, J.; Guo, K.; Zhang, X.; Li, J. Ibuprofen Exerts Antiepileptic and Neuroprotective Effects in the Rat Model of Pentylenetetrazol-Induced Epilepsy via the COX-2/NLRP3/IL-18 Pathway. Neurochem. Res. 2020, 45, 2516–2526. [Google Scholar] [CrossRef] [PubMed]
  24. Kelly, S.B.; Stojanovska, V.; Zahra, V.A.; Moxham, A.; Miller, S.L.; Moss, T.J.M.; Hooper, S.B.; Nold, M.F.; Nold-Petry, C.A.; Dean, J.M.; et al. Interleukin-1 blockade attenuates white matter inflammation and oligodendrocyte loss after progressive systemic lipopolysaccharide exposure in near-term fetal sheep. J. Neuroinflammation 2021, 18, 189. [Google Scholar] [CrossRef]
  25. Kelly, S.B.; Dean, J.M.; Zahra, V.A.; Dudink, I.; Thiel, A.; Polglase, G.R.; Miller, S.L.; Hooper, S.B.; Bennet, L.; Gunn, A.J.; et al. Progressive inflammation reduces high-frequency EEG activity and cortical dendritic arborisation in late gestation fetal sheep. J. Neuroinflammation 2023, 20, 124. [Google Scholar] [CrossRef] [PubMed]
  26. Hofstetter, A.O.; Herlenius, E. Interleukin-1beta depresses hypoxic gasping and autoresuscitation in neonatal DBA/1lacJ mice. Respir. Physiol. Neurobiol. 2005, 146, 135–146. [Google Scholar] [CrossRef]
  27. Jafri, A.; Belkadi, A.; Zaidi, S.I.; Getsy, P.; Wilson, C.G.; Martin, R.J. Lung inflammation induces IL-1β expression in hypoglossal neurons in rat brainstem. Respir. Physiol. Neurobiol. 2013, 188, 21–28. [Google Scholar] [CrossRef]
  28. Olsson, A.; Kayhan, G.; Lagercrantz, H.; Herlenius, E. IL-1β Depresses Respiration and Anoxic Survival via a Prostaglandin-Dependent Pathway in Neonatal Rats. Pediatr. Res. 2003, 54, 326–331. [Google Scholar] [CrossRef]
  29. Ramirez, S.C.; Koschnitzky, J.E.; Baertsch, N.A.; Anderson, T.M.; Smith, C.V.; Ramirez, J.-M. Disturbances in central respiratory rhythm generation may contribute to breathing disturbances in prematurely born mice. FASEB J. 2016, 30, 987.984. [Google Scholar] [CrossRef]
  30. Siljehav, V.; Shvarev, Y.; Herlenius, E. Il-1beta and prostaglandin E2 attenuate the hypercapnic as well as the hypoxic respiratory response via prostaglandin E receptor type 3 in neonatal mice. J. Appl. Physiol. 2014, 117, 1027–1036. [Google Scholar] [CrossRef]
  31. Balan, K.V.; Kc, P.; Mayer, C.A.; Wilson, C.G.; Belkadi, A.; Martin, R.J. Intrapulmonary lipopolysaccharide exposure upregulates cytokine expression in the neonatal brainstem. Acta Paediatr. 2012, 101, 466–471. [Google Scholar] [CrossRef]
  32. Galic, M.A.; Riazi, K.; Pittman, Q.J. Cytokines and brain excitability. Front. Neuroendocrinol. 2012, 33, 116–125. [Google Scholar] [CrossRef]
  33. Connors, G.; Hunse, C.; Carmichael, L.; Natale, R.; Richardson, B. The role of carbon dioxide in the generation of human fetal breathing movements. Am. J. Obstet. Gynecol. 1988, 158, 322–327. [Google Scholar] [CrossRef] [PubMed]
  34. Forsberg, D.; Horn, Z.; Tserga, E.; Smedler, E.; Silberberg, G.; Shvarev, Y.; Kaila, K.; Uhlén, P.; Herlenius, E. CO2-evoked release of PGE2 modulates sighs and inspiration as demonstrated in brainstem organotypic culture. eLife 2016, 5, e14170. [Google Scholar] [CrossRef] [PubMed]
  35. Koch, H.; Caughie, C.; Elsen, F.P.; Doi, A.; Garcia, A.J., 3rd; Zanella, S.; Ramirez, J.M. Prostaglandin E2 differentially modulates the central control of eupnoea, sighs and gasping in mice. J. Physiol. 2015, 593, 305–319. [Google Scholar] [CrossRef]
  36. Stojanovska, V.; Miller, S.L.; Hooper, S.B.; Polglase, G.R. The Consequences of Preterm Birth and Chorioamnionitis on Brainstem Respiratory Centers: Implications for Neurochemical Development and Altered Functions by Inflammation and Prostaglandins. Front. Cell Neurosci. 2018, 12, 26. [Google Scholar] [CrossRef] [PubMed]
  37. Cimino, P.J.; Keene, C.D.; Breyer, R.M.; Montine, K.S.; Montine, T.J. Therapeutic targets in prostaglandin E2 signaling for neurologic disease. Curr. Med. Chem. 2008, 15, 1863–1869. [Google Scholar] [CrossRef]
  38. Polglase, G.R.; Wallace, M.J.; Grant, D.A.; Hooper, S.B. Influence of Fetal Breathing Movements on Pulmonary Hemodynamics in Fetal Sheep. Pediatr. Res. 2004, 56, 932–938. [Google Scholar] [CrossRef]
  39. Badurdeen, S.; Gill, A.W.; Kluckow, M.; Roberts, C.T.; Galinsky, R.; Klink, S.; Miller, S.L.; Davis, P.G.; Schmölzer, G.M.; Hooper, S.B.; et al. Excess cerebral oxygen delivery follows return of spontaneous circulation in near-term asphyxiated lambs. Sci. Rep. 2020, 10, 16443. [Google Scholar] [CrossRef]
  40. Johnson, J.K.; Sudheimer, K.D.; Davis, K.K.; Kerndt, G.M.; Winn, B.M. The Sheep Brain Atlas. Available online: https://brains.anatomy.msu.edu/brains/sheep/index.html (accessed on 31 August 2021).
  41. Paxinos, G. The Rat Brain in Stereotaxic Coordinates, 2nd ed.; Academic Press: Sydney, Australia, 1986. [Google Scholar]
Figure 1. Fetal breathing movement (FBM) characterisations of (A) incidence (% of time spent breathing per h), (B) delta change from day 1 baseline (Δ) for the average duration of continuous breathing per h, (C) Δ change from baseline for average frequency of continuous breathing per h, (D) Δ change from baseline for average amplitudes of breaths per h, and (E) Δ change from baseline for incidence of accentuated breathing (% of time spent breathing per h). Hourly epochs were analysed throughout experimental days (D) 1–3 at baseline (before LPS/saline infusions [grey bar]) and throughout the first 12 h after LPS/saline infusions. The orange bar denotes the timing of saline or ibuprofen treatment, which was at 1 h after the LPS/saline infusion. Values are mean ± SD. CTLSAL: n = 9; LPSSAL: n = 8; LPSIBU: n = 8. Significant group differences were assessed by Fisher’s LSD test for multiple comparisons and are indicated as follows: CTLSAL vs. LPSSAL: $ p < 0.05; CTLSAL vs. LPSIBU: # p < 0.05; LPSSAL vs. LPSIBU: * p < 0.05.
Ijms 26 05591 g001
Figure 2. Hemodynamic responses: (A) delta change from day 1 baseline (Δ) for right carotid artery blood flow (CBF), (B) Δ change of cerebral oxygen delivery (CDO2), (C) Δ change of mean arterial blood pressure (MABP) and (D) Δ change of fetal heart rate (FHR). Hourly epochs were analysed throughout experimental days (D) 1–3 at baseline (before LPS/saline infusions [grey bar]) and throughout the first 12 h after LPS/saline infusions. The orange bar denotes the timing of saline or ibuprofen treatment, which was 1 h after the LPS/saline infusion. Values are mean ± SD. CTLSAL: n = 9; LPSSAL: n = 8; LPSIBU: n = 8. Significant group differences were assessed by Tukey’s multiple comparisons test, and are indicated as follows: CTLSAL vs. LPSSAL: $ p < 0.05; CTLSAL vs. LPSIBU: # p < 0.05; LPSSAL vs. LPSIBU: * p < 0.05.
Ijms 26 05591 g002
Figure 3. Blood gas measurements of (A) pH, (B) arterial partial pressure of oxygen (PaO2), (C) arterial partial pressure of carbon dioxide (PaCO2), (D) arterial oxygen saturation (SaO2), arterial (E) lactate and (F) glucose. Arterial blood samples were collected on experimental days (D) 1–3 at baseline (before LPS/saline infusions [grey bar]) and at 2 and 6 h after LPS/saline infusions. The orange bar denotes the timing of saline or ibuprofen treatment, which was at 1 h after the LPS/saline infusion. Values are mean ± SD. CTLSAL: n = 9; LPSSAL: n = 8; LPSIBU: n = 8. Significant group differences assessed by Fisher’s LSD test for multiple comparisons and are indicated as follows: CTLSAL vs. LPSSAL: $ p < 0.05; CTLSAL vs. LPSIBU: # p < 0.05; LPSSAL vs. LPSIBU: * p < 0.05.
Ijms 26 05591 g003
Figure 4. Plasma, CSF and brainstem PGE2. (A) Concentration of PGE2 (pg.mL−1) in arterial plasma samples collected periodically throughout the experiment. Arterial plasma samples were collected on experimental days (D) 1–3 at baseline (before LPS/saline infusions [grey bar]) and at 2 and 6 h after LPS/saline infusions. The orange bar denotes the timing of saline or ibuprofen treatment, which was at 1 h after the LPS/saline infusion. Significant group differences were assessed by Fisher’s LSD test for multiple comparisons and are indicated as follows: * p < 0.05, ** p < 0.01, *** p < 0.005; LPSSAL vs. LPSIBU. CTLSAL: n = 6; LPSSAL: n = 8; LPSIBU: n = 6. (B) Concentration of PGE2 (pg.mL−1) in cerebrospinal fluid (CSF) collected at post-mortem. (C) % area coverage of PGE2+ immunostaining in brainstem respiratory centres. Significant differences are indicated as * p < 0.05. Values are mean ± SD. (D) Representative PGE2 immunofluorescent staining within the RTN/pFRG of the brainstem. Scale bar is 20 µm.
Ijms 26 05591 g004
Figure 6. IBA-1 immunostaining for microglia in brainstem respiratory centres. (AE) Cell density analysis of IBA-1 immuno-positive staining in brainstem regions. Values are mean ± SD. Significant differences are indicated as * p < 0.05, ** p < 0.01, *** p < 0.005. (F) Representative IBA-1 immunofluorescent staining within the preBötC and raphe of the brainstem at 40× magnification. Scale bars are 50 µm.
Ijms 26 05591 g006
Figure 7. Experimental timeline and brainstem assessment. (A) Instrumentally monitored fetuses randomly allocated to groups of CTLSAL fetuses only administered saline; LPSSAL fetuses administered daily-escalated doses of lipopolysaccharide (LPS), and saline 1 h after each LPS dose; and LPSIBU fetuses administered daily-escalated doses of lipopolysaccharide (LPS), with each LPS dose followed by ibuprofen (IBU) 1 h after. Respiratory centres assessed within the brainstem medulla in grey: (B) retrotrapezoid/parafacial respiratory group (RTN/pFRG); (C) nucleus tractus solitarius (NTS), preBötzinger complex (preBötC), raphe nucleus and the hypoglossal nucleus (XII).
Ijms 26 05591 g007
Table 1. Fetal characteristics at end of experiment and post-mortem.
CTLSALLPSSALLPSIBU
Number (n)988
Male/Female7:27:15:3
Single/Twin6:35:38:0p-Value
Body weight (kg)4.55 ± 0.604.56 ± 0.494.84 ± 0.380.196
Brain weight (g)51.47 ± 3.7048.77 ± 3.8347.73 ± 3.390.131
Brain/Body ratio11.40 ± 1.7710.75 ± 0.779.88 ± 0.440.088
Heart weight (g)31.98 ± 5.7532.94 ± 4.9740.20 ± 3.07 **##0.004
Heart/Body ratio7.06 ± 1.077.26 ± 1.038.37 ± 1.02 #0.046
Lungs (g)180.00 ± 27.17156.00 ± 17.00178.83 ± 41.850.219
Lungs/Body Ratio39.80 ± 5.6334.34 ± 3.0537.02 ± 8.680.104
Liver (g)131.10 ± 30.06134.40 ± 21.41142.38 ± 23.480.433
Right Kidney (g)12.39 ± 3.0312.66 ± 1.5013.60 ± 1.940.537
Blood gases at end of experiment
pH7.4 ± 0.07.3 ± 0.07.3 ± 0.00.136
PaO2 (mmHg)24.1 ± 2.623.4 ± 1.721.3 ± 4.30.192
PaCO2 (mmHg)47.2 ± 3.548.2 ± 1.951.2 ± 3.3 #0.039
SaO2 (%)64.6 ± 7.461.7 ± 5.760.6 ± 14.80.716
Lactate (mmol.L−1)1.5 ± 0.41.0 ± 0.21.5 ± 0.80.161
Glucose (mmol.L−1)0.9 ± 0.10.9 ± 0.21.2 ± 0.30.056
Data expressed as mean ± SD and analysed by one-way ANOVA for parametric data or the Kruskal–Wallis test for non-parametric data; post hoc tests followed up with Tukey’s multiple comparisons test. Significant group differences are in bold and indicated as follows: CTLSAL vs. LPSIBU: # p < 0.05, ## p < 0.01, LPSSAL vs. LPSIBU: ** p < 0.01.
Table 2. Baseline fetal breathing, cardiovascular, and cerebral physiology data: Average baseline data, obtained one hour prior to the first LPS/saline infusion, for fetal breathing movement characterisation, carotid blood flow (CBF), cerebral oxygen delivery (CDO2), mean arterial pressure (MABP) and fetal heart rate (FHR) parameters. Statistical analysis using one-way ANOVA for parametric data or the Kruskal–Wallis test for non-parametric data, demonstrating no baseline differences between groups. Data are mean ± SD.
Group
CTLSALLPSSALLPSIBUp-Value
Breathing incidence (%)44.0 ± 16.238.6 ± 26.428.9 ± 19.90.346
Breathing duration (s)75.5 ± 70.2192.8 ± 171.7145.6 ± 85.00.152
Breathing frequency (breaths/s)2.5 ± 0.24.0 ± 3.42.7 ± 1.20.967
Breathing amplitude (mmHg)6.6 ± 2.95.8 ± 2.84.2 ± 1.50.230
Accentuated breathing (% of time spent breathing)7.5 ± 4.234.4 ± 30.610.3 ± 10.00.233
CBF (mL/min)72.3 ± 9.890.7 ± 26.264.0 ± 16.10.085
CDO2 (mL/g/min)11.6 ± 1.916.5 ± 5.612.4 ± 2.50.099
MABP (mmHg)39.6 ± 7.044.2 ± 2.943.5 ± 6.30.230
FHR (bpm)155.0 ± 14.4146.2 ± 31.5158.1 ± 12.60.624
Disclaimer/Publisher’s Note: The statements, opinions and data contained in all publications are solely those of the individual author(s) and contributor(s) and not of MDPI and/or the editor(s). MDPI and/or the editor(s) disclaim responsibility for any injury to people or property resulting from any ideas, methods, instructions or products referred to in the content.

