A Systematic Review of ABCB1 Polymorphisms and Antiseizure Medication Resistance: Insights from Effect Size and Study Power Analysis
Abstract
1. Introduction
2. Materials and Methods
2.1. Information Sources and Search Strategy
2.2. Data Extraction and Statistical Analysis
3. Results
3.1. rs1045642 (c.3435C>T, p.Ile1145=)
3.1.1. Characteristics of Studies Included in the Analysis of rs1045642
3.1.2. Genotype Associations, Effect Sizes, and Required Sample Sizes for rs1045642
3.2. rs2032582 (c.2677G>T/A, p.Ala893Ser/Thr)
3.2.1. Characteristics of Studies Included in the Analysis of rs2032582
3.2.2. Genotype Associations, Effect Sizes, and Required Sample Sizes for rs2032582
3.3. rs1128503 (c.1236C>T, p.Gly412=)
3.3.1. Characteristics of Studies Included in the Analysis of rs1128503
3.3.2. Genotype Associations, Effect Sizes, and Required Sample Sizes for rs1128503
4. Discussion
4.1. ABCB1 Gene and P-Glycoprotein
4.2. ABCB1 Polymorphisms: Functional Impact on P-Glycoprotein
4.3. Study Design and Challenges in ABCB1 Pharmacogenetic Research
4.4. Genotype Distribution of ABCB1 Polymorphisms Across Populations
4.5. ABCB1 Polymorphisms and Antiseizure Medication Resistance
5. Conclusions
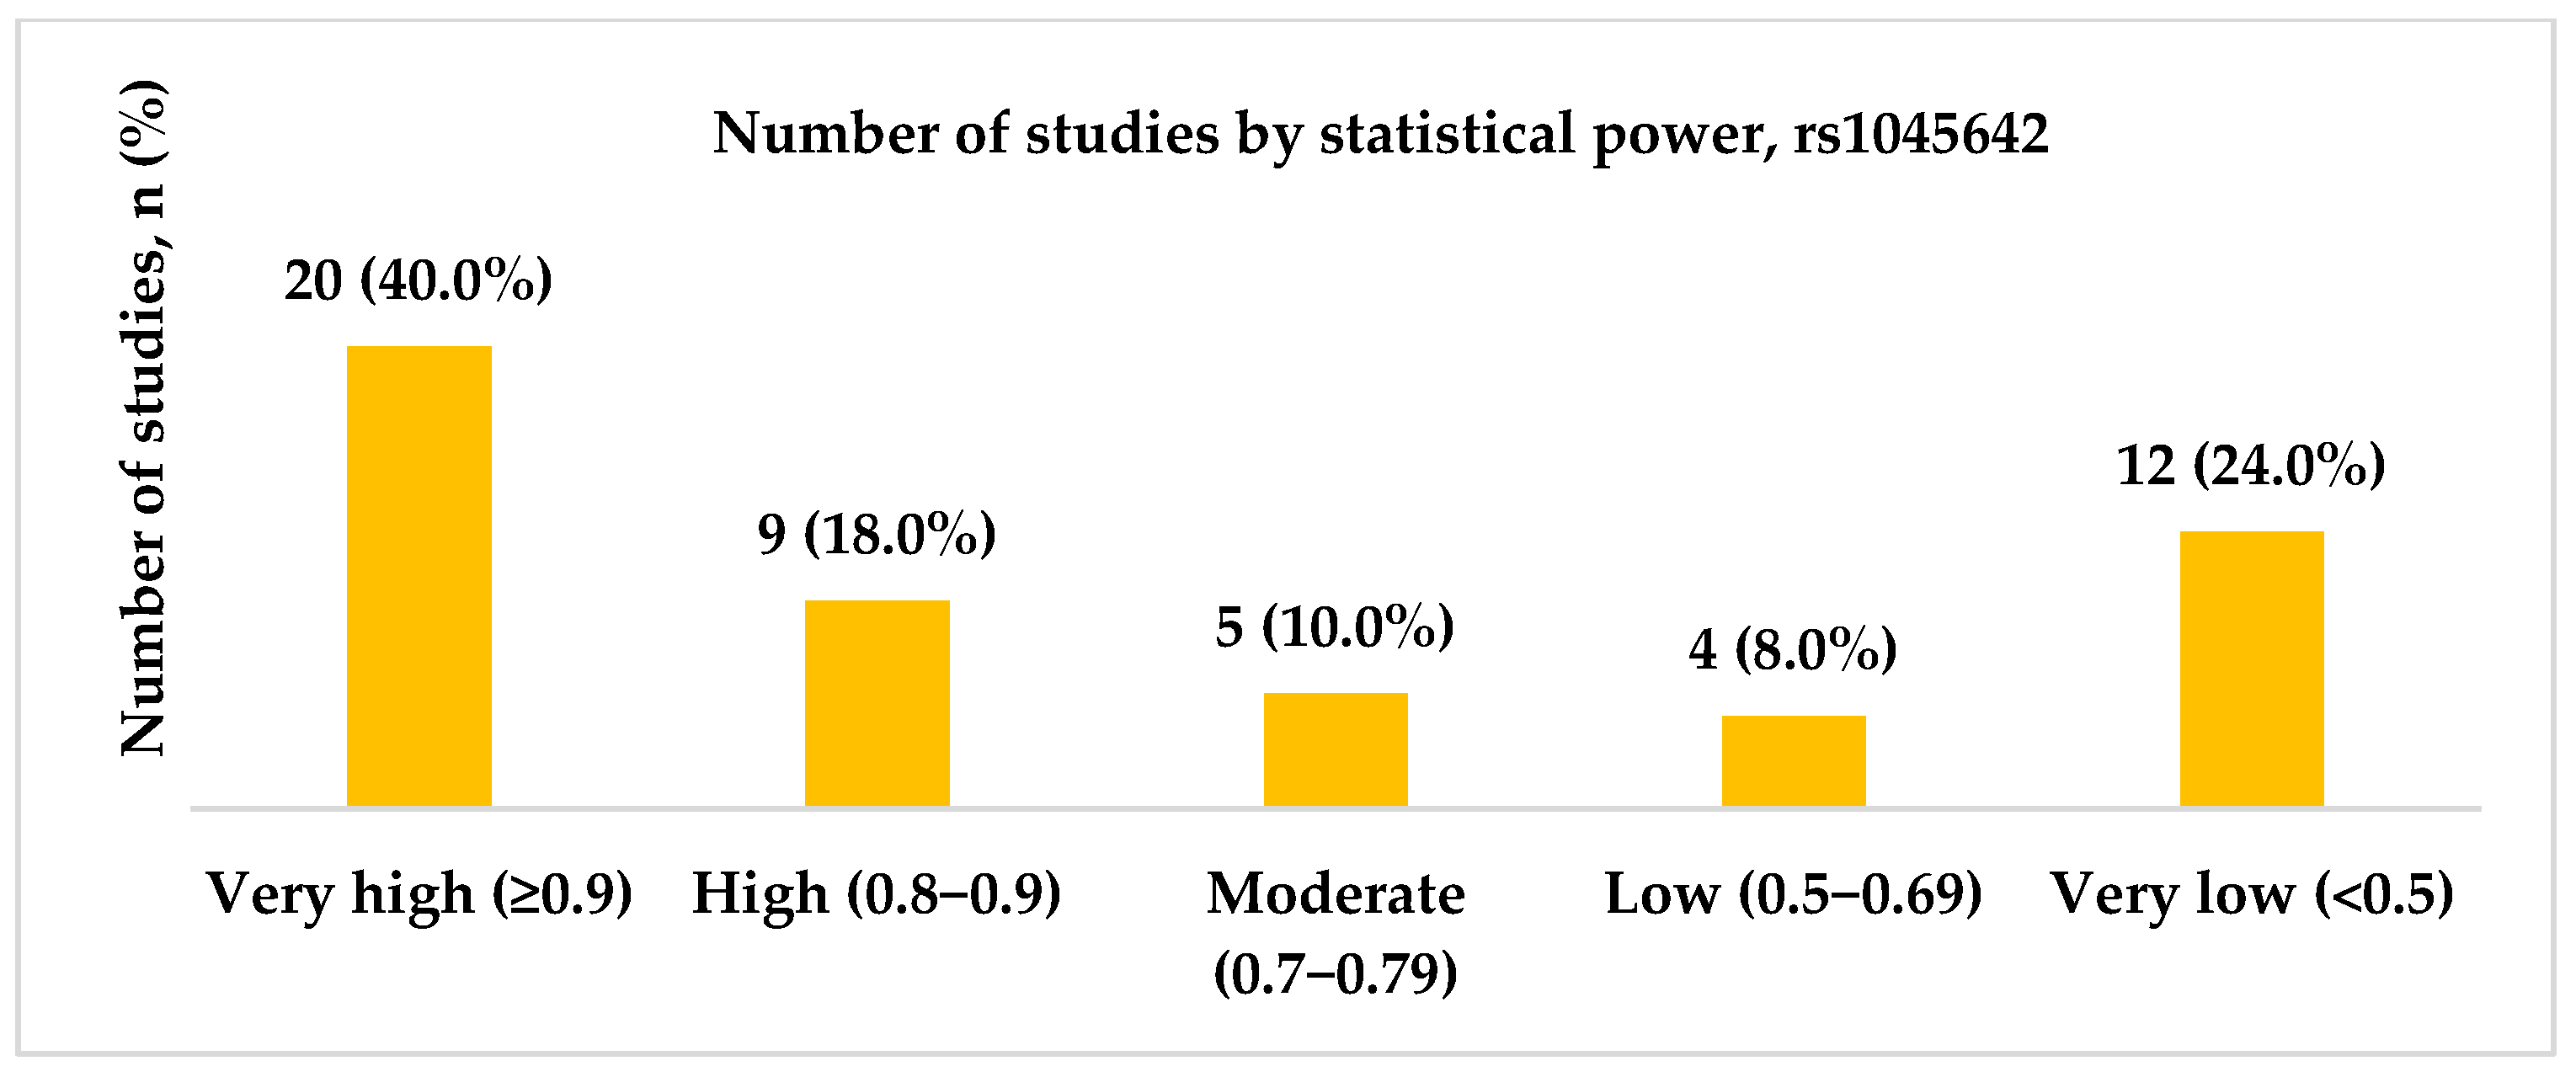
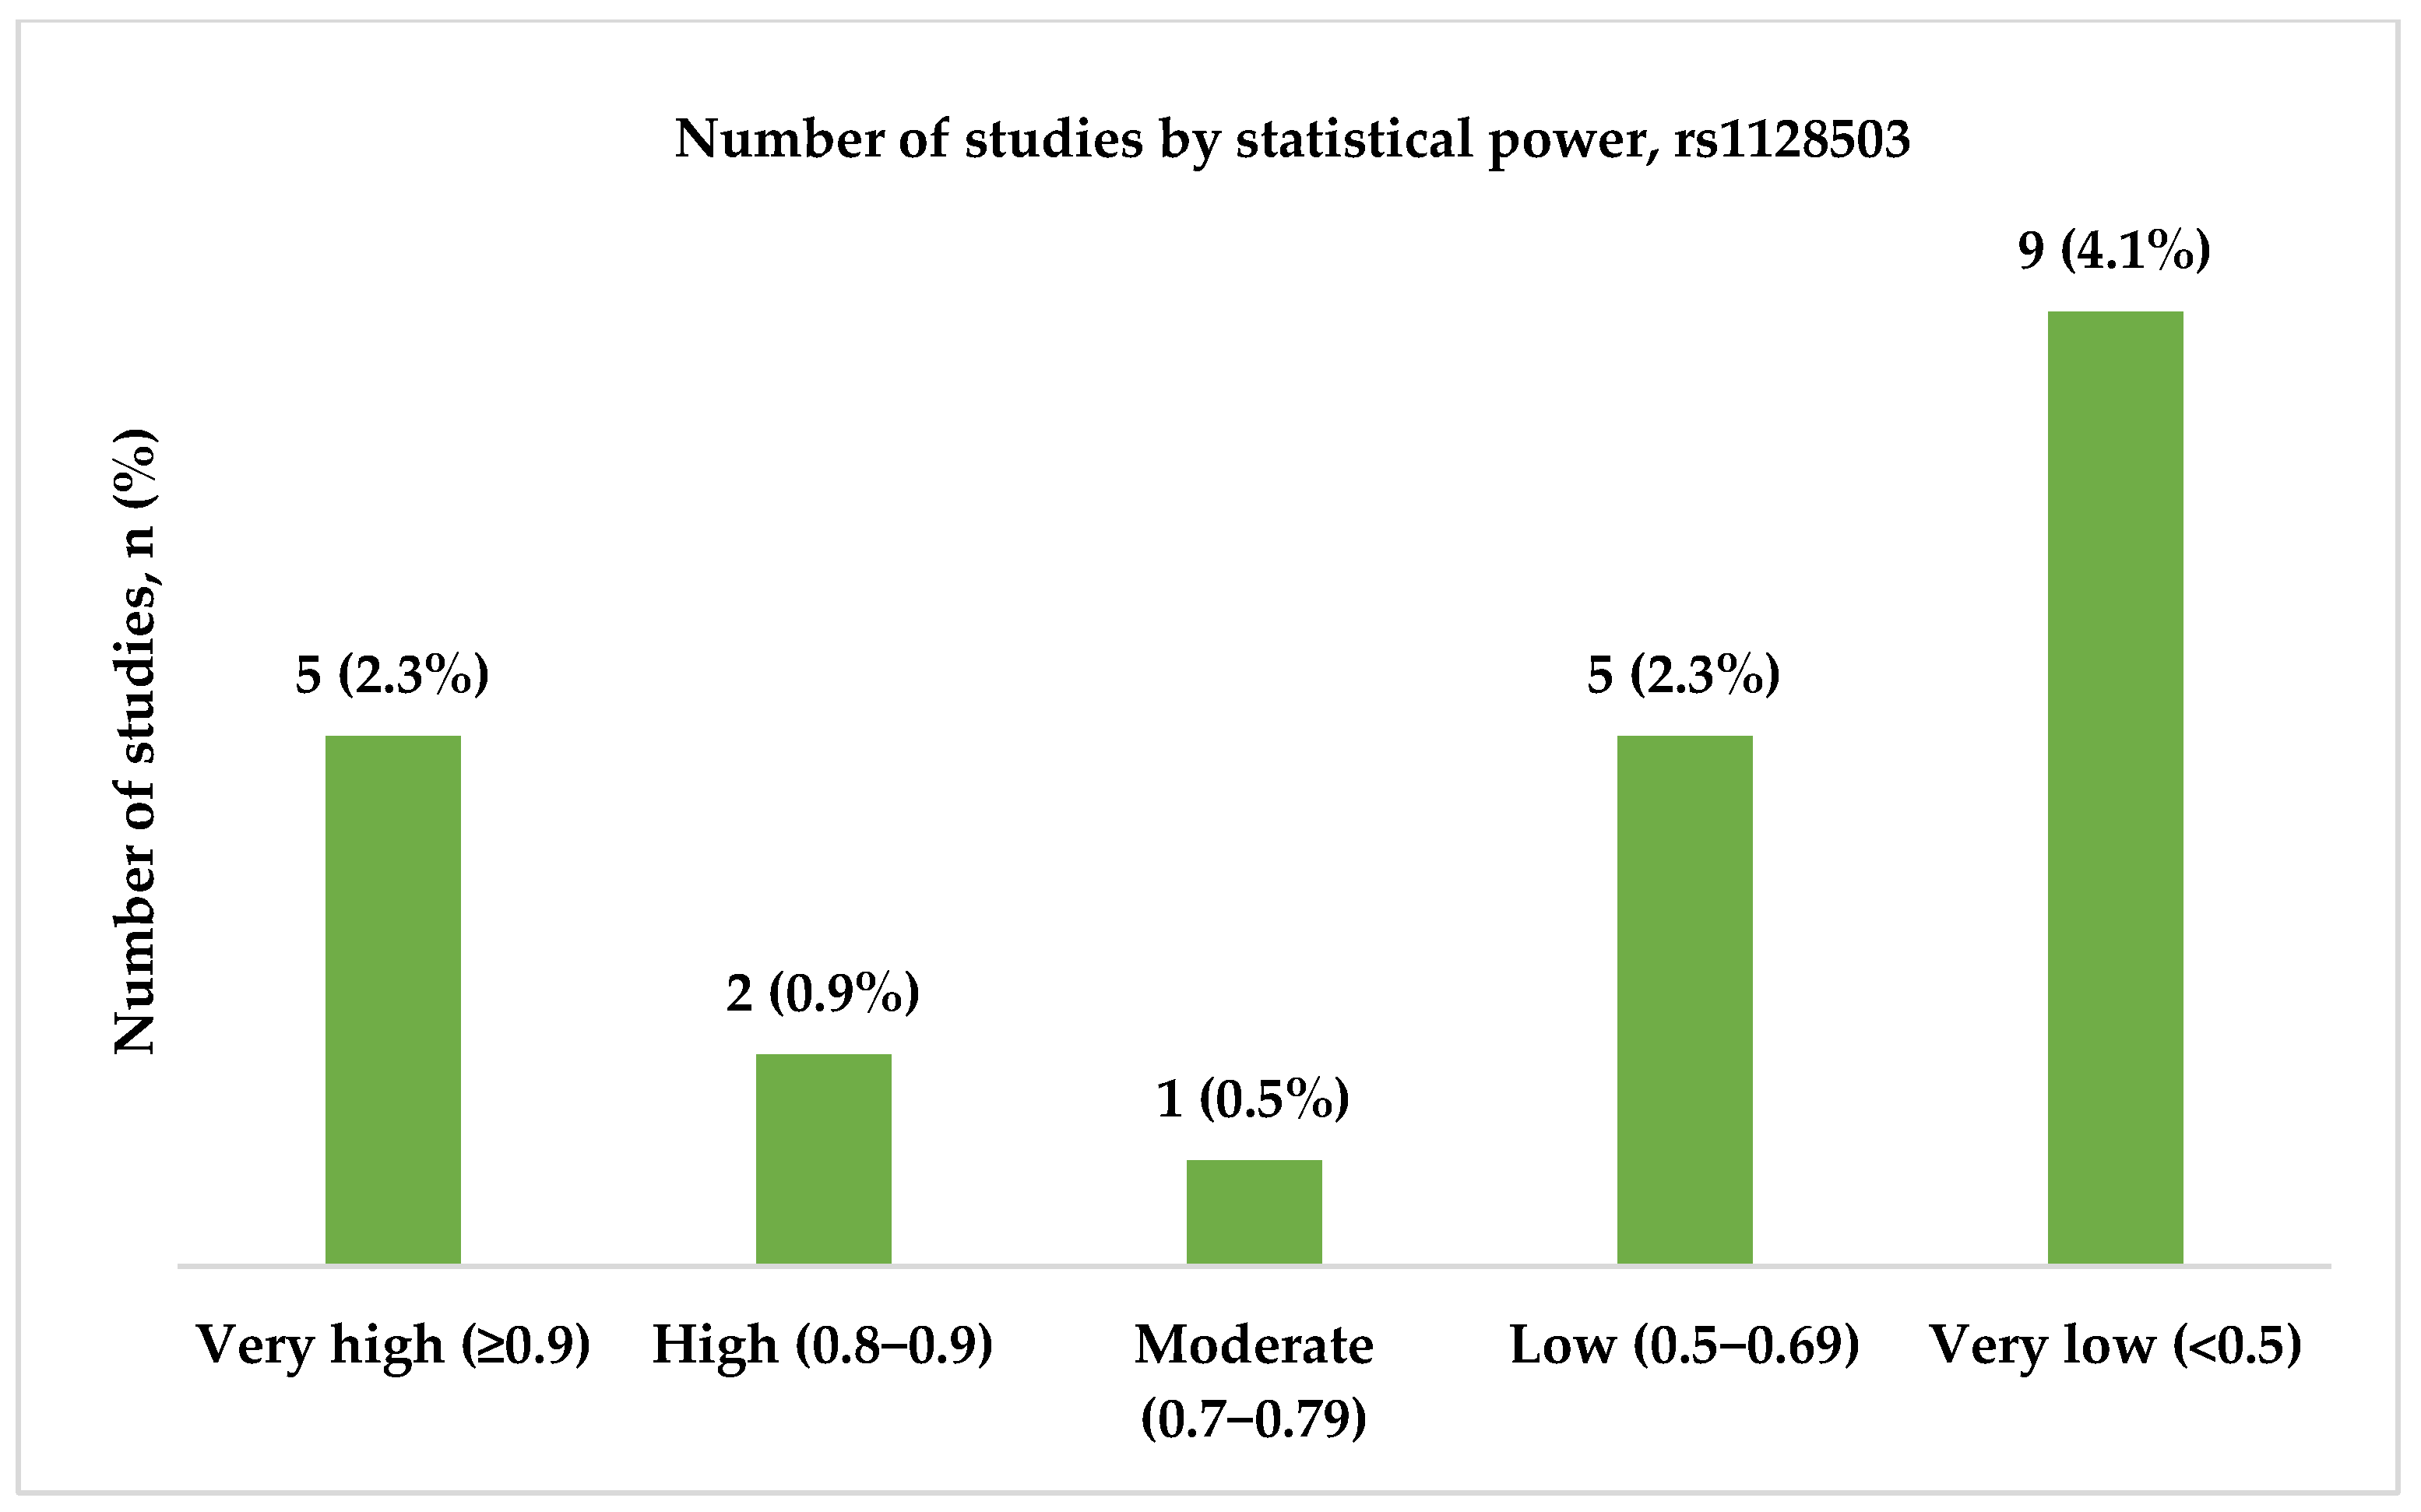
- High and very high statistical power for rs1045642 (c.3435C>T, p.Ile1145=), rs2032582 (c.2677G>T/A, p.Ala893Ser/Thr), and rs1128503 (c.1236C>T, p.Gly412=) polymorphisms was achieved only in 58.0, 60.7, and 31.8% of the studies, respectively. Considering both the effect sizes and statistical power when designing genetic association studies is essential, as they influence the reliability and interpretability of the results.
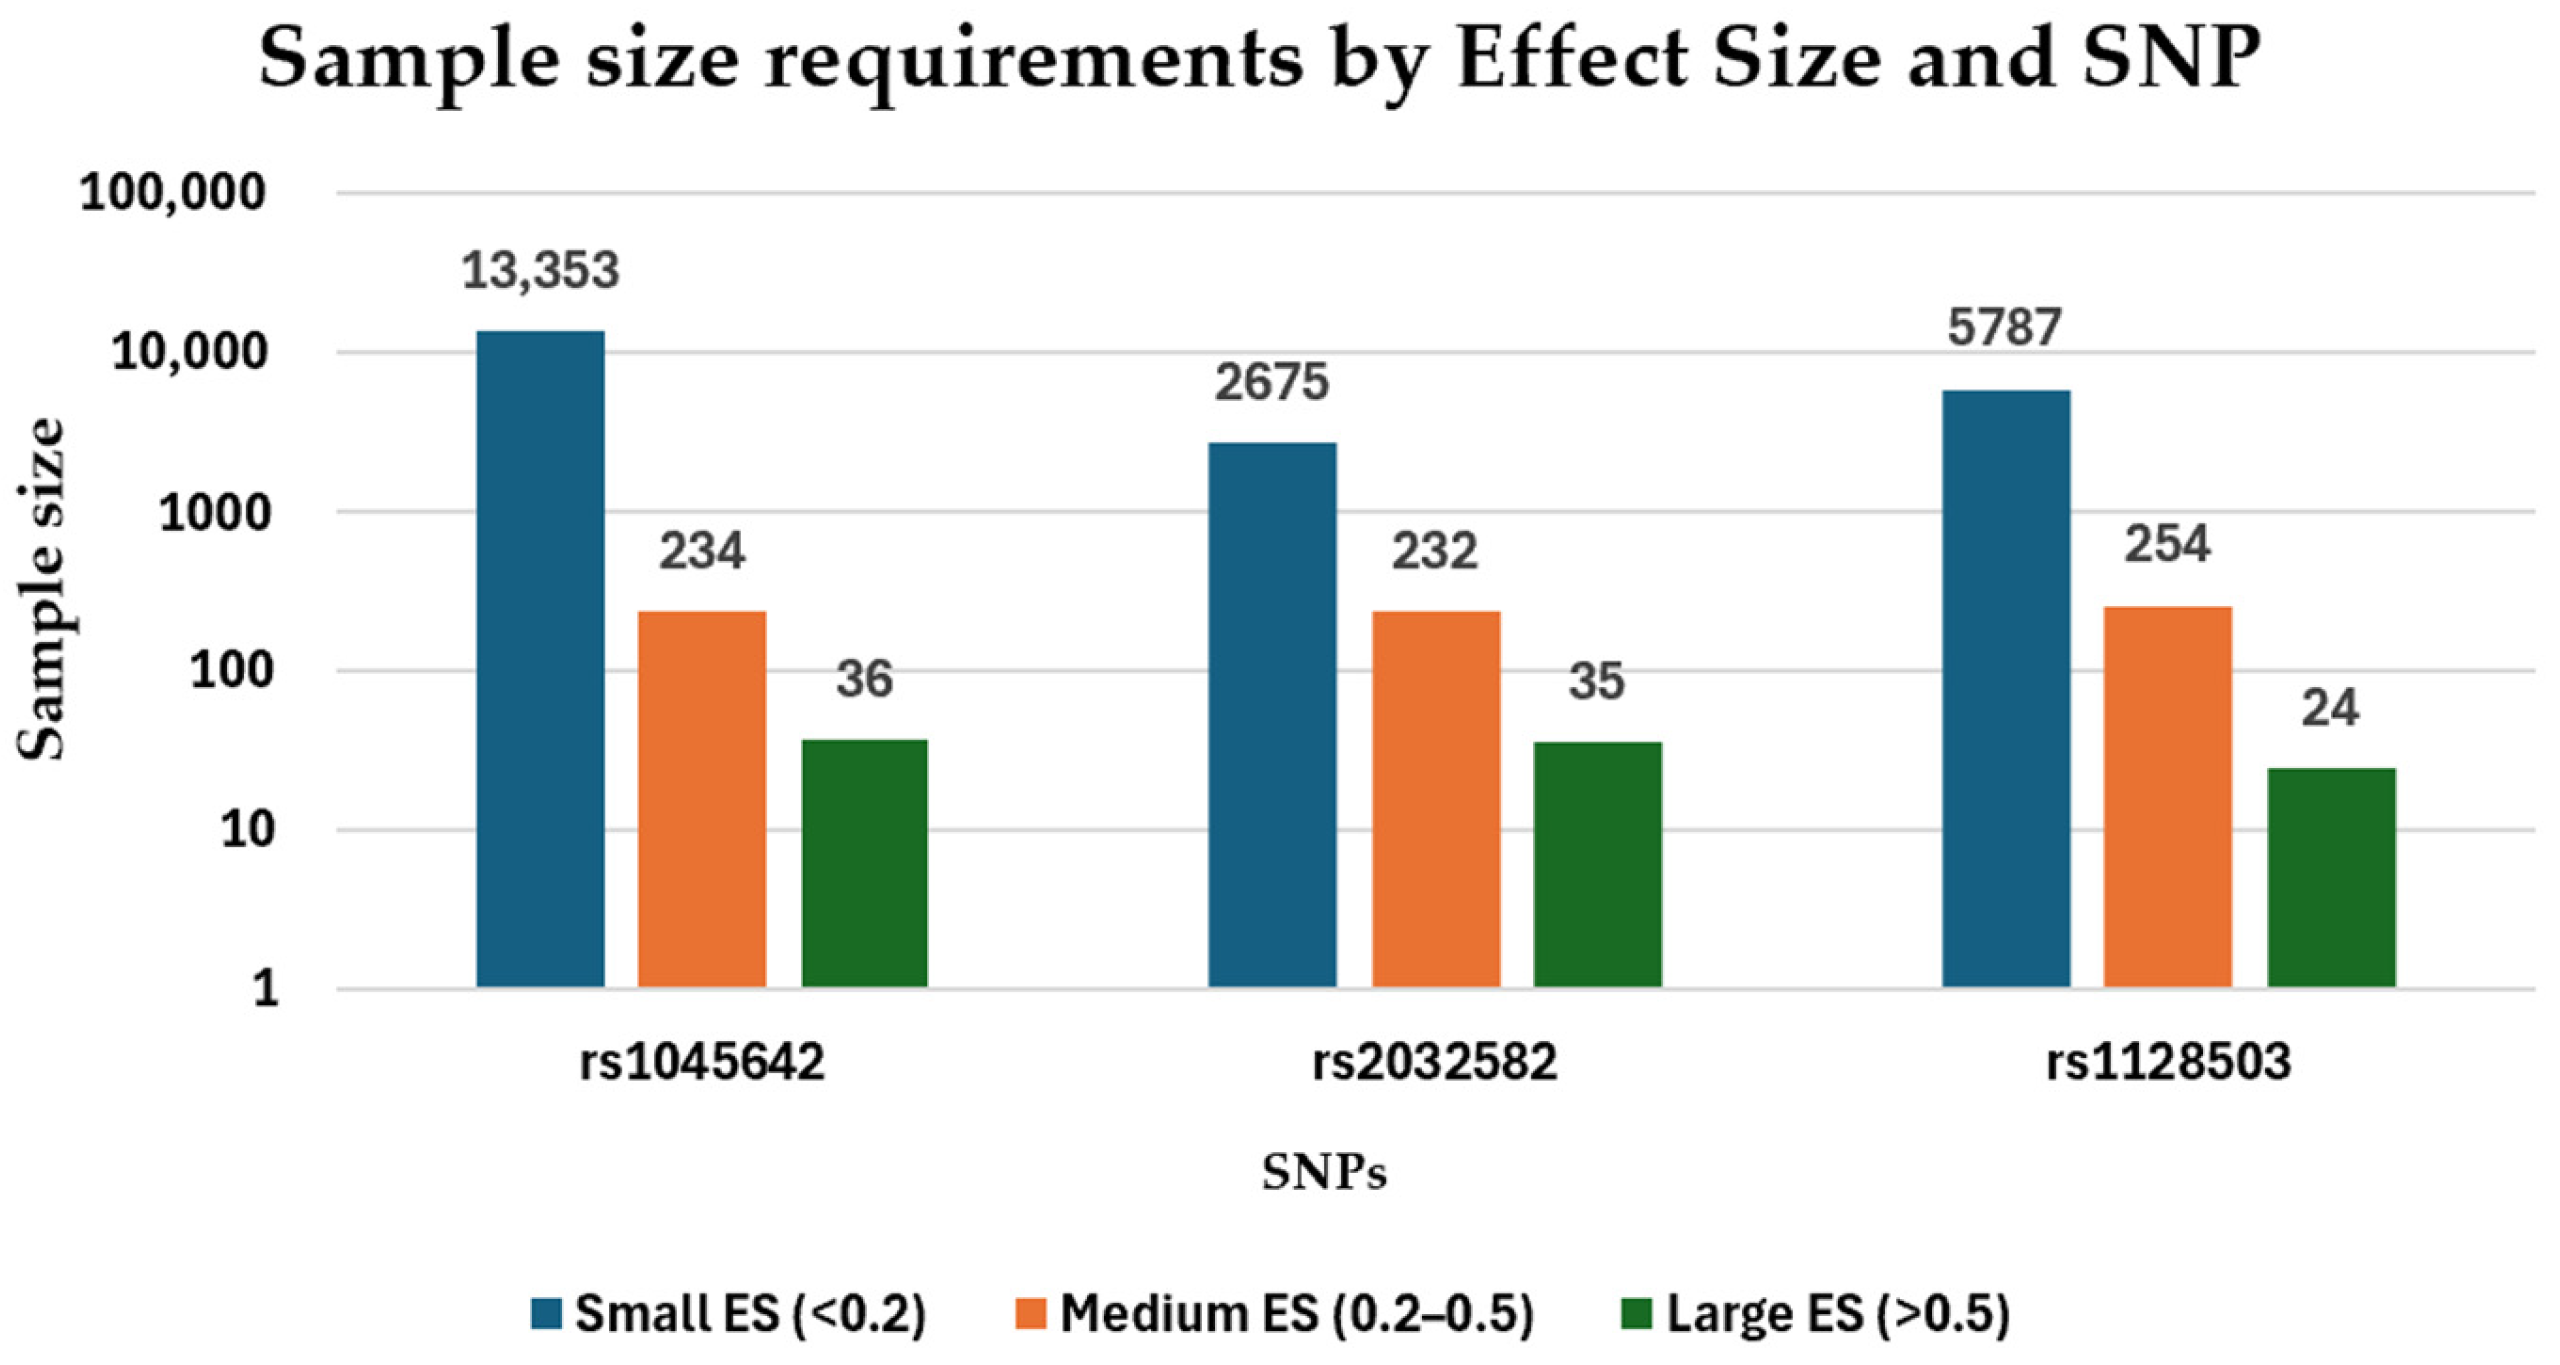
- The effect sizes (ES) of rs1045642, rs2032582, and rs1128503 ranged from 0.03–1.04, 0.06–0.92, and 0.04–0.64, respectively. The required sample sizes for rs1045642, rs2032582, and rs1128503 ranged from 9–13,000, 12–2600, and 24–5700 participants, respectively.
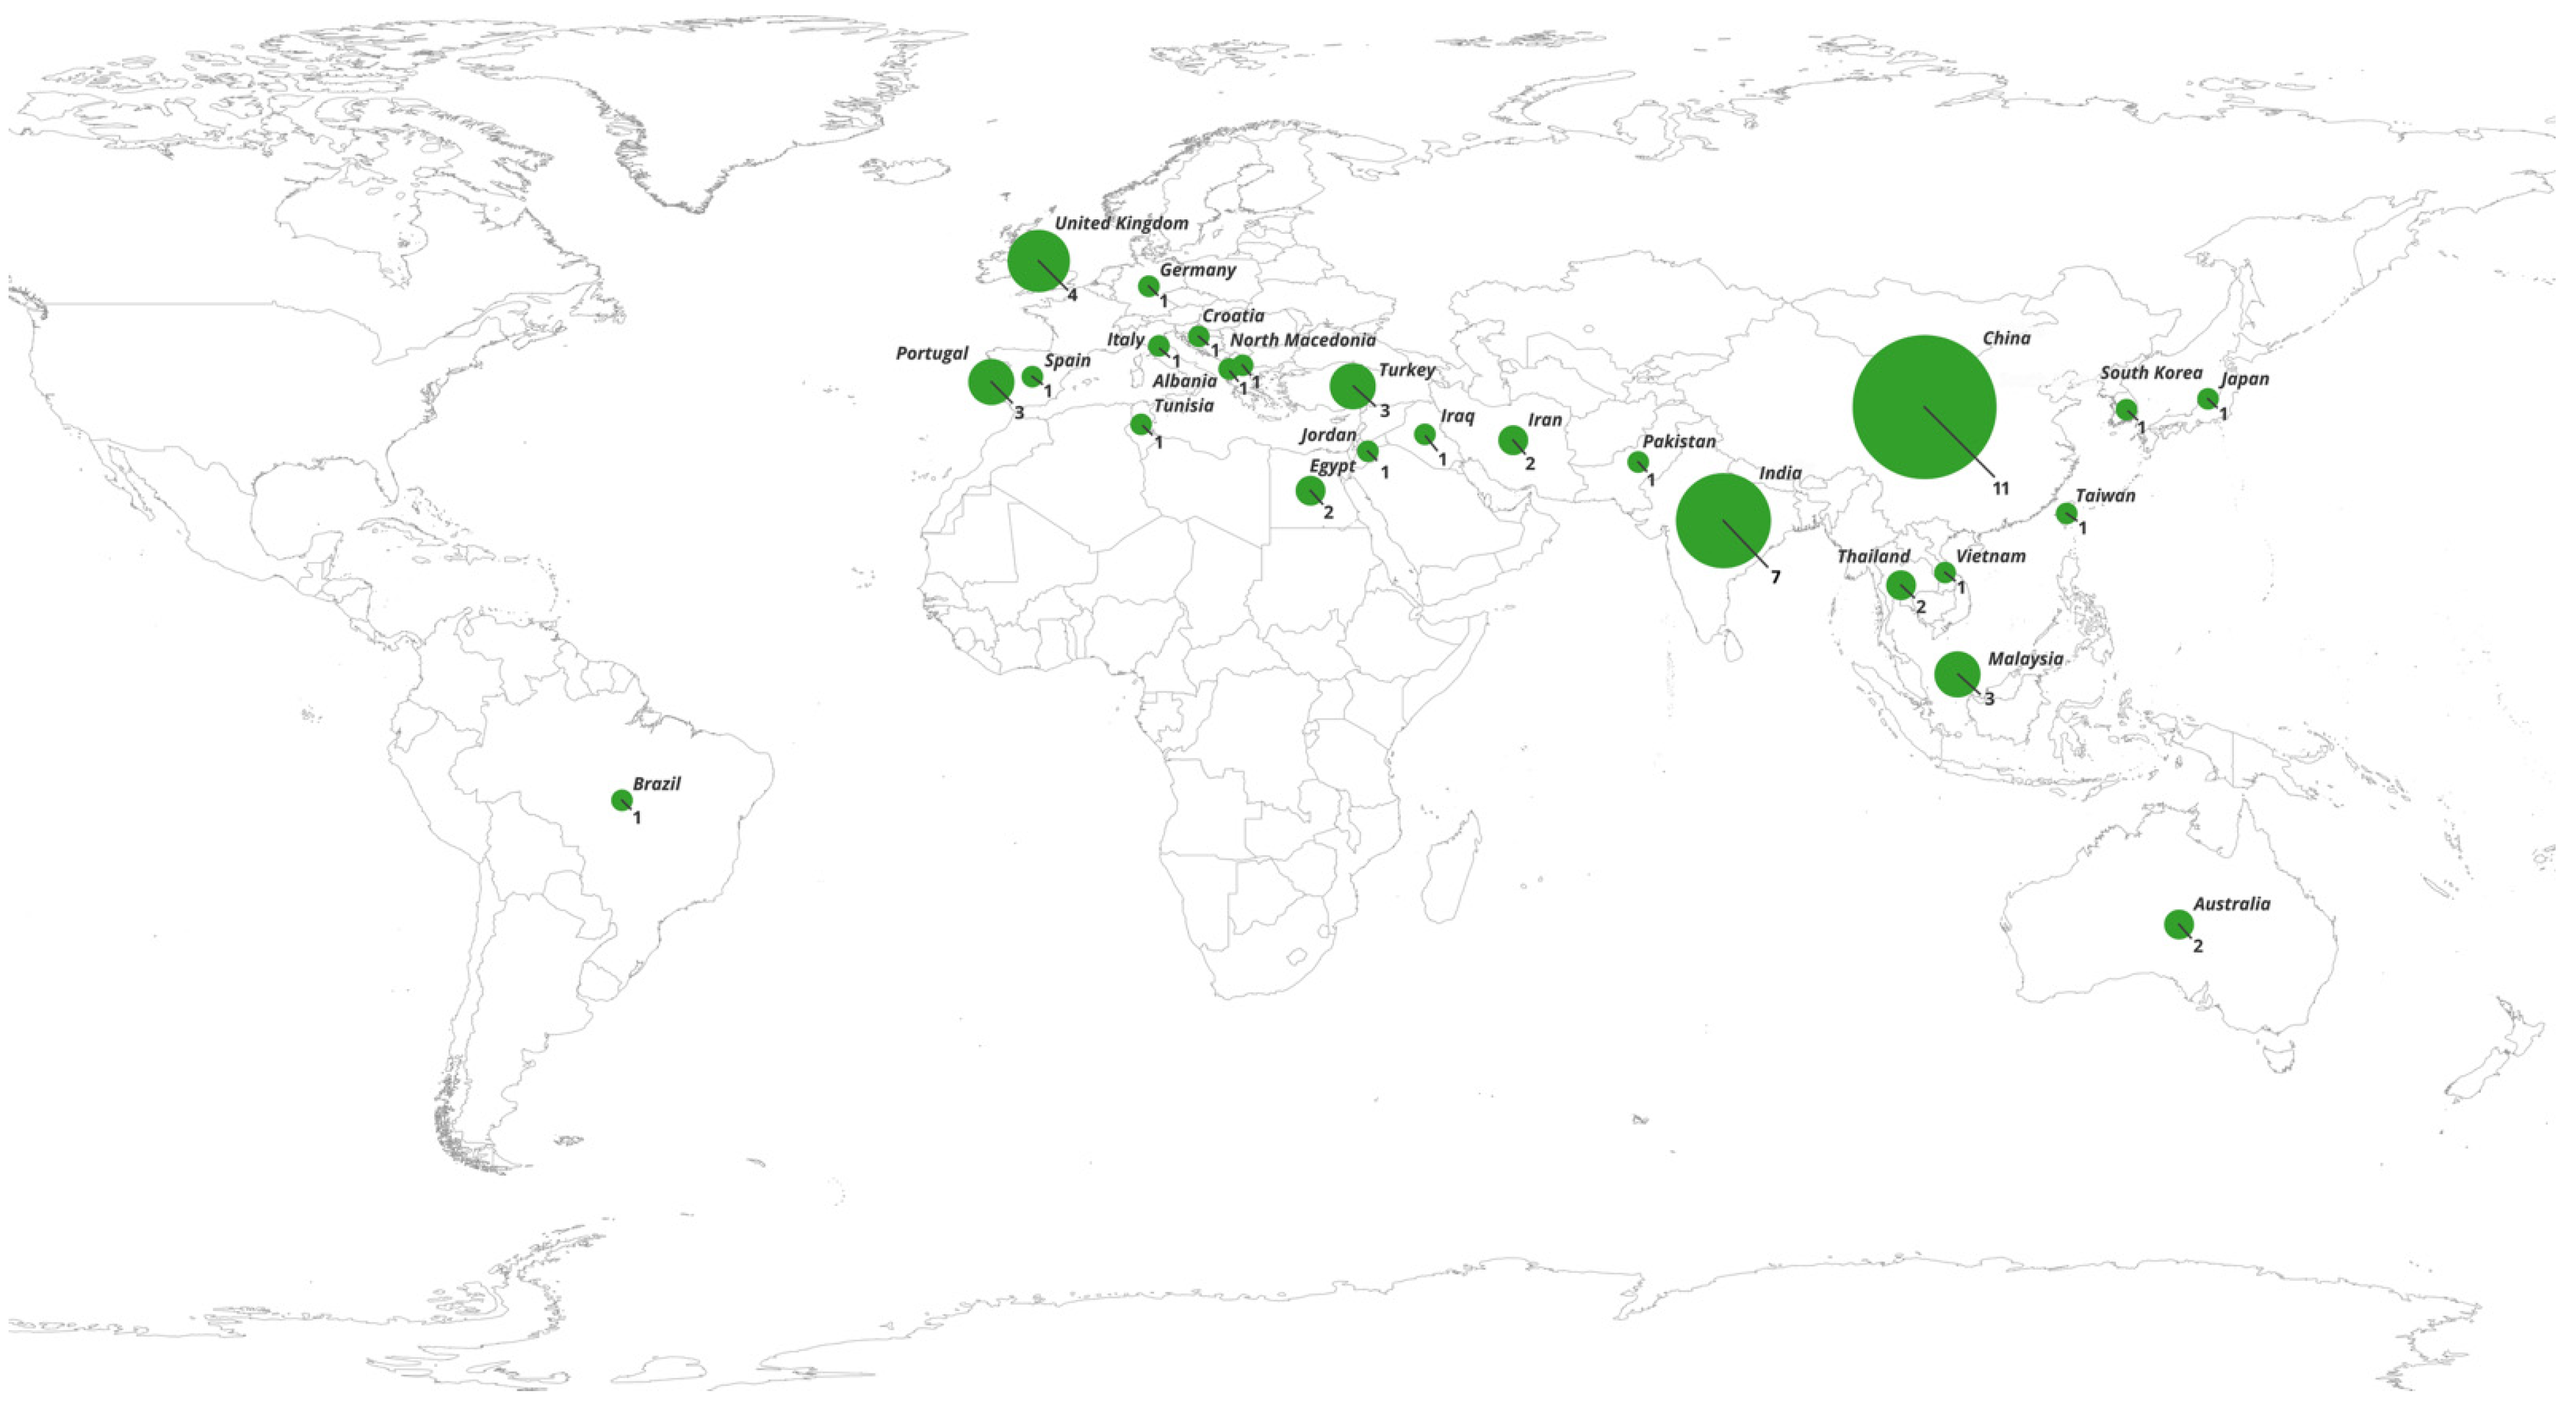
- There is a shortage of studies on European, African, and Middle Eastern populations, and South Asian, Southeast Asian, and Latin American countries. Expanding research into a wider range of populations could help identify population-specific genetic markers, improve global understanding, and guide treatment strategies for epilepsy.
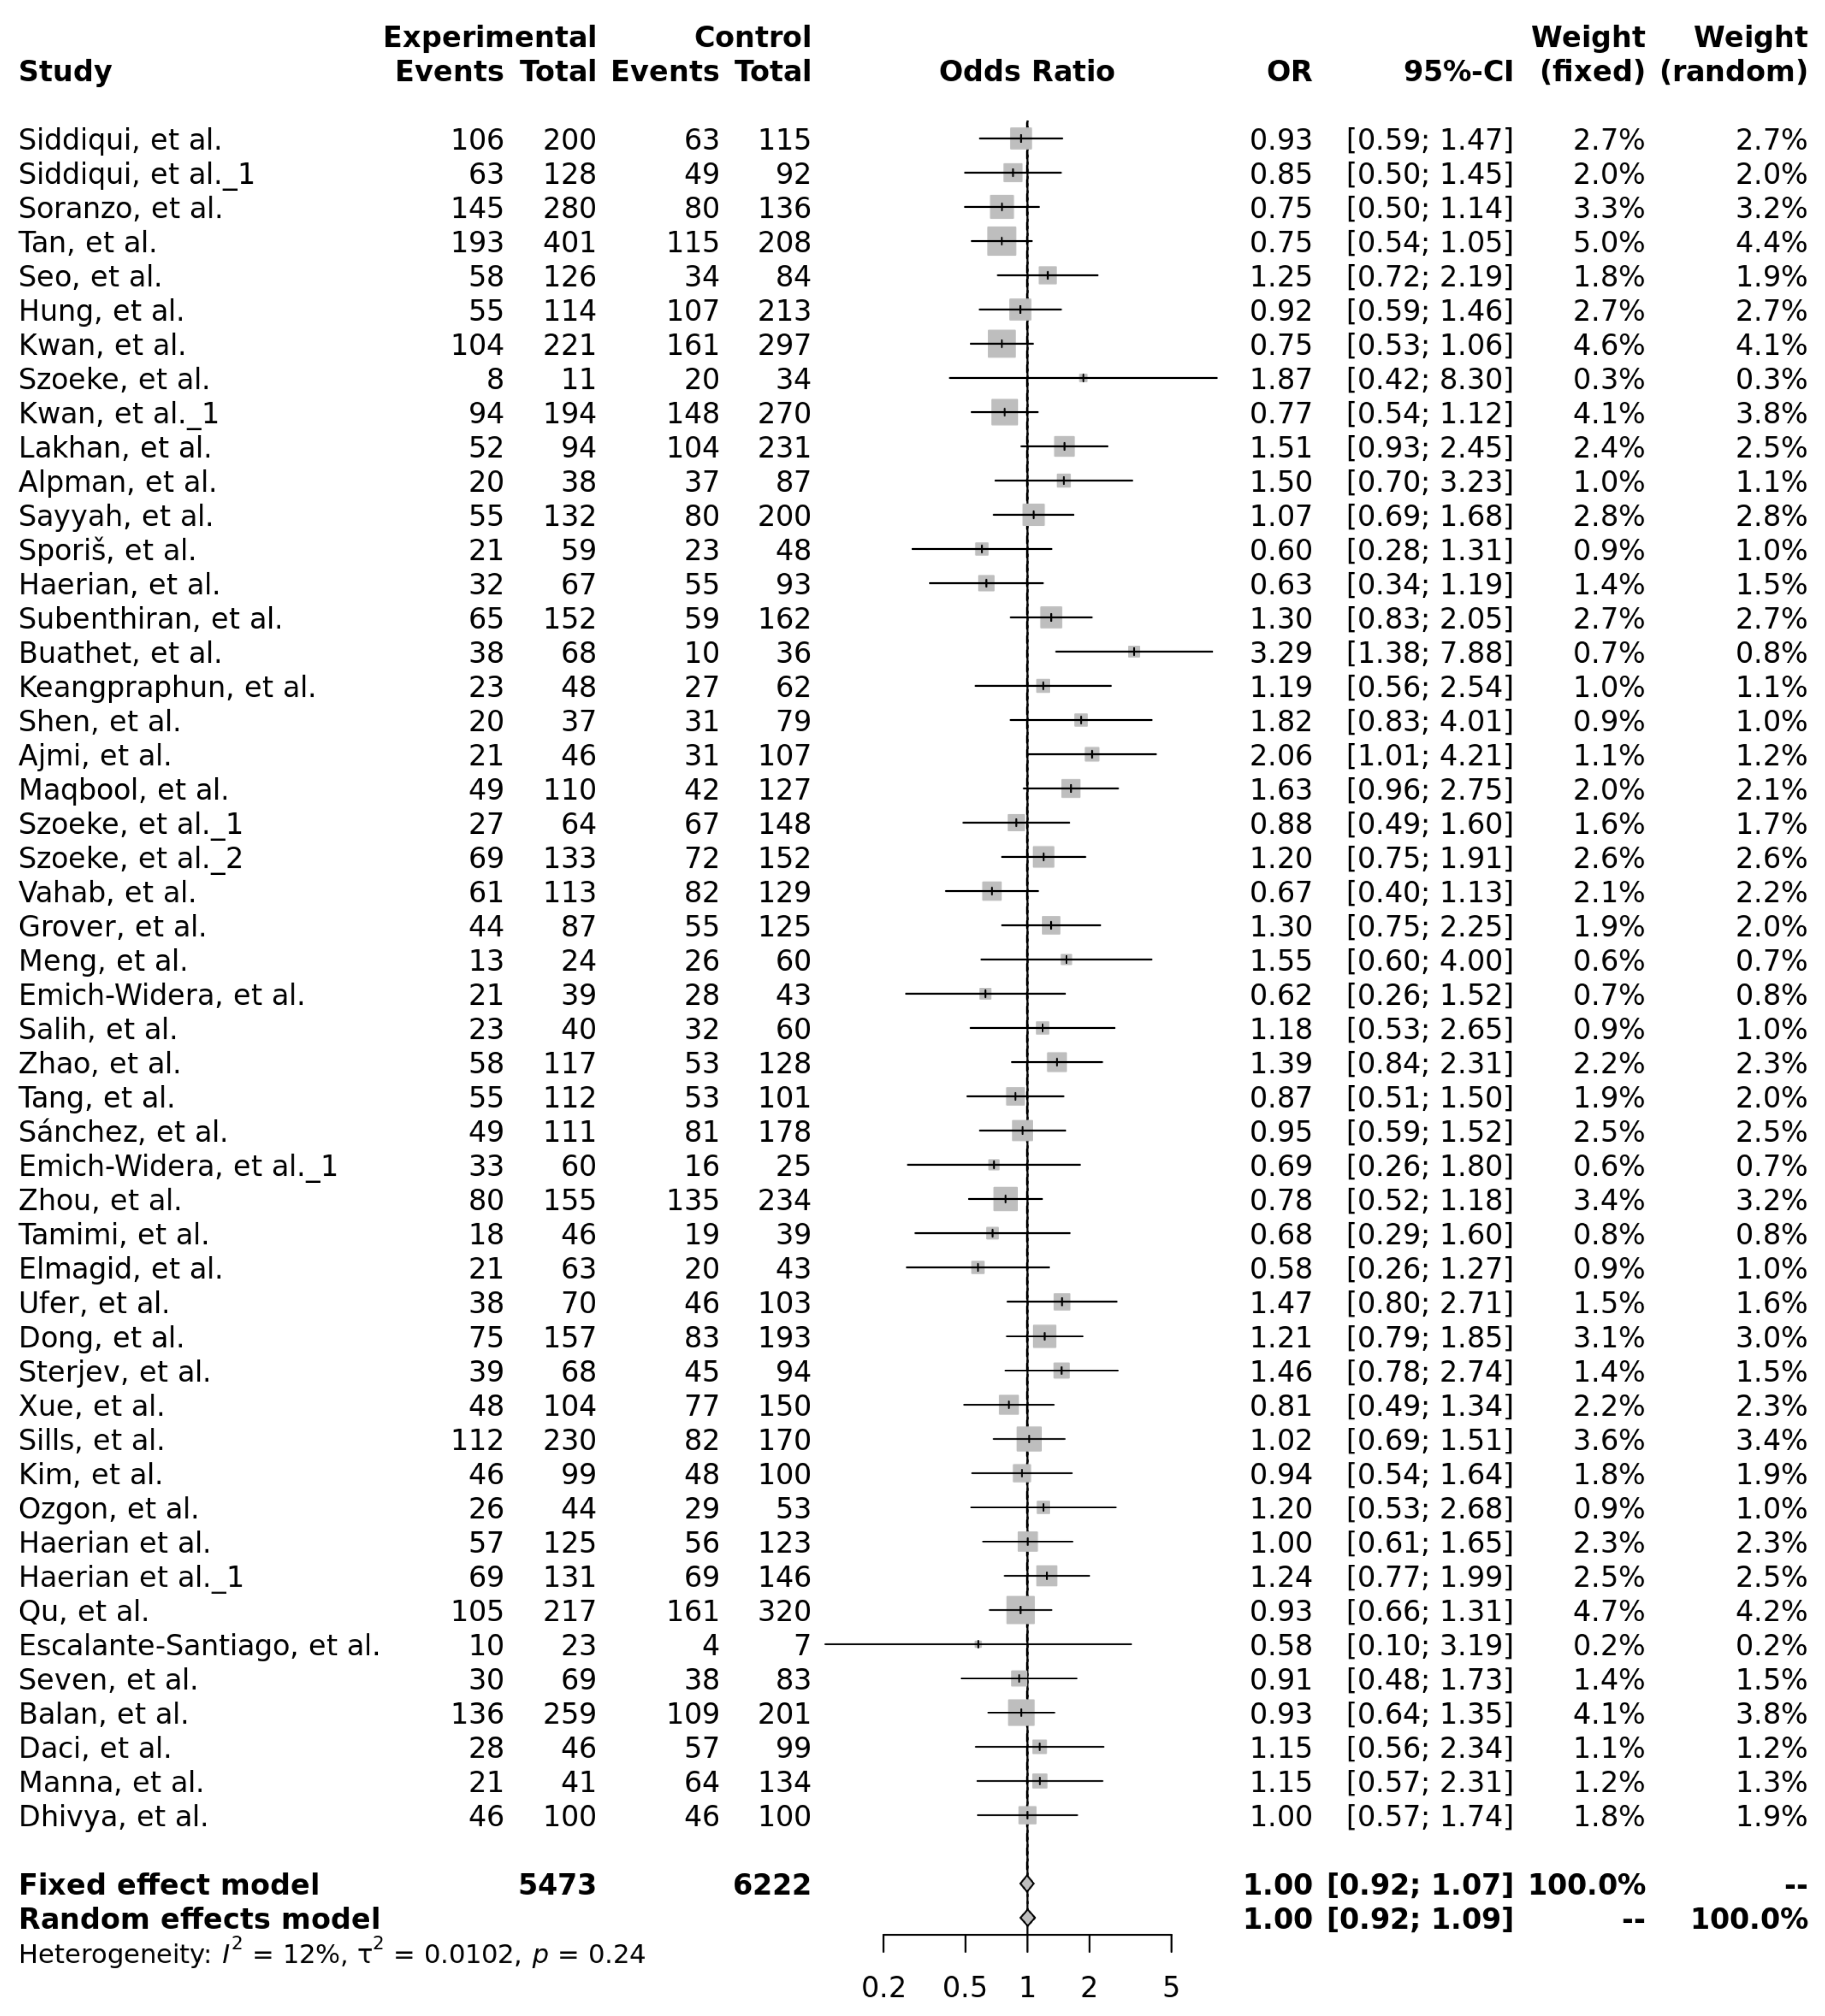
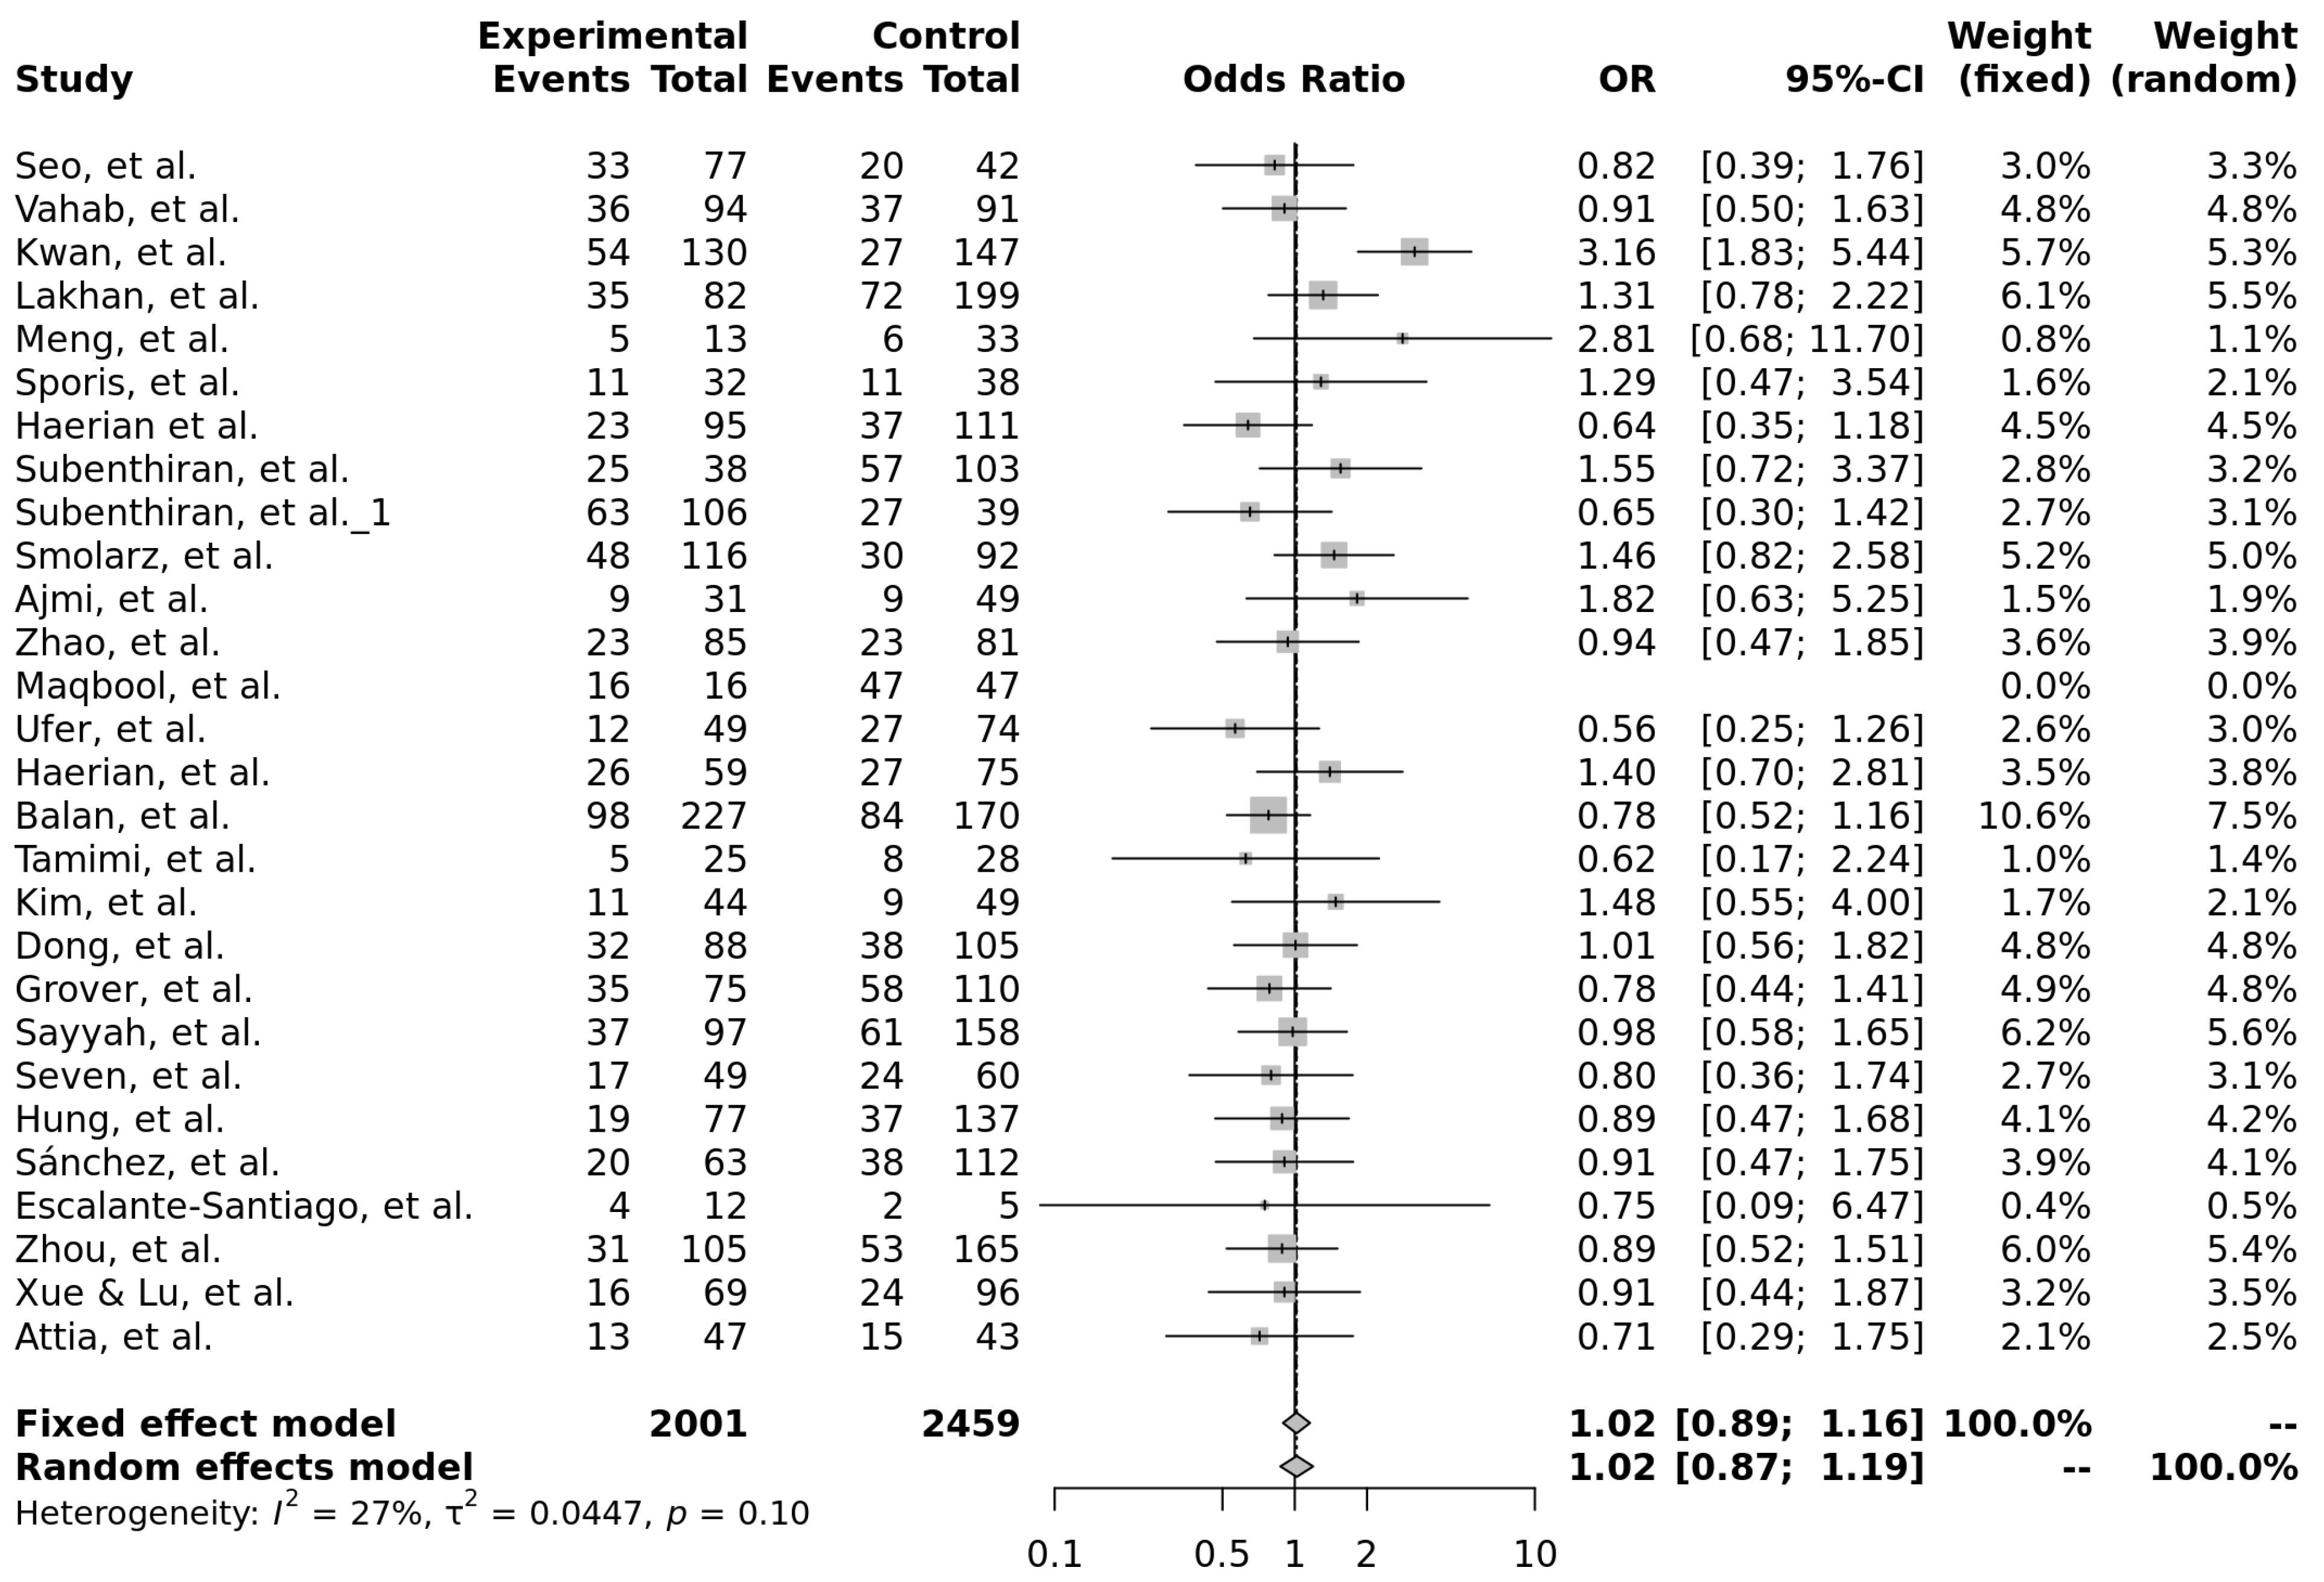
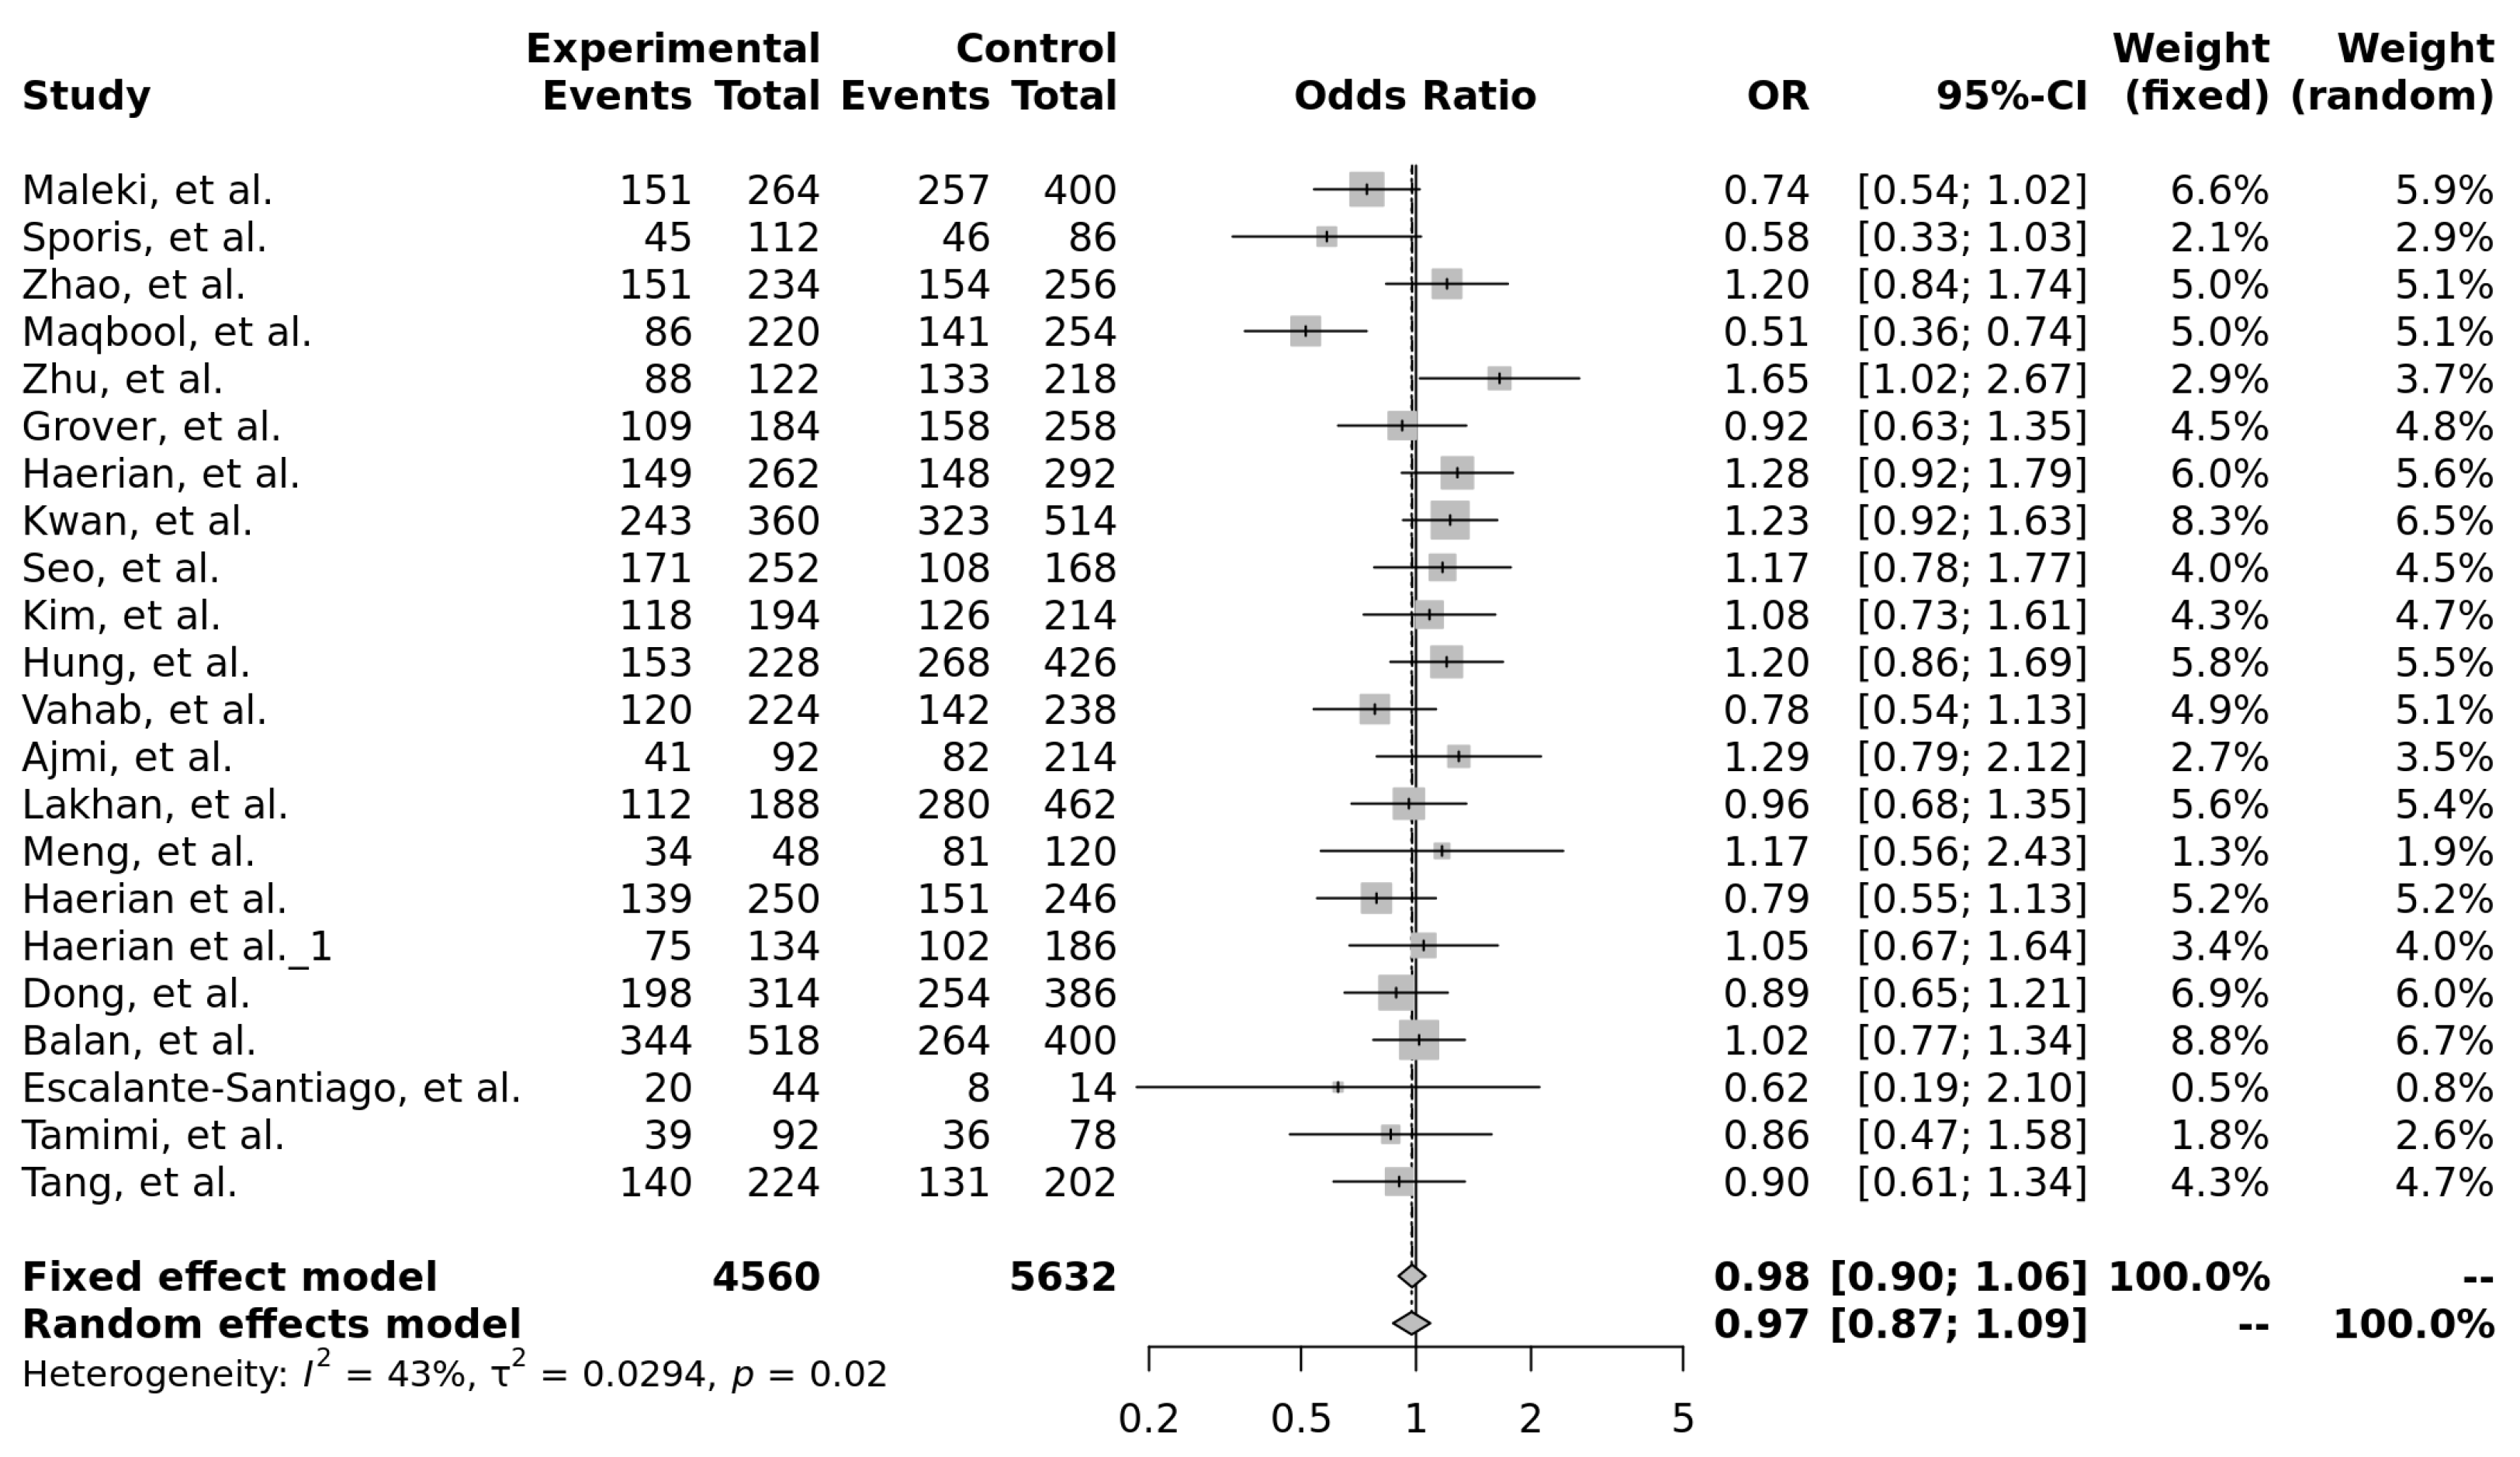
- The meta-analyses did not identify statistically significant associations between any of the three ABCB1 polymorphisms (rs1045642, rs2032582, or rs1128503) and antiseizure medication resistance.
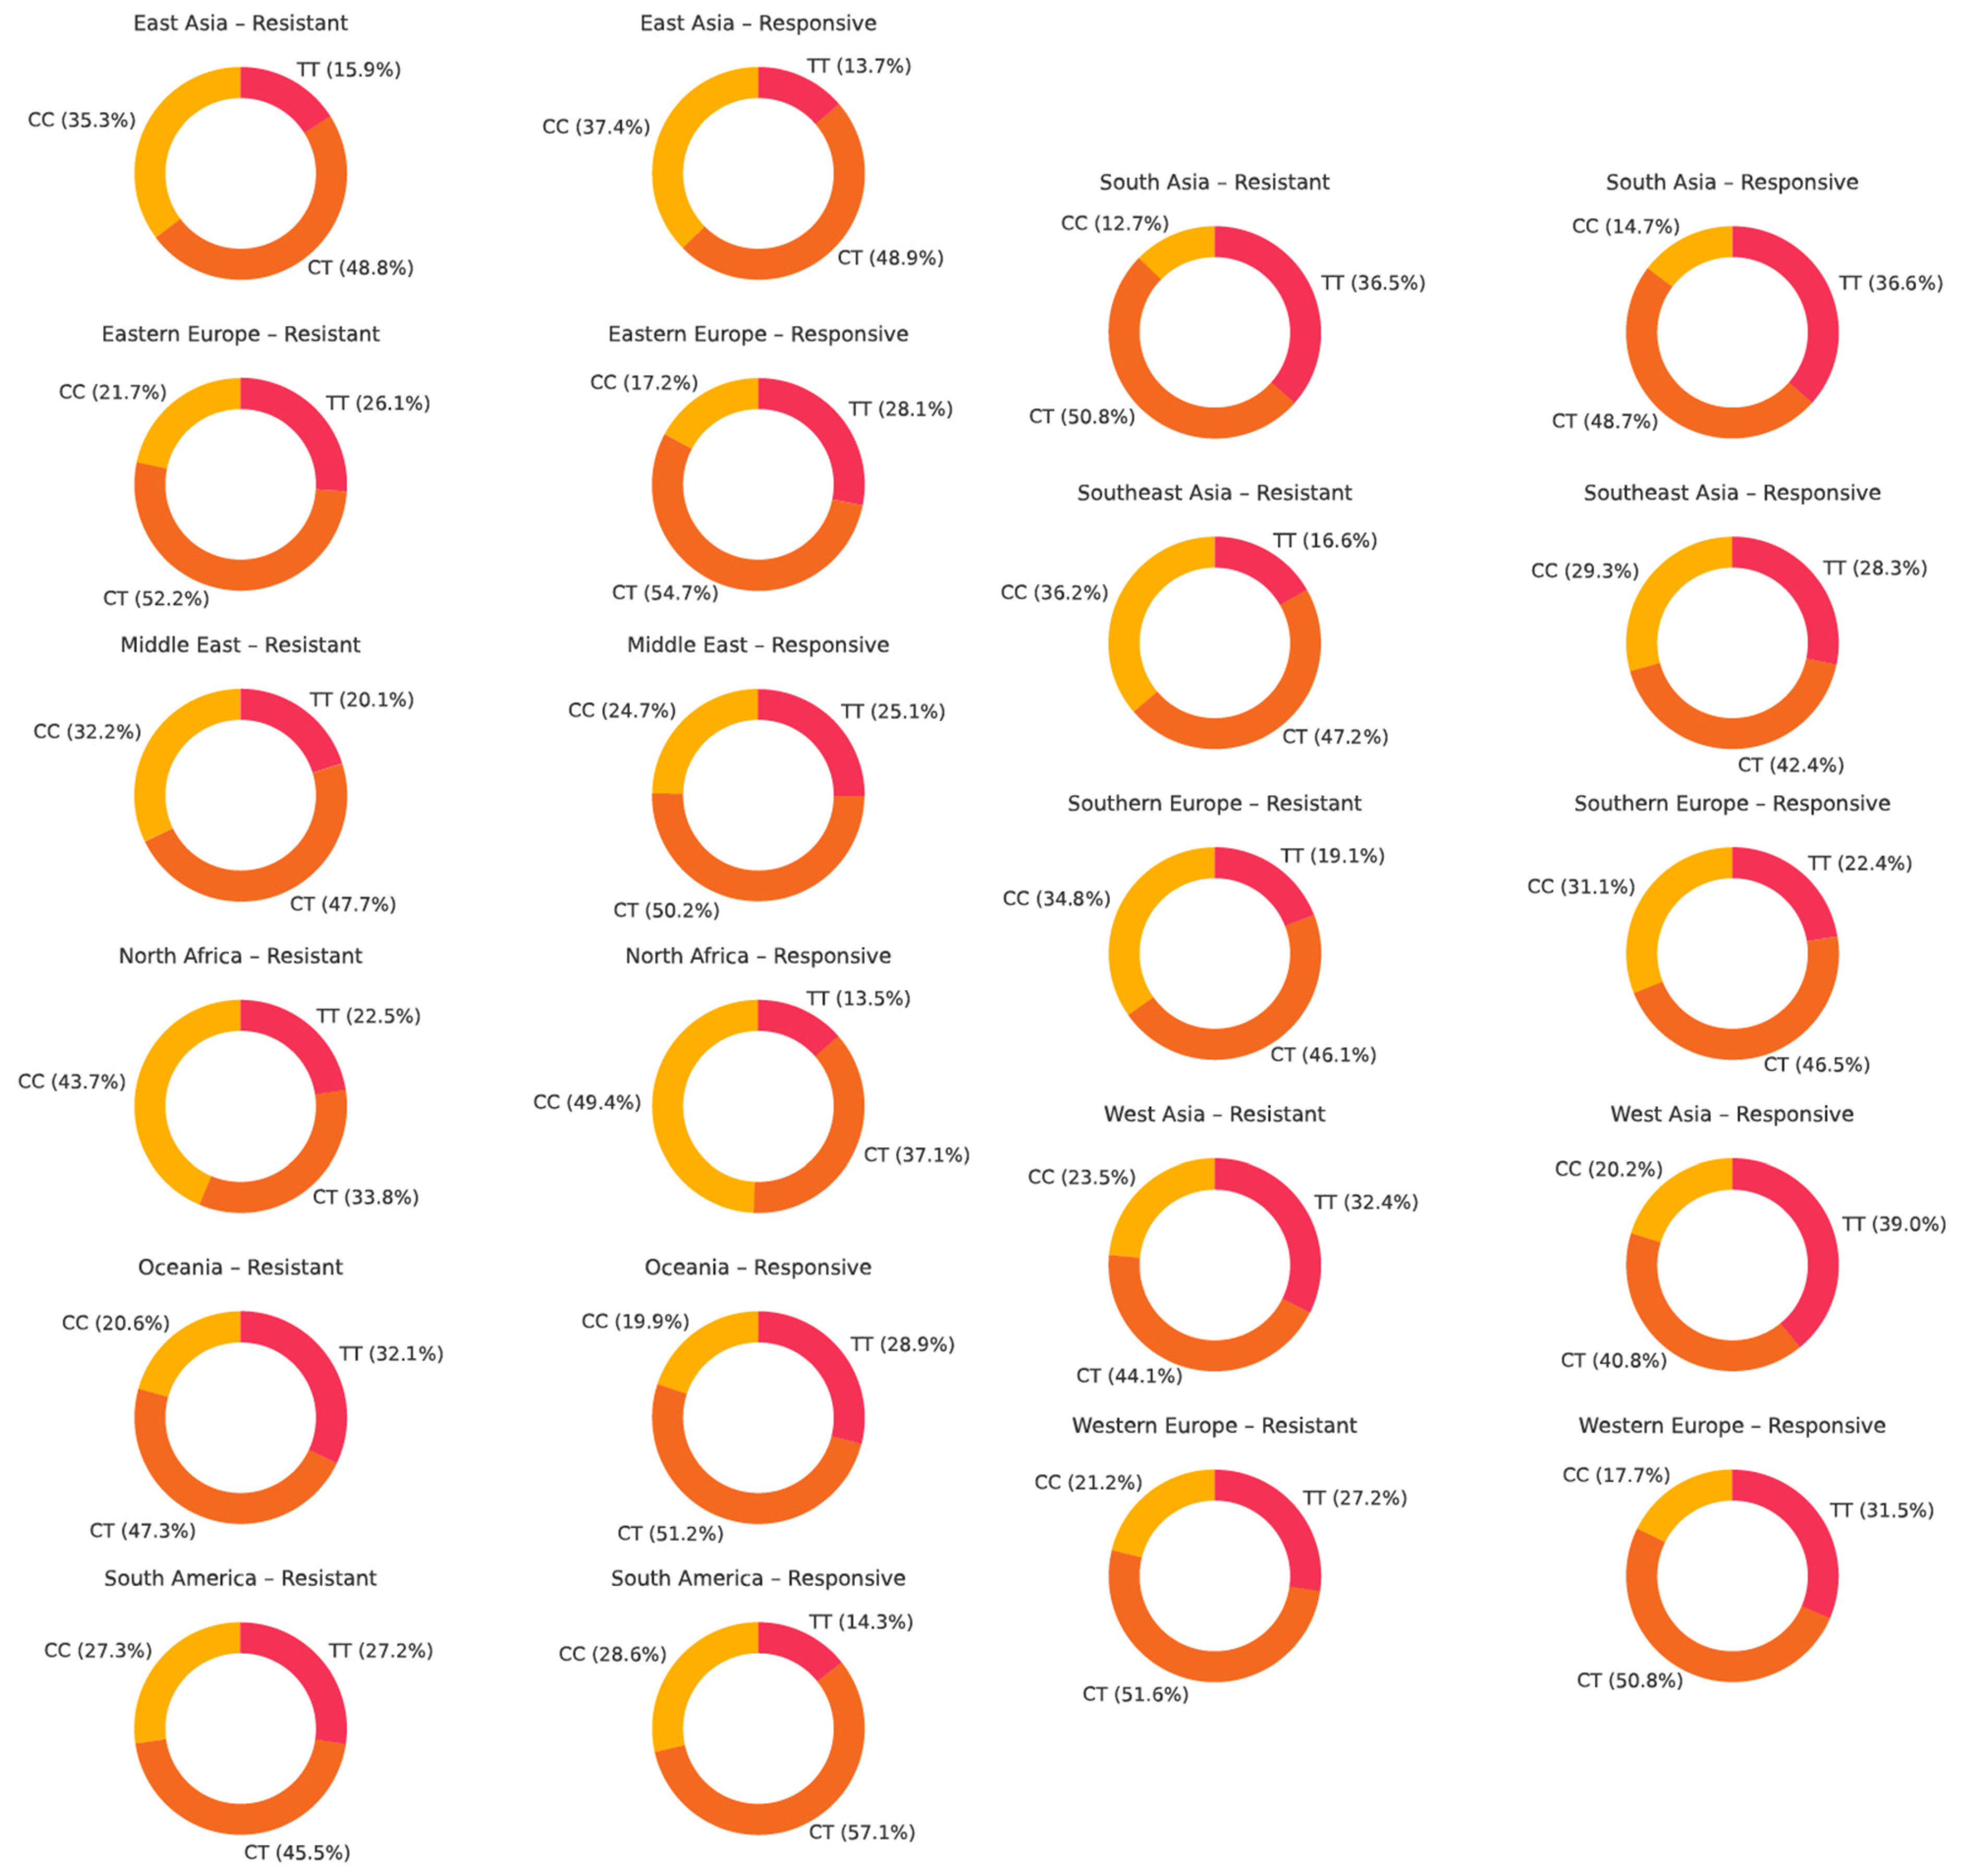
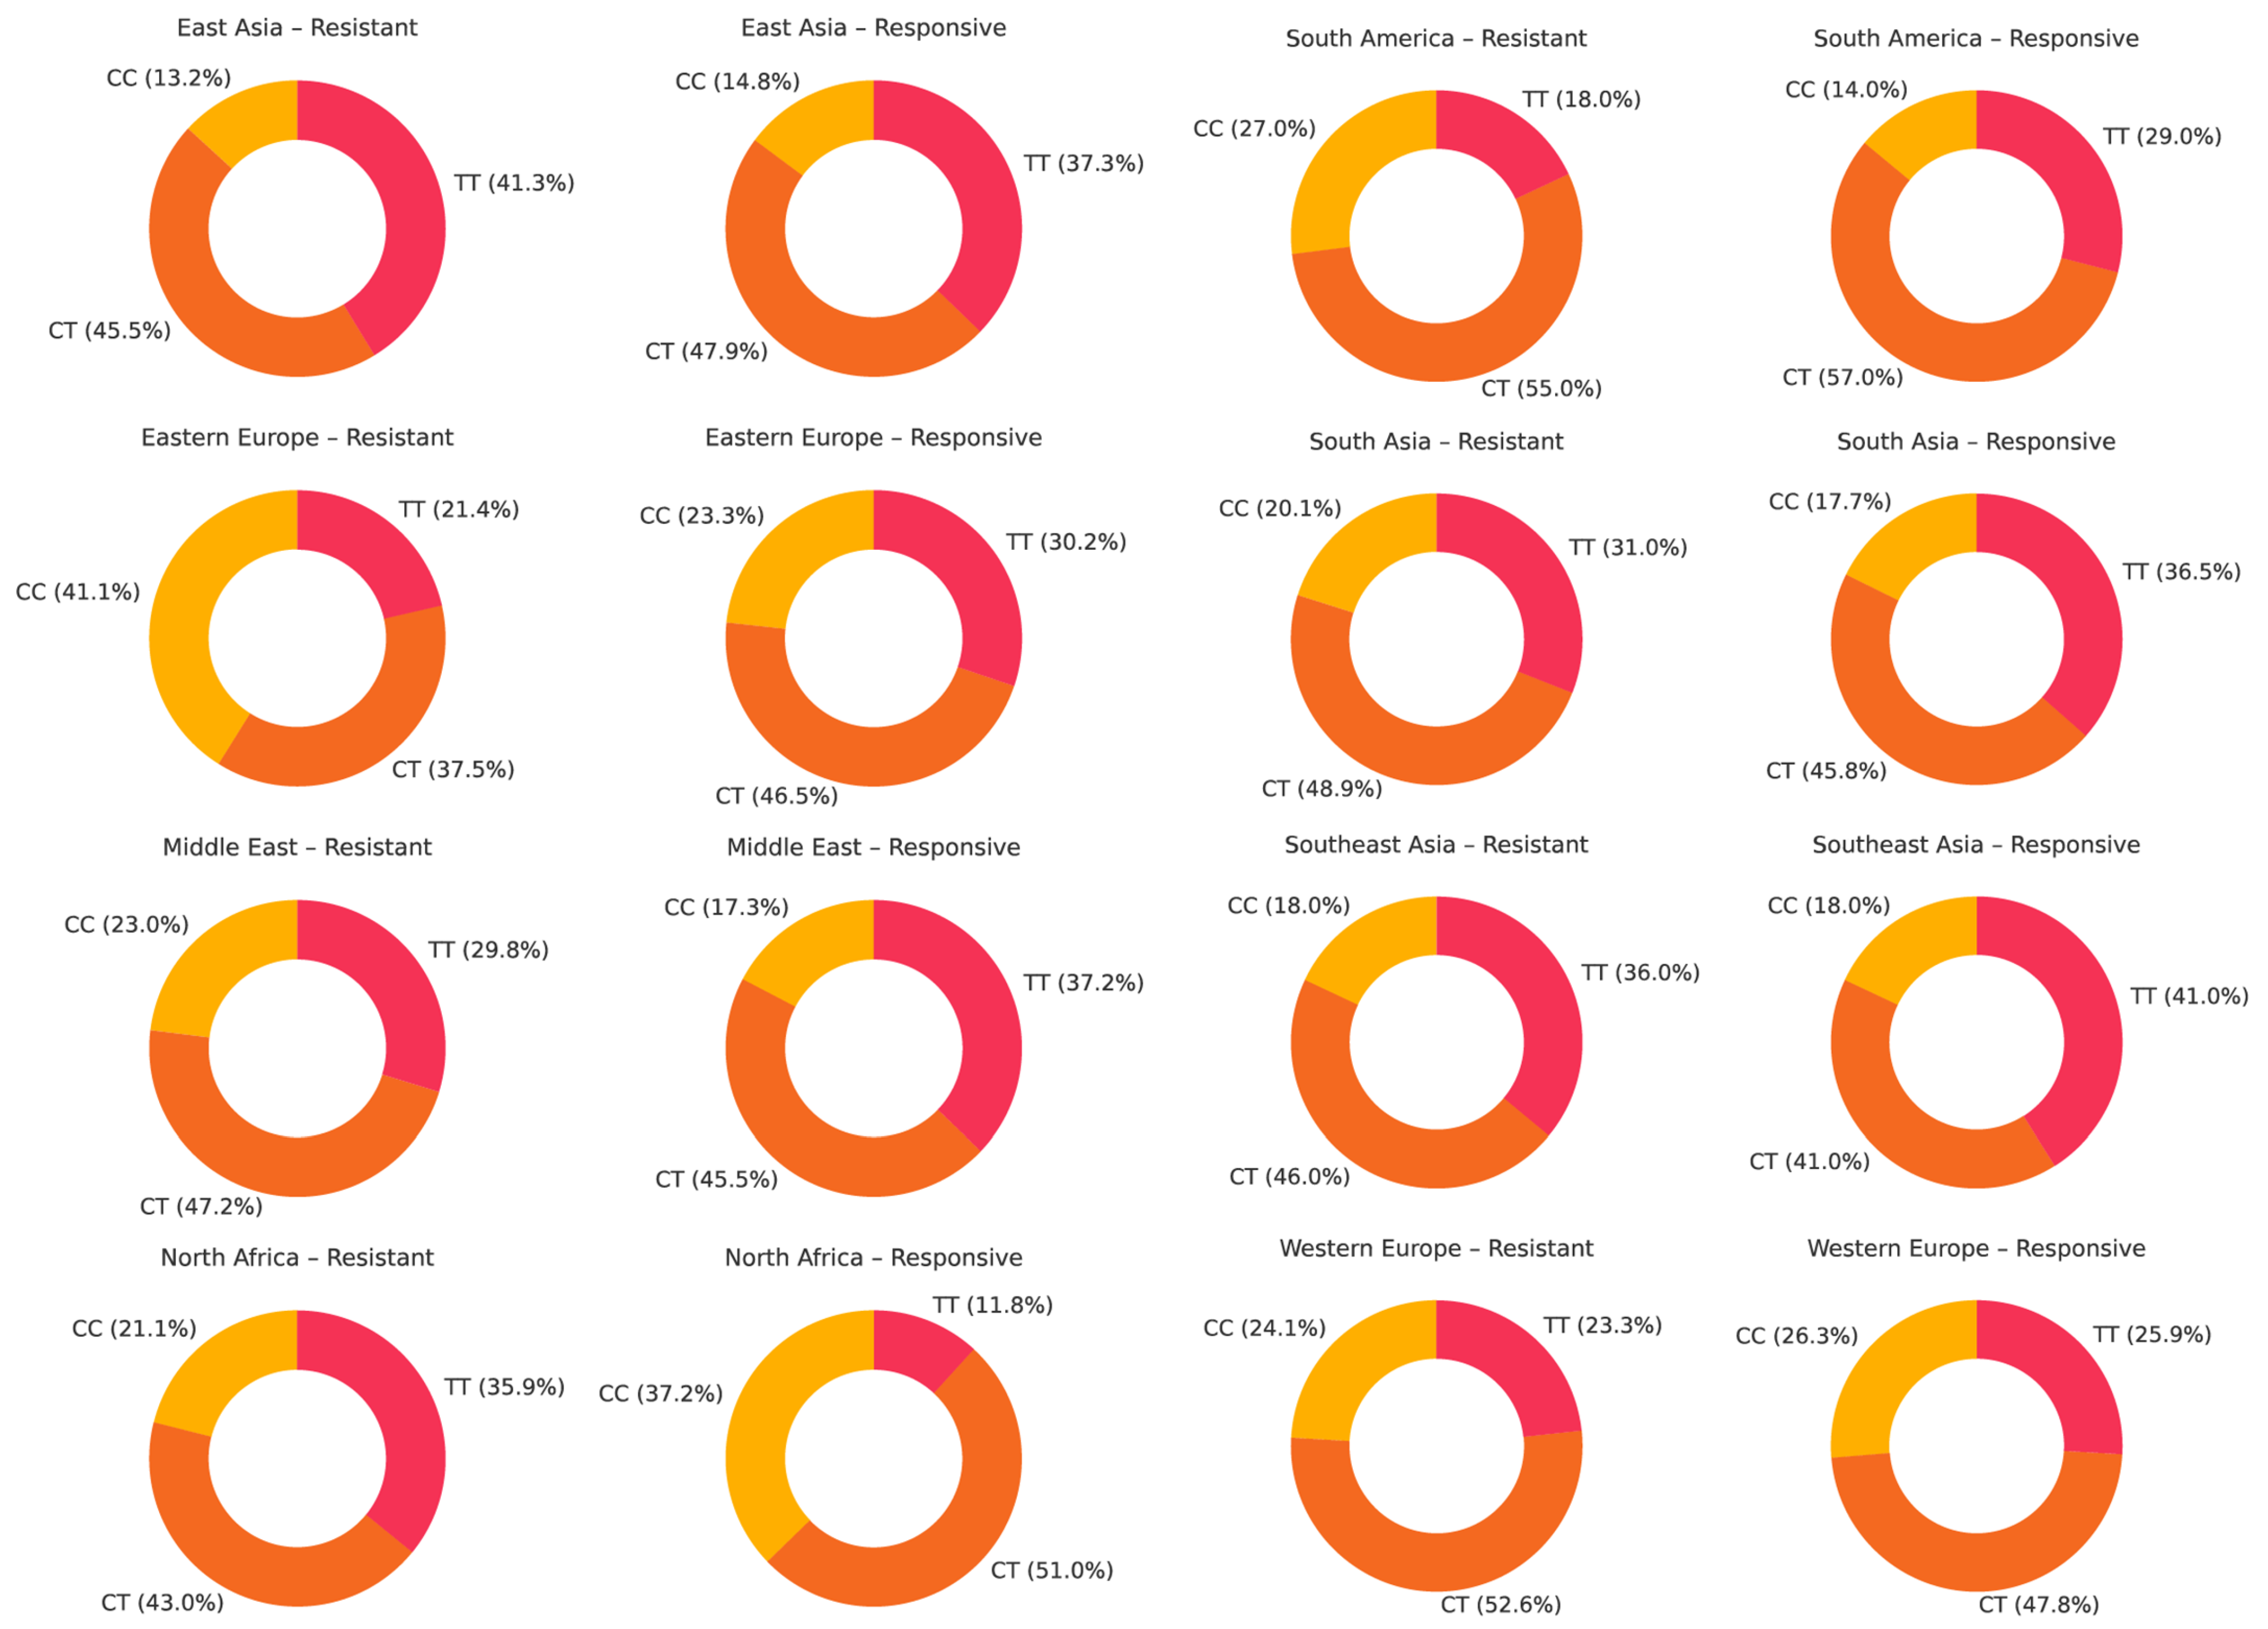
- For rs1045642, a non-significant trend toward a protective effect of the TT genotype was observed. The CT genotype was most prevalent, especially among drug-responsive individuals. For rs2032582, the TT genotype showed a weak tendency toward resistance, but no consistent association was found. GT was the most common genotype, while GG was more frequent in responsive patients in some regions. For rs1128503, no such genotype associations were detected. The TT genotype was slightly more common in drug-resistant groups, and CT remained the most prevalent, particularly in responsive populations.
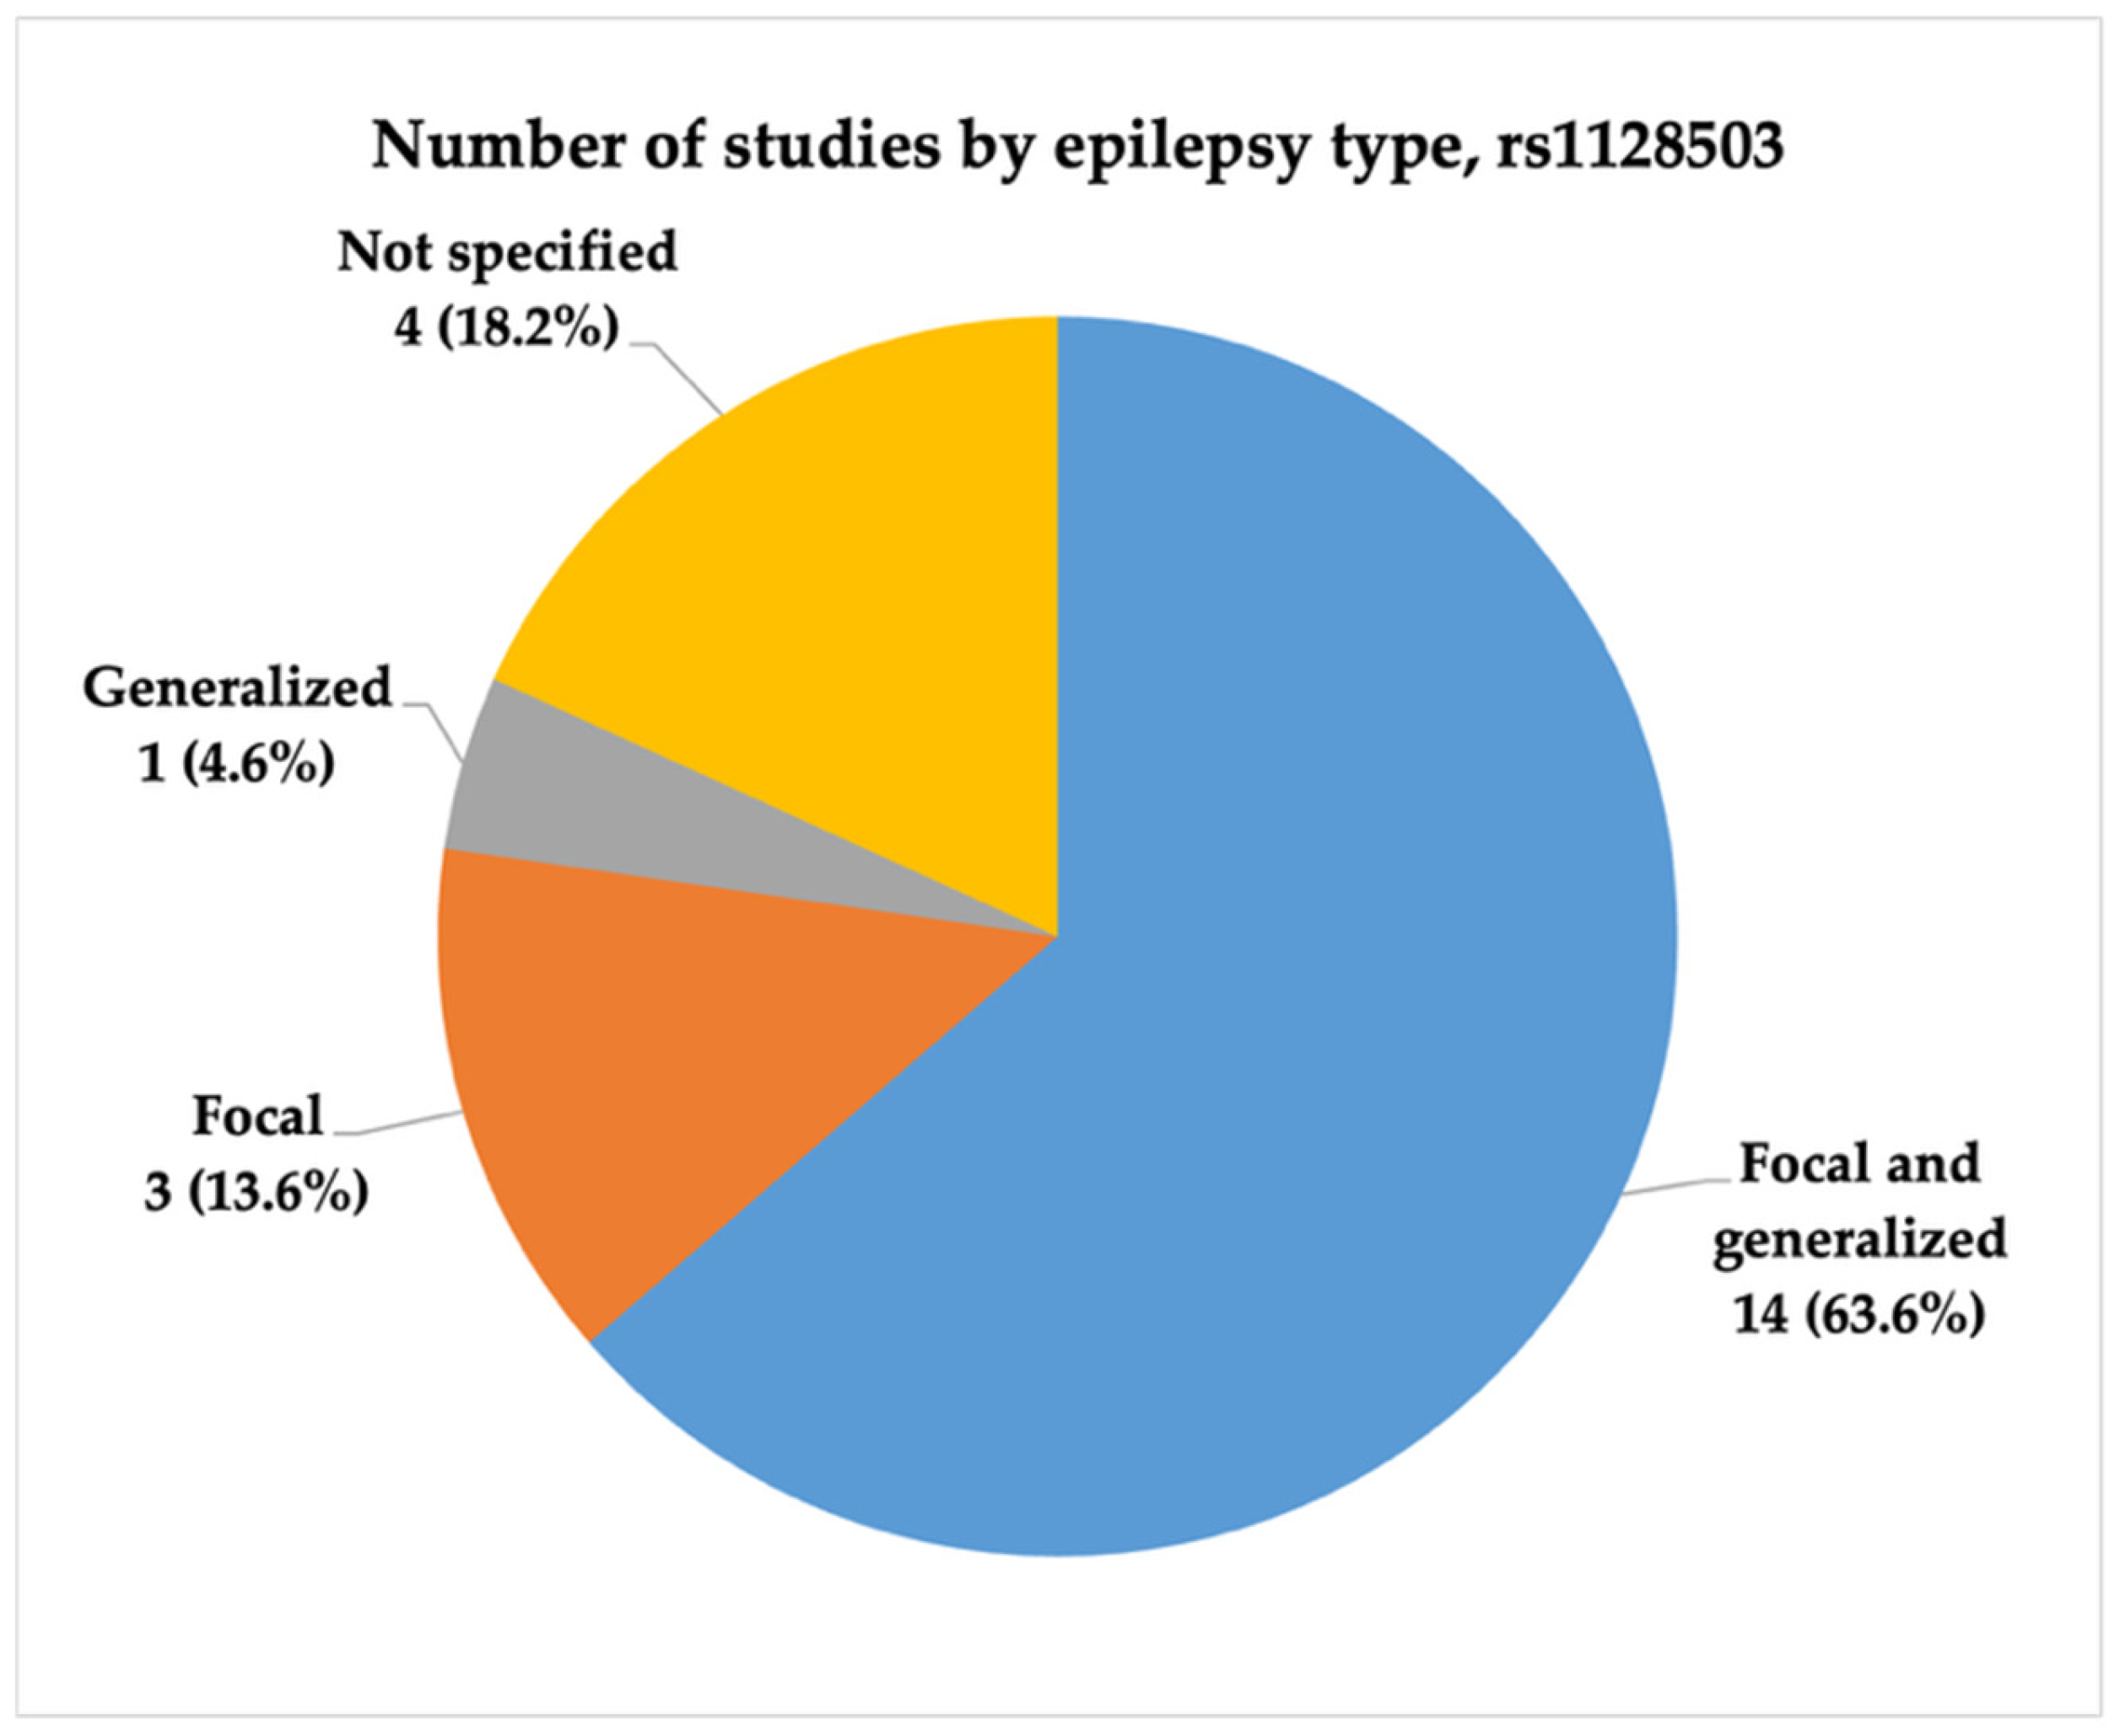
- Future studies investigating the association between ABCB1 polymorphisms and antiseizure medication resistance should consider stratifying drug-resistant epilepsy patients by epilepsy type.
- Since 2015, there has been a decline in studies on the single-nucleotide polymorphisms rs1045642, rs2032582, and rs1128503 in relation to antiseizure medication resistance. Despite the reduced research attention to these SNPs, they still have considerable clinical potential, particularly if investigated through robust, large-scale studies and haplotype analyses, which could be crucial for clarifying their role in ASM resistance.
Author Contributions
Funding
Institutional Review Board Statement
Informed Consent Statement
Data Availability Statement
Conflicts of Interest
References
- Kwan, P.; Arzimanoglou, A.; Berg, A.T.; Brodie, M.J.; Allen Hauser, W.; Mathern, G.; Moshé, S.L.; Perucca, E.; Wiebe, S.; French, J. Definition of Drug Resistant Epilepsy: Consensus Proposal by the Ad Hoc Task Force of the ILAE Commission on Therapeutic Strategies. Epilepsia 2010, 51, 1069–1077. [Google Scholar] [CrossRef] [PubMed]
- Abou-Khalil, B.W. Update on Antiseizure Medications 2022. Contin. Minneap Minn 2022, 28, 500–535. [Google Scholar] [CrossRef] [PubMed]
- Stephen, L.J.; Brodie, M.J. Pharmacotherapy of Epilepsy: Newly Approved and Developmental Agents. CNS Drugs 2011, 25, 89–107. [Google Scholar] [CrossRef] [PubMed]
- Sultana, B.; Panzini, M.-A.; Veilleux Carpentier, A.; Comtois, J.; Rioux, B.; Gore, G.; Bauer, P.R.; Kwon, C.-S.; Jetté, N.; Josephson, C.B.; et al. Incidence and Prevalence of Drug-Resistant Epilepsy: A Systematic Review and Meta-Analysis. Neurology 2021, 96, 805–817. [Google Scholar] [CrossRef]
- Tang, F.; Hartz, A.M.S.; Bauer, B. Drug-Resistant Epilepsy: Multiple Hypotheses, Few Answers. Front. Neurol. 2017, 8, 301. [Google Scholar] [CrossRef]
- Zhang, W.; Oh, J.-H.; Zhang, W.; Rathi, S.; Le, J.; Talele, S.; Sarkaria, J.N.; Elmquist, W.F. How Much Is Enough? Impact of Efflux Transporters on Drug Delivery Leading to Efficacy in the Treatment of Brain Tumors. Pharm. Res. 2023, 40, 2731–2746. [Google Scholar] [CrossRef]
- Leschziner, G.D.; Andrew, T.; Pirmohamed, M.; Johnson, M.R. ABCB1 Genotype and PGP Expression, Function and Therapeutic Drug Response: A Critical Review and Recommendations for Future Research. Pharmacogenom. J. 2007, 7, 154–179. [Google Scholar] [CrossRef]
- PRISMA 2020 Statement. Available online: https://www.prisma-statement.org/prisma-2020-statement (accessed on 25 May 2025).
- Siddiqui, A.; Kerb, R.; Weale, M.E.; Brinkmann, U.; Smith, A.; Goldstein, D.B.; Wood, N.W.; Sisodiya, S.M. Association of Multidrug Resistance in Epilepsy with a Polymorphism in the Drug-Transporter Gene ABCB1. N. Engl. J. Med. 2003, 348, 1442–1448. [Google Scholar] [CrossRef]
- Keangpraphun, T.; Towanabut, S.; Chinvarun, Y.; Kijsanayotin, P. Association of ABCB1 C3435T Polymorphism with Phenobarbital Resistance in Thai Patients with Epilepsy. J. Clin. Pharm. Ther. 2015, 40, 315–319. [Google Scholar] [CrossRef]
- Sayyah, M.; Kamgarpour, F.; Maleki, M.; Karimipoor, M.; Gharagozli, K.; Shamshiri, A.R. Association Analysis of Intractable Epilepsy with C3435T and G2677T/A ABCB1 Gene Polymorphisms in Iranian Patients. Epileptic. Disord. 2011, 13, 155–165. [Google Scholar] [CrossRef]
- Hung, C.-C.; Jen Tai, J.; Kao, P.-J.; Lin, M.-S.; Liou, H.-H. Association of Polymorphisms in NR1I2 and ABCB1 Genes with Epilepsy Treatment Responses. Pharmacogenomics 2007, 8, 1151–1158. [Google Scholar] [CrossRef] [PubMed]
- Maqbool, H.; Saleem, T.; Sheikh, N.; Asmatullah; Mukhtar, M.; Javed, I.; Rehman, A. Polymorphism in Drug Transporter Gene ABCB1 Is Associated with Drug Resistance in Pakistani Epilepsy Patients. Epilepsy Res. 2021, 178, 106814. [Google Scholar] [CrossRef] [PubMed]
- Shen, C.; Zhang, B.; Liu, Z.; Tang, Y.; Zhang, Y.; Wang, S.; Guo, Y.; Ding, Y.; Wang, S.; Ding, M. Effects of ABCB1, ABCC2, UGT2B7 and HNF4α Genetic Polymorphisms on Oxcarbazepine Concentrations and Therapeutic Efficacy in Patients with Epilepsy. Seizure 2017, 51, 102–106. [Google Scholar] [CrossRef] [PubMed]
- Subenthiran, S.; Abdullah, N.R.; Joseph, J.P.; Muniandy, P.K.; Mok, B.T.; Kee, C.C.; Ismail, Z.; Mohamed, Z. Linkage Disequilibrium between Polymorphisms of ABCB1 and ABCC2 to Predict the Treatment Outcome of Malaysians with Complex Partial Seizures on Treatment with Carbamazepine Mono-Therapy at the Kuala Lumpur Hospital. PLoS ONE 2013, 8, e64827. [Google Scholar] [CrossRef]
- Ajmi, M.; Boujaafar, S.; Zouari, N.; Amor, D.; Nasr, A.; Rejeb, N.B.; Amor, S.B.; Omezzine, A.; Benammou, S.; Bouslama, A. Association between ABCB1 Polymorphisms and Response to First-Generation Antiepileptic Drugs in a Tunisian Epileptic Population. Int. J. Neurosci. 2018, 128, 705–714. [Google Scholar] [CrossRef]
- Seo, T.; Ishitsu, T.; Ueda, N.; Nakada, N.; Yurube, K.; Ueda, K.; Nakagawa, K. ABCB1 Polymorphisms Influence the Response to Antiepileptic Drugs in Japanese Epilepsy Patients. Pharmacogenomics 2006, 7, 551–561. [Google Scholar] [CrossRef]
- Kwan, P.; Wong, V.; Ng, P.W.; Lui, C.H.T.; Sin, N.C.; Poon, W.S.; Ng, H.K.; Wong, K.S.; Baum, L. Gene-Wide Tagging Study Of Association Between ABCB1 Polymorphisms and Multidrug Resistance in Epilepsy in Han Chinese. Pharmacogenomics 2009, 10, 723–732. [Google Scholar] [CrossRef]
- Kwan, P.; Baum, L.; Wong, V.; Ng, P.W.; Lui, C.H.; Sin, N.C.; Hui, A.C.F.; Yu, E.; Wong, L.K.S. Association between ABCB1 C3435T Polymorphism and Drug-Resistant Epilepsy in Han Chinese. Epilepsy Behav. 2007, 11, 112–117. [Google Scholar] [CrossRef]
- Buathet, K.; Chinvarun, Y.; Towanabut, S.; Kijsanayotin, P. Association of ABCB1 Polymorphism with Lamotrigine-Resistant Epilepsy in Thais. Thai J. Pharm. Sci. 2013, 37, 146–151. [Google Scholar] [CrossRef]
- Soranzo, N.; Cavalleri, G.L.; Weale, M.E.; Wood, N.W.; Depondt, C.; Marguerie, R.; Sisodiya, S.M.; Goldstein, D.B. Identifying Candidate Causal Variants Responsible for Altered Activity of the ABCB1 Multidrug Resistance Gene. Genome Res. 2004, 14, 1333–1344. [Google Scholar] [CrossRef]
- Sporiš, D.; Bašić, S.; Božina, N.; Babić, T.; Hajnšek, S.; Sertić, J.; Šušak, I.; Marković, I. ABCB1 Gene Variants as Predictors of Multidrug-Resistant Epilepsy in Croatian Population. Neurol Croat 2011, 60, 63–70. [Google Scholar]
- Alpman, A.; Ozkinay, F.; Tekgul, H.; Gokben, S.; Pehlivan, S.; Schalling, M.; Ozkinay, C. Multidrug Resistance 1 (MDR1) Gene Polymorphisms in Childhood Drug-Resistant Epilepsy. J. Child Neurol. 2010, 25, 1485–1490. [Google Scholar] [CrossRef] [PubMed]
- Ks, S.; Fb, H.; Qs, A.-M.; Am, A.-M. Association of ABCB1 Gene Polymorphism (C1236T and C3435T) with Refractory Epilepsy in Iraqi Patients. Mol. Biol. Rep. 2020, 47, 4245–4254. [Google Scholar] [CrossRef]
- Tan, N.C.; Heron, S.E.; Scheffer, I.E.; Pelekanos, J.T.; McMahon, J.M.; Vears, D.F.; Mulley, J.C.; Berkovic, S.F. Failure to confirm association of a polymorphism in ABCB1 with multidrug-resistant epilepsy. Neurology 2004, 63, 1090–1092. [Google Scholar] [CrossRef]
- Szoeke, C.; Sills, G.J.; Kwan, P.; Petrovski, S.; Newton, M.; Hitiris, N.; Baum, L.; Berkovic, S.F.; Brodie, M.J.; Sheffield, L.J.; et al. Multidrug-Resistant Genotype (ABCB1) and Seizure Recurrence in Newly Treated Epilepsy: Data from International Pharmacogenetic Cohorts. Epilepsia 2009, 50, 1689–1696. [Google Scholar] [CrossRef]
- Lakhan, R.; Misra, U.K.; Kalita, J.; Pradhan, S.; Gogtay, N.J.; Singh, M.K.; Mittal, B. No Association of ABCB1 Polymorphisms with Drug-Refractory Epilepsy in a North Indian Population. Epilepsy Behav. 2009, 14, 78–82. [Google Scholar] [CrossRef]
- Haerian, B.S.; Lim, K.S.; Mohamed, E.H.M.; Tan, H.J.; Tan, C.T.; Raymond, A.A.; Wong, C.P.; Wong, S.W.; Mohamed, Z. Lack of Association of ABCB1 and PXR Polymorphisms with Response to Treatment in Epilepsy. Seizure Eur. J. Epilepsy 2011, 20, 387–394. [Google Scholar] [CrossRef]
- Vahab, S.A.; Sen, S.; Ravindran, N.; Mony, S.; Mathew, A.; Vijayan, N.; Nayak, G.; Bhaskaranand, N.; Banerjee, M.; Satyamoorthy, K. Analysis of Genotype and Haplotype Effects of ABCB1 (MDR1) Polymorphisms in the Risk of Medically Refractory Epilepsy in an Indian Population. Drug Metab. Pharmacokinet. 2009, 24, 255–260. [Google Scholar] [CrossRef]
- Grover, S.; Bala, K.; Sharma, S.; Gourie-Devi, M.; Baghel, R.; Kaur, H.; Gupta, M.; Talwar, P.; Kukreti, R. Absence of a General Association between ABCB1 Genetic Variants and Response to Antiepileptic Drugs in Epilepsy Patients. Biochimie 2010, 92, 1207–1212. [Google Scholar] [CrossRef]
- Meng, H.; Guo, G.; Ren, J.; Zhou, H.; Ge, Y.; Guo, Y. Effects of ABCB1 Polymorphisms on Plasma Carbamazepine Concentrations and Pharmacoresistance in Chinese Patients with Epilepsy. Epilepsy Behav. 2011, 21, 27–30. [Google Scholar] [CrossRef]
- Emich-Widera, E.; Likus, W.; Kazek, B.; Sieroń, A.L.; Urbanek, K. Polymorphism of ABCB1/MDR1 C3435T in Children and Adolescents with Partial Epilepsy Is Due to Different Criteria for Drug Resistance—Preliminary Results. Med. Sci. Monit. Int. Med. J. Exp. Clin. Res. 2014, 20, 1654–1661. [Google Scholar] [CrossRef]
- Zhao, T.; Yu, J.; Wang, T.-T.; Feng, J.; Zhao, W.-B.; Sun, L.; Yu, L.-H.; Li, H.-J.; Sun, Y. Impact of ABCB1 Polymorphism on Levetiracetam Serum Concentrations in Epileptic Uygur Children in China. Ther. Drug Monit. 2020, 42, 886–892. [Google Scholar] [CrossRef]
- Tang, H.X.; Ho, M.D.; Vu, N.P.; Cao, H.V.; Ngo, V.A.; Nguyen, V.T.; Nguyen, T.D.; Nguyen, T.D. Association between Genetic Polymorphism of SCN1A, GABRA1 and ABCB1 and Drug Responsiveness in Vietnamese Epileptic Children. Med. Kaunas Lith. 2024, 60, 637. [Google Scholar] [CrossRef]
- Sánchez, M.B.; Herranz, J.L.; Leno, C.; Arteaga, R.; Oterino, A.; Valdizán, E.M.; Nicolás, J.M.; Adín, J.; Armijo, J.A. Genetic Factors Associated with Drug-Resistance of Epilepsy: Relevance of Stratification by Patient Age and Aetiology of Epilepsy. Seizure 2010, 19, 93–101. [Google Scholar] [CrossRef]
- Emich-Widera, E.; Likus, W.; Kazek, B.; Niemiec, P.; Balcerzyk, A.; Sieroń, A.L.; Żak, I. CYP3A5*3 and C3435T MDR1 Polymorphisms in Prognostication of Drug-Resistant Epilepsy in Children and Adolescents. BioMed Res. Int. 2013, 2013, 526837. [Google Scholar] [CrossRef]
- Zhou, L.; Cao, Y.; Long, H.; Long, L.; Xu, L.; Liu, Z.; Zhang, Y.; Xiao, B. ABCB1, ABCC2, SCN1A, SCN2A, GABRA1 Gene Polymorphisms and Drug Resistant Epilepsy in the Chinese Han Population. Pharmazie 2015, 70, 416–420. [Google Scholar] [CrossRef]
- Tamimi, D.E.; Abduljabbar, R.; Yousef, A.-M.; Saeed, R.M.; Zawiah, M. Association between ABCB1 Polymorphisms and Response to Antiepileptic Drugs among Jordanian Epileptic Patients. Neurol. Res. 2021, 43, 724–735. [Google Scholar] [CrossRef]
- Elmagid, D.S.A.; Abdelsalam, M.; Magdy, H.; Tharwat, N. The Association between MDR1 C3435T Genetic Polymorphism and the Risk of Multidrug-Resistant Epilepsy in Egyptian Children. Egypt. J. Med. Hum. Genet. 2021, 22, 31. [Google Scholar] [CrossRef]
- Ufer, M.; Mosyagin, I.; Muhle, H.; Jacobsen, T.; Haenisch, S.; Häsler, R.; Faltraco, F.; Remmler, C.; Von Spiczak, S.; Kroemer, H.K.; et al. Non-Response to Antiepileptic Pharmacotherapy Is Associated with the ABCC2 −24C>T Polymorphism in Young and Adult Patients with Epilepsy. Pharmacogenet. Genom. 2009, 19, 353–362. [Google Scholar] [CrossRef]
- Dong, L.; Luo, R.; Tong, Y.; Cai, X.; Mao, M.; Yu, D. Lack of Association between ABCB1 Gene Polymorphisms and Pharmacoresistant Epilepsy: An Analysis in a Western Chinese Pediatric Population. Brain Res. 2011, 1391, 114–124. [Google Scholar] [CrossRef]
- Sterjev, Z.; Trencevska, G.K.; Cvetkovska, E.; Petrov, I.; Kuzmanovski, I.; Ribarska, J.T.; Nestorovska, A.K.; Matevska, N.; Naumovska, Z.; Jolevska-Trajkovic, S.; et al. The Association of C3435T Single-Nucleotide Polymorphism, Pgp-Glycoprotein Gene Expression Levels and Carbamazepine Maintenance Dose in Patients with Epilepsy. Neuropsychiatr. Dis. Treat. 2012, 8, 191–196. [Google Scholar] [CrossRef] [PubMed][Green Version]
- Xue, T.; Lu, Z.N. Association between the Polymorphisms in the ATP-Binding Cassette Genes ABCB1 and ABCC2 and the Risk of Drug-Resistant Epilepsy in a Chinese Han Population. Genet. Mol. Res. GMR 2016, 15, 1–9. [Google Scholar] [CrossRef] [PubMed]
- Sills, G.J.; Mohanraj, R.; Butler, E.; McCrindle, S.; Collier, L.; Wilson, E.A.; Brodie, M.J. Lack of Association between the C3435T Polymorphism in the Human Multidrug Resistance (MDR1) Gene and Response to Antiepileptic Drug Treatment. Epilepsia 2005, 46, 643–647. [Google Scholar] [CrossRef] [PubMed]
- Kim, Y.O.; Kim, M.K.; Woo, Y.J.; Lee, M.C.; Kim, J.H.; Park, K.W.; Kim, E.Y.; Roh, Y.I.; Kim, C.J. Single Nucleotide Polymorphisms in the Multidrug Resistance 1 Gene in Korean Epileptics. Seizure 2006, 15, 67–72. [Google Scholar] [CrossRef]
- Ozgon, G.O.; Bebek, N.; Gul, G.; Cine, N. Association of MDR1 (C3435T) Polymorphism and Resistance to Carbamazepine in Epileptic Patients from Turkey. Eur. Neurol. 2008, 59, 67–70. [Google Scholar] [CrossRef]
- Qu, J.; Zhou, B.; Yin, J.; Xu, X.; Zhao, Y.; Lei, G.; Tang, Q.; Zhou, H.; Liu, Z. ABCC2 Polymorphisms and Haplotype Are Associated with Drug Resistance in Chinese Epileptic Patients. CNS Neurosci. Ther. 2012, 18, 647–651. [Google Scholar] [CrossRef]
- Escalante-Santiago, D.; Feria-Romero, I.A.; Ribas-Aparicio, R.M.; Rayo-Mares, D.; Fagiolino, P.; Vázquez, M.; Escamilla-Núñez, C.; Grijalva-Otero, I.; López-García, M.A.; Orozco-Suárez, S. MDR-1 and MRP2 Gene Polymorphisms in Mexican Epileptic Pediatric Patients with Complex Partial Seizures. Front. Neurol. 2014, 5, 184. [Google Scholar] [CrossRef]
- Seven, M.; Batar, B.; Unal, S.; Yesil, G.; Yuksel, A.; Guven, M. The Drug-Transporter Gene MDR1 C3435T and G2677T/A Polymorphisms and the Risk of Multidrug-Resistant Epilepsy in Turkish Children. Mol. Biol. Rep. 2014, 41, 331–336. [Google Scholar] [CrossRef]
- Balan, S.; Bharathan, S.P.; Vellichiramal, N.N.; Sathyan, S.; Joseph, V.; Radhakrishnan, K.; Banerjee, M. Genetic Association Analysis of ATP Binding Cassette Protein Family Reveals a Novel Association of ABCB1 Genetic Variants with Epilepsy Risk, but Not with Drug-Resistance. PLoS ONE 2014, 9, e89253. [Google Scholar] [CrossRef]
- Daci, A.; Beretta, G.; Vllasaliu, D.; Shala, A.; Govori, V.; Norata, G.D.; Krasniqi, S. Polymorphic Variants of SCN1A and EPHX1 Influence Plasma Carbamazepine Concentration, Metabolism and Pharmacoresistance in a Population of Kosovar Albanian Epileptic Patients. PLoS ONE 2015, 10, e0142408. [Google Scholar] [CrossRef]
- Manna, I.; Gambardella, A.; Labate, A.; Mumoli, L.; Ferlazzo, E.; Pucci, F.; Aguglia, U.; Quattrone, A. Polymorphism of the Multidrug Resistance 1 Gene MDR1/ABCB1 C3435T and Response to Antiepileptic Drug Treatment in Temporal Lobe Epilepsy. Seizure Eur. J. Epilepsy 2015, 24, 124–126. [Google Scholar] [CrossRef] [PubMed]
- Dhivya, E.; Kesavan, R.; Pradeep, N.P. Impact of ABCB1 Genetic Polymorphism on Carbamazepine Dose Requirement among Southern Indian Persons with Epilepsy. Drug Metab. Pers. Ther. 2024, 39, 27–34. [Google Scholar] [CrossRef] [PubMed]
- Subenthiran, S.; Abdullah, N.R.; Muniandy, P.K.; Joseph, J.P.; Cheong, K.C.; Ismail, Z.; Mohamed, Z. G2677T Polymorphism Can Predict Treatment Outcome of Malaysians with Complex Partial Seizures Being Treated with Carbamazepine. Genet. Mol. Res. 2013, 12, 5937–5944. [Google Scholar] [CrossRef] [PubMed]
- Kumari, R.; Lakhan, R.; Garg, R.K.; Kalita, J.; Misra, U.K.; Mittal, B. Pharmacogenomic Association Study on the Role of Drug Metabolizing, Drug Transporters and Drug Target Gene Polymorphisms in Drug-Resistant Epilepsy in a North Indian Population. Indian J. Hum. Genet. 2011, 17, S32–S40. [Google Scholar] [CrossRef]
- Smolarz, B.; Skalski, D.; Rysz, A.; Marchel, A.; Romanowicz, H.; Makowska, M. Polymorphism of the Multidrug Resistance 1 Gene MDR1 G2677T/A (Rs2032582) and the Risk of Drug-Resistant Epilepsy in the Polish Adult Population. Acta Neurol. Belg. 2017, 117, 849–855. [Google Scholar] [CrossRef]
- Attia, Z.R.; Labib, M.E.; Kelany, A.K.; Alnefaie, R.M.; Twab, H.A.; Wahsh, E.; Abd El Azeem, R.A.; Shaaban, E.I.A.; Elsaid, A.M.; Alalawy, A.I.; et al. Pharmacogenetic Insights into ABCB1, ABCC2, CYP1A2, and CYP2B6 Variants with Epilepsy Susceptibility among Egyptian Children: A Retrospective Case-Control Study. Int. Immunopharmacol. 2024, 142, 113073. [Google Scholar] [CrossRef]
- Maleki, M.; Sayyah, M.; Kamgarpour, F.; Karimipoor, M.; Arab, A.; Rajabi, A.; Gharagozli, K.; Shamshiri, A.R.; Ananloo, E.S. Association between ABCB1-T1236C Polymorphism and Drug- Resistant Epilepsy in Iranian Female Patients. Iran. Biomed. J. 2010, 14, 89–96. [Google Scholar]
- Zhu, J.; Lu, J.; He, Y.; Shen, X.; Xia, H.; Li, W.; Zhang, J.; Fan, X. Association of ABCB1 Polymorphisms with Efficacy and Adverse Drug Reactions of Valproic Acid in Children with Epilepsy. Pharmaceuticals 2023, 16, 1536. [Google Scholar] [CrossRef]
- Vasiliou, V.; Vasiliou, K.; Nebert, D.W. Human ATP-Binding Cassette (ABC) Transporter Family. Hum. Genom. 2009, 3, 281–290. [Google Scholar] [CrossRef]
- Dean, M.; Hamon, Y.; Chimini, G. The Human ATP-Binding Cassette (ABC) Transporter Superfamily. J. Lipid Res. 2001, 42, 1007–1017. [Google Scholar] [CrossRef]
- Bodor, M.; Kelly, E.J.; Ho, R.J. Characterization of the Human MDR1 Gene. AAPS J. 2005, 7, E1-5. [Google Scholar] [CrossRef] [PubMed]
- Juliano, R.L.; Ling, V. A Surface Glycoprotein Modulating Drug Permeability in Chinese Hamster Ovary Cell Mutants. Biochim. Biophys. Acta 1976, 455, 152–162. [Google Scholar] [CrossRef] [PubMed]
- Fung, K.L.; Gottesman, M.M. A Synonymous Polymorphism in a Common MDR1 (ABCB1) Haplotype Shapes Protein Function. Biochim. Biophys. Acta 2009, 1794, 860–871. [Google Scholar] [CrossRef] [PubMed]
- Higgins, C.F. Multiple Molecular Mechanisms for Multidrug Resistance Transporters. Nature 2007, 446, 749–757. [Google Scholar] [CrossRef]
- Hodges, L.M.; Markova, S.M.; Chinn, L.W.; Gow, J.M.; Kroetz, D.L.; Klein, T.E.; Altman, R.B. Very Important Pharmacogene Summary: ABCB1 (MDR1, P-Glycoprotein). Pharmacogenet. Genom. 2011, 21, 152–161. [Google Scholar] [CrossRef]
- Aller, S.G.; Yu, J.; Ward, A.; Weng, Y.; Chittaboina, S.; Zhuo, R.; Harrell, P.M.; Trinh, Y.T.; Zhang, Q.; Urbatsch, I.L.; et al. Structure of P-Glycoprotein Reveals a Molecular Basis for Poly-Specific Drug Binding. Science 2009, 323, 1718–1722. [Google Scholar] [CrossRef]
- Sisodiya, S.M.; Martinian, L.; Scheffer, G.L.; Van Der Valk, P.; Scheper, R.J.; Harding, B.N.; Thom, M. Vascular Colocalization of P-Glycoprotein, Multidrug-Resistance Associated Protein 1, Breast Cancer Resistance Protein and Major Vault Protein in Human Epileptogenic Pathologies. Neuropathol. Appl. Neurobiol. 2006, 32, 51–63. [Google Scholar] [CrossRef]
- Ahmed Juvale, I.I.; Abdul Hamid, A.A.; Abd Halim, K.B.; Che Has, A.T. P-Glycoprotein: New Insights into Structure, Physiological Function, Regulation and Alterations in Disease. Heliyon 2022, 8, e09777. [Google Scholar] [CrossRef]
- Smolarz, B.; Makowska, M.; Romanowicz, H. Pharmacogenetics of Drug-Resistant Epilepsy (Review of Literature). Int. J. Mol. Sci. 2021, 22, 11696. [Google Scholar] [CrossRef]
- Fromm, M.F. Importance of P-Glycoprotein at Blood–Tissue Barriers. Trends Pharmacol. Sci. 2004, 25, 423–429. [Google Scholar] [CrossRef]
- Löscher, W.; Potschka, H. Role of Multidrug Transporters in Pharmacoresistance to Antiepileptic Drugs. J. Pharmacol. Exp. Ther. 2002, 301, 7–14. [Google Scholar] [CrossRef] [PubMed]
- Tishler, D.M.; Weinberg, K.I.; Hinton, D.R.; Barbaro, N.; Annett, G.M.; Raffel, C. MDR1 Gene Expression in Brain of Patients with Medically Intractable Epilepsy. Epilepsia 1995, 36, 1–6. [Google Scholar] [CrossRef] [PubMed]
- Boughrara, W.; Chentouf, A. The ABCB1, ABCC2 and RALBP1 Polymorphisms Are Associated with Carbamazepine Response in Epileptic Patient: A Systematic Review. Acta Neurol. Belg. 2022, 122, 871–880. [Google Scholar] [CrossRef]
- Sisodiya, S.M.; Lin, W.-R.; Harding, B.N.; Squier, M.V.; Thom, M. Drug Resistance in Epilepsy: Expression of Drug Resistance Proteins in Common Causes of Refractory Epilepsy. Brain 2002, 125, 22–31. [Google Scholar] [CrossRef]
- Czornyj, L.; Auzmendi, J.; Lazarowski, A. Transporter Hypothesis in Pharmacoresistant Epilepsies. Is It at the Central or Peripheral Level? Epilepsia Open 2022, 7, 85–107. [Google Scholar] [CrossRef]
- Kimchi-Sarfaty, C.; Oh, J.M.; Kim, I.-W.; Sauna, Z.E.; Calcagno, A.M.; Ambudkar, S.V.; Gottesman, M.M. A “Silent” Polymorphism in the MDR1 Gene Changes Substrate Specificity. Science 2007, 315, 525–528. [Google Scholar] [CrossRef]
- Zhou, Y.; Gottesman, M.M.; Pastan, I. The Extracellular Loop between TM5 and TM6 of P-Glycoprotein Is Required for Reactivity with Monoclonal Antibody UIC2. Arch. Biochem. Biophys. 1999, 367, 74–80. [Google Scholar] [CrossRef]
- Hung, C.-C.; Tai, J.J.; Lin, C.-J.; Lee, M.-J.; Liou, H.-H. Complex Haplotypic Effects of the ABCB1 Gene on Epilepsy Treatment Response. Pharmacogenomics 2005, 6, 411–417. [Google Scholar] [CrossRef]
- Zimprich, F.; Sunder-Plassmann, R.; Stogmann, E.; Gleiss, A.; Dal-Bianco, A.; Zimprich, A.; Plumer, S.; Baumgartner, C.; Mannhalter, C. Association of an ABCB1 Gene Haplotype with Pharmacoresistance in Temporal Lobe Epilepsy. Neurology 2004, 63, 1087–1089. [Google Scholar] [CrossRef]
- Andrade, C. The P Value and Statistical Significance: Misunderstandings, Explanations, Challenges, and Alternatives. Indian J. Psychol. Med. 2019, 41, 210–215. [Google Scholar] [CrossRef]

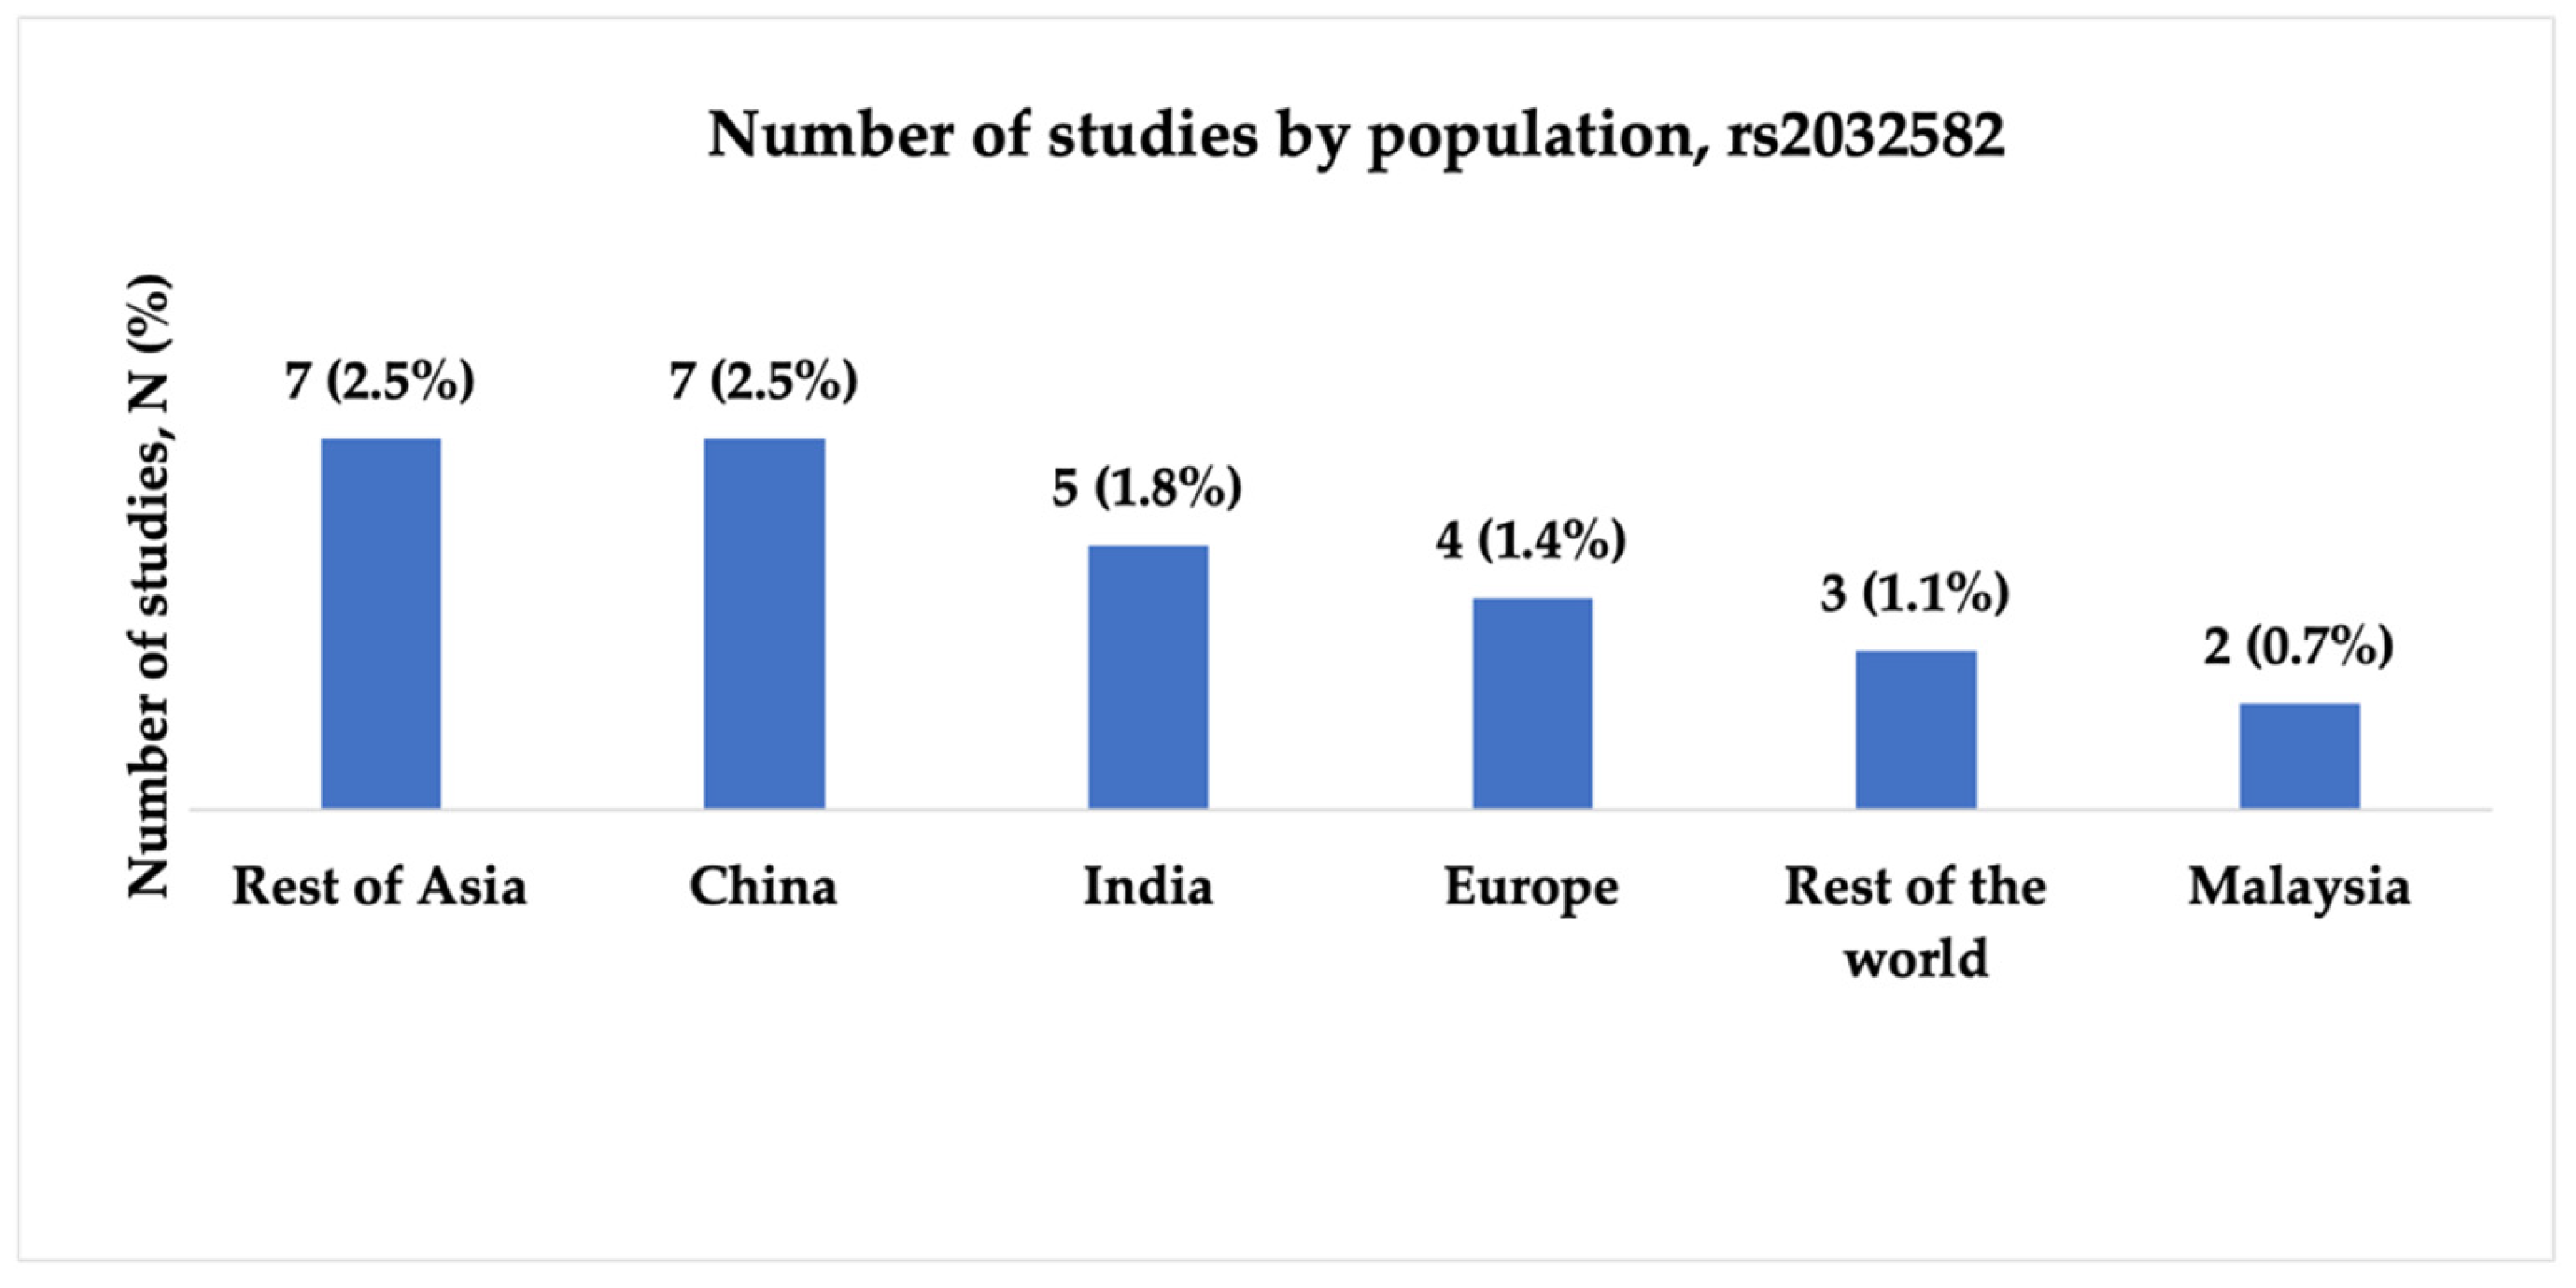
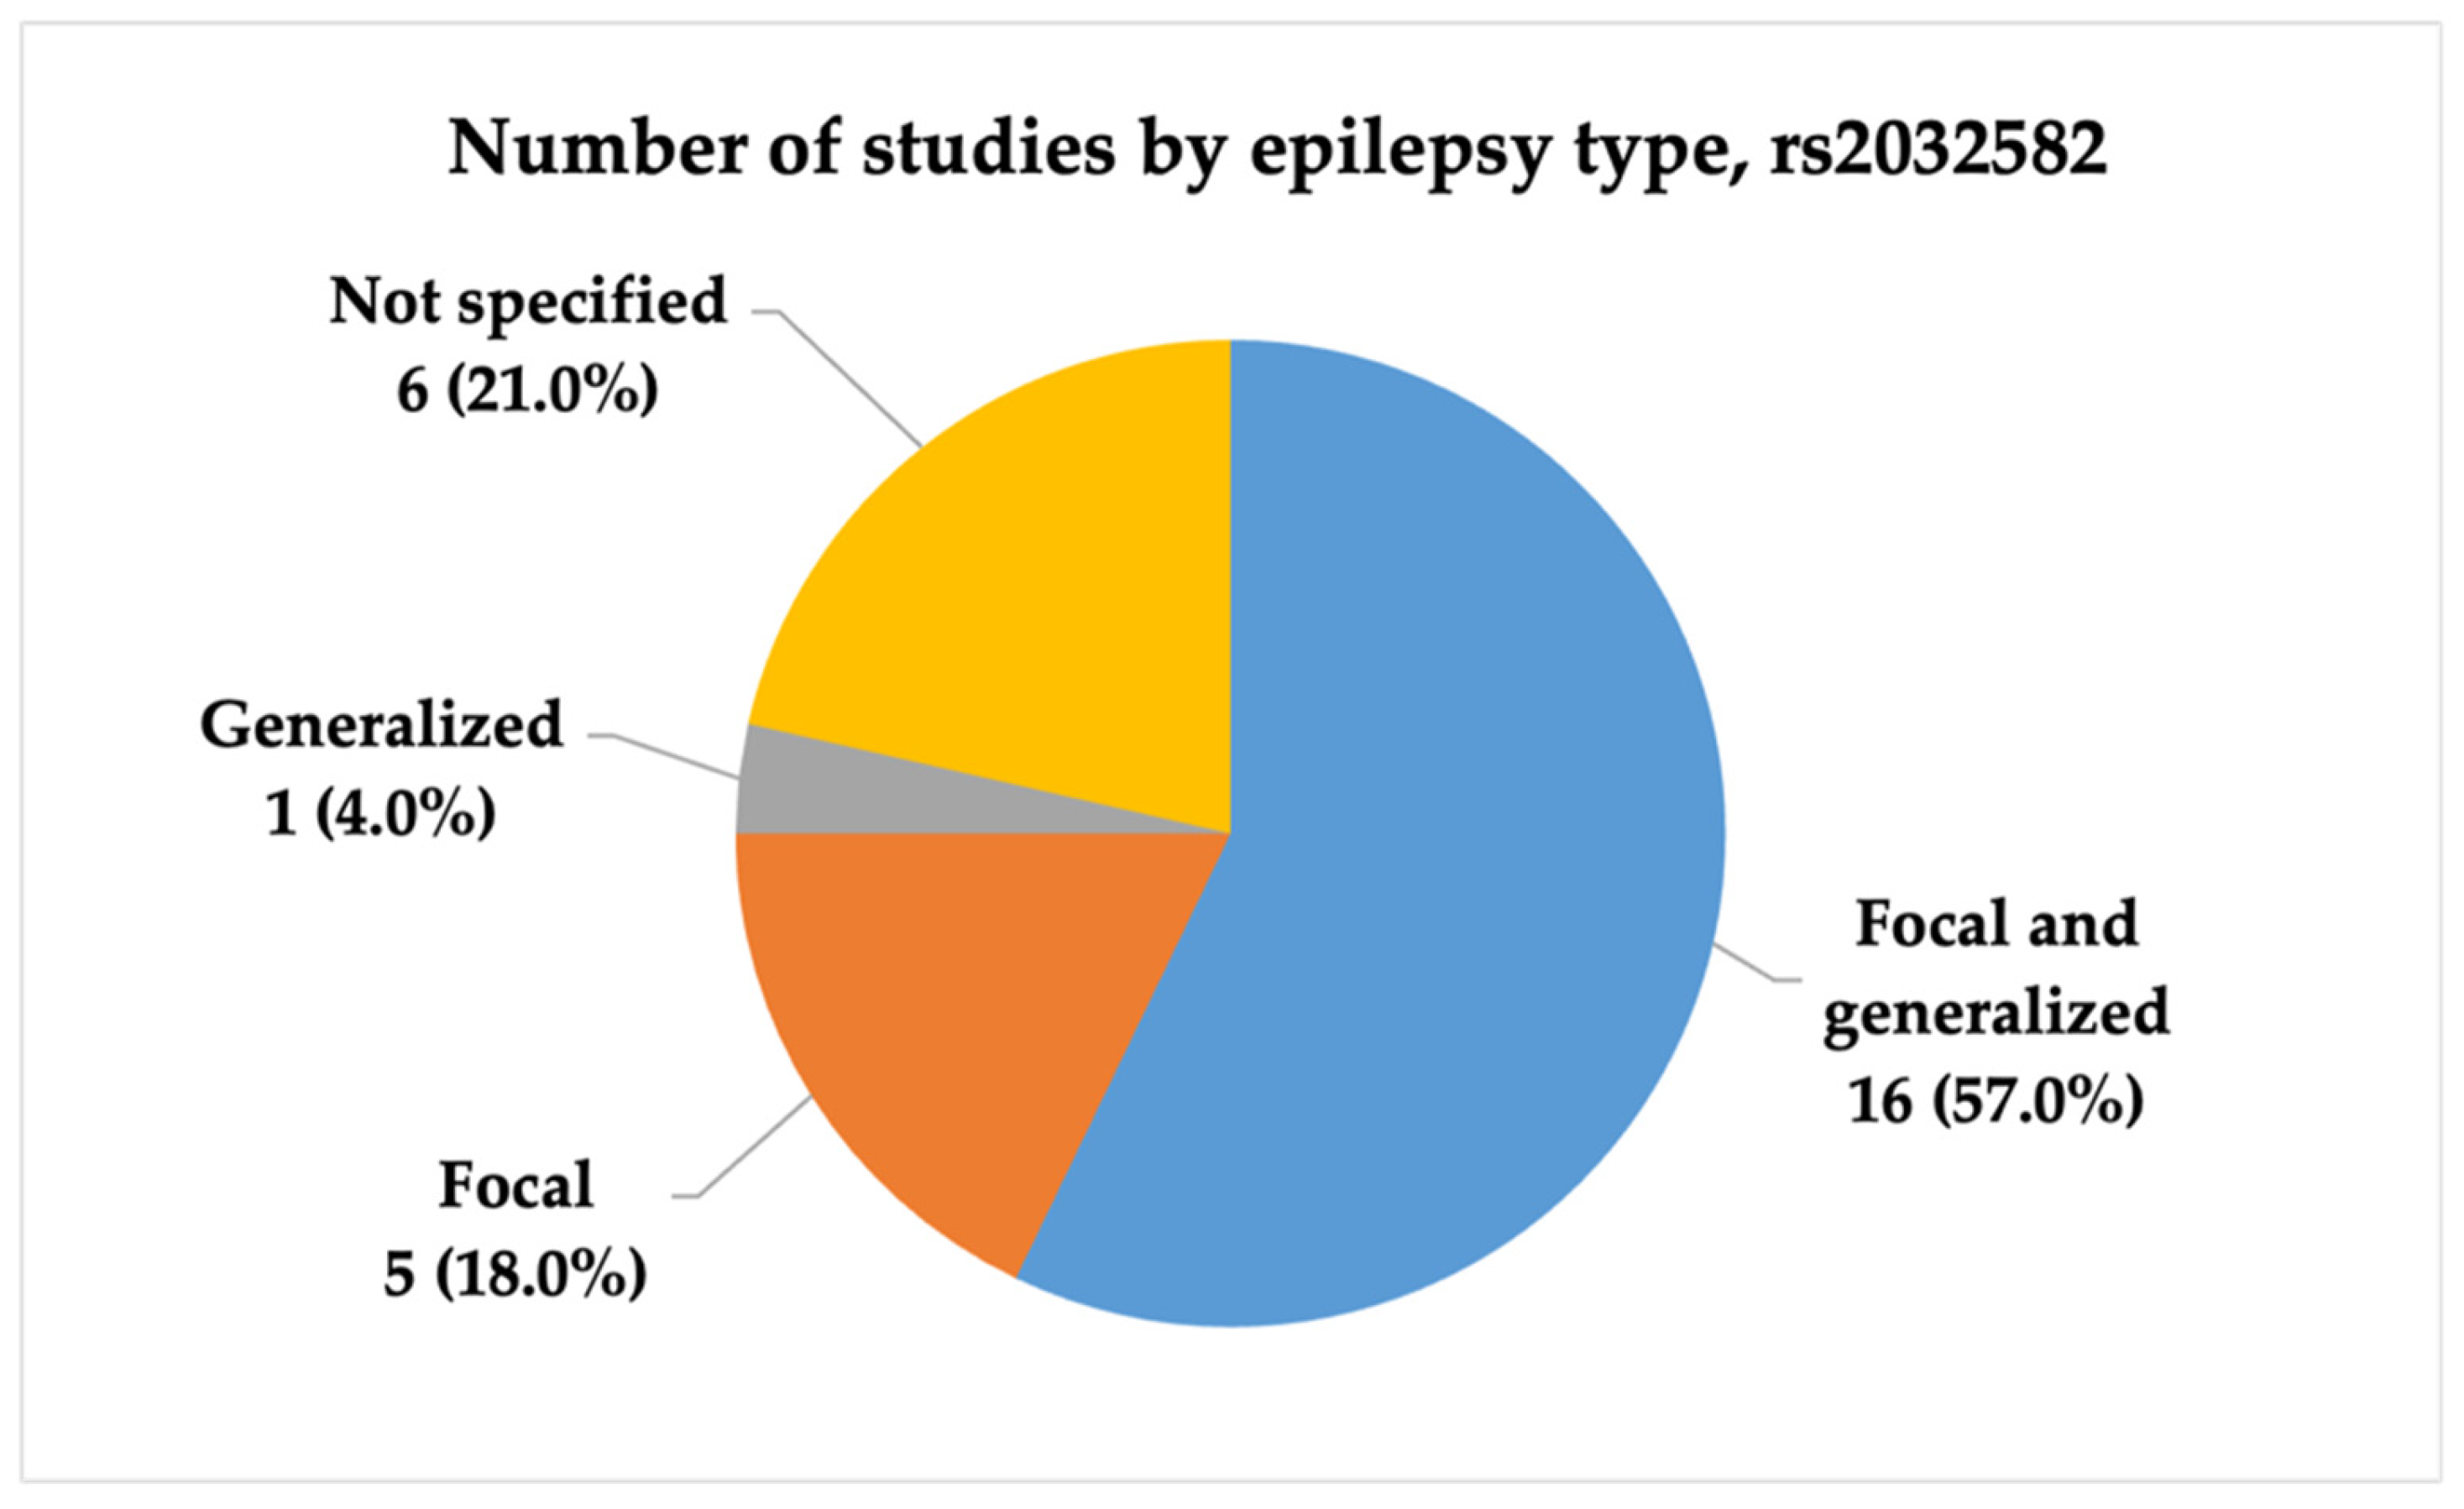
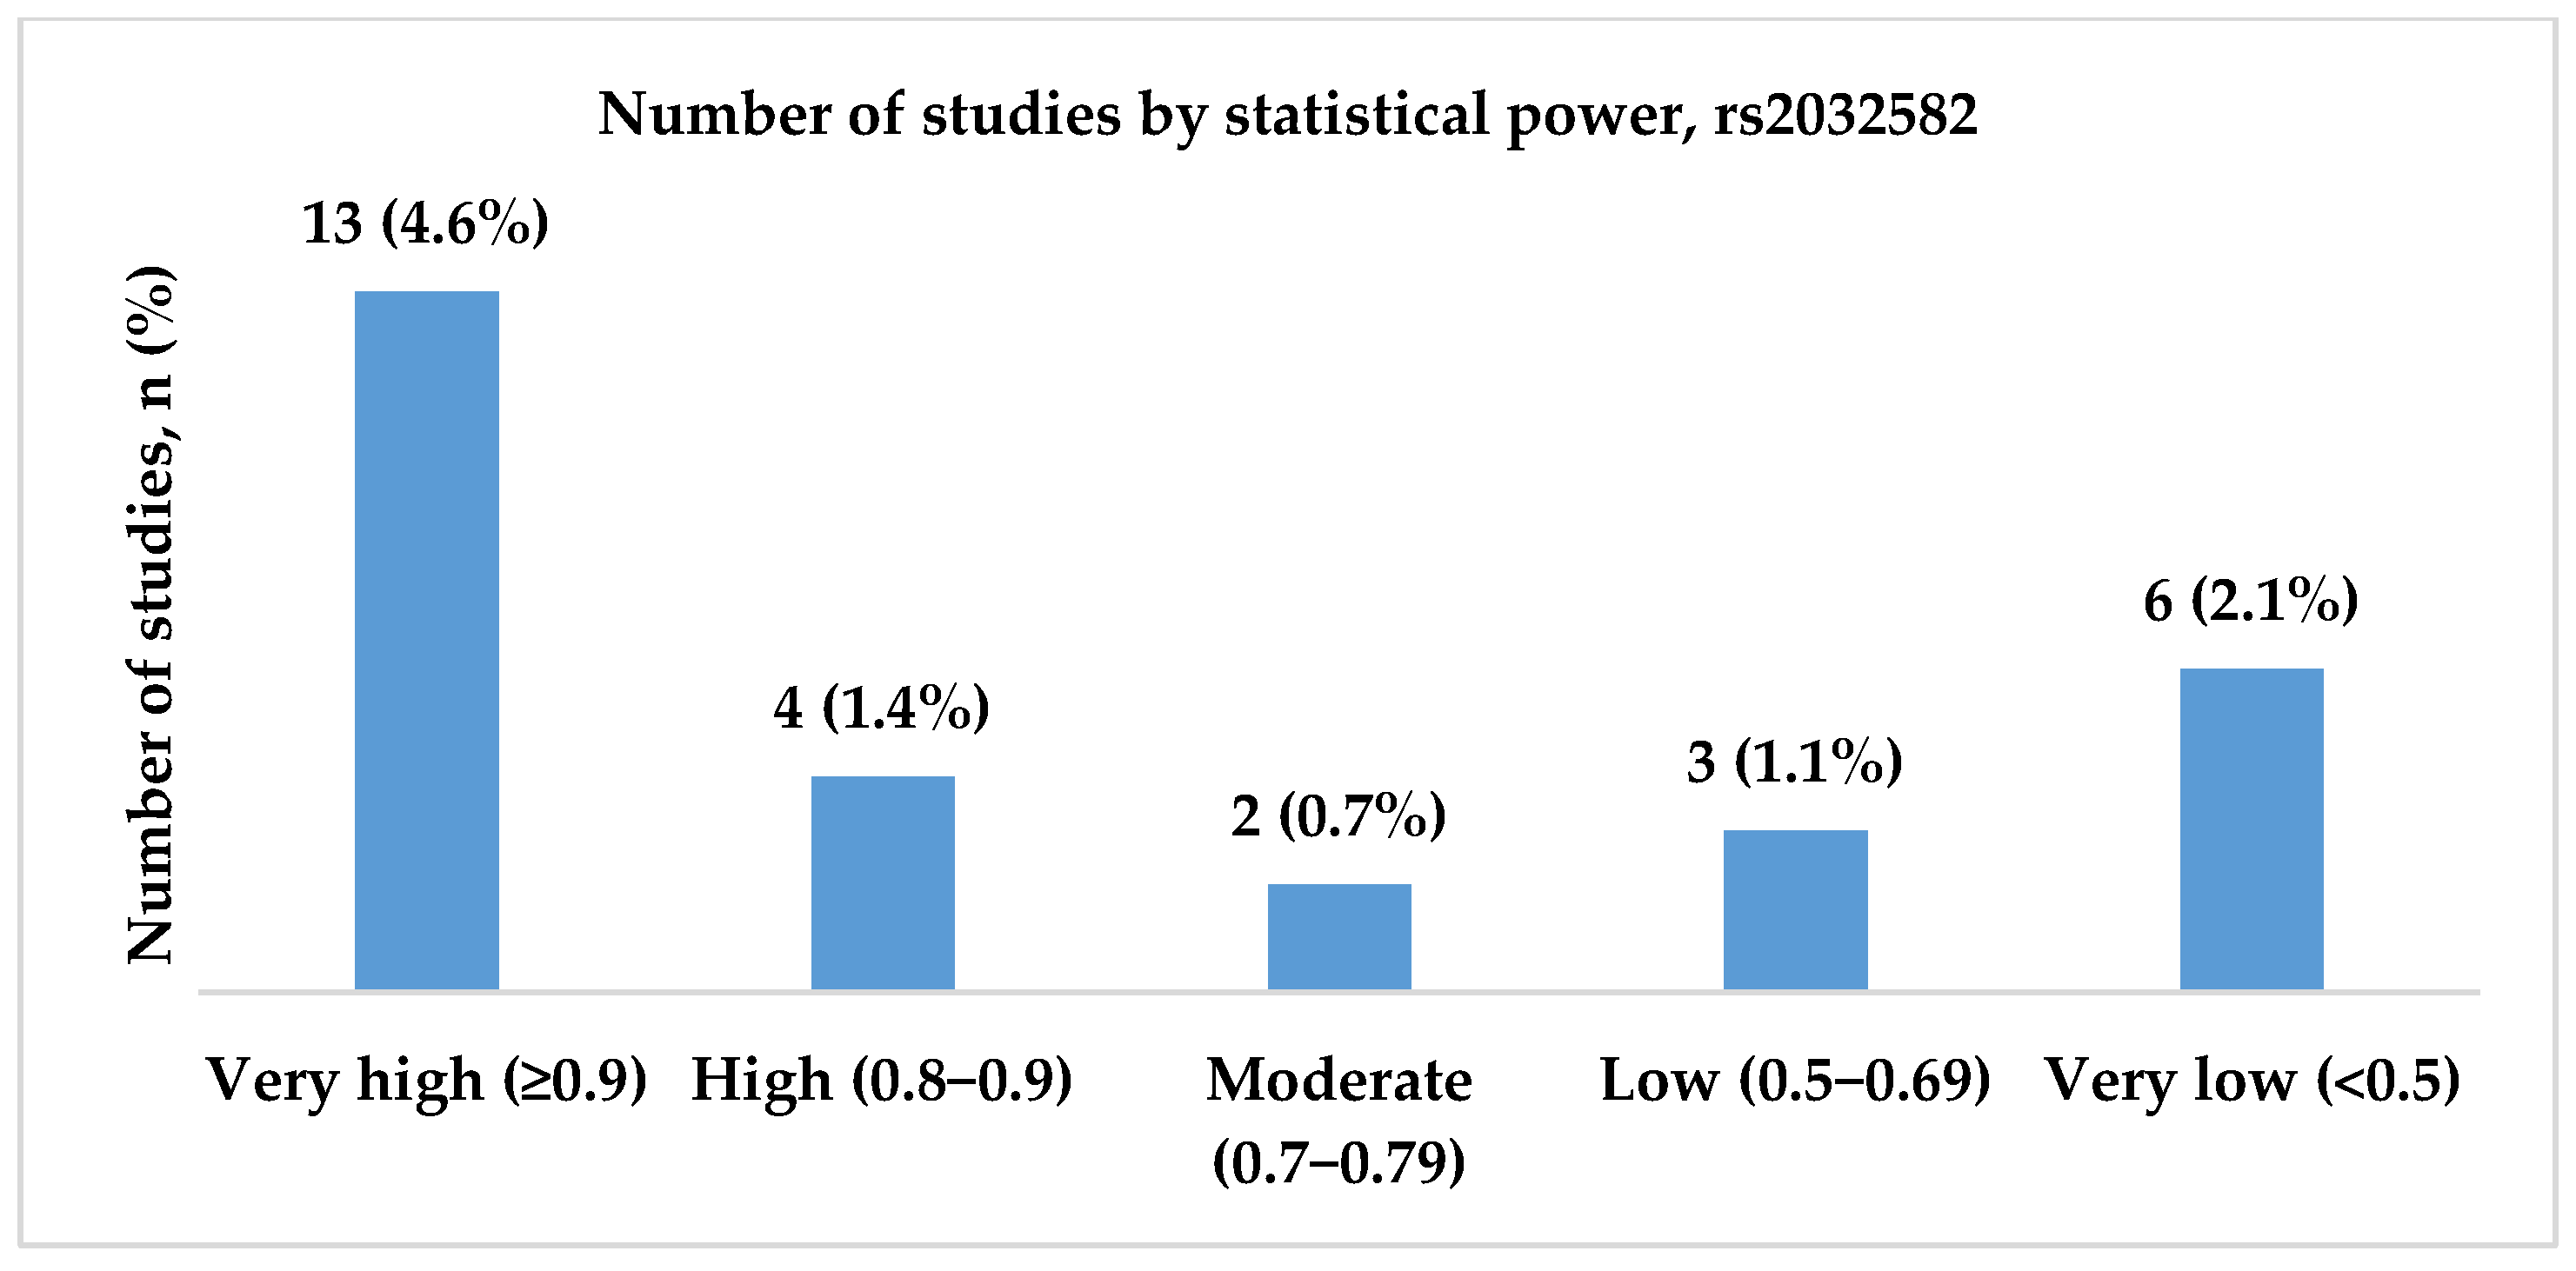
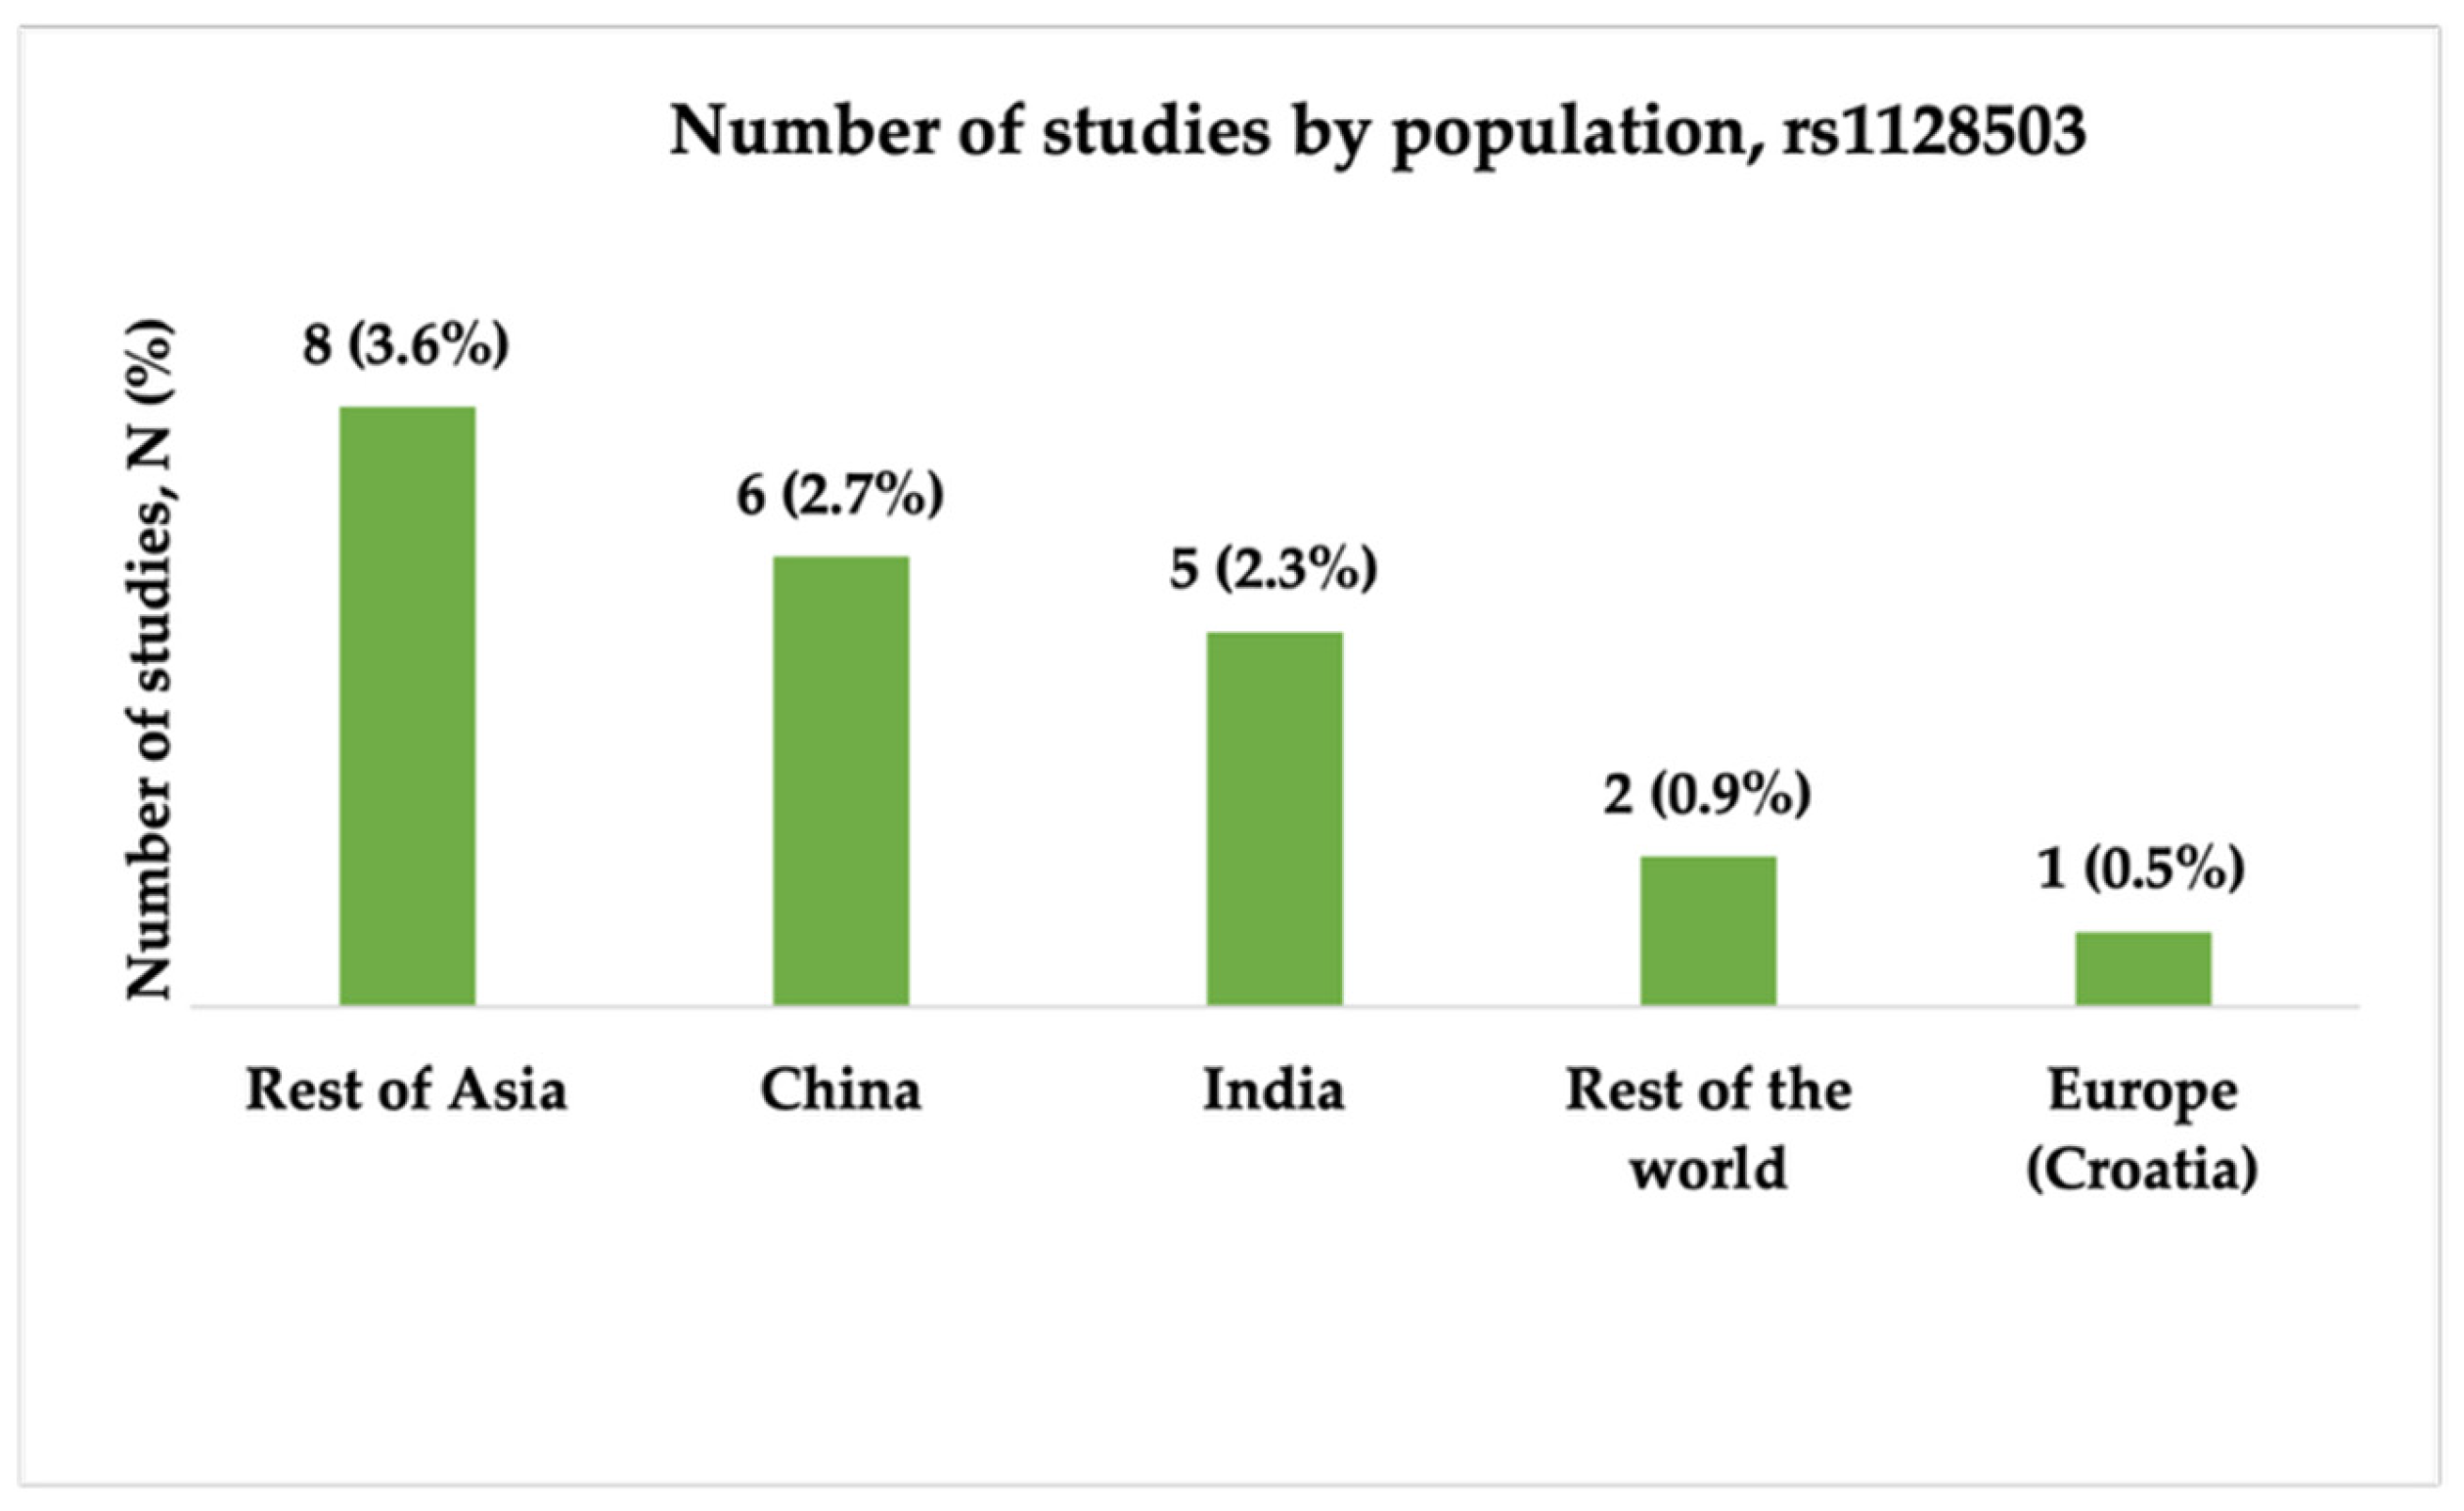

| Author | Year | Population | Epilepsy Type | Drug Resistant, N | CC, N (%) | CT, N (%) | TT, N (%) | Drug Responsive, N | CC, N (%) | CT, N (%) | TT, N (%) | Results | G-Power Calculations | ||
|---|---|---|---|---|---|---|---|---|---|---|---|---|---|---|---|
| Effect Size | Power 1 − β | Needed Sample Size | |||||||||||||
| Very high statistical power | |||||||||||||||
| Siddiqui, et al. [9] | 2003 | UK | Focal and generalized | 200 | 55 (27.5%) | 106 (53%) | 39 (19.5%) | 115 | 18 (15.7%) | 63 (54.8%) | 34 (29.6%) | DRE patients were more likely to have the CC genotype than the TT genotype (p = 0.006). | 0.32 | 1.000 | 93 |
| Siddiqui et al. [9] | 2003 | India | Focal and generalized | 128 | 11 (8.6%) | 63 (50%) | 54 (42%) | 92 | 21(23.0%) | 49 (53.0%) | 22 (24%) | No significant association with ASM resistance. | 0.56 | 1.000 | 31 |
| Soranzo et al. [21] | 2004 | UK | Not specified | 280 * (* 286) | 73 (25.5%) | 145 (50.7%) | 62 (21.7%) | 136 * (135) | 20 (14.8%) | 80 (59.3%) | 36 (26.7%) | The C allele was significantly overrepresented in the DRE group (p = 0.032). | 0.26 | 0.999 | 143 |
| Tan et al. [25] | 2004 | Australia | Focal and generalized | 401 | 75 (18.7%) | 193 (48.1%) | 133 (33.2%) | 208 | 37 (17.8%) | 115 (55.3%) | 56 (26.9%) | No significant association with ASM resistance. | 0.15 | 0.930 | 416 |
| Seo et al. [17] | 2006 | Japan | Focal and generalized | 126 | 34 (27.0%) | 58 (46.0%) | 34 (27.0%) | 84 | 36 (42.9%) | 34 (40.5%) | 14 (16.7%) | DRE had higher frequencies of the TT genotype (p = 0.027). | 0.37 | 0.999 | 70 |
| Hung et al. [12] | 2007 | Taiwan | Focal and generalized | 114 | 40 (35%) | 55 (48.0%) | 19 (17.0%) | 213 | 39 (18.0%) | 107 (50.0%) | 67 (32.0%) | DRE patients were more likely to have the CC genotype (p < 0.001). | 0.46 | 1.000 | 46 |
| Kwan et al. [19] | 2007 | China | Focal and generalized | 221 | 80 (36.2%) | 104 (47.1%) | 37 (16.7%) | 297 | 114 (38.4%) | 161 (54.2%) * | 22 (7.4%) | DRE patients were more likely to have the TT genotype (p = 0.0009). | 0.25 | 1.000 | 151 |
| Szoeke et al. [26] | 2009 | Hong Kong | Focal and generalized | 11 | 1 (9.1%) | 8 (72.7%) | 2 (18.2%) | 34 | 13 (38.2%) | 20 (58.8%) | 1 (2.9%) | No significant association with ASM resistance. | 1.04 | 1.000 | 9 |
| Kwan et al. [18] | 2009 | Han Chinese | Focal and generalized | 194 | 71 (36.6%) | 94 (48.5%) | 29 (14.9%) | 270 | 101 (37.4%) | 148 (54.8%) | 21 (7.8%) | DRE patients were more likely to have the TT genotype (p = 0.04). | 0.21 | 0.983 | 229 |
| Lakhan et al. [27] | 2009 | North India | Focal and generalized | 94 | 9 (9.6%) | 52 (55.3%) | 33 (35.1%) | 231 | 38 (16.5%) | 104 (45.0%) | 89 (38.5%) | No significant association with ASM resistance. | 0.27 | 0.994 | 134 |
| Alpman et al. [23] | 2010 | Turkey | Focal and generalized | 38 * (39) | 6 (15.4%) | 20 (51.3%) | 12 (30.8%) | 87 * (92) | 26 (28.3%) | 37 (40.2%) | 24 (26.1%) | No significant association with ASM resistance. | 0.39 | 0.979 | 65 |
| Sayyah et al. [11] | 2011 | Iran | Focal and generalized | 132 | 34 (25.7%) | 55 (41.6%) | 43 (32.6%) | 200 | 32 (16.0%) | 80 (40.0%) | 88 (44.0%) | DRE patients had a higher frequency of the CC genotype (p = 0.01). | 0.28 | 0.997 | 125 |
| Sporiš et al. [22] | 2011 | Croatia | Focal and generalized | 59 | 19 (32.2%) | 21 (35.6%) | 19 (32.2%) | 48 | 7 (14.6%) | 23 (47.9%) | 18 (37.5%) | No significant association with ASM resistance. | 0.38 | 0.954 | 66 |
| Haerian et al. [28] | 2011 | Indian | Focal and generalized | 67 | 23 (34%) | 32 (48%) | 12 (18%) | 93 | 17 (18%) | 55 (59%) | 21 (23%) | No significant association with ASM resistance. | 0.39 | 0.976 | 85 |
| Subenthiran et al. [15] | 2013 | Malaysia | Focal | 152 * (162) | 51 (34%) | 65 (42.8%) | 36 (23.7%) | 162 | 35 (21.6%) | 59 (36.4%) | 68 (42.0%) | TT genotype was associated with ASM resistance (p = 0.007). | 0.40 | 1.000 | 62 |
| Buathet et al. [20] | 2013 | Thailand | Focal and generalized | 68 | 19 (27.9%) | 38 (55.9%) | 11 (16.2%) | 36 | 11 (30.6%) | 10 (27.8%) | 15 (41.7%) | CT and CC genotypes were associated with ASM resistance (p = 0.001 and p = 0.036, respectively). | 0.74 | 1.000 | 18 |
| Keangpraphun et al. [10] | 2015 | Thailand | Focal and generalized | 48 | 19 (39.6%) | 23 (47.9%) | 6 (12.5%) | 62 | 19 (30.6%) | 27 (43.5%) | 16 (25.8%) | DRE patients had a higher frequency of the CC genotype (p = 0.039). | 0.41 | 0.976 | 59 |
| Shen et al. [14] | 2017 | Han Chinese | Focal and generalized | 37 | 9 (24.3%) | 20 (54.1%) | 8 (21.6%) | 79 | 39 (49.4%) | 31 (39.2%) | 9 (11.4%) | Patients with the CC genotype were more likely to be ASM-responsive than those with CT (p = 0.025) and TT (p = 0.022) genotypes. | 0.59 | 1.000 | 28 |
| Ajmi et al. [16] | 2018 | Tunisia | Focal and generalized | 46 | 19 (41.3%) | 21 (45.7%) | 6 (13%) | 107 | 70 (65.4%) | 31 (29.0%) | 6 (5.6%) | TT genotype was more frequent in DRE patients (p = 0.017). | 0.49 | 1.000 | 40 |
| Maqbool et al. [13] | 2021 | Pakistan | Idiopathic generalized epilepsy | 110 | 39 (35.5%) | 49 (44.5%) | 22 (20.0%) | 127 | 33 (26.0%) | 42 (33.1%) | 52 (40.9%) | CC genotype was strongly associated with DRE (p = 0.0009). | 0.52 | 1.000 | 36 |
| High statistical power | |||||||||||||||
| Szoeke et al. [26] | 2009 | Australia | Focal and generalized | 64 | 21 (32.8%) | 27 (42.2%) | 16 (25.0%) | 148 | 34 (23.0%) | 67 (45.3%) | 47 (31.7%) | No significant association with ASM resistance. | 0.22 | 0.838 | 193 |
| Szoeke et al. [26] | 2009 | Scotland | Focal and generalized | 133 | 20 (15%) | 69 (51.9%) | 44 (33.1%) | 152 | 34 (22.4%) | 72 (47.4%) | 46 (30.3%) | No significant association with ASM resistance. | 0.21 | 0.887 | 227 |
| Vahab et al. [29] | 2009 | India | Focal and generalized | 113 | 3 (2.65%) | 61 (53.98%) | 49 (43.36%) | 129 | 4 (3.1%) | 82 (63.57%) | 43 (33.33%) | No significant association with ASM resistance. | 0.20 | 0.815 | 234 |
| Grover et al. [30] | 2010 | India | Focal and generalized | 87 * (95) | 13 (14.9%) | 44 (50.6%) | 30 (34.5%) | 125 * (133) | 14 (11.2%) | 55 (44.0%) | 56 (44.8%) | No significant association with ASM resistance. | 0.22 | 0.827 | 199 |
| Meng et al. [31] | 2011 | China | Focal and generalized | 24 | 6 (25%) | 13 (54.2%) | 5 (20.8%) | 60 | 24 (40.0%) | 26 (43.3%) | 10 (16.7%) | No significant association with ASM resistance. | 0.35 | 0.819 | 81 |
| Emich-Widera et al. [32] | 2014 | Poland | Focal | 39 | 8 (20.5%) | 21 (53.8%) | 10 (25.6%) | 43 | 2 (4.7%) | 28 (65.1%) | 13 (30.2%) | No significant association with ASM resistance. | 0.39 | 0.898 | 63 |
| Salih et al. [24] | 2020 | Iraq | Focal and generalized | 40 | 13 (32.5%) | 23 (57.5%) | 4 (10%) | 60 | 11 (18.33%) | 32 (55.33%) | 17 (28.33%) | DRE patients had a higher frequency of CT + CC genotypes (p = 0.019). | 0.27 | 0.802 | 130 |
| Zhao et al. [33] | 2020 | China | Focal and generalized | 117 | 32 (27%) | 58 (50%) | 27 (23%) | 128 | 46 (36%) | 53 (41%) | 29 (23%) | No significant association with ASM resistance. | 0.215 | 0.863 | 209 |
| Tang et al. [34] | 2024 | Vietnam | Focal and generalized | 112 | 47 (42.0%) | 55 (49.1%) | 10 (8.9%) | 101 | 33 (32.7%) | 53 (52.5%) | 15 (14.9%) | No significant association with ASM resistance. | 0.26 | 0.802 | 141 |
| Moderate statistical power | |||||||||||||||
| Sánchez et al. [35] | 2010 | Spain | Focal and generalized | 111 | 40 (36%) | 49 (44.1%) | 22 (18.8%) | 178 | 52 (29.2%) | 81 (45.5%) | 45 (25.3%) | In DRE patients, the CC genotype was significantly more frequent than the TT genotype (p = 0.019). | 0.17 | 0.732 | 338 |
| Emich-Widera et al. [36] | 2013 | Poland | Focal | 60 | 9 (15.0%) | 33 (55.0%) | 18 (30.0%) | 25 | 1 (4.0%) | 16 (64.0%) | 8 (32.0%) | No significant association with ASM resistance. | 0.31 | 0.730 | 100 |
| Zhou et al. [37] | 2015 | China | Focal and generalized | 155 * (156) | 55 (35.5%) | 80 (51.6%) | 20 (12.9%) | 234 * (235) | 79 (33.8%) | 135 (57.7%) | 20 (8.5%) | No significant association with ASM resistance. | 0.15 | 0.769 | 419 |
| Tamimi et al. [38] | 2021 | Jordan | Not specified | 46 | 21 (45.7%) | 18 (39.1%) | 7 (15.2%) | 39 | 12 (30.8%) | 19 (48.7%) | 8 (20.5%) | DRE was 14 times more likely in females with the CC genotype compared to those with the TT genotype (p = 0.028). | 0.30 | 0.700 | 107 |
| Elmagid et al. [39] | 2021 | Egypt | Focal and generalized | 63 | 32 (50.8%) | 21 (33.3%) | 10 (15.9%) | 43 | 18 (41.9%) | 20 (46.5%) | 5 (11.6%) | No significant association with ASM resistance. | 0.28 | 0.742 | 122 |
| Low statistical power | |||||||||||||||
| Ufer et al. [40] | 2009 | Germany | Focal and generalized | 70 | 10 (14.3%) | 38 (54.3%) | 22 (31.4%) | 103 | 20 (19.4%) | 46 (44.7%) | 37 (35.9%) | No significant association with ASM resistance. | 0.20 | 0.672 | 230 |
| Dong et al. [41] | 2011 | China | Focal and generalized | 157 | 64 (40.7%) | 75 (47.8%) | 18 (11.5%) | 193 | 82 (42.5%) | 83 (43.0%) | 28 (14.5%) | No significant association with ASM resistance. | 0.12 | 0.481 | 712 |
| Sterjev et al. [42] | 2012 | Macedonia | Focal and generalized | 68 | 15 (22.0%) | 39 (57.0%) | 14 (21.0%) | 94 | 25 (26.6%) | 45 (47.9%) | 24 (25.5%) | No significant association with ASM resistance. | 0.19 | 0.579 | 264 |
| Xue et al. [43] | 2016 | Han Chinese | Focal and generalized | 104 | 43 (41.35%) | 48 (46.15%) | 13 (12.5%) | 150 | 61 (40.67%) | 77 (51.33%) | 12 (8.00%) | No significant association with ASM resistance. | 0.15 | 0.553 | 437 |
| Very low statistical power | |||||||||||||||
| Sills et al. [44] | 2005 | Scotland | Focal and generalized | 230 | 41 (17.8%) | 112 (48.7%) | 77 (33.5%) | 170 | 32 (18.8%) | 82 (48.2%) | 56 (32.9%) | No significant association with ASM resistance. | 0.03 | 0.072 | 13353 |
| Kim et al. [45] | 2006 | Korea | Not specified | 99 | 47 (47.5%) | 46 (46.5%) | 6 (6.1%) | 100 | 45 (45.0%) | 48 (48.0%) | 7 (7.0%) | No significant association with ASM resistance. | 0.06 | 0.106 | 2780 |
| Ozgon et al. [46] | 2008 | Turkey | Focal and generalized | 44 | 13 (29.6%) | 26 (59.1%) | 5 (11.3%) | 53 | 16 (30.3%) | 29 (54.7%) | 8 (15.0%) | No significant association with ASM resistance. | 0.12 | 0.178 | 624 |
| Haerian et al. [28] | 2011 | Malays | Focal and generalized | 125 | 47 (38%) | 57 (46%) | 21 (17%) | 123 | 44 (36%) | 56 (45%) | 23 (19%) | No significant association with ASM resistance. | 0.06 | 0.119 | 2830 |
| Haerian et al. [28] | 2011 | Chinese | Focal and generalized | 131 | 39 (30%) | 69 (53%) | 23 (18%) | 146 | 49 (34%) | 69 (47%) | 28 (19%) | No significant association with ASM resistance. | 0.10 | 0.318 | 901 |
| Qu et al. [47] | 2012 | China | Focal and generalized | 217 | 81 (37.3%) | 105 (48.4%) | 31 (14.3%) | 320 | 116 (36.3%) | 161(50.3%) | 43 (13.4%) | No significant association with ASM resistance. | 0.04 | 0.119 | 6097 |
| Escalante et al. [48] | 2014 | Brazil | Focal | 22 | 30.0% | 45.0% | 25.5% | 7 | 28.6% | 57.1% | 14.3% | No significant association with ASM resistance. | 0.28 | 0.253 | 122 |
| Seven et al. [49] | 2014 | Turkey | Focal and generalized | 69 | 17 (25.0%) | 30 (43.5%) | 22 (32.0%) | 83 | 22 (26.5%) | 38 (46.0%) | 23 (28.0%) | No significant association with ASM resistance. | 0.09 | 0.155 | 1174 |
| Balan et al. [50] | 2014 | India | Focal and generalized | 259 | 12 (0.05) | 136 (52.5%) | 111 (0.43) | 201 | 12 (6.0%) | 109 (54.0%) | 80 (40.0%) | No significant association with ASM resistance. | 0.08 | 0.338 | 1399 |
| Daci et al. [51] | 2015 | Albania | Focal and generalized | 46 | 8 (17.4%) | 28 (60.9%) | 10 (21.7%) | 99 | 18 (18.2%) | 57 (57.6%) | 24 (24.2%) | No significant association with ASM resistance. | 0.07 | 0.109 | 1914 |
| Manna et al. [52] | 2015 | Italy | Focal | 41 | 13 (31.7%) | 21 (51.2%) | 7 (17.1%) | 134 | 45 (33.6%) | 64 (47.8%) | 25 (18.7%) | No significant association with ASM resistance. | 0.07 | 0.122 | 1917 |
| Dhivya et al. [53] | 2024 | South India | Focal and generalized | 100 | 16 (16%) | 46 (46%) | 38 (38%) | 100 | 19 (19%) | 46 (46%) | 35 (35%) | No significant association with ASM resistance. | 0.09 | 0.188 | 1206 |
| Author | Year | Population | Epilepsy Type | Drug Responsiveness | Number of Participants, N | GG, N (%) | GT, N (%) | TT, N (%) | GA, N (%) | TA, N (%) | AA, N (%) | Conclusion | G-Power Calculations | ||
|---|---|---|---|---|---|---|---|---|---|---|---|---|---|---|---|
| Effect Size | Power 1 − β | Needed Sample Size | |||||||||||||
| Very high statistical power | |||||||||||||||
| Seo et al. [17] | 2006 | Japan | Focal and generalized | Drug resistant, N | 126 | 18 (14.3%) | 44 (34.9%) | 33 (26.2%) | 15 (11.9%) | 15 (11.9%) | 1 (0.8%) | DRE patients were more likely to have the TT genotypes than the GG genotypes (p = 0.049). | 0.40 | 0.998 | 81 |
| Drug responsive, N | 84 | 22 (26.2%) | 22 (26.2%) | 20 (23.8%) | 8 (9.5%) | 10 (11.9%) | 2 (2.4%) | ||||||||
| Vahab et al. [29] | 2009 | India | Unspecified | Drug resistant, N | 110 * (* 112) | 16 (14.54%) | 58 (52.73%) | 36 (32.73%) | NR | NR | NR | No significant association with ASM resistance. | 0.26 | 0.948 | 145 |
| Drug responsive, N | 119 | 28 (23.53%) | 54 (45.38%) | 37 (31.09%) | NR | NR | NR | ||||||||
| Kwan et al. [18] | 2009 | Han Chinese | Unspecified | Drug resistant, N | 174 * (194) | 44 (25.3%) | 76 (43.7%) | 54 (31.0%) | NR | NR | NR | T/A genotypes were significantly associated with ASM resistance (p = 0.020). | 0.49 | 1.000 | 41 |
| Drug responsive, N | 251 * (270) | 104 (41.4%) | 120 (47.8%) | 27 (10.8%) | NR | NR | NR | ||||||||
| Lakhan et al. [27] | 2009 | North India | Focal and generalized | Drug resistant, N | 97 | 10 (10.8%) * | 47 (50.0%) | 35 (37.2%) | 0 (0%) | 2 (2.1%) | NR | No significant association with ASM resistance. | 0.29 | 0.994 | 148 |
| Drug responsive, N | 234 | 16 (6.9%) | 127 (55.0%) | 72 (31.2%) | 2 (0.9%) | 14 (6.1%) | NR | ||||||||
| Meng et al. [31] | 2011 | Chinese Han | Focal and generalized | Drug resistant, N | 24 | 5 (20.8%) | 8 (33.3%) | 5 (20.8%) | 0 (0.00%) | 6 (25%) | 0 (0.00%) | No significant association with ASM resistance. | 0.55 | 0.989 | 44 |
| Drug responsive, N | 59 | 12 (20.3%) | 27 (45.8%) | 6 (10.2%) | 3 (5.1%) | 8 (13.6%) | 3 (5.1%) | ||||||||
| Sporis et al. [22] | 2011 | Croatia | Focal | Drug resistant, N | 58 | 26 (44.8%) | 21 (36.2%) | 11 (19%) | NR | NR | NR | Patients with the GT genotype had a statistically significantly lower chance for ASM resistance compared with patients with the GG genotype. | 0.53 | 0.999 | 35 |
| Drug responsive, N | 47 | 9 (19.15%) | 27 (57.45%) | 11 (23.4%) | NR | NR | NR | ||||||||
| Haerian et al. [28] | 2011 | Chinese | Focal and generalized | Drug resistant, N | 131 | 36 (27%) | 72 (55%) | 23 (18%) | NR | NR | NR | No significant association with ASM resistance. | 0.18 | 0.784 | 288 |
| Drug responsive, N | 146 | 35 (24%) | 74 (51%) | 37 (25%) | NR | NR | NR | ||||||||
| Subenthiran et al. [15] | 2013 | Malaysia | Focal | Drug resistant, N | 182 * (162) | 144 (75%) | 13 (9.0%) | 25 (16.0%) | NR | NR | NR | DRE patients were more likely to have the TT genotype (p < 0.001). | 0.92 | 1.000 | 12 |
| Drug responsive, N | 162 * (152) | 59 (36.4%) | 46 (28.4%) | 57 (35.2%) | NR | NR | NR | ||||||||
| Subenthiran et al. [54] | 2013 | Malaysia | Focal | Drug resistant, N | 162 | 56 (34.6%) | 43 (26.5%) | 63 (38.9%) | NR | NR | NR | DRE patients were more likely to carry the TT, while patients with the GG genotype were significantly more likely to respond to ASM (p < 0.001). | 0.84 | 1.000 | 14 |
| Drug responsive, N | 152 | 113 (74.3%) | 12 (7.9%) | 27 (17.8%) | NR | NR | NR | ||||||||
| Smolarz et al. [56] | 2017 | Poland | Not specified | Drug resistant, N | 340 | 140 (41.0%) | 68 (20.0%) | 48 (14.0%) | 36 (11.0%) | 28 (8.0%) | 20 (6.0%) | The GG genotype was significantly more frequent in DRE patients. | 0.26 | 1.000 | 193 |
| Drug responsive, N | 240 | 40 (16.7%) | 62 (25.8%) | 30 (12.5%) | 58 (24.2%) | 26 (10.8%) | 24 (10%) | ||||||||
| Ajmi et al. [16] | 2018 | Tunisia | Focal and generalized | Drug resistant, N | 46 | 15 (32.6%) | 22 (47.8%) | 9 (19.6%) | NR | NR | NR | DRE patients had significantly higher frequencies of the GT and TT genotypes compared to drug-responsive patients (p = 0.025). | 0.48 | 1.000 | 42 |
| Drug responsive, N | 107 | 58 (54.2%) | 40 (37.4%) | 9 (8.4%) | NR | NR | NR | ||||||||
| Zhao et al. [33] | 2020 | China | Focal and generalized | Drug resistant, N | 117 | 15 (13%) | 62 (53%) | 23 (20%) | 12 (10%) | 5 (4%) | NR | The GG genotype frequency was significantly higher in ASM-responsive patients (p = 0.046). | 0.30 | 0.979 | 132 |
| Drug responsive, N | 128 | 29 (23%) | 58 (45%) | 23 (18%) | 13 (10%) | 5 (4%) | NR | ||||||||
| Maqbool et al. [13] | 2021 | Pakistan | Idiopathic generalized epilepsy | Drug resistant, N | 110 | 4 (3.6%) | NR | 16 (14.5%) | NR | 51 (4.64%) | 39 (35.5%) | The AA genotype was associated with ASM resistance compared to the TT wild-type genotype (p = 0.001). | 0.64 | 1.000 | 32 |
| Drug responsive, N | 127 | 5 (3.9%) | NR | 47 (37.0%) | NR | 42 (33.1%) | 33 (26.0%) | ||||||||
| High statistical power | |||||||||||||||
| Ufer et al. [40] | 2009 | Germany | Focal and generalized | Drug resistant, N | 70 | 21 (30%) | 37 (52.9%) | 12 (17.1%) | NR | NR | NR | No significant association with ASM resistance. | 0.25 | 0.843 | 155 |
| Drug responsive, N | 102 * (103) | 28 (27.45%) | 47 (46.08%) | 27 (26.47%) | NR | NR | NR | ||||||||
| Haerian et al. [28] | 2011 | Indian | Focal and generalized | Drug resistant, N | 67 | 8 (12%) | 33 (49%) | 26 (39%) | NR | NR | NR | No significant association with ASM resistance. | 0.26 | 0.850 | 142 |
| Drug responsive, N | 93 | 18 (19%) | 48 (52%) | 27 (29%) | NR | NR | NR | ||||||||
| Balan et al. [50] | 2013 | India | Temporal with hippocampal sclerosis (MTLE-HS) | Drug resistant, N | 256 * (259) | 29 (11.3%) | 129 (50.4%) | 98 (38.3%) | NR | NR | NR | No significant association with ASM resistance. | 0.15 | 0.848 | 404 |
| Drug responsive, N | 199 * (201) | 29 (14.6%) | 86 (43.2%) | 84 (42.2%) | NR | NR | NR | ||||||||
| Tamimi et al. [38] | 2021 | Jordan | Not specified | Drug resistant, N | 46 | 19 (41.3%) | 20 (43.5%) | 5 (10.9%) | 2 (4.3%) | NR | NR | DRE was 9 times more likely in females with the TT genotype compared to those with the CC genotype (p = 0.04). | 0.37 | 0.843 | 78 |
| Drug responsive, N | 40 | 11 (27.5%) | 20 (50%) | 8 (20%) | 1 (2.5%) | NR | NR | ||||||||
| Moderate statistical power | |||||||||||||||
| Kim et al. [45] | 2006 | Korea | Unspecified | Drug resistant, N | 99 | 19 (19.2%) | 33 (33.3%) | 11 (11.1%) | 22 (22.2%) | 12 (12.1%) | 2 (2.0%) | No significant association with ASM resistance. | 0.24 | 0.754 | 232 |
| Drug responsive, N | 107 | 17 (15.9%) | 40 (37.4%) | 9 (8.4%) | 21 (19.6%) | 15 (14.0%) | 5 (4.7%) | ||||||||
| Dong et al. [41] | 2011 | China | Focal and generalized | Drug resistant, N | 157 | 37 (23.5%) | 56 (35.7%) | 32 (20.4%) | 19 (12.1%) | 11 (7.0%) | 2 (1.3%) | No significant association with ASM resistance. | 0.17 | 0.702 | 428 |
| Drug responsive, N | 193 | 49 (25.4%) | 67 (34.7%) | 38 (19.7%) | 18 (9.3%) | 20 (10.4%) | 1 (0.5%) | ||||||||
| Low statistical power | |||||||||||||||
| Grover et al. [30] | 2010 | India | Focal and generalized | Drug resistant, N | 92 * (95) | 10 (10.9%) | 40 (43.5%) | 35 (38.0%) | 2 (2.2%) | 4 (4.3%) | 1 (1.1%) | No significant association with ASM resistance. | 0.19 | 0.573 | 357 |
| Drug responsive, N | 128 * (133) | 12 (9.4%) | 52 (40.6%) | 58 (45.3%) | 1 (0.8%) | 5 (3.9%) | 0 (0%) | ||||||||
| Sayyah et al. [11] | 2011 | Iran | Focal and generalized | Drug resistant, N | 132 | 31 (23.5%) | 60 (45.5%) | 37 (28.0%) | 2 (1.5%) | 2 (1.5%) | No significant association with ASM resistance. | 0.14 | 0.525 | 585 | |
| Drug responsive, N | 200 | 36 (18.0%) | 97 (48.5%) | 61 (30.5%) | 2 (1%) | 4 (2%) | |||||||||
| Seven et al. [49] | 2014 | Turkey | Unspecified | Drug resistant, N | 69 | 17 (25%) | 32 (46%) | 17 (25%) | 1 (1%) | 2 (3%) | No significant association with ASM resistance. | 0.25 | 0.687 | 193 | |
| Drug responsive, N | 83 | 20 (24%) | 36 (43%) | 24 (29%) | 2 (3%) | 1 (1%) | |||||||||
| Very low statistical power | |||||||||||||||
| Hung et al. [12] | 2007 | Taiwan | Focal and generalized | Drug resistant, N | 114 | 37 (32%) | 58 (51%) | 19 (17%) | NR | NR | NR | No significant association with ASM resistance. | 0.09 | 0.289 | 1185 |
| Drug responsive, N | 213 | 76 (36%) | 100 (47%) | 37 (17%) | NR | NR | NR | ||||||||
| Sánchez et al. [35] | 2010 | Spain/Caucasians | Focal and generalized | Drug resistant, N | 111 | 48 (43.2%) | 43 (38.7%) | 20 (18.0%) | 2 (1.6%) | 3 (2.4%) | NR | DRE patients had a higher frequency of the GG genotype compared to the TT genotype (p = 0.03) | 0.13 | 0.491 | 574 |
| Drug responsive, N | 178 | 66 (37.1%) | 74 (41.6%) | 38 (21.3%) | NR | NR | NR | ||||||||
| Escalante-Santiago et al. [48] | 2014 | Brazil | Focal | Drug resistant, N | 22 | 31.8% ** | 36.4% ** | 18.2% ** | 4.5% ** | 9.1% ** | NR | No significant association with ASM resistance. | 0.25 | 0.181 | 190 |
| Drug responsive, N | 7 | 28.6% ** | 42.9% ** | 28.6% ** | NR | NR | NR | ||||||||
| Zhou et al. [37] | 2015 | China | Focal and generalized | Drug resistant, N | 153 * (156) | 48 (31.4%) | 74 (48.3%) | 31 (20.3%) | NR | NR | NR | No significant association with ASM resistance. | 0.07 | 0.196 | 2197 |
| Drug responsive, N | 233 * (235) | 68 (29.2%) | 112 (48.1%) | 53 (22.7%) | NR | NR | NR | ||||||||
| Xue & Lu [43] | 2016 | Chinese Han | Focal and generalized | Drug resistant, N | 104 | 35 (33.65%) | 53 (50.96%) | 16 (15.38%) | NR | NR | NR | No significant association with ASM resistance. | 0.06 | 0.125 | 2675 |
| Drug responsive, N | 150 | 54 (36.00%) | 72 (48.00%) | 24 (16.00%) | NR | NR | NR | ||||||||
| Attia et al. [57] | 2024 | Egypt | Focal and generalized | Drug resistant, N | 67 | 20 (29.9%) | 34 (50.7%) | 13 (19.4%) | NR | NR | NR | No significant association with ASM resistance. | 0.1786186 | 0.4403930 | 302 |
| Drug responsive, N | 67 | 24 (35.8%) | 28 (41.8%) | 15 (22.4%) | NR | NR | NR | ||||||||
| Author | Year | Population | Epilepsy Type | Drug Resistant, N | CC, N (%) | CT, N (%) | TT, N (%) | Drug Responsive, N | CC, N (%) | CT, N (%) | TT, N (%) | Conclusion | G-Power Calculations | ||
|---|---|---|---|---|---|---|---|---|---|---|---|---|---|---|---|
| Effect Size | Power 1 − β | Needed Sample Size | |||||||||||||
| Very high statistical power | |||||||||||||||
| Maleki et al. [58] | 2010 | Iran | Focal and generalized | 132 | 24 (18.18%) | 65 (49.24%) | 43 (32.57%) | 200 | 28 (14%) | 87 (43.5%) | 85 (42.5%) | In females, CC and CT genotypes were linked to a higher risk of DRE compared to TT (p = 0.02 and p = 0.008, respectively). | 0.22 | 0.950 | 228 |
| Sporis D et al. [22] | 2011 | Croatia | Focal | 56 | 23 (41.1%) | 21 (37.5%) | 12 (21.4%) | 43 | 10 (23.3%) | 20 (46.5%) | 13 (30.2%) | No significant association with ASM resistance. | 0.37 | 0.916 | 72 |
| Zhao et al. [33] | 2020 | China | Focal and generalized | 117 | 13 (11%) | 57 (49%) | 47 (40%) | 128 | 24 (19%) | 54 (42%) | 50 (39%) | No significant association with ASM resistance. | 0.26 | 0.965 | 141 |
| Maqbool et al. [13] | 2021 | Pakistan | Idiopathic generalized epilepsy | 110 | 41 (37.3%) | 52 (47.3%) | 17 (15.5%) | 127 | 35 (27.6%) | 43 (33.9%) | 49 (38.6%) | DRE patients had significantly higher frequencies of the CC and CT genotypes (p = 0.0003). | 0.64 | 1.000 | 24 |
| Zhu J et al. [59] | 2023 | China | Focal and generalized | 61 | 5 (8.2%) | 24 (39.3%) | 32 (52.5%) | 109 | 12 (11%) | 61 (56%) | 36 (33%) | DRE patients were more likely to carry the TT genotype (p = 0.013). | 0.39 | 0.997 | 63 |
| High statistical power | |||||||||||||||
| Grover et al. [30] | 2010 | India | Focal and generalized | 95 | 13 (14.1%) | 49 (53.3%) | 30 (32.6%) | 129 * (133) | 23 (17.8%) | 54 (41.9%) | 52 (40.3%) | No significant association with ASM resistance. | 0.23 | 0.870 | 185 |
| Haerian et al. [28] | 2011 | Chinese | Focal and generalized | 131 | 27 (21%) | 59 (45%) | 45 (34%) | 146 | 35 (24%) | 74 (51%) | 37 (25%) | No significant association with ASM resistance. | 0.19 | 0.816 | 267 |
| Moderate statistical power | |||||||||||||||
| Kwan et al. [18] | 2009 | Han Chinese | Not specified | 180 * (194) | 19 (10.6%) | 79 (43.9%) | 82 (45.6%) | 257 * (270) | 34 (13.2%) | 123 (47.9%) | 100 (38.9%) | No significant association with ASM resistance. | 0.14 | 0.759 | 481 |
| Low statistical power | |||||||||||||||
| Seo et al. [17] | 2006 | Japan | Focal and generalized | 126 | 16 (12.7%) | 49 (38.9%) | 61 (48.4%) | 84 | 15 (17.9%) | 30 (35.7%) | 39 (46.4%) | No significant association with ASM resistance. | 0.16 | 0.520 | 390 |
| Kim et al. [45] | 2006 | Korea | Not specified | 97 | 18 (18.6%) | 40 (41.2%) | 39 (40.2%) | 107 | 17 (15.9%) | 54 (50.5%) | 36 (33.6%) | No significant association with ASM resistance. | 0.19 | 0.675 | 270 |
| Hung et al. [12] | 2007 | Taiwan | Focal and generalized | 114 | 12 (10%) | 51 (45%) | 51 (45%) | 213 | 27 (13%) | 104 (49%) | 82 (38%) | No significant association with ASM resistance. | 0.15 | 0.698 | 411 |
| Vahab et al. [29] | 2009 | India | Not specified | 112 | 30 (26.79%) | 44 (39.29%) | 38 (33.92%) | 119 | 25 (21.01%) | 46 (38.65%) | 48 (40.34%) | No significant association with ASM resistance. | 0.16 | 0.562 | 390 |
| Ajmi et al. [16] | 2018 | Tunisia | Focal and generalized | 46 | 14 (30.4%) | 23 (50%) | 9 (19.6%) | 107 | 42 (39.3%) | 48 (44.9%) | 17 (15.9%) | No significant association with ASM resistance. | 0.20 | 0.570 | 254 |
| Very low statistical power | |||||||||||||||
| Lakhan et al. [27] | 2009 | North India | Generalized and focal | 94 | 12 (12.8%) | 52 (55.3%) | 30 (31.9%) | 231 | 29 (12.6%) | 124 (53.7%) | 78 (33.8%) | No significant association with ASM resistance. | 0.04 | 0.093 | 5787 |
| Meng et al. [31] | 2011 | China | Focal and generalized | 24 | 2 (8.3%) | 10 (41.7%) | 12 (50%) | 60 | 5 (8.3%) | 29 (48.3%) | 26 (43.4%) | No significant association with ASM resistance. | 0.14 | 0.189 | 503 |
| Haerian et al. [28] | 2011 | Malays | Focal and generalized | 125 | 24 (18%) | 63 (46%) | 38 (36%) | 123 | 22 (18%) | 51 (41%) | 50 (41%) | No significant association with ASM resistance. | 0.11 | 0.328 | 779 |
| Haerian et al. [28] | 2011 | Indian | Focal and generalized | 67 | 14 (21%) | 31 (46%) | 22 (33%) | 93 | 20 (22%) | 44 (47%) | 29 (31%) | No significant association with ASM resistance. | 0.04 | 0.074 | 5056 |
| Dong et al. [41] | 2011 | China | Focal and generalized | 157 | 22 (14.0%) | 72 (45.9%) | 63 (40.1%) | 193 | 20 (10.4%) | 92 (47.7%) | 81 (41.9%) | No significant association with ASM resistance. | 0.10 | 0.394 | 895 |
| Balan et al. [50] | 2013 | India | Temporal with hippocampal sclerosis | 259 | 32 (0.12) | 110 (0.43) | 117 (0.45) | 200 * (201) | 29 (14.5%) | 78 (39%) | 93 (46.5) | No significant association with ASM resistance. | 0.08 | 0.445 | 1022 |
| Escalante et al. [48] | 2014 | Brazil | Focal | 22 | 6 (27%) | 12 (55%) | 4 (18%) | 7 | 1 (14%) | 4 (57%) | 2 (29%) | No significant association with ASM resistance. | 0.35 | 0.374 | 79 |
| Tamimi et al. [38] | 2021 | Jordan | Not specified | 46 | 17 (37%) | 19 (41.3%) | 10 (21.7%) | 39 * (40) | 12 (30.7%) | 18 (46.2%) | 9 (23.1%) | Females with the CC genotype were 18.7 times more likely to be observed in the DRE group compared to those with the TT genotype (p = 0.02). | 0.13 | 0.177 | 553 |
| Tang et al. [34] | 2024 | Vietnam | Focal and generalized | 112 | 15 (13.4%) | 54 (48.2%) | 43 (38.4%) | 101 | 15 (14.9%) | 41 (40.6%) | 45 (44.6%) | No significant association with ASM resistance. | 0.15 | 0.287 | 413 |
| Model | OR (95% CI) | Significant? | Heterogeneity (I2) |
|---|---|---|---|
| T vs. C (allele) | 0.95 [0.87–1.05] | No | 64% |
| Recessive (TT vs. TC + CC) | 0.93 [0.81–1.08] | No | 55% |
| Dominant (TT + TC vs. CC) | 0.95 [0.83–1.09] | No | 54% |
| Over-dominant (TC vs. TT + CC) | 1.00 [0.92–1.09] | No | 12% |
| TT vs. CC | 0.92 [0.75–1.13] | No | 64% |
| TT vs. TC | 0.95 [0.83–1.08] | No | 41% |
| TT vs. TC | 0.97 [0.86–1.11] | No | 40% |
| Model | OR (95% CI) | Significant | Heterogeneity (I2) |
|---|---|---|---|
| T vs. C (allele) | 0.98 [0.79–1.21] | No | 87% |
| Recessive (TT vs. TC + CC) | 1.01 [0.72–1.41] | No | 87% |
| Dominant (TT + TC vs. CC) | 0.99 [0.72–1.34] | No | 85% |
| Over-dominant (TC vs. TT + CC) | 0.99 [0.82–1.20] | No | 67% |
| TT vs. CC | 1.01 [0.72–1.41] | No | 79% |
| TT vs. TC | 1.02 [0.87–1.19] | No | 27% |
| TT vs. TC | 1.0 [0.75–1.34] | No | 79% |
| Model | OR (95% CI) | Significant | Heterogeneity (I2) |
|---|---|---|---|
| T vs. C (allele) | 0.97 [0.87–1.09] | No | 43% |
| Recessive (TT vs. TC + CC) | 0.95 [0.81–1.13] | No | 46% |
| Dominant (TT + TC vs. CC) | 0.99 [0.85–1.16] | No | 0% |
| Over-dominant (TC vs. TT + CC) | 1.04 [0.92–1.17] | No | 8% |
| TT vs. CC | 0.96 [0.78–1.18] | No | 30% |
| TT vs. TC | 0.95 [0.80–1.12] | No | 39% |
| TT vs. TC | 1.05 [0.89–1.23] | No | 0% |
Disclaimer/Publisher’s Note: The statements, opinions and data contained in all publications are solely those of the individual author(s) and contributor(s) and not of MDPI and/or the editor(s). MDPI and/or the editor(s) disclaim responsibility for any injury to people or property resulting from any ideas, methods, instructions or products referred to in the content. |
© 2025 by the authors. Licensee MDPI, Basel, Switzerland. This article is an open access article distributed under the terms and conditions of the Creative Commons Attribution (CC BY) license (https://creativecommons.org/licenses/by/4.0/).
Share and Cite
Daškevičiūtė, A.; Zaboras, E.; Navalinskas, J.; Baronas, K.; Jasionis, A.; Navickienė, E.; Mameniškienė, R. A Systematic Review of ABCB1 Polymorphisms and Antiseizure Medication Resistance: Insights from Effect Size and Study Power Analysis. Int. J. Mol. Sci. 2025, 26, 5548. https://doi.org/10.3390/ijms26125548
Daškevičiūtė A, Zaboras E, Navalinskas J, Baronas K, Jasionis A, Navickienė E, Mameniškienė R. A Systematic Review of ABCB1 Polymorphisms and Antiseizure Medication Resistance: Insights from Effect Size and Study Power Analysis. International Journal of Molecular Sciences. 2025; 26(12):5548. https://doi.org/10.3390/ijms26125548
Chicago/Turabian StyleDaškevičiūtė, Aurelija, Edgaras Zaboras, Jonas Navalinskas, Karolis Baronas, Arminas Jasionis, Eglė Navickienė, and Rūta Mameniškienė. 2025. "A Systematic Review of ABCB1 Polymorphisms and Antiseizure Medication Resistance: Insights from Effect Size and Study Power Analysis" International Journal of Molecular Sciences 26, no. 12: 5548. https://doi.org/10.3390/ijms26125548
APA StyleDaškevičiūtė, A., Zaboras, E., Navalinskas, J., Baronas, K., Jasionis, A., Navickienė, E., & Mameniškienė, R. (2025). A Systematic Review of ABCB1 Polymorphisms and Antiseizure Medication Resistance: Insights from Effect Size and Study Power Analysis. International Journal of Molecular Sciences, 26(12), 5548. https://doi.org/10.3390/ijms26125548


