
Fecal Microbiota Transplantation from Mice Receiving Magnetic Mitohormesis Treatment Reverses High-Fat Diet-Induced Metabolic and Osteogenic Dysfunction
 , , ,
, , ,  , , , , ,
  , ,
, , 
Abstract

1. Introduction
2. Results
2.1. Study Workflow and Weight Assessment
2.2. Modification of Metabolism-Regulating Gene Expression in White and Brown Adipose Tissues
2.3. Modulation of the Oxidative Character of Muscle

2.4. Changes in Bone Density
2.5. Specific Bone Indices
2.6. Blood Glucose Tolerance and Metabolic Biomarkers in HFD Mice
2.7. Modulation of Gut Firmicutes/Bacteroidetes and Deferribacteres/Bacteroidetes Ratios
2.8. Modulation of Hepatic Lipidome
3. Discussion
3.1. Modulation of Adipose, Bone, and Muscle Phenotypes
3.2. Modulation of Blood Adipokines, Angiogenic Factors, and Glucose Handling
3.3. Firmicutes/Bacteroidetes (F/B) and Deferribacteres/Bacteroidetes (D/B) Ratios
3.4. Hepatic Lipidome

| Figure | Objective | Analysis/Statistical Test | Findings | Ref. | |
|---|---|---|---|---|---|
| Donor Mice | FMT Recipient HFD Mice | ||||
| 1 | GROWTH RATE | Weight | No weight difference between groups (n = 10 per group) | Continual weight increment in HFD mice. PEMF-FMT showed the greatest stabilization of weight (n = 12–15 per group) | [84] |
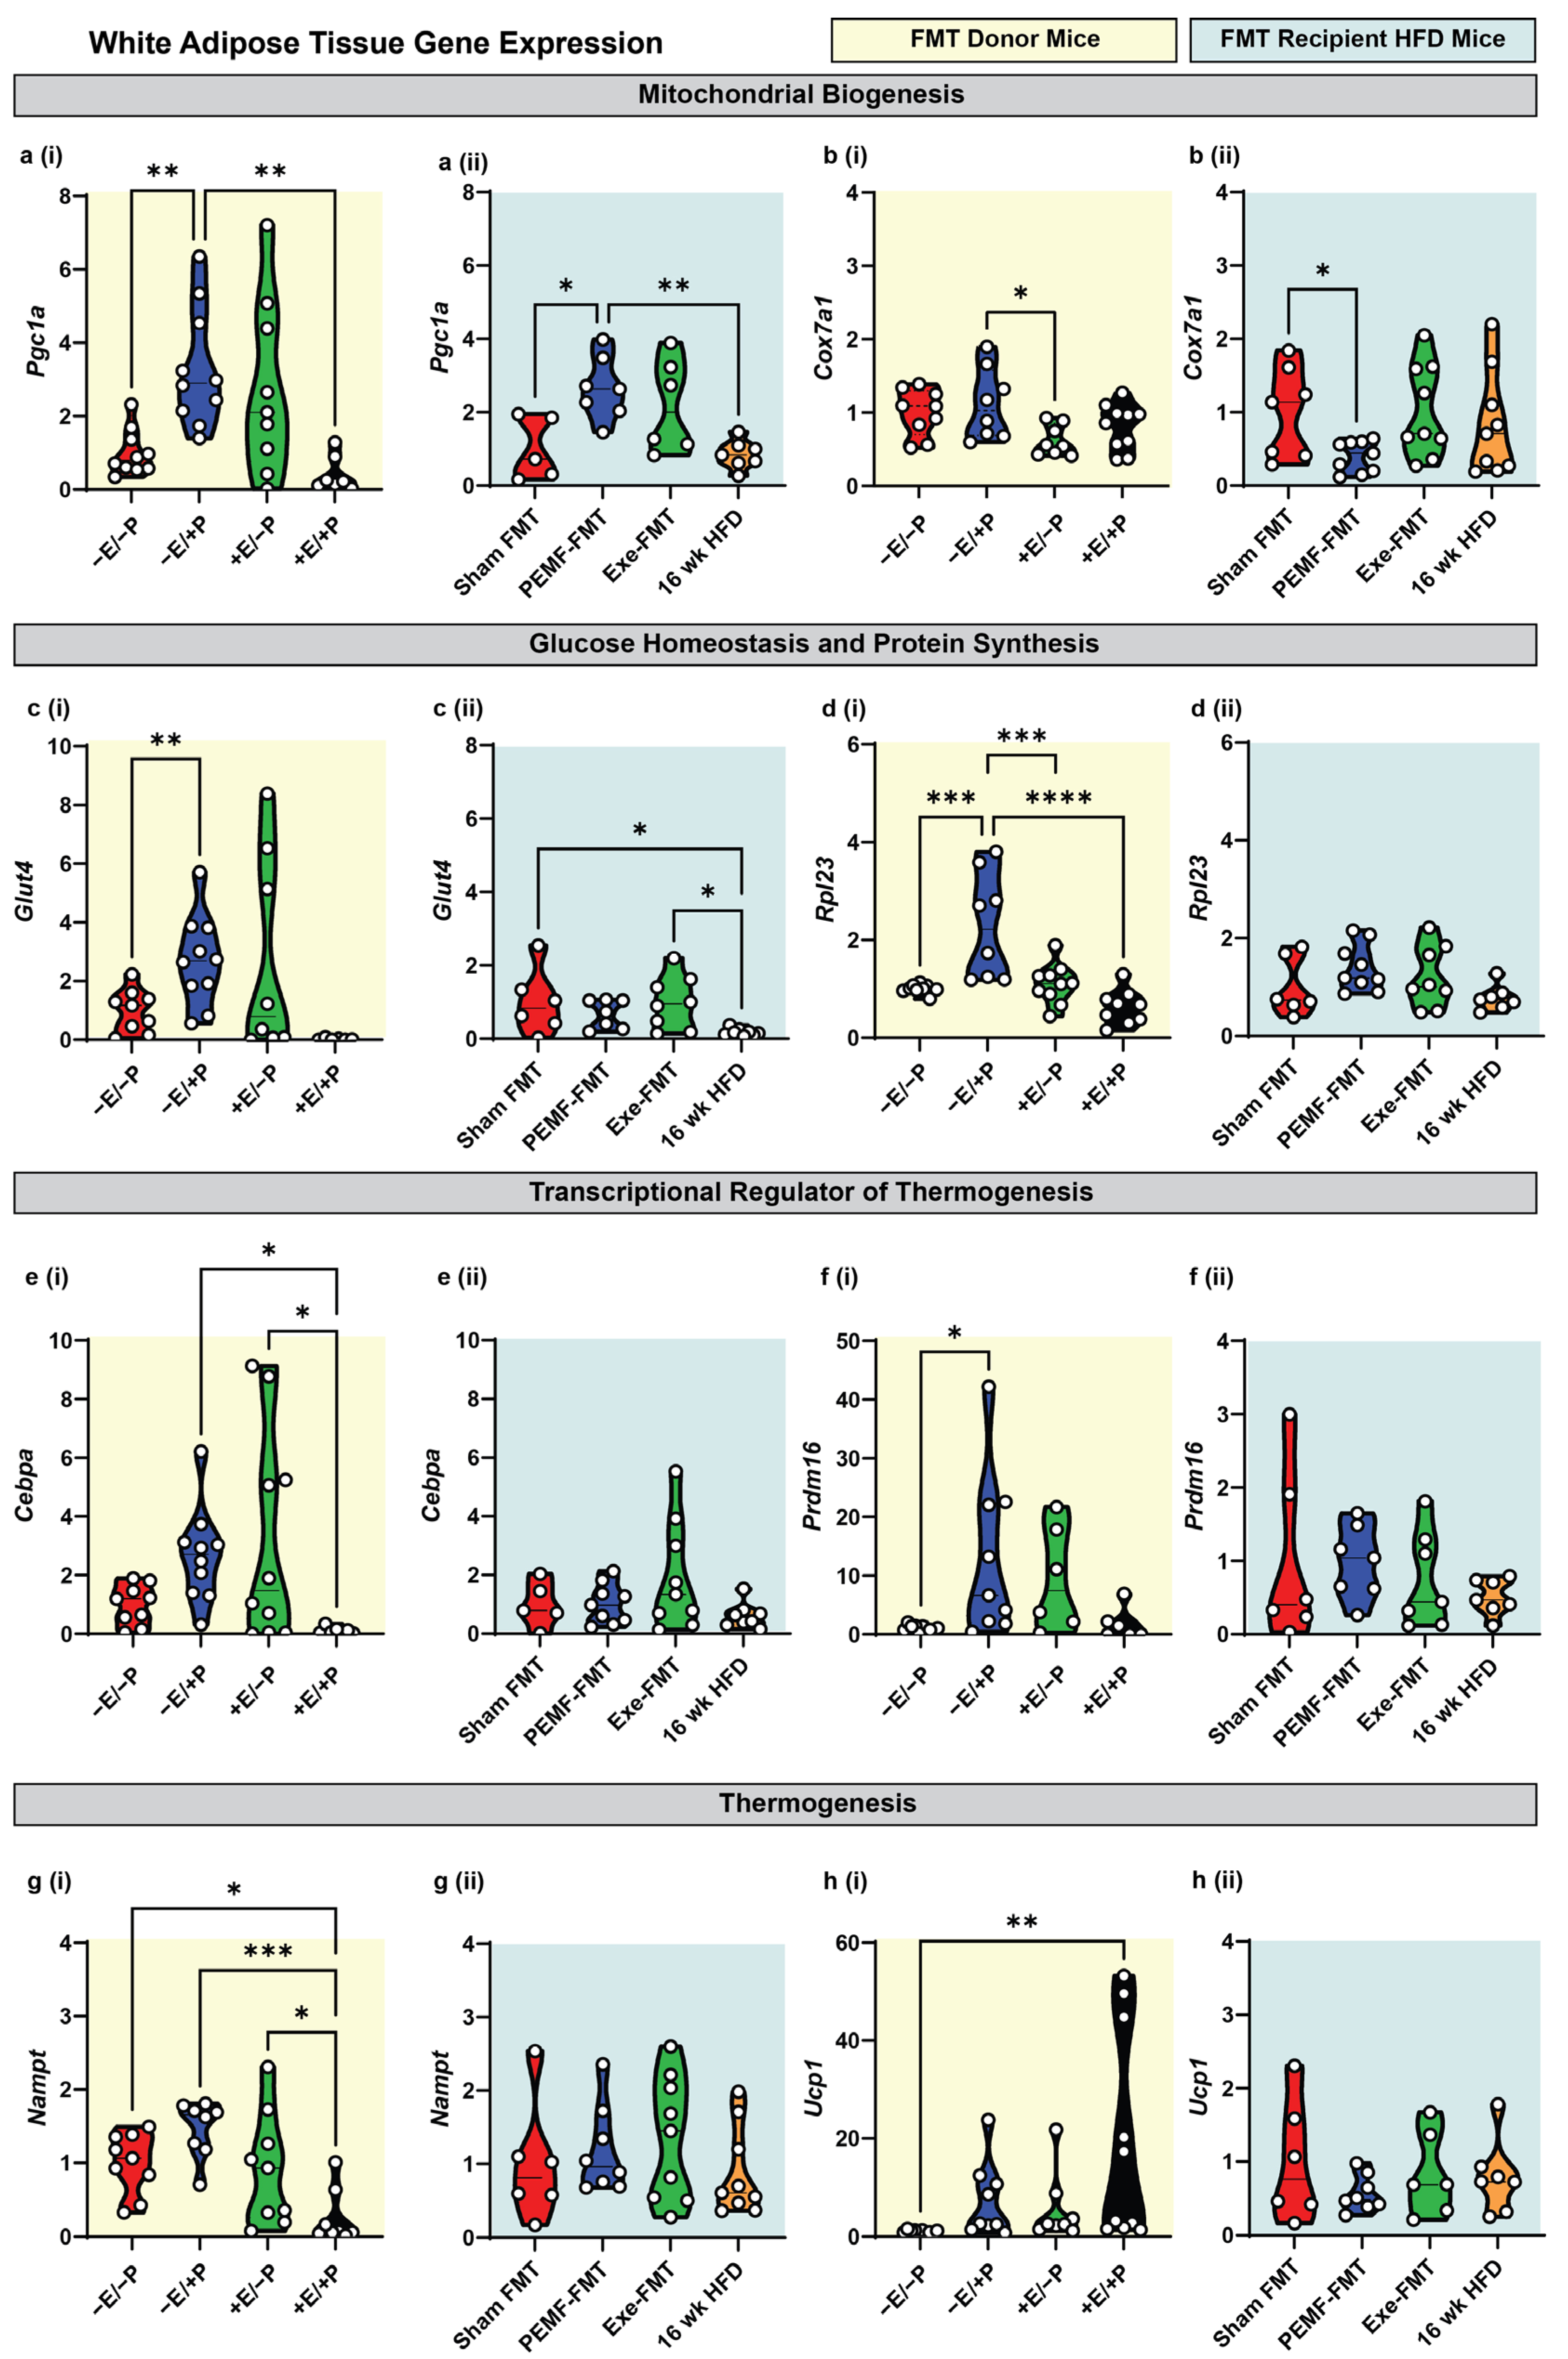
| 2 | WHITE ADIPOSE TISSUE Expression of Metabolic Genes | qPCR One-way ANOVA (Sidak’s test) | PEMF vs. control * Significant upregulation: Pgc1a, Glut4, Rpl23, and Prdm16 Modest upregulation: Cebpa and Ucp1 (n = 6–10 per group) * p < 0.05 | PEMF-FMT vs. Sham FMT * Significant changes: Pgc1a upregulation Cox7a1 downregulation (n = 7–10 per group) * p < 0.05 | [15,31,68,73,74] |
| 3 | BROWN ADIPOSE TISSUE Expression of Metabolic Genes | qPCR One-way ANOVA (Sidak’s test) | PEMF vs. control * Significant upregulation: Pgc1a, Cox7a1, Glut4, Rpl23, (n = 6–10 per group) * p < 0.05 | PEMF-FMT vs. Sham FMT * Significant upregulation: Pgc1a, Cox7a1, Glut4, Rpl23, (n = 7–10 per group) * p < 0.05 | |
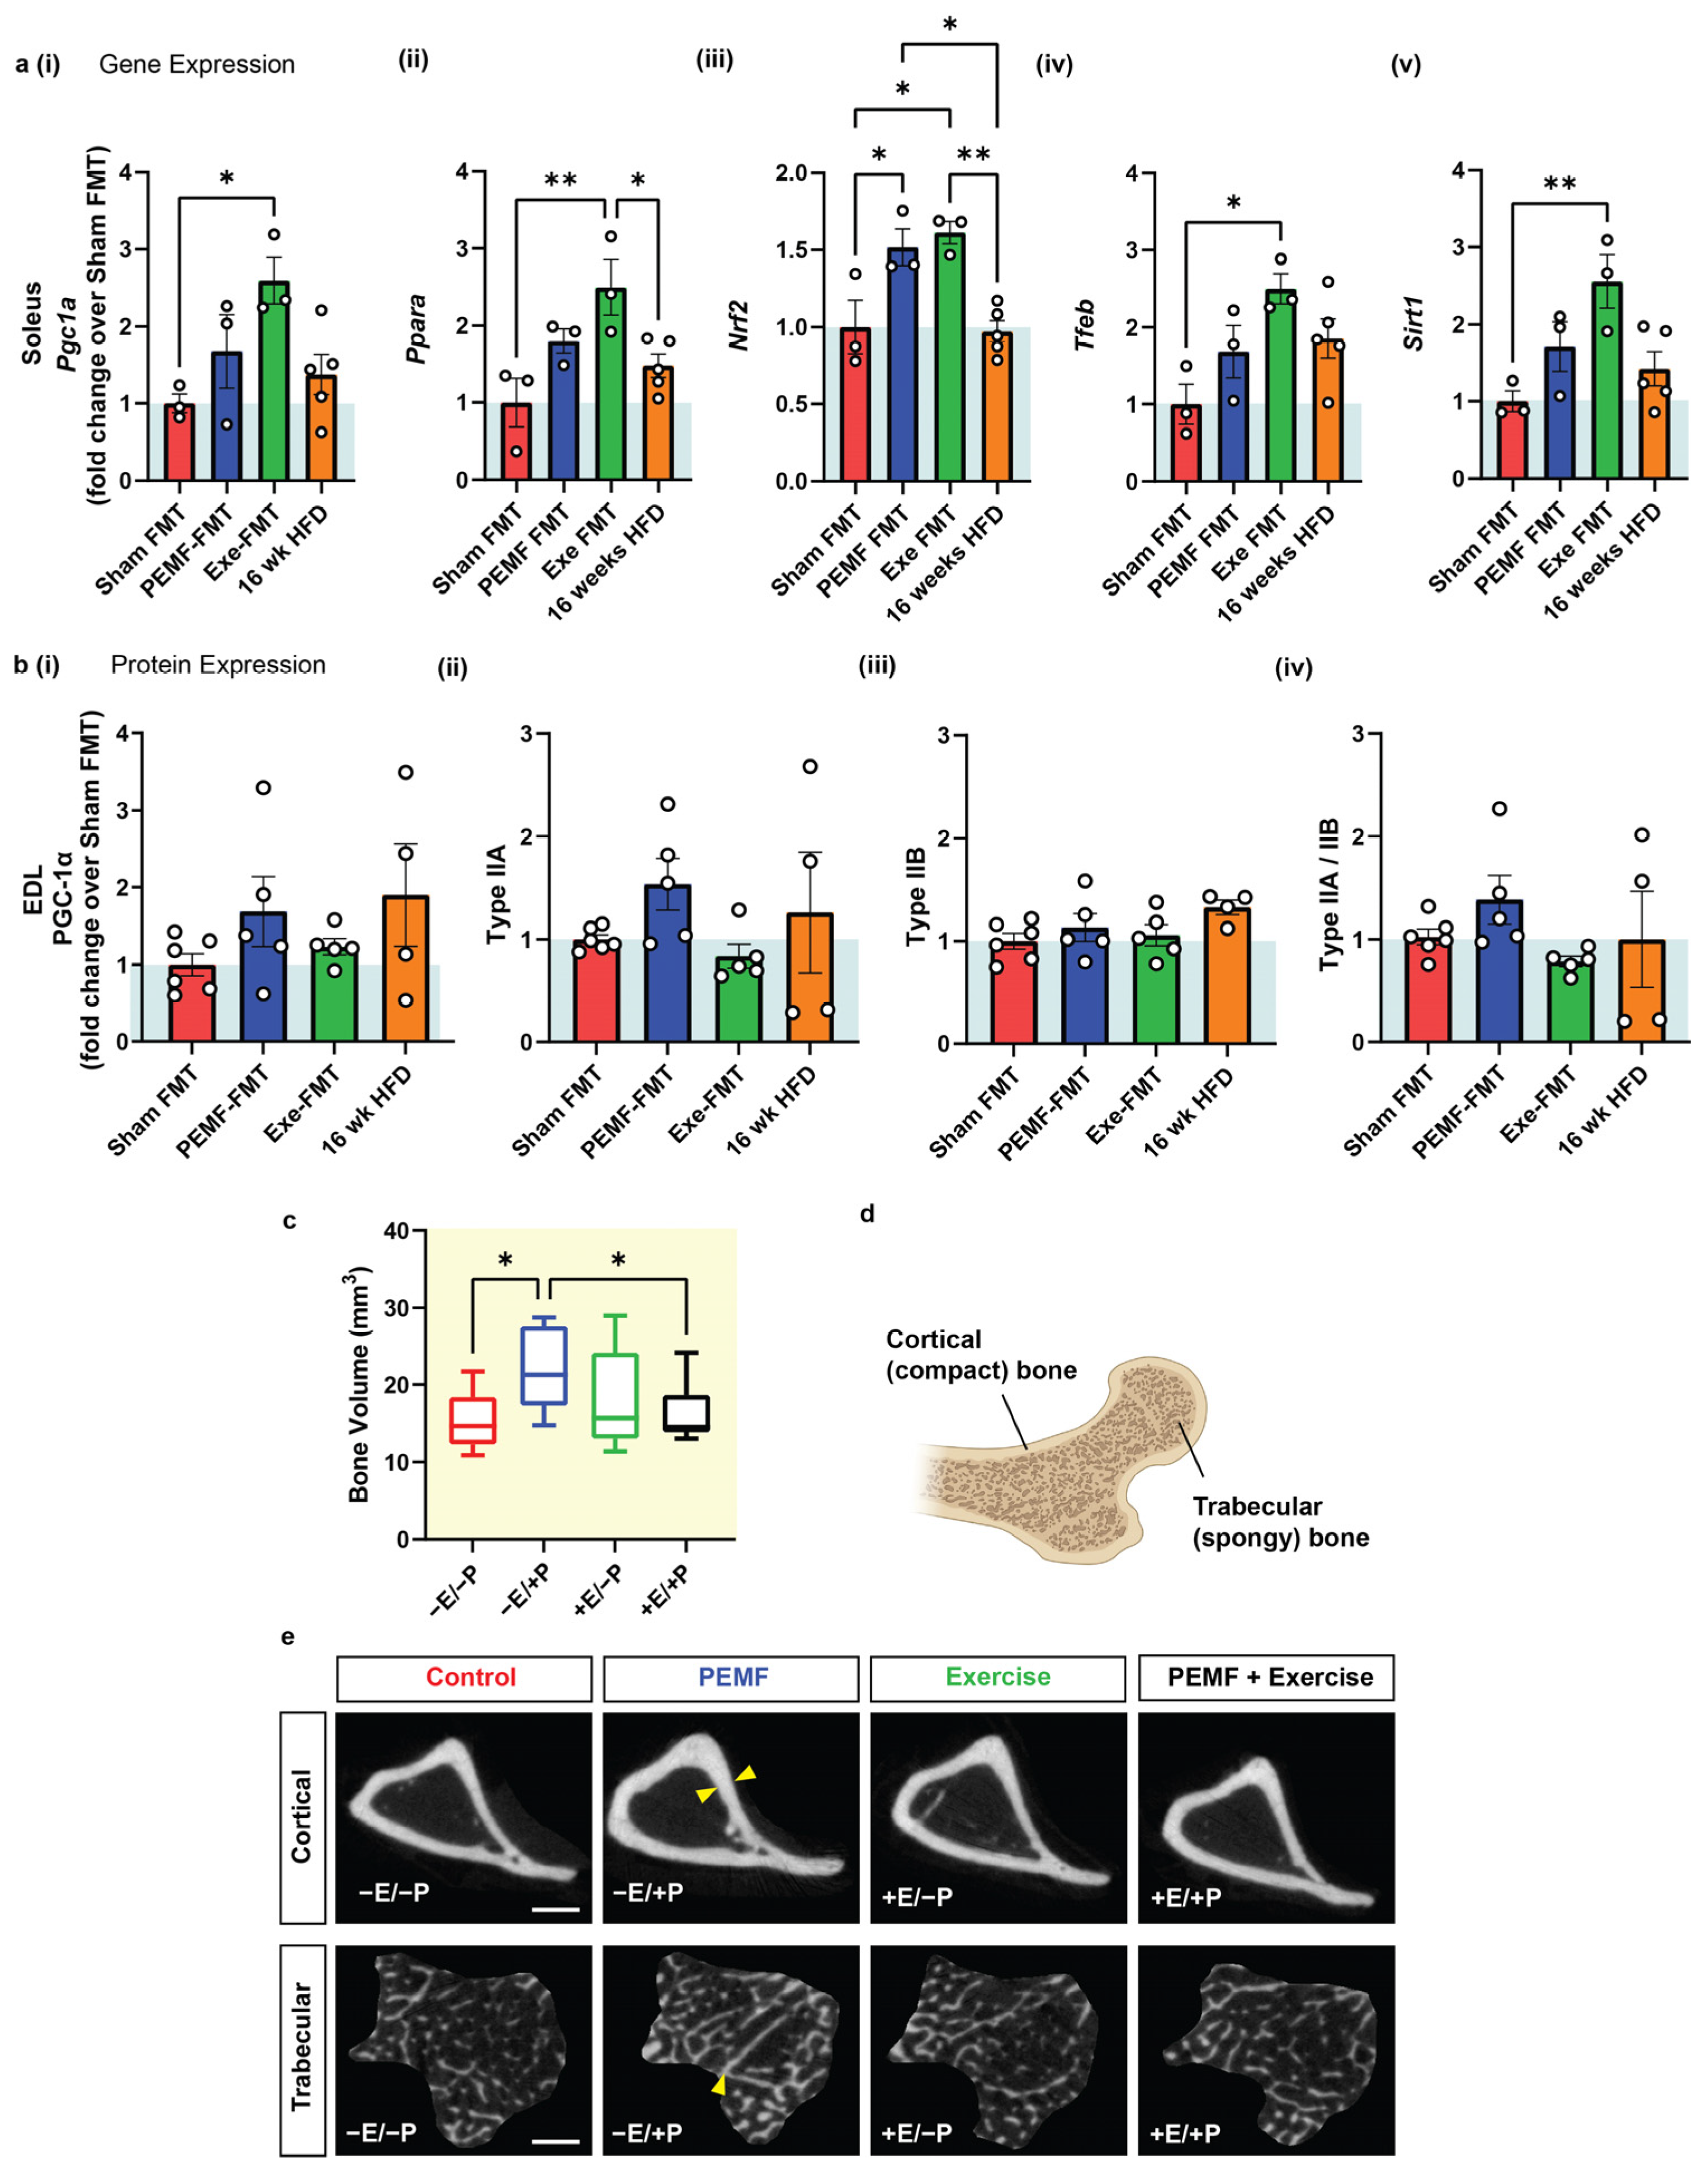
| 4 | MUSCLE Expression of Metabolic Genes | SOLEUS qPCR One-way ANOVA (Sidak’s test) | Not applicable Note: PEMF was previously shown to upregulate Pgc1a expression [15]. | PEMF-FMT vs. Sham FMT * Significant effect: Nrf2 upregulation Modest effect: Ppara, Pgc1a, Tfeb, and Sirt1 Note: Exercise FMT significantly upregulated gene targets compared to Sham FMT (n = 3–5 per group) * p < 0.05 | [15,30,53,73,77] |
| MUSCLE Protein Expression | EDL Western Blot One-way ANOVA (Sidak’s test) | Not applicable | PEMF-FMT vs. Sham FMT Modest elevation: PGC-1α and Type IIA fibers (n = 4–6 per group) | ||
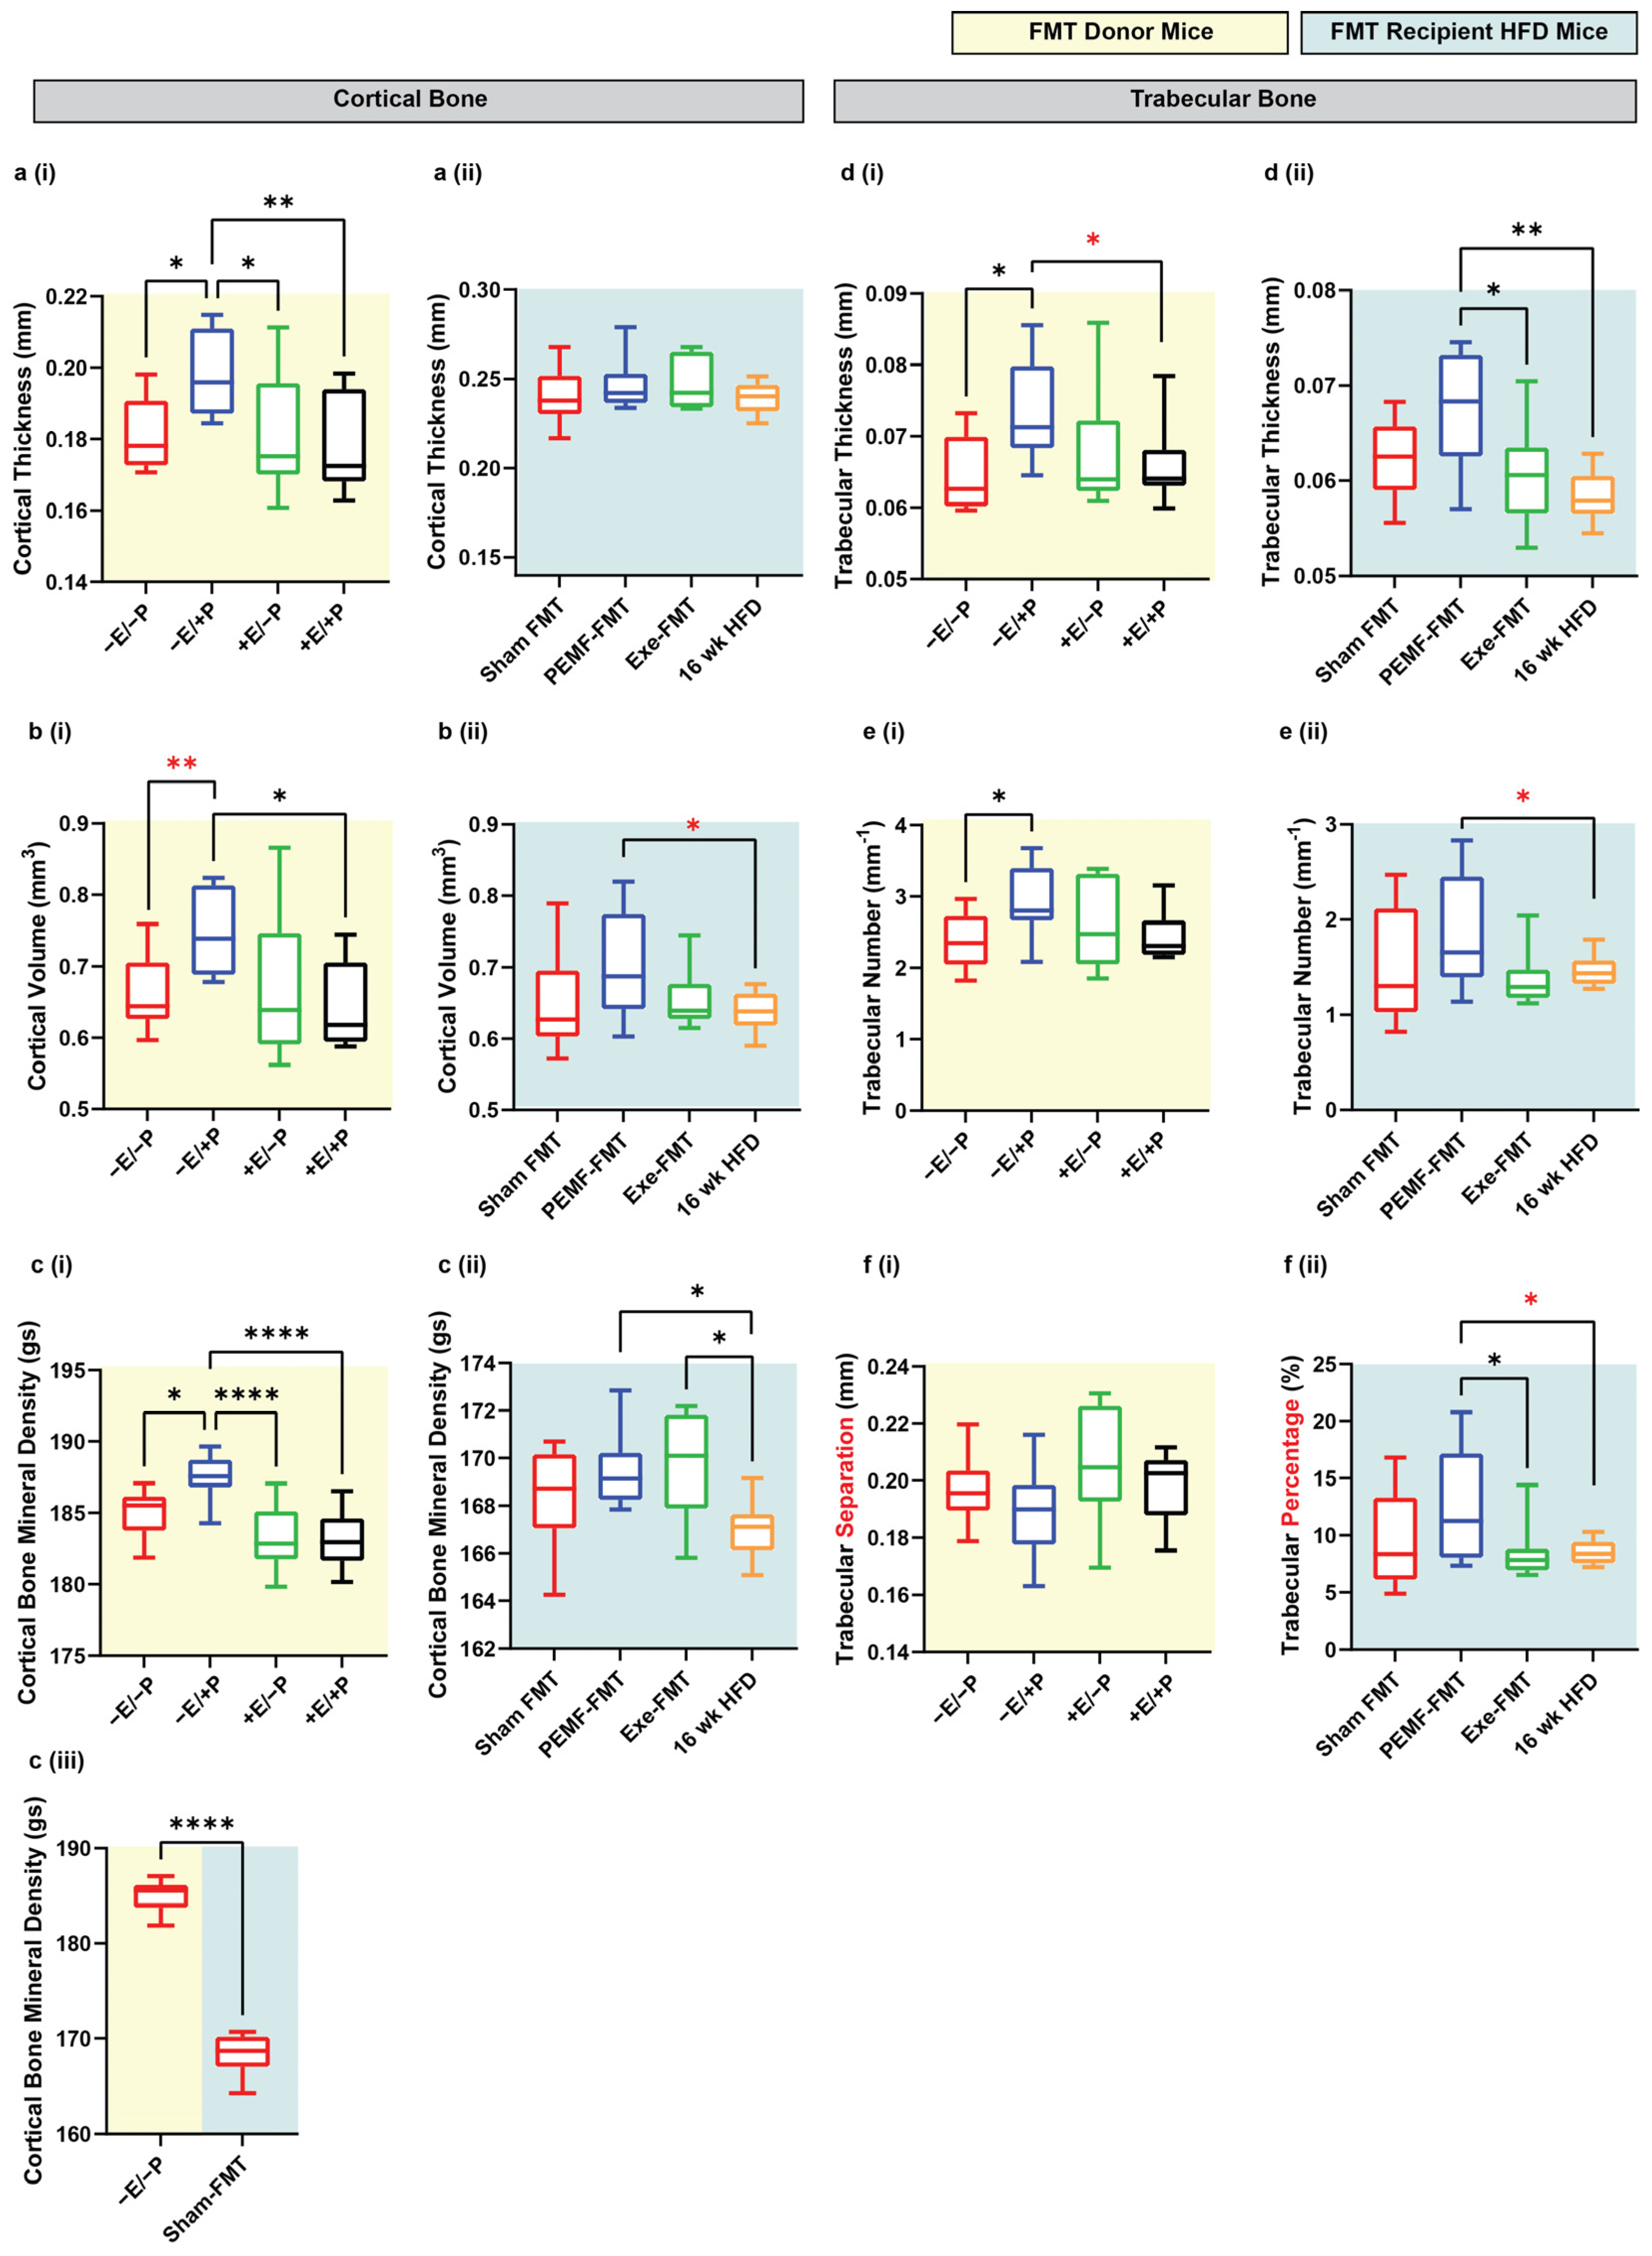
| 4 & 5 | BONE DENSITY | Micro-CT One-way ANOVA (Sidak’s test) | PEMF vs. control * Significant bone fortification: Cortical: thickness, volume, and BMD Trabecular: thickness and number (n = 10 per group) * p < 0.05 | PEMF-FMT vs. 16 wk HFD mice * Significant bone fortification: Cortical: volume and BMD Trabecular: thickness, number, and percentage Note: Cortical BMD was also significantly higher in Exercise-FMT vs. HFD, but not in Sham-FMT vs. HFD. (n = 8–10 per group) * p < 0.05 | [54,78] |
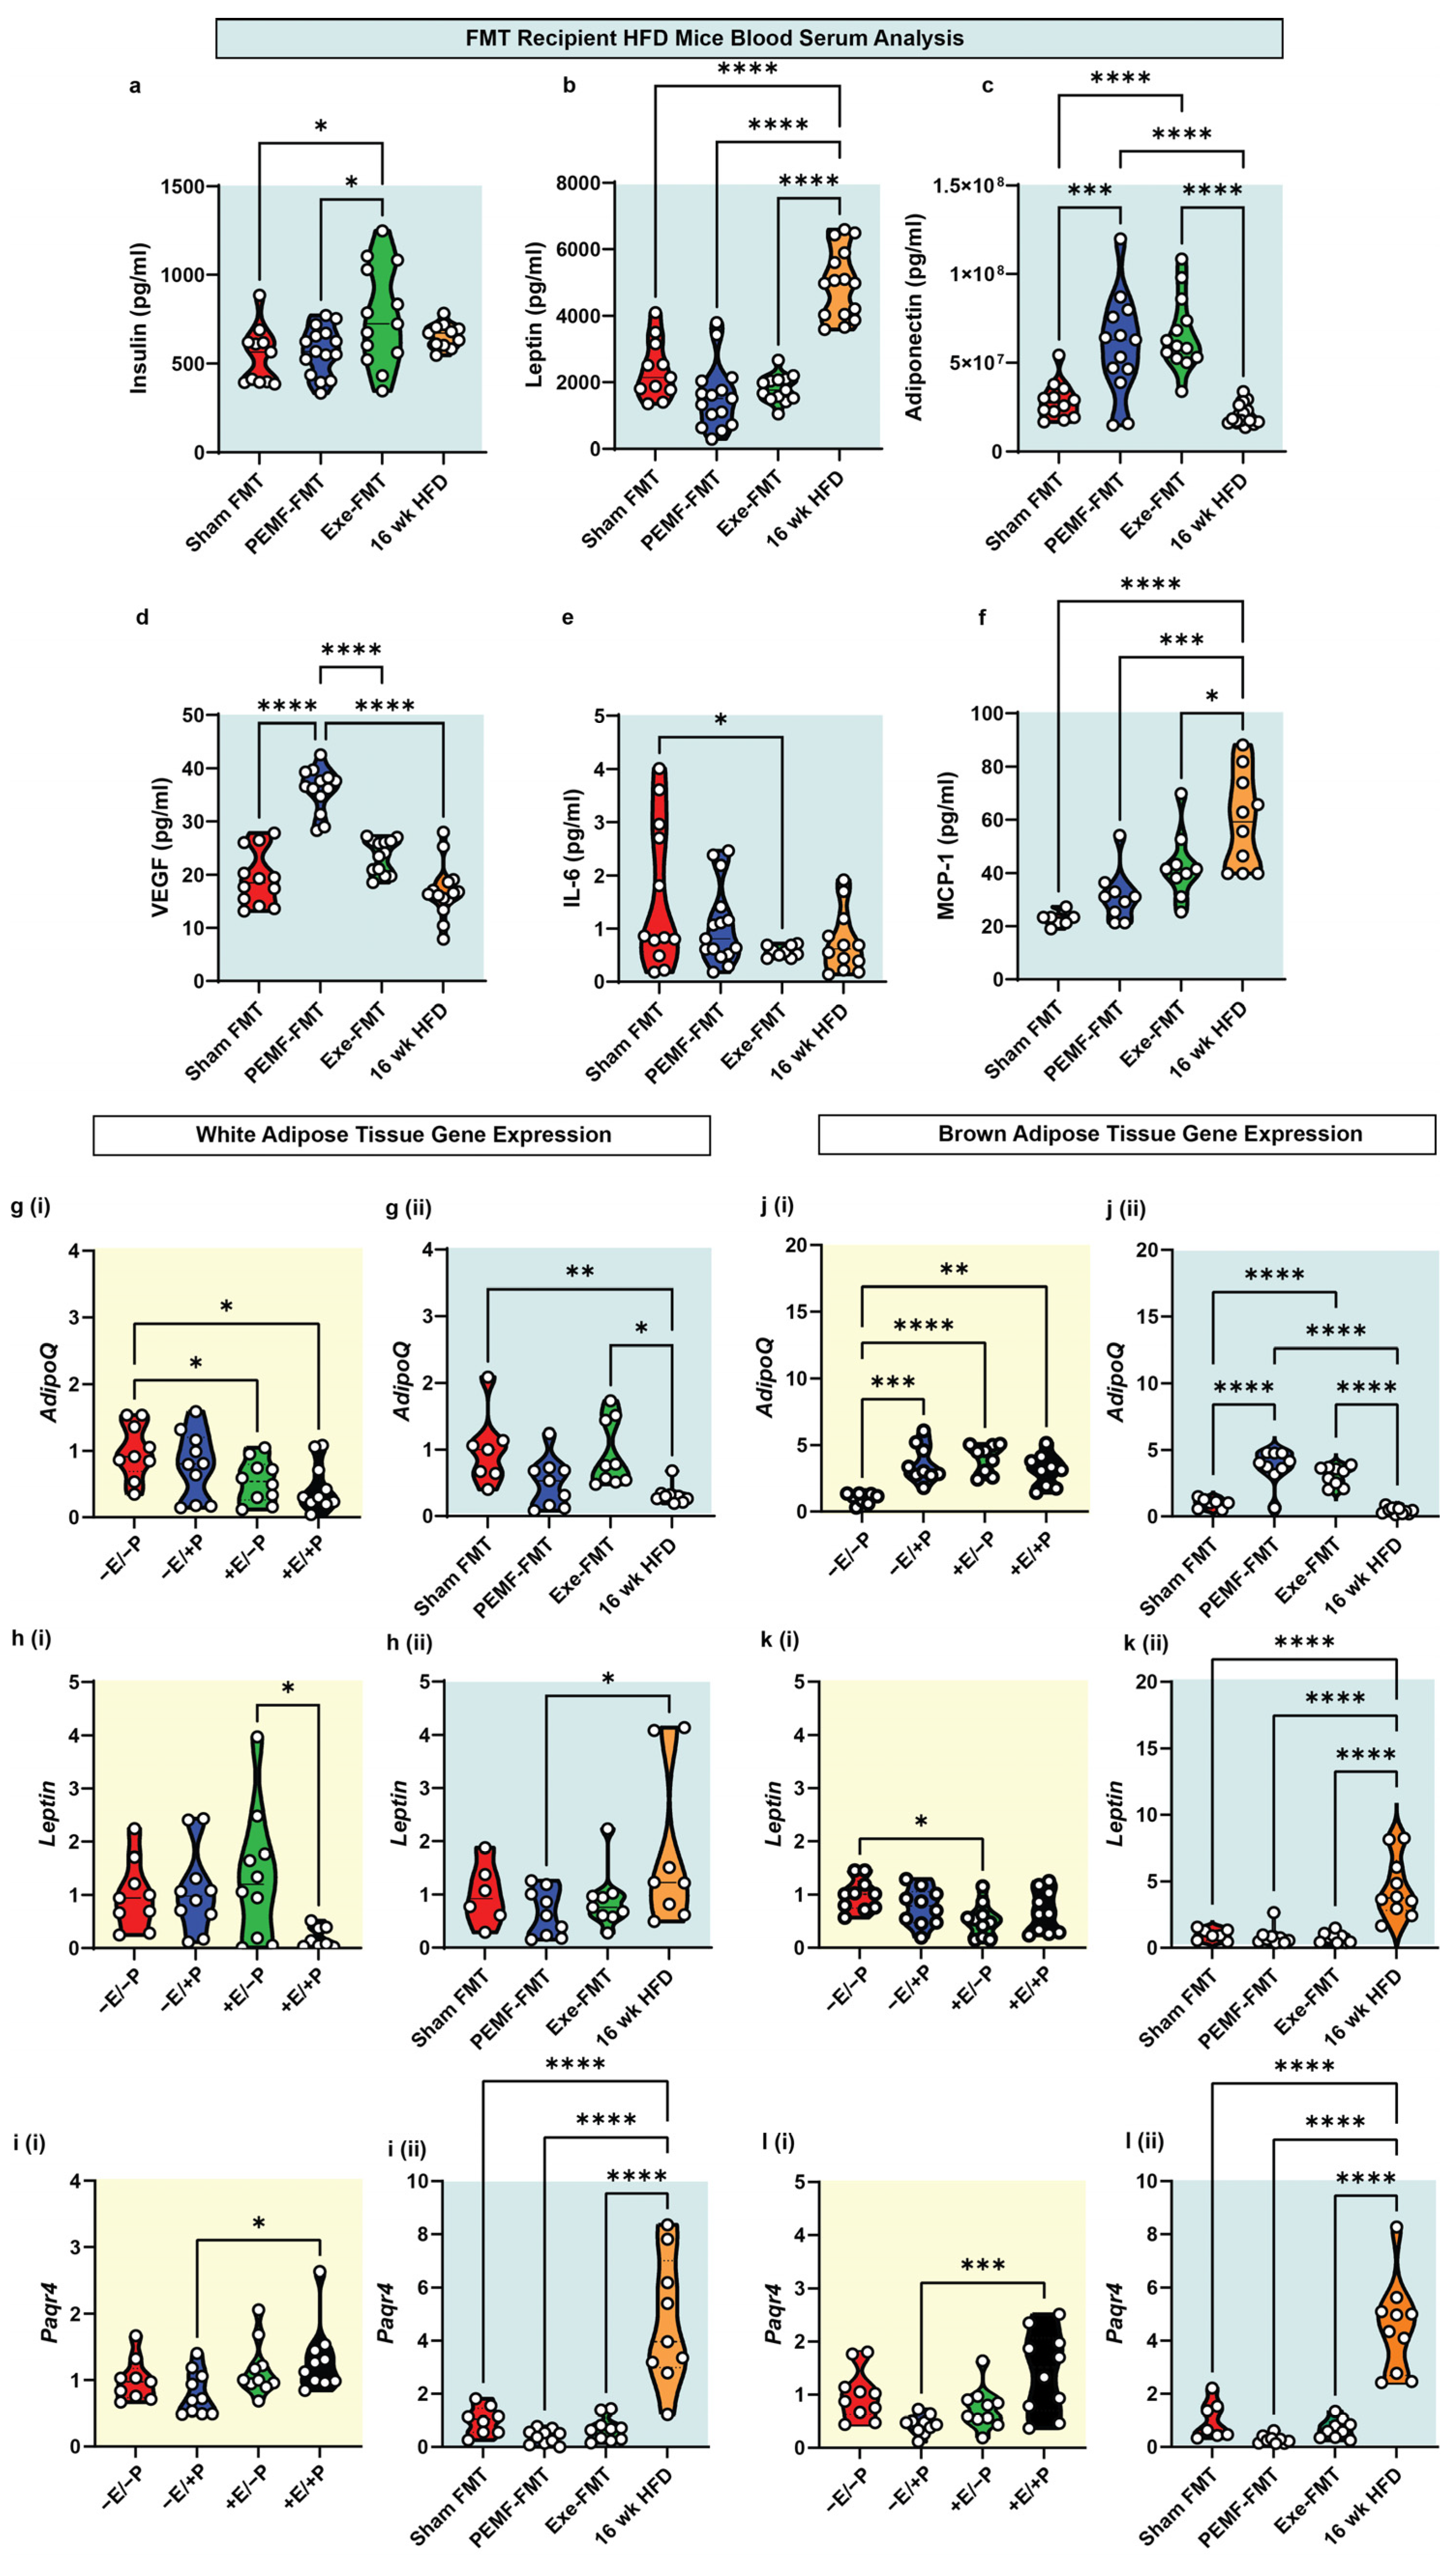
| 6 | BLOOD BIOMARKERS Metabolic Biomarkers | ELISA and Multiplex assay One-way ANOVA (Sidak’s test) | Not applicable | PEMF-FMT vs. Sham FMT * Significant upregulation: Adiponectin and VEGF Modest downregulation: Leptin Note: Exercise-FMT significantly increased insulin and adiponectin levels compared to Sham FMT. (n = 10–15 per group) * p < 0.05 | [82,83,87,88,91] |
| WHITE ADIPOSE TISSUE Expression of Energy Homeostatic Genes | qPCR One-way ANOVA (Sidak’s test) | PEMF vs. control No observable change: AdipoQ, Leptin, and Paqr4 (n = 9–10 per group) | PEMF-FMT vs. Sham FMT Modest downregulation: AdipoQ, Leptin, and Paqr4 (n = 6–10 per group) | ||
| BROWN ADIPOSE TISSUE Expression of Energy Homeostatic Genes | qPCR One-way ANOVA (Sidak’s test) | PEMF vs. control * Significant upregulation: AdipoQ (n = 9–10 per group) | PEMF-FMT vs. Sham FMT * Significant upregulation: AdipoQ (n = 6–10 per group) | ||
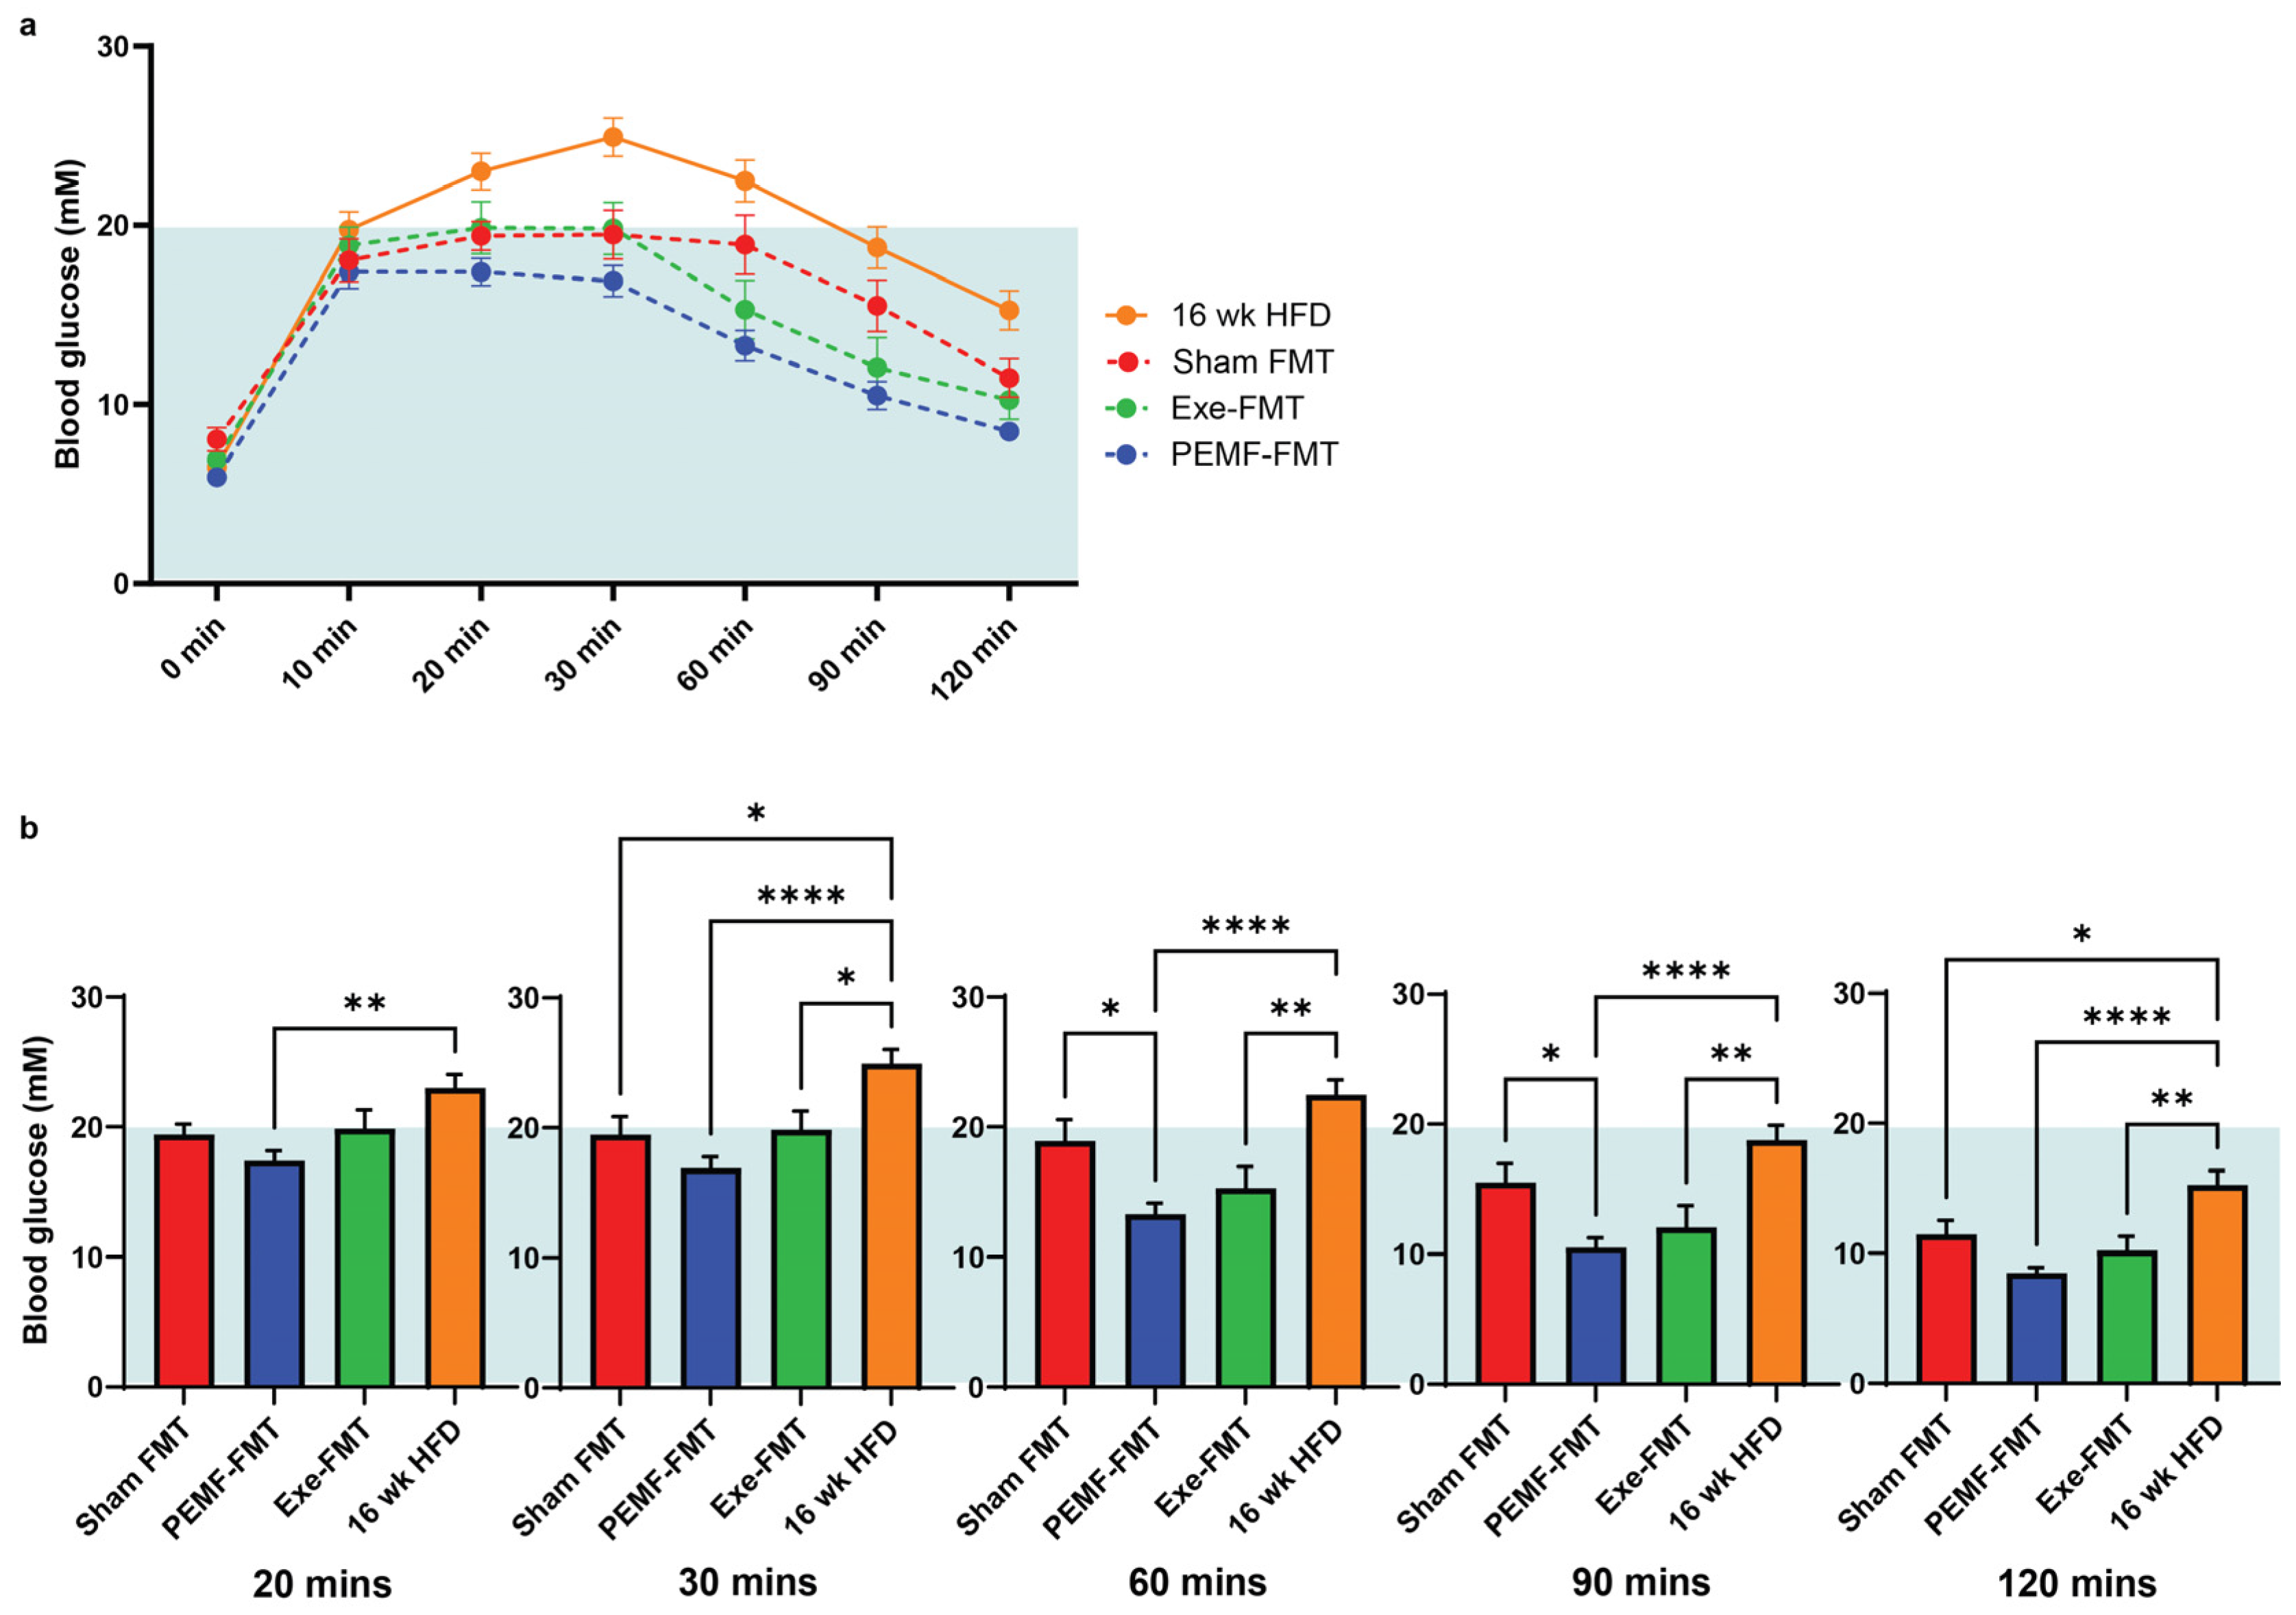
| 7 | INSULIN SENSITIVITY Glucose Tolerance Test | IPGTT One-way ANOVA (Sidak’s test) | Not applicable | PEMF-FMT vs. Sham FMT Prompt normalization of blood glucose: * Significant difference at 60 min and 90 min post glucose challenge (n = 12–15 per group) * p < 0.05 | [82,83,84] |
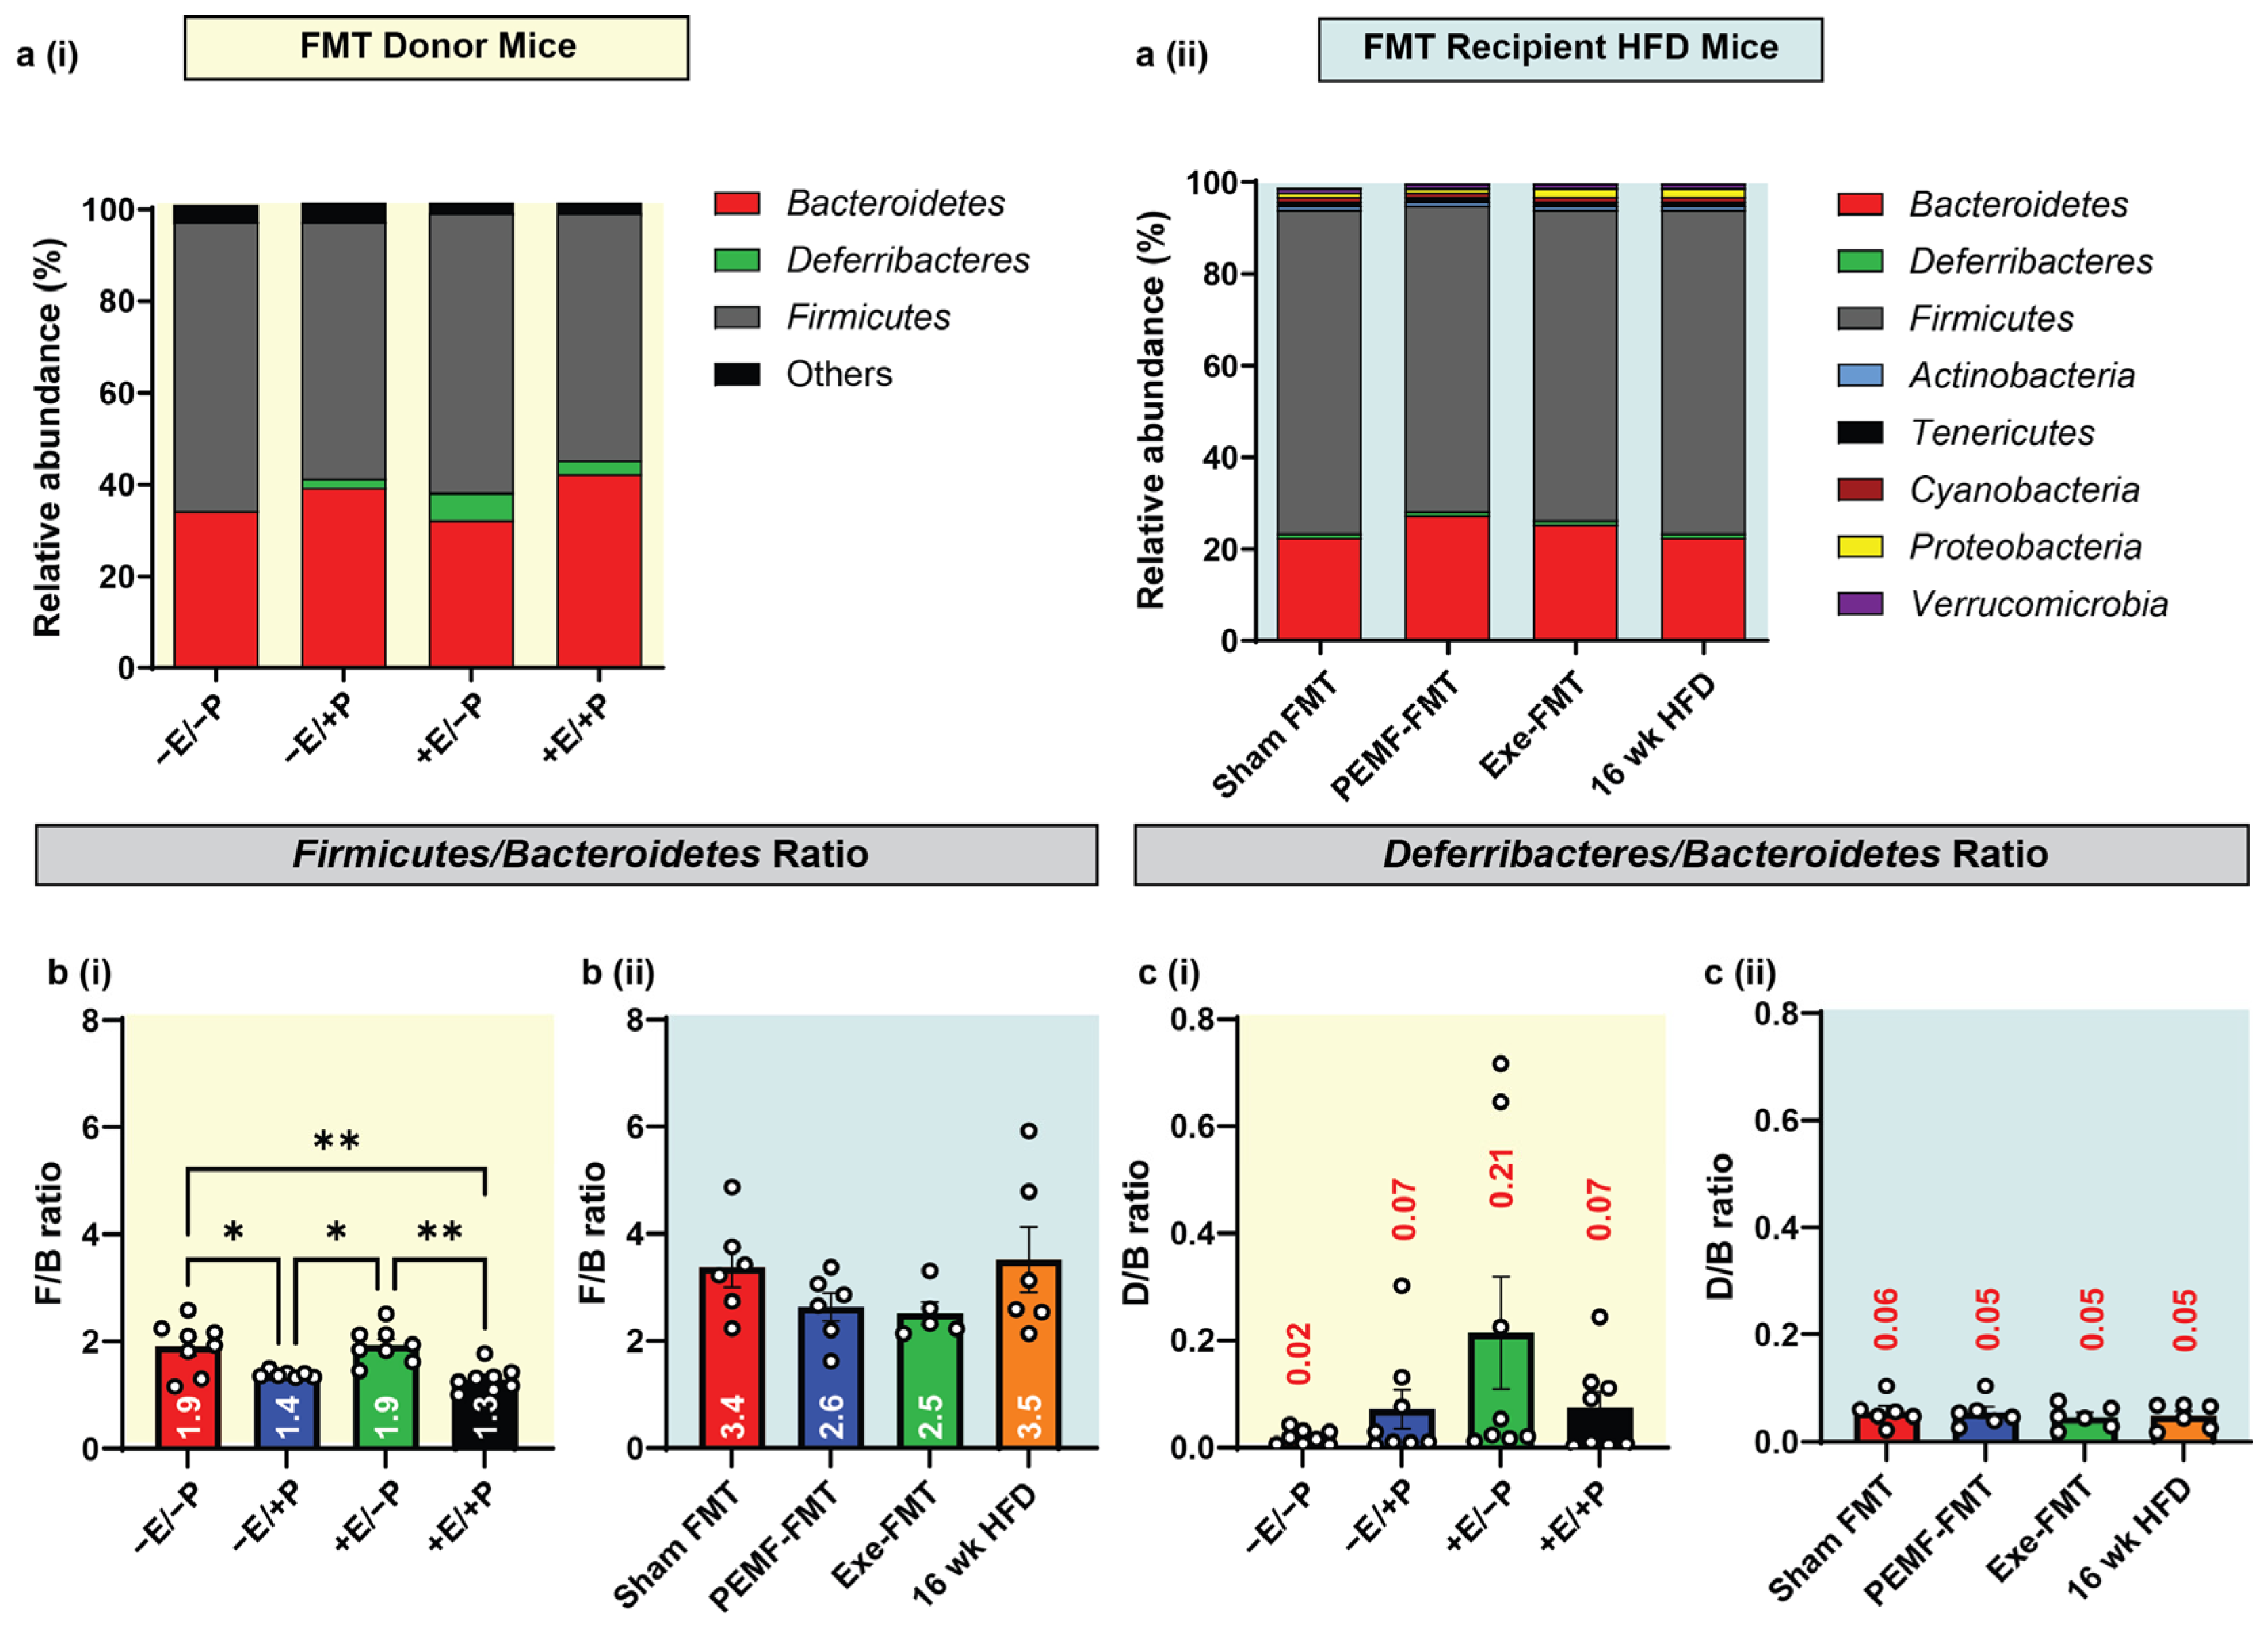
| 8 | MICROBIOME DIVERSITY AND COMPOSITION Firmicutes-to-Bacteroidetes (F/B) ratio. | 16S rRNA gene sequencing One-way ANOVA (Sidak’s test) | PEMF vs. control * Significant effect: Lower F/B Ratio (1.4 vs. 1.9) (n = 4–8 per group) * p < 0.05 | PEMF-FMT vs. Sham FMT Modest effect: Lower F/B Ratio (2.6 vs. 3.4) (n = 4–8 per group) * p < 0.05 | [93,95] |
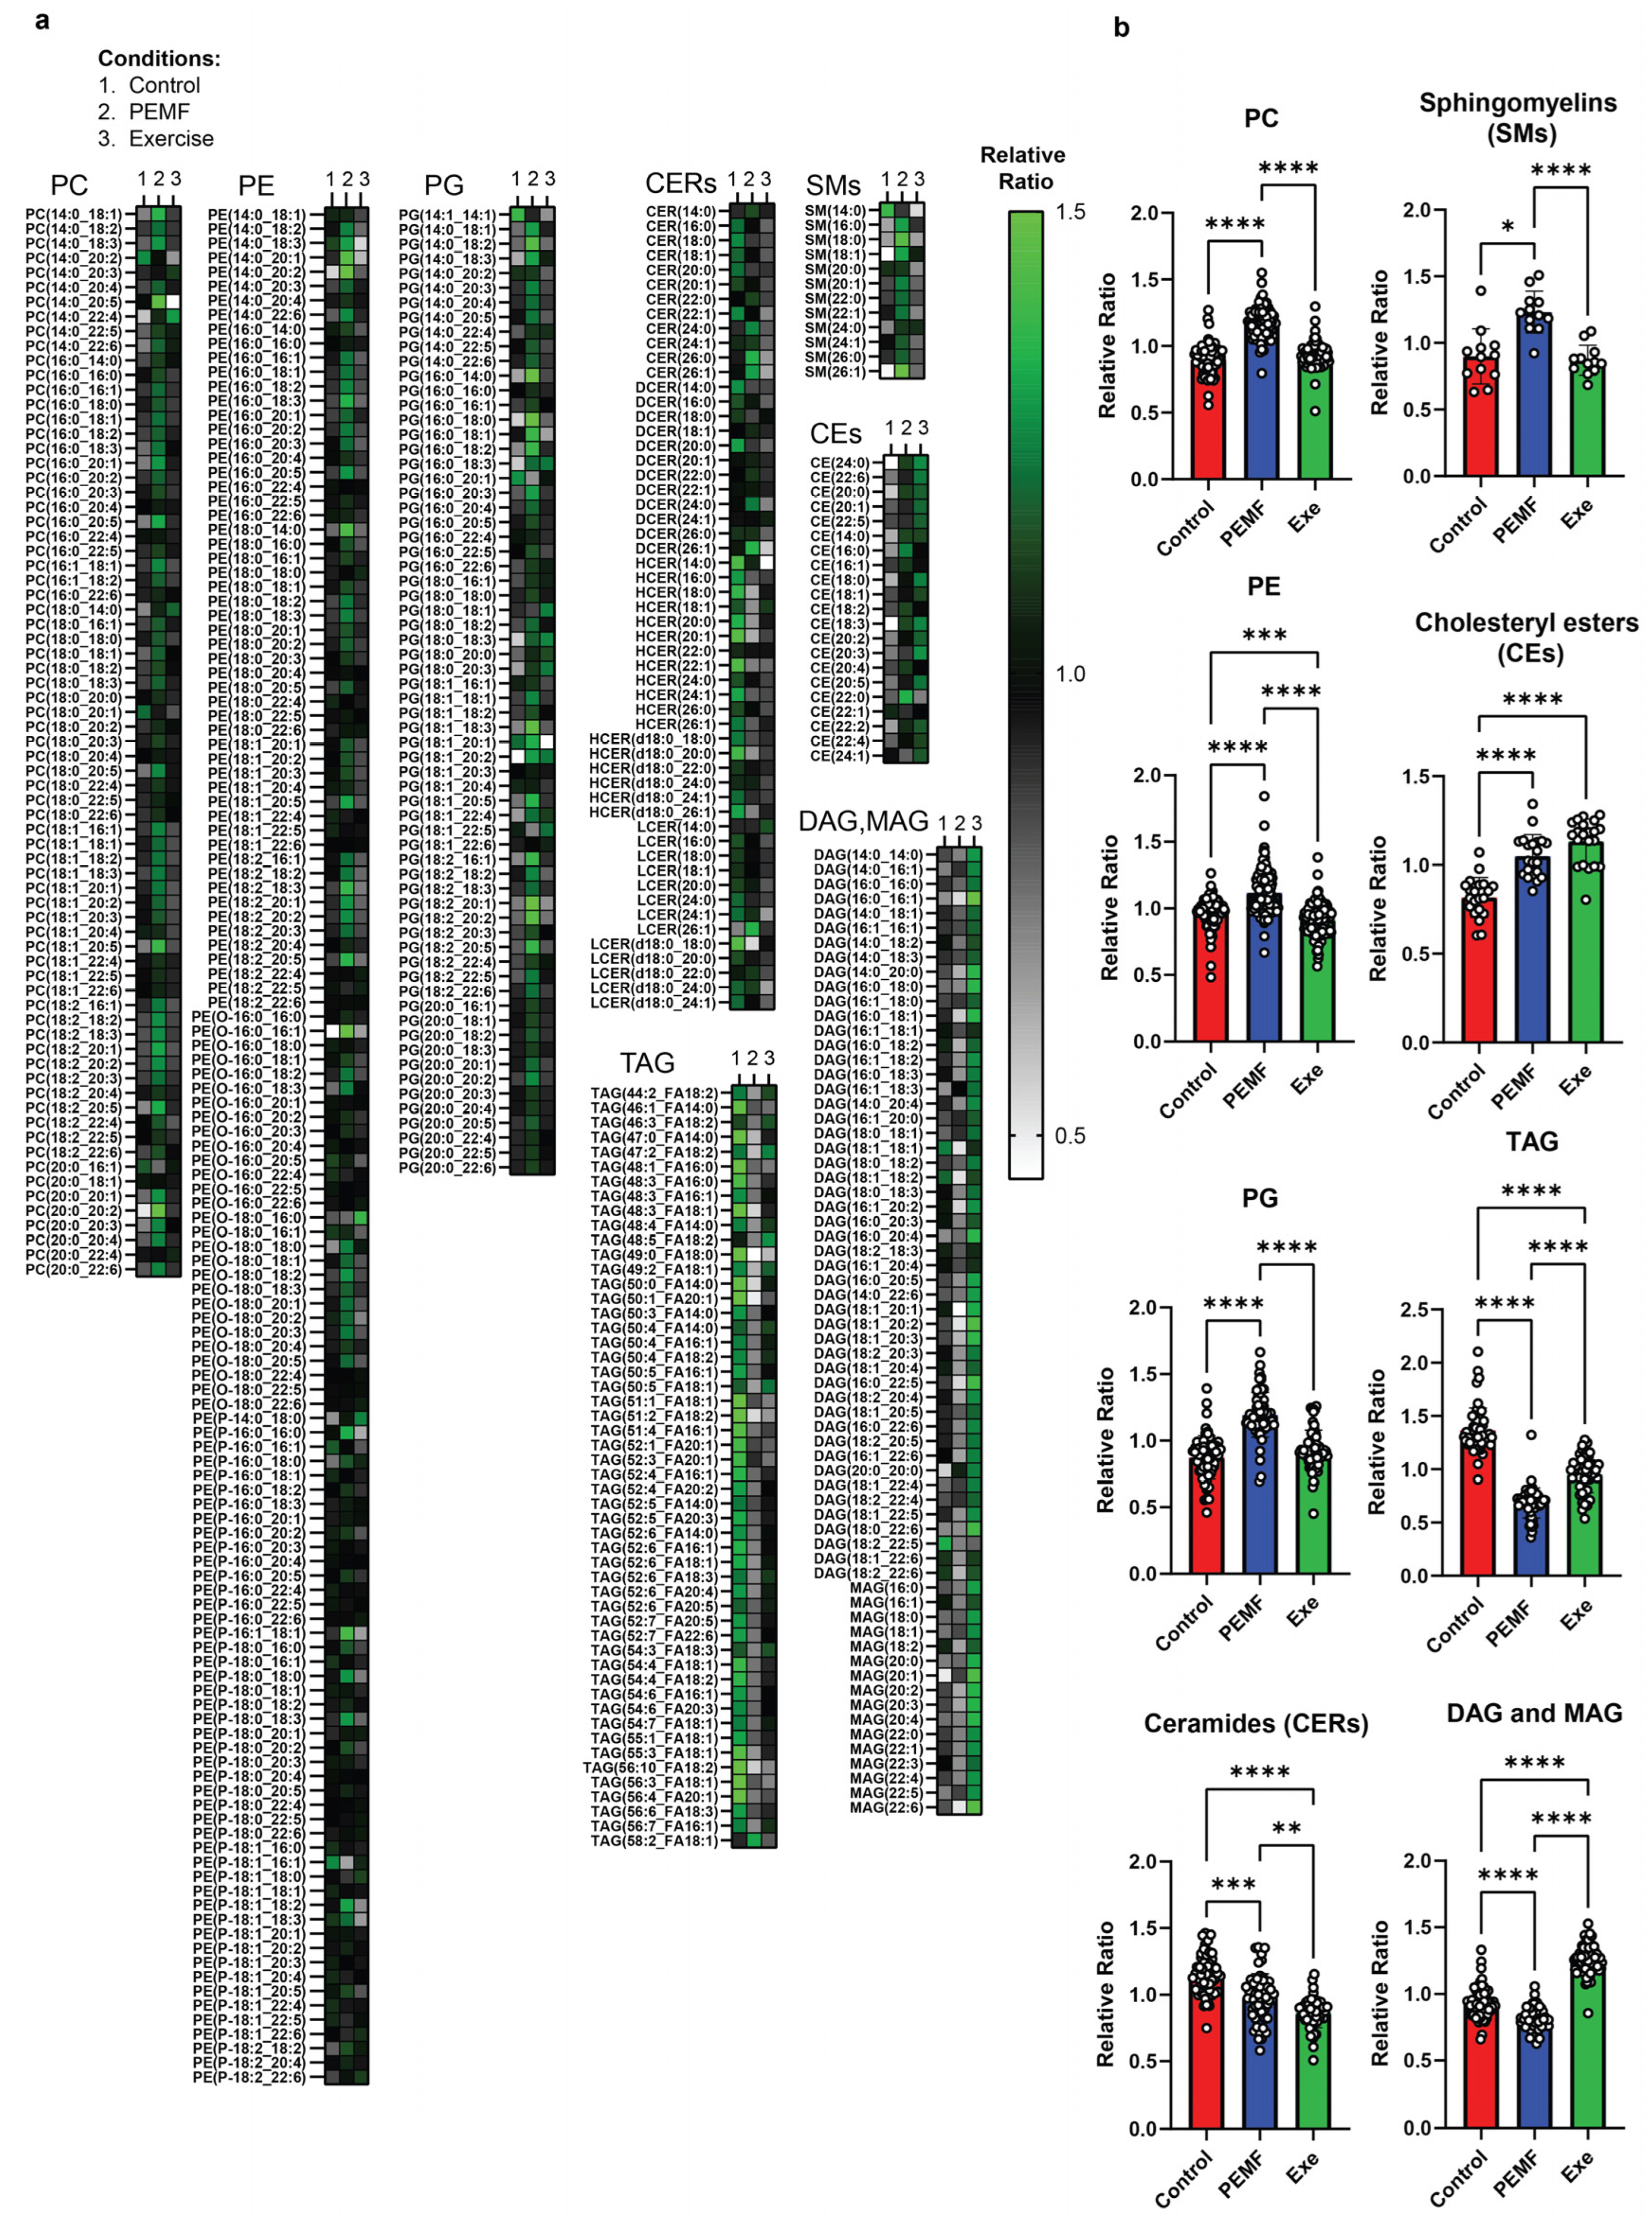
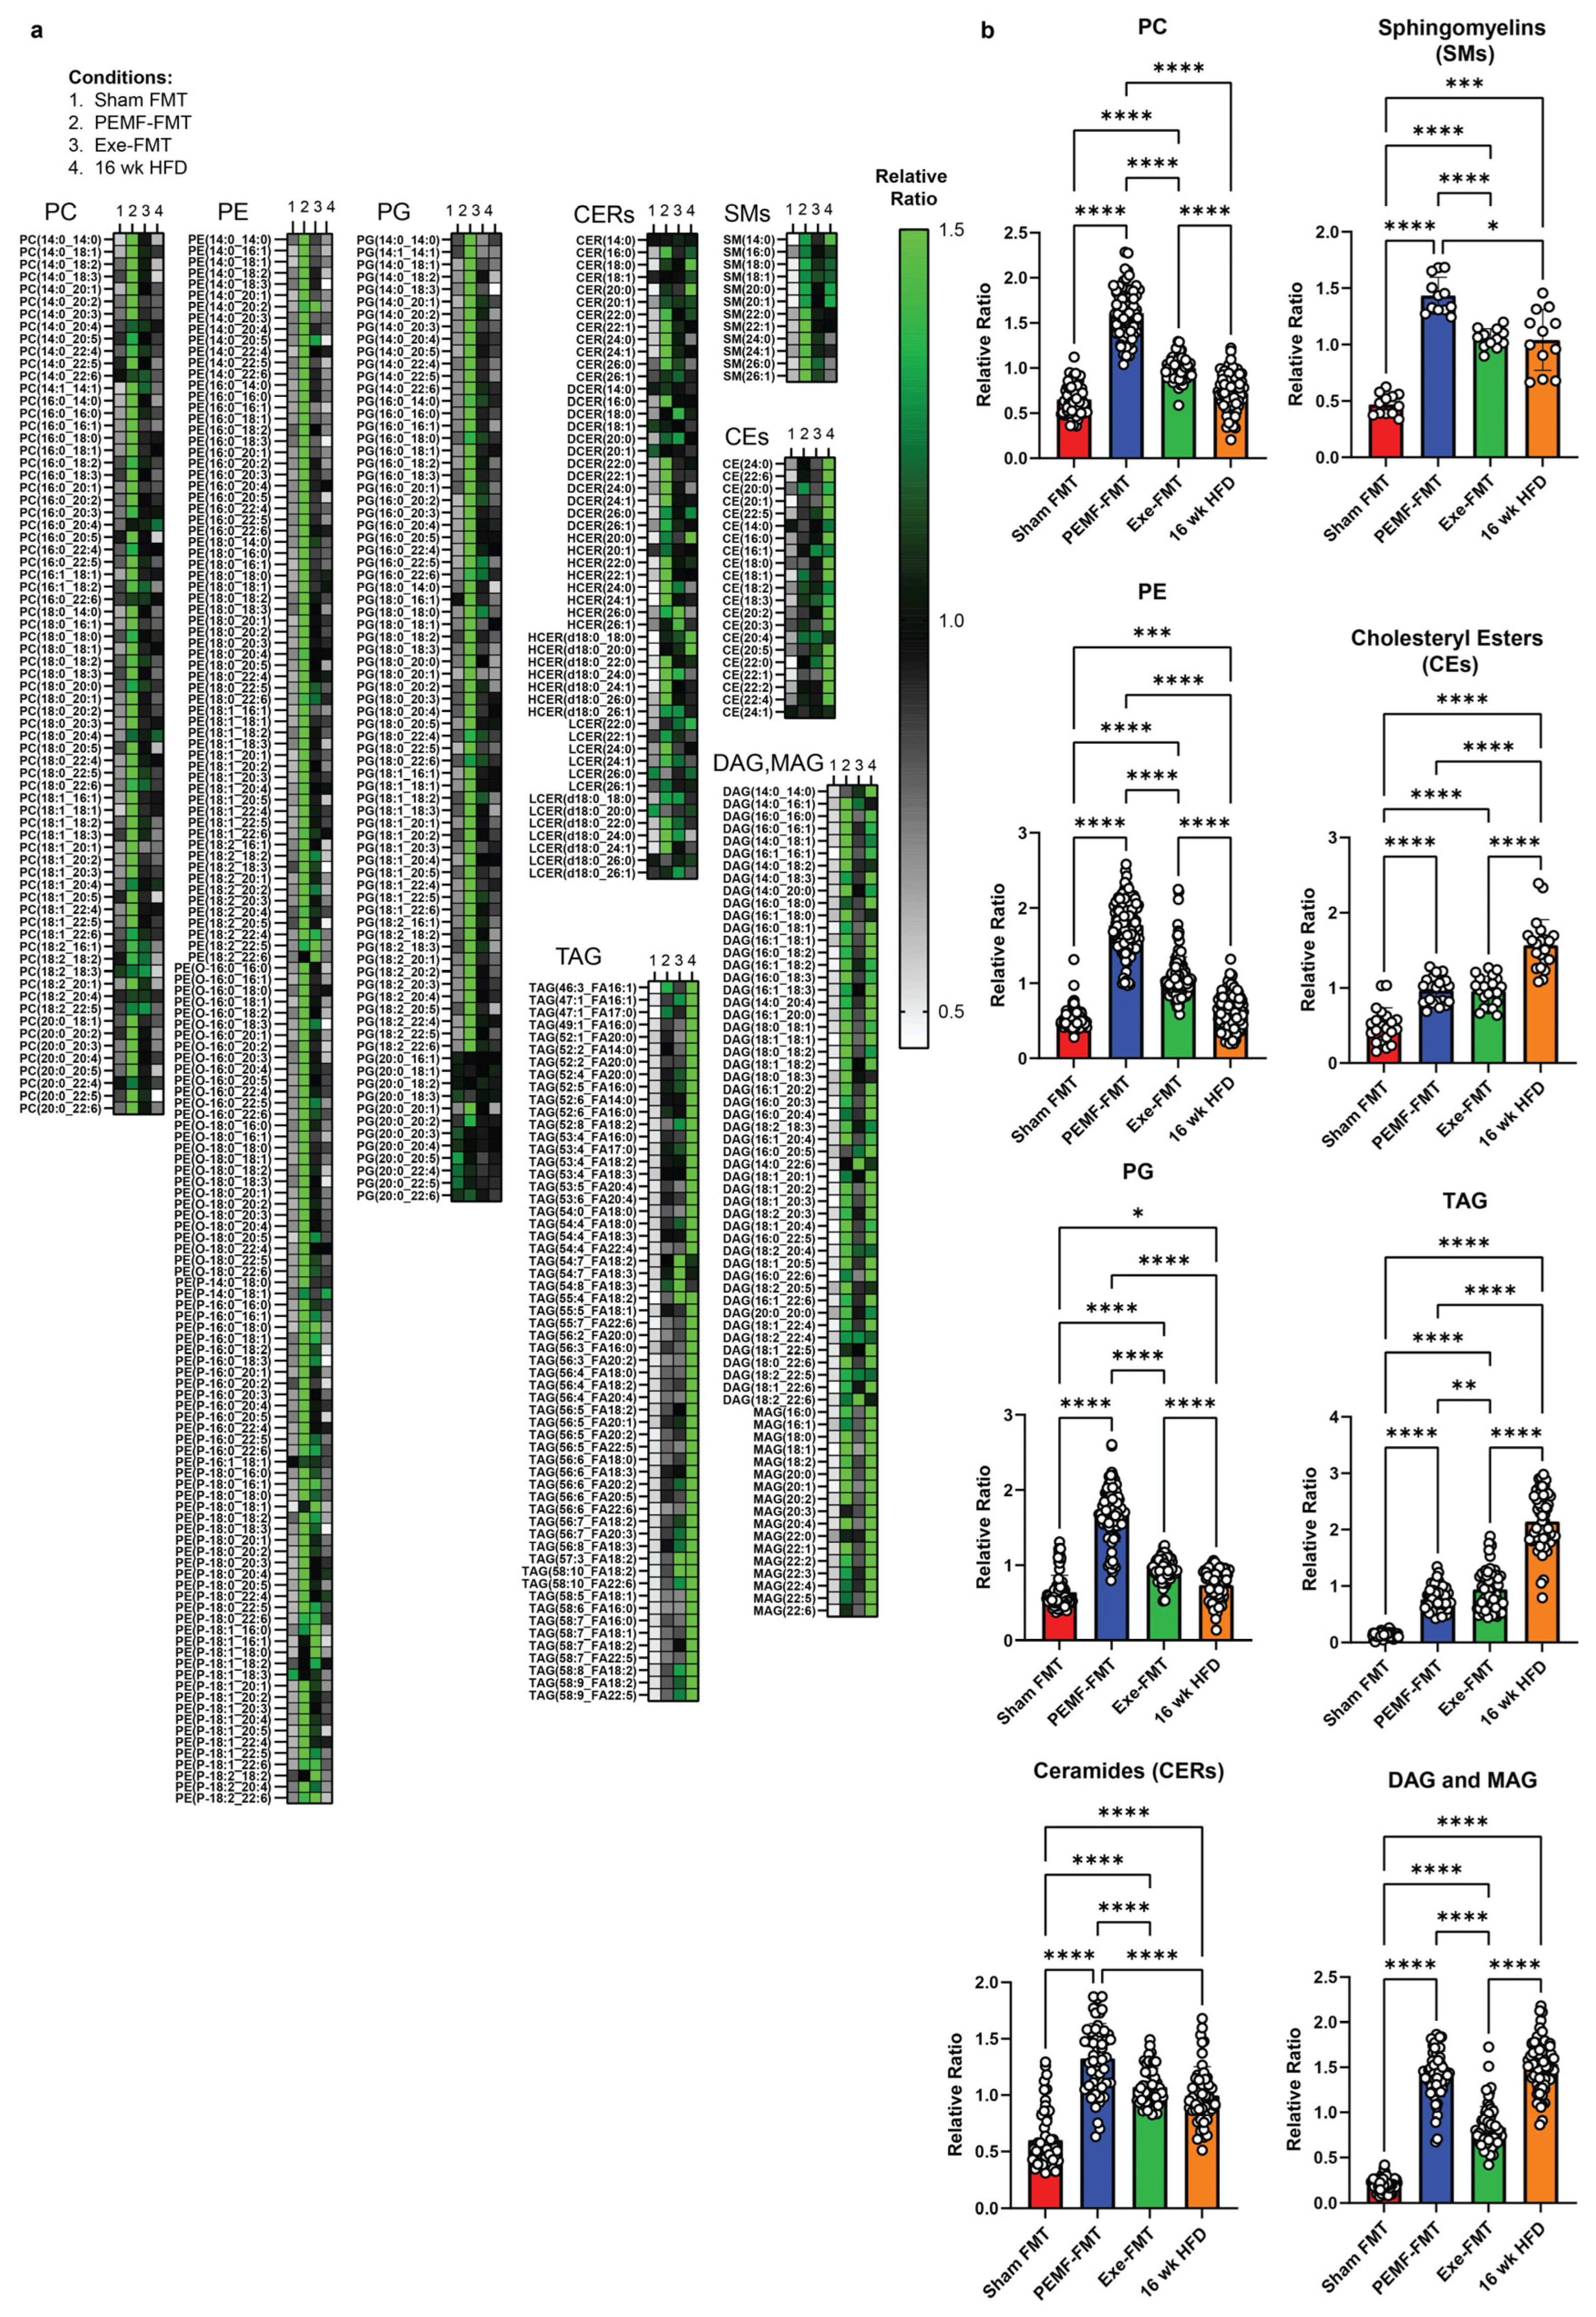
| 9 & 10 | HEPATIC LIPIDS | Lipidomics One-way ANOVA (Tukey’s test) | PEMF vs. control Significant changes: Elevation in PC, PE, PG, sphingomyelins, and cholesteryl esters Reduction in TAG, DAG, and MAG Ceramides: Reduction in long-chain (C16–C20) and elevation in very long-chain ceramides (C22–C26). This distinct expression pattern is not observed with exercise. (n = 5 per group) * p < 0.05 | PEMF-FMT vs. Sham FMT Significant changes: Elevation in PC, PE, PG, ceramides, sphingomyelins, cholesteryl esters, TAG, DAG, and MAG PEMF-FMT vs. 16 wk HFD Ceramides: Reduction in long-chain (C16–C20) and elevation in very long-chain ceramides (C22–C26). This distinct expression pattern is not observed with Sham FMT or Exercise-FMT. (n = 4–6 per group) * p < 0.05 | [28,86,102,103,107,108,110,112] |
4. Materials and Methods
4.1. Animal Husbandry, Food Intake, and Ethics Approval
4.2. Experimental Groups for Paradigm 1: Direct Magnetic Exposure
4.3. PEMF and Exercise Interventions
4.4. Collection of Fresh Fecal Pellets for SCFA Analysis
4.5. Dried Fecal Pellets for Fecal Microbiota Transplantation, Cecal Matter, and Adipose Tissue Collection
4.6. Experimental Groups for Paradigm 2: Fecal Matter Transplant (FMT)
4.7. Antibiotic Administration, High-Fat Diet (HFD), and FMT Intervention
4.8. Intraperitoneal Glucose Tolerance Test (IGTT)
4.9. Blood Plasma and Multiplex Analysis
4.10. Microbiome Profiling of Stool Samples Using 16S rRNA Gene Sequencing
4.11. MicroCT Analysis of the Tibia
4.12. Liver Homogenization and Lipidomics Profiling
4.13. RNA Extraction and qPCR Analysis of Mouse Adipose and Muscle Samples
4.14. Analysis of Muscle Protein Abundance
4.15. Bioinformatics Analysis
4.16. Statistical Analysis
5. Conclusions
Supplementary Materials
Author Contributions
Funding
Institutional Review Board Statement
Informed Consent Statement
Data Availability Statement
Acknowledgments
Conflicts of Interest
References
- Sabaratnam, R.; Wojtaszewski, J.F.P.; Hojlund, K. Factors mediating exercise-induced organ crosstalk. Acta Physiol. 2022, 234, e13766. [Google Scholar] [CrossRef] [PubMed]
- Suriano, F.; Van Hul, M.; Cani, P.D. Gut microbiota and regulation of myokine-adipokine function. Curr. Opin. Pharmacol. 2020, 52, 9–17. [Google Scholar] [CrossRef] [PubMed]
- Pace, L.A.; Crowe, S.E. Complex Relationships Between Food, Diet, and the Microbiome. Gastroenterol. Clin. N. Am. 2016, 45, 253–265. [Google Scholar] [CrossRef]
- Lynch, S.V.; Pedersen, O. The Human Intestinal Microbiome in Health and Disease. N. Engl. J. Med. 2016, 375, 2369–2379. [Google Scholar] [CrossRef]
- Li, S.; Mao, Y.; Zhou, F.; Yang, H.; Shi, Q.; Meng, B. Gut microbiome and osteoporosis: A review. Bone Jt. Res. 2020, 9, 524–530. [Google Scholar] [CrossRef]
- Monda, V.; Villano, I.; Messina, A.; Valenzano, A.; Esposito, T.; Moscatelli, F.; Viggiano, A.; Cibelli, G.; Chieffi, S.; Monda, M.; et al. Exercise Modifies the Gut Microbiota with Positive Health Effects. Oxid. Med. Cell Longev. 2017, 2017, 3831972. [Google Scholar] [CrossRef]
- Pickard, J.M.; Zeng, M.Y.; Caruso, R.; Nunez, G. Gut microbiota: Role in pathogen colonization, immune responses, and inflammatory disease. Immunol. Rev. 2017, 279, 70–89. [Google Scholar] [CrossRef]
- Mailing, L.J.; Allen, J.M.; Buford, T.W.; Fields, C.J.; Woods, J.A. Exercise and the Gut Microbiome: A Review of the Evidence, Potential Mechanisms, and Implications for Human Health. Exerc. Sport. Sci. Rev. 2019, 47, 75–85. [Google Scholar] [CrossRef]
- Franco-Obregon, A.; Gilbert, J.A. The Microbiome-Mitochondrion Connection: Common Ancestries, Common Mechanisms, Common Goals. mSystems 2017, 2, 10–1128. [Google Scholar] [CrossRef]
- Hawley, J.A. Microbiota and muscle highway—Two way traffic. Nat. Rev. Endocrinol. 2020, 16, 71–72. [Google Scholar] [CrossRef]
- Arumugam, M.; Raes, J.; Pelletier, E.; Le Paslier, D.; Yamada, T.; Mende, D.R.; Fernandes, G.R.; Tap, J.; Bruls, T.; Batto, J.M.; et al. Enterotypes of the human gut microbiome. Nature 2011, 473, 174–180. [Google Scholar] [CrossRef] [PubMed]
- Chen, T.; Long, W.; Zhang, C.; Liu, S.; Zhao, L.; Hamaker, B.R. Fiber-utilizing capacity varies in Prevotella- versus Bacteroides-dominated gut microbiota. Sci. Rep. 2017, 7, 2594. [Google Scholar] [CrossRef] [PubMed]
- Denou, E.; Marcinko, K.; Surette, M.G.; Steinberg, G.R.; Schertzer, J.D. High-intensity exercise training increases the diversity and metabolic capacity of the mouse distal gut microbiota during diet-induced obesity. Am. J. Physiol. Endocrinol. Metab. 2016, 310, E982–E993. [Google Scholar] [CrossRef] [PubMed]
- Cullen, J.M.A.; Shahzad, S.; Dhillon, J. A systematic review on the effects of exercise on gut microbial diversity, taxonomic composition, and microbial metabolites: Identifying research gaps and future directions. Front. Physiol. 2023, 14, 1292673. [Google Scholar] [CrossRef]
- Tai, Y.K.; Ng, C.; Purnamawati, K.; Yap, J.L.Y.; Yin, J.N.; Wong, C.; Patel, B.K.; Soong, P.L.; Pelczar, P.; Frohlich, J.; et al. Magnetic fields modulate metabolism and gut microbiome in correlation with Pgc-1alpha expression: Follow-up to an in vitro magnetic mitohormetic study. FASEB J. 2020, 34, 11143–11167. [Google Scholar] [CrossRef]
- Hildebrandt, M.A.; Hoffmann, C.; Sherrill-Mix, S.A.; Keilbaugh, S.A.; Hamady, M.; Chen, Y.Y.; Knight, R.; Ahima, R.S.; Bushman, F.; Wu, G.D. High-fat diet determines the composition of the murine gut microbiome independently of obesity. Gastroenterology 2009, 137, e1711–e1712. [Google Scholar] [CrossRef]
- Evans, C.C.; LePard, K.J.; Kwak, J.W.; Stancukas, M.C.; Laskowski, S.; Dougherty, J.; Moulton, L.; Glawe, A.; Wang, Y.; Leone, V.; et al. Exercise prevents weight gain and alters the gut microbiota in a mouse model of high fat diet-induced obesity. PLoS ONE 2014, 9, e92193. [Google Scholar] [CrossRef]
- Aragón-Vela, J.; Solis-Urra, P.; Ruiz-Ojeda, F.J.; Álvarez-Mercado, A.I.; Olivares-Arancibia, J.; Plaza-Diaz, J. Impact of Exercise on Gut Microbiota in Obesity. Nutrients 2021, 13, 3999. [Google Scholar] [CrossRef]
- Malesza, I.J.; Malesza, M.; Walkowiak, J.; Mussin, N.; Walkowiak, D.; Aringazina, R.; Bartkowiak-Wieczorek, J.; Madry, E. High-Fat, Western-Style Diet, Systemic Inflammation, and Gut Microbiota: A Narrative Review. Cells 2021, 10, 3164. [Google Scholar] [CrossRef]
- Qiao, J.; Wu, Y.; Ren, Y. The impact of a high fat diet on bones: Potential mechanisms. Food Funct. 2021, 12, 963–975. [Google Scholar] [CrossRef]
- Martyniak, K.; Wei, F.; Ballesteros, A.; Meckmongkol, T.; Calder, A.; Gilbertson, T.; Orlovskaya, N.; Coathup, M.J. Do polyunsaturated fatty acids protect against bone loss in our aging and osteoporotic population? Bone 2021, 143, 115736. [Google Scholar] [CrossRef] [PubMed]
- Chen, Y.C.; Greenbaum, J.; Shen, H.; Deng, H.W. Association Between Gut Microbiota and Bone Health: Potential Mechanisms and Prospective. J. Clin. Endocrinol. Metab. 2017, 102, 3635–3646. [Google Scholar] [CrossRef] [PubMed]
- Zhang, Y.W.; Cao, M.M.; Li, Y.J.; Dai, G.C.; Lu, P.P.; Zhang, M.; Bai, L.Y.; Chen, X.X.; Zhang, C.; Shi, L.; et al. The regulative effect and repercussion of probiotics and prebiotics on osteoporosis: Involvement of brain-gut-bone axis. Crit. Rev. Food Sci. Nutr. 2023, 63, 7510–7528. [Google Scholar] [CrossRef] [PubMed]
- Franco-Obregon, A.; Tai, Y.K.; Wu, K.Y.; Iversen, J.N.; Wong, C.J.K. The Developmental Implications of Muscle-Targeted Magnetic Mitohormesis: A Human Health and Longevity Perspective. Bioengineering 2023, 10, 956. [Google Scholar] [CrossRef]
- Yap, J.L.Y.; Tai, Y.K.; Fröhlich, J.; Fong, C.H.H.; Yin, J.N.; Foo, Z.L.; Ramanan, S.; Beyer, C.; Toh, S.J.; Casarosa, M.; et al. Ambient and supplemental magnetic fields promote myogenesis via a TRPC1-mitochondrial axis: Evidence of a magnetic mitohormetic mechanism. FASEB J. 2019, 33, 12853–12872. [Google Scholar] [CrossRef]
- Tai, Y.K.; Iversen, J.N.; Chan, K.K.W.; Fong, C.H.H.; Abdul Razar, R.B.; Ramanan, S.; Yap, L.Y.J.; Yin, J.N.; Toh, S.J.; Wong, C.J.K.; et al. Secretome from Magnetically Stimulated Muscle Exhibits Anticancer Potency: Novel Preconditioning Methodology Highlighting HTRA1 Action. Cells 2024, 13, 460. [Google Scholar] [CrossRef]
- Wong, C.J.K.; Tai, Y.K.; Yap, J.L.Y.; Fong, C.H.H.; Loo, L.S.W.; Kukumberg, M.; Frohlich, J.; Zhang, S.; Li, J.Z.; Wang, J.W.; et al. Brief exposure to directionally-specific pulsed electromagnetic fields stimulates extracellular vesicle release and is antagonized by streptomycin: A potential regenerative medicine and food industry paradigm. Biomaterials 2022, 287, 121658. [Google Scholar] [CrossRef]
- Stephenson, M.C.; Krishna, L.; Pannir Selvan, R.M.; Tai, Y.K.; Kit Wong, C.J.; Yin, J.N.; Toh, S.J.; Torta, F.; Triebl, A.; Fröhlich, J.; et al. Magnetic field therapy enhances muscle mitochondrial bioenergetics and attenuates systemic ceramide levels following ACL reconstruction: Southeast Asian randomized-controlled pilot trial. J. Orthop. Transl. 2022, 35, 99–112. [Google Scholar] [CrossRef]
- Venugobal, S.; Tai, Y.K.; Goh, J.; Teh, S.; Wong, C.; Goh, I.; Maier, A.B.; Kennedy, B.K.; Franco-Obregon, A. Brief, weekly magnetic muscle therapy improves mobility and lean body mass in older adults: A Southeast Asia community case study. Aging 2023, 15, 1768–1790. [Google Scholar] [CrossRef]
- Lin, J.; Wu, H.; Tarr, P.T.; Zhang, C.Y.; Wu, Z.; Boss, O.; Michael, L.F.; Puigserver, P.; Isotani, E.; Olson, E.N.; et al. Transcriptional co-activator PGC-1 alpha drives the formation of slow-twitch muscle fibres. Nature 2002, 418, 797–801. [Google Scholar] [CrossRef]
- Bostrom, P.; Wu, J.; Jedrychowski, M.P.; Korde, A.; Ye, L.; Lo, J.C.; Rasbach, K.A.; Bostrom, E.A.; Choi, J.H.; Long, J.Z.; et al. A PGC1-alpha-dependent myokine that drives brown-fat-like development of white fat and thermogenesis. Nature 2012, 481, 463–468. [Google Scholar] [CrossRef] [PubMed]
- Franco-Obregon, A. Harmonizing Magnetic Mitohormetic Regenerative Strategies: Developmental Implications of a Calcium-Mitochondrial Axis Invoked by Magnetic Field Exposure. Bioengineering 2023, 10, 1176. [Google Scholar] [CrossRef] [PubMed]
- Chansoria, P.; Liu, H.; Christiansen, M.G.; Schürle-Finke, S.; Zenobi-Wong, M. Untethered: Using remote magnetic fields for regenerative medicine. Trends Biotechnol. 2022, 41, 615–631. [Google Scholar] [CrossRef]
- Iversen, J.N.; Tai, Y.K.; Wu, K.Y.; Wong, C.J.K.; Lim, H.Y.; Franco-Obregon, A. Magnetically Stimulated Myogenesis Recruits a CRY2-TRPC1 Photosensitive Signaling Axis. Cells 2025, 14, 231. [Google Scholar] [CrossRef]
- Hamid, H.A.; Sarmadi, V.H.; Prasad, V.; Ramasamy, R.; Miskon, A. Electromagnetic field exposure as a plausible approach to enhance the proliferation and differentiation of mesenchymal stem cells in clinically relevant scenarios. J. Zhejiang Univ. Sci. B 2022, 23, 42–57. [Google Scholar] [CrossRef]
- Uzieliene, I.; Bernotas, P.; Mobasheri, A.; Bernotiene, E. The Role of Physical Stimuli on Calcium Channels in Chondrogenic Differentiation of Mesenchymal Stem Cells. Int. J. Mol. Sci. 2018, 19, 2998. [Google Scholar] [CrossRef]
- Varani, K.; Vincenzi, F.; Pasquini, S.; Blo, I.; Salati, S.; Cadossi, M.; De Mattei, M. Pulsed Electromagnetic Field Stimulation in Osteogenesis and Chondrogenesis: Signaling Pathways and Therapeutic Implications. Int. J. Mol. Sci. 2021, 22, 809. [Google Scholar] [CrossRef]
- Ma, Q.; Chen, C.; Deng, P.; Zhu, G.; Lin, M.; Zhang, L.; Xu, S.; He, M.; Lu, Y.; Duan, W.; et al. Extremely Low-Frequency Electromagnetic Fields Promote In Vitro Neuronal Differentiation and Neurite Outgrowth of Embryonic Neural Stem Cells via Up-Regulating TRPC1. PLoS ONE 2016, 11, e0150923. [Google Scholar] [CrossRef]
- Xia, L.; Cheung, K.K.; Yeung, S.S.; Yeung, E.W. The involvement of transient receptor potential canonical type 1 in skeletal muscle regrowth after unloading-induced atrophy. J. Physiol. 2016, 594, 3111–3126. [Google Scholar] [CrossRef]
- Zanou, N.; Schakman, O.; Louis, P.; Ruegg, U.T.; Dietrich, A.; Birnbaumer, L.; Gailly, P. Trpc1 ion channel modulates phosphatidylinositol 3-kinase/Akt pathway during myoblast differentiation and muscle regeneration. J. Biol. Chem. 2012, 287, 14524–14534. [Google Scholar] [CrossRef]
- Schwerzmann, K.; Hoppeler, H.; Kayar, S.R.; Weibel, E.R. Oxidative capacity of muscle and mitochondria: Correlation of physiological, biochemical, and morphometric characteristics. Proc. Natl. Acad. Sci. USA 1989, 86, 1583–1587. [Google Scholar] [CrossRef] [PubMed]
- Numaga-Tomita, T.; Oda, S.; Nishiyama, K.; Tanaka, T.; Nishimura, A.; Nishida, M. TRPC channels in exercise-mimetic therapy. Pflug. Arch. 2019, 471, 507–517. [Google Scholar] [CrossRef] [PubMed]
- Ley, R.E.; Turnbaugh, P.J.; Klein, S.; Gordon, J.I. Microbial ecology: Human gut microbes associated with obesity. Nature 2006, 444, 1022–1023. [Google Scholar] [CrossRef] [PubMed]
- Weingarden, A.R.; Vaughn, B.P. Intestinal microbiota, fecal microbiota transplantation, and inflammatory bowel disease. Gut Microbes 2017, 8, 238–252. [Google Scholar] [CrossRef]
- Chen, Q.; Wu, C.; Xu, J.; Ye, C.; Chen, X.; Tian, H.; Zong, N.; Zhang, S.; Li, L.; Gao, Y.; et al. Donor-recipient intermicrobial interactions impact transfer of subspecies and fecal microbiota transplantation outcome. Cell Host Microbe 2024, 32, 349–365.E4. [Google Scholar] [CrossRef]
- Boicean, A.; Ichim, C.; Sasu, S.M.; Todor, S.B. Key Insights into Gut Alterations in Metabolic Syndrome. J. Clin. Med. 2025, 14, 2678. [Google Scholar] [CrossRef]
- Ooijevaar, R.E.; Terveer, E.M.; Verspaget, H.W.; Kuijper, E.J.; Keller, J.J. Clinical Application and Potential of Fecal Microbiota Transplantation. Annu. Rev. Med. 2019, 70, 335–351. [Google Scholar] [CrossRef]
- Zhang, Y.W.; Cao, M.M.; Li, Y.J.; Zhang, R.L.; Wu, M.T.; Yu, Q.; Rui, Y.F. Fecal microbiota transplantation as a promising treatment option for osteoporosis. J. Bone Miner. Metab. 2022, 40, 874–889. [Google Scholar] [CrossRef]
- Chew, W.; Lim, Y.P.; Lim, W.S.; Chambers, E.S.; Frost, G.; Wong, S.H.; Ali, Y. Gut-muscle crosstalk. A perspective on influence of microbes on muscle function. Front. Med. 2022, 9, 1065365. [Google Scholar] [CrossRef]
- Suryani, D.; Subhan Alfaqih, M.; Gunadi, J.W.; Sylviana, N.; Goenawan, H.; Megantara, I.; Lesmana, R. Type, Intensity, and Duration of Exercise as Regulator of Gut Microbiome Profile. Curr. Sports Med. Rep. 2022, 21, 84–91. [Google Scholar] [CrossRef]
- Cummins, T.D.; Holden, C.R.; Sansbury, B.E.; Gibb, A.A.; Shah, J.; Zafar, N.; Tang, Y.; Hellmann, J.; Rai, S.N.; Spite, M.; et al. Metabolic remodeling of white adipose tissue in obesity. Am. J. Physiol. Endocrinol. Metab. 2014, 307, E262–E277. [Google Scholar] [CrossRef] [PubMed]
- Audrito, V.; Messana, V.G.; Deaglio, S. NAMPT and NAPRT: Two Metabolic Enzymes With Key Roles in Inflammation. Front. Oncol. 2020, 10, 358. [Google Scholar] [CrossRef] [PubMed]
- Fraysse, B.; Desaphy, J.F.; Pierno, S.; De Luca, A.; Liantonio, A.; Mitolo, C.I.; Camerino, D.C. Decrease in resting calcium and calcium entry associated with slow-to-fast transition in unloaded rat soleus muscle. FASEB J. 2003, 17, 1916–1918. [Google Scholar] [CrossRef] [PubMed]
- Kirk, B.; Feehan, J.; Lombardi, G.; Duque, G. Muscle, Bone, and Fat Crosstalk: The Biological Role of Myokines, Osteokines, and Adipokines. Curr. Osteoporos. Rep. 2020, 18, 388–400. [Google Scholar] [CrossRef]
- Alizadeh Pahlavani, H. Exercise Therapy for People With Sarcopenic Obesity: Myokines and Adipokines as Effective Actors. Front. Endocrinol. 2022, 13, 811751. [Google Scholar] [CrossRef]
- Ross, M.; Kargl, C.K.; Ferguson, R.; Gavin, T.P.; Hellsten, Y. Exercise-induced skeletal muscle angiogenesis: Impact of age, sex, angiocrines and cellular mediators. Eur. J. Appl. Physiol. 2023, 123, 1415–1432. [Google Scholar] [CrossRef]
- Panee, J. Monocyte Chemoattractant Protein 1 (MCP-1) in obesity and diabetes. Cytokine 2012, 60, 1–12. [Google Scholar] [CrossRef]
- Zhu, Q.; Chen, S.; Funcke, J.B.; Straub, L.G.; Lin, Q.; Zhao, S.; Joung, C.; Zhang, Z.; Kim, D.S.; Li, N.; et al. PAQR4 regulates adipocyte function and systemic metabolic health by mediating ceramide levels. Nat. Metab. 2024, 6, 1347–1366. [Google Scholar] [CrossRef]
- Li, Y.; Liu, Q.; Peng, C.; Ruan, B. Both Gut Microbiota and Differentially Expressed Proteins Are Relevant to the Development of Obesity. Biomed. Res. Int. 2020, 2020, 5376108. [Google Scholar] [CrossRef]
- Paramsothy, S.; Nielsen, S.; Kamm, M.A.; Deshpande, N.P.; Faith, J.J.; Clemente, J.C.; Paramsothy, R.; Walsh, A.J.; van den Bogaerde, J.; Samuel, D.; et al. Specific Bacteria and Metabolites Associated With Response to Fecal Microbiota Transplantation in Patients With Ulcerative Colitis. Gastroenterology 2019, 156, 1440–1454.e1442. [Google Scholar] [CrossRef]
- Gobert, A.P.; Latour, Y.L.; Asim, M.; Barry, D.P.; Allaman, M.M.; Finley, J.L.; Smith, T.M.; McNamara, K.M.; Singh, K.; Sierra, J.C.; et al. Protective Role of Spermidine in Colitis and Colon Carcinogenesis. Gastroenterology 2022, 162, 813–827.e818. [Google Scholar] [CrossRef] [PubMed]
- Herp, S.; Durai Raj, A.C.; Salvado Silva, M.; Woelfel, S.; Stecher, B. The human symbiont Mucispirillum schaedleri: Causality in health and disease. Med. Microbiol. Immunol. 2021, 210, 173–179. [Google Scholar] [CrossRef] [PubMed]
- Bluher, M. Obesity: Global epidemiology and pathogenesis. Nat. Rev. Endocrinol. 2019, 15, 288–298. [Google Scholar] [CrossRef]
- Verde, L.; Barrea, L.; Bowman-Busato, J.; Yumuk, V.D.; Colao, A.; Muscogiuri, G. Obesogenic environments as major determinants of a disease: It is time to re-shape our cities. Diabetes Metab. Res. Rev. 2024, 40, e3748. [Google Scholar] [CrossRef]
- Singer-Englar, T.; Barlow, G.; Mathur, R. Obesity, diabetes, and the gut microbiome: An updated review. Expert. Rev. Gastroenterol. Hepatol. 2019, 13, 3–15. [Google Scholar] [CrossRef]
- Clauss, M.; Gérard, P.; Mosca, A.; Leclerc, M. Interplay Between Exercise and Gut Microbiome in the Context of Human Health and Performance. Front. Nutr. 2021, 8, 637010. [Google Scholar] [CrossRef]
- Goossens, G.H.; Blaak, E.E. Adipose tissue dysfunction and impaired metabolic health in human obesity: A matter of oxygen? Front. Endocrinol. 2015, 6, 55. [Google Scholar] [CrossRef]
- An, Y.; Wang, G.; Diao, Y.; Long, Y.; Fu, X.; Weng, M.; Zhou, L.; Sun, K.; Cheung, T.H.; Ip, N.Y.; et al. A Molecular Switch Regulating Cell Fate Choice between Muscle Progenitor Cells and Brown Adipocytes. Dev. Cell 2017, 41, 382–391.e385. [Google Scholar] [CrossRef]
- Lin, W.S.; Hsu, N.W.; Lee, M.J.; Lin, Y.Y.; Tsai, C.C.; Pan, P.J. Correlation analysis of physical fitness and its impact on falls in 2130 community- dwelling older adults: A retrospective cross-sectional study. BMC Geriatr. 2022, 22, 447. [Google Scholar] [CrossRef]
- Angulo, J.; El Assar, M.; Alvarez-Bustos, A.; Rodriguez-Manas, L. Physical activity and exercise: Strategies to manage frailty. Redox Biol. 2020, 35, 101513. [Google Scholar] [CrossRef]
- Chow, L.S.; Gerszten, R.E.; Taylor, J.M.; Pedersen, B.K.; van Praag, H.; Trappe, S.; Febbraio, M.A.; Galis, Z.S.; Gao, Y.; Haus, J.M.; et al. Exerkines in health, resilience and disease. Nat. Rev. Endocrinol. 2022, 18, 273–289. [Google Scholar] [CrossRef] [PubMed]
- Yamada, M. Muscle P62 Stimulates the Expression of Antioxidant Proteins Alleviating Cancer Cachexia. FASEB J. 2023, 37, e23156. [Google Scholar] [CrossRef] [PubMed]
- Narasimhan, M.; Hong, J.; Atieno, N.; Muthusamy, V.R.; Davidson, C.J.; Abu-Rmaileh, N.; Richardson, R.S.; Gomes, A.V.; Hoidal, J.R.; Rajasekaran, N.S. Nrf2 Deficiency Promotes Apoptosis and Impairs PAX7/MyoD Expression in Aging Skeletal Muscle Cells. Free Radic. Biol. Med. 2014, 71, 402–414. [Google Scholar] [CrossRef] [PubMed]
- Petrillo, S.; Pelosi, L.; Piemonte, F.; Travaglini, L.; Forcina, L.; Catteruccia, M.; Petrini, S.; Verardo, M.; D’Amico, A.; Musarò, A.; et al. Oxidative Stress in Duchenne Muscular Dystrophy: Focus on the NRF2 Redox Pathway. Hum. Mol. Genet. 2017, 26, 2781–2790. [Google Scholar] [CrossRef]
- Org, E.; Mehrabian, M.; Lusis, A.J. Unraveling the environmental and genetic interactions in atherosclerosis: Central role of the gut microbiota. Atherosclerosis 2015, 241, 387–399. [Google Scholar] [CrossRef]
- Houghton, D.; Stewart, C.J.; Day, C.P.; Trenell, M. Gut Microbiota and Lifestyle Interventions in NAFLD. Int. J. Mol. Sci. 2016, 17, 447. [Google Scholar] [CrossRef]
- Wang, L.; Yang, S.; Lu, Y.; Wu, H.; Wang, J.; Yu, S.; Kong, A.N.T.; Zhang, Y. Hypoxia Preconditioning Promotes Endurance Exercise Capacity of Mice by Activating Skeletal Muscle Nrf2. J. Appl. Physiol. 2019, 127, 1267–1277. [Google Scholar] [CrossRef]
- Hochberg, M.C.; Greenspan, S.; Wasnich, R.D.; Miller, P.; Thompson, D.E.; Ross, P.D. Changes in bone density and turnover explain the reductions in incidence of nonvertebral fractures that occur during treatment with antiresorptive agents. J. Clin. Endocrinol. Metab. 2002, 87, 1586–1592. [Google Scholar] [CrossRef]
- Piccirillo, R. Exercise-Induced Myokines With Therapeutic Potential for Muscle Wasting. Front. Physiol. 2019, 10, 287. [Google Scholar] [CrossRef]
- Yadegar, A.; Bar-Yoseph, H.; Monaghan, T.M.; Pakpour, S.; Severino, A.; Kuijper, E.J.; Smits, W.K.; Terveer, E.M.; Neupane, S.; Nabavi-Rad, A.; et al. Fecal microbiota transplantation: Current challenges and future landscapes. Clin. Microbiol. Rev. 2024, 37, e0006022. [Google Scholar] [CrossRef]
- Xie, X.; Huang, C. Role of the gut-muscle axis in mitochondrial function of ageing muscle under different exercise modes. Ageing Res. Rev. 2024, 98, 102316. [Google Scholar] [CrossRef] [PubMed]
- Wang, J.; Cheng, R.; Luo, Y.; Zhou, Q.; Jiang, F.; Shen, X.; Wu, X.; He, F. High-fat diet induces metabolic syndrome in mice and its influence on intestinal development, liver function and intestinal microbiota. Wei Sheng Yan Jiu 2021, 50, 93–99. [Google Scholar] [CrossRef] [PubMed]
- Bradley, R.L.; Jeon, J.Y.; Liu, F.F.; Maratos-Flier, E. Voluntary exercise improves insulin sensitivity and adipose tissue inflammation in diet-induced obese mice. Am. J. Physiol. Endocrinol. Metab. 2008, 295, E586–E594. [Google Scholar] [CrossRef] [PubMed]
- Lin, S.; Thomas, T.C.; Storlien, L.H.; Huang, X.F. Development of high fat diet-induced obesity and leptin resistance in C57Bl/6J mice. Int. J. Obes. Relat. Metab. Disord. 2000, 24, 639–646. [Google Scholar] [CrossRef]
- Becic, T.; Studenik, C.; Hoffmann, G. Exercise Increases Adiponectin and Reduces Leptin Levels in Prediabetic and Diabetic Individuals: Systematic Review and Meta-Analysis of Randomized Controlled Trials. Med. Sci. 2018, 6, 97. [Google Scholar] [CrossRef]
- Raichur, S.; Wang, S.T.; Chan, P.W.; Li, Y.; Ching, J.; Chaurasia, B.; Dogra, S.; Ohman, M.K.; Takeda, K.; Sugii, S.; et al. CerS2 haploinsufficiency inhibits beta-oxidation and confers susceptibility to diet-induced steatohepatitis and insulin resistance. Cell Metab. 2014, 20, 687–695. [Google Scholar] [CrossRef]
- Endo, Y.; Hwang, C.D.; Zhang, Y.; Olumi, S.; Koh, D.J.; Zhu, C.; Neppl, R.L.; Agarwal, S.; Sinha, I. VEGFA Promotes Skeletal Muscle Regeneration in Aging. Adv. Biol. 2023, 7, e2200320. [Google Scholar] [CrossRef]
- Kwon, J.H.; Moon, K.M.; Min, K.W. Exercise-Induced Myokines can Explain the Importance of Physical Activity in the Elderly: An Overview. Healthcare 2020, 8, 378. [Google Scholar] [CrossRef]
- Elias, I.; Franckhauser, S.; Bosch, F. New insights into adipose tissue VEGF-A actions in the control of obesity and insulin resistance. Adipocyte 2013, 2, 109–112. [Google Scholar] [CrossRef]
- Park, J.; Kim, M.; Sun, K.; An, Y.A.; Gu, X.; Scherer, P.E. VEGF-A-Expressing Adipose Tissue Shows Rapid Beiging and Enhanced Survival After Transplantation and Confers IL-4-Independent Metabolic Improvements. Diabetes 2017, 66, 1479–1490. [Google Scholar] [CrossRef]
- Fernandez-Marcos, P.J.; Auwerx, J. Regulation of PGC-1alpha, a nodal regulator of mitochondrial biogenesis. Am. J. Clin. Nutr. 2011, 93, 884S–890S. [Google Scholar] [CrossRef]
- Yan, W.; Sun, C.; Zheng, J.; Wen, C.; Ji, C.; Zhang, D.; Chen, Y.; Hou, Z.; Yang, N. Efficacy of Fecal Sampling as a Gut Proxy in the Study of Chicken Gut Microbiota. Front. Microbiol. 2019, 10, 2126. [Google Scholar] [CrossRef] [PubMed]
- Petakh, P.; Oksenych, V.; Kamyshnyi, A. The F/B ratio as a biomarker for inflammation in COVID-19 and T2D: Impact of metformin. Biomed. Pharmacother. 2023, 163, 114892. [Google Scholar] [CrossRef] [PubMed]
- Mohamed Qadir, R.; Assafi, M.S. The association between body mass index and the oral Firmicutes and Bacteroidetes profiles of healthy individuals. Malays. Fam. Physician 2021, 16, 36–43. [Google Scholar] [CrossRef]
- Yoshida, N.; Watanabe, S.; Yamasaki, H.; Sakuma, H.; Takeda, A.K.; Yamashita, T.; Hirata, K.I. Average gut flora in healthy Japanese subjects stratified by age and body mass index. Biosci. Microbiota Food Health 2022, 41, 45–53. [Google Scholar] [CrossRef]
- Li, Y.; Liu, M.; Liu, H.; Sui, X.; Liu, Y.; Wei, X.; Liu, C.; Cheng, Y.; Ye, W.; Gao, B.; et al. The Anti-Inflammatory Effect and Mucosal Barrier Protection of Clostridium butyricum RH2 in Ceftriaxone-Induced Intestinal Dysbacteriosis. Front. Cell Infect. Microbiol. 2021, 11, 647048. [Google Scholar] [CrossRef]
- Robertson, B.R.; O’Rourke, J.L.; Neilan, B.A.; Vandamme, P.; On, S.L.W.; Fox, J.G.; Lee, A. Mucispirillum schaedleri gen. nov., sp. nov., a spiral-shaped bacterium colonizing the mucus layer of the gastrointestinal tract of laboratory rodents. Int. J. Syst. Evol. Microbiol. 2005, 55, 1199–1204. [Google Scholar] [CrossRef]
- Goncalves, I.O.; Maciel, E.; Passos, E.; Torrella, J.R.; Rizo, D.; Viscor, G.; Rocha-Rodrigues, S.; Santos-Alves, E.; Domingues, M.R.; Oliveira, P.J.; et al. Exercise alters liver mitochondria phospholipidomic profile and mitochondrial activity in non-alcoholic steatohepatitis. Int. J. Biochem. Cell Biol. 2014, 54, 163–173. [Google Scholar] [CrossRef]
- Zhang, X.; Zhang, J.; Sun, H.; Liu, X.; Zheng, Y.; Xu, D.; Wang, J.; Jia, D.; Han, X.; Liu, F.; et al. Defective Phosphatidylglycerol Remodeling Causes Hepatopathy, Linking Mitochondrial Dysfunction to Hepatosteatosis. Cell Mol. Gastroenterol. Hepatol. 2019, 7, 763–781. [Google Scholar] [CrossRef]
- Engel, K.M.; Schiller, J.; Galuska, C.E.; Fuchs, B. Phospholipases and Reactive Oxygen Species Derived Lipid Biomarkers in Healthy and Diseased Humans and Animals—A Focus on Lysophosphatidylcholine. Front. Physiol. 2021, 12, 732319. [Google Scholar] [CrossRef]
- Wu, H.; Ballantyne, C.M. Skeletal muscle inflammation and insulin resistance in obesity. J. Clin. Investig. 2017, 127, 43–54. [Google Scholar] [CrossRef] [PubMed]
- Li, Z.; Chiang, Y.P.; He, M.; Worgall, T.S.; Zhou, H.; Jiang, X.C. Liver sphingomyelin synthase 1 deficiency causes steatosis, steatohepatitis, fibrosis, and tumorigenesis: An effect of glucosylceramide accumulation. iScience 2021, 24, 103449. [Google Scholar] [CrossRef] [PubMed]
- Montgomery, M.K.; Brown, S.H.; Lim, X.Y.; Fiveash, C.E.; Osborne, B.; Bentley, N.L.; Braude, J.P.; Mitchell, T.W.; Coster, A.C.; Don, A.S.; et al. Regulation of glucose homeostasis and insulin action by ceramide acyl-chain length: A beneficial role for very long-chain sphingolipid species. Biochim. Biophys. Acta 2016, 1861, 1828–1839. [Google Scholar] [CrossRef] [PubMed]
- Correnti, J.; Lin, C.; Brettschneider, J.; Kuriakose, A.; Jeon, S.; Scorletti, E.; Oranu, A.; McIver-Jenkins, D.; Kaneza, I.; Buyco, D.; et al. Liver-specific ceramide reduction alleviates steatosis and insulin resistance in alcohol-fed mice. J. Lipid Res. 2020, 61, 983–994. [Google Scholar] [CrossRef]
- Holland, W.L.; Brozinick, J.T.; Wang, L.P.; Hawkins, E.D.; Sargent, K.M.; Liu, Y.; Narra, K.; Hoehn, K.L.; Knotts, T.A.; Siesky, A.; et al. Inhibition of ceramide synthesis ameliorates glucocorticoid-, saturated-fat-, and obesity-induced insulin resistance. Cell Metab. 2007, 5, 167–179. [Google Scholar] [CrossRef]
- Chaurasia, B.; Tippetts, T.S.; Mayoral Monibas, R.; Liu, J.; Li, Y.; Wang, L.; Wilkerson, J.L.; Sweeney, C.R.; Pereira, R.F.; Sumida, D.H.; et al. Targeting a ceramide double bond improves insulin resistance and hepatic steatosis. Science 2019, 365, 386–392. [Google Scholar] [CrossRef]
- Hla, T.; Kolesnick, R. C16:0-ceramide signals insulin resistance. Cell Metab. 2014, 20, 703–705. [Google Scholar] [CrossRef]
- Peterson, L.R.; Xanthakis, V.; Duncan, M.S.; Gross, S.; Friedrich, N.; Volzke, H.; Felix, S.B.; Jiang, H.; Sidhu, R.; Nauck, M.; et al. Ceramide Remodeling and Risk of Cardiovascular Events and Mortality. J. Am. Heart Assoc. 2018, 7, e007931. [Google Scholar] [CrossRef]
- Turkish, A.R.; Sturley, S.L. The genetics of neutral lipid biosynthesis: An evolutionary perspective. Am. J. Physiol. Endocrinol. Metab. 2009, 297, E19–E27. [Google Scholar] [CrossRef]
- Hernaez, A.; Soria-Florido, M.T.; Castaner, O.; Pinto, X.; Estruch, R.; Salas-Salvado, J.; Corella, D.; Alonso-Gomez, A.; Martinez-Gonzalez, M.A.; Schroder, H.; et al. Leisure time physical activity is associated with improved HDL functionality in high cardiovascular risk individuals: A cohort study. Eur. J. Prev. Cardiol. 2021, 28, 1392–1401. [Google Scholar] [CrossRef]
- Alves-Bezerra, M.; Cohen, D.E. Triglyceride Metabolism in the Liver. Compr. Physiol. 2017, 8, 1–22. [Google Scholar] [CrossRef] [PubMed]
- Zhu, J.Y.; Guo, L. Exercise-regulated lipolysis: Its role and mechanism in health and diseases. J. Adv. Res. 2024; in press. [Google Scholar] [CrossRef]
- Muscella, A.; Stefano, E.; Lunetti, P.; Capobianco, L.; Marsigliante, S. The Regulation of Fat Metabolism During Aerobic Exercise. Biomolecules 2020, 10, 1699. [Google Scholar] [CrossRef] [PubMed]
- Lai, Z.L.; Tseng, C.H.; Ho, H.J.; Cheung, C.K.Y.; Lin, J.Y.; Chen, Y.J.; Cheng, F.C.; Hsu, Y.C.; Lin, J.T.; El-Omar, E.M.; et al. Fecal microbiota transplantation confers beneficial metabolic effects of diet and exercise on diet-induced obese mice. Sci. Rep. 2018, 8, 15625. [Google Scholar] [CrossRef] [PubMed]
- Grivennikov, S.I.; Wang, K.; Mucida, D.; Stewart, C.A.; Schnabl, B.; Jauch, D.; Taniguchi, K.; Yu, G.Y.; Osterreicher, C.H.; Hung, K.E.; et al. Adenoma-linked barrier defects and microbial products drive IL-23/IL-17-mediated tumour growth. Nature 2012, 491, 254–258. [Google Scholar] [CrossRef]
- Andrikopoulos, S.; Blair, A.R.; Deluca, N.; Fam, B.C.; Proietto, J. Evaluating the glucose tolerance test in mice. Am. J. Physiol. Endocrinol. Metab. 2008, 295, E1323–E1332. [Google Scholar] [CrossRef]

| Gene | Forward Primer Sequence (5′…3′) | Reverse Primer Sequence (5′…3′) |
|---|---|---|
| AdipoQ | GCACTGGCAAGTTCTACTGCAA | GTAGGTGAAGAGAACGGCCTTGT |
| Leptin | GAGACCCCTGTGTCGGTTC | CTGCGTGTGTGAAATGTCATTG |
| Cox7a1 | CAGCGTCATGGTCAGTCTGT | AGAAAACCGTGTGGCAGAGA |
| Cebpa | TTCGGGTCGCTGGATCTCTA | TCAAGGAGAAACCACCACGG |
| Glut4 | ACGTTGGTCTCGGTGCTCTT | GGCCACGATGGAGACATAGC |
| Nampt | CATTCAAGGAGATGGCGTGG | CCTTAAACACATTAACCCCAAGGC |
| Prdm16 | AGTCCTCCATACCAGGAGCTG | CCAAGTCTTCAGAGATCTGCTTTT |
| Rpl23 | AGATGTCGAAGCGAGGACGC | GTCTGTTCAGCCGTCCCTTG |
| Ucp1 | ACTGCCACACCTCCAGTCATT | CTTTGCCTCACTCAGGATTGG |
| Pgc1a | GGAGTGACATAGAGTGTGCTG | TGGTCGCTACACCACTTCAA |
| Paqr4 | CAGCCTTTTCTACCTACACAACG | GCACATGAAGAGGTGATACAGCA |
| B2m | GATGTCAGATATGTCCTTCAGCA | TCACATGTCTCGATCCCAGT |
| Gene | Forward Primer Sequence (5′…3′) | Reverse Primer Sequence (5′…3′) |
|---|---|---|
| Pgc1a | GGAGTGACATAGAGTGTGCTG | TGGTCGCTACACCACTTCAA |
| Sirt1 | TGACCGATGGACTCCTCACT | ACAAAAGTATATGGACCTATCCGC |
| Nrf2 | TGAAGCTCAGCTCGCATTGA | TGCTCCAGCTCGACAATGTT |
| Tfeb | TGTCTAGCAGCCACCTGAAC | GCTCTGCTCTCAGCATCTGT |
| Ppara | GCAACCATCCAGATGACACC | TCTCTTGCAACAGTGGGTGC |
| B2m | GATGTCAGATATGTCCTTCAGCA | TCACATGTCTCGATCCCAGT |
Disclaimer/Publisher’s Note: The statements, opinions and data contained in all publications are solely those of the individual author(s) and contributor(s) and not of MDPI and/or the editor(s). MDPI and/or the editor(s) disclaim responsibility for any injury to people or property resulting from any ideas, methods, instructions or products referred to in the content. |
© 2025 by the authors. Licensee MDPI, Basel, Switzerland. This article is an open access article distributed under the terms and conditions of the Creative Commons Attribution (CC BY) license (https://creativecommons.org/licenses/by/4.0/).
Share and Cite
Wong, J.K.C.; Patel, B.K.; Tai, Y.K.; Tan, T.Z.; Khine, W.W.T.; Chen, W.C.; Kukumberg, M.; Ching, J.; Lee, L.S.; Chua, K.V.; et al. Fecal Microbiota Transplantation from Mice Receiving Magnetic Mitohormesis Treatment Reverses High-Fat Diet-Induced Metabolic and Osteogenic Dysfunction. Int. J. Mol. Sci. 2025, 26, 5450. https://doi.org/10.3390/ijms26125450
Wong JKC, Patel BK, Tai YK, Tan TZ, Khine WWT, Chen WC, Kukumberg M, Ching J, Lee LS, Chua KV, et al. Fecal Microbiota Transplantation from Mice Receiving Magnetic Mitohormesis Treatment Reverses High-Fat Diet-Induced Metabolic and Osteogenic Dysfunction. International Journal of Molecular Sciences. 2025; 26(12):5450. https://doi.org/10.3390/ijms26125450
Chicago/Turabian StyleWong, Jun Kit Craig, Bharati Kadamb Patel, Yee Kit Tai, Tuan Zea Tan, Wei Wei Thwe Khine, Way Cherng Chen, Marek Kukumberg, Jianhong Ching, Lye Siang Lee, Kee Voon Chua, and et al. 2025. "Fecal Microbiota Transplantation from Mice Receiving Magnetic Mitohormesis Treatment Reverses High-Fat Diet-Induced Metabolic and Osteogenic Dysfunction" International Journal of Molecular Sciences 26, no. 12: 5450. https://doi.org/10.3390/ijms26125450
APA StyleWong, J. K. C., Patel, B. K., Tai, Y. K., Tan, T. Z., Khine, W. W. T., Chen, W. C., Kukumberg, M., Ching, J., Lee, L. S., Chua, K. V., Tan, T. Y., Wu, K. Y., Bai, X., Iversen, J. N., Purnamawati, K., Abdul Jalil, R., Kumar, A. P., Lee, Y. K., Moochhala, S. M., & Franco-Obregón, A. (2025). Fecal Microbiota Transplantation from Mice Receiving Magnetic Mitohormesis Treatment Reverses High-Fat Diet-Induced Metabolic and Osteogenic Dysfunction. International Journal of Molecular Sciences, 26(12), 5450. https://doi.org/10.3390/ijms26125450