

Frequency-Dependent Premature Differentiation of Pheochromocytoma Cells Exhibits Band-Pass Filter Behavior Correlation with Intracellular Enzyme Activation Kinetics


Abstract
1. Introduction
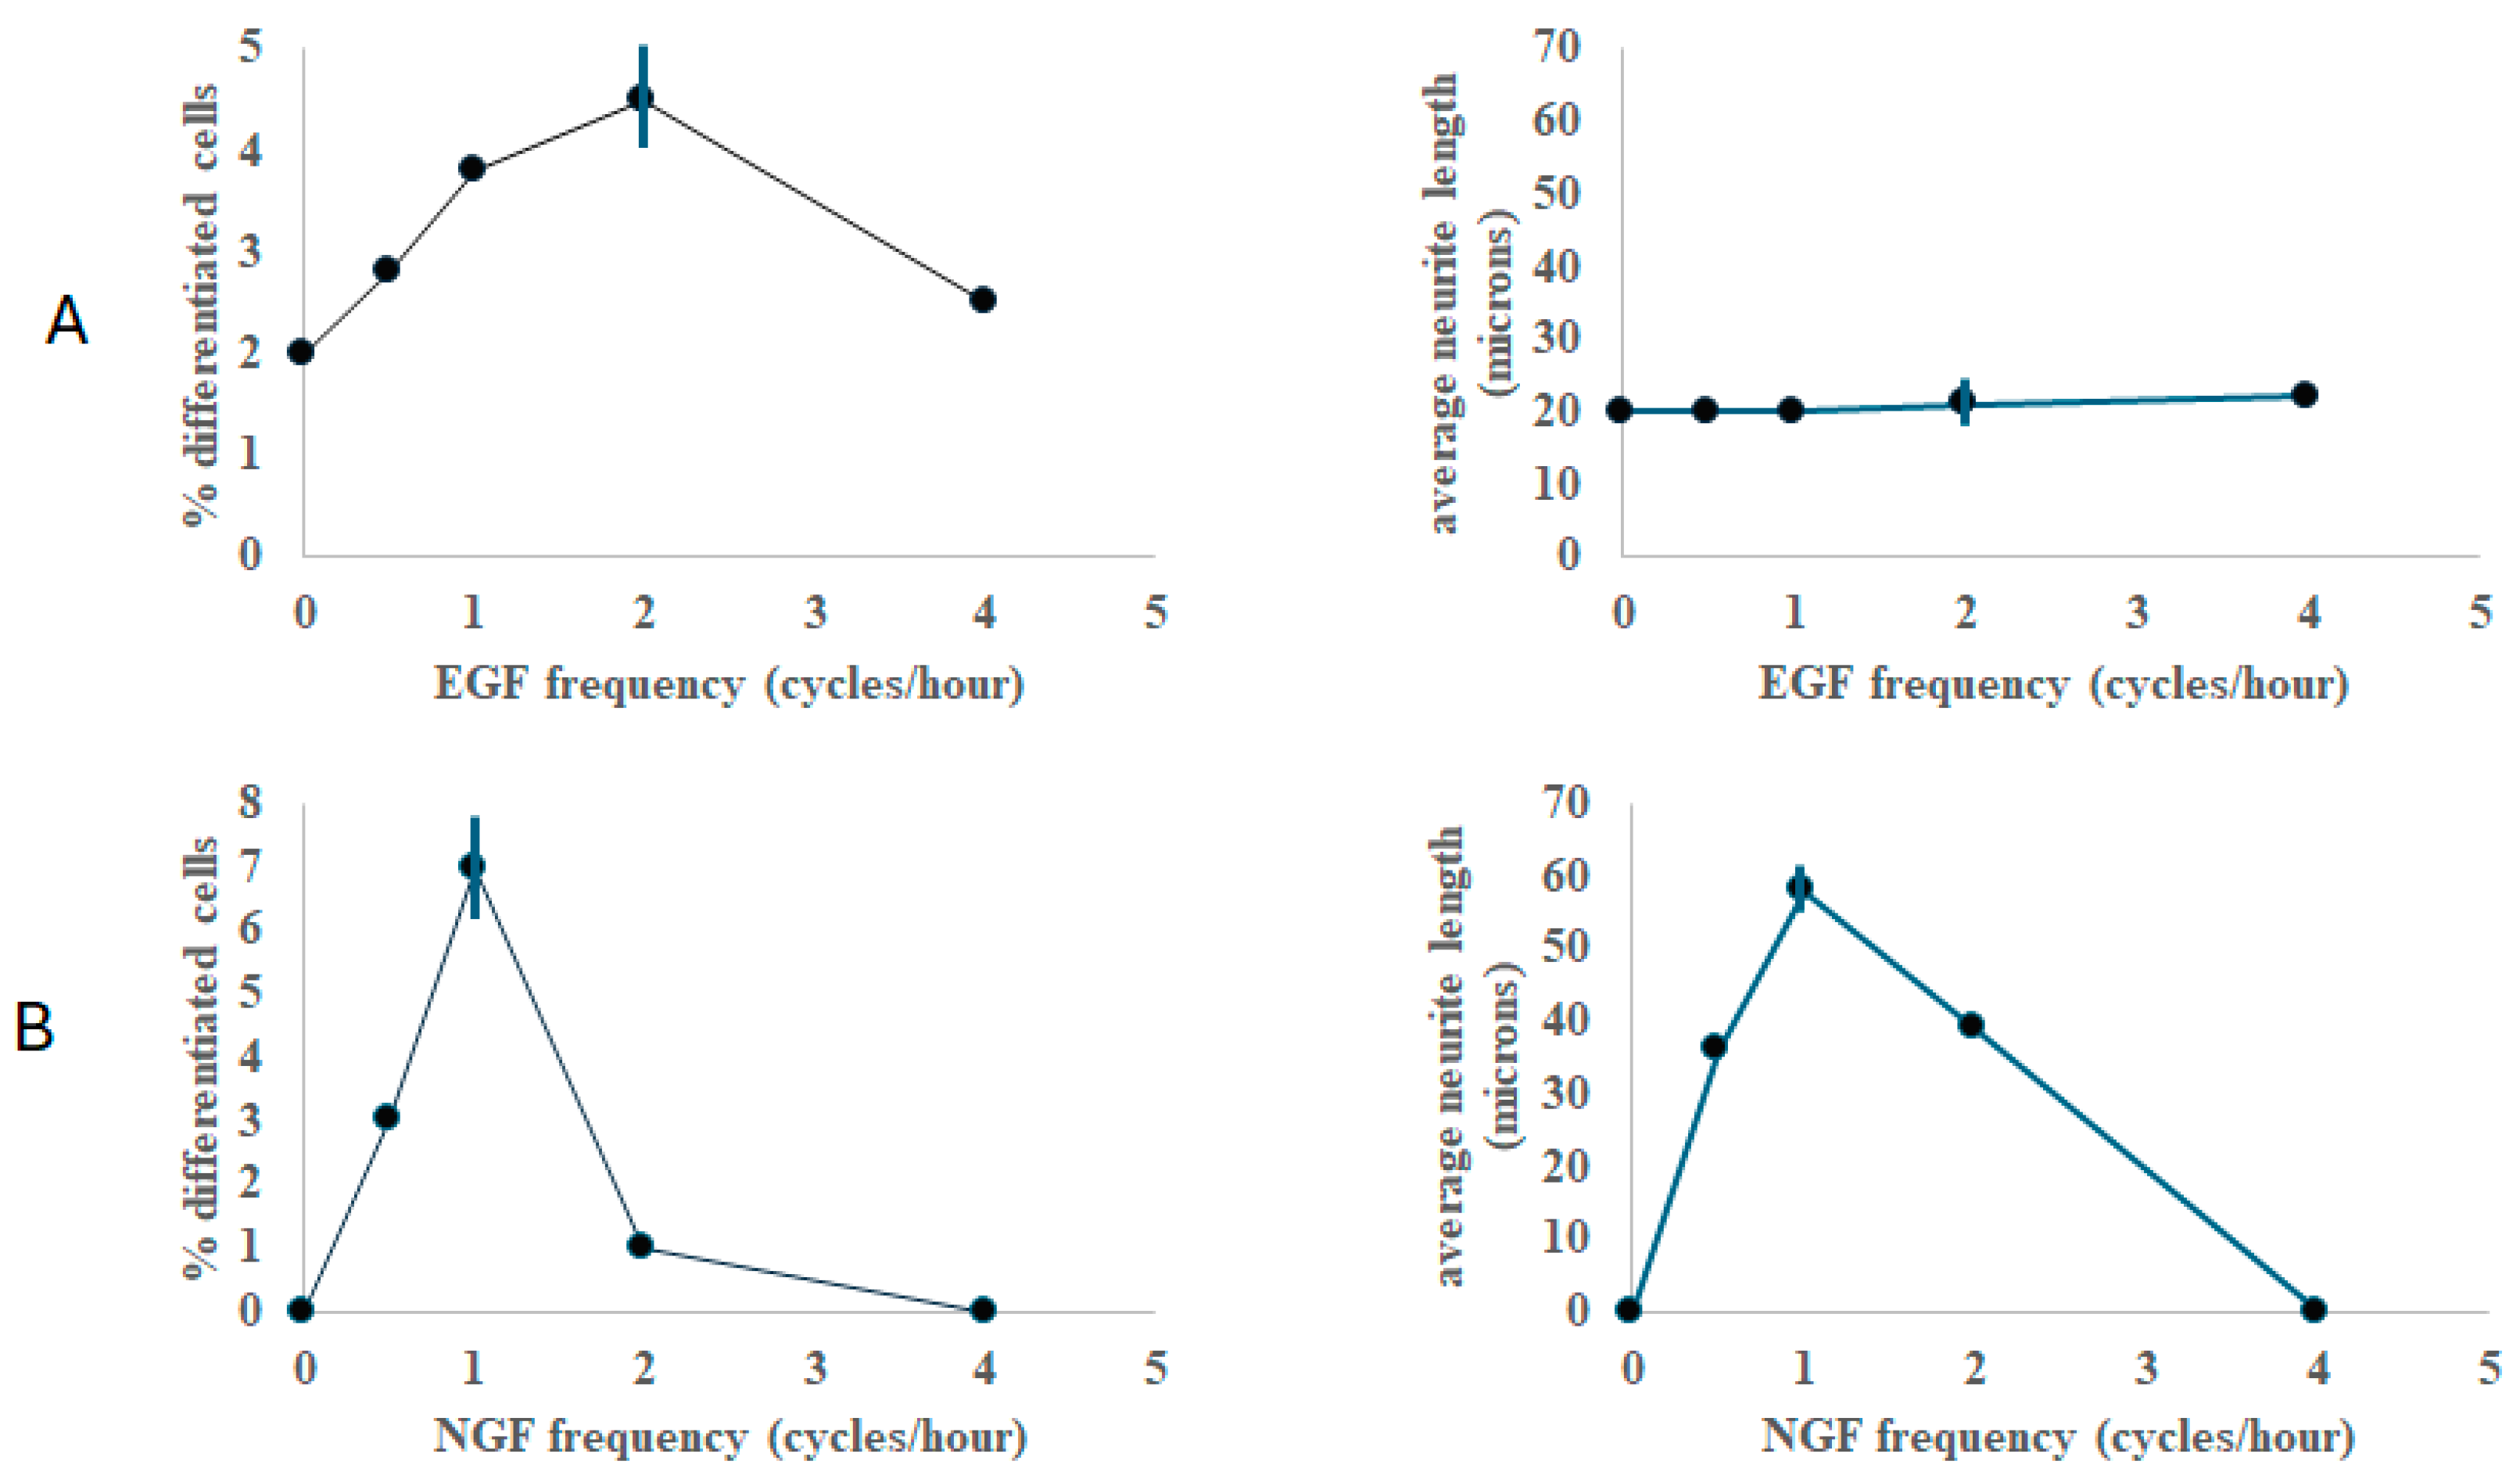
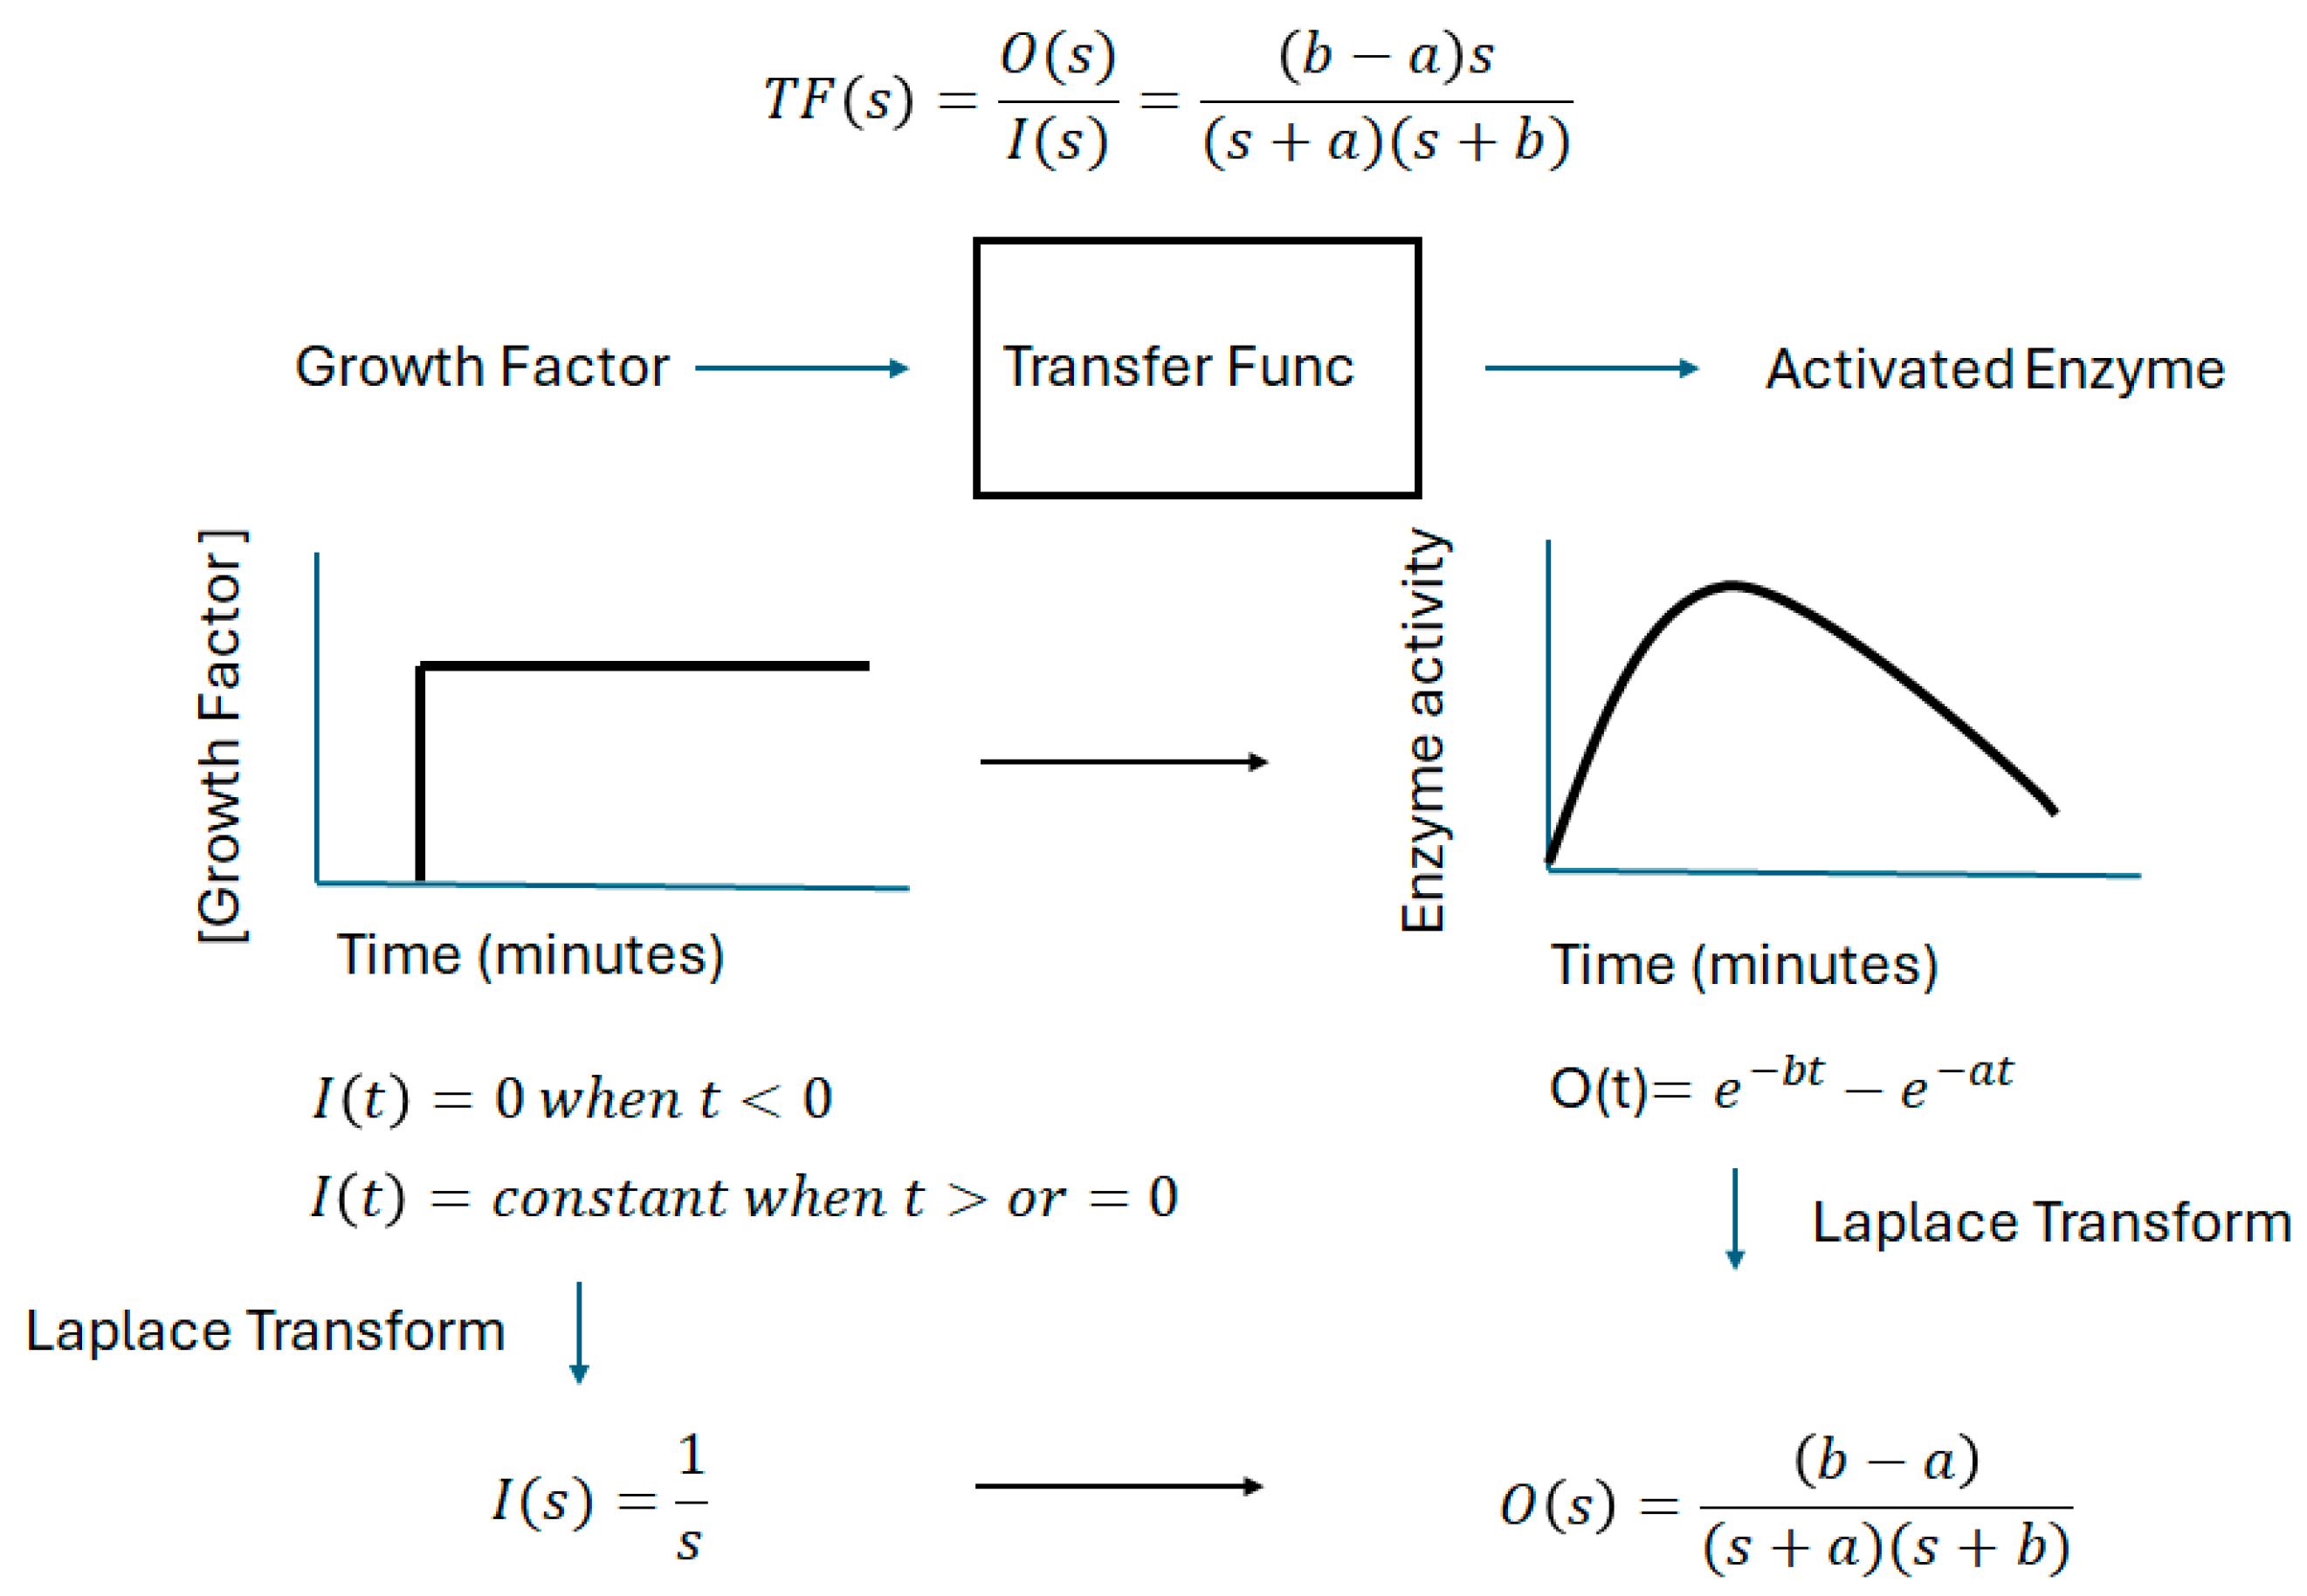
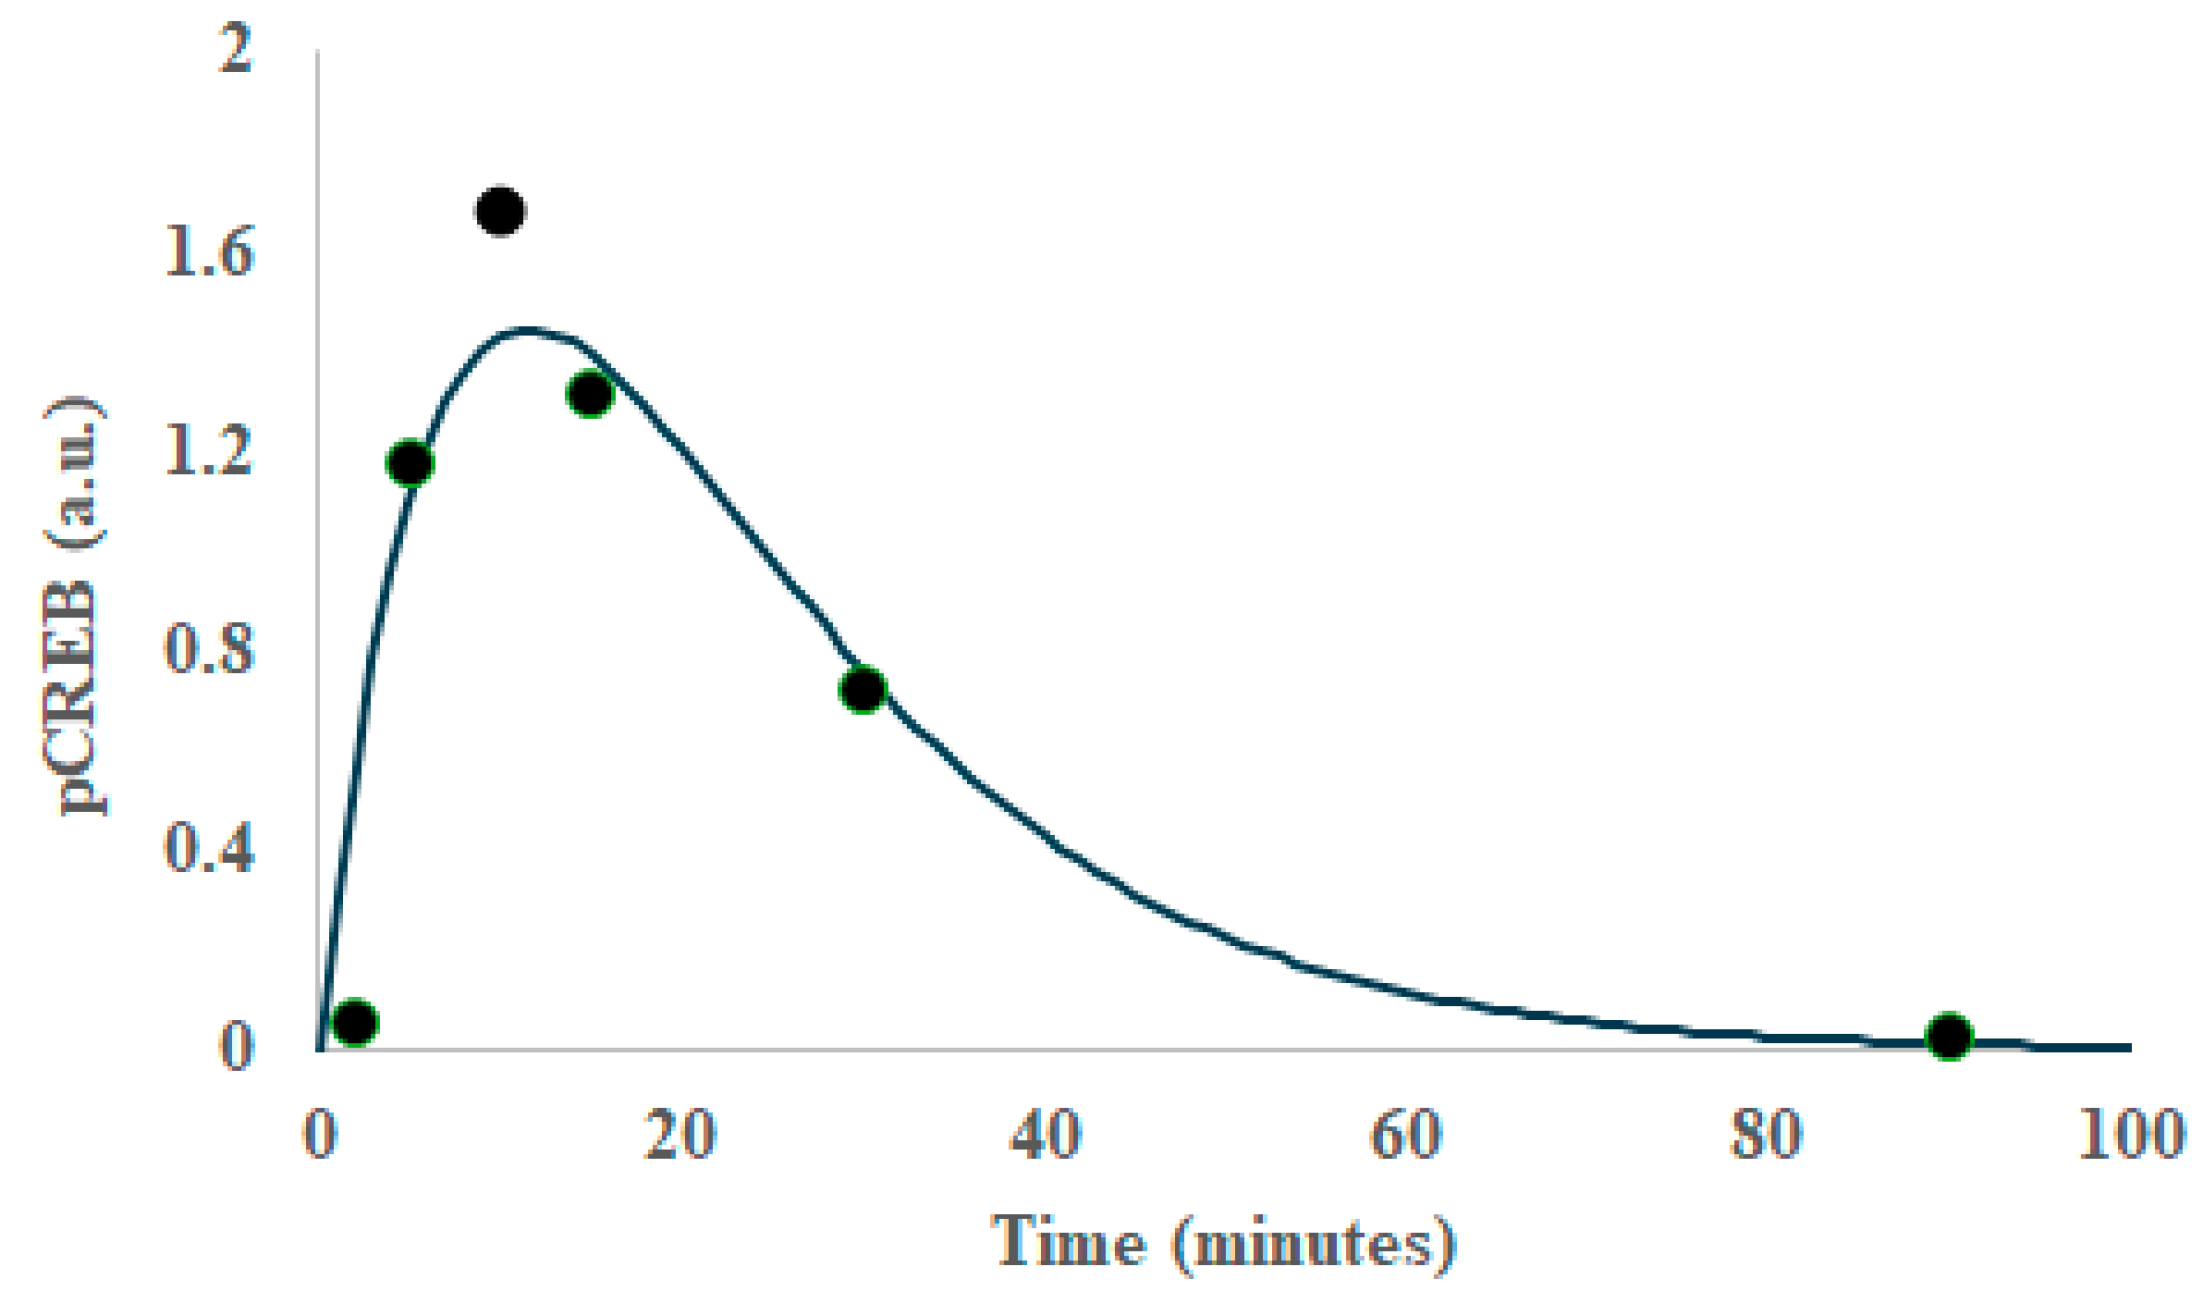
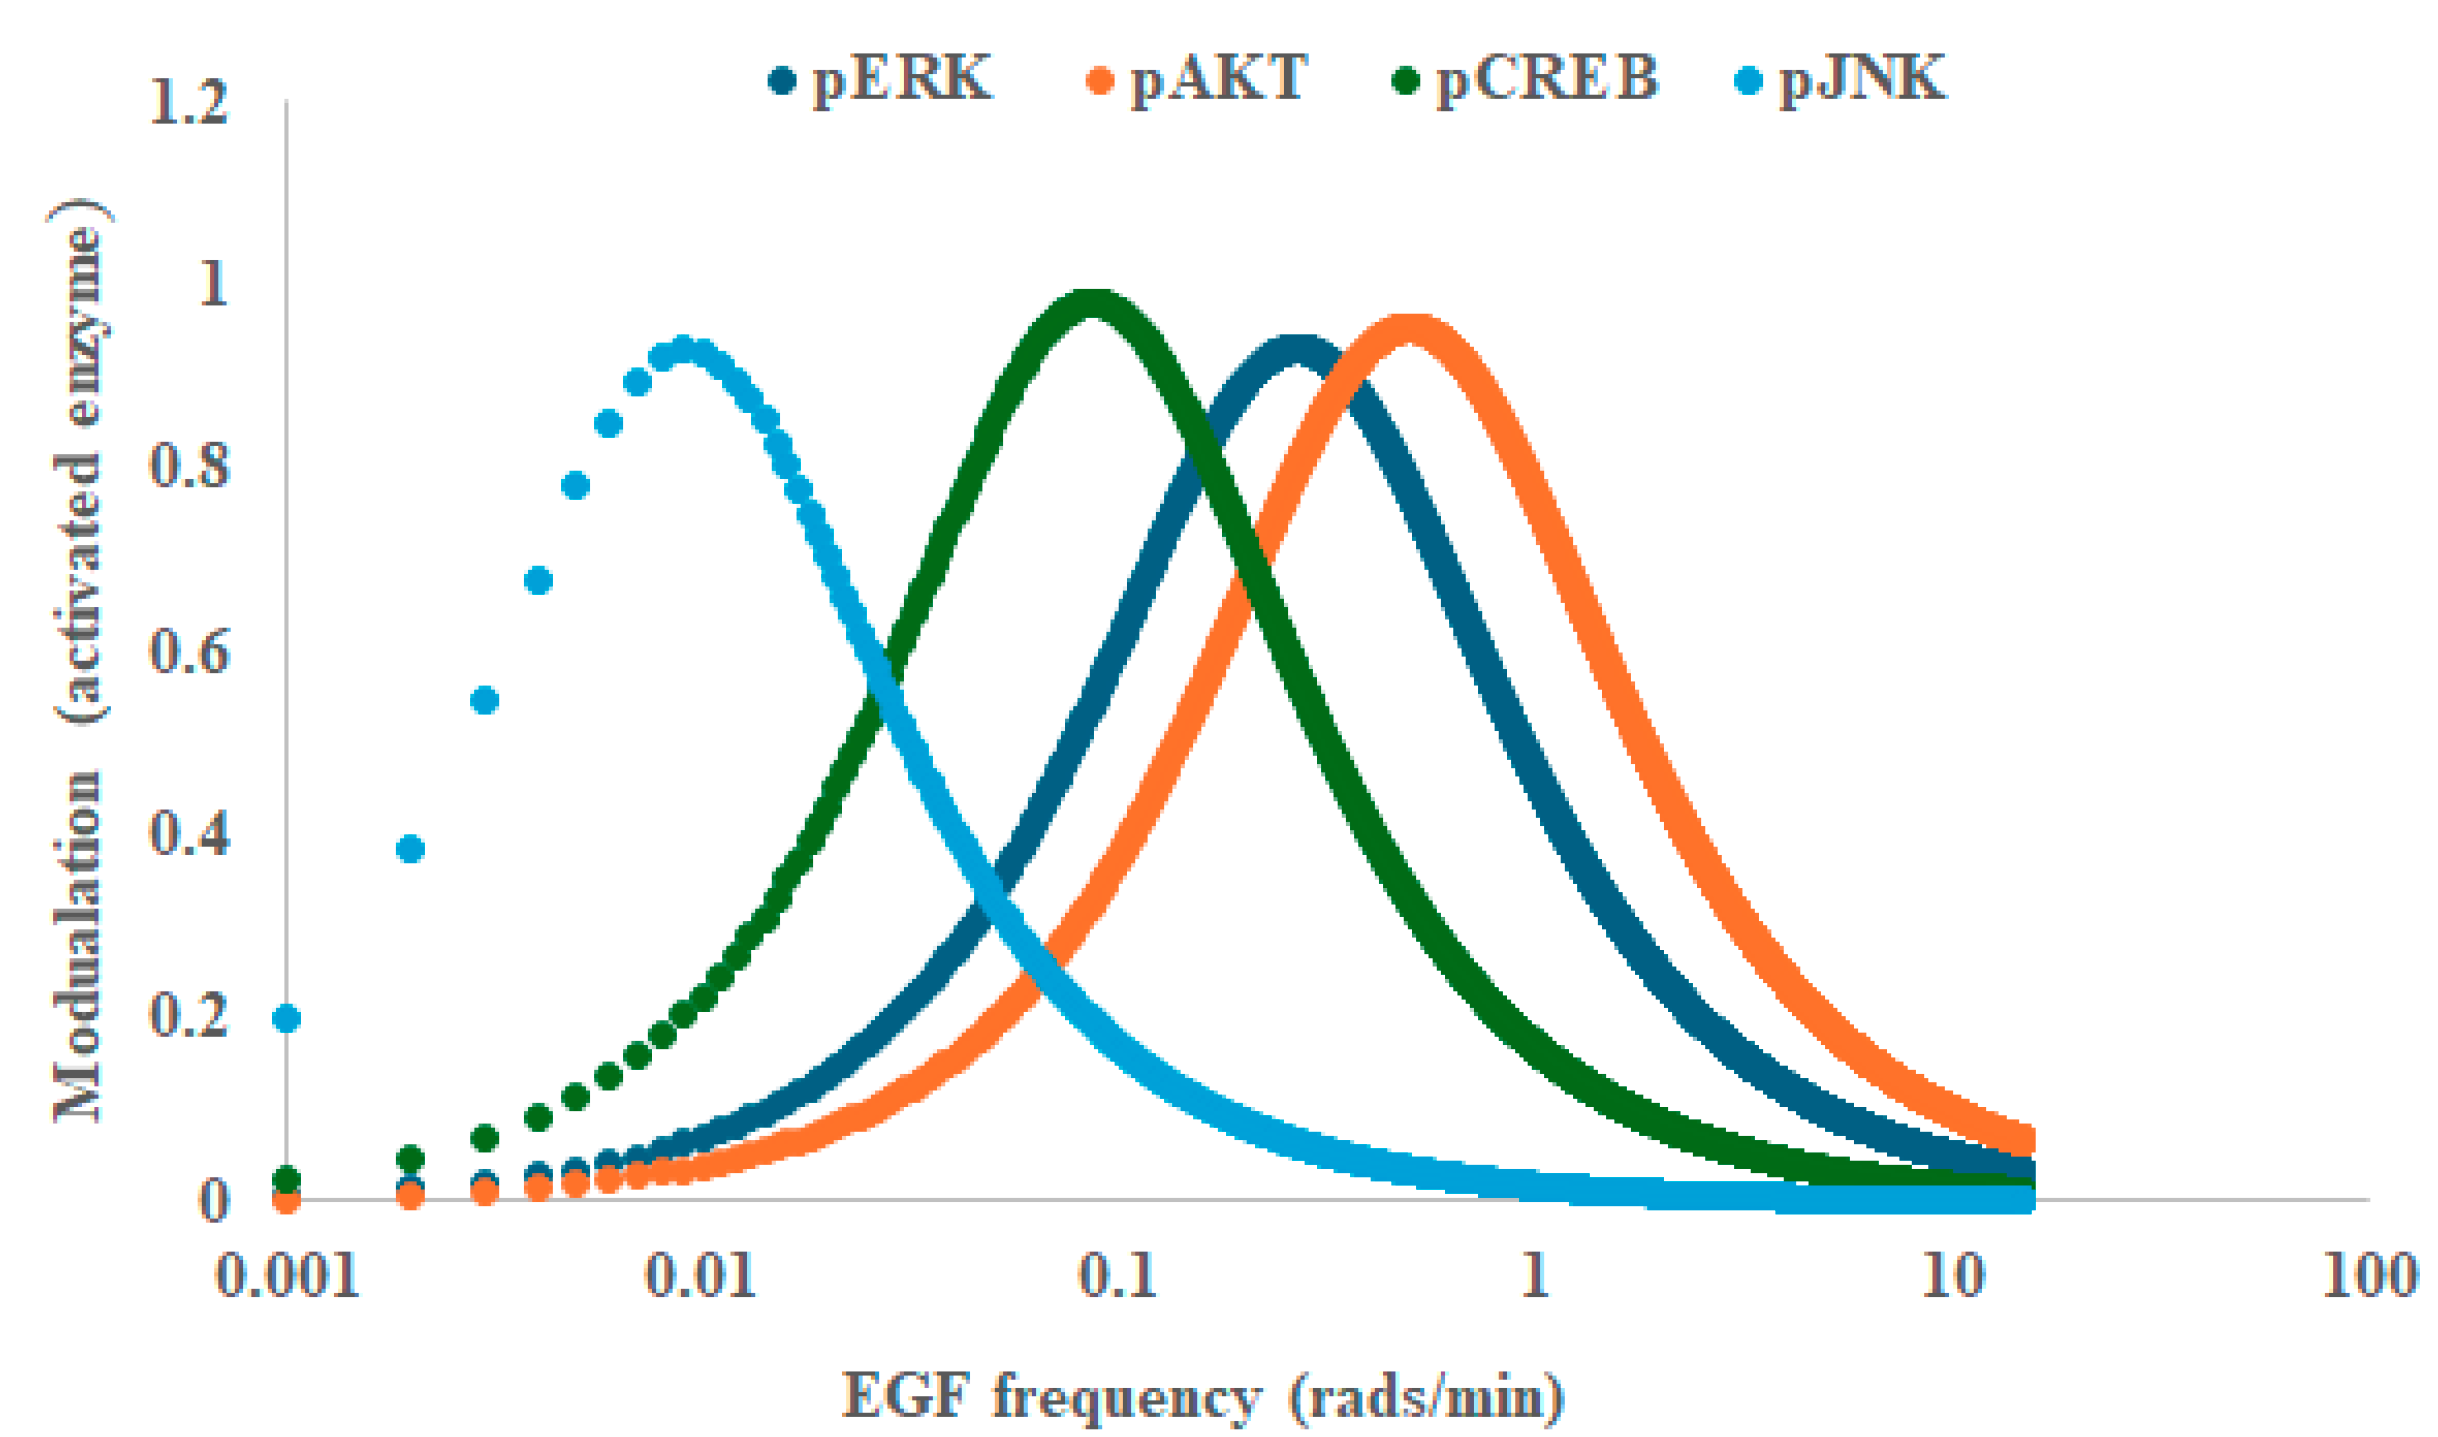
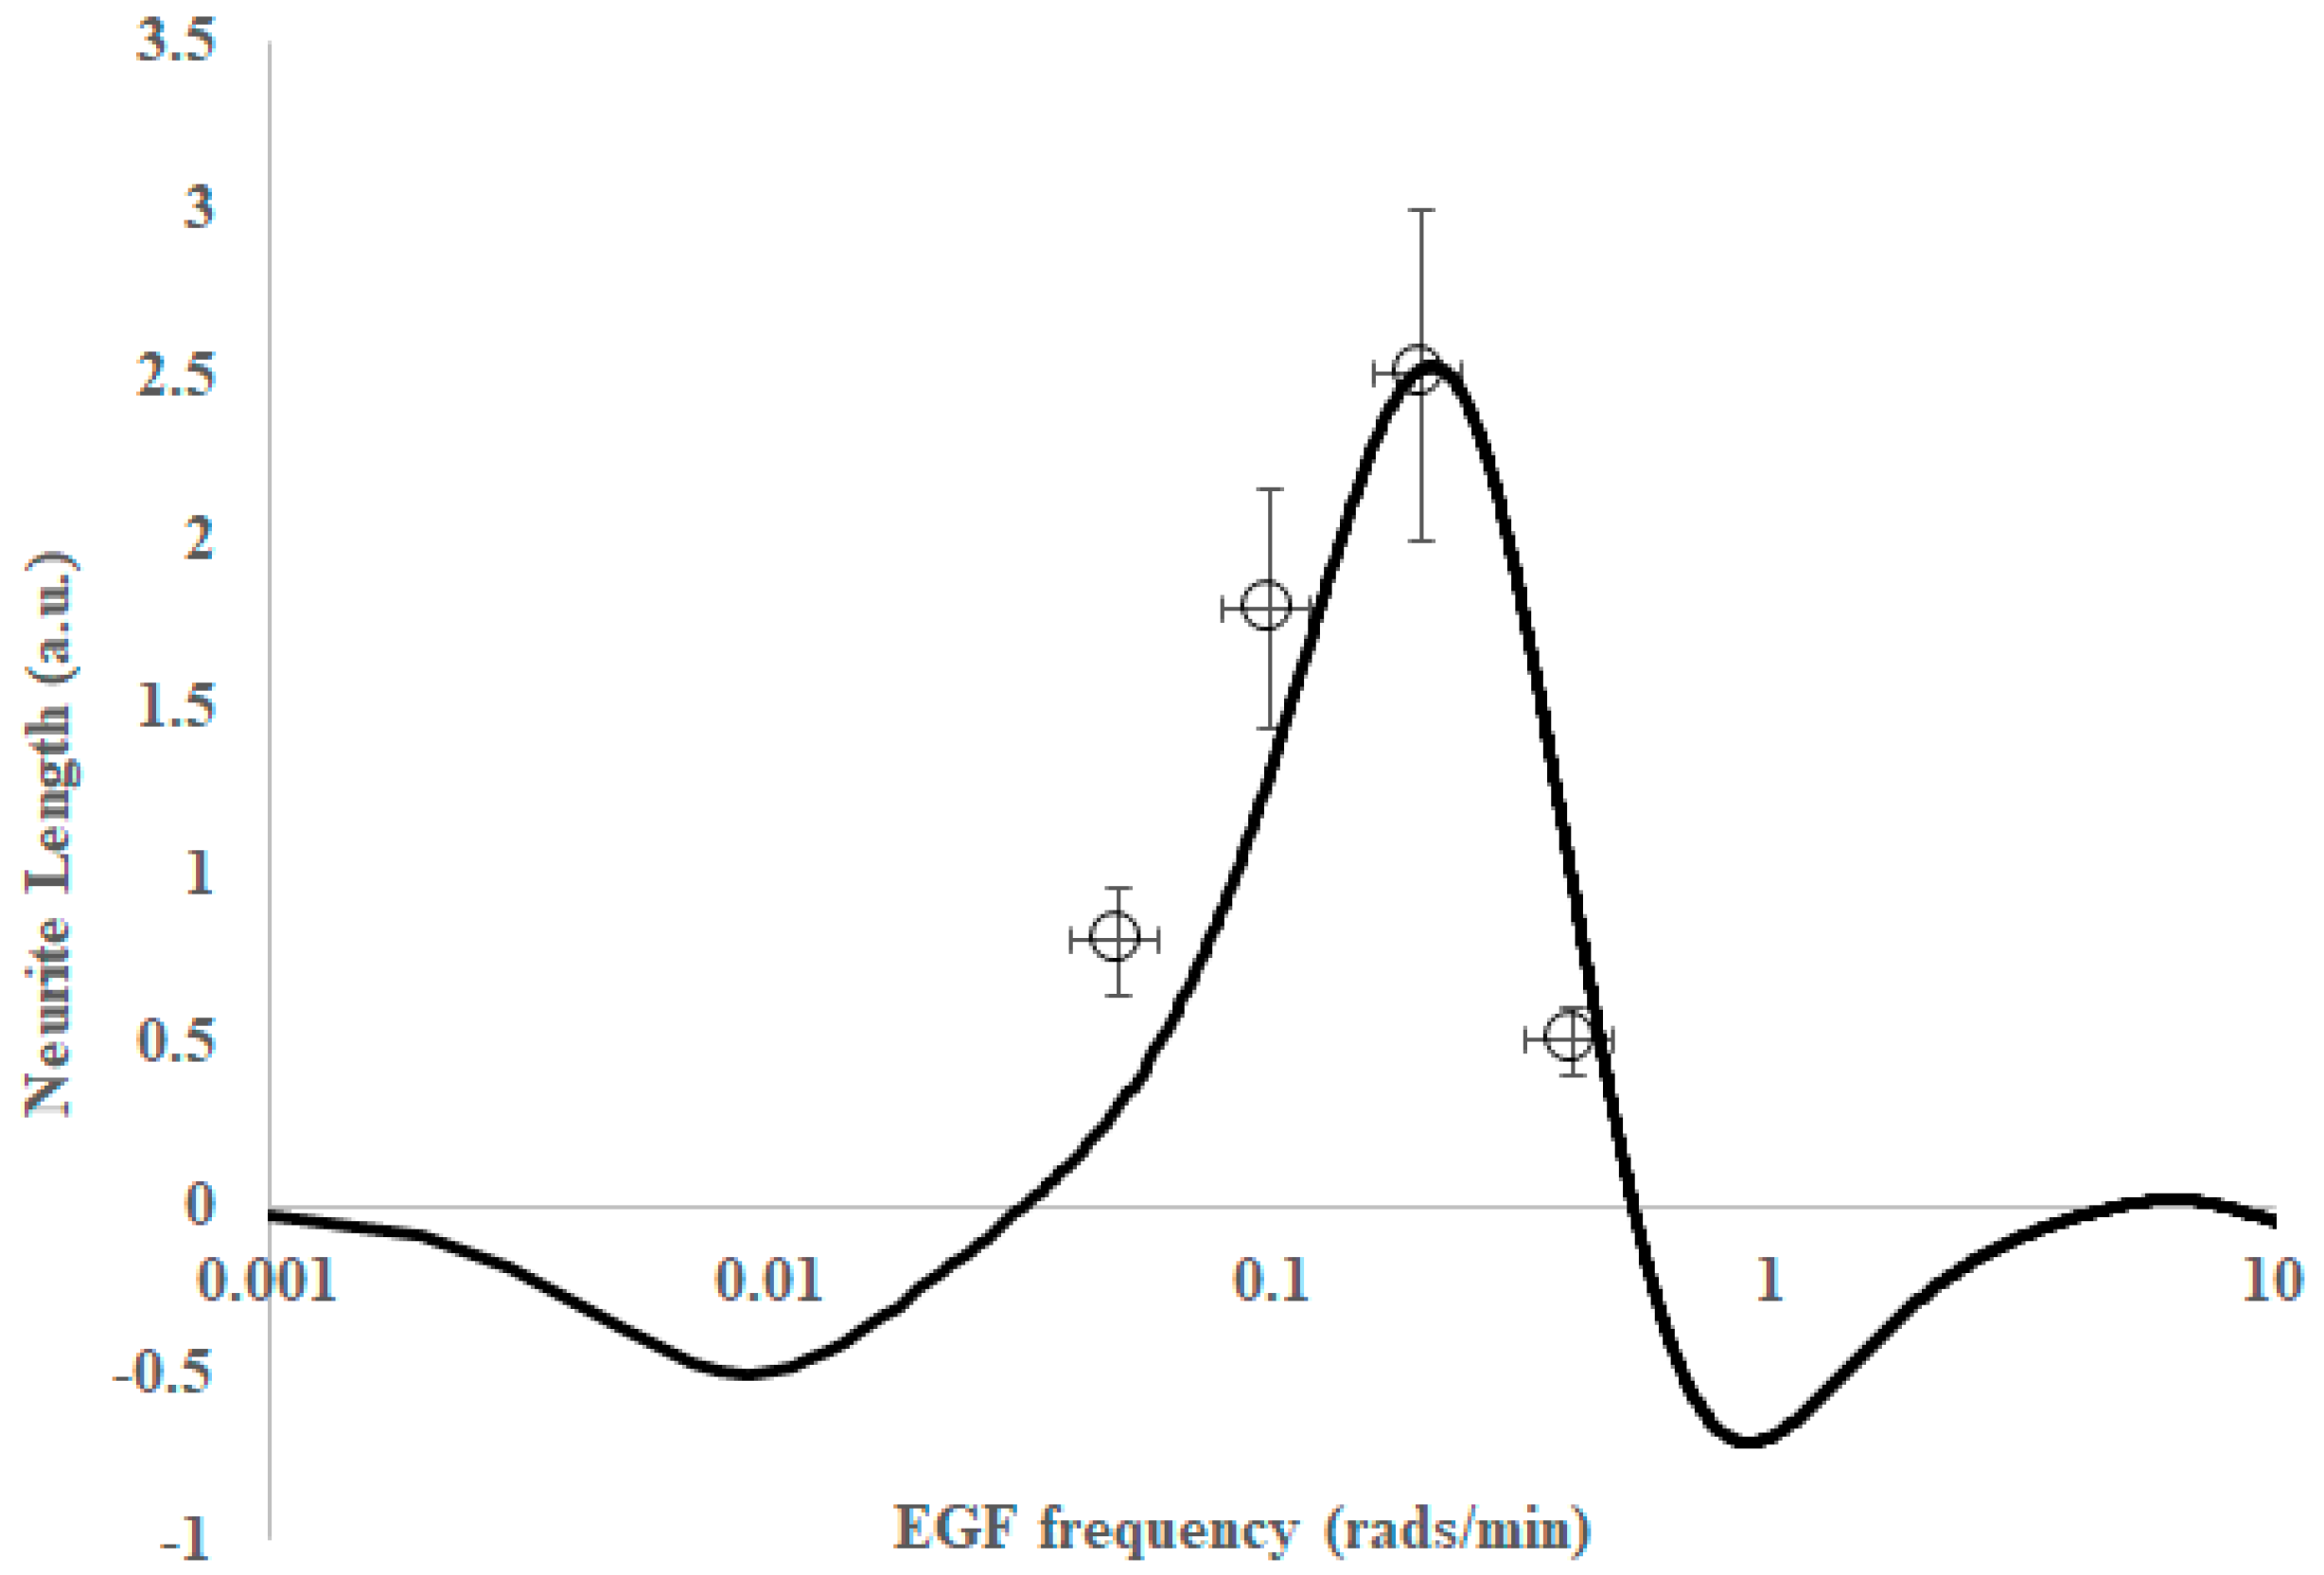
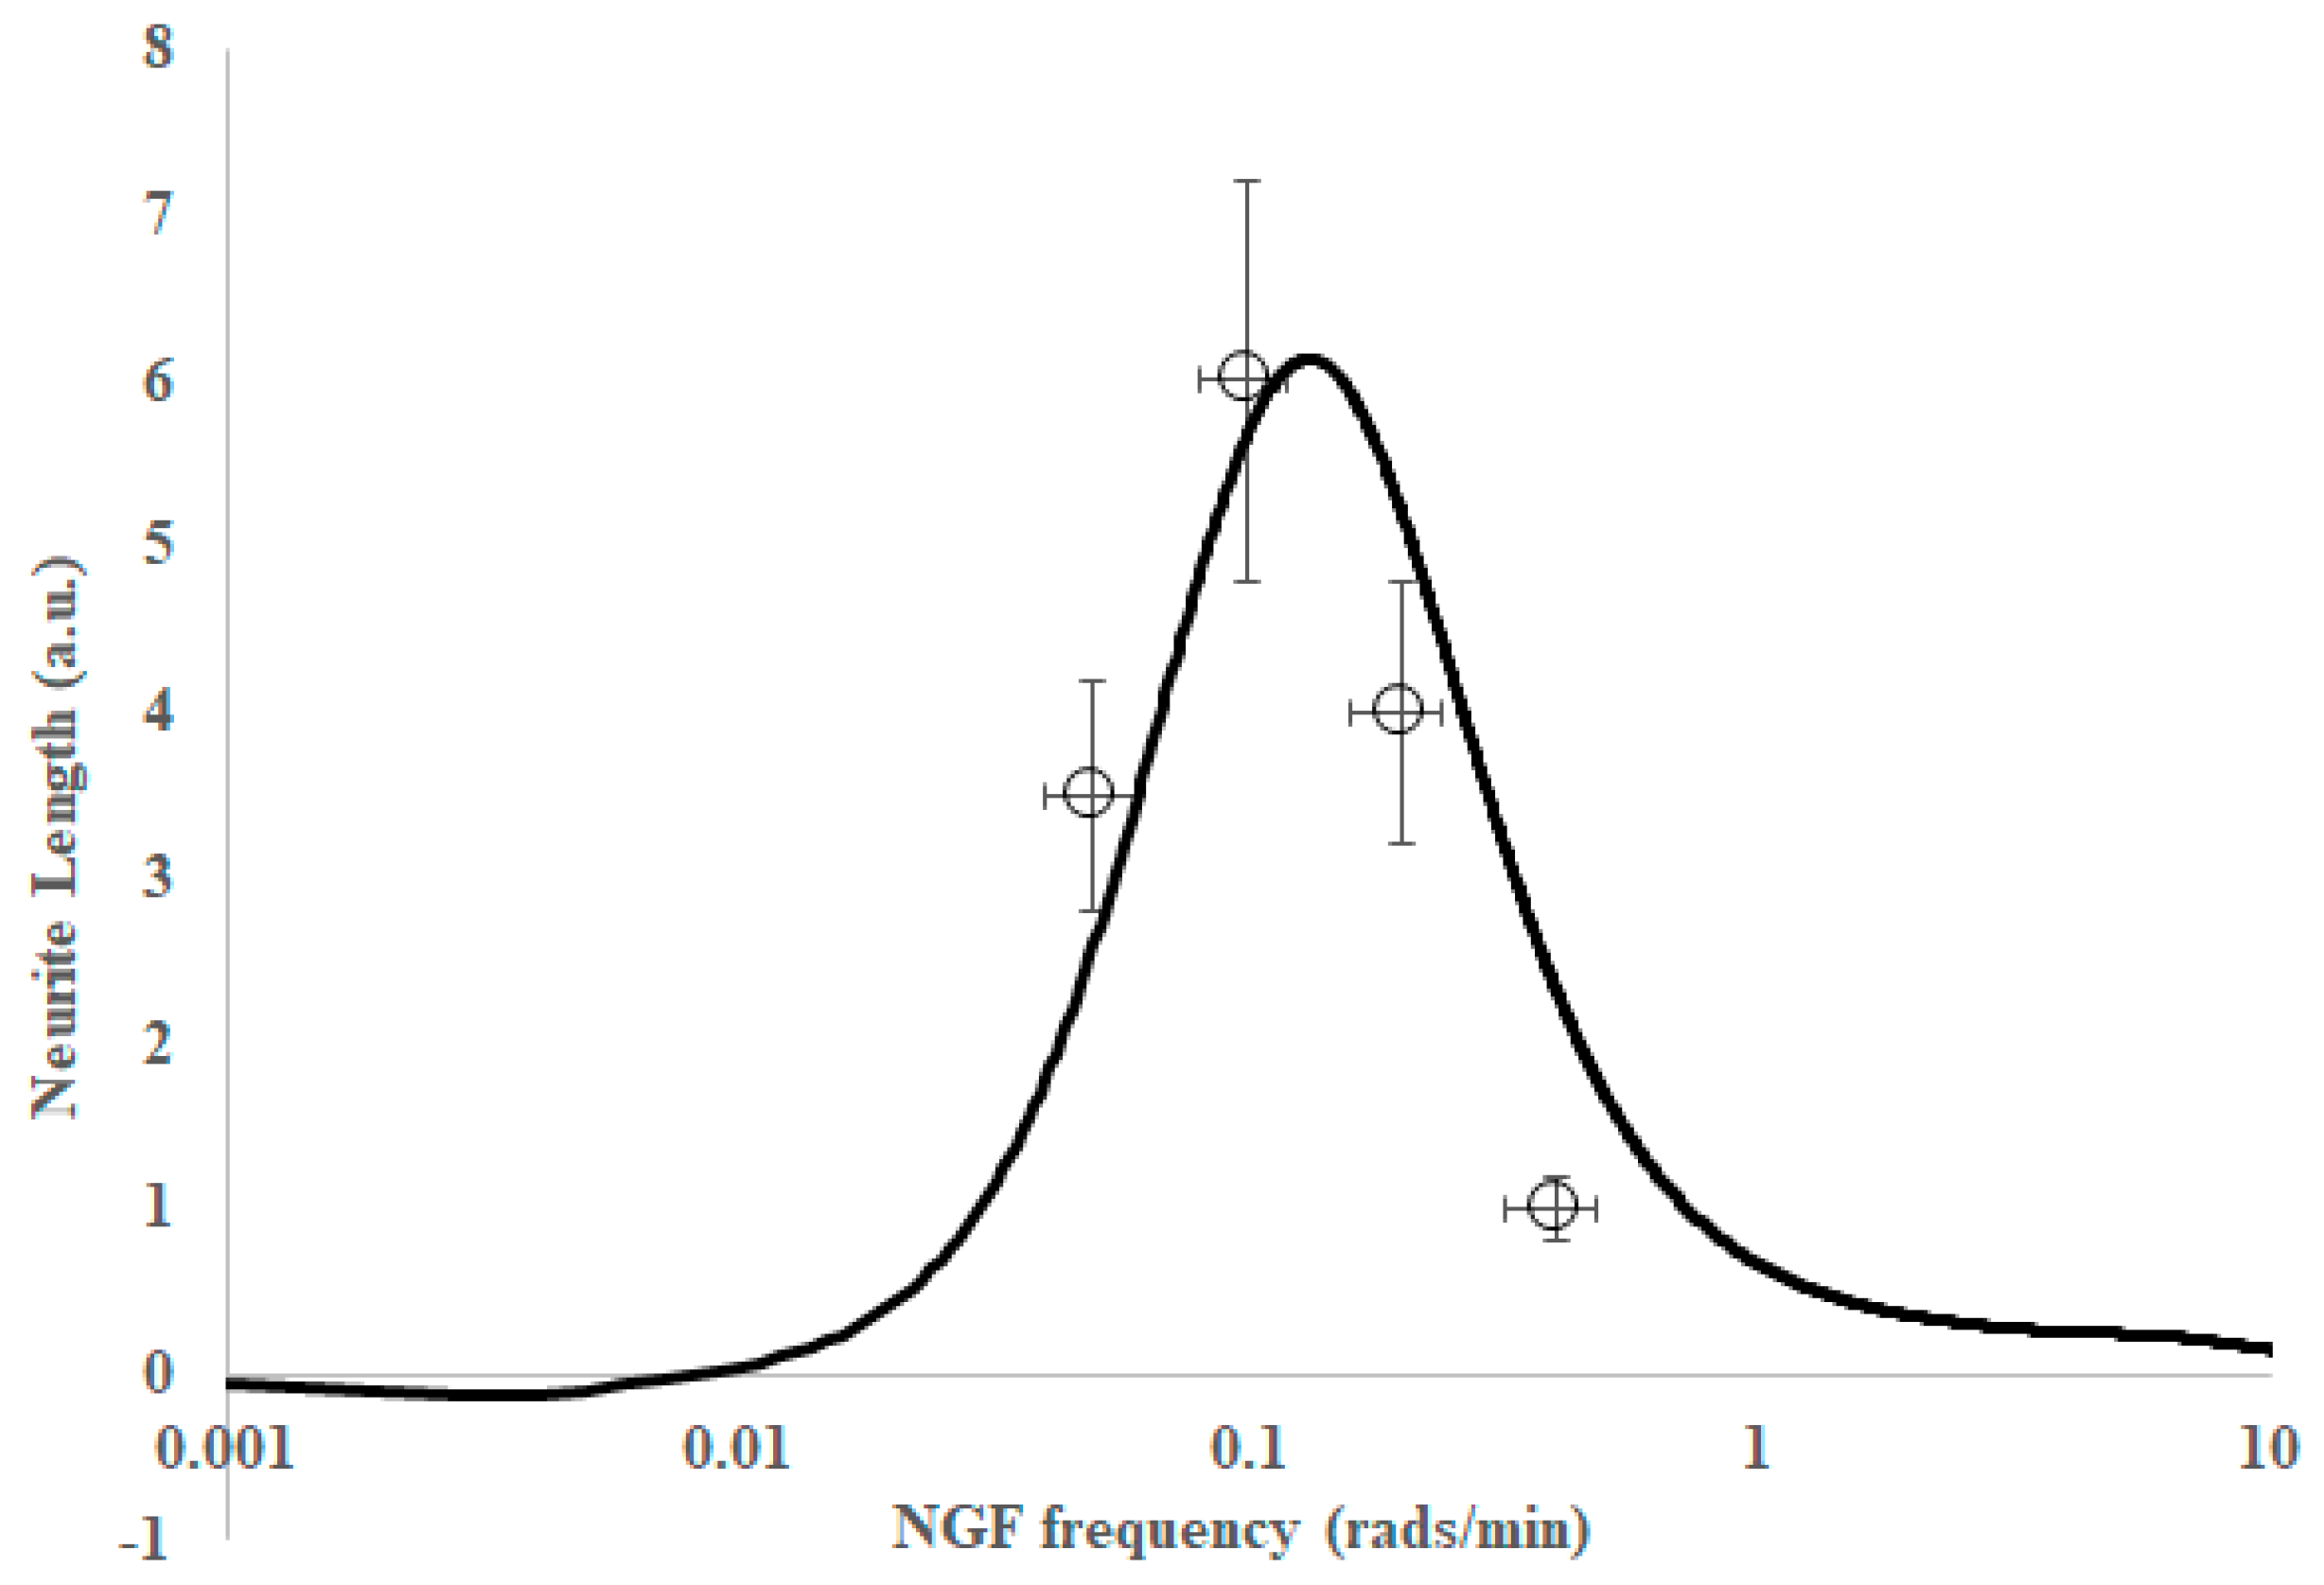
2. Results
3. Discussion
4. Materials and Methods
Materials
5. Conclusions
Author Contributions
Funding
Data Availability Statement
Conflicts of Interest
Abbreviations
| ERK | Extracellular signal-regulated kinase |
| JNK | c-Jun N-terminal kinase |
| CREB | cAMP Response Element-Binding Protein |
| AKT | Protein kinase B |
| EGF | Epidermal growth factor |
| NGF | Nerve growth factor |
References
- Marshall, C.J. Specificity of receptor tyrosine kinase signaling: Transient versus sustained extracellular signal-regulated kinase activation. Cell 1995, 80, 179–185. [Google Scholar] [CrossRef] [PubMed]
- Antebi, Y.E.; Nandagopal, N.; Elowitz, M.B. An operational view of intercellular signaling pathways. Curr. Opin. Syst. Biol. 2017, 1, 16–24. [Google Scholar] [CrossRef] [PubMed]
- Levine, J.H.; Lin, Y.; Elowitz, M.B. Functional roles of pulsing in genetic circuits. Science 2013, 342, 1193–1200. [Google Scholar] [CrossRef]
- Hoffmann, A.; Levchenko, A.; Scott, M.L.; Baltimore, D. The IkappaB-NF-kappaB signaling module: Temporal control and selective gene activation. Science 2002, 298, 1241–1245. [Google Scholar] [CrossRef] [PubMed]
- Tang, Y.; Adelaja, A.; Ye, F.X.-F.; Deeds, E.; Wollman, R.; Hoffmann, A. Quantifying information accumulation encoded in the dynamics of biochemical signaling. Nat. Commun. 2021, 12, 1272. [Google Scholar] [CrossRef]
- Purvis, J.E.; Karhohs, K.W.; Mock, C.; Batchelor, E.; Loewer, A.; Lahav, G. P53 dynamics control cell fate. Science 2012, 336, 1440–1444. [Google Scholar] [CrossRef]
- Sorre, B.; Warmflash, A.; Brivanlou, A.H.; Siggia, E.D. Encoding of temporal signals by the TGF-β pathway and implications for embryonic patterning. Dev. Cell 2014, 30, 334–342. [Google Scholar] [CrossRef]
- Jovic, A.; Howell, B.; Cote, M.; Wade, S.M.; Mehta, K.; Miyawaki, A.; Neubig, R.R.; Linderman, J.J.; Takayama, S. Phase-locked signals elucidate circuit architecture of an oscillatory pathway. PLoS Comput. Biol. 2010, 6, e1001040. [Google Scholar] [CrossRef]
- Hafner, A.; Stewart-Ornstein, J.; Purvis, J.E.; Forrester, W.C.; Bulyk, M.L.; Lahav, G. P53 pulses lead to distinct patterns of gene expression albeit similar DNA-binding dynamics. Nat. Struct. Mol. Biol. 2017, 24, 840–847. [Google Scholar] [CrossRef]
- Hansen, A.S.; O’Shea, E.K. Promoter decoding of transcription factor dynamics involves a trade-off between noise and control of gene expression. Mol. Syst. Biol. 2013, 9, 704. [Google Scholar] [CrossRef]
- Harton, M.D.; Koh, W.S.; Bunker, A.D.; Singh, A.; Batchelor, E. P53 pulse modulation differentially regulates target gene promoters to regulate cell fate decisions. Mol. Syst. Biol. 2019, 15, e8685. [Google Scholar] [CrossRef] [PubMed]
- Adelaja, A.; Taylor, B.; Sheu, K.M.; Liu, Y.; Luecke, S.; Hoffmann, A. Six distinct NFκB signaling codons convey discrete information to distinguish stimuli and enable appropriate macrophage responses. Immunity 2021, 54, 916–930.e7. [Google Scholar] [CrossRef] [PubMed]
- Zambrano, S.; De Toma, I.; Piffer, A.; Bianchi, M.E.; Agresti, A. NF-κB oscillations translate into functionally related patterns of gene expression. eLife 2016, 5, e09100. [Google Scholar] [CrossRef] [PubMed]
- Hansen, A.S.; O’Shea, E.K. Limits on information transduction through amplitude and frequency regulation of transcription factor activity. eLife 2015, 4, e06559. [Google Scholar] [CrossRef]
- Tomida, T.; Oda, S.; Takekawa, M.; Iino, Y.; Saito, H. The Temporal Pattern of Stimulation Determines the Extent and Duration of MAPK Activation in a Caenorhabditis elegans Sensory Neuron. Sci. Signal. 2012, 5, ra76. [Google Scholar] [CrossRef]
- Dhumpa, R.; Truong, T.M.; Wang, X.; Roper, M.G. Measurement of the entrainment window of islets of Langerhans by microfluidic delivery of a chirped glucose waveform. Integr. Biol. 2015, 7, 1061–1067. [Google Scholar] [CrossRef]
- Dhumpa, R.; Truong, T.M.; Wang, X.; Bertram, R.; Roper, M.G. Negative feedback synchronizes islets of Langerhans. Biophys. J. 2014, 106, 2275–2282. [Google Scholar] [CrossRef]
- Tay, S.; Hughey, J.J.; Lee, T.K.; Lipniacki, T.; Quake, S.R.; Covert, M.W. Single-cell NF-kappaB dynamics reveal digital activation and analogue information processing. Nature 2010, 466, 267–271. [Google Scholar] [CrossRef]
- Jovic, A.; Wade, S.M.; Miyawaki, A.; Neubig, R.R.; Linderman, J.J.; Takayama, S. Hi-Fi transmission of periodic signals amid cell-to-cell variability. Mol. Biosyst. 2011, 7, 2238–2244. [Google Scholar] [CrossRef]
- Kellogg, R.A.; Tay, S. Noise facilitates transcriptional control under dynamic inputs. Cell 2015, 160, 381–392. [Google Scholar] [CrossRef]
- Ashall, L.; Horton, C.A.; Nelson, D.E.; Paszek, P.; Harper, C.V.; Sillitoe, K.; Ryan, S.; Spiller, D.G.; Unitt, J.F.; Broomhead, D.S.; et al. Pulsatile stimulation determines timing and specificity of NF-kappaB-dependent transcription. Science 2009, 324, 242–246. [Google Scholar] [CrossRef] [PubMed]
- Sumit, M.; Takayama, S.; Linderman, J.J. New insights into mammalian signaling pathways using microfluidic pulsatile inputs and mathematical modeling. Integr. Biol. 2017, 9, 6–21. [Google Scholar] [CrossRef] [PubMed]
- Tran, N.H.N.; Clayton, A.H.A. Transfer function approach to understanding periodic forcing of signal transduction networks. Phys. Biol. 2023, 20, 035001. [Google Scholar] [CrossRef] [PubMed]
- Mettetal, J.T.; Muzzey, D.; Gómez-Uribe, C.; van Oudenaarden, A. The Frequency Dependence of Osmo-Adaptation in Saccharomyces cerevisiae. Science 2008, 319, 482–484. [Google Scholar] [CrossRef]
- Mitchell, A.; Wei, P.; Lim, W.A. Oscillatory stress stimulation uncovers an Achilles’ heel of the yeast MAPK signaling network. Science 2015, 350, 1379–1383. [Google Scholar] [CrossRef]
- Ningsih, Z.; Clayton, A.H.A. Does frequency-dependent cell proliferation exhibit a Fano-type resonance? Phys. Biol. 2020, 17, 044001. [Google Scholar] [CrossRef]
- Ryu, H.; Chung, M.; Dobrzyński, M.; Fey, D.; Blum, Y.; Sik Lee, S.; Peter, M.; Kholodenko, B.N.; Li Jeon, N.; Pertz, O. Frequency modulation of ERK activation dynamics rewires cell fate. Mol. Syst. Biol. 2015, 11, 838. [Google Scholar] [CrossRef]
- Albeck, J.G.; Mills, G.B.; Brugge, J.S. Frequency-modulated pulses of ERK activity transmit quantitative proliferation signals. Mol. Cell 2013, 49, 249–261. [Google Scholar] [CrossRef]
- Bugaj, L.J.; Sabnis, A.J.; Mitchell, A.; Garbarino, J.E.; Toettcher, J.E.; Bivona, T.G.; Lim, W.A. Cancer mutations and targeted drugs can disrupt dynamic signal encoding by the Ras-Erk pathway. Science 2018, 361, eaao3048. [Google Scholar] [CrossRef]
- Pokrass, M.J.; Ryan, K.A.; Xin, T.; Pielstick, B.; Timp, W.; Greco, V.; Regot, S. Cell-Cycle-Dependent ERK Signaling Dynamics Direct Fate Specification in the Mammalian Preimplantation Embryo. Dev. Cell 2020, 55, 328–340.e5. [Google Scholar] [CrossRef]
- Aikin, T.J.; Peterson, A.F.; Pokrass, M.J.; Clark, H.R.; Regot, S. MAPK activity dynamics regulate non-cell autonomous effects of oncogene expression. eLife 2020, 9, e60541. [Google Scholar] [CrossRef] [PubMed]
- Goglia, A.G.; Wilson, M.Z.; Jena, S.G.; Silbert, J.; Basta, L.P.; Devenport, D.; Toettcher, J.E. A Live-Cell Screen for Altered Erk Dynamics Reveals Principles of Proliferative Control. Cell Syst. 2020, 10, 240–253.e6. [Google Scholar] [CrossRef] [PubMed]
- Johnson, H.E.; Toettcher, J.E. Signaling Dynamics Control Cell Fate in the Early Drosophila Embryo. Dev. Cell 2019, 48, 361–370.e3. [Google Scholar] [CrossRef]
- Arekatla, G.; Trenzinger, C.; Reimann, A.; Loeffler, D.; Kull, T.; Schroeder, T. Optogenetic manipulation identifies the roles of ERK and AKT dynamics in controlling mouse embryonic stem cell exit from pluripotency. Dev. Cell 2023, 58, 1022–1036.e4. [Google Scholar] [CrossRef] [PubMed]
- Min, M.; Rong, Y.; Tian, C.; Spencer, S.L. Temporal integration of mitogen history in mother cells controls proliferation of daughter cells. Science 2020, 368, 1261–1265. [Google Scholar] [CrossRef] [PubMed]
- Gagliardi, P.A.; Dobrzynski, M.; Jacques, M.A.; Dessauges, C.; Ender, P.; Blum, Y.; Hughes, R.M.; Cohen, A.R.; Pertz, O. Collective ERK/Akt activity waves orchestrate epithelial homeostasis by driving apoptosis-induced survival. Dev. Cell 2021, 56, 1712–1726.e6. [Google Scholar] [CrossRef]
- Ningsih, Z. How Do Cells Process Information? Ph.D. Thesis, Swinburne University of Technology, Melbourne, Australia, 2017. [Google Scholar]
- Akimoto, Y.; Yugi, K.; Uda, S.; Kudo, T.; Komori, Y.; Kubota, H.; Kuroda, S. The Extraction of Simple Relationships in Growth Factor-Specific Multiple-Input and Multiple-Output Systems in Cell-Fate Decisions by Backward Elimination PLS Regression. PLoS ONE 2013, 8, e72780. [Google Scholar] [CrossRef]
- Joslin, E.J.; Shankaran, H.; Opresko, L.K.; Bollinger, N.; Lauffenburger, D.A.; Wiley, H.S. Structure of the egf receptor transactivation circuit integrates multiple signals with cell context. Mol. BioSyst. 2010, 6, 1293–1306. [Google Scholar] [CrossRef]
- Ningsih, Z.; Chon, J.W.M.; Clayton, A.H.A. A Microfluidic Device for Spatiotemporal Delivery of Stimuli to Cells. Aims Biophys. 2015, 2, 58–72. [Google Scholar] [CrossRef]
- Tran, N.H.N.; Frascoli, F.; Clayton, A.H.A. A Frequency Domain Analysis of the Growth Factor-Driven Extra-Cellular-Regulated Kinase (ERK) Pathway. Biology 2025, 14, 374. [Google Scholar] [CrossRef]
- Stern, A.D.; Smith, G.R.; Santos, L.C.; Sarmah, D.; Zhang, X.; Lu, X.; Iuricich, F.; Pandey, G.; Iyengar, R.; Birtwistle, M.R. Relating individual cell division events to single-cell ERK and Akt activity time courses. Sci. Rep. 2022, 12, 18077. [Google Scholar] [CrossRef] [PubMed]
- Guo, L.; Zhu, K.; Pargett, M.; Contreras, A.; Tsai, P.; Qing, Q.; Losert, W.; Albeck, J.; Zhao, M. Electrically synchronizing and modulating the dynamics of ERK activation to regulate cell fate. iScience 2021, 24, 103240. [Google Scholar] [CrossRef] [PubMed]

| Growth Factor/Enzyme | A (per Minute) | B (per Minute) |
|---|---|---|
| EGF/JNK | 0.012 | 0.018 |
| EGF/CREB | 0.081 | 0.092 |
| EGF/ERK | 0.243 | 0.293 |
| EGF/AKT | 0.391 | 0.636 |
| NGF/JNK | 0.012 | 0.018 |
| NGF/CREB | 0.040 | 0.048 |
| NGF/ERK | 0.113 | 0.147 |
| NGF/AKT | 0.032 | 0.045 |
Disclaimer/Publisher’s Note: The statements, opinions and data contained in all publications are solely those of the individual author(s) and contributor(s) and not of MDPI and/or the editor(s). MDPI and/or the editor(s) disclaim responsibility for any injury to people or property resulting from any ideas, methods, instructions or products referred to in the content. |
© 2025 by the authors. Licensee MDPI, Basel, Switzerland. This article is an open access article distributed under the terms and conditions of the Creative Commons Attribution (CC BY) license (https://creativecommons.org/licenses/by/4.0/).
Share and Cite
Ningsih, Z.; Tran, N.H.N.; Clayton, A.H.A. Frequency-Dependent Premature Differentiation of Pheochromocytoma Cells Exhibits Band-Pass Filter Behavior Correlation with Intracellular Enzyme Activation Kinetics. Int. J. Mol. Sci. 2025, 26, 5287. https://doi.org/10.3390/ijms26115287
Ningsih Z, Tran NHN, Clayton AHA. Frequency-Dependent Premature Differentiation of Pheochromocytoma Cells Exhibits Band-Pass Filter Behavior Correlation with Intracellular Enzyme Activation Kinetics. International Journal of Molecular Sciences. 2025; 26(11):5287. https://doi.org/10.3390/ijms26115287
Chicago/Turabian StyleNingsih, Zubaidah, Nguyen H. N. Tran, and Andrew H. A. Clayton. 2025. "Frequency-Dependent Premature Differentiation of Pheochromocytoma Cells Exhibits Band-Pass Filter Behavior Correlation with Intracellular Enzyme Activation Kinetics" International Journal of Molecular Sciences 26, no. 11: 5287. https://doi.org/10.3390/ijms26115287
APA StyleNingsih, Z., Tran, N. H. N., & Clayton, A. H. A. (2025). Frequency-Dependent Premature Differentiation of Pheochromocytoma Cells Exhibits Band-Pass Filter Behavior Correlation with Intracellular Enzyme Activation Kinetics. International Journal of Molecular Sciences, 26(11), 5287. https://doi.org/10.3390/ijms26115287