
Microheterogeneity in Liquid Water Associated with Hydrogen-Bond Cooperativity-IR Spectroscopic and MD Simulation Study of Temperature Effect


Abstract
1. Introduction
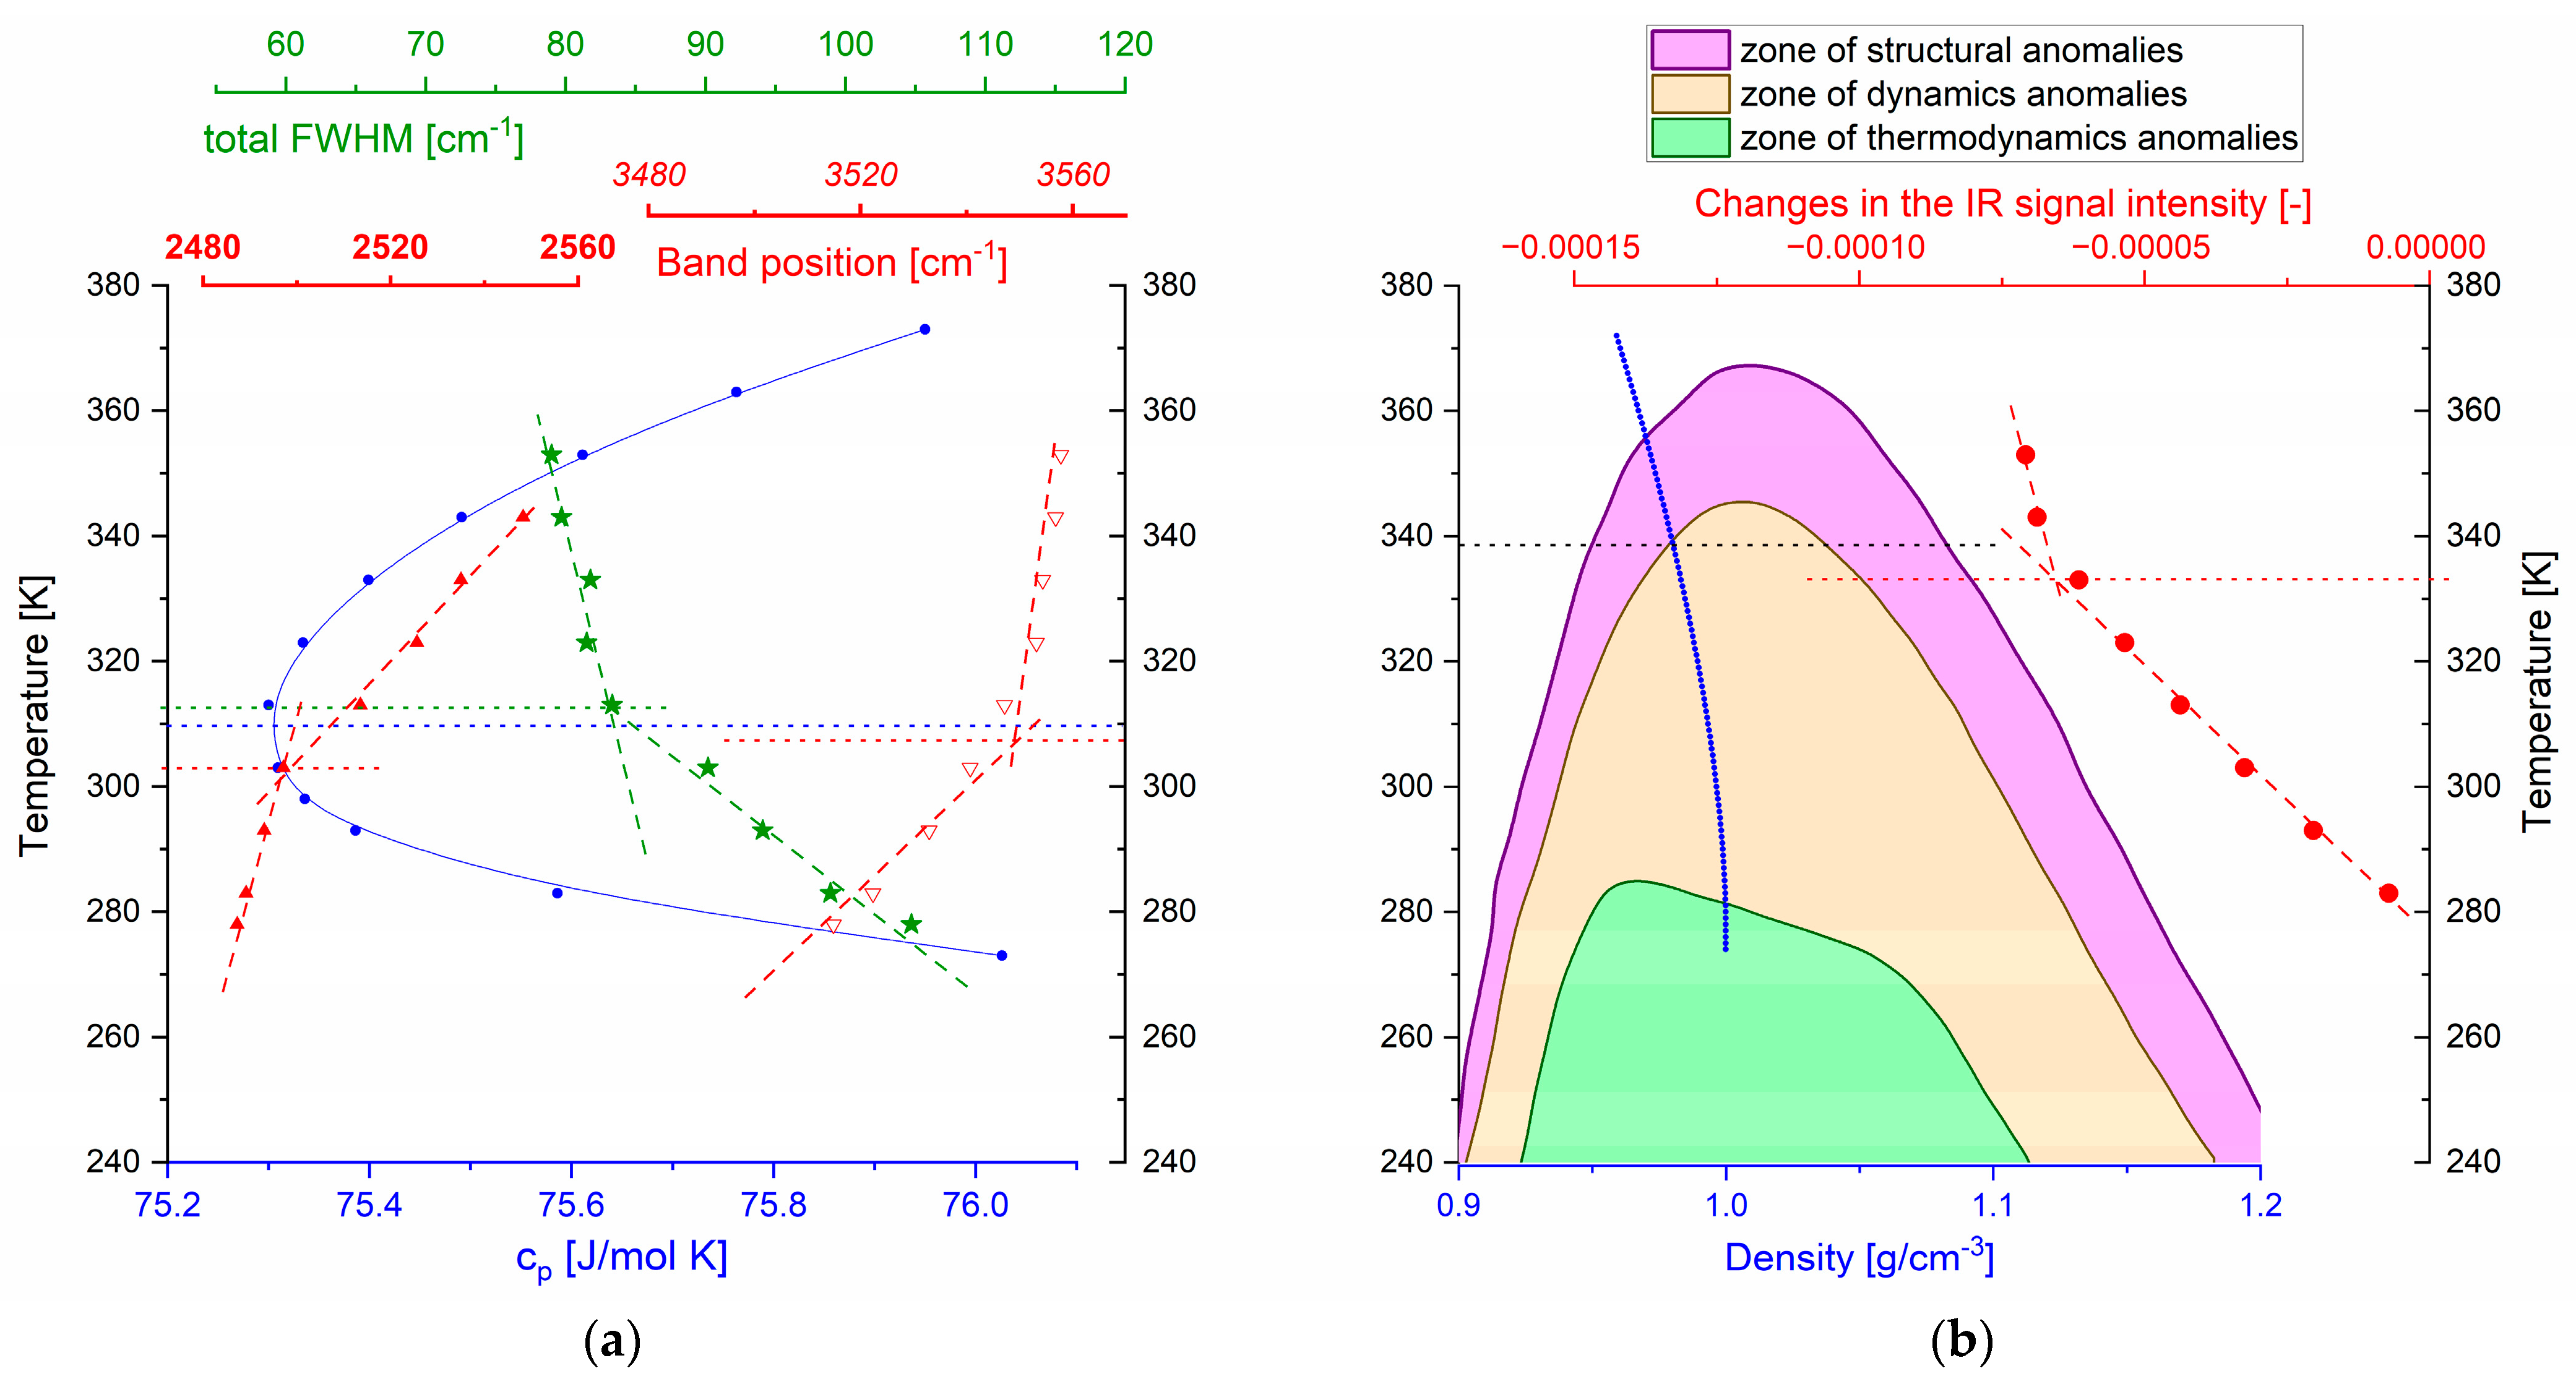
2. Results
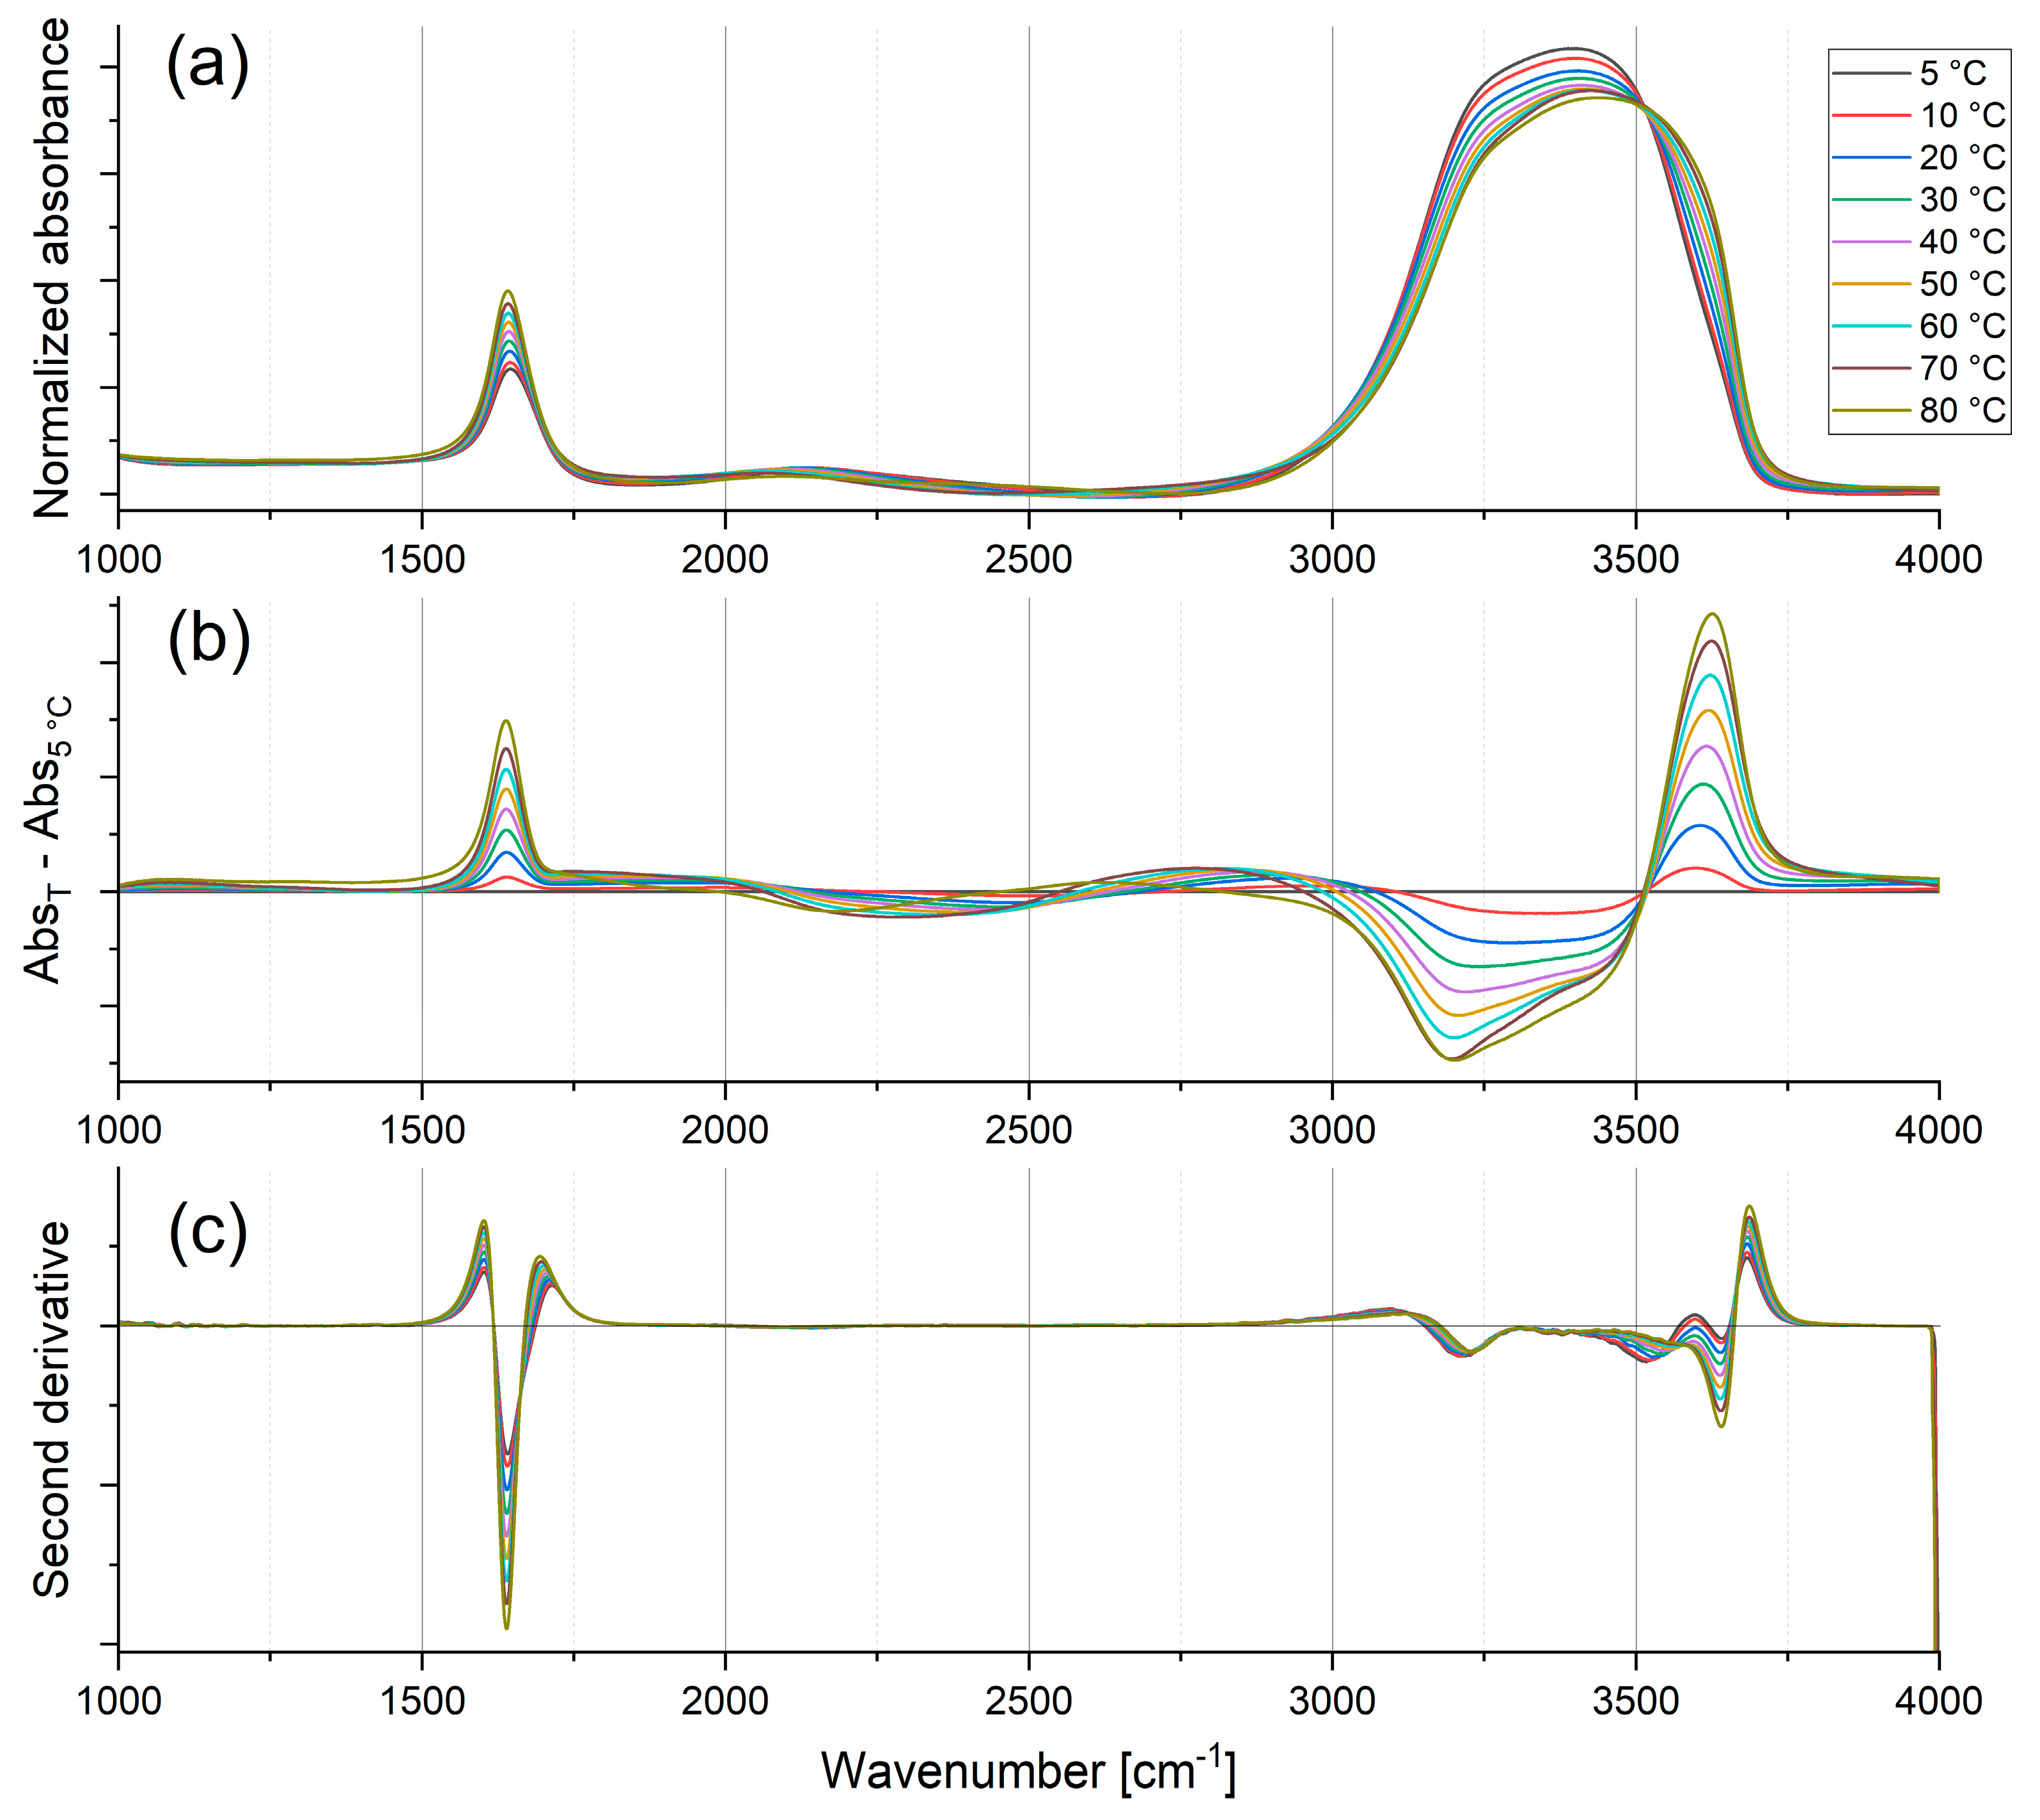
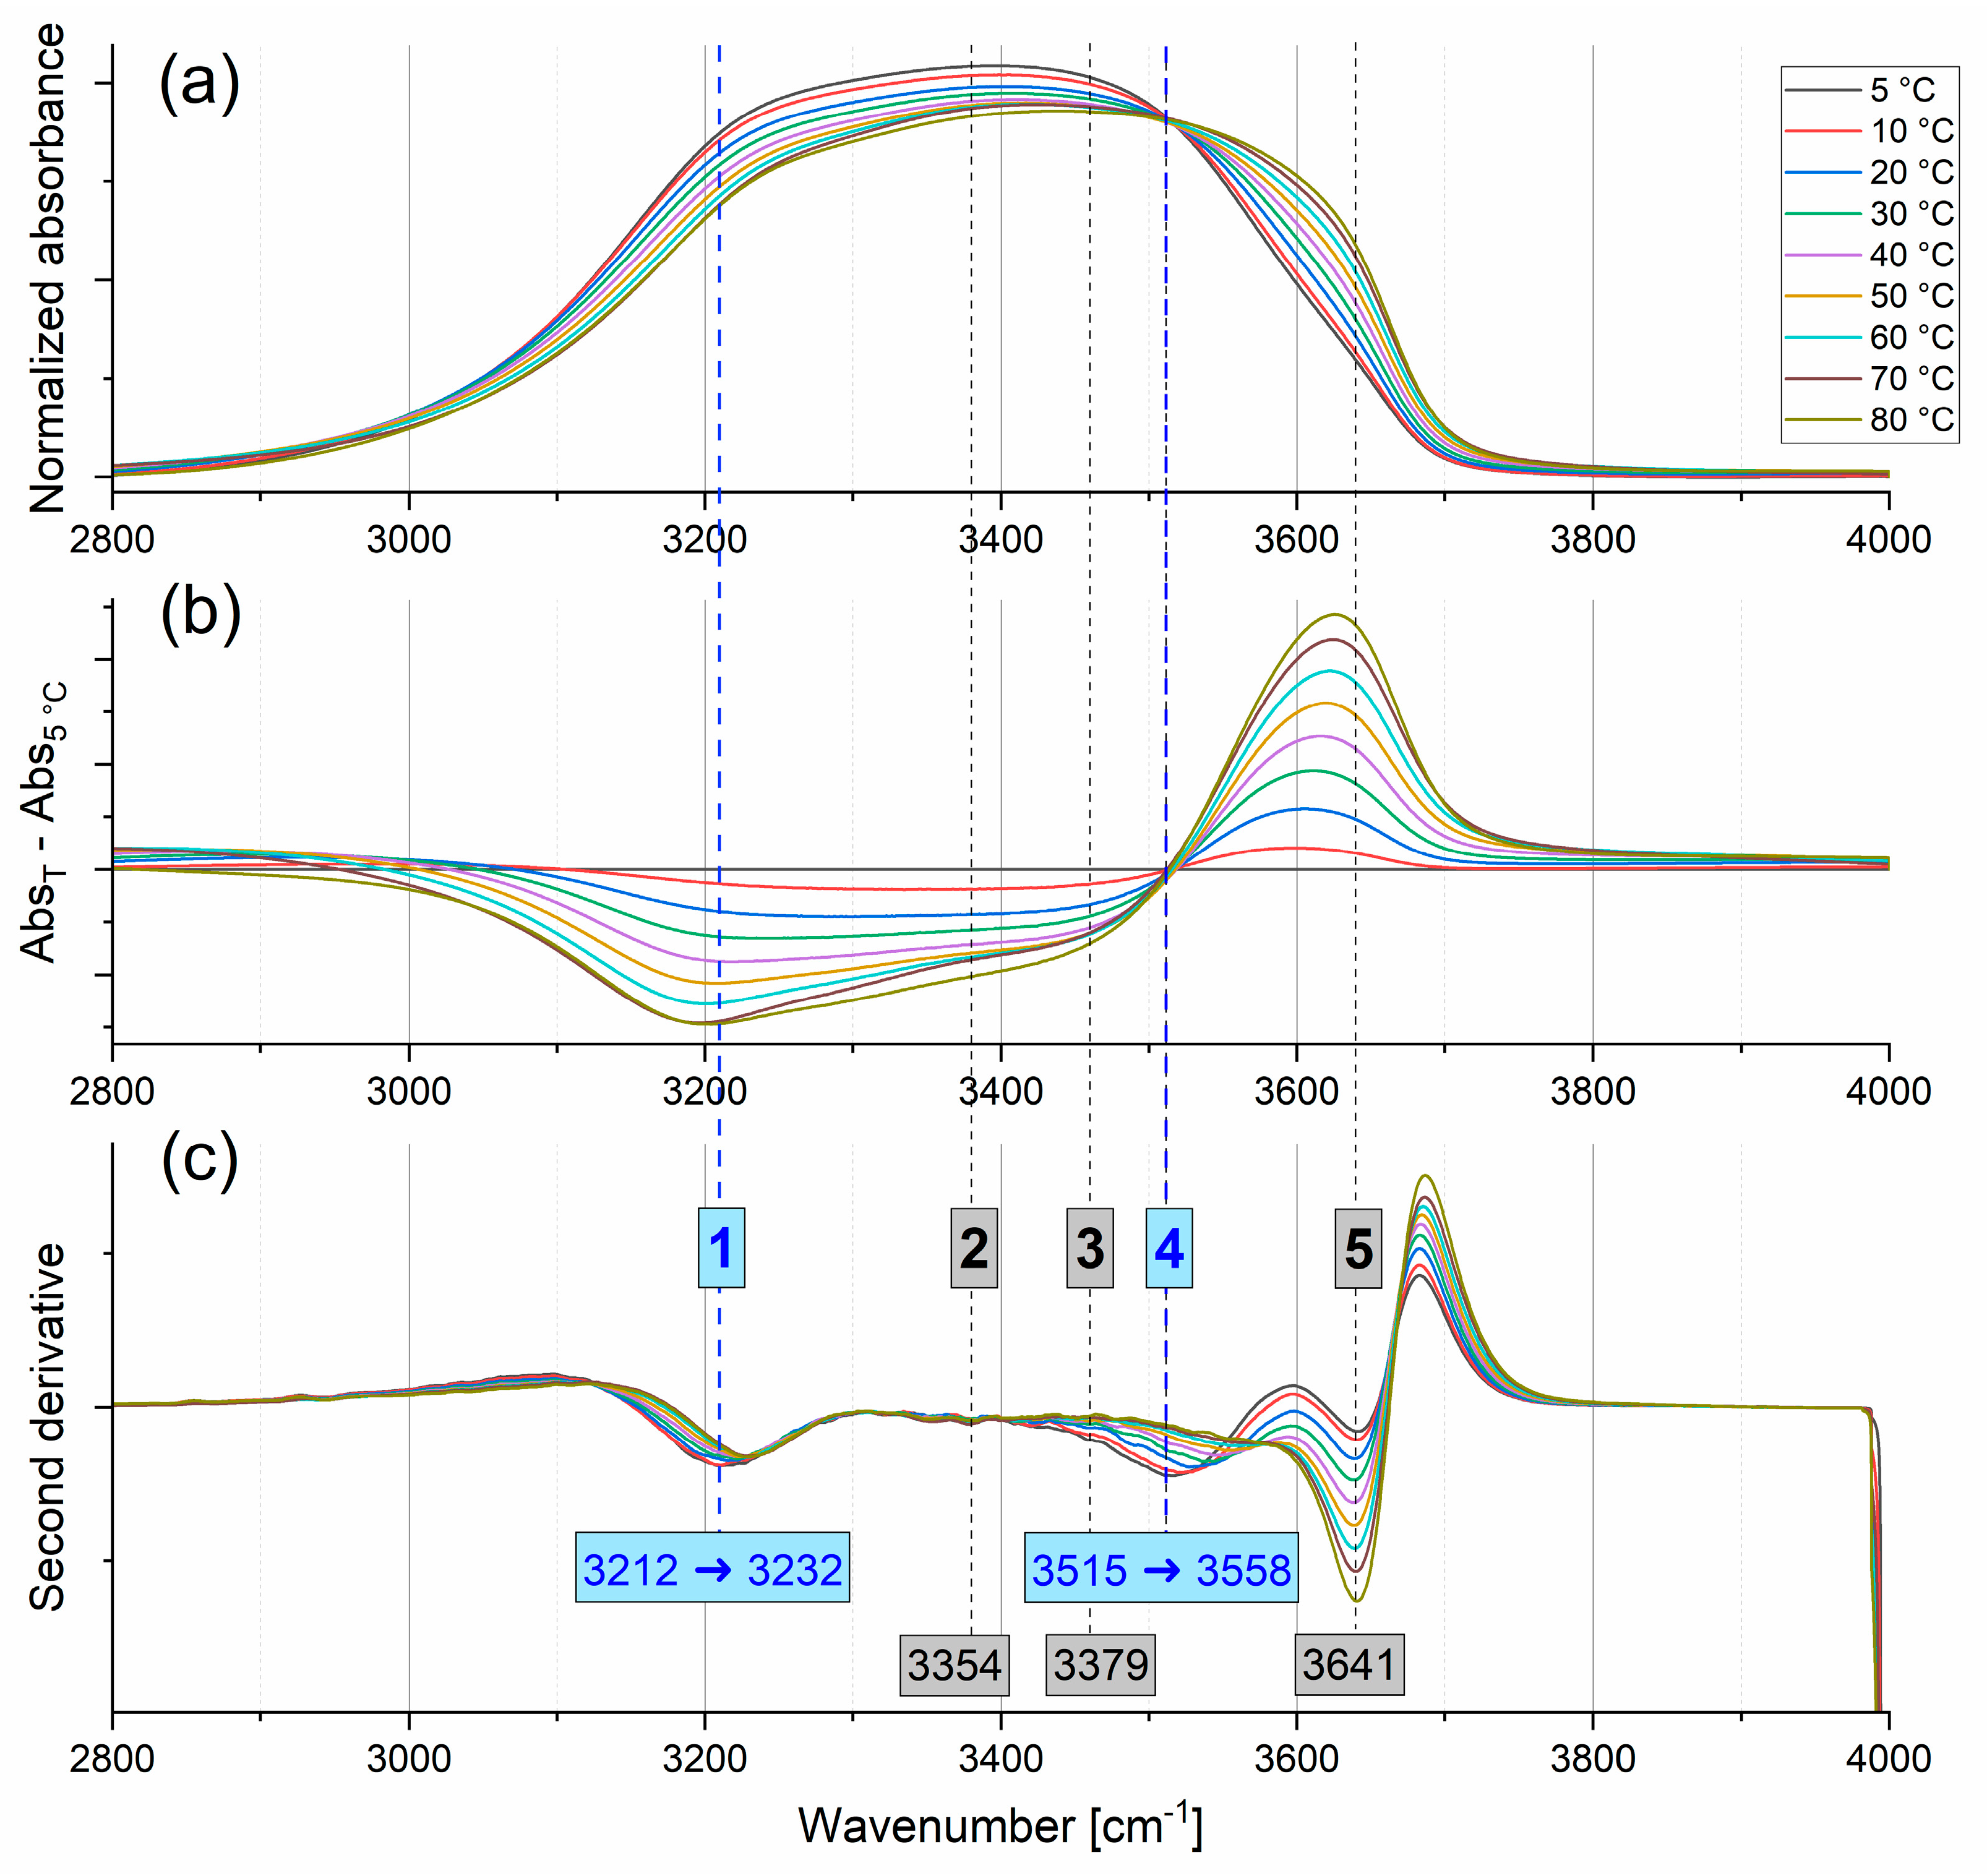
2.1. IR Spectroscopy
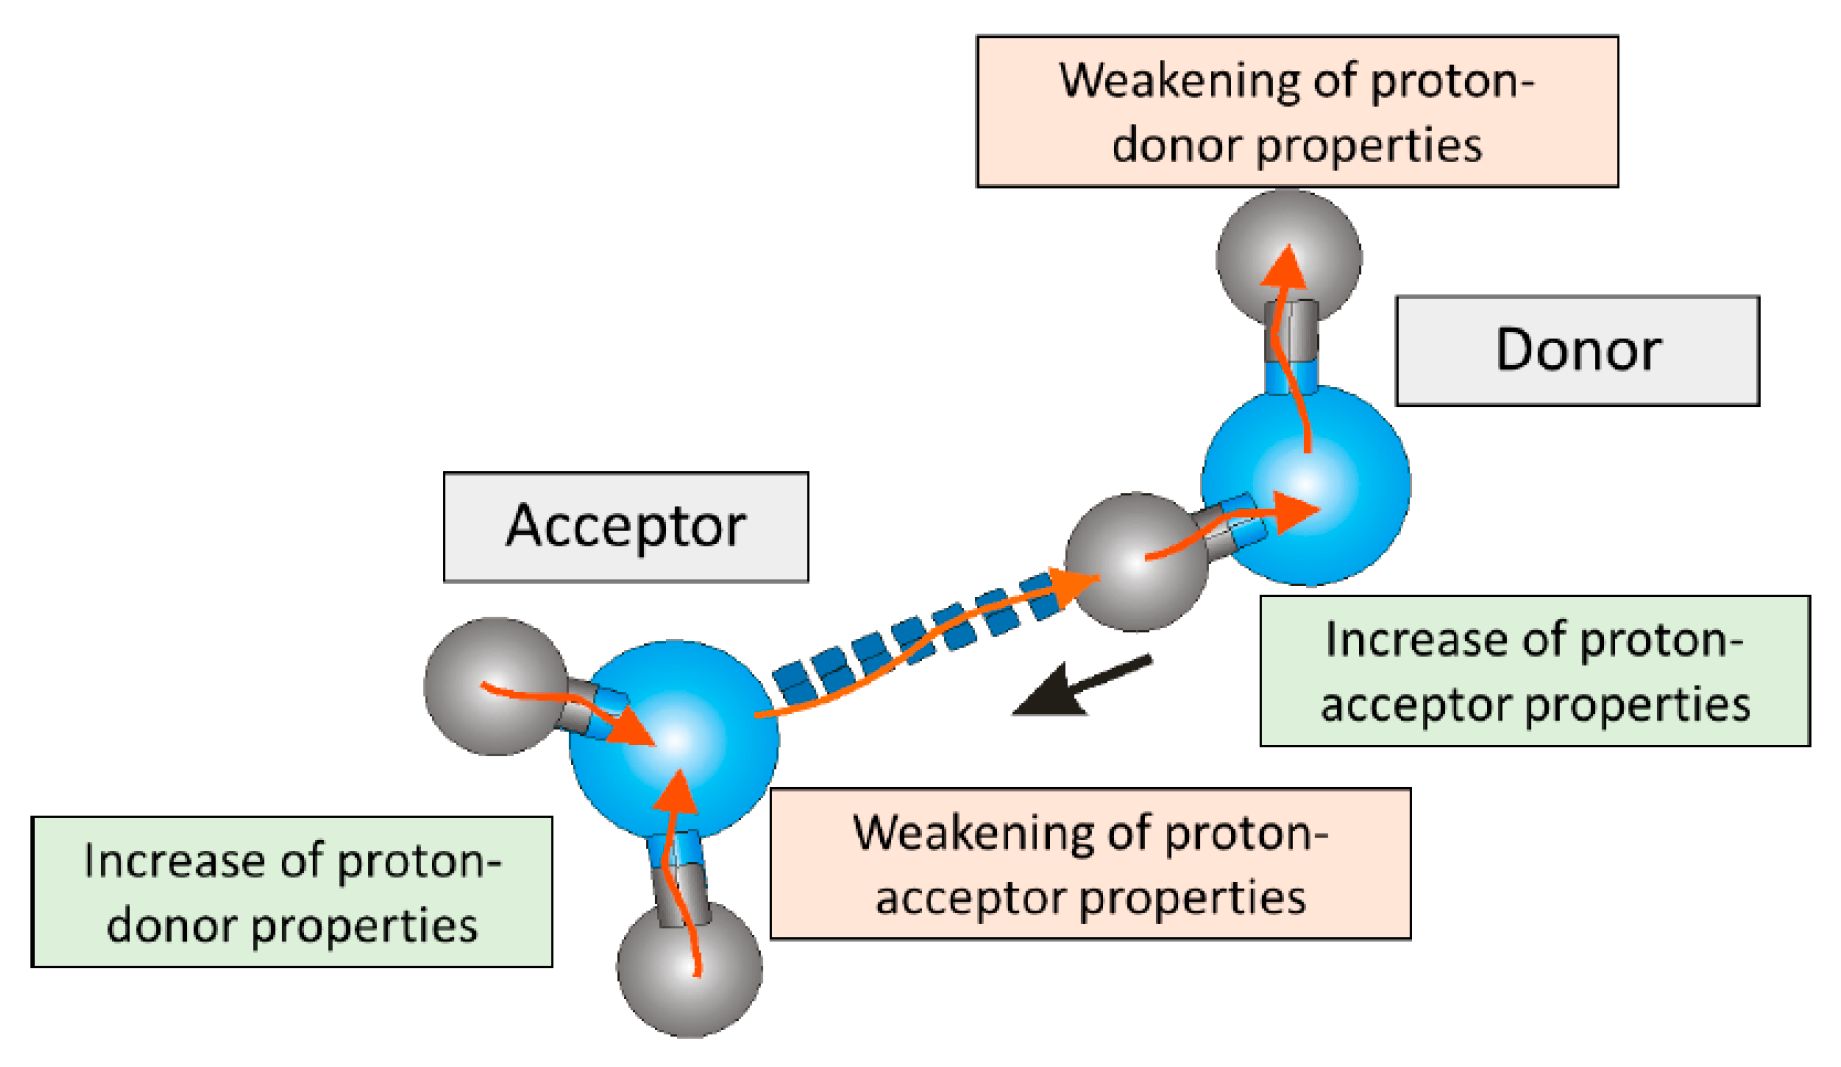
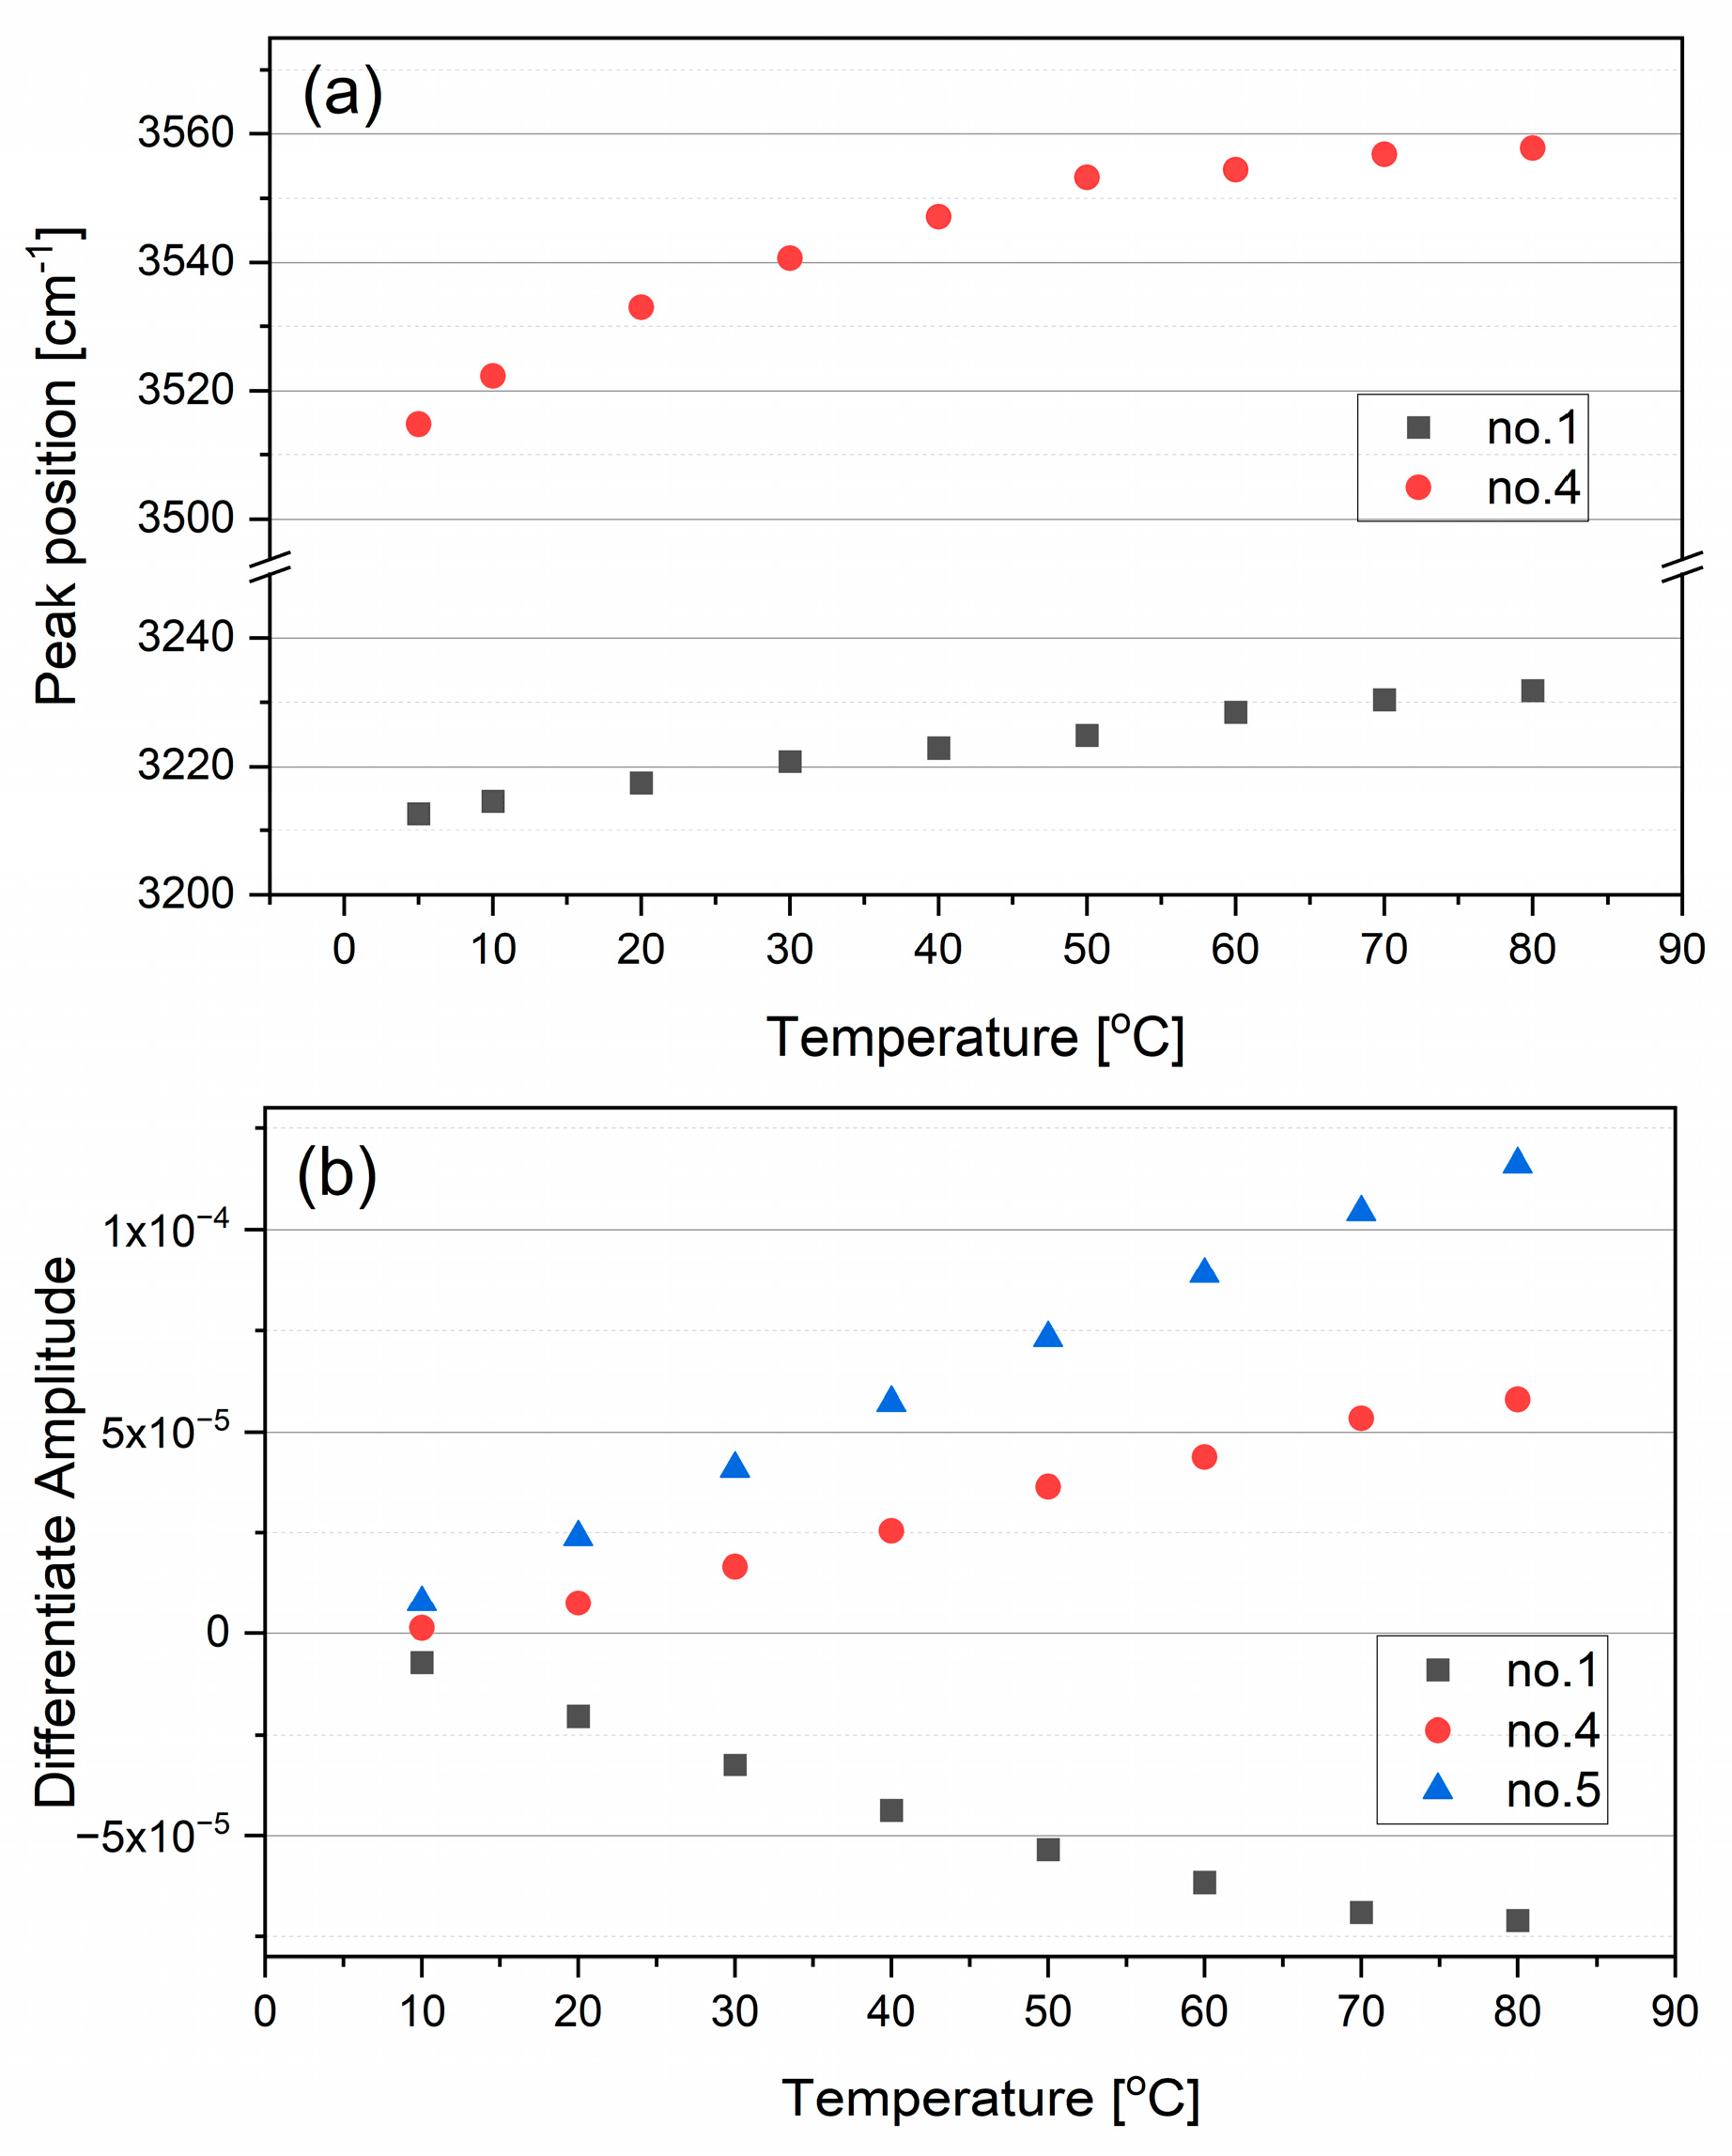
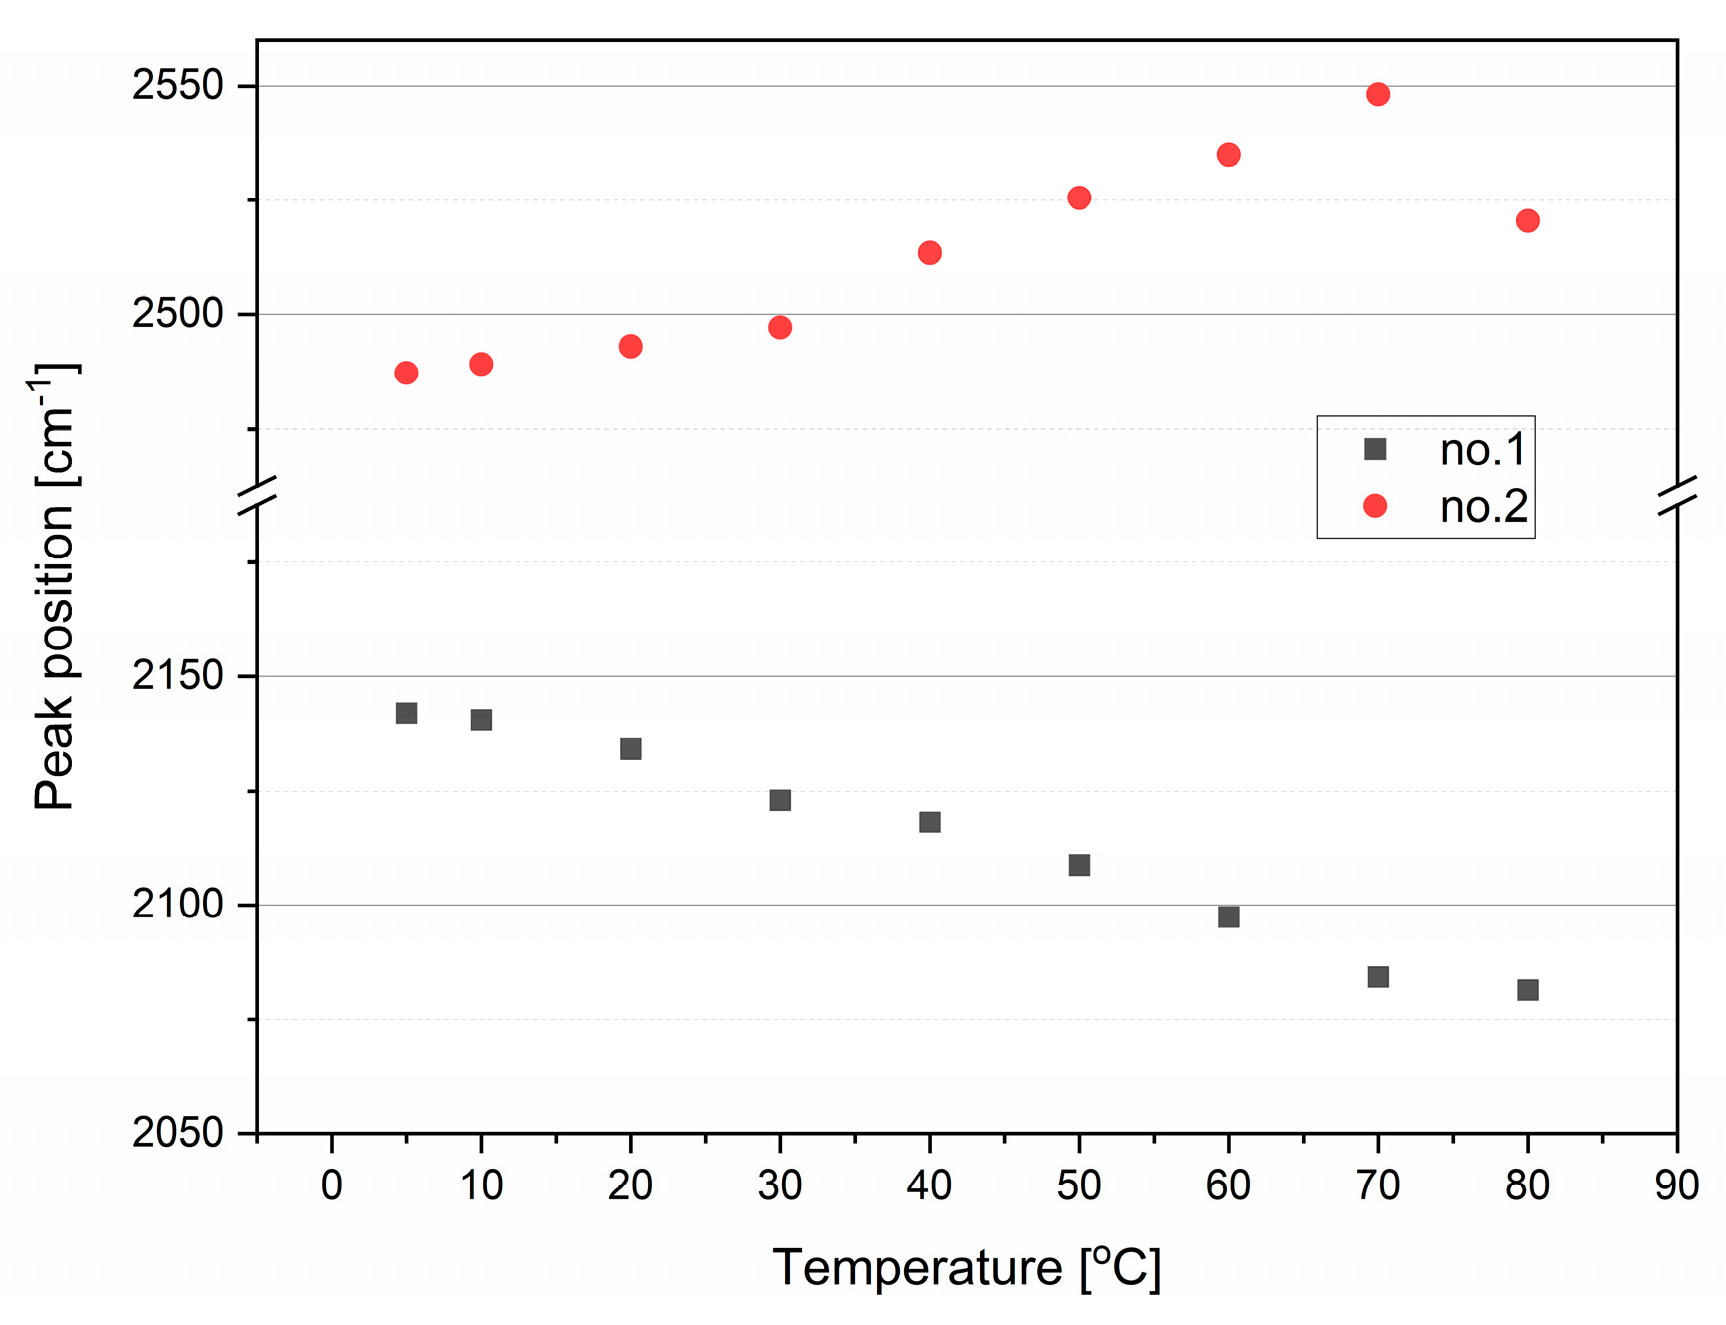
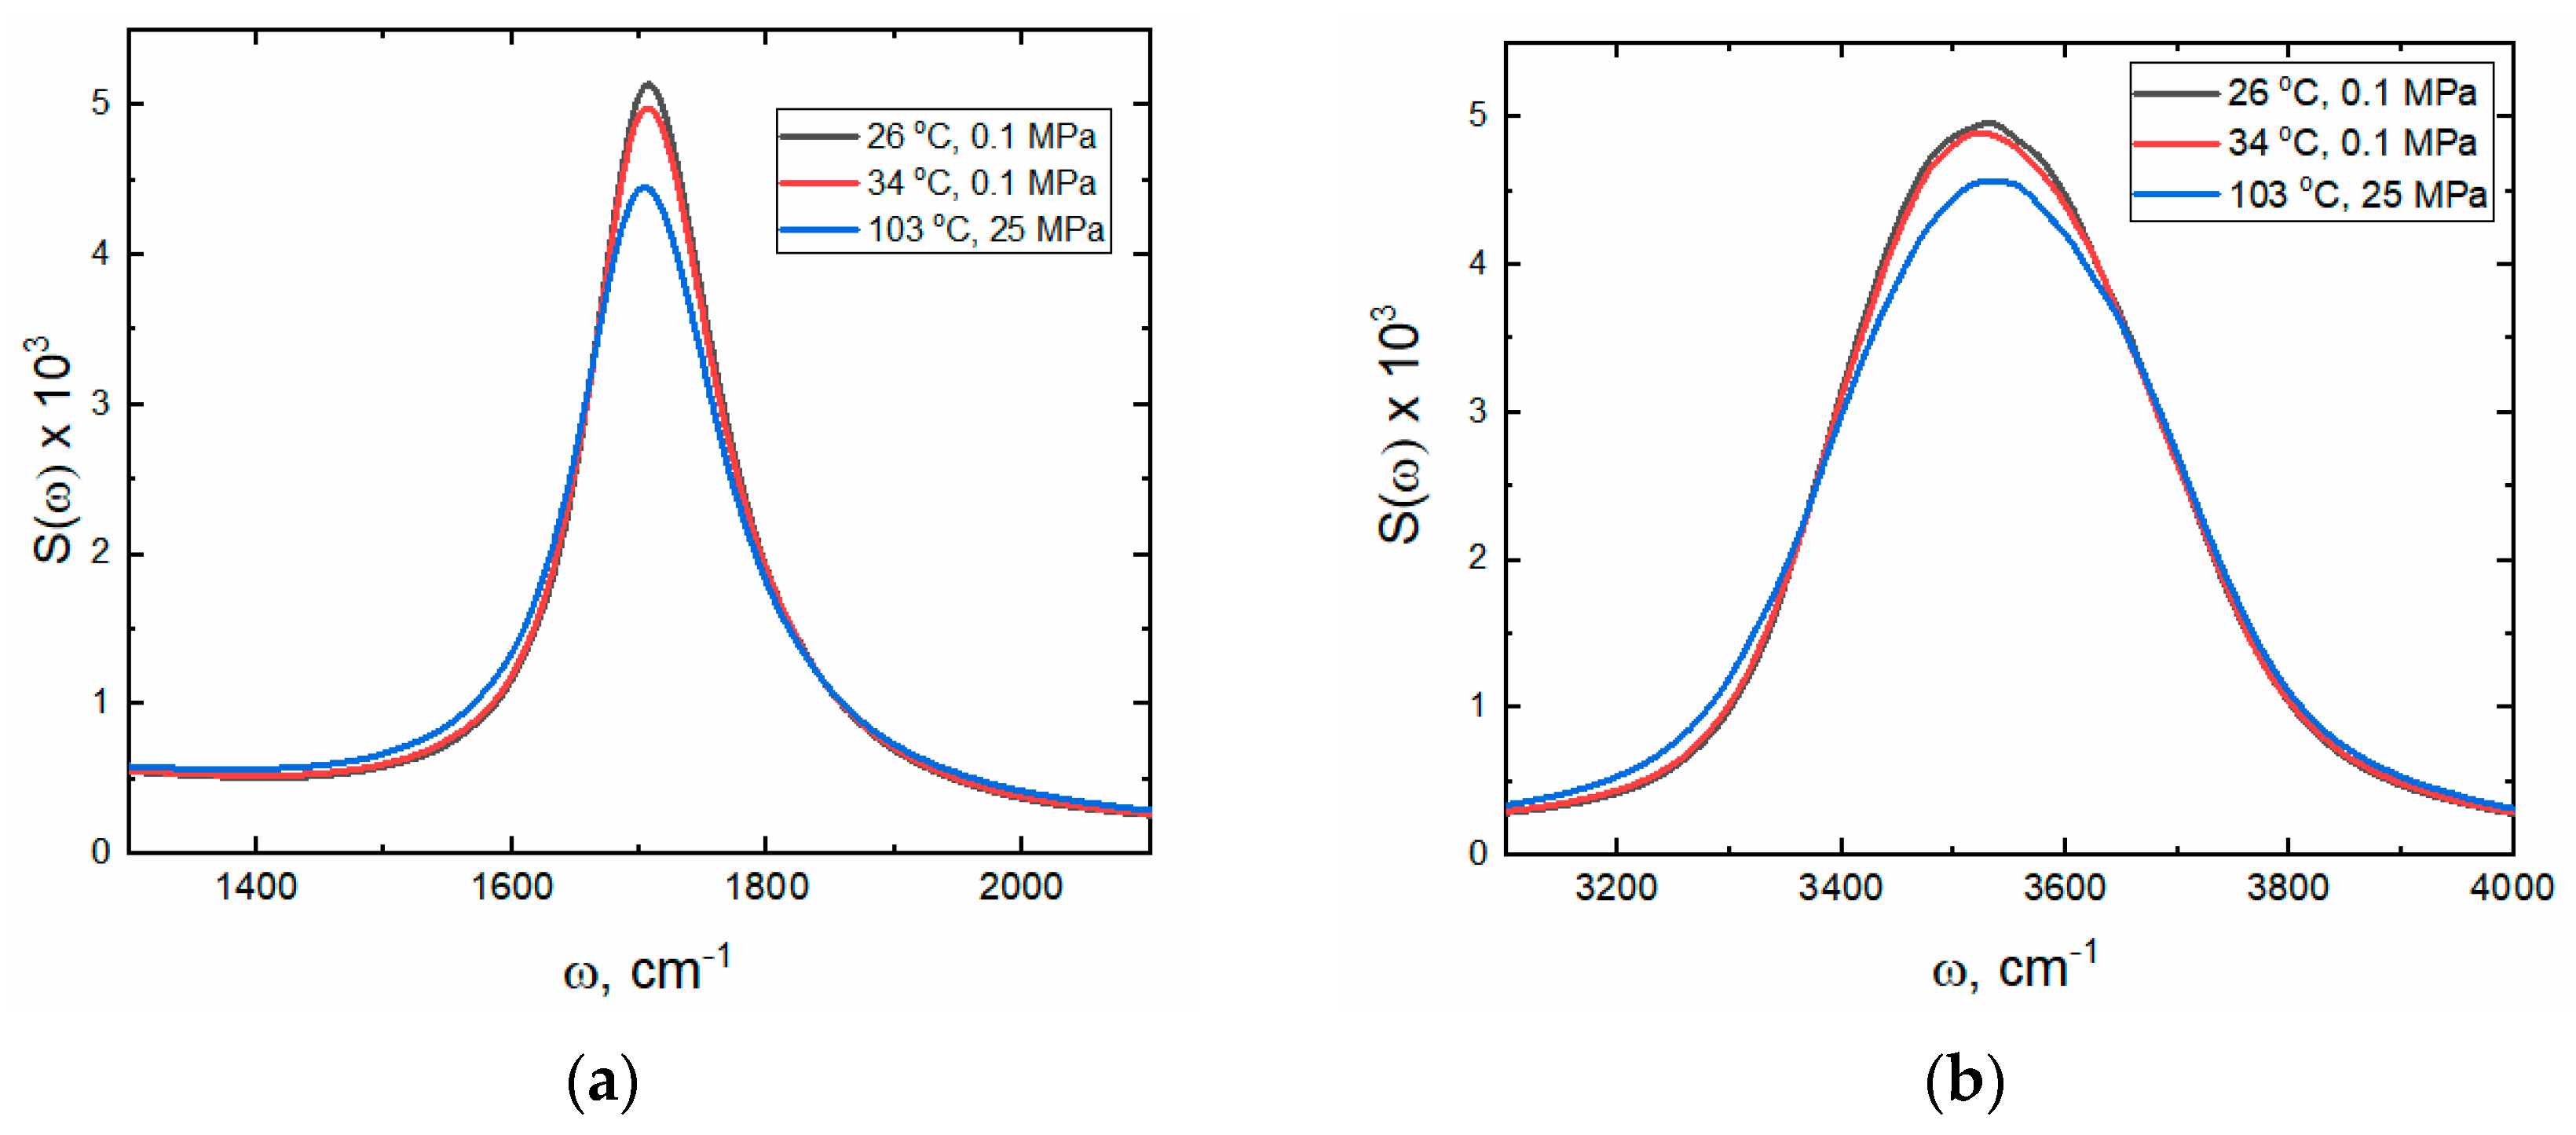
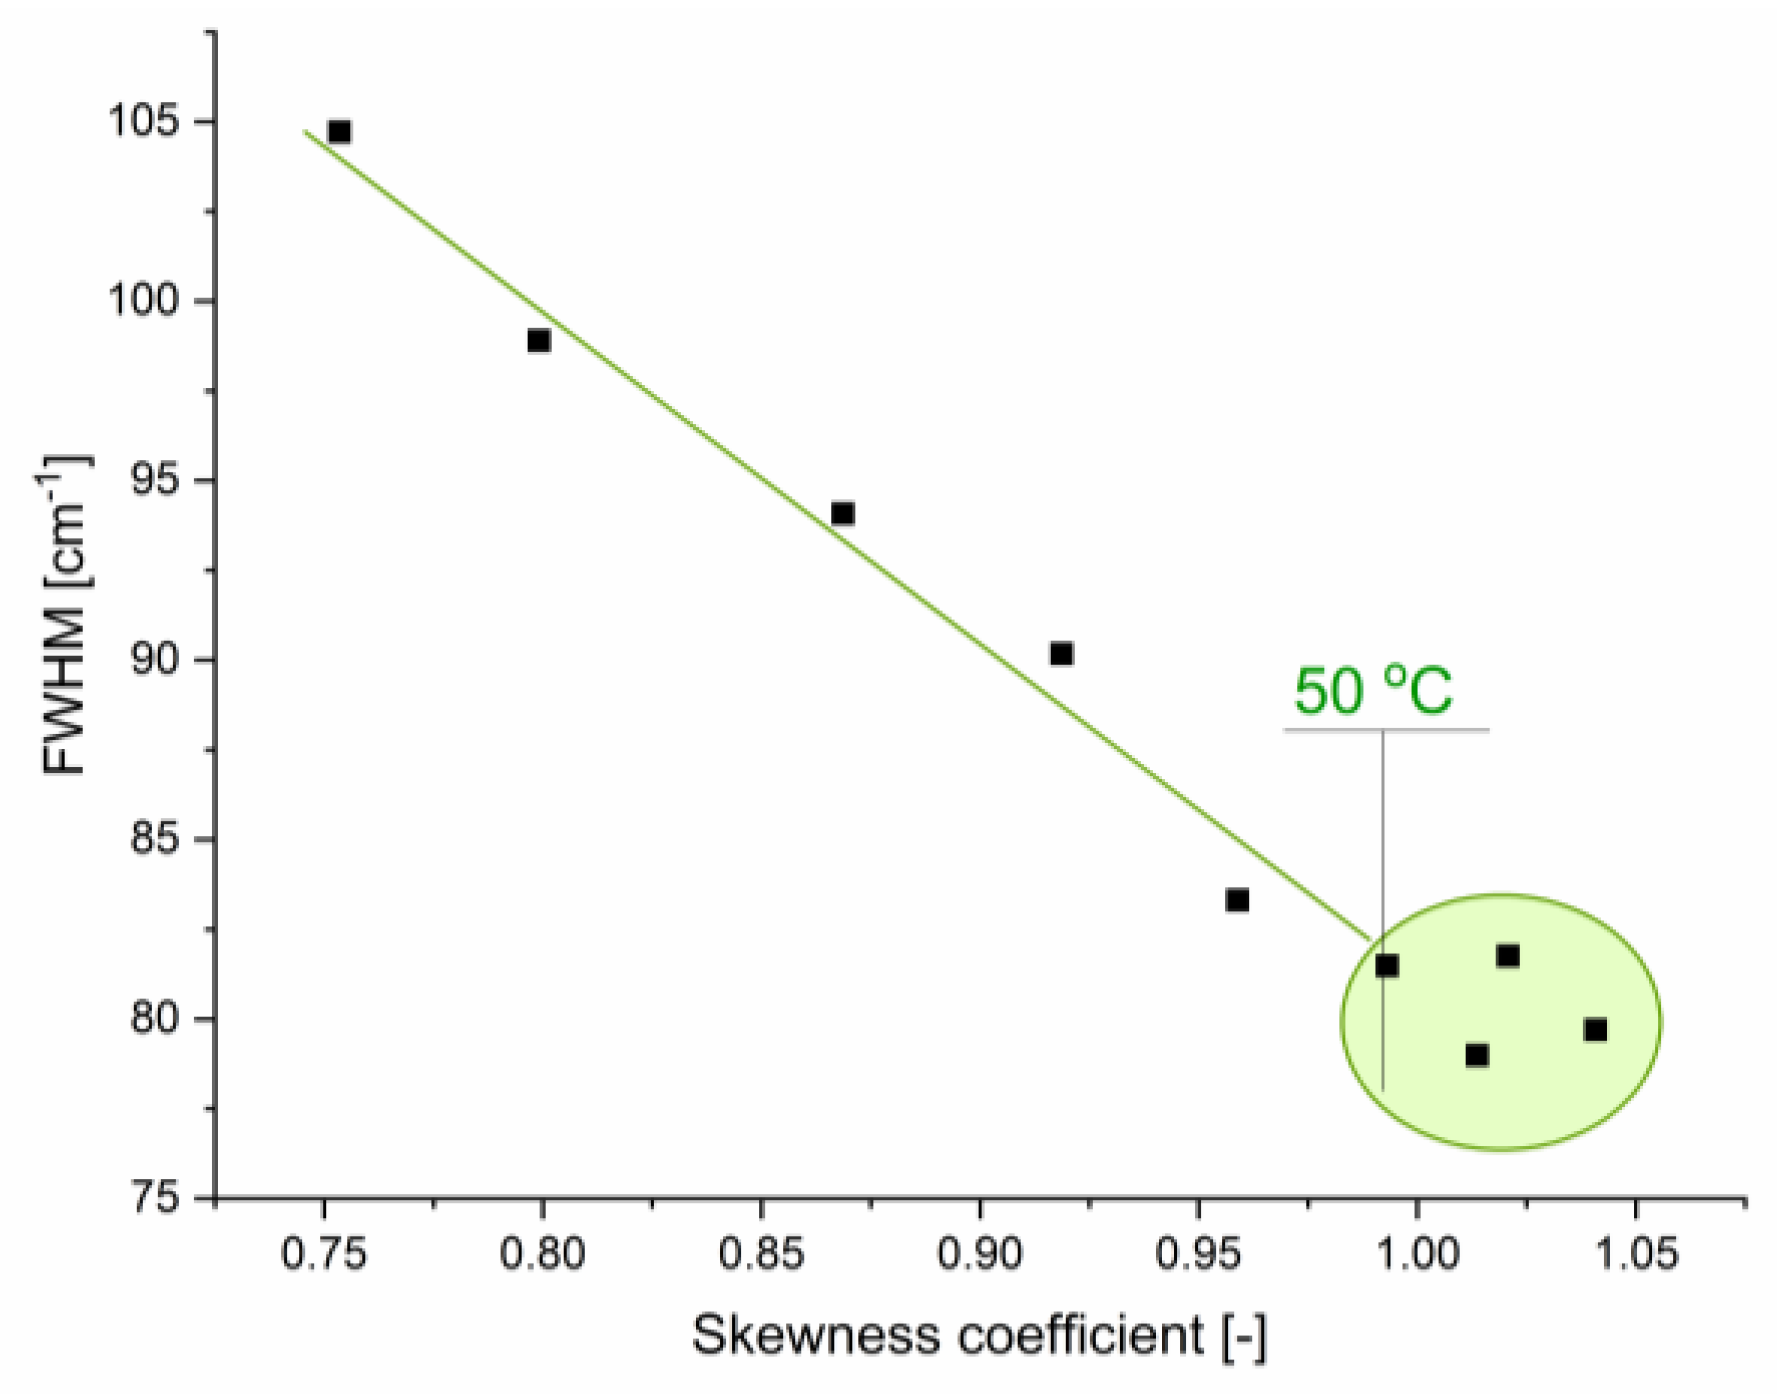
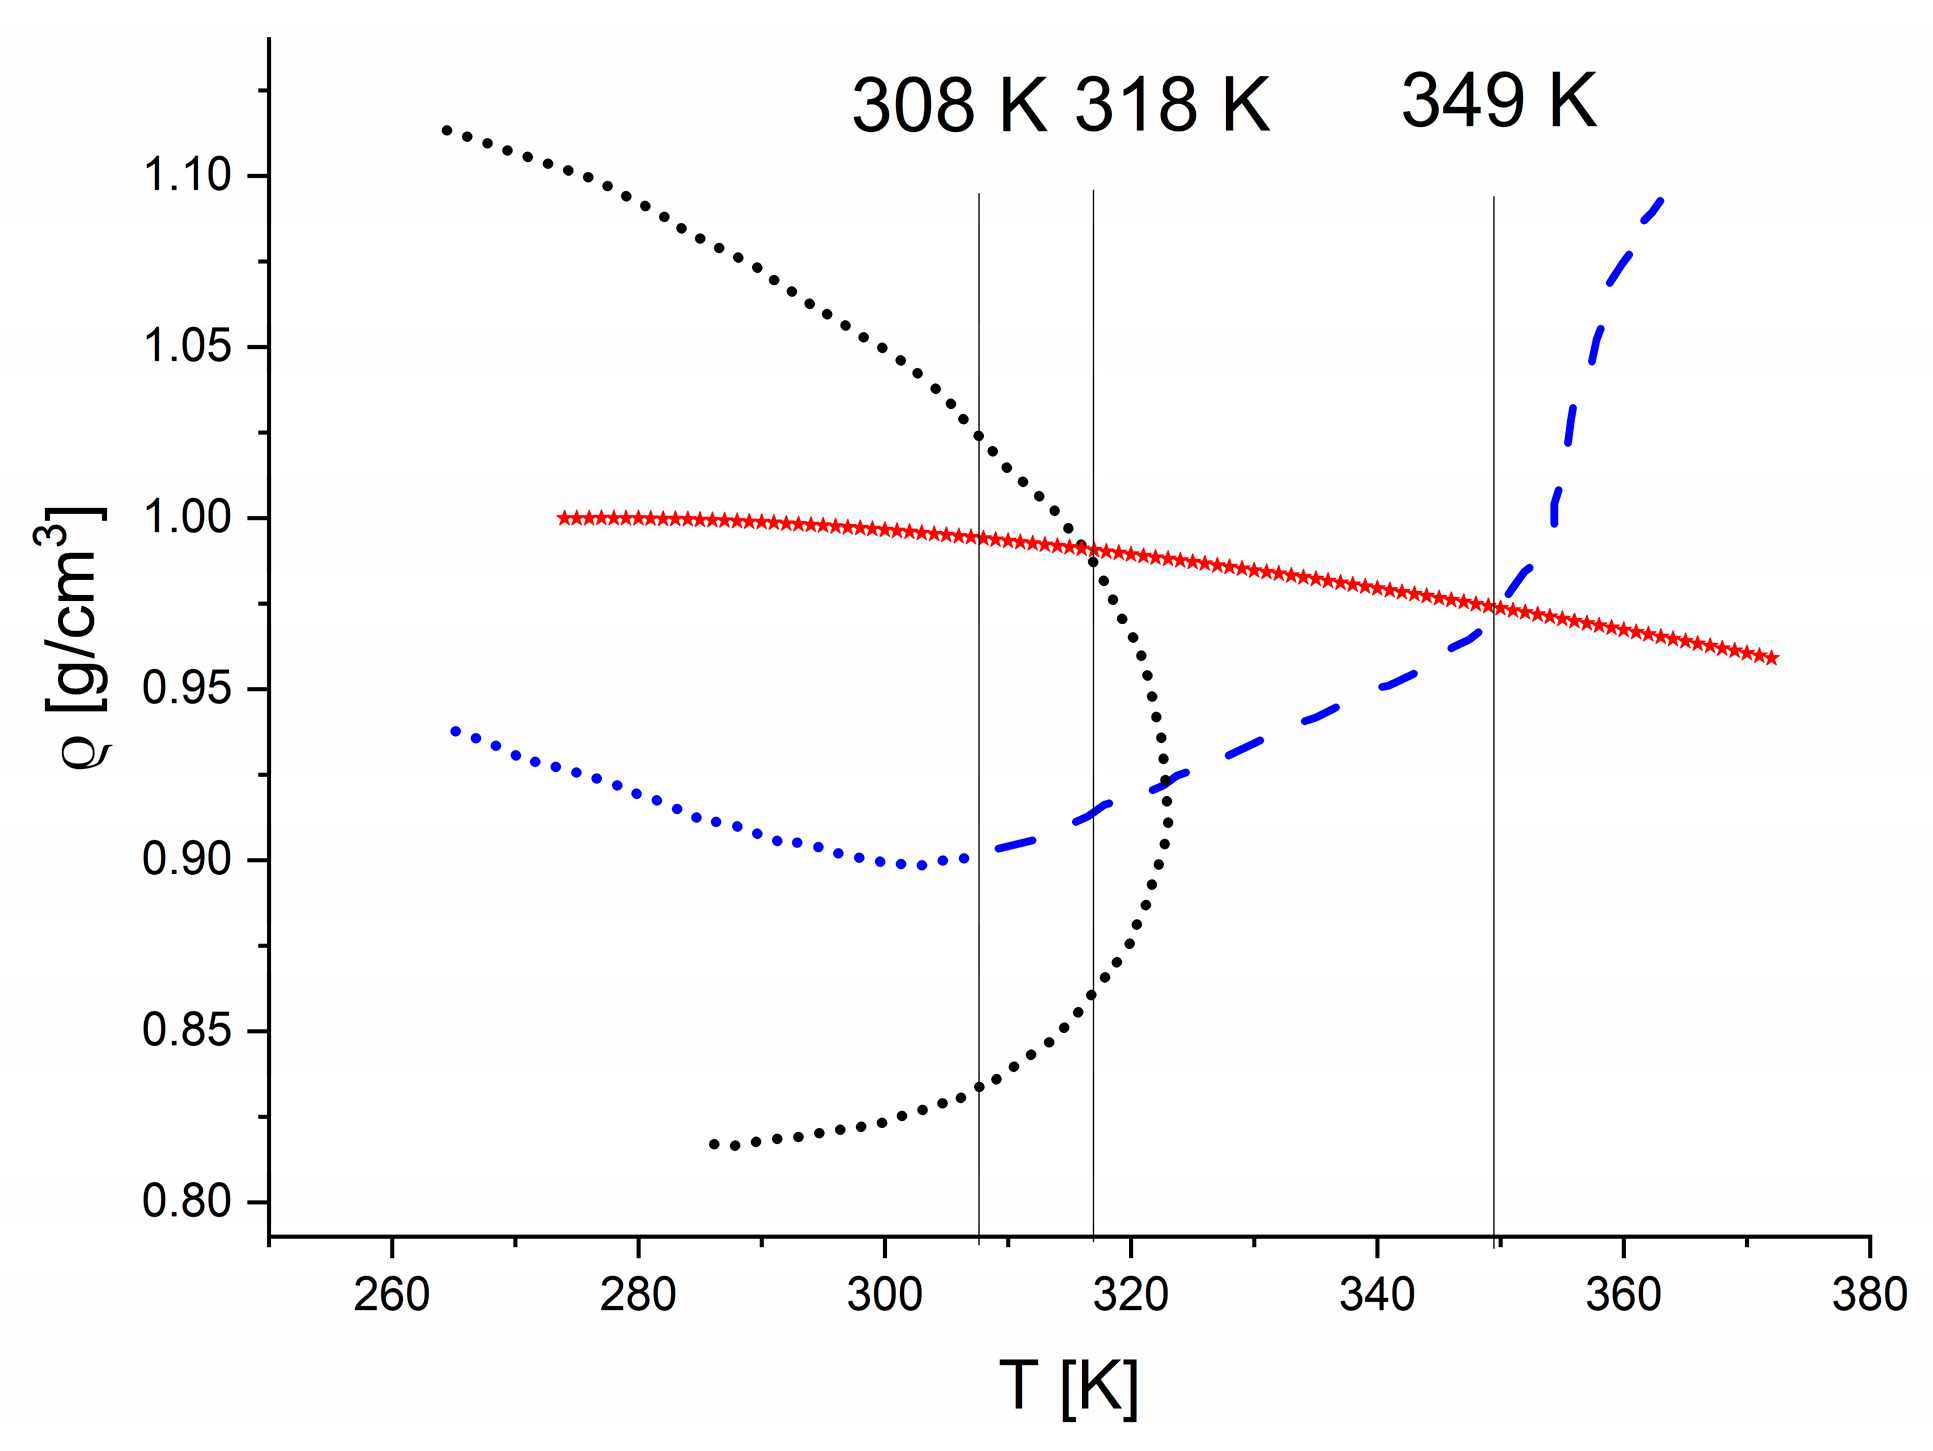
2.1.1. Stretching Modes
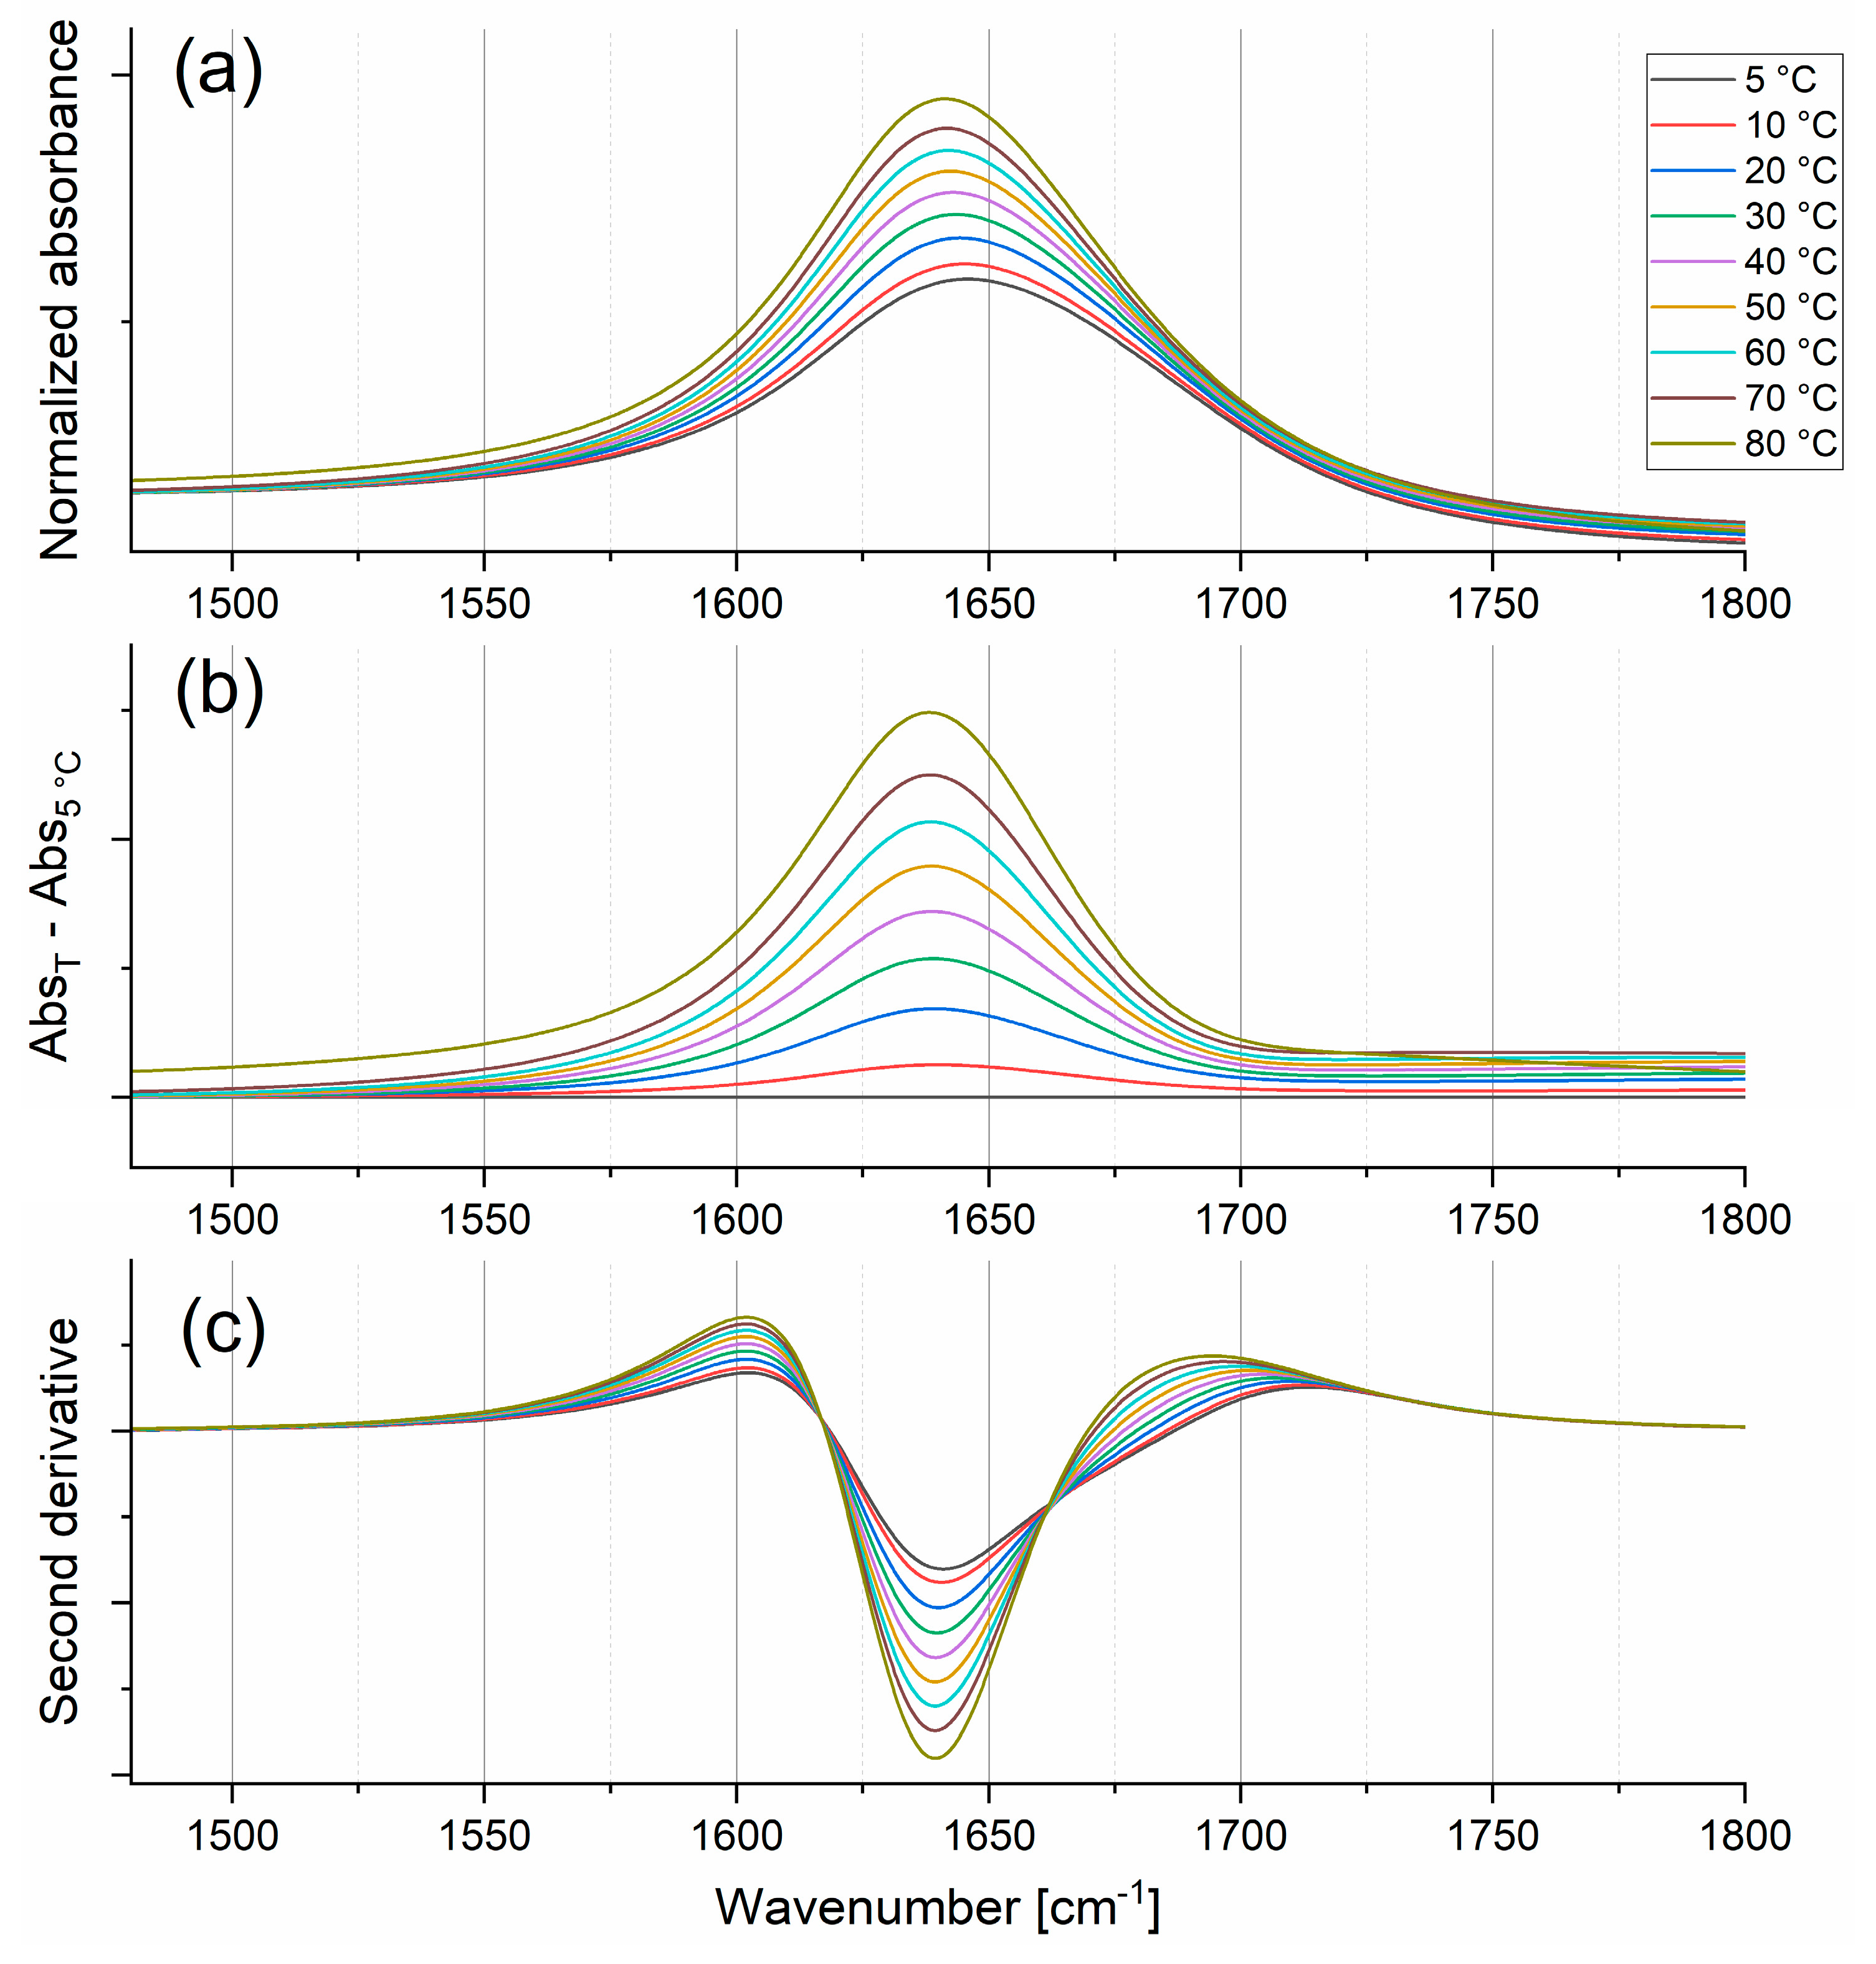
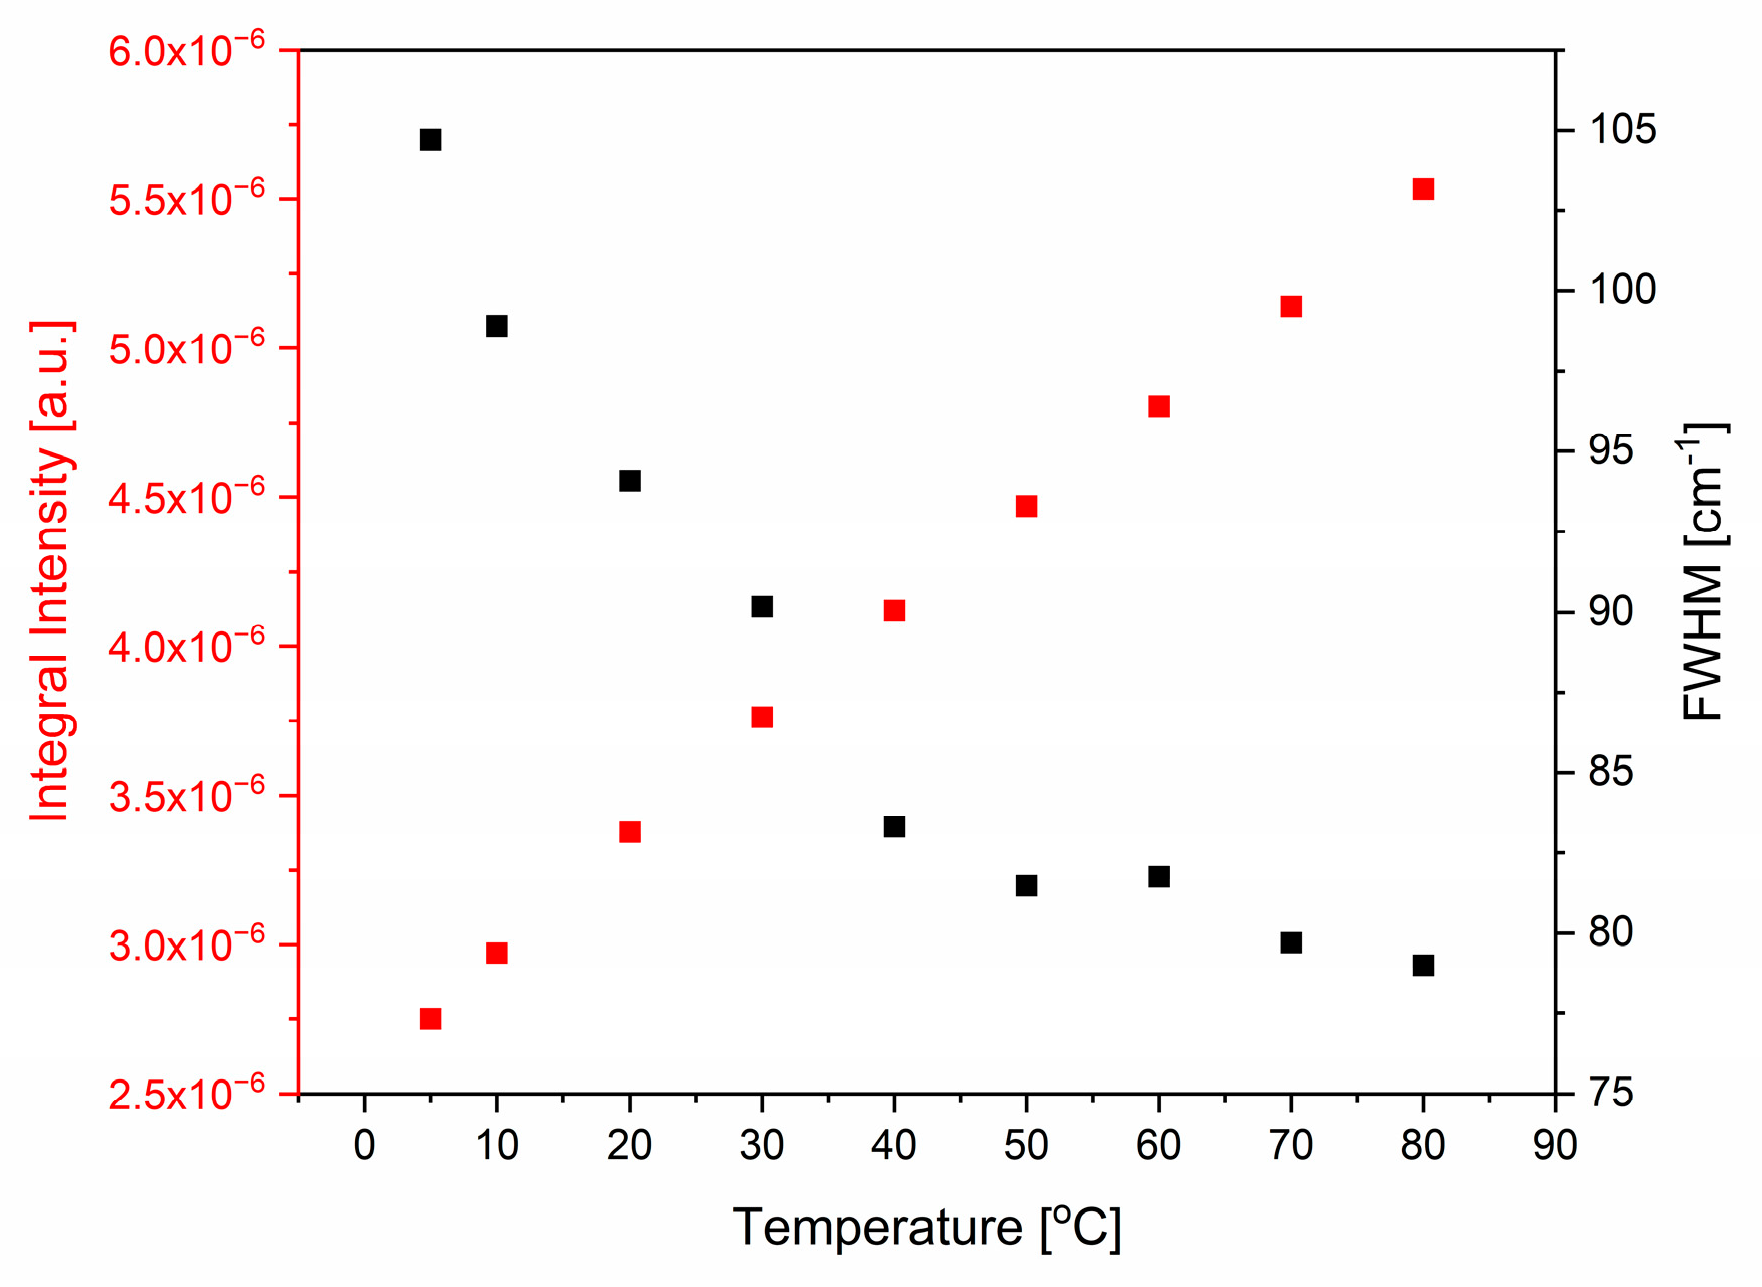
2.1.2. Bending Mode
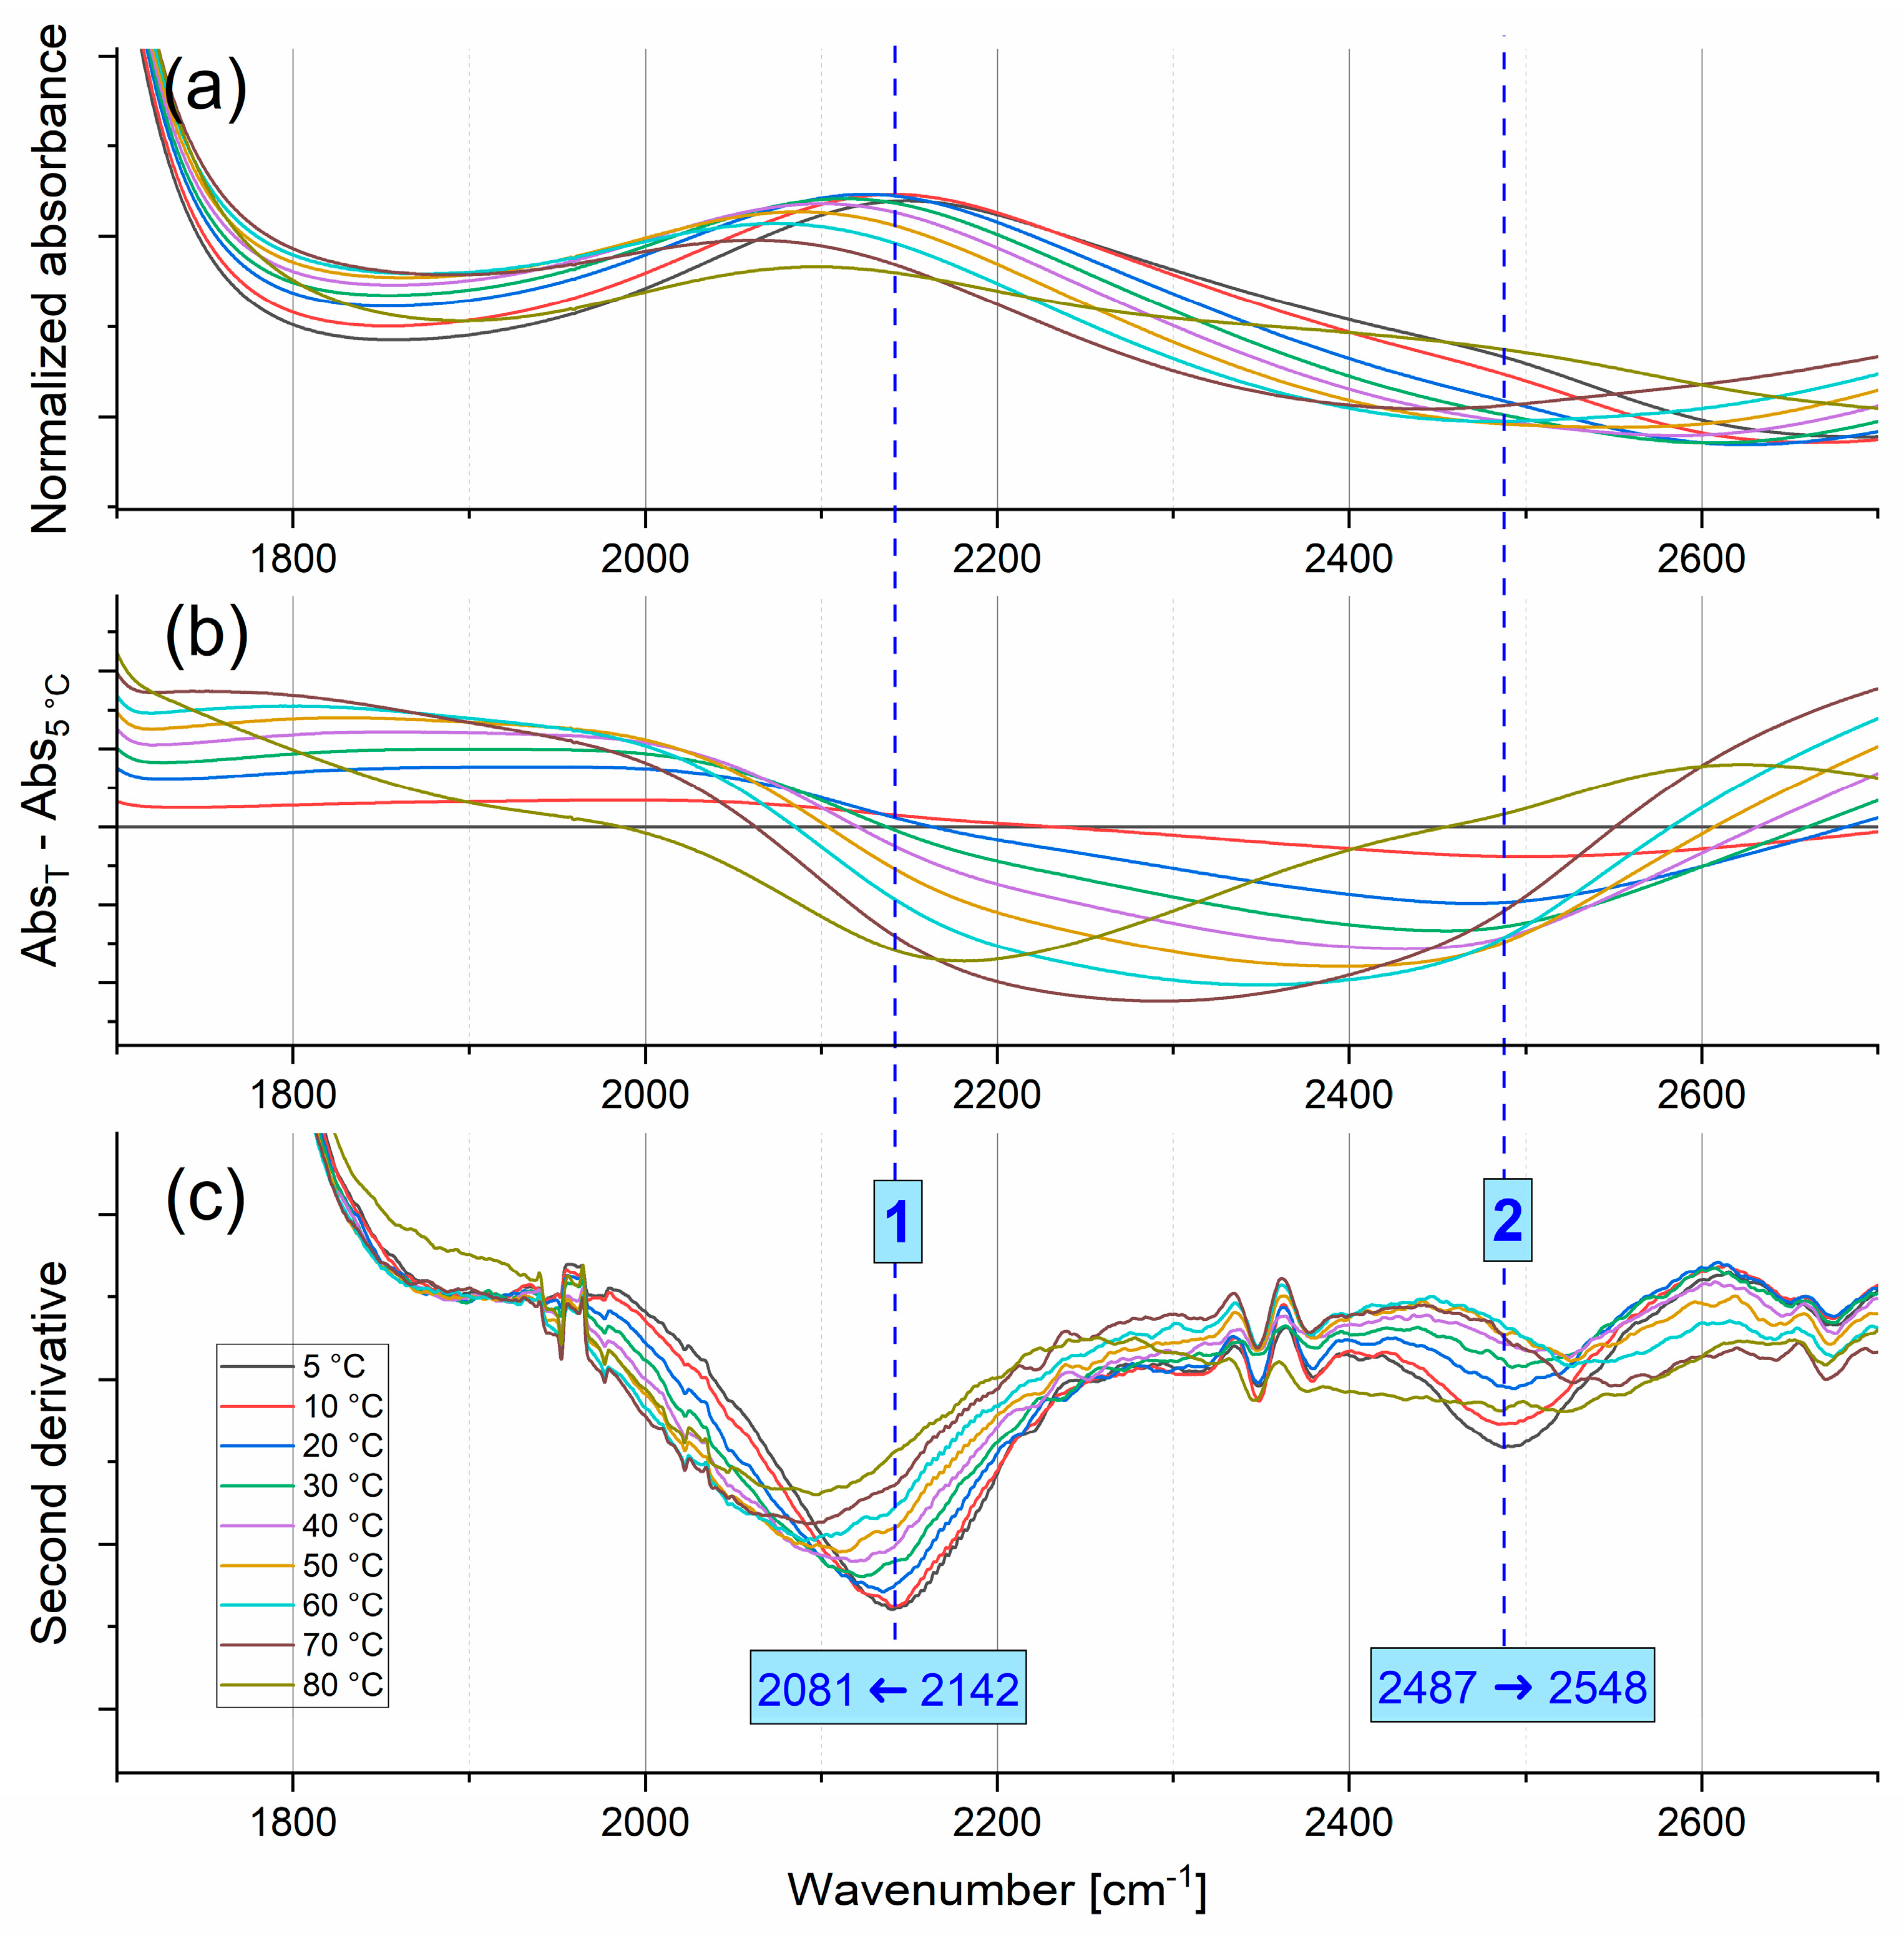
2.1.3. Combination Modes
2.2. MD Simulation
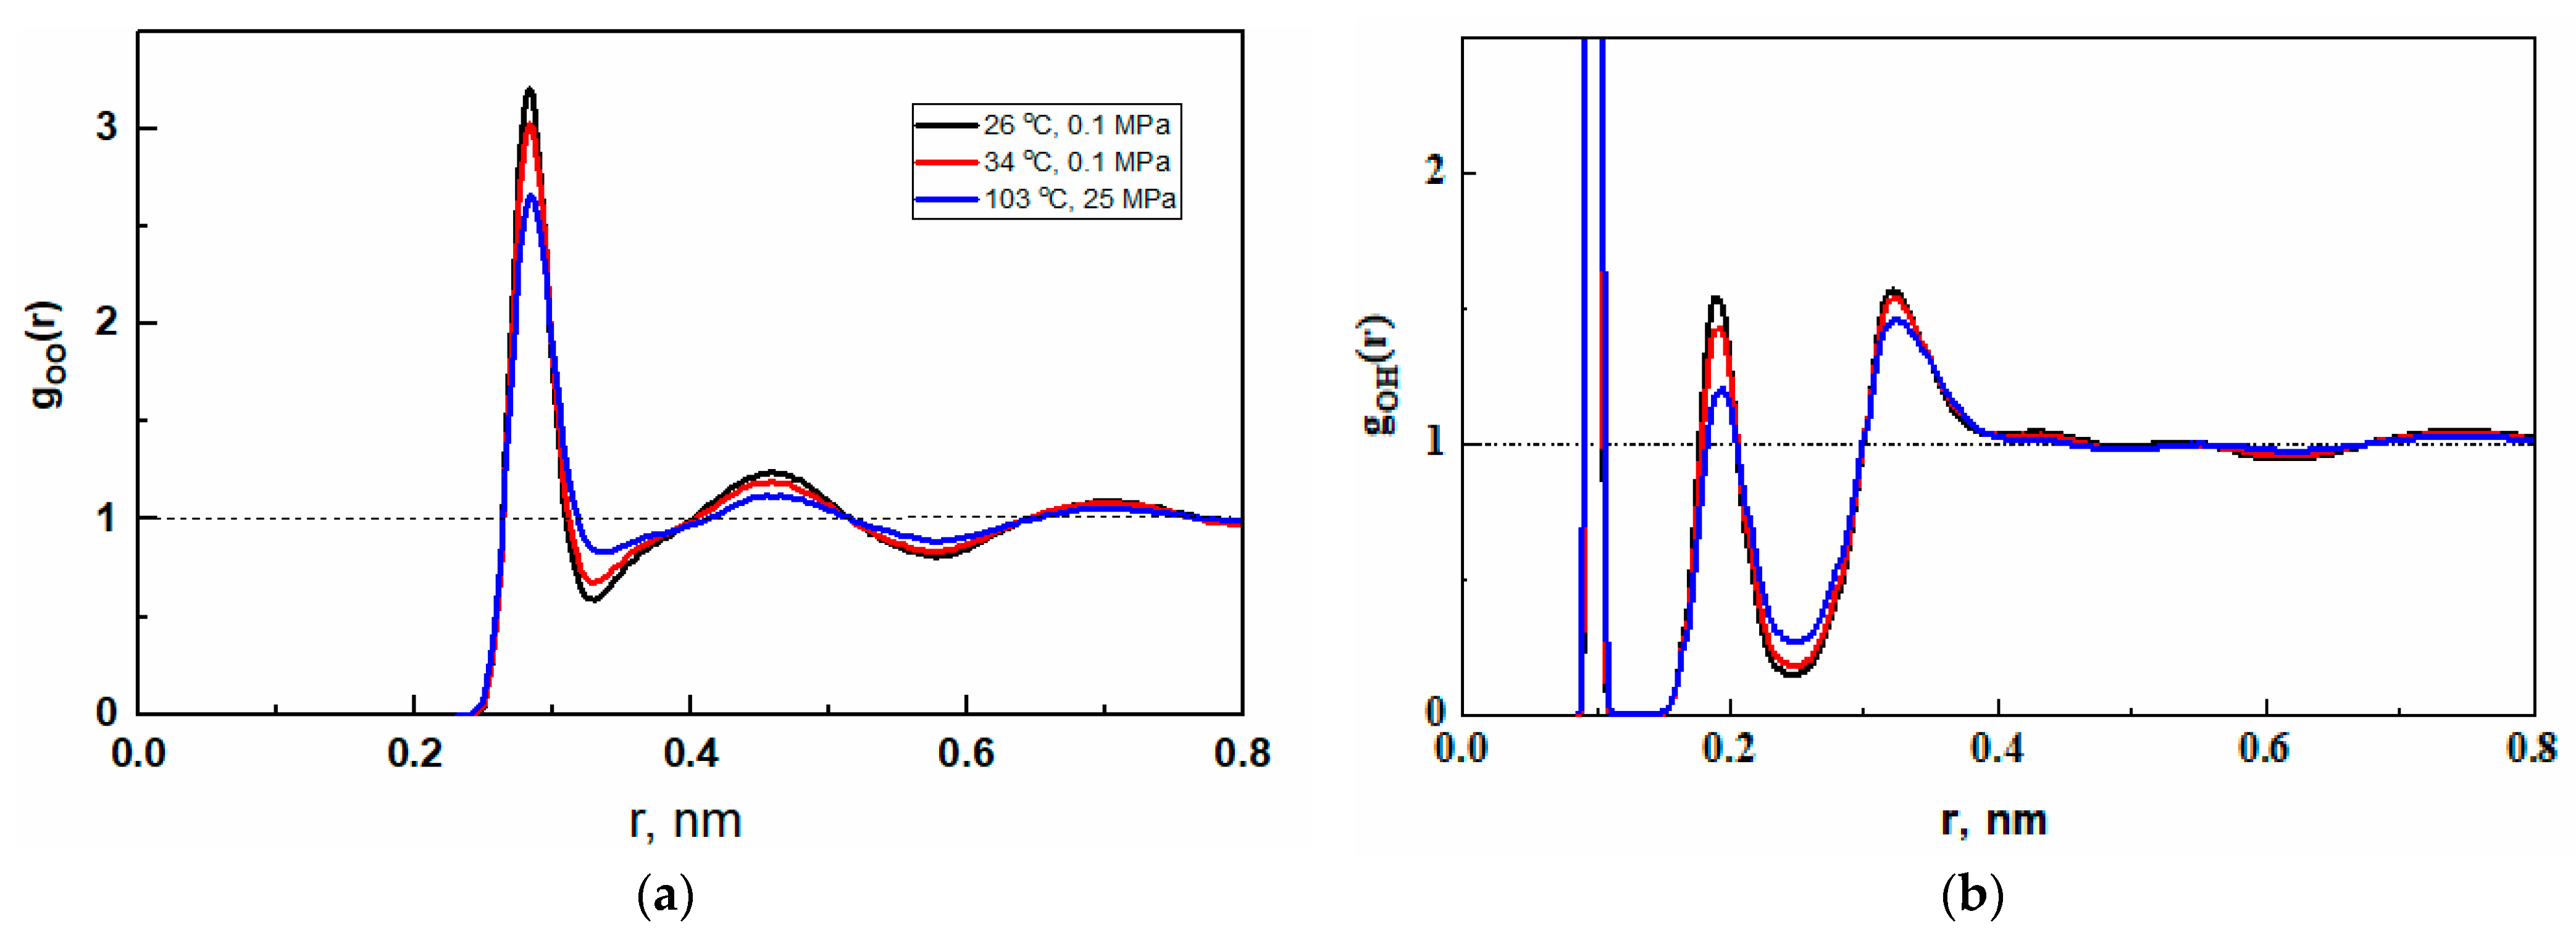
2.2.1. Radial Distribution Functions
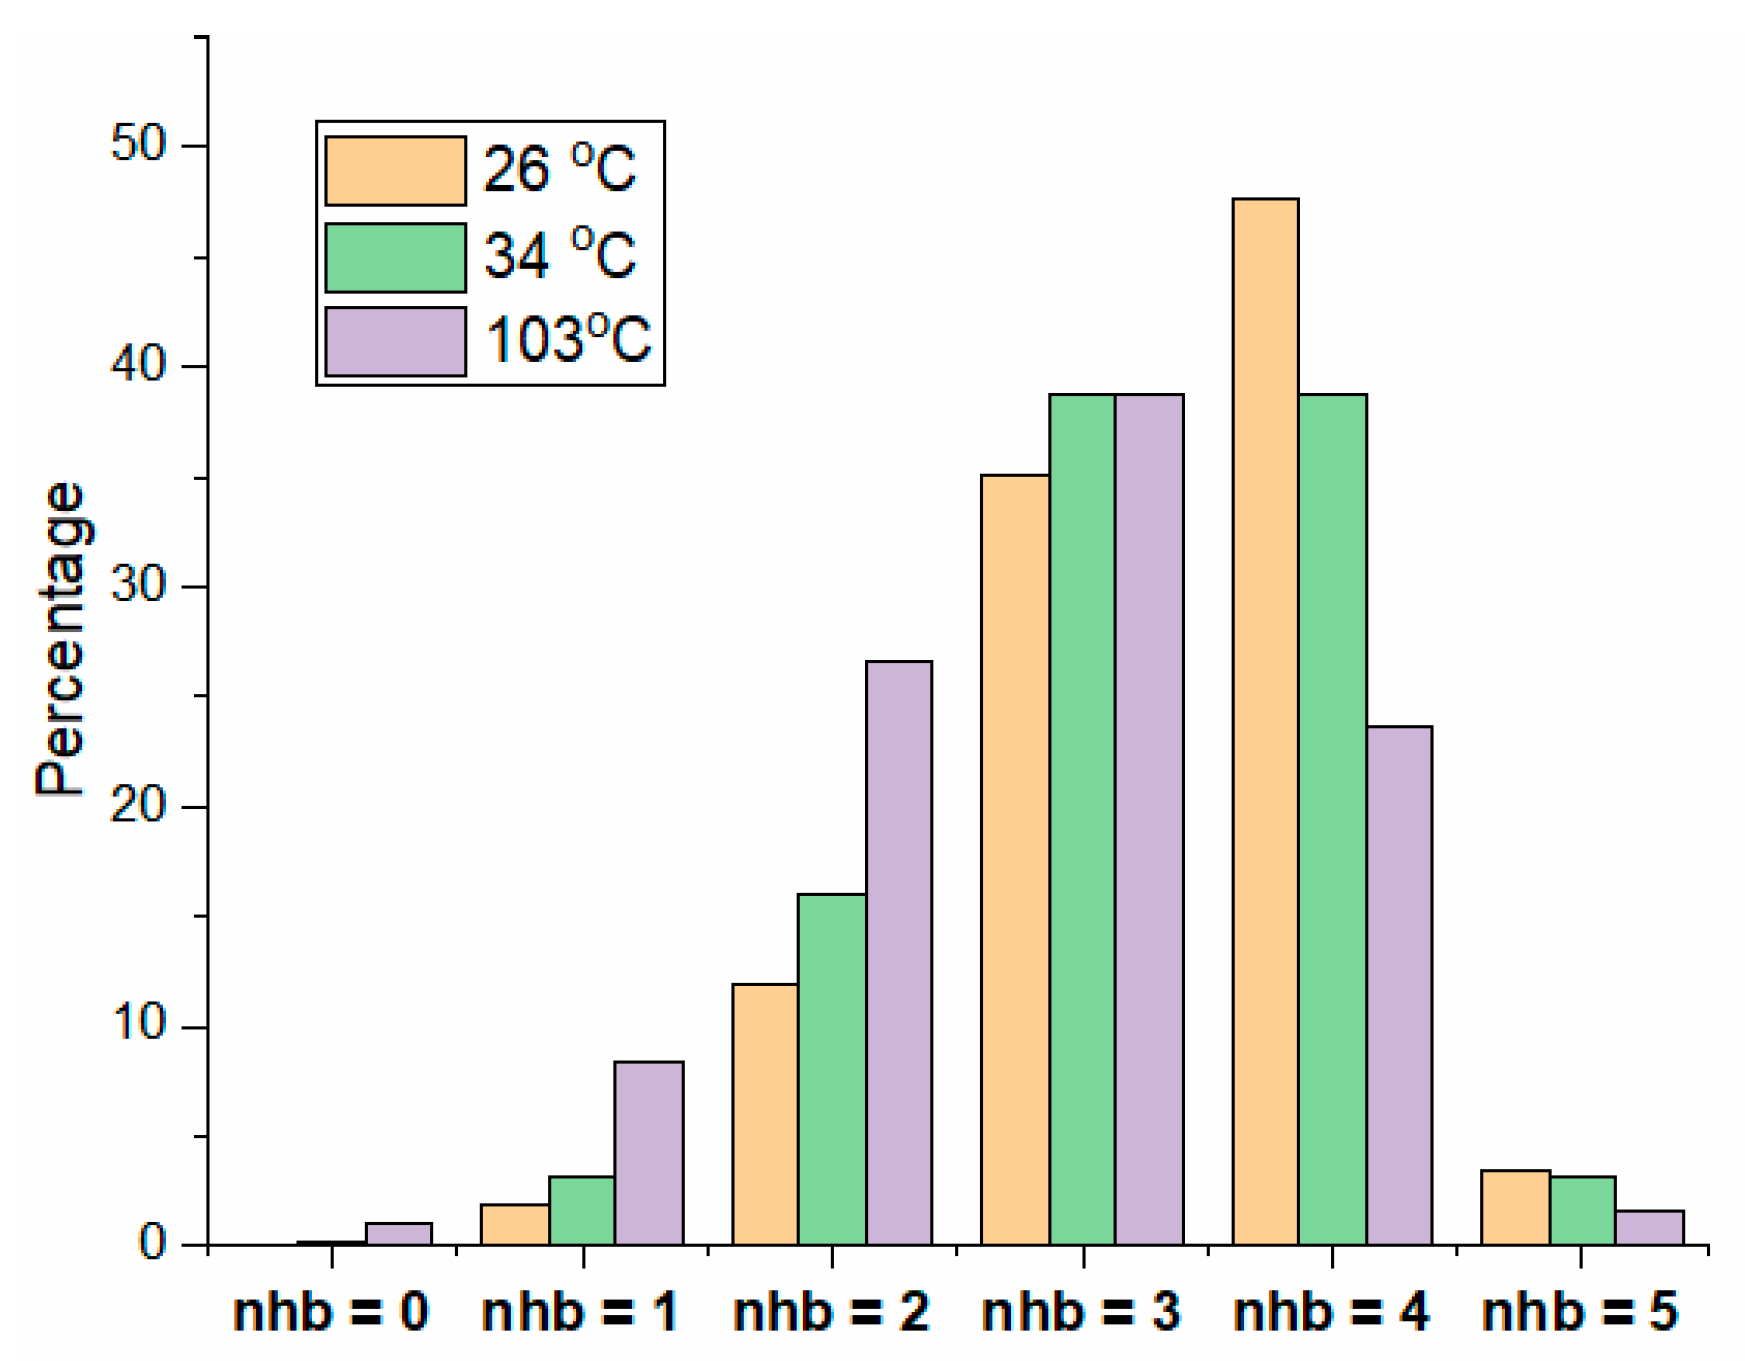
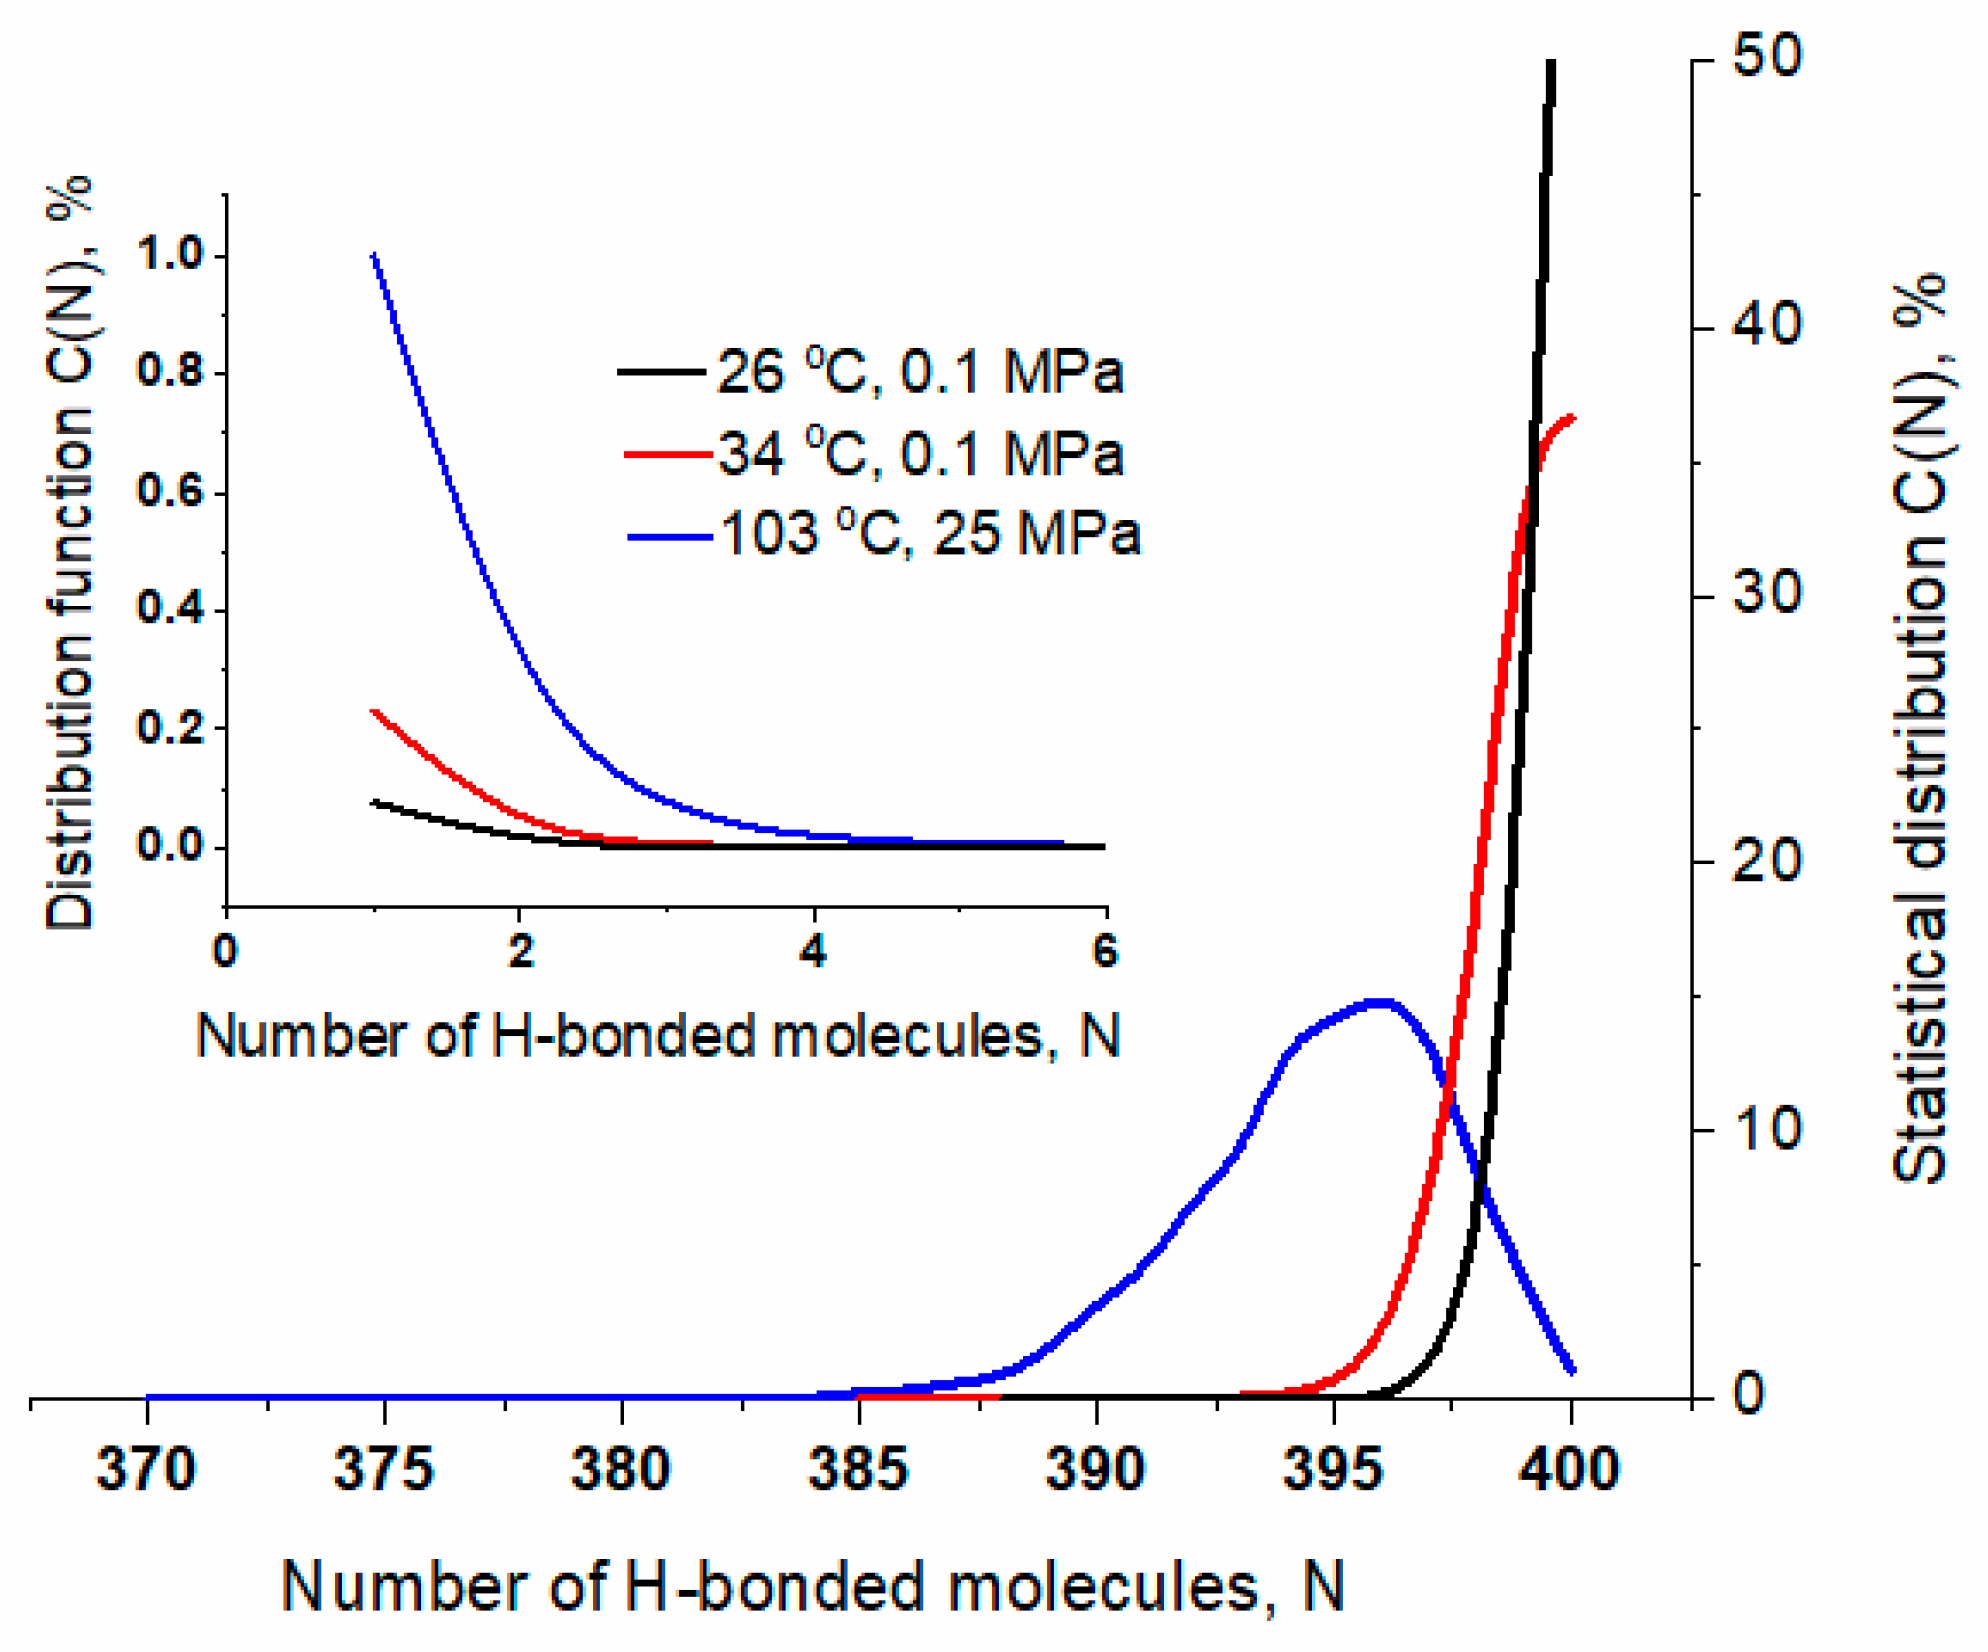
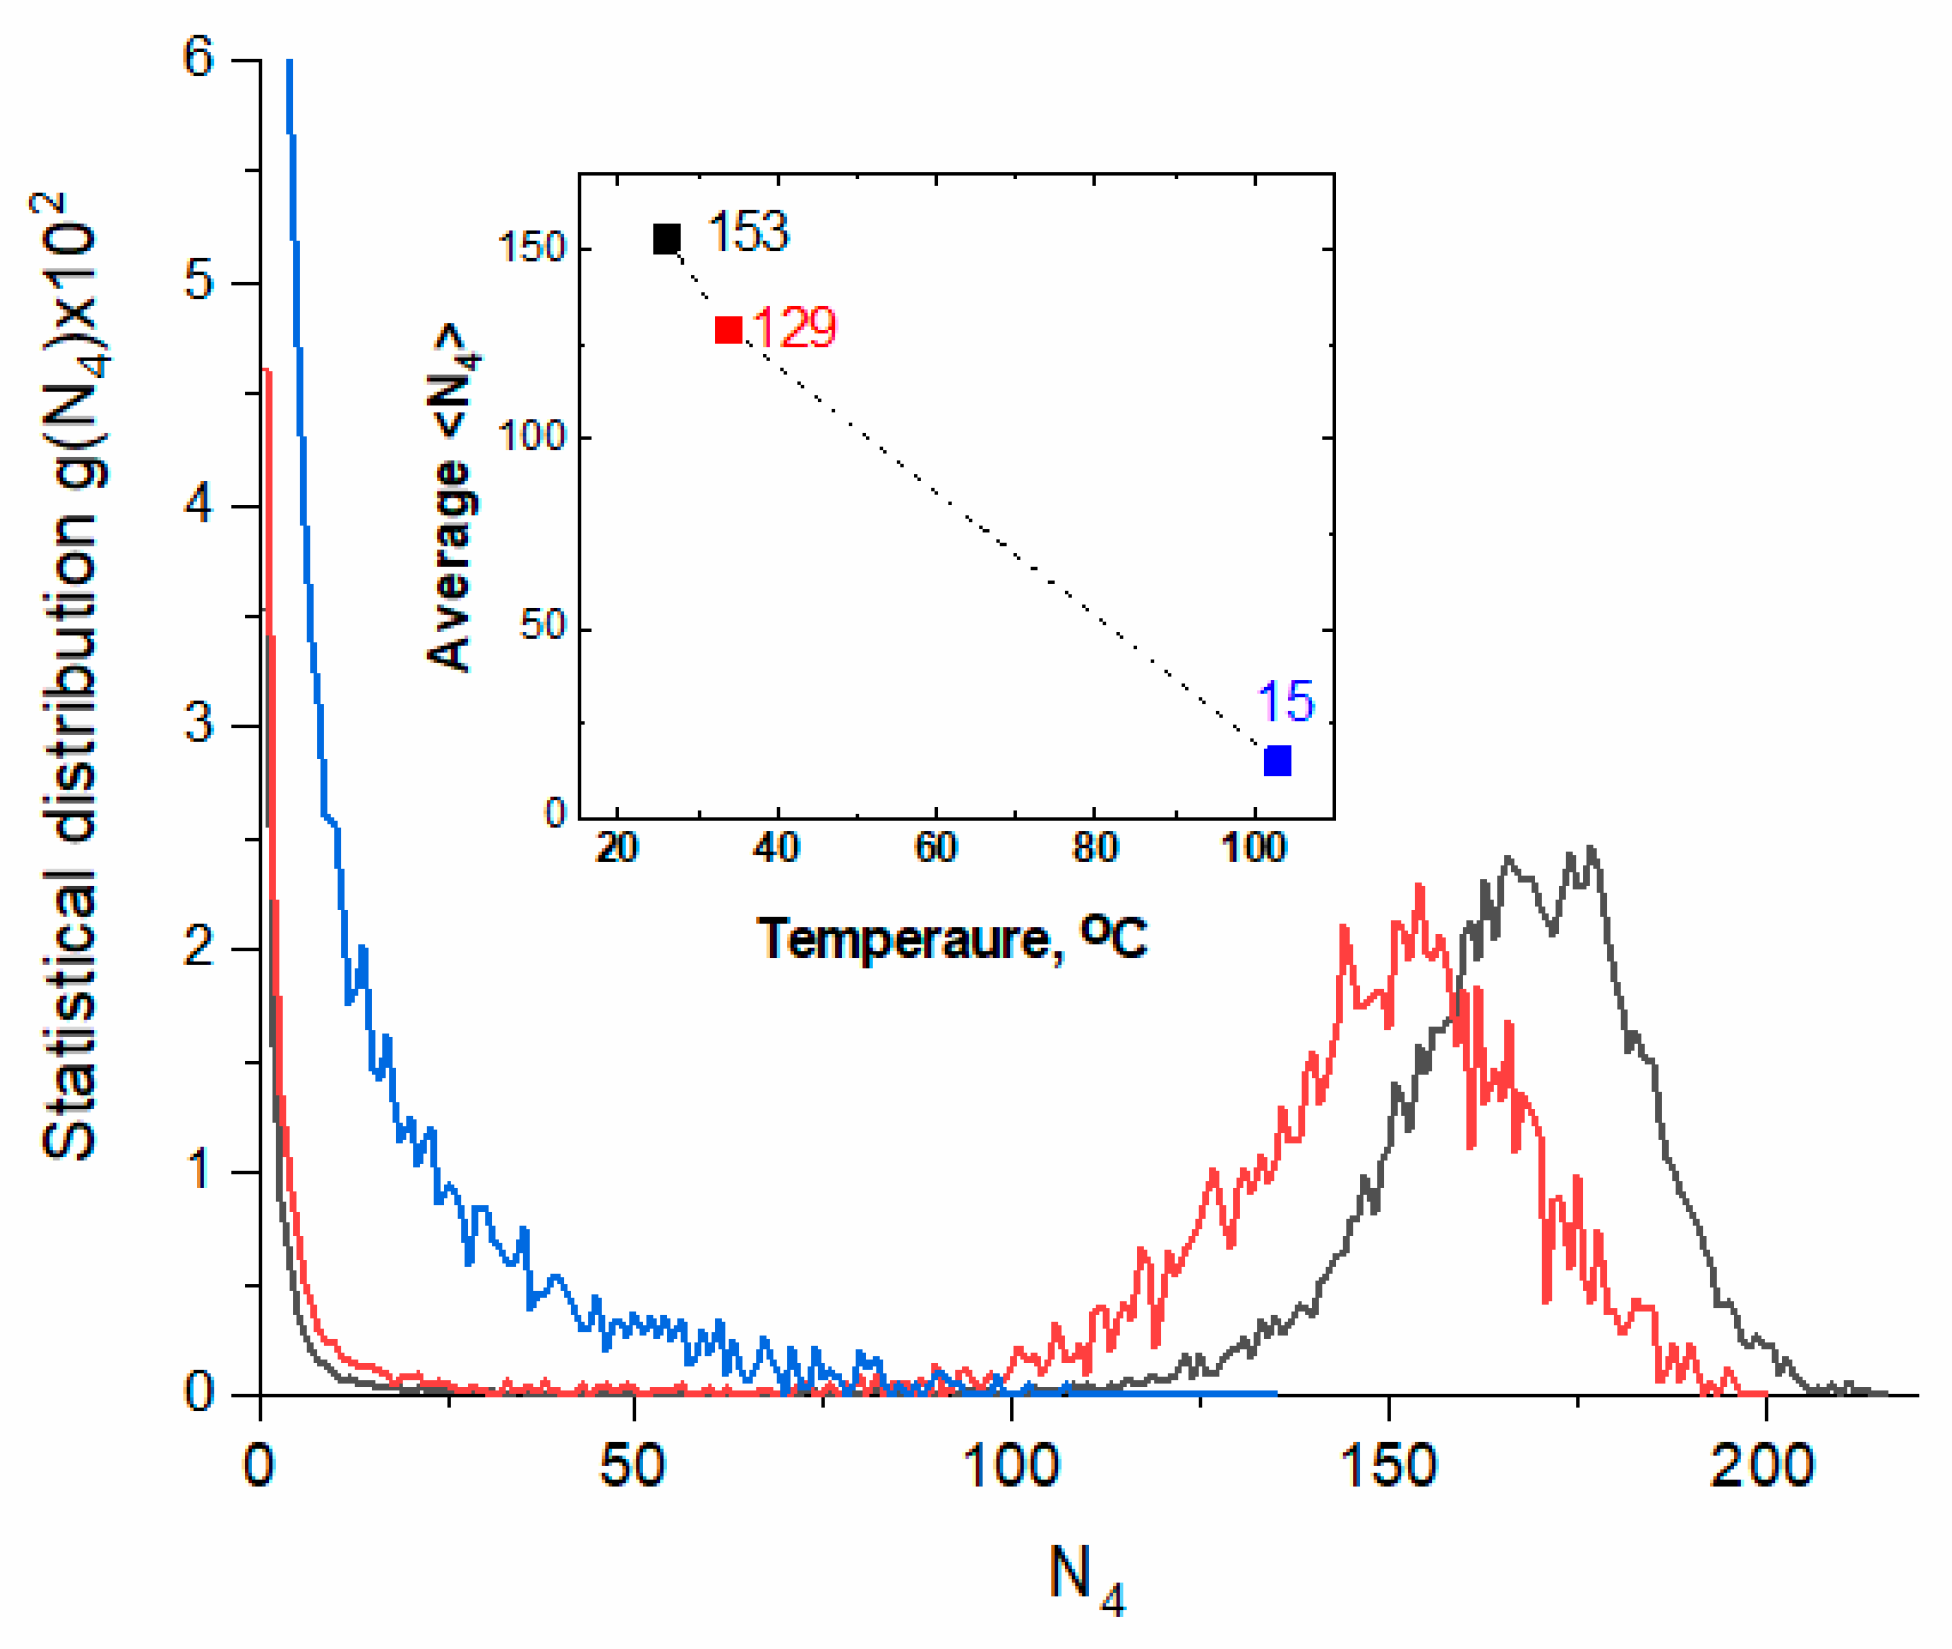
2.2.2. Hydrogen Bond Network
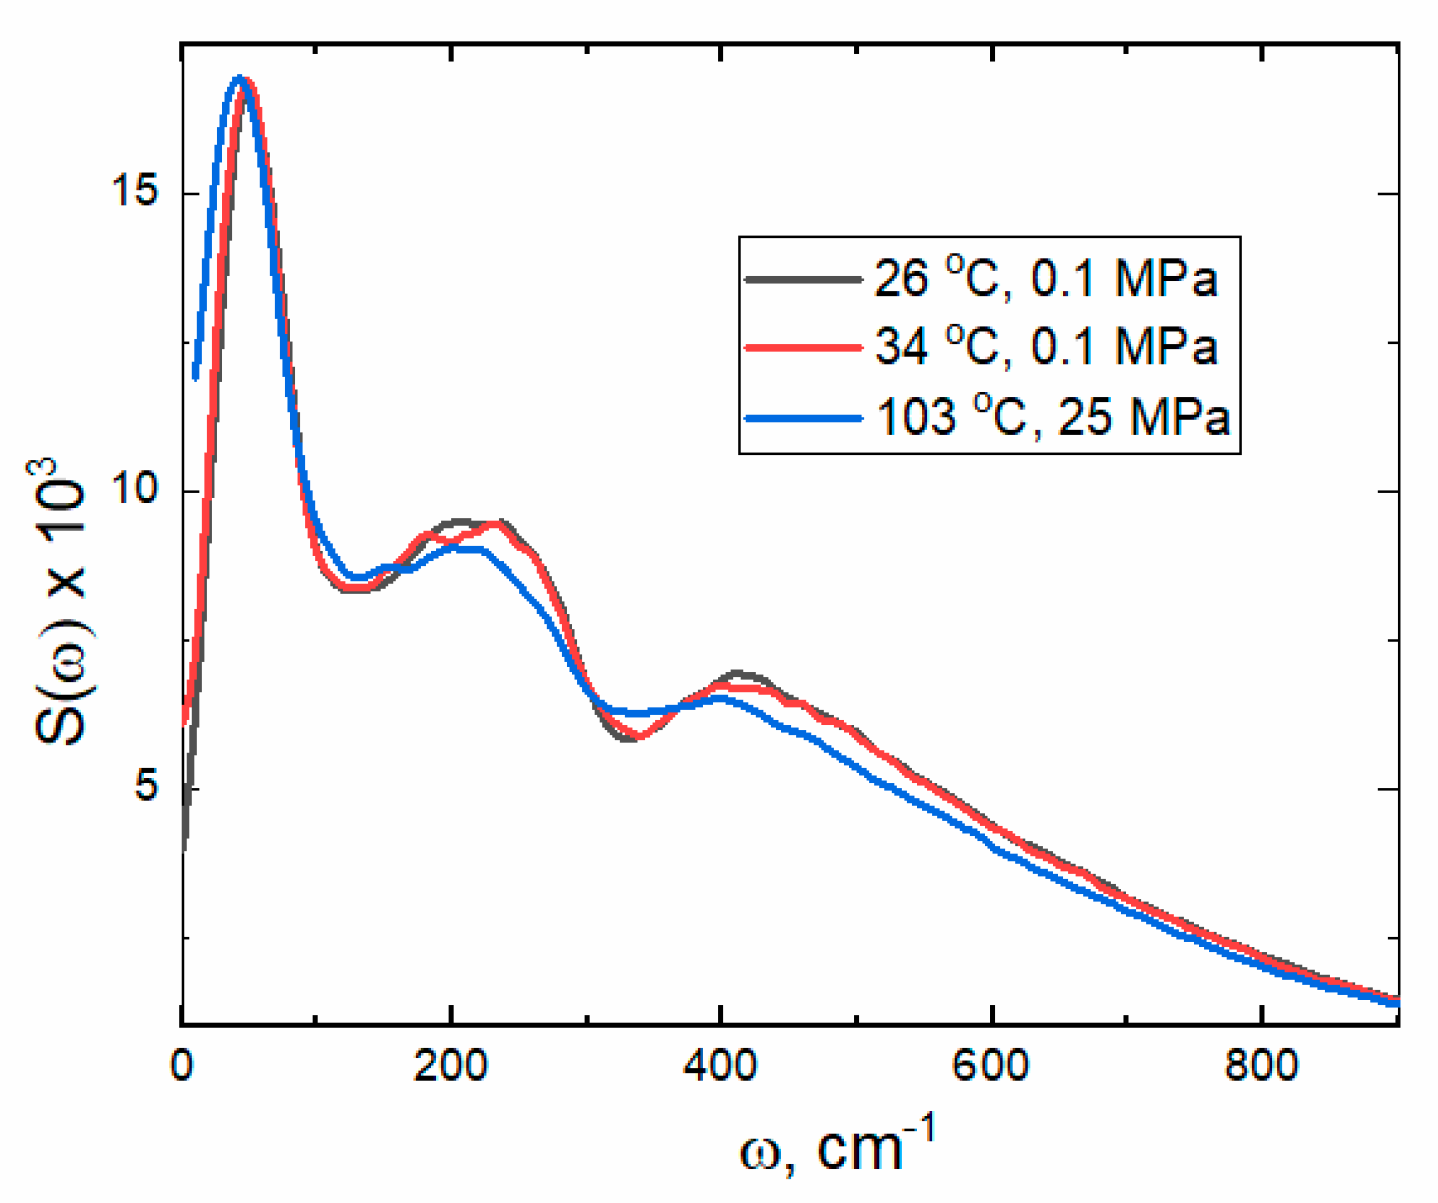
2.2.3. Power Spectra
3. Discussion
4. Materials and Methods
4.1. Experimental Method
4.2. Computational Method
5. Conclusions
Supplementary Materials
Author Contributions
Funding
Institutional Review Board Statement
Informed Consent Statement
Data Availability Statement
Conflicts of Interest
References
- Maréchal, Y. The Hydrogen Bond and the Water Molecule; Elsevier: Amsterdam, The Netherlands, 2007. [Google Scholar]
- Sun, C.Q.; Huang, Y.; Zhang, X.; Ma, Z.; Wang, B. The Physics Behind Water Irregularity. Phys. Rep. 2023, 998, 1–68. [Google Scholar] [CrossRef]
- Nilsson, A.; Pettersson, L.G.M. Perspective on the Structure of Liquid Water. Chem. Phys. 2011, 389, 1–34. [Google Scholar] [CrossRef]
- Bartha, F.; Kapuy, O.; Kozmutza, C.; Van Alsenoy, C. Analysis of Weakly Bound Structures: Hydrogen Bond and the Electron Density in a Water Dimer. Proc. J. Mol. Struct. THEOCHEM 2003, 666–667, 117–122. [Google Scholar] [CrossRef]
- Stanley, H.E.; Buldyrev, S.V.; Canpolat, M.U.; Mishima, O.; Sadr-Lahijany, M.R.; Scala, A.; Starr, F.W. The Puzzling Behavior of Water at Very Low Temperature. Phys. Chem. Chem. Phys. 2000, 2, 1551–1558. [Google Scholar] [CrossRef]
- Stanley, H.E.; Buldyrev, S.V.; Canpolat, M.U.; Meyer, M.; Mishima, O.; Sadr-Lahijany, M.R.; Scala, A.; Starr, F.W. The Puzzling Statistical Physics of Liquid Water. Phys. A 1998, 257, 213–232. [Google Scholar] [CrossRef]
- Geiger, A.; Stanley, H.E. Low-Density Patches in the Hydrogen-Bond Network of Liquid Water: Evidence from Molecular-Dynamics Computer Simulations. Phys. Rev. Lett. 1982, 49, 1749–1752. [Google Scholar] [CrossRef]
- Blumberg, R.L.; Stanley, H.E.; Geiger, A.; Mausbach, P. Connectivity of Hydrogen Bonds in Liquid Water. J. Chem. Phys. 1984, 80, 5230–5241. [Google Scholar] [CrossRef]
- Huang, C.; Wikfeldt, K.T.; Tokushima, T.; Nordlund, D.; Harada, Y.; Bergmann, U.; Niebuhr, M.; Weiss, T.M.; Horikawa, Y.; Leetmaa, M.; et al. The Inhomogeneous Structure of Water at Ambient Conditions. Proc. Natl. Acad. Sci. USA 2009, 106, 15214–15218. [Google Scholar] [CrossRef]
- Swiatla-Wojcik, D.; Szala-Bilnik, J. Transition from Patchlike to Clusterlike Inhomogeneity Arising from Hydrogen Bonding in Water. J. Chem. Phys. 2011, 134, 054121. [Google Scholar] [CrossRef] [PubMed]
- Swiatla-Wojcik, D. Simulation Studies of the Dynamics and the Connectivity Patterns of Hydrogen Bonds in Water from Ambient to Supercritical Conditions. Molecules 2024, 29, 5513. [Google Scholar] [CrossRef]
- Bakker, H.J.; Skinner, J.L. Vibrational Spectroscopy as a Probe of Structure and Dynamics in Liquid Water. Chem. Rev. 2010, 110, 1498–1517. [Google Scholar] [CrossRef]
- Perakis, F.; De Marco, L.; Shalit, A.; Tang, F.; Kann, Z.R.; Kühne, T.D.; Torre, R.; Bonn, M.; Nagata, Y. Vibrational Spectroscopy and Dynamics of Water. Chem. Rev. 2016, 116, 7590–7607. [Google Scholar] [CrossRef] [PubMed]
- Swiatla-Wojcik, D. Water-Structure Based Mechanistic View on the Bimolecular Decay of the Hydrated Electron. Chem. Phys. Lett. 2015, 641, 51–56. [Google Scholar] [CrossRef]
- Brubach, J.-B.; Mermet, A.; Filabozzi, A.; Gerschel, A.; Roy, P. Signatures of the Hydrogen Bonding in the Infrared Bands of Water. J. Chem. Phys. 2005, 122, 184509. [Google Scholar] [CrossRef]
- Giuffrida, S.; Cottone, G.; Cordone, L. The Water Association Band as a Marker of Hydrogen Bonds in Trehalose Amorphous Matrices. Phys. Chem. Chem. Phys. 2017, 19, 4251–4265. [Google Scholar] [CrossRef]
- Zelsmann, H.R. Temperature Dependence of the Optical Constants for Liquid H2O and D2O in the Far IR Region. J. Mol. Struct. 1995, 350, 95–114. [Google Scholar] [CrossRef]
- Praprotnik, M.; Janežič, D.; Mavri, J. Temperature Dependence of Water Vibrational Spectrum: A Molecular Dynamics Simulation Study. J. Phys. Chem. A 2004, 108, 11056–11062. [Google Scholar] [CrossRef]
- Mizuse, K.; Fujii, A.; Mikami, N. Long Range Influence of an Excess Proton on the Architecture of the Hydrogen Bond Network in Large-Sized Water Clusters. J. Chem. Phys. 2007, 126, 231101. [Google Scholar] [CrossRef]
- Max, J.J.; Larouche, P.; Chapados, C. Orthogonalyzed H2O and D2O Species Obtained from Infrared Spectra of Liquid Water at Several Temperatures. J. Mol. Struct. 2017, 1149, 457–472. [Google Scholar] [CrossRef]
- Max, J.-J.; Chapados, C. Determination of Spectroscopic Band Shapes Using Second Derivatives, Part I: Theory. Appl. Spectrosc. 2015, 69, 348–362. [Google Scholar] [CrossRef]
- Max, J.-J.; Chapados, C. Determination of Spectroscopic Band Shapes by Second Derivatives, Part II: Infrared Spectra of Liquid Light and Heavy Water. Appl. Spectrosc. 2015, 69, 1281–1292. [Google Scholar] [CrossRef] [PubMed]
- Walrafen, G.E.; Hokmabadi, M.S.; Yang, W.H. Raman investigation of the temperature dependence of the bending .nu.2 and combination .nu.2 + .nu.L bands from liquid water. J. Phys. Chem. 1988, 92, 2433–2438. [Google Scholar] [CrossRef]
- Verma, P.K.; Kundu, A.; Puretz, M.S.; Dhoonmoon, C.; Chegwidden, O.S.; Londergan, C.H.; Cho, M. The Bend + Libration Combination Band Is an Intrinsic, Collective, and Strongly Solute-Dependent Reporter on the Hydrogen Bonding Network of Liquid Water. J. Phys. Chem. B 2018, 122, 2587–2599. [Google Scholar] [CrossRef]
- Devlin, J.P.; Sadlej, J.; Buch, V. Infrared Spectra of Large H2O Clusters: New Understanding of the Elusive Bending Mode of Ice. J. Phys. Chem. A 2001, 105, 974–983. [Google Scholar] [CrossRef]
- Draegert, D.A.; Stone, N.W.B.; Curnutte, B.; Williams, D. Far-Infrared Spectrum of Liquid Water. J. Opt. Soc. Am. 1966, 56, 64–69. [Google Scholar] [CrossRef]
- Swiatla-Wojcik, D. Evaluation of the criteria of Hydrogen Bonding in highly associated liquids. Chem. Phys. 2007, 342, 260–266. [Google Scholar] [CrossRef]
- Bopp, P.; Jancsó, G.; Heinzinger, K. An Improved Potential for Non-rigid Water Molecules in the Liquid Phase. Chem. Phys. Lett. 1983, 98, 129–133. [Google Scholar] [CrossRef]
- Stillinger, F.H.; Rahman, A. Revised Central Force Potentials for Water. J. Chem. Phys. 1978, 68, 666–670. [Google Scholar] [CrossRef]
- Walrafen, G.E.; Hokmabadi, M.S.; Yang, W.H.; Chu, Y.C.; Monosmith, B. Collision-Induced Raman Scattering form water and aqueous solution. J. Phys. Chem. 1989, 93, 2909–2917. [Google Scholar] [CrossRef]
- Yu, C.C.; Chiang, K.Y.; Okuno, M.; Seki, T.; Ohto, T.; Yu, X.; Korepanov, V.; Hamaguchi, H.; Hunger, J.; Nagata, Y. Vibrational couplings and energy transfer pathways of water’s bending mode. Nat. Commun. 2020, 11, 5977. [Google Scholar] [CrossRef]
- Debenedetti, P.G. Supercooled and Glassy Water. J. Phys. Condens. Matter 2003, 15, R1669–R1726. [Google Scholar] [CrossRef]
- Kell, G.S. Density, Thermal Expansivity, and Compressibility of Liquid Water from 0°C to 150 °C. Correlations and Tables for Atmospheric-Pressure and Saturation Reviewed and Expressed on 1968 Temperature Scale. J. Chem. Eng. Data 1975, 20, 97–105. [Google Scholar] [CrossRef]
- Angell, C.A.; Oguni, M.; Sichina, W.J. Heat Capacity of Water at Extremes of Supercooling and Superheating. J. Phys. Chem. 1982, 86, 998–1002. [Google Scholar] [CrossRef]
- Carlton, T.S. Using Heat Capacity and Compressibility To Choose among Two-State Models of Liquid Water. J. Phys. Chem. B 2007, 111, 13398–13403. [Google Scholar] [CrossRef] [PubMed]
- Errington, J.R.; Debenedetti, P.G. Relationship between structural order and the anomalies of liquid water. Nature 2001, 409, 318–321. [Google Scholar] [CrossRef]
- Water Density Table. Available online: www.internetchemistry.com/chemical-data/water-density-table.php (accessed on 14 April 2025).
- Specific Heat Capacity of Water: Temperature-Dependent Data and Calculator. Available online: www.engineeringtoolbox.com/specific-heat-capacity-water-d_660.html (accessed on 14 April 2025).
- Vedamuthu, M.; Singh, S.; Robinson, G.W. Properties of Liquid Water. 4. The Isothermal Compressibility Minimum near 50 °C. J. Phys. Chem. 1995, 99, 9263–9267. [Google Scholar] [CrossRef]
- Speedy, R.J.; Angell, C.A. Isothermal Compressibility of Supercooled Water and Evidence for a Thermodynamic Singularity at −45 °C. J. Chem. Phys. 1976, 65, 851–858. [Google Scholar] [CrossRef]
- Poole, P.H.; Saika-Voivod, I.; Sciortino, F. Density minimum and liquid–liquid phase transition. J. Phys. Condens. Matter 2005, 17, L431–L437. [Google Scholar] [CrossRef]
- Sastry, S.; Debenedetti, P.G.; Sciortino, F.; Stanley, H.E. Singularity-free interpretation of the thermodynamics of supercooled water. Phys. Rev. E 1996, 53, 6144. [Google Scholar] [CrossRef]
- Rebelo, L.P.N.; Debenedetti, P.G.; Sastry, S. Singularity-free interpretation of the thermodynamics of supercooled water. II. Thermal and volumetric behavior. J. Chem. Phys. 1998, 109, 626–633. [Google Scholar] [CrossRef]
- Duval, E.; Boukenter, A.; Achibat, T. Vibrational dynamics and the structure of glasses. J. Phys. Condens. Matter 1990, 2, 10227. [Google Scholar] [CrossRef]
- Carney, G.D.; Curtiss, L.A.; Langhoff, S.R. Improved Potential Functions for Bent AB2 Molecules: Water and Ozone. J. Mol. Spectrosc. 1976, 61, 371–381. [Google Scholar] [CrossRef]

| Bending | Stretching | |||||
|---|---|---|---|---|---|---|
| System | 26 °C 0.1 MPa | 34 °C 0.1 MPa | 103 °C 25 MPa | 26 °C 0.1 MPa | 34 °C 0.1 MPa | 103 °C 25 MPa |
| 1ωmax | 1709 | 1706 | 1704 | 3551 | 3558 | 3638 |
| 1W1/2 | 92 | 82 | 88 | 333 | 303 | 240 |
| 1Smax | 0.0032 | 0.0024 | 0.0021 | 0.0045 | 0.0042 | 0.0023 |
| 2ωmax | 1724 | 1721 | 1715 | 3463 | 3443 | 3480 |
| 2W1/2 | 250 | 191 | 204 | 154 | 165 | 251 |
| 2Smax | 0.0016 | 0.0021 | 0.0019 | 0.0007 | 0.0009 | 0.0030 |
Disclaimer/Publisher’s Note: The statements, opinions and data contained in all publications are solely those of the individual author(s) and contributor(s) and not of MDPI and/or the editor(s). MDPI and/or the editor(s) disclaim responsibility for any injury to people or property resulting from any ideas, methods, instructions or products referred to in the content. |
© 2025 by the authors. Licensee MDPI, Basel, Switzerland. This article is an open access article distributed under the terms and conditions of the Creative Commons Attribution (CC BY) license (https://creativecommons.org/licenses/by/4.0/).
Share and Cite
Filipczak, P.; Kozanecki, M.; Szala-Rearick, J.; Swiatla-Wojcik, D. Microheterogeneity in Liquid Water Associated with Hydrogen-Bond Cooperativity-IR Spectroscopic and MD Simulation Study of Temperature Effect. Int. J. Mol. Sci. 2025, 26, 5187. https://doi.org/10.3390/ijms26115187
Filipczak P, Kozanecki M, Szala-Rearick J, Swiatla-Wojcik D. Microheterogeneity in Liquid Water Associated with Hydrogen-Bond Cooperativity-IR Spectroscopic and MD Simulation Study of Temperature Effect. International Journal of Molecular Sciences. 2025; 26(11):5187. https://doi.org/10.3390/ijms26115187
Chicago/Turabian StyleFilipczak, Paulina, Marcin Kozanecki, Joanna Szala-Rearick, and Dorota Swiatla-Wojcik. 2025. "Microheterogeneity in Liquid Water Associated with Hydrogen-Bond Cooperativity-IR Spectroscopic and MD Simulation Study of Temperature Effect" International Journal of Molecular Sciences 26, no. 11: 5187. https://doi.org/10.3390/ijms26115187
APA StyleFilipczak, P., Kozanecki, M., Szala-Rearick, J., & Swiatla-Wojcik, D. (2025). Microheterogeneity in Liquid Water Associated with Hydrogen-Bond Cooperativity-IR Spectroscopic and MD Simulation Study of Temperature Effect. International Journal of Molecular Sciences, 26(11), 5187. https://doi.org/10.3390/ijms26115187