Abstract
This study investigated the effects of two nanofertilizers (NFs): copper nanoparticles (NPs) synthesised using cotton (CuC) and chitosan (CuCh) as well as two biofertilizers (BFs), nopal extract (NE) and commercial Biojal® worm humus (WH), on the growth of black bean seedlings. The treatments consisted of applying 50 mg L−1 of CuC, 50 mg L−1 of CuCh, 50 mg L−1 of NE, 100 mg L−1 of WH, their respective combinations, and an absolute control that consisted of distilled water. The CuC, CuCh, WH, and WH + CuC leaf applications resulted in an increase in plant height by 34.4%, 19.5%, 25.7%, and 20.3%, respectively. Furthermore, the CuC and WH applications led to an increase in the number of leaves by 53.2% and 36.9%, respectively. However, the addition of NE + CuC resulted in a 37.4% decrease in dry weight. A total of 44 metabolites were identified, including 7 sugars, 17 amino acids, 12 organic acids, 4 nucleosides, 1 alcohol, and 3 miscellaneous metabolites. The NE + CuC and WH treatments resulted in a notably higher concentration of various metabolites, including amino acids, organic acids, and sugars. Conversely, the CuCh treatment led to an increased concentration of nucleosides, amino acids, trigonelline, and nicotinamide adenine dinucleotide (NAD+).
1. Introduction
The agricultural industry is currently facing a crisis due to climate change and the overutilisation of chemical fertilizers and pesticides [1]. Conventional fertilizers negatively affect soil health and the overall ecosystem [2]. However, nanotechnology has the potential to reduce the environmental impact of traditional farming practices [3]. Nanotechnology has demonstrated its capacity to revolutionise agricultural systems via advancements in crop production through the use of nanofertilizers (NFs) and nanopesticides [4]. Nanofertilizers are composed of nanoparticles (NPs) containing macro- or micronutrients that are strategically applied to crops to improve both the plants’ growth and quality [5] in a controlled manner. Furthermore, NFs enhance nutrient absorption efficiency, boost photosynthesis, reduce soil toxicity, lower the required application frequency, and, most importantly, mitigate environmental pollution [6]. However, it is important to note that producing NPs involves using chemicals that consume energy and produce environmental pollution [3].
Various biological synthetic technologies have recently emerged for manufacturing NPs; such technologies are renowned for being environmentally friendly, efficient, and non-toxic. Nanoparticles obtained via biological or green synthesis routes generate less waste, rendering them effective and ecological methods for use with agricultural crops [7,8]. One of the metals that can be synthesised and used as a NFs is copper (Cu) [9].
Copper is an essential micronutrient vital for plant growth and metabolism [10]. Its presence improves chlorophyll formation, and Cu is involved in cell-wall development; the element also exhibits antimicrobial properties and provides resistance to stress [11]. Additionally, Cu participates in enzymatic reactions and serves as a cofactor for several proteins [12]. Some authors suggests that the use of copper oxide (CuO) NPs can increase plant growth due to enhanced bioavailability of Cu2+; these NPs are accordingly efficient NFs [3]. Other authors applied CuO NPs (80 mg L−1) to dragonhead plant leaves and observed an increase in biomass, elevated accumulation of Cu in shoots, and higher yields of bioactive compounds [13]. Similarly, foliar application of CuO NPs (8 mg L−1) to mustard plants was evaluated. The results indicated significant increases in growth and biomass, as well as an increased content of chlorophylls and proline and heightened antioxidant activity [11].
On the other hand, biofertilizers (BFs) are another alternative to improve plant nutrition, promote soil health, and optimise crop yields for sustainable agricultural production [14,15]. However, the effectiveness of biofertilization in agriculture is influenced by various factors. Some authors have noted that the combination of NFs with BFs increases nutrient-utilisation efficiency and improves tolerance to abiotic stress [16].
The common bean (Phaseolus vulgaris L.) is one of the most important legumes in the world [17]. In Mexico, it is one of the basic foods in the local food basket; it serves as a staple in the diets of lower-income individuals due to the high nutritional value it provides at a low cost. The common bean furthermore plays a vital role in children’s diets as it promotes brain development owing to its rich content of iron, protein, calcium, and fibre [18]. In addition, it is an important source of protein (14 to 33%), starch, B complex vitamins, minerals (calcium, copper, potassium, magnesium, phosphorus and zinc), and dietary fibre [18,19].
The use of NPs in plants confers promise for improving crop qualities and yields, given that plants activate defence mechanisms to adapt to adverse environmental conditions. Such a situation can lead to the accumulation or depletion of various metabolites [20]. Changes in the metabolic profiles of plants can arise from genetic modifications, external stimuli, or exposure to stressors or elicitors [21,22]. These changes can be effectively studied using a metabolomic approach, which involves analysing the metabolites that serve as biomarkers during stressful situations [23]. Metabolomic analysis can involve several different techniques. Nuclear magnetic resonance (NMR) spectroscopy is a rapid, reproducible, and high-throughput technique [24,25]. 1H NMR, combined with multivariate data analysis, is one of the most-used methodologies for metabolomics studies [26].
We assumed that the foliar application of NFs or BFs could enhance plant nutrition while minimising the negative consequences associated with the excessive use of conventional chemical fertilizers. Furthermore, the combination of NFs and BFs has the potential to amplify their respective effects on plant growth and development [24]. Therefore, the objective of this work was to assess the impact of foliar application of Cu NPs synthesised using green methods; these NPs functioned as both NFs and BFs. We furthermore investigated their synergistic effects on the agronomic and metabolomic responses of black bean seedling leaves.
2. Results
2.1. Bean Crop Growth
The application of nanofertilizers (NFs) and biofertilizers (BFs) to the leaves of black bean seedlings resulted in significant modifications to the plant height (PH), number of leaves per plant (NL), and dry weight (DW). The copper-cotton (CuC) and copper-chitosan (CuCh) NPs exhibited notable increases in PH (i.e., 34.4% and 19.5%, respectively, compared with the absolute control (C)). Among the BFs, only Biojal® worm humus (WH) showed a substantial increase of 25.7%. The combination of NFs and BFs did not significantly affect PH, with the exception of the WH + CuC treatment, which resulted in a 20.3% increase in PH compared to the absolute control (C) (Figure S1A).
Both stem diameter (SD) and fresh weight (FW) were unaffected by any of the treatments (Figure S1B,C). However, the NL increased by 53.2% and 36.9% after the CuC and WH treatments, respectively (Figure S1D). The DW decreased by 37.4% relative to the absolute control (C) after the NE + CuC treatment (Figure S1E).
2.2. Identification of Metabolites
Figure S2 shows the 1H NMR spectrum (750 MHz) of the aqueous extract from untreated black beans leaves (C). We recorded multiple signals from 0.00 to 9.50 ppm belonging to 44 metabolites (i.e., 7 sugars, 17 amino acids, 12 organic acids, 4 nucleosides, 1 alcohol, and 3 miscellaneous metabolites). These findings are consistent with those reported by others authors [17], who studied the metabolic profile of seeds and leaves from five bean cultivars. When comparing the spectra, we obtained with those reported certain variations can be observed across different regions (Figure S2A–D). For instance, the signal intensity of 2-hydroxy-isobutyric acid was significantly higher over the range of 0.80–3.30 ppm (Figure S2B). Likewise, within 3.30–5.50 ppm range, more intense signals were observed for sugars (Figure S2C). Additionally, signals corresponding to amino acids and nucleosides appeared quite similar over the range 5.50–9.50 ppm; the exception was trigonelline, which exhibited a weaker signal (Figure S2D). Figure S7 illustrates the representative spectra of various treatments with NFs and BFs. It is noteworthy that the CuCh, WH, and NE + CuC treatments resulted in a higher signal intensity for various metabolites. This finding suggests that a greater concentration of metabolites persisted after those treatments compared with other treatments. For detailed information on the chemical shifts, multiplicity, and coupling constants of the metabolites identified in aqueous extracts of untreated black bean (Phaseolus vulgaris L.) leaves, the reader is referred to Table S2.
2.3. Multivariate Analysis
Figure 1 illustrates the results obtained from the principal component analysis (PCA) and orthogonal partial least squares discriminant analysis (OPLS-DA) models, along with the corresponding heat map derived from the 1H NMR spectra of black bean leaves treated with NFs and BFs. The PCA model was applied to assess the behaviour of the treatments. The result of the score scatterplot reveals no distinction among the treatments. The first principal component (PC1) and the second principal component (PC2) explained 38.3% and 15.2% of the variance, respectively (Figure 1A). On the other hand, the OPLS-DA graph reveals two-dimensional projections (PC1 = 32.9% and PC2 = 14.3%) indicating that the NE + CuC, WH, and CuCh treatments were distinct from the rest of the treatments (Figure 1B). The values of R2 and Q2, as well as the results of the permutation tests, can be found in Table S3. The heatmap (Figure 1C), by providing a visual representation of the metabolomic profile of each treatment, enables a comparison of the differences in relative concentration levels of the metabolites in the bean leaves. Seedlings treated with NE + CuC exhibit the highest concentration of metabolites, followed by the seedlings that received the WH and CuCh treatments. This finding is consistent with varied effects of the treatments observed in the OPLS-DA model. In particular, the NE + CuC and WH treatments resulted in a marked abundance of amino acids, organic acids, and sugars. The addition of CuCh also resulted in a high content of nucleosides, amino acids, trigonelline, and NAD+. On the other hand, when BFs (NE and WH) were used together with CuCh, the metabolite level fell significantly. This finding was also observed in the control group (C).
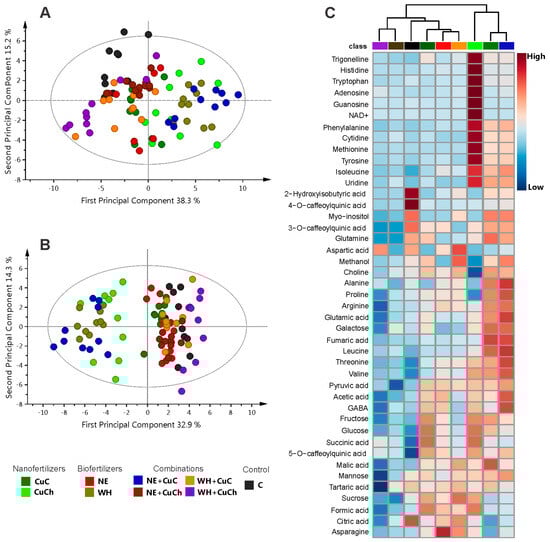
Figure 1.
Scatter plot depicting PCA scores with outliers (A); scatter plots from OPLS-DA without outliers (B), both derived from NFs and BFs applied to black bean leaves (Phaseolus vulgaris L.). Heatmap showing the relative abundance of identified metabolites (C). Red denotes a high relative abundance; blue denotes a low relative abundance. C: absolute control; CuC: copper-cotton NPs; CuCh: copper-chitosan NPs; NE: nopal extract; WH: Biojal® worm humus.
The discriminant metabolites were selected based on the projection of important variables (VIP > 1) obtained from the OPLS-DA model. The foliar application of NFs and BFs, as well as their combination, resulted in changes in the concentration of certain metabolites present in the bean leaves. Specifically, the levels of eight amino acids, five organic acids, sugars (arabinose), and nucleosides (uridine) were affected. The treatments that resulted in the most significant metabolite increment included NE + CuC, WH, and CuCh. For instance, leucine increased by 192.68%, 170.62%, and 128.36%, respectively, after the NE + CuC, WH, and CuCh treatments. Valine increased by 195.13%, 159.21%, and 140.40%, respectively. Tyrosine increased by 150.98%, 138.18%, and 93.85%, respectively; isoleucine increased by 203.56%, 164.36%, and 146.33%, respectively. Phenylalanine increased by 167.01%, 141.92%, and 106.38%, respectively. Methionine increased by 146.43%, 118.68%, and 90.60%, respectively. Proline increased by 42.63%, 31.90%, and 29.24%, respectively. Arginine increased by 36.48%, 31.90%, and 42.44%, respectively. Fumaric acid increased by 290.94%, 295.16%, and 270.85%, respectively; uridine increased by 140.74%, 141.18%, and 107.93% (Figure 2).
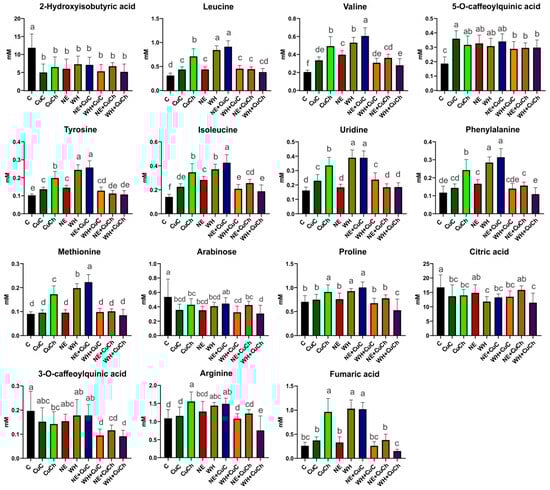
Figure 2.
Relative concentrations of differential metabolites obtained the VIP scores of the OPLS-DA model for black bean leaves (Phaseolus vulgaris L.) treated with NFs and BFs and their respective combinations. Each data point represents the average of 10 replicates ± standard errors. Letters indicate significant differences between the treatments according to Duncan’s test (p ≤ 0.05). C: absolute control; CuC: copper-cotton NPs; CuCh: copper-chitosan NPs; NE: nopal extract; WH: Biojal® worm humus.
5-O-Caffeoylquinic acid levels were higher after the CuC treatment compared with the absolute control (C). On the other hand, the addition of WH + CuC, CuCh, NE + CuCh, and WH + CuCh decreased the concentration of 3-O-caffeoylquinic acid by 51.88%, 27.69%, 41.02%, and 53.54%, respectively. A decrease in 2-hydroxyisobutyric acid was observed in all treatments; the CuC treatment resulted in the greatest reduction (i.e., 57.73% compared with the absolute control (C)). Citric acid levels were also affected; they decreased by 16.65–31.80% with the treatments.
The exception was NE and NE + CuCh, which resulted in no significant differences compared with the absolute control (C). Similarly, arabinose decreased with the application of NFs and BFs; the exception was the NE + CuC treatment, which was similar to the absolute control (C). It is worth noting that the WH + CuCh treatment resulted in the lowest arabinose content (i.e., a decrease of 43.00% compared with the absolute control (C) (Figure 2).
We used PCA and OPLS-DA to study the NFs and BFs treatments. Principal component analysis did not reveal clear differentiation among the treatments. PC1 and PC2 accounted for 33.3% and 19.9% of the variance, respectively (Figure 3A). Conversely, the graphical results of the OPLS-DA model (PC1 = 28.5% and PC2 = 9.68%) revealed that the treatments could be separated into two groups: Group 1 consisting of CuCh and WH, and group 2 consisting of C, CuC, and NE. However, it is noteworthy that C also exhibited discernible segregation from the CuC and NE treatments (Figure 3B).
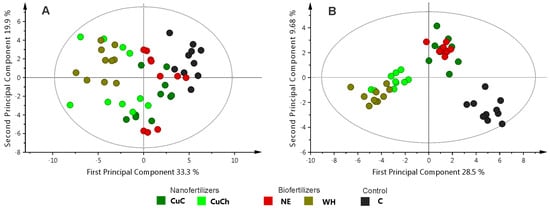
Figure 3.
Principal component analysis score scatter plot with outliers (A) and OPLS-DA score scatter plots (B) for the leaves of black bean (Phaseolus vulgaris L.) treated with NFs and BFs. C: absolute control; CuC: copper-cotton NPs; CuCh: copperchitosan NPs; NE: nopal extract; WH: Biojal® worm humus.
These groups self-segregated according to the concentration of metabolites resulting from the treatments; for instance, the CuC and NE treatments produced metabolites such as formic acid, asparagine, sucrose, and NAD+. The CuCh and WH treatments yielded the highest relative concentration of metabolites; the C samples exhibited higher concentrations of arabinose guanosine, methanol, citric acid, aspartic acid, tartaric acid, and caffeoylquinic acids (Figure 4A).
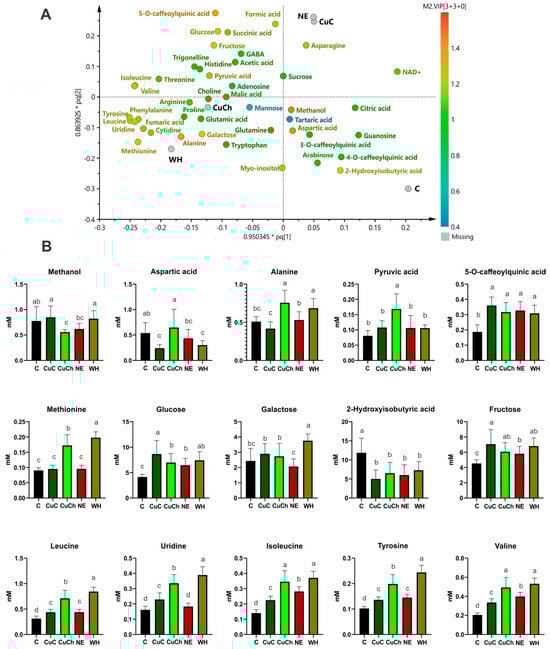
Figure 4.
The corresponding loading of scatter plots generated from the 1H NMR spectra (750 MHz) of the metabolites found in black bean (Phaseolus vulgaris L.) leaves treated with NFs and BFs illustrated in (A). The relative concentrations of various metabolites as a function of VIP score from the OPLS-DA model (B). Each data point is the average of 10 replicates ± standard error. Letters indicate significant differences between the treatments according to Duncan’s test (p ≤ 0.05). C: absolute control; CuC: copper-cotton NPs; CuCh: copper-chitosan NPs; NE: nopal extract; WH: Biojal® worm humus.
The differential metabolites obtained from the OPLS-DA model using a loading scatter plot are shown in Figure 4B. We found an increase in the content of 5-O-caffeoylquinic acid (92.30%), glucose (108.60%), fructose (55.69%), leucine (40.37%), uridine (41.98%), isoleucine (60.37%), tyrosine (32.91%), and valine (63.16%) after the CuC treatment. However, aspartic acid (55.39%) and 2-hydroxy-isobutyric acid (57.73%) decreased. On the other hand, we did not observe any significant differences in the content of methanol, alanine, pyruvic acid, methionine, or galactose compared with the C group.
We noted a higher concentration of alanine (48.53%), pyruvic acid (108.64%), tyrosine (93.85%), and valine (140.40%) after the CuCh treatment; there were also slight increases in 5-O-caffeolquinic acid (69.57%), methionine (90.60%), glucose (68.21%), fructose (33.84%), leucine (128.36%), uridine (107.93%), and isoleucine (146.33%). Conversely, methanol and 2-hydroxyisobutyric acid decreased by 28.12% and 45.16%, respectively, compared with the C group. Aspartic acid and galactose levels were similar to those observed in the C group.
The WH treatment resulted in the largest increase in metabolites of all the BFs. For instance, the contents of methionine (118.68%), galactose (54.69%), leucine (170.62%), uridine (141.18%), isoleucine (164.36%), tyrosine (138.18%), and valine (159.21%) all increased significantly. Additionally, alanine, 5-O-caffeoylquinic acid, glucose, and fructose exhibited increases of 34.38%, 64.97%, 78.77%, and 50.24%, respectively. Only aspartic acid and 2-hydroxyisobutyric acid decreased (by 44.05% and 38.55%, respectively). Methanol and pyruvic acid exhibited no differences compared with the C group.
We only observed slight increases in 5-O-caffeoylquinic acid (64.97%), glucose (55.24%), fructose (27.91%), leucine (40.88%), isoleucine (100.86%), tyrosine (41.50%), and valine (93.96%) for BFs with NE. The sole decrease was observed in 2-hydroxyisobutyric acid (49.27%); the levels of the remaining metabolites were similar to those of the C group (Figure 4B).
Figure 5A shows a PCA model plot for the combination of NFs + BFs. The plot reveals a lack of discernible separation among the treatments; however, OPLS-DA revealed that the treatments could be divided into two distinct groups: the NE + CuC treatment was distinct from the rest of the treatments (Figure 5B).
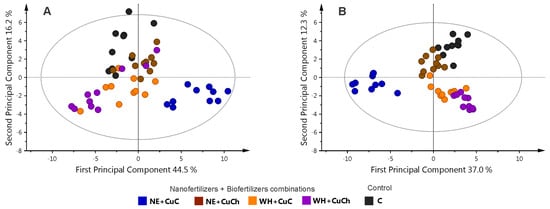
Figure 5.
Principal component analysis score scatter plot with outliers (A) and OPLS-DA score scatter plots with outliers removed (B) for the leaves of black bean (Phaseolus vulgaris L.) treated with combinations of NFs and BFs. C: absolute control; CuC: copper-cotton NPs; CuCh: copper-chitosan NPs; NE: nopal extract; WH: Biojal® worm humus.
The NE + CuC treatment resulted in the highest concentration of metabolites; the NE + CuCh treatment followed next (Figure 6A). However, the combination of CuC and CuCh NFs with BFs and WH had a detrimental effect—both treatments resulted in a reduction in metabolites.
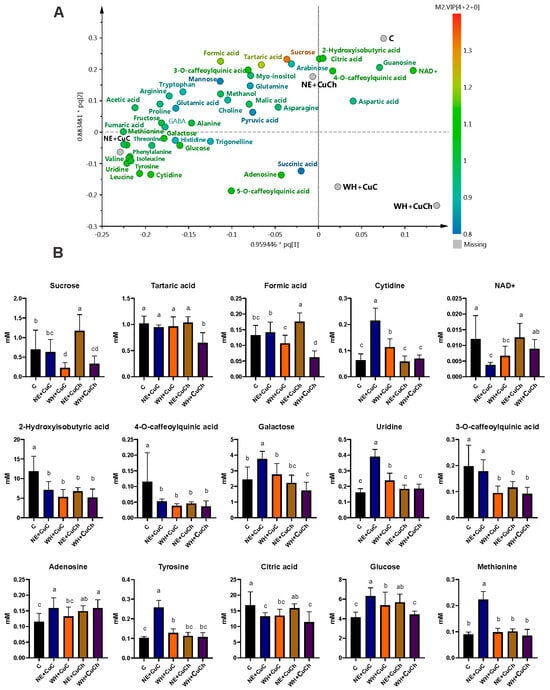
Figure 6.
The corresponding loading of scatter plots generated from the 1H NMR spectra (750 MHz) of the metabolites found in black bean (Phaseolus vulgaris L.) leaves treated with NFs and BFs illustrated in (A). Relative concentrations of differential metabolites obtained as a function of VIP score from the OPLS-DA (B). Each data point is the average of 10 replicates ± standard error. Letters indicate significant differences between the treatments according to Duncan’s test (p ≤ 0.05). C: absolute control. C: absolute control; CuC: copper-cotton NPs; CuCh: copper-chitosan NPs; NE: nopal extract; WH: Biojal® worm humus.
The combination of NE + CuC led to an increase in the content of sugars, including glucose (52.16%) and galactose (54.61%), as well as amino acids such as methionine (146.43%), and tyrosine (150.98%). The nucleosides cytidine (241.27%), uridine (140.74%), and adenosine (37.07%) increased as well. The content of organic acids such as 2-hydroxyisobutyric, 4-O-caffeoylquinic acid, citric acid, and NAD+ decreased with this combination, however. The remaining metabolites yielded levels similar to those of the C group.
The combination of NE + CuCh resulted in an increase in the contents of sucrose (67.29%), glucose (36.80%), formic acid (33.33%), and adenosine (28.45%). However, the combination led to a 43.09% decrease in the concentration of 2-hydroxyisobutyric acid. 3-O-caffeoylquinic acid also decreased by 41.02%, and 4-O-caffeoylquinic acid decreased by 60.34%. The remaining metabolites exhibited no significant differences compared with the C group. For the combination of WH + CuC, we noted an increase in the content of glucose (52.16%), tyrosine (25.00%), cytidine (79.37%), and uridine (46.87%); the treatment only increased the concentration of adenosine (37.07%). For both the NE + CuCh and WH + CuC combinations, the levels of the remaining metabolites did not significantly differ from those of the C group (Figure 6B).
3. Discussion
This study is the first to report a 1H NMR-based metabolomics profiling of black bean leaves, specifically investigating the effects of NFs and BFs foliar fertilization under field conditions. Prior to this research, a comprehensive metabolomic analysis of bean leaves was conducted, which established a protocol for replicating and validating the metabolic profile of this crop [17]. One advantage of foliar application of NFs is that NPs can pass through plant cells and penetrate the interior of the leaves given their nanometric size and the subsequent increase in their surface area [27]. As a result, nutrient penetration, absorption, and efficiency are enhanced [28]. On the other hand, conventional fertilizers only penetrate the leaf tissue of plants [29]. We have shown that the introduction of NPs increases plant leaf area. The increase expands the photosynthetic surface and increases the amount of chlorophyll and plant biomass, which can in turn trigger vigorous cumulative growth [30]. The observed increase in plant height and number of leaves can be attributed to the addition of CuC NPs.
Some authors have noted that the responses of plants exposed to BFs and nanomaterials in tandem differ from those observed when only BFs are applied [31]. This combination of elicitors can result in synergistic or antagonistic effects that can lead to improved plant resilience or a failure to withstand biotic or abiotic stresses [32]. Our findings demonstrate that both NFs and BFs influence the overall composition of metabolites in plants’ leaves. However, we noted an antagonistic effect when NFs and WH were combined—the combination led to a decrease in metabolite concentration in black bean leaves. That was unlike the combination of BFs of NE with CuC, which increased the concentration of metabolites. Also, the combination of NFs and BFs can prolong the lifespan and stability of nanoformulations against ultraviolet inactivation and heat [33]. Therefore, we assumed that the combination of BFs of NE with NFs of CuC would form the most stable nanoformulation and thereby elicit positive responses in the analysed crop.
Studying metabolites in plants is vital for gaining insights into their biology and understanding the effects of stress factors [34]. By monitoring changes in the concentrations of specific metabolites, it is possible to assess the impact of external stimuli and stressors [35]. We observed increased levels of organic acids, including pyruvic, acetic, fumaric, and succinic acids, when NE + CuC and CuCh were applied in tandem. These acids are of great importance in plants given that they participate in the tricarboxylic acid cycle, also known as the Krebs cycle, which generates energy for cellular processes [36]. Furthermore, an increase in organic acids triggers the increase or decrease in other metabolites, in this case an increase in pyruvic acid increases the concentration of tryptophan, which is a precursor of indole-3-acetic acid (IAA) through the indole-3-pyruvic acid pathway. IAA predominantly represents auxins, which is a major phytohormone that regulates cell division, expansion, and differentiation and is a regulator of cotyledon and leaf development [37], which could explain some changes in plant growth parameters such as height and leaf number.
Moreover, the addition of CuCh, CuC, NE + CuC, and WH positively affected the levels of sugars such as glucose, fructose, sucrose, galactose, and mannose. These sugars serve as energy sources and signal transduction factors in stress responses [38,39]. The presence ensures an increased osmotic adjustment response, heightened elimination of reactive oxygen species, and increased maintenance of the cellular energy state [40]. Some authors, mentions that an increase in photosynthetic activity increases sucrose; however, sucrose at high concentrations generates internal osmotic stress which can cause an imbalance in metabolite synthesis, and consequently, a reduction in biomass [41]. On the other hand, during the process of glycolysis, glucose is converted into pyruvic acid [42], which is a crucial component for the initiation of the Krebs cycle, this cycle is a major consumer of pyruvic acid and its supply must be coordinated with the demand of related products, so an imbalance in the synthesis and concentration of metabolites can cause a secondary effect on plant development, which would limit the final accumulation of biomass [43]. The above could be related to the biomass changes described above
On the other hand, the addition of CuCh, WH, and NE + CuC resulted in increased levels of the majority of the amino acids. In general, amino acid metabolism plays a significant role in plants’ energy metabolism. The energy status of plants is a fundamental factor affecting various physiological processes, including development and nutrient synthesis [44]. For example, the oxidation of tyrosine produces 34 adenosine triphosphate (ATP) molecules, and glutamine can be converted into γ-aminobutyric acid and subsequently transformed into succinic acid, which plays a role in the tricarboxylic acid (TCA) cycle [38]. Proline, on the other hand, plays an important role in redox buffering, energy transfer, and resistance against pathogens in plants [38,45].
Amino acids—including tyrosine, lysine, phenylalanine, and tryptophan—are biosynthetic precursors for alkaloids associated with plants’ defence mechanisms [46]. In light of this information and our findings, one can assume that higher concentrations of amino acids, such as phenylalanine, stimulate the synthesis of compounds derived from phenylpropanoids, such as flavonoids. These compounds play a crucial role in promoting robust crop development, particularly in challenging environmental conditions. Some authors suggested that stress conditions can enhance the accumulation of metabolites such as sugars and amino acids [47]. In this sense, NFs act as elicitors or stress-inducing agents that trigger diverse metabolic responses in plants [35]. That situation in turn leads to the accumulation or depletion of both general and specialised metabolites [20].
We also observed a significant increase in the concentration of nucleosides such as adenosine, guanine, uridine, and cytidine, as well as compounds like NAD+ and trigonelline, with the addition of CuCh. Nucleosides are essential components of nucleic acids, and they act as precursors of primary and specialised metabolites [20]. They also serve as integral components of enzyme cofactors and second messengers [48]. However, the accumulation of nucleosides generally exerts a negative impact on plants, as observed in the case of cytidine [49]. For example, NAD+ actively participates in catabolic processes, facilitating the generation of cellular energy, and it plays an important role in signalling pathways [50]. Trigonelline, on the other hand, acts as an osmolyte-enabling plant adaptation to environmental stressors [51]. Chitosan has a diverse chemical structure with variable compositions and molecular weight distributions, which contributes to its propensity to react easily with other active compounds [52,53]. The aforementioned characteristics may explain the observed increase in these variables that resulted the combination of Cu NPs and chitosan.
Nanofertilizers, in combination with biofertilizers, offer numerous advantages and open new perspectives for sustainable agriculture [54]. The application of metal nanoparticles together with biofertilizers can lead to the binding of plant proteins and metal nanoparticles. The proteins can act as encapsulating agents and form a layer on the surface of the metal nanoparticles. This protective layer prevents agglomeration, protects the nanoparticles from agglomeration and stabilizes the medium, which generates new actions and conditions in plants [55,56]. These effects can be favorable or unfavorable, or both. The above could explain the results found in our study as the combination of CuC and NE resulted in the highest concentration of metabolites in leaves, revealing a synergistic interaction. In contrast, an antagonistic effect was observed when CuCh was combined with WH.
The use of Cu at optimal concentrations as a NF promotes the growth and metabolism of plant such as onions, tomatoes, and alfalfa. This situation in turn leads to the induction of an antioxidant system and enhanced stress tolerance [57,58]. Furthermore, the accumulation of metabolites such as amino acids, organic acids, and sugars is contingent upon factors such as the developmental process, stage, leaf position on the stem, and harvest timing [41]. In addition, the increased levels of metabolites such as tryptophan, pyruvic acid, and sucrose promote seed formation and embryo growth through cell division, driven by metabolic interactions involved in the synthesis of plant hormones like auxins (indole-3-acetic acid via the indole-3-pyruvic acid pathway) and cytokinins, such as zeatin, which is synthesized from nucleosides [37,59]. In legume seeds, early embryo growth depends on the number of cells in the cotyledons, making the regulation of cell division critical during the initial stages of seed development [60]. This analysis enhances our understanding of the metabolic profile of black bean leaves and provides a valuable reference for improving regulation and producing higher-quality grains.
4. Materials and Methods
4.1. Experiment Development
We analysed “Michigan” variety black bean seeds. The crop was grown in the municipality of Tetepango, Hidalgo, Mexico (20°05’38.8” N, 99°09’57.4” W). The climate in Tetepango is dry, and the summer is rainy; the mean annual temperature and precipitation are 24 °C and 250 mm, respectively. The black beans were sown under rainfed conditions by directly planting them in the soil at the beginning of September 2022. The soil in Tetepango has a clay texture, an organic matter content of 3.29%, a neutral pH (7.2), an EC of 1.281 dS m−1, CEC of 38.02, and a high content of N-NO3− (45.20 mg Kg−1), K+ (840.00 mg Kg−1), Ca++ (5900.00 mg Kg−1), Mg+ (730.00 mg Kg−1), and B (1.30 mg Kg−1). It has a low content of Na+ (97.00 mg Kg−1) and micro elements such as Fe++, Zn++, Mn++, and Cu++; it has 16.01 mg Kg−1 of usable P.
We evaluated the NFs and BFs separately, as well as in combination, analyzing a total of nine distinct treatments: copper nanoparticles synthesized with cotton (CuC), copper nanoparticles synthesized with chitosan (CuCh), nopal extract (NE), commercial Biojal® worm humus (WH), and their respective combinations: NE + CuC, NuCh, WH + CuC, and WH + CuCh, along with an absolute control (C). The treatment concentrations were 50 mg L−¹ for CuC, CuCh, and NE, and 100 mL L−¹ for WH (Table S1).
The size of the Cu NPs, estimated using the X-ray powder diffraction technique (XRD), varied from 15 to 35 nm [61].
The NE contained N (600–670 mg L−1), P (154–170 mg L−1), Ca (1830–1950 mg L−1), Mg (700–800 mg L−1), Fe (5–10 mg L−1), Zn (>1 mg L−1), Cu (>1 mg L−1), Na (600 mg L−1), organic matter (250–302 mg L−1), humic acids (600 mg L−1), and total chlorophyll (4.7 mg L−1).
The WH contained NO3 (531.42 mg L−1), NH4 (212 mg L−1), phosphates (458.20 mg L−1), sulphates (1200.00 mg L−1), Ca (560.00 mg L−1), S (400.00 mg L−1), Cl− (1701.60 mg L−1), Fe (53.00 mg L−1), Zn (1.00 mg L−1), Mg (100.00 mg L−1), Mn (1.00 mg L−1), B (12.00 mg L−1), and 0.54% organic matter.
Forty days after sowing (das), when the plants had two pairs of true leaves, the leaf application was carried out using a manual sprayer. We added 1% glacial acetic acid as a solubiliser to the NPs synthesised using chitosan. A total of two applications were carried separated by 15 days (i.e., 40 and 55 das).
The experimental design was a randomized complete block. Each block consisted of four 10 m furrows separated by 80 cm. There were three blocks in total. To evaluate the agronomic variables, 12 replicates per treatment were considered. Each replicate consisted of a single plant.
4.2. Agronomic Variables
Plant height (PH, cm) was determined using a flexometer, and stem diameter (SD, mm) was determined using a digital vernier caliper; the number of leaves per plant (NL) was determined by counting. To obtain the fresh weight (FW, g), the stem, leaves, and roots of each plant were weighed using a digital scale (Truper 102316 BASE-05B, Jilotepec, Mexico City, Mexico); the dry weight (DW, g) was obtained by drying the samples at room temperature.
4.3. NMR Analysis
For metabolomic analysis, 10 aqueous extracts per treatment were evaluated. Each extract was obtained from a single replicate. The sampling was carried out at 70 das. We targeted young leaves that were fully expanded. The collected samples were stored at −20 °C for 10 days and then lyophilised for 72 h at a temperature of −40 °C in a lyophiliser FreeZone 6 L-50C Console Freeze Dryer (Labconco, Kansas City, MO, USA); they were subsequently analysed using NMR. According to the methodology described [17], 50 mg of lyophilised tissue was weighed in 2 mL Eppendorf tubes, and 720 µL of deuterated water and 80 µL of potassium phosphate-buffer solution at a concentration of 0.7 mM and pH = 6 (7 mM TSP, 10 mM EDTA, 2 mM NaN3) were added. The resulting mixture was sonicated for 20 min (Branson 5510 Ultrasonic Cleaner, Marshall Scientific, Hampton, NH, USA) and centrifuged at 10,000 rpm (PrismTM Microcentrifuge C2500, Labnet International Inc. Edison, NJ, USA) for 20 min at room temperature. Next, 600 μL of the supernatant was taken and transferred to a 5 mm NMR tube.
4.4. Nuclear Magnetic Resonance Analysis
The samples were analysed on a Bruker AscendTM 750 MHz spectrometer (Bruker Biospin, Rheinstetten, Germany) equipped with a TXI probe. The 1H NMR analyses were measured using the NOESYPR1D pulse sequence at 25 °C + 0.1 °K without rotation. The acquisition parameters were as follows: FID size = 64 K, number of dummy scans = 4, number of scans = 256, spectral width = 15.0 ppm, receiver gain = 32, acquisition time = 2.18 s, relaxation delay = 5.00 s, and FID resolution = 0.45 Hz.
4.5. Signal Assignments in NMR Spectra
Complete interpretation of 1H NMR spectra of the aqueous extract of leaves of black beans was achieved using 1D and 2D analyses such as 13C (Figure S3), COSY (Figure S4), HSQC (Figure S5), and HMBC (Figure S6). The spectral data of the metabolites identified in the leaves of black beans were compared with databases such as the Human Metabolome Data Base version 5.0 [62] and the Biological Magnetic Resonance Data Bank [63].
4.6. Spectral Processing and Quantification of Metabolites
We processed the NMR data according to the procedure [17]. Phase and baseline corrections were performed on the 1H NMR spectra using Mestrenova software (v.6.1.0 Mestrelab Research SL, Santiago de Compostela, Spain). The TSP signal was used to reference the spectra at 0.00 ppm and was normalised using the TSP signal intensity. The spectral intensities were reduced to integrated regions, called cubes, of equal width (0.04 ppm) for all spectral regions (0.50–10.00 ppm). The spectral region corresponding to the residual water signal (4.70–4.90 ppm) was excluded from the analysis. The resulting data matrix was subsequently used for the multivariate analysis [64].
Relative quantitation of metabolites was performed using the following expression [65]:
where Mx = Relative concentration of metabolite; My = Relative concentration of internal standard (TMSPd4); IX = Relative integral value of the 1H NMR signal of metabolite; IY = Relative integral value of the 1H NMR signal of internal standard (TMSPd4); NX = Number of protons belonging to the 1H NMR signal of metabolite; NY = Number of protons belonging to the 1H NMR signal of internal standard (TMSPd4).
4.7. Statistical Analysis
The statistical analysis was conducted using Infostat software (v 2020, Cordoba, Spain). Analysis of variance (ANOVA) was performed, followed by a Duncan test (p ≤ 0.05) for mean comparisons. The multivariate analysis was performed using SIMCA®-P v software. 14.1 (Umetrics, Umeå, Sweden). The data were normalized with a logarithmic function and subsequently scaled using Pareto scaling. Principal component analysis (PCA) was applied to the data set to identify differences or similarities between the treatments and explore intrinsic variations. The data sets were then subjected to orthogonal partial least squares discriminant analysis (OPLS-DA) to identify differential components among the samples and to determine the optimal relationship between independent and dependent variables. Model validation was carried out using permutation testing (200 times); the explained variables and the predictability of the models were verified using R2 and Q2 measures. A heat map was also created using MetaboAnalyst 3.0 software [66] to visualise the relative concentrations of metabolites resulting from each of the different treatments.
5. Conclusions
Nanofertilizers and biofertilizers are promising alternatives to conventional fertilizers given their ability to potentially mitigate the latter’s adverse impacts on agriculture and the environment. Both BFs and NFs are environmentally friendly and less detrimental than chemical fertilizers and pesticides; they are capable of boosting and stimulating optimal crop growth. However, when used in combination, they can exhibit either synergistic or antagonistic effects. For instance, the combination of CuC and NE in our study resulted in the highest concentration of metabolites in the leaves; that finding revealed a synergistic interaction. Conversely, an antagonistic effect was observed when CuCh was combined with WH. The results of this research may contribute to the identification and selection of suitable NFs and BFs and optimal combinations thereof to improve crop development and ensure higher seed yield and quality. However, due to the unique physicochemical properties of nanomaterials, they often have toxic consequences, the size and large surface area of these materials facilitate their dispersion and invasion into the human body, resulting in nanotoxicity, so precautionary measures should be taken before implementing nanoparticles on a large scale for agricultural uses, as these agricultural products will be consumed by humans and animals. Finally, the study of plant metabolites is crucial for understanding plant biology and unlocking their potential for various agronomic applications.
Supplementary Materials
The following supporting information can be downloaded at: https://www.mdpi.com/article/10.3390/ijms26104844/s1.
Author Contributions
Conceptualization, E.B.-M.; methodology, E.R.L.-V., L.G.Z.-V., C.J.H.-G., A.D.H.-F., G.C.-P. and M.P.-Á.; validation, E.R.L.-V. and D.H.-M.; formal analysis, E.R.L.-V., D.H.-M., E.B.-M., C.J.H.-G. and A.D.H.-F.; writing—original draft, E.R.L.-V. and C.J.H.-G.; writing—review and editing, D.H.-M., E.B.-M., L.G.Z.-V., G.C.-P. and M.P.-Á.; supervision, E.B.-M.; project administration, E.B.-M. All authors have read and agreed to the published version of the manuscript.
Funding
This research received financial support from Secretaría de Investigación y Posgrado del Instituto Politécnico Nacional (Proyecto innovación: SIP 20242816 and 20251353).
Institutional Review Board Statement
Not applicable.
Informed Consent Statement
Not applicable.
Data Availability Statement
The original contributions presented in this study are included in the article/Supplementary Materials. Further inquiries can be directed to the corresponding authors.
Acknowledgments
We are grateful to the Secretariat of Science, Humanities, Technology and Innovation (SECIHTI) and the BEIFI-IPN program for the grant awarded for this project.
Conflicts of Interest
The authors declare no conflicts of interest. The funders had no role in the design of the study; in the collection, analyses, or interpretation of data; in the writing of the manuscript; or in the decision to publish the results.
Abbreviations
The following abbreviations are used in this manuscript:
| NFs | nanofertilizers |
| NPs | nanoparticles |
| BFs | biofertilizers |
| CuC | copper nanoparticles synthesised using cotton |
| CuCh | copper nanoparticles synthesised using chitosan |
| NE n | Nopal extract |
| WH c | commercial Biojal® worm humus |
| NAD+ | nicotinamide adenine dinucleotide |
| Cu | copper |
| CuO | copper oxide |
| NMR | nuclear magnetic resonance |
| PH | plant height |
| SD | stem diameter |
| NL | number of leaves per plant |
| DW | dry weight |
| FW | fresh weight |
| PCA | principal component analysis |
| OPLS-DA | orthogonal partial least squares discriminant analysis |
| PC1 | first principal component |
| PC2 | second principal component |
| IAA | indole-3-acetic acid |
| ATP | adenosine triphosphate |
| TCA | tricarboxylic acid |
References
- Gangwar, J.; Kadanthottu Sebastian, J.; Puthukulangara Jaison, J.; Kurian, J.T. Nano-Technological Interventions in Crop Production—A Review. Physiol. Mol. Biol. Plants 2023, 29, 93–107. [Google Scholar] [CrossRef]
- Kumar, N.; Samota, S.R.; Venkatesh, K.; Tripathi, S.C. Global Trends in Use of Nano-Fertilizers for Crop Production: Advantages and Constraints—A Review. Soil Tillage Res. 2023, 228, 105645. [Google Scholar] [CrossRef]
- Singh, D.; Jain, D.; Rajpurohit, D.; Jat, G.; Kushwaha, H.S.; Singh, A.; Mohanty, S.R.; Al-Sadoon, M.K.; Zaman, W.; Upadhyay, S.K. Bacteria Assisted Green Synthesis of Copper Oxide Nanoparticles and Their Potential Applications as Antimicrobial Agents and Plant Growth Stimulants. Front. Chem. 2023, 11, 1154128. [Google Scholar] [CrossRef]
- Haris, M.; Hussain, T.; Mohamed, H.I.; Khan, A.; Ansari, M.S.; Tauseef, A.; Khan, A.A.; Akhtar, N. Nanotechnology—A New Frontier of Nano-Farming in Agricultural and Food Production and Its Development. Sci. Total Environ. 2023, 857, 159639. [Google Scholar] [CrossRef]
- Bala, M.; Kumar Bansal, S.; Fatima, F. Nanotechnology: A Boon for Agriculture. Mater. Today Proc. 2023, 73, 267–270. [Google Scholar] [CrossRef]
- Hussain, B.; Riaz, L.; Javeed, K.; Umer, M.J.; Abbas, Y.; Ur-Rahman, S.; Khan, S.W.; Ali, H.; Abbas, Q.; Zafar, M.; et al. Use of Nanoparticles and Fertilizers in Alleviating Heavy Metals and Improving Nutrients Uptake in Plants. In Sustainable Plant Nutrition; Hakeem, K.R., Ed.; Academic Press: Cambridge, MA, USA, 2023; pp. 153–178. ISBN 978-0-443-18675-2. [Google Scholar]
- Sahoo, N.G.; Rana, S.; Cho, J.W.; Li, L.; Chan, S.H. Polymer Nanocomposites Based on Functionalized Carbon Nanotubes. Prog. Polym. Sci. 2010, 35, 837–867. [Google Scholar] [CrossRef]
- Sharma, B.; Tiwari, S.; Kumawat, K.C.; Cardinale, M. Nano-Biofertilizers as Bio-Emerging Strategies for Sustainable Agriculture Development: Potentiality and Their Limitations. Sci. Total Environ. 2023, 860, 160476. [Google Scholar] [CrossRef]
- Babu, S.; Singh, R.; Yadav, D.; Rathore, S.S.; Raj, R.; Avasthe, R.; Yadav, S.K.; Das, A.; Yadav, V.; Yadav, B.; et al. Nanofertilizers for Agricultural and Environmental Sustainability. Chemosphere 2022, 292, 133451. [Google Scholar] [CrossRef]
- Saquee, F.S.; Diakite, S.; Kavhiza, N.J.; Pakina, E.; Zargar, M. The Efficacy of Micronutrient Fertilizers on the Yield Formulation and Quality of Wheat Grains. Agronomy 2023, 13, 566. [Google Scholar] [CrossRef]
- Faraz, A.; Faizan, M.; Hayat, S.; Alam, P. Foliar Application of Copper Oxide Nanoparticles Increases the Photosynthetic Efficiency and Antioxidant Activity in Brassica Juncea. J. Food Qual. 2022, 2022, 5535100. [Google Scholar] [CrossRef]
- Ranaweera, S.; Silva, S.S.H.; Manatunga, D.C. Cobalt and Copper Deficiency and Molybdenosis. In Medical Geology: En route to One Health; Wiley Online Library: Hoboken, NJ, USA, 2023; pp. 235–252. ISBN 9781119867371. [Google Scholar]
- Nekoukhou, M.; Fallah, S.; Pokhrel, L.R.; Abbasi-Surki, A.; Rostamnejadi, A. Foliar Enrichment of Copper Oxide Nanoparticles Promotes Biomass, Photosynthetic Pigments, and Commercially Valuable Secondary Metabolites and Essential Oils in Dragonhead (Dracocephalum moldavica L.) under Semi-Arid Conditions. Sci. Total Environ. 2023, 863, 160920. [Google Scholar] [CrossRef]
- Daniel, A.I.; Fadaka, A.O.; Gokul, A.; Bakare, O.O.; Aina, O.; Fisher, S.; Burt, A.F.; Mavumengwana, V.; Keyster, M.; Klein, A. Biofertilizer: The Future of Food Security and Food Safety. Microorganisms 2022, 10, 1220. [Google Scholar] [CrossRef]
- Atieno, M.; Herrmann, L.; Nguyen, H.T.; Phan, H.T.; Nguyen, N.K.; Srean, P.; Than, M.M.; Zhiyong, R.; Tittabutr, P.; Shutsrirung, A.; et al. Assessment of Biofertilizer Use for Sustainable Agriculture in the Great Mekong Region. J. Environ. Manag. 2020, 275, 111300. [Google Scholar] [CrossRef]
- Zulfiqar, F.; Navarro, M.; Ashraf, M.; Akram, N.A.; Bosch, S.M. Nanofertilizer Use for Sustainable Agriculture: Advantages and Limitations. Plant Sci. 2019, 289, 110270. [Google Scholar] [CrossRef]
- Guerrero, C.J.H.; Ruano, N.V.; Vallejo, L.G.Z.; Fuentes, A.D.H.; Estrada, K.R.; Lucero, S.Z.; Martínez, D.H.; Martínez, E.B. Bean Cultivars (Phaseolus vulgaris L.) under the Spotlight of NMR Metabolomics. Food Res. Int. 2021, 150, 110805. [Google Scholar] [CrossRef]
- Begum, R.; Sharmin, S.; Mitra, S.; Akhi, K.; Deb, L.; Kamruzzaman, M.; Khan, M.A. Production Risk and Technical Inefficiency of Bean (Phaseolus vulgaris) Cultivation in Bangladesh: Do Socio-Economic Factors Matter? Soc. Sci. Humanit. Open 2023, 7, 100417. [Google Scholar] [CrossRef]
- Stopnisek, N.; Shade, A. Persistent Microbiome Members in the Common Bean Rhizosphere: An Integrated Analysis of Space, Time, and Plant Genotype. ISME J. 2021, 15, 2708–2722. [Google Scholar] [CrossRef]
- Tortella, G.; Rubilar, O.; Pieretti, J.C.; Fincheira, P.; de Melo Santana, B.; Fernández-Baldo, M.A.; Benavides-Mendoza, A.; Seabra, A.B. Nanoparticles as a Promising Strategy to Mitigate Biotic Stress in Agriculture. Antibiotics 2023, 12, 338. [Google Scholar] [CrossRef]
- Aguirre-Becerra, H.; Vazquez-Hernandez, M.C.; Saenz de la O, D.; Alvarado-Mariana, A.; Guevara-Gonzalez, R.G.; Garcia-Trejo, J.F.; Feregrino-Perez, A.A. Role of Stress and Defense in Plant Secondary Metabolites Production. In Bioactive Natural Products for Pharmaceutical Applications; Pal, D., Nayak, A.K., Eds.; Springer International Publishing: Cham, Switzerland, 2021; pp. 151–195. ISBN 978-3-030-54027-2. [Google Scholar]
- Anjum, S.; Komal, A.; Abbasi, B.H.; Hano, C. Nanoparticles as Elicitors of Biologically Active Ingredients in Plants. In Nanotechnology in Plant Growth Promotion and Protection; Wiley Online Library: Hoboken, NJ, USA, 2021; pp. 170–202. [Google Scholar]
- Liu, Z.; Sun, J.; Teng, Z.; Luo, Y.; Yu, L.; Simko, I.; Chen, P. Identification of Marker Compounds for Predicting Browning of Fresh-Cut Lettuce Using Untargeted UHPLC-HRMS Metabolomics. Postharvest Biol. Technol. 2021, 180, 111626. [Google Scholar] [CrossRef]
- Pérez-Trujillo, M.; Athersuch, T.J. Special Issue: Nmr-Based Metabolomics. Molecules 2021, 26, 3283. [Google Scholar] [CrossRef]
- Selegato, D.M.; Pilon, A.C.; Carnevale Neto, F. Plant Metabolomics Using NMR Spectroscopy. In NMR-Based Metabolomics. Methods in Molecular Biology; Springer: New York, NY, USA, 2019; pp. 345–362. ISBN 978-1-4939-9690-2. [Google Scholar]
- Valentino, G.; Graziani, V.; D’Abrosca, B.; Pacifico, S.; Fiorentino, A.; Scognamiglio, M. NMR-Based Plant Metabolomics in Nutraceutical Research: An Overview. Molecules 2020, 25, 1444. [Google Scholar] [CrossRef] [PubMed]
- Alnaddaf, L.M.; Bamsaoud, S.F.; Bahwirth, M. Perspective Chapter: Application of Nanotechnology Solutions in Plants Fertilization and Environmental Remediation. In Urban Horticulture—Sustainable Gardening in Cities; Kuden, P.A., İmrak, A.P.B., Eds.; IntechOpen: Rijeka, Croatia, 2023; ISBN 978-1-83769-486-0. [Google Scholar]
- Wahab, A.; Munir, A.; Saleem, M.H.; AbdulRaheem, M.I.; Aziz, H.; Mfarrej, M.F.B.; Abdi, G. Interactions of Metal-Based Engineered Nanoparticles with Plants: An Overview of the State of Current Knowledge, Research Progress, and Prospects. J. Plant Growth Regul. 2023, 42, 5396–5416. [Google Scholar] [CrossRef]
- Jha, A.; Pathania, D.; Sonu; Damathia, B.; Raizada, P.; Rustagi, S.; Singh, P.; Rani, G.M.; Chaudhary, V. Panorama of Biogenic Nano-Fertilizers: A Road to Sustainable Agriculture. Environ. Res. 2023, 235, 116456. [Google Scholar] [CrossRef] [PubMed]
- Rahman, M.H.; Hasan, M.N.; Nigar, S.; Ma, F.; Aly Saad Aly, M.; Khan, M.Z.H. Synthesis and Characterization of a Mixed Nanofertilizer Influencing the Nutrient Use Efficiency, Productivity, and Nutritive Value of Tomato Fruits. ACS Omega 2021, 6, 27112–27120. [Google Scholar] [CrossRef] [PubMed]
- Nongbet, A.; Mishra, A.K.; Mohanta, Y.K.; Mahanta, S.; Ray, M.K.; Khan, M.; Baek, K.H.; Chakrabartty, I. Nanofertilizers: A Smart and Sustainable Attribute to Modern Agriculture. Plants 2022, 11, 2587. [Google Scholar] [CrossRef]
- Amjad, M.; Ameen, N.; Murtaza, B.; Imran, M. Comparative Physiological and Biochemical Evaluation of Salt and Nickel Tolerance Mechanisms in Two Contrasting Tomato Genotypes. Physiol. Plant. 2019, 168, 27–37. [Google Scholar] [CrossRef]
- Adetunji, C.O.; Kadiri, O.; Islam, S.; Nwankwo, W.; Thangadurai, D.; Anani, O.A.; Makinde, S.; Sangeetha, J.; Adetunji, J.B. Potential Agrifood Applications of Novel and Sustainable Nanomaterials: An Ecofriendly Approach. In Handbook of Nanomaterials and Nanocomposites for Energy and Environmental Applications; Kharissova, O.V., Martínez, L.M.T., Kharisov, B.I., Eds.; Springer International Publishing: Cham, Switzerland, 2020; pp. 1–17. ISBN 978-3-030-11155-7. [Google Scholar]
- Lanzotti, V.; Anzano, A.; Grauso, L.; Zotti, M.; Sacco, A.; Senatore, M.; Moreno, M.; Diano, M.; Parente, M.; Esposito, S.; et al. NMR Metabolomics and Chemometrics of Lettuce, Lactuca sativa L., under Different Foliar Organic Fertilization Treatments. Plants 2022, 11, 2164. [Google Scholar] [CrossRef]
- Abdel-Aziz, H.M.M.; Benavides-Mendoza, A.; Rizwan, M.; Seleiman, M.F. Nanofertilizers and Abiotic Stress Tolerance in Plants. Front. Plant Sci. 2023, 14, 1154113. [Google Scholar] [CrossRef]
- Caicedo Ruiz, J.D.; Diaztagle Fernández, J.J.; Alvarado Sánchez, J.I.; Latorre Alfonso, S.I.; Ocampo Posada, M.; Cruz Martínez, L.E. Intermediarios Del Ciclo de Krebs En Sepsis: Una Revisión Sistemática. Acta Colomb. Cuid. Intensivo 2021, 21, 42–50. [Google Scholar] [CrossRef]
- Zhu, A.; Wang, A.; Zhang, Y.; Dennis, E.S.; Peacock, W.J.; Greaves, I.K. Early Establishment of Photosynthesis and Auxin Biosynthesis Plays a Key Role in Early Biomass Heterosis in Brassica Napus (Canola) Hybrids. Plant Cell Physiol. 2020, 61, 1134–1143. [Google Scholar] [CrossRef]
- Chen, L.; Wu, J.; Li, Z.; Liu, Q.; Zhao, X.; Yang, H. Metabolomic Analysis of Energy Regulated Germination and Sprouting of Organic Mung Bean (Vigna radiata) Using NMR Spectroscopy. Food Chem. 2019, 286, 87–97. [Google Scholar] [CrossRef] [PubMed]
- Yoon, J.; Cho, L.-H.; Tun, W.; Jeon, J.-S.; An, G. Sucrose Signaling in Higher Plants. Plant Sci. 2021, 302, 110703. [Google Scholar] [CrossRef]
- Kaur, H.; Manna, M.; Thakur, T.; Gautam, V.; Salvi, P. Imperative Role of Sugar Signaling and Transport during Drought Stress Responses in Plants. Physiol. Plant. 2021, 171, 833–848. [Google Scholar] [CrossRef] [PubMed]
- Abreu, A.C.; Marín, P.; Aguilera-Sáez, L.M.; Tristán, A.I.; Peña, A.; Oliveira, I.; Simões, M.; Valera, D.; Fernández, I. Effect of a Shading Mesh on the Metabolic, Nutritional, and Defense Profiles of Harvested Greenhouse-Grown Organic Tomato Fruits and Leaves Revealed by NMR Metabolomics. J. Agric. Food Chem. 2019, 67, 12972–12985. [Google Scholar] [CrossRef]
- Cui, J.; Tcherkez, G. Potassium Dependency of Enzymes in Plant Primary Metabolism. Plant Physiol. Biochem. 2021, 166, 522–530. [Google Scholar] [CrossRef]
- Liu, L.; Ji, H.; An, J.; Shi, K.; Ma, J.; Liu, B.; Tang, L.; Cao, W.; Zhu, Y. Response of Biomass Accumulation in Wheat to Low-Temperature Stress at Jointing and Booting Stages. Environ. Exp. Bot. 2019, 157, 46–57. [Google Scholar] [CrossRef]
- Saddhe, A.A.; Manuka, R.; Penna, S. Plant Sugars: Homeostasis and Transport under Abiotic Stress in Plants. Physiol. Plant. 2021, 171, 739–755. [Google Scholar] [CrossRef] [PubMed]
- Ejaz, S.; Fahad, S.; Anjum, M.A.; Nawaz, A.; Naz, S.; Hussain, S.; Ahmad, S. Role of Osmolytes in the Mechanisms of Antioxidant Defense of Plants. In Sustainable Agriculture Reviews 39; Springer International Publishing: Cham, Switzerland, 2020; pp. 95–117. ISBN 978-3-030-38881-2. [Google Scholar]
- Gade, A.; Ingle, P.; Nimbalkar, U.; Rai, M.; Raut, R.; Vedpathak, M.; Jagtap, P.; Abd-Elsalam, K.A. Nanofertilizers: The Next Generation of Agrochemicals for Long-Term Impact on Sustainability in Farming Systems. Agrochemicals 2023, 2, 257–278. [Google Scholar] [CrossRef]
- Zhou, W.; Liang, X.; Li, K.; Dai, P.; Li, J.; Liang, B.; Sun, C.; Lin, X. Metabolomics Analysis Reveals Potential Mechanisms of Phenolic Accumulation in Lettuce (Lactuca sativa L.) Induced by Low Nitrogen Supply. Plant Physiol. Biochem. 2021, 158, 446–453. [Google Scholar] [CrossRef]
- Chen, Z.; Zhao, J.; Song, J.; Han, S.; Du, Y.; Qiao, Y.; Liu, Z.; Qiao, J.; Li, W.; Li, J.; et al. Transcriptome Analysis Reveals That Multiple Metabolic Pathways Operate in Zea Mays Roots Subjected to Graphene. Res. Sq. 2020, 123, 1–33. [Google Scholar] [CrossRef]
- Witte, C.P.; Herde, M. Nucleotide Metabolism in Plants. Plant Physiol. 2020, 182, 63–78. [Google Scholar] [CrossRef]
- Hashida, S.; Kawai-Yamada, M. Inter-Organelle NAD Metabolism Underpinning Light Responsive NADP Dynamics in Plants. Front. Plant Sci. 2019, 10, 960. [Google Scholar] [CrossRef] [PubMed]
- Beygi, Z.; Nezamzadeh, Z.; Rabiei, M.; Mirakhorli, N. Enhanced Accumulation of Trigonelline by Elicitation and Osmotic Stresses in Fenugreek Callus Culture. Plant Cell Tissue Organ Cult. 2021, 147, 169–174. [Google Scholar] [CrossRef]
- Mehta, M.R.; Mahajan, H.P.; Hivrale, A.U. Green Synthesis of Chitosan Capped-Copper Nano Biocomposites: Synthesis, Characterization, and Biological Activity against Plant Pathogens. Bionanoscience 2021, 11, 417–427. [Google Scholar] [CrossRef]
- Yu, J.; Wang, D.; Geetha, N.; Khawar, K.M.; Jogaiah, S.; Mujtaba, M. Current Trends and Challenges in the Synthesis and Applications of Chitosan-Based Nanocomposites for Plants: A Review. Carbohydr. Polym. 2021, 261, 117904. [Google Scholar] [CrossRef]
- Mahapatra, D.M.; Satapathy, K.C.; Panda, B. Biofertilizers and Nanofertilizers for Sustainable Agriculture: Phycoprospects and Challenges. Sci. Total Environ. 2022, 803, 149990. [Google Scholar] [CrossRef] [PubMed]
- Thirugnanasambandan, T. Advances and Trends in Nano-Biofertilizers. Available online: https://ssrn.com/abstract=3306998 (accessed on 20 March 2024).
- Marques, C.; Maroni, P.; Maurizi, L.; Jordan, O.; Borchard, G. Understanding Protein-Nanoparticle Interactions Leading to Protein Corona Formation: In Vitro–in Vivo Correlation Study. Int. J. Biol. Macromol. 2024, 256, 128339. [Google Scholar] [CrossRef]
- Singh, S.P.; Keswani, C.; Minkina, T.; Ortiz, A.; Sansinenea, E. Nano-Inputs: A Next-Generation Solution for Sustainable Crop Production. J. Plant Growth Regul. 2023, 42, 5311–5324. [Google Scholar] [CrossRef]
- Tabatabaee, S.; Iranbakhsh, A.; Shamili, M.; Oraghi Ardebili, Z. Copper Nanoparticles Mediated Physiological Changes and Transcriptional Variations in MicroRNA159 (MiR159) and Mevalonate Kinase (MVK) in Pepper; Potential Benefits and Phytotoxicity Assessment. J. Environ. Chem. Eng. 2021, 9, 106151. [Google Scholar] [CrossRef]
- Yang, Q.; Zhao, D.; Liu, Q. Connections between Amino Acid Metabolisms in Plants: Lysine as an Example. Front. Plant Sci. 2020, 11, 928. [Google Scholar] [CrossRef]
- Matilla, A.J. Desarrollo y Germinación de Las Semillas Fundamentos de Fisiología Vegetal. In Fundamentos de Fisiología Vegetal; McGraw Hill: New York, NY, USA, 2008; pp. 537–558. [Google Scholar]
- Pérez-Alvarez, M.; Cadenas-Pliego, G.; Pérez-Camacho, O.; Comparán-Padilla, V.E.; Cabello-Alvarado, C.J.; Saucedo-Salazar, E. Green Synthesis of Copper Nanoparticles Using Cotton. Polymers 2021, 13, 1906. [Google Scholar] [CrossRef] [PubMed]
- Human Metabolome Data Base. Available online: http://www.hmdb.ca (accessed on 20 March 2024).
- Biological Magnetic Resonance Data Bank. Available online: https://bmrb.io (accessed on 20 March 2024).
- Villa-Ruano, N.; Ramírez-Meraz, M.; Méndez-Aguilar, R.; Zepeda-Vallejo, L.G.; Álvarez-Bravo, A.; Pérez-Hernández, N.; Becerra-Martínez, E. 1 H NMR-Based Metabolomics Profiling of Ten New Races from Capsicum Annuum Cv. Serrano Produced in Mexico. Food Res. Int. 2019, 119, 785–792. [Google Scholar] [CrossRef] [PubMed]
- Bharti, S.K.; Roy, R. Quantitative 1H NMR Spectroscopy. TrAC Trends Anal. Chem. 2012, 35, 5–26. [Google Scholar] [CrossRef]
- MetaboAnalyst. Available online: https://www.metaboanalyst.ca (accessed on 19 March 2024).
Disclaimer/Publisher’s Note: The statements, opinions and data contained in all publications are solely those of the individual author(s) and contributor(s) and not of MDPI and/or the editor(s). MDPI and/or the editor(s) disclaim responsibility for any injury to people or property resulting from any ideas, methods, instructions or products referred to in the content. |
© 2025 by the authors. Licensee MDPI, Basel, Switzerland. This article is an open access article distributed under the terms and conditions of the Creative Commons Attribution (CC BY) license (https://creativecommons.org/licenses/by/4.0/).