

Skin Fibroblasts from Individuals Self-Diagnosed as Electrosensitive Reveal Two Distinct Subsets with Delayed Nucleoshuttling of the ATM Protein in Common
 , ,
, ,  ,
, 
Abstract
1. Introduction
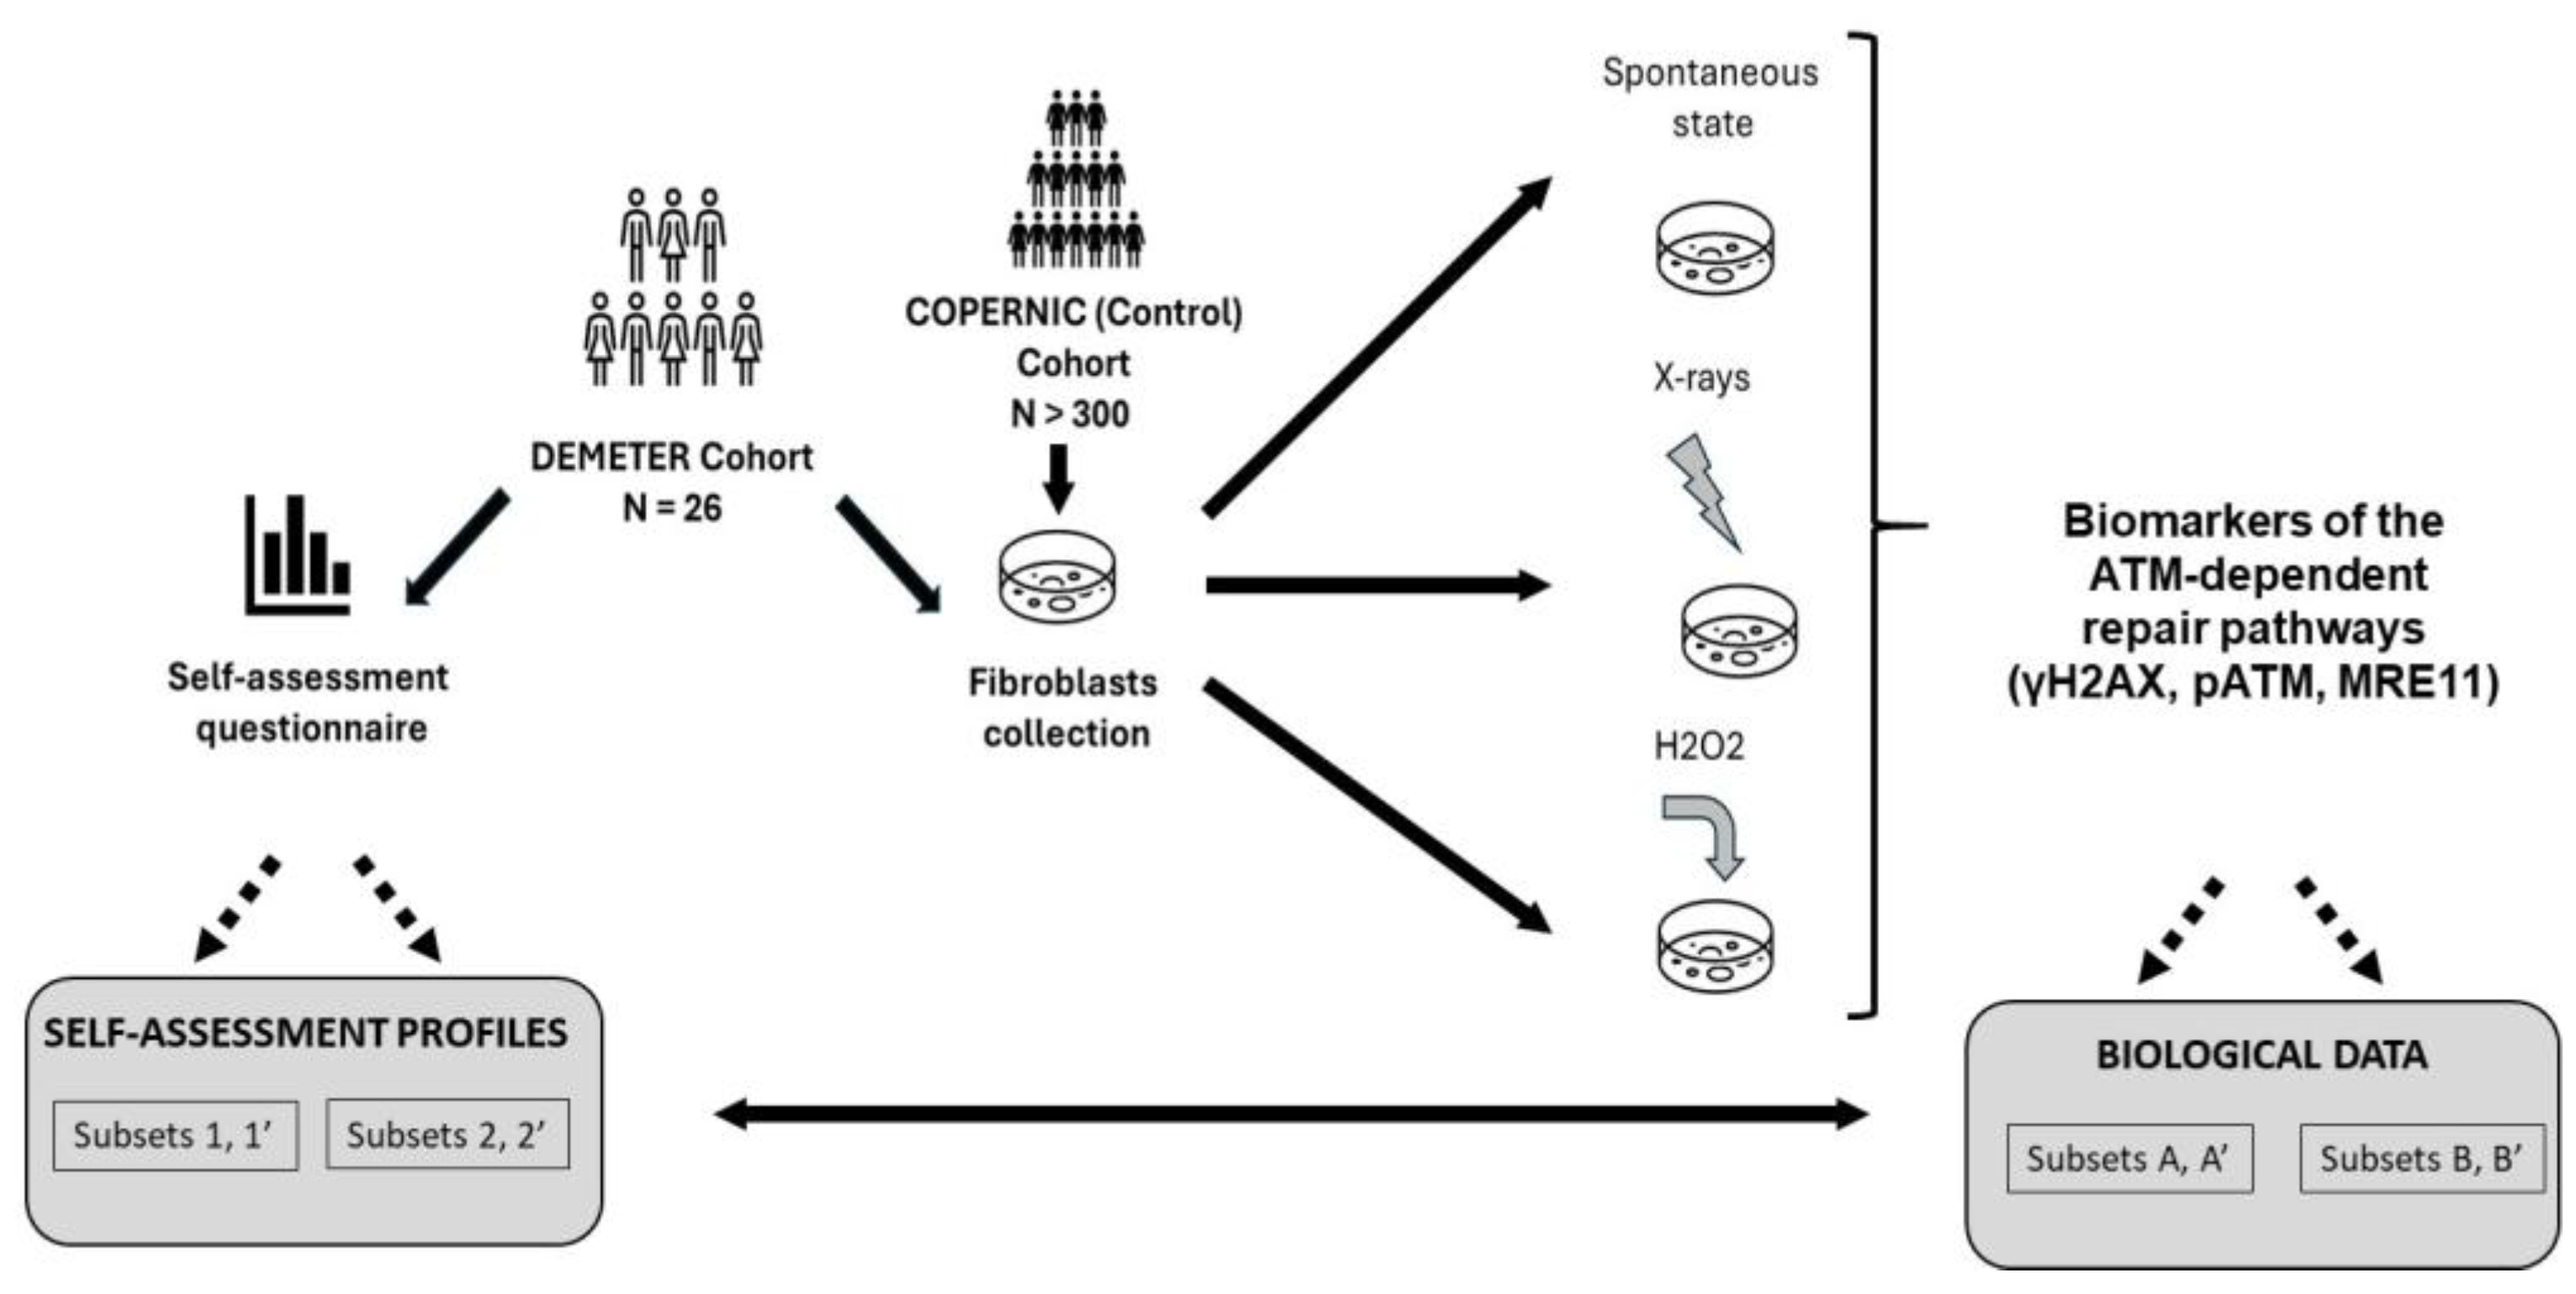
2. Results
- -
- a self-assessment questionnaire composed of five parts: questions about the intensities of symptoms and discomfort (A) after exposure to various and current sources of EMF; (B) after exposure to some non-EMF sources; (C) according to the tissue/organ exposed, before exposure to EMF sources; (D) according to the tissue/organ exposed, during exposure to EMF sources, and a free area (P) for personal information to detail eventual medical history and ongoing treatments. For A to D questions, intensities were scored from 0 (the lowest intensity) to 5 (the highest intensity).
- -
- a measurement of the DNA breaks in DEMETER cells at the spontaneous state and in response to X-rays and H2O2, two documented sources of DNA strand breaks.
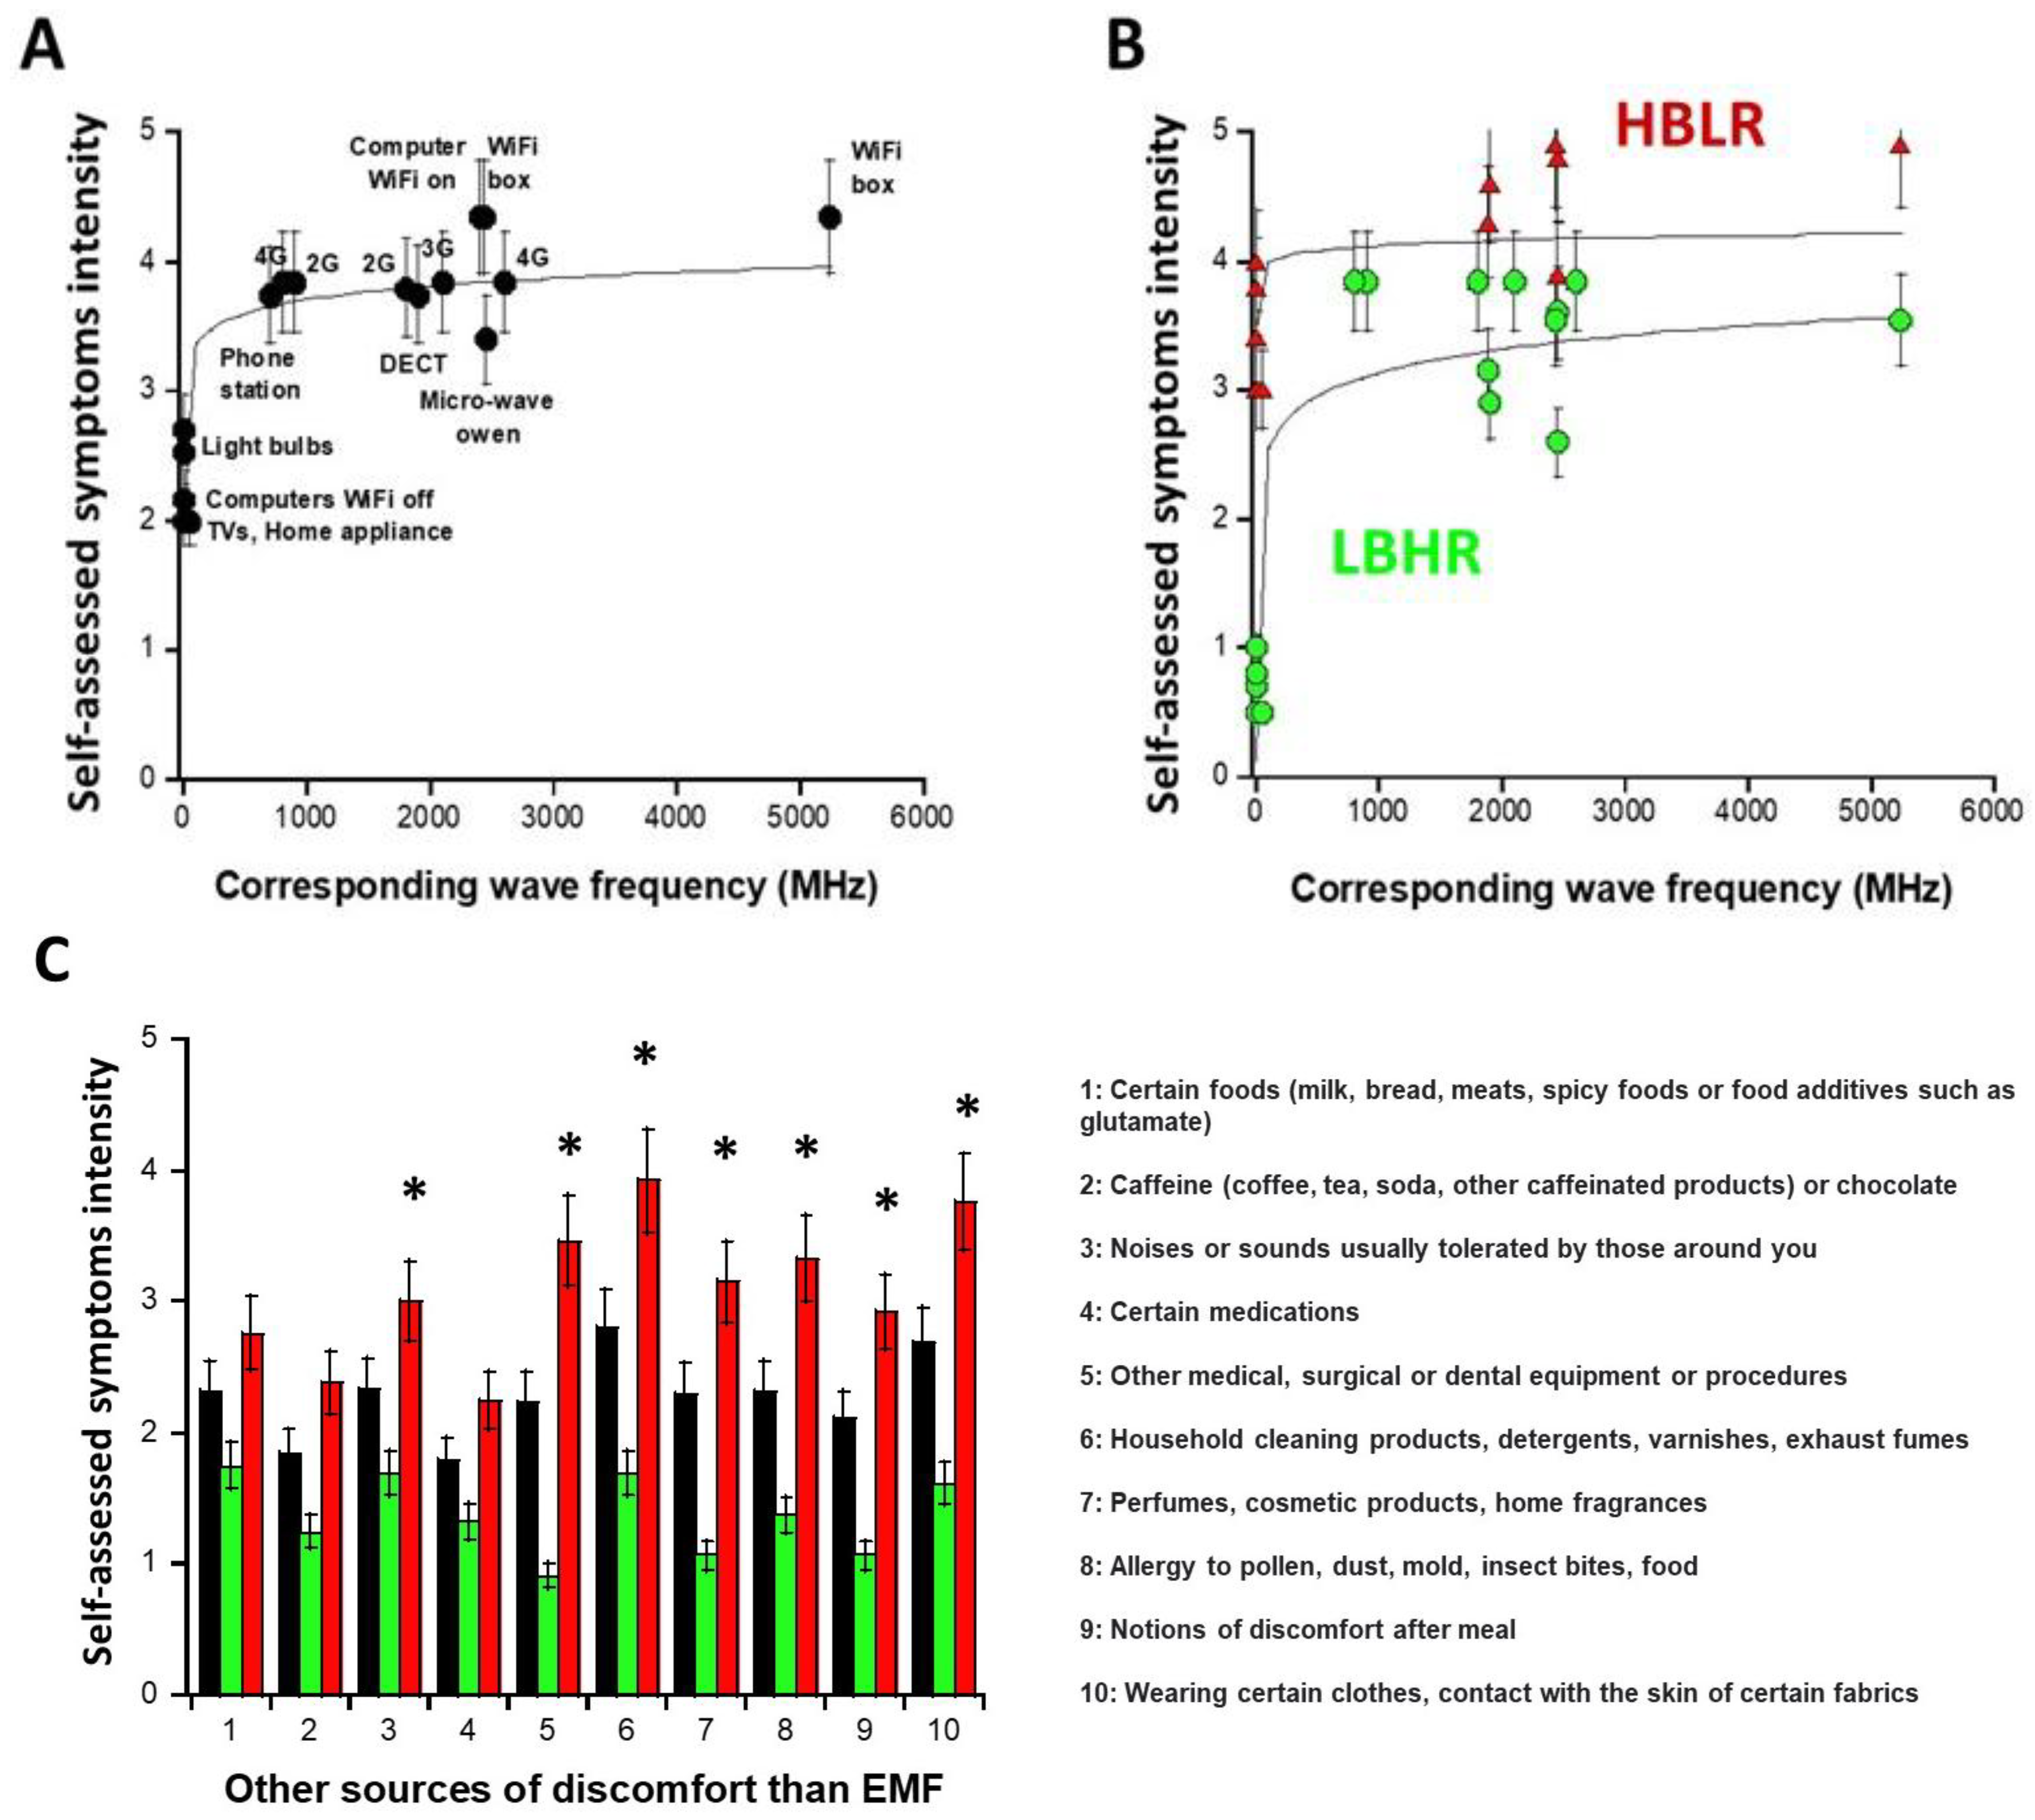
2.1. Analysis of Data from the Self-Assessment Questionnaire
2.1.1. General Features of the DEMETER Cohort
2.1.2. Sources of EMF That May Induce Symptoms: Definition of the Subsets 1 and 2
- -
- the subset 1 of DEMETER donors (N = 14; 53.8%) with relatively low self-assessed intensities of symptoms and discomfort when exposed to EMF lower than UHF (IA5,A6,A7 < 2.48): numerically, IA5,A6,A7 = 0.8 in the [0.7–1] interval. The DEMETER subset 1 donors were also characterized by relatively high self-assessed intensities of symptoms and discomfort when exposed to UHF (2.6 < IUHF < 3.84; Iaverage (UHF) = 3.5; Iaverage (UHF) − IA5,A6,A7 = 2.7) (Figure 2B). The subset 1 gathered therefore the DEMETER donors who elicited a low background (LB) but a relatively high self-assessed responsiveness (HR) to exposure to UHF, defining the “LBHR” phenotype. It was the case of the following DEMETER donors: #4, 5, 7, 8, 9, 11, 15, 16, 18, 20, 22, 23, 24, and 25 (Table S1, Supplementary Data), whose data obeyed the following formula:
- -
- the subset 2 of DEMETER donors (N = 12; 46.1%) with relatively high self-assessed intensities of symptoms and discomfort when exposed to EMF lower than UHF (IA5,A6,A7 > 2.48): numerically, IA5,A6,A7 = 3.8 in the [3.4–4] interval. The DEMETER subset 2 donors were also characterized by relatively low self-assessed intensities of symptoms and discomfort when exposed to UHF (3.37 < IUHF < 4.71; Iaverage (UHF) = 3.95; Iaverage (UHF) − IA5,A6,A7 = 0.15) (Figure 2B). The subset 2 gathered therefore the DEMETER donors who elicited a high background (HB) but a relatively low self-assessed responsiveness (LR) to exposure to UHF defining therefore the “HBLR” phenotype. It was the case of the following DEMETER donors: #1, 2, 3, 6, 10, 12, 13, 14, 17, 19, 21, 26 (Table S1, Supplementary Data), whose data obeyed the following formula:
2.1.3. Nature of the Non-EMF Sources That May Induce Symptoms
2.1.4. Medical History and Ongoing Treatments of the DEMETER Donors
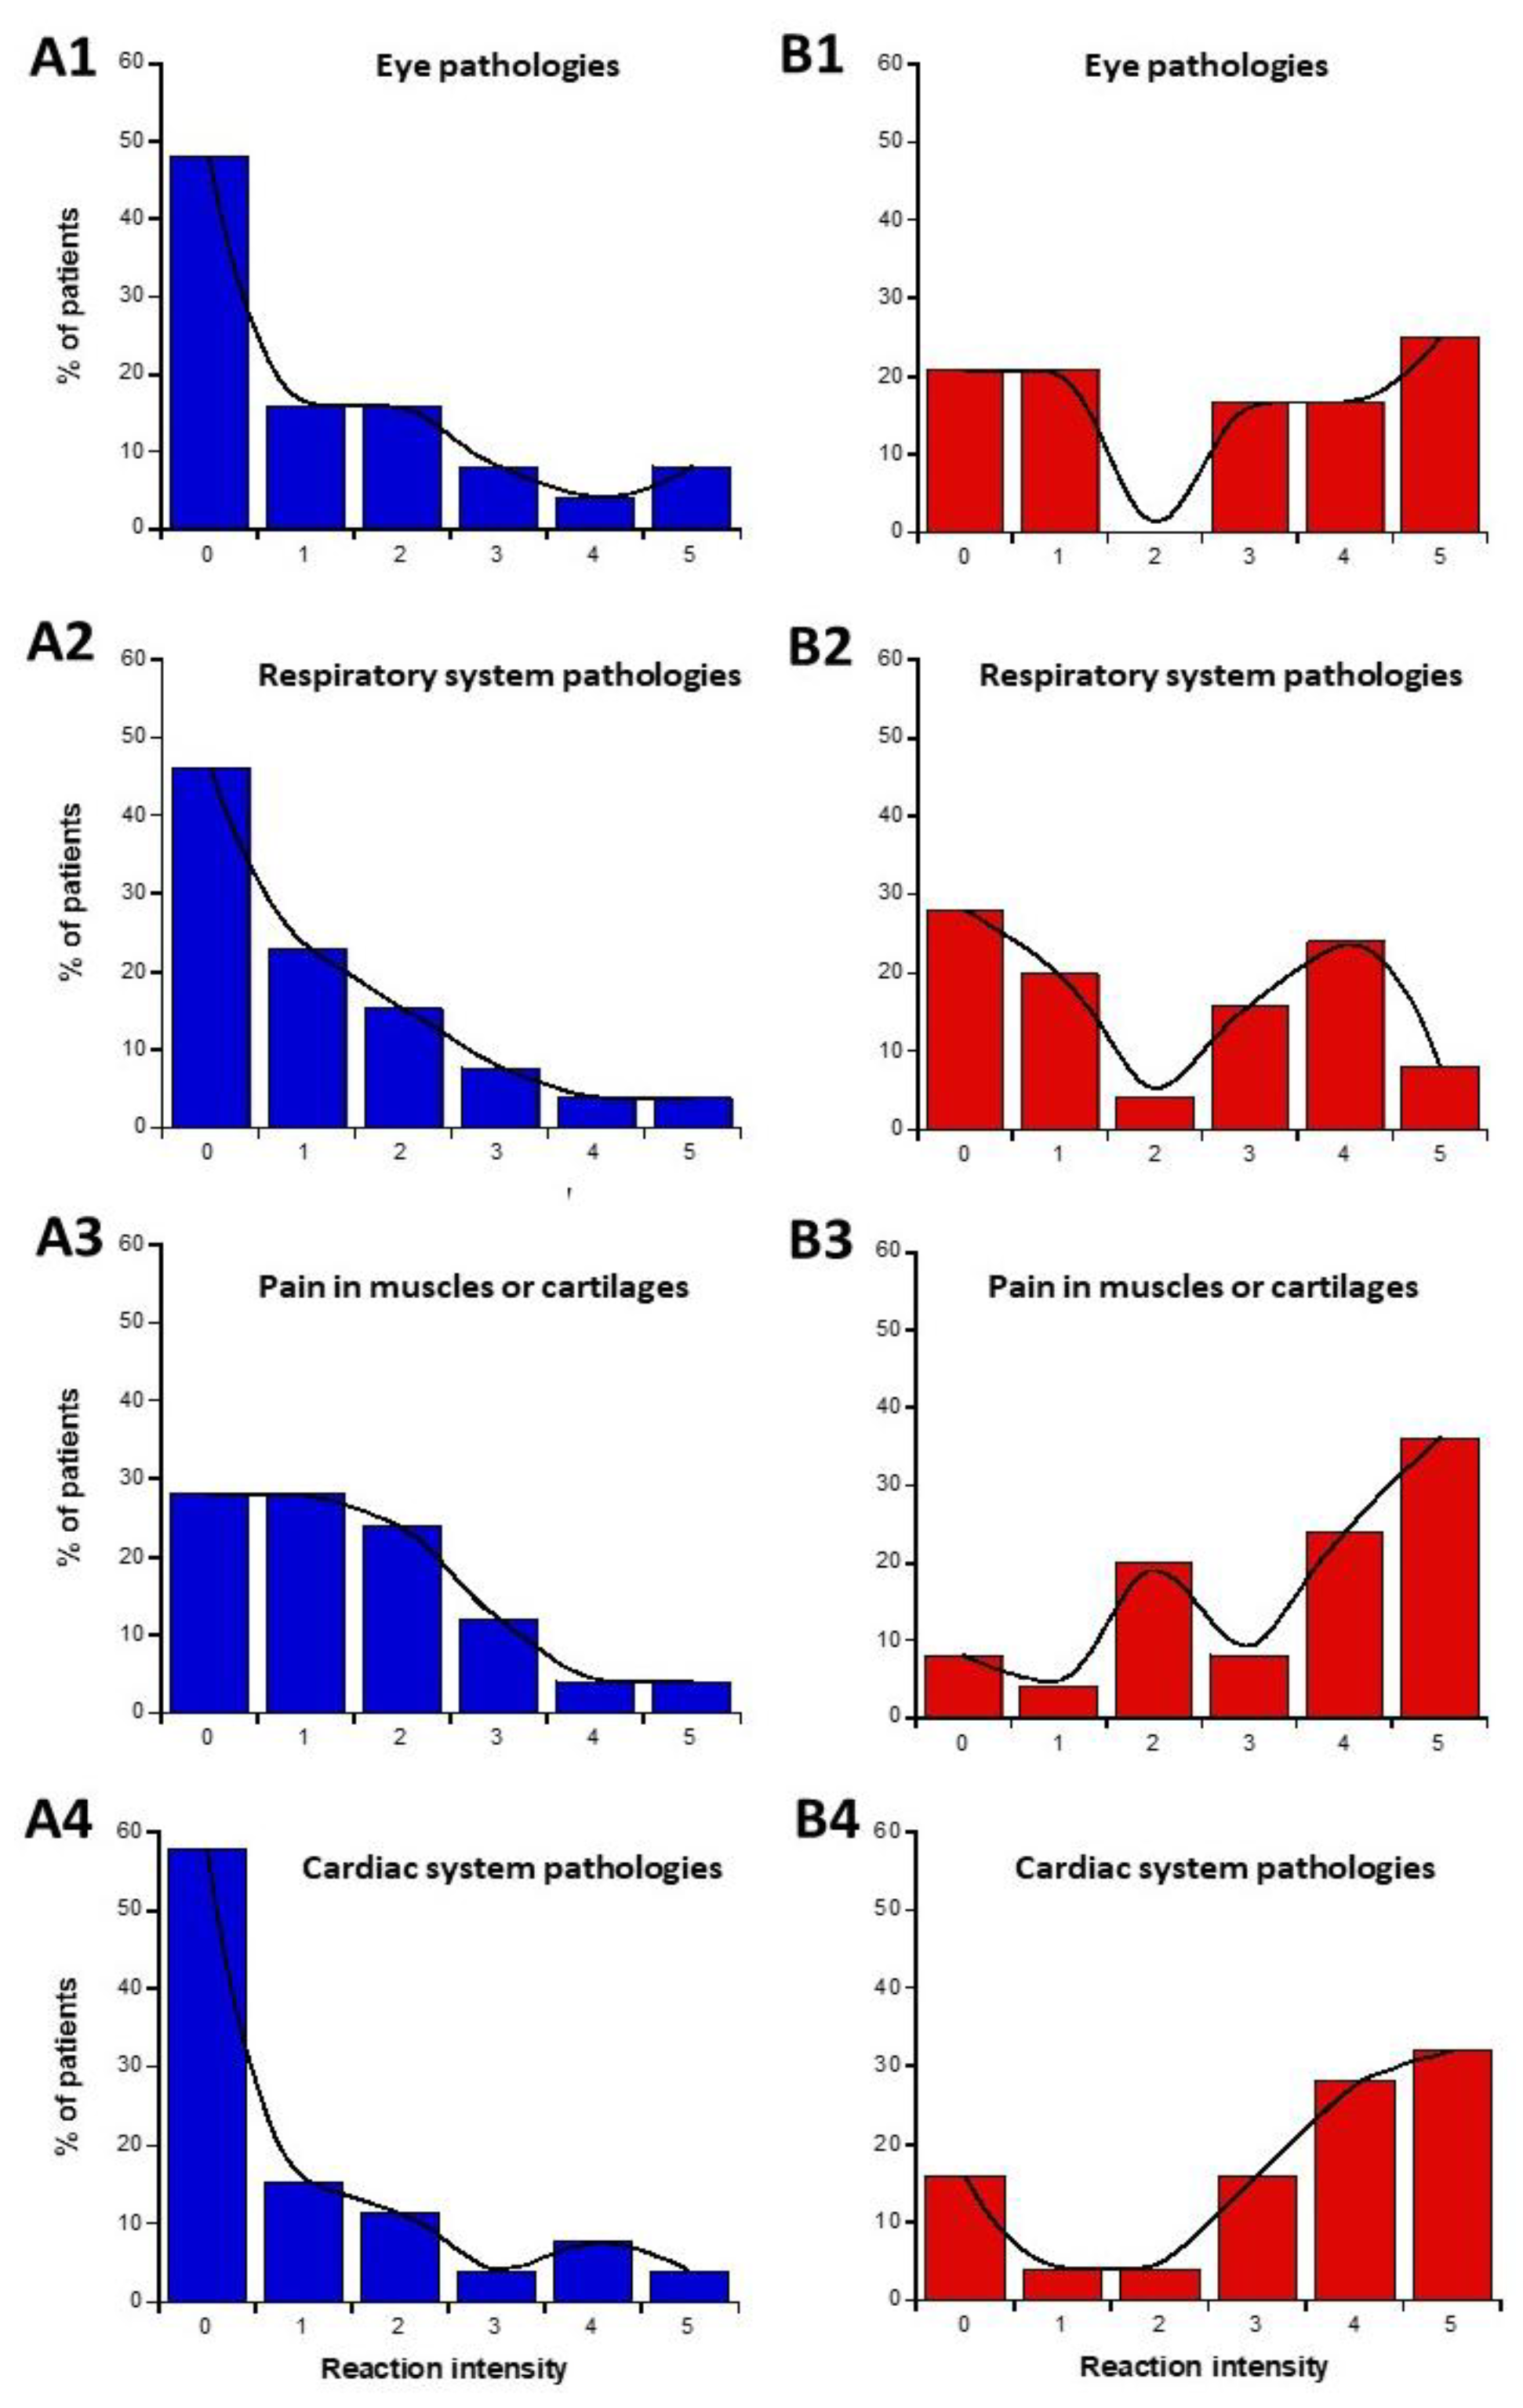
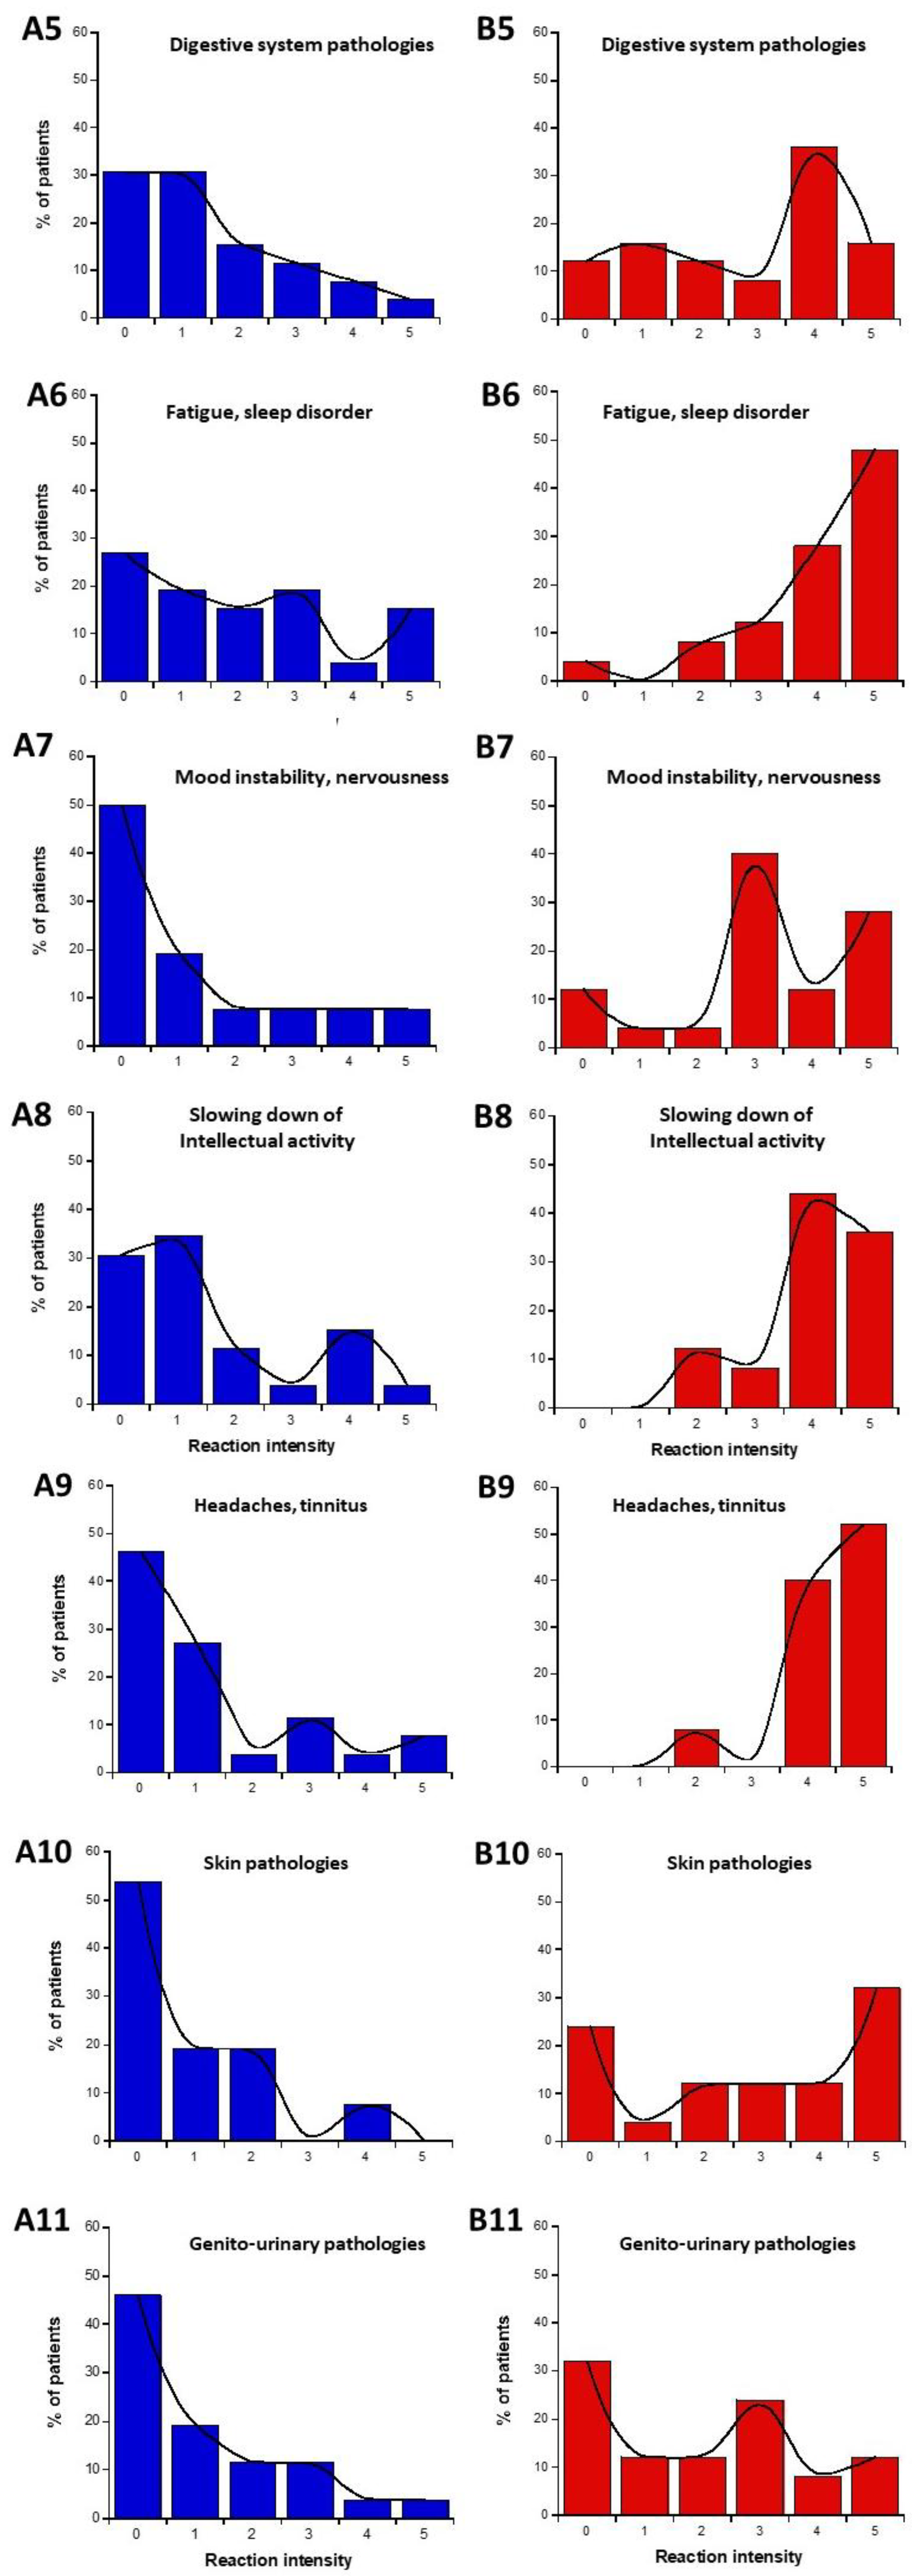
2.1.5. Nature of the Symptoms Before and During the Exposure to EMF: Definition of the Subsets 1′ and 2′
- -
- Calculation of the average of the self-assessed I-intensities of symptoms and discomfort before (part C) or in response to the exposure to EMF sources (part D) for each organ/pathology.
- -
- Estimation of the LBHR/HBLR phenotypes for each patient and organ/pathology by obeying the following conditions: for part C (before exposure to EMF), if the I-intensity was found equal or higher than the average intensity, the phenotype was considered as HB. If the I-intensity was found lower than the average intensity the phenotype was considered LB; for part D (during exposure to EMF), if the I-intensity was found equal to or higher than the average intensity, the phenotype was considered HR. If the I-intensity was found lower than the average intensity, the phenotype was considered LR. From this process, two subsets (namely, 1′ and 2′) were deduced, gathering the LBHR and HBLR phenotypes, respectively (Table 1 and Table 2).
- -
- Calculation of “null-responses ratios (NR): if I-intensities remained the same before (part C) and during the response to exposure to EMF (part D), the response was considered as NR.
- -
2.2. Analysis of Biological Data from Skin Fibroblasts Derived from the DEMETER Donors
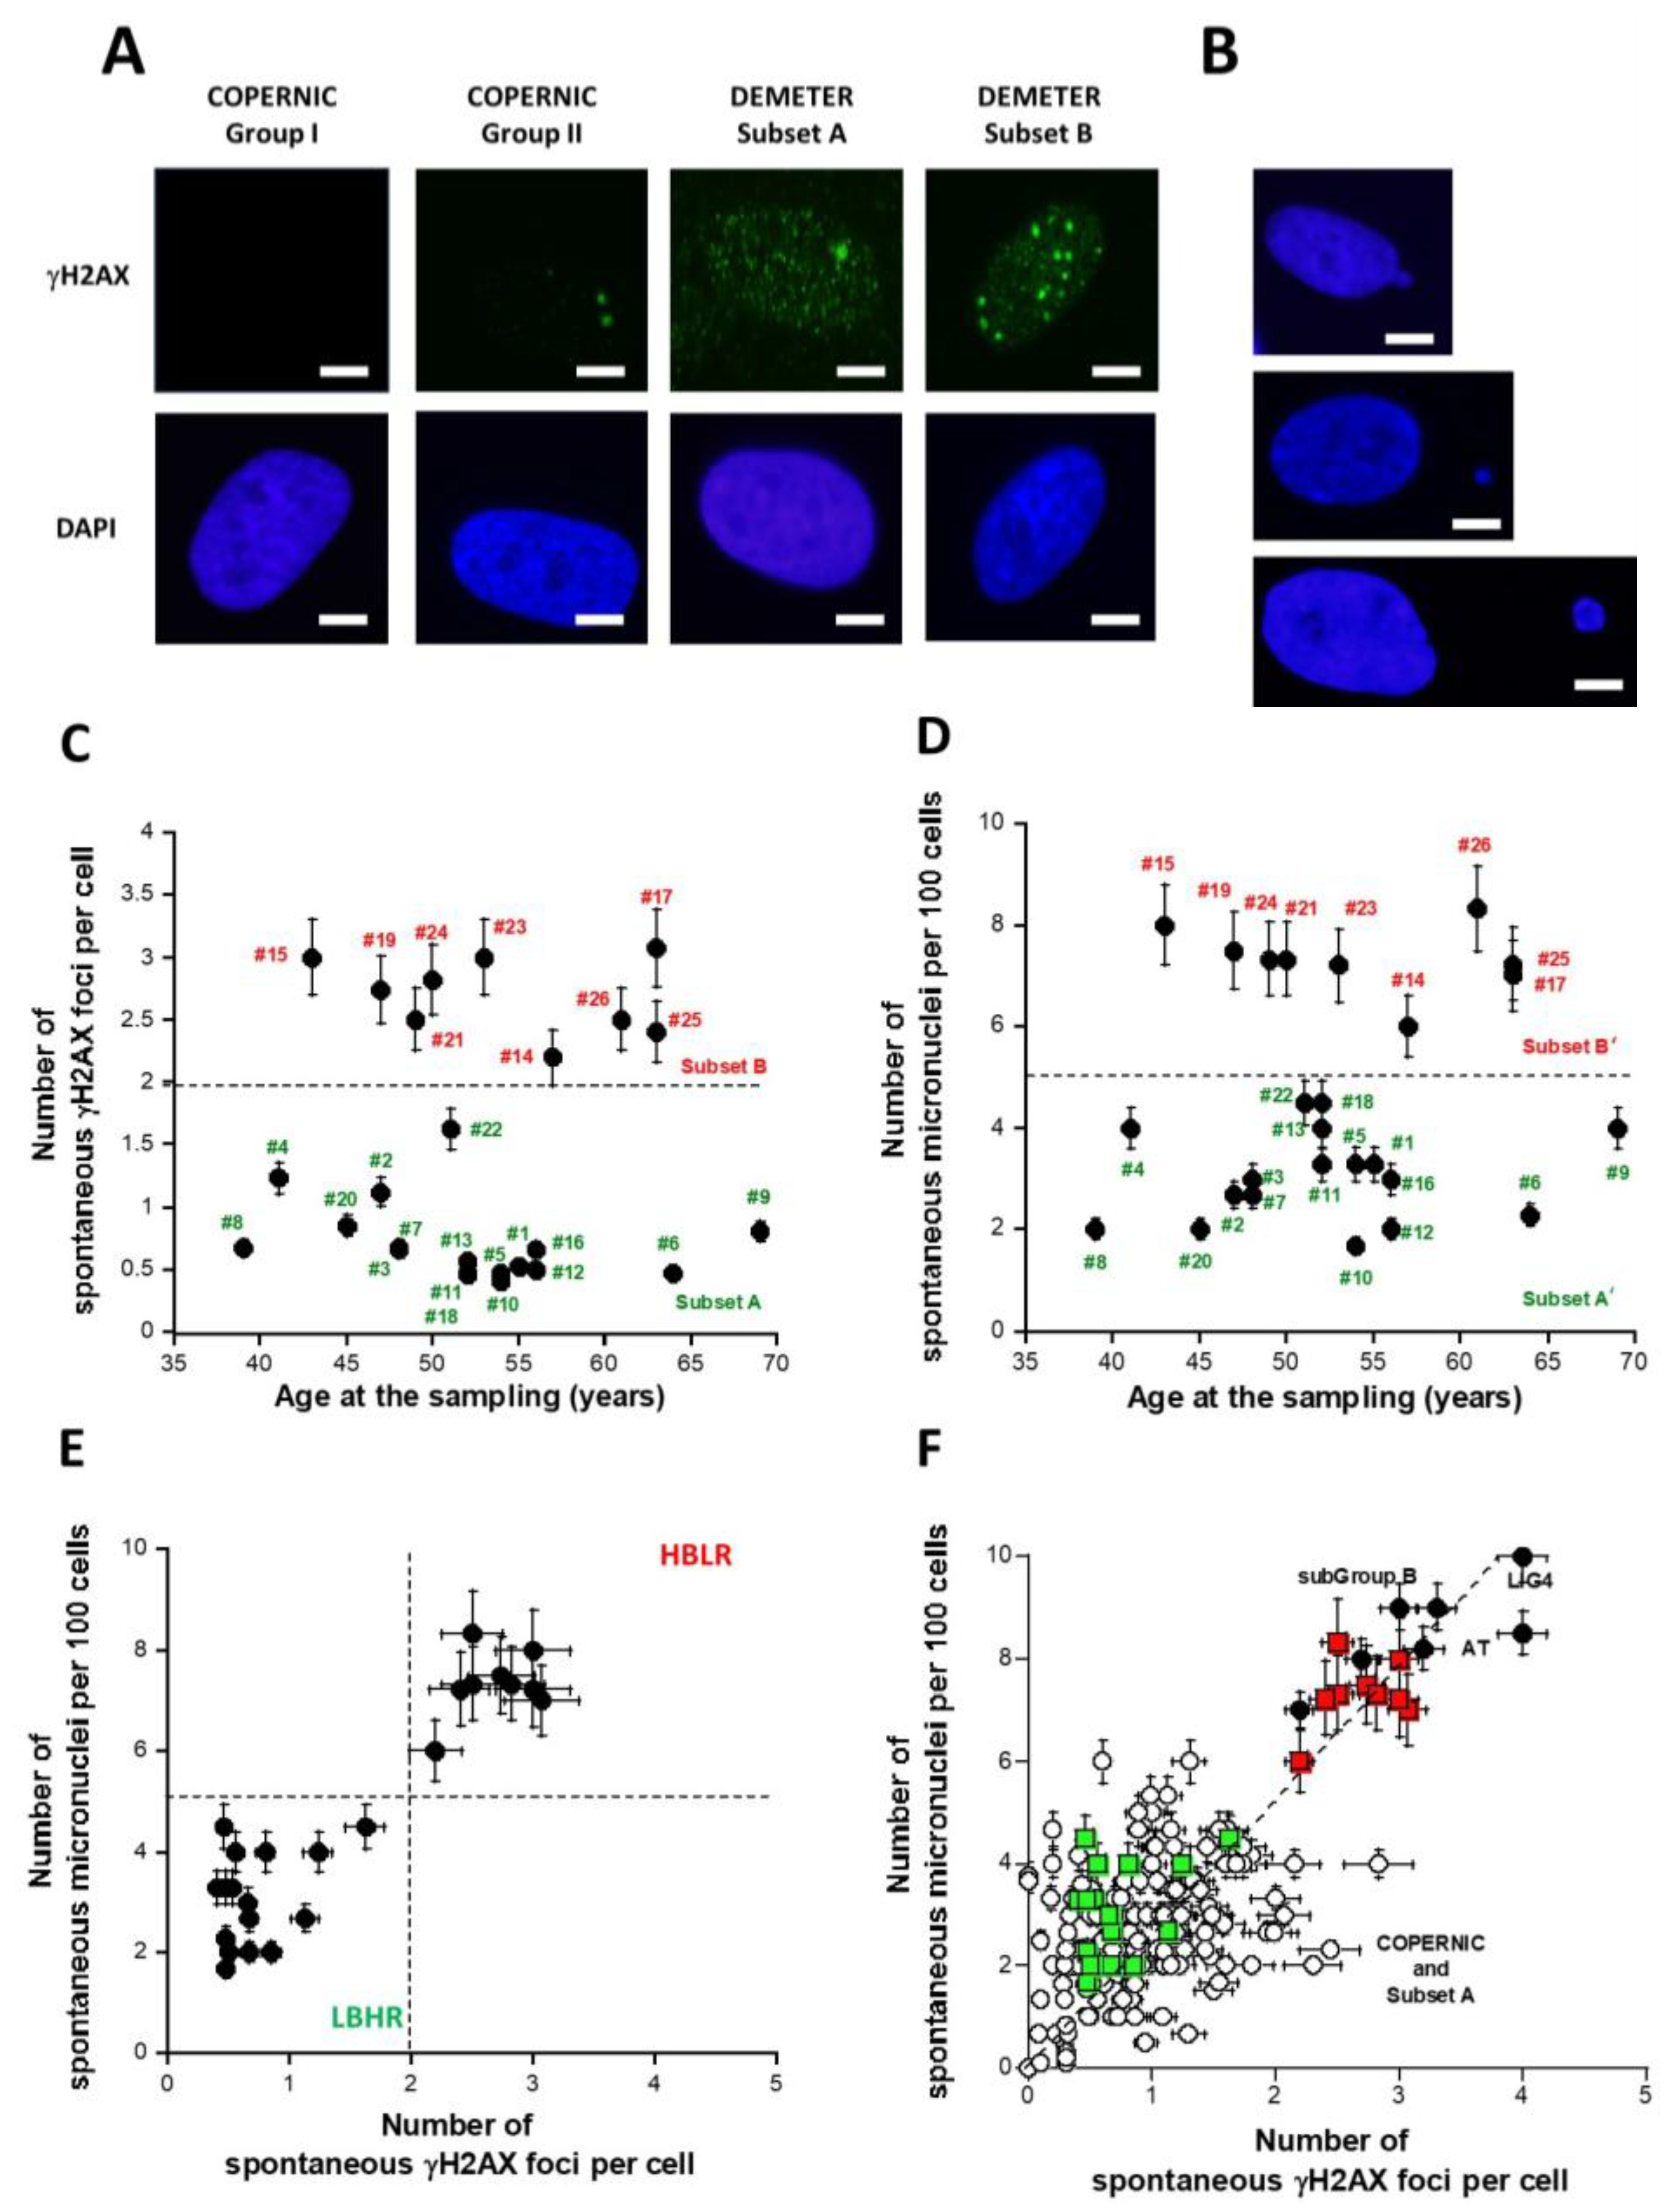
2.2.1. Spontaneous Data from the DEMETER Cohort
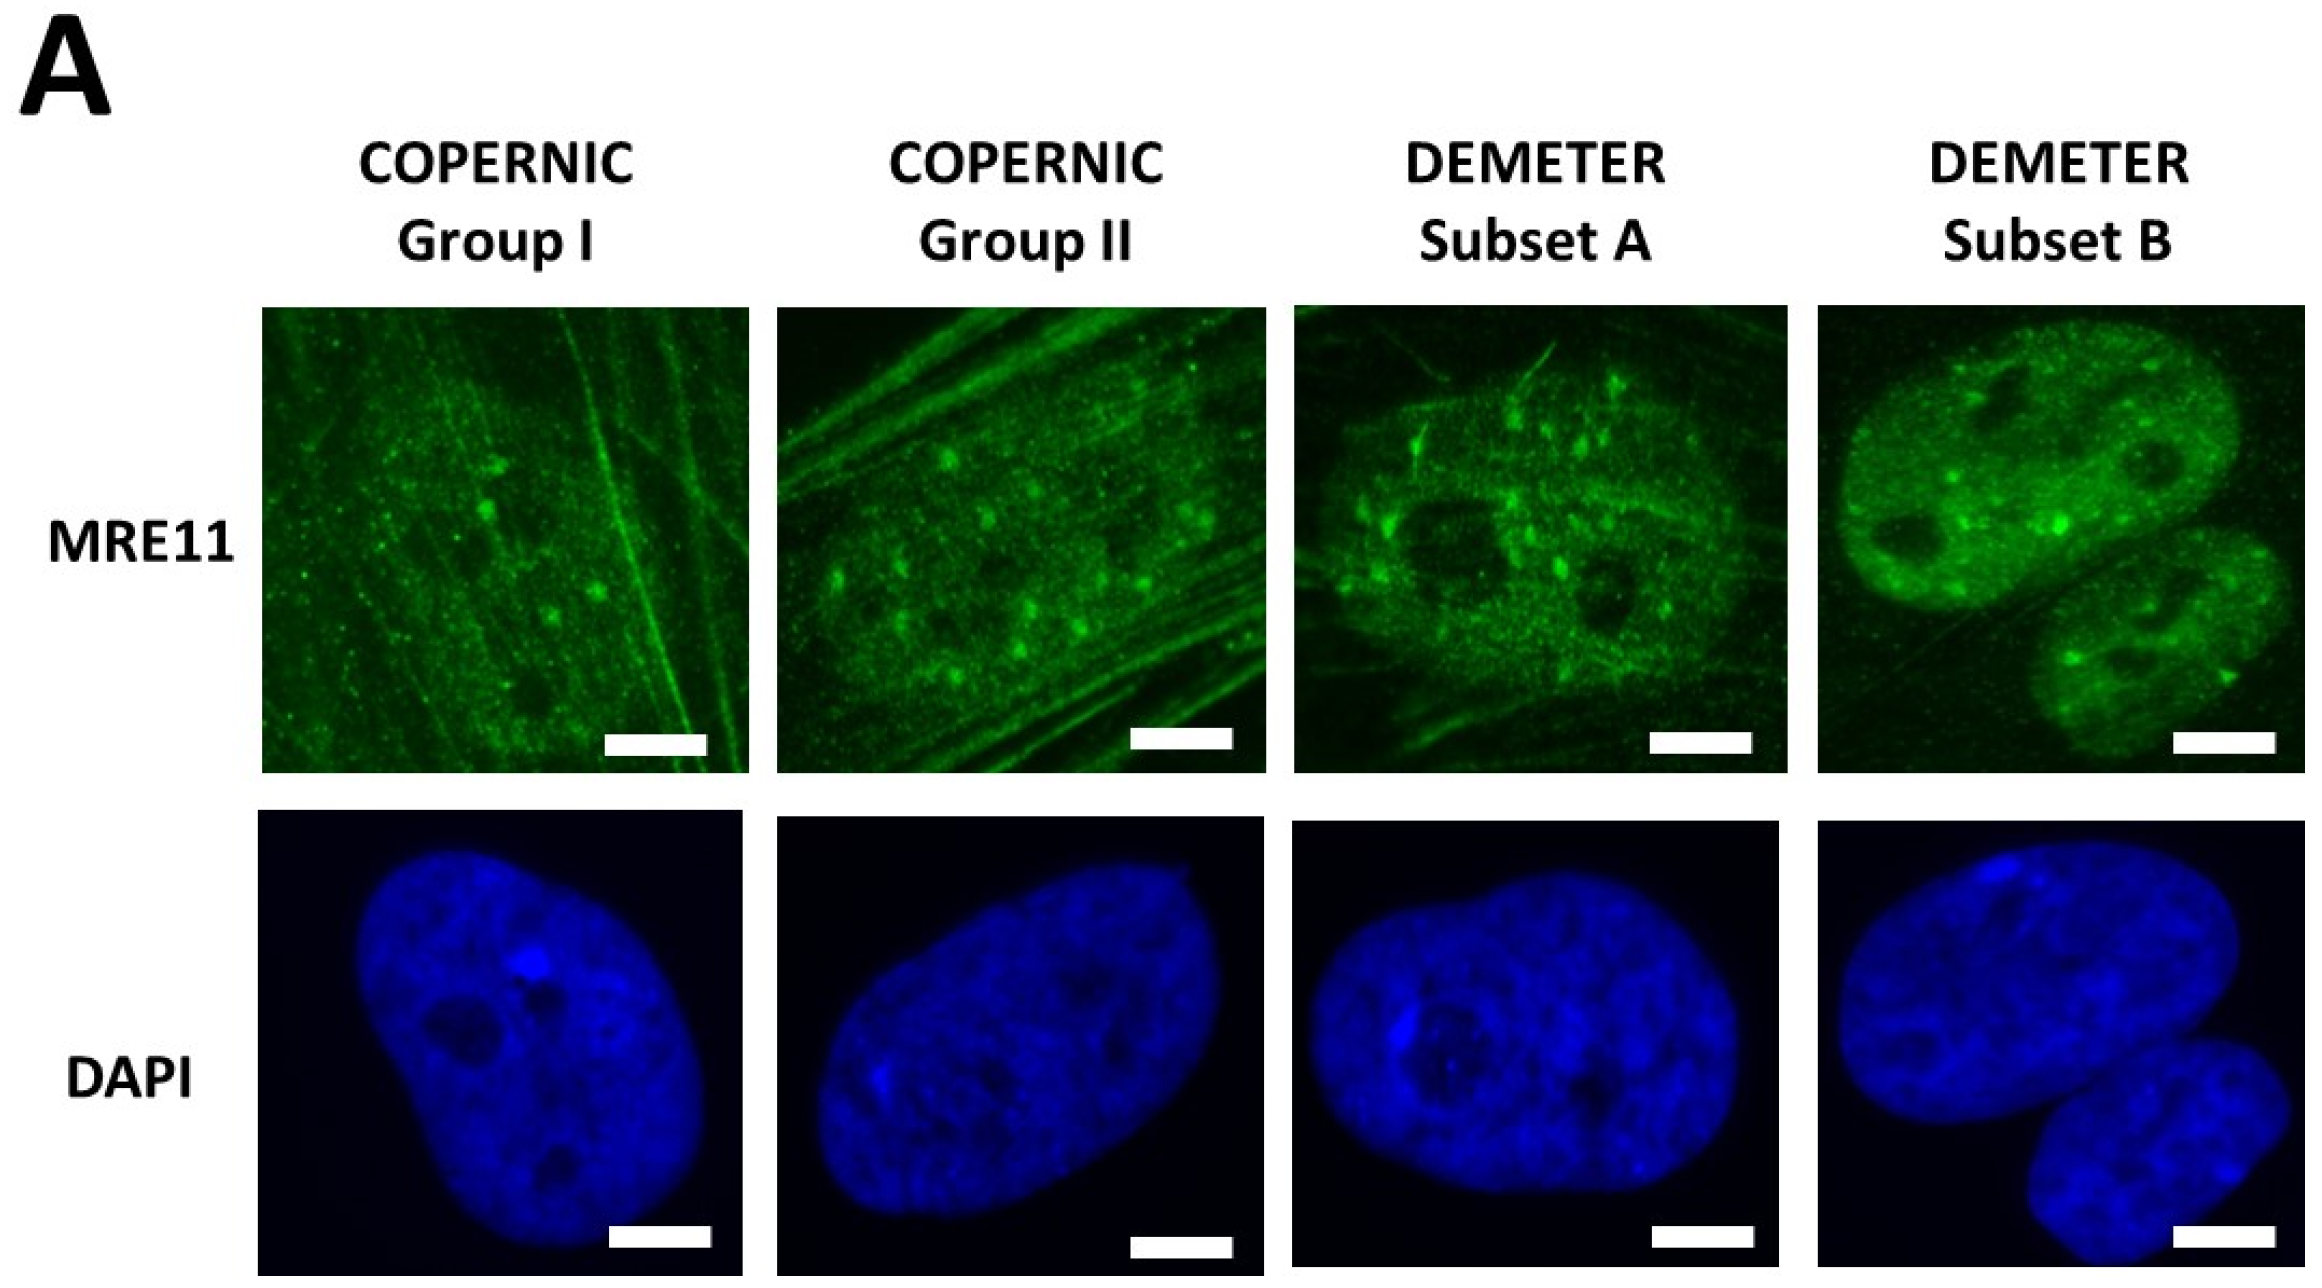
2.2.2. Perinuclear Crowns of the ATM Protein in DEMETER Fibroblasts
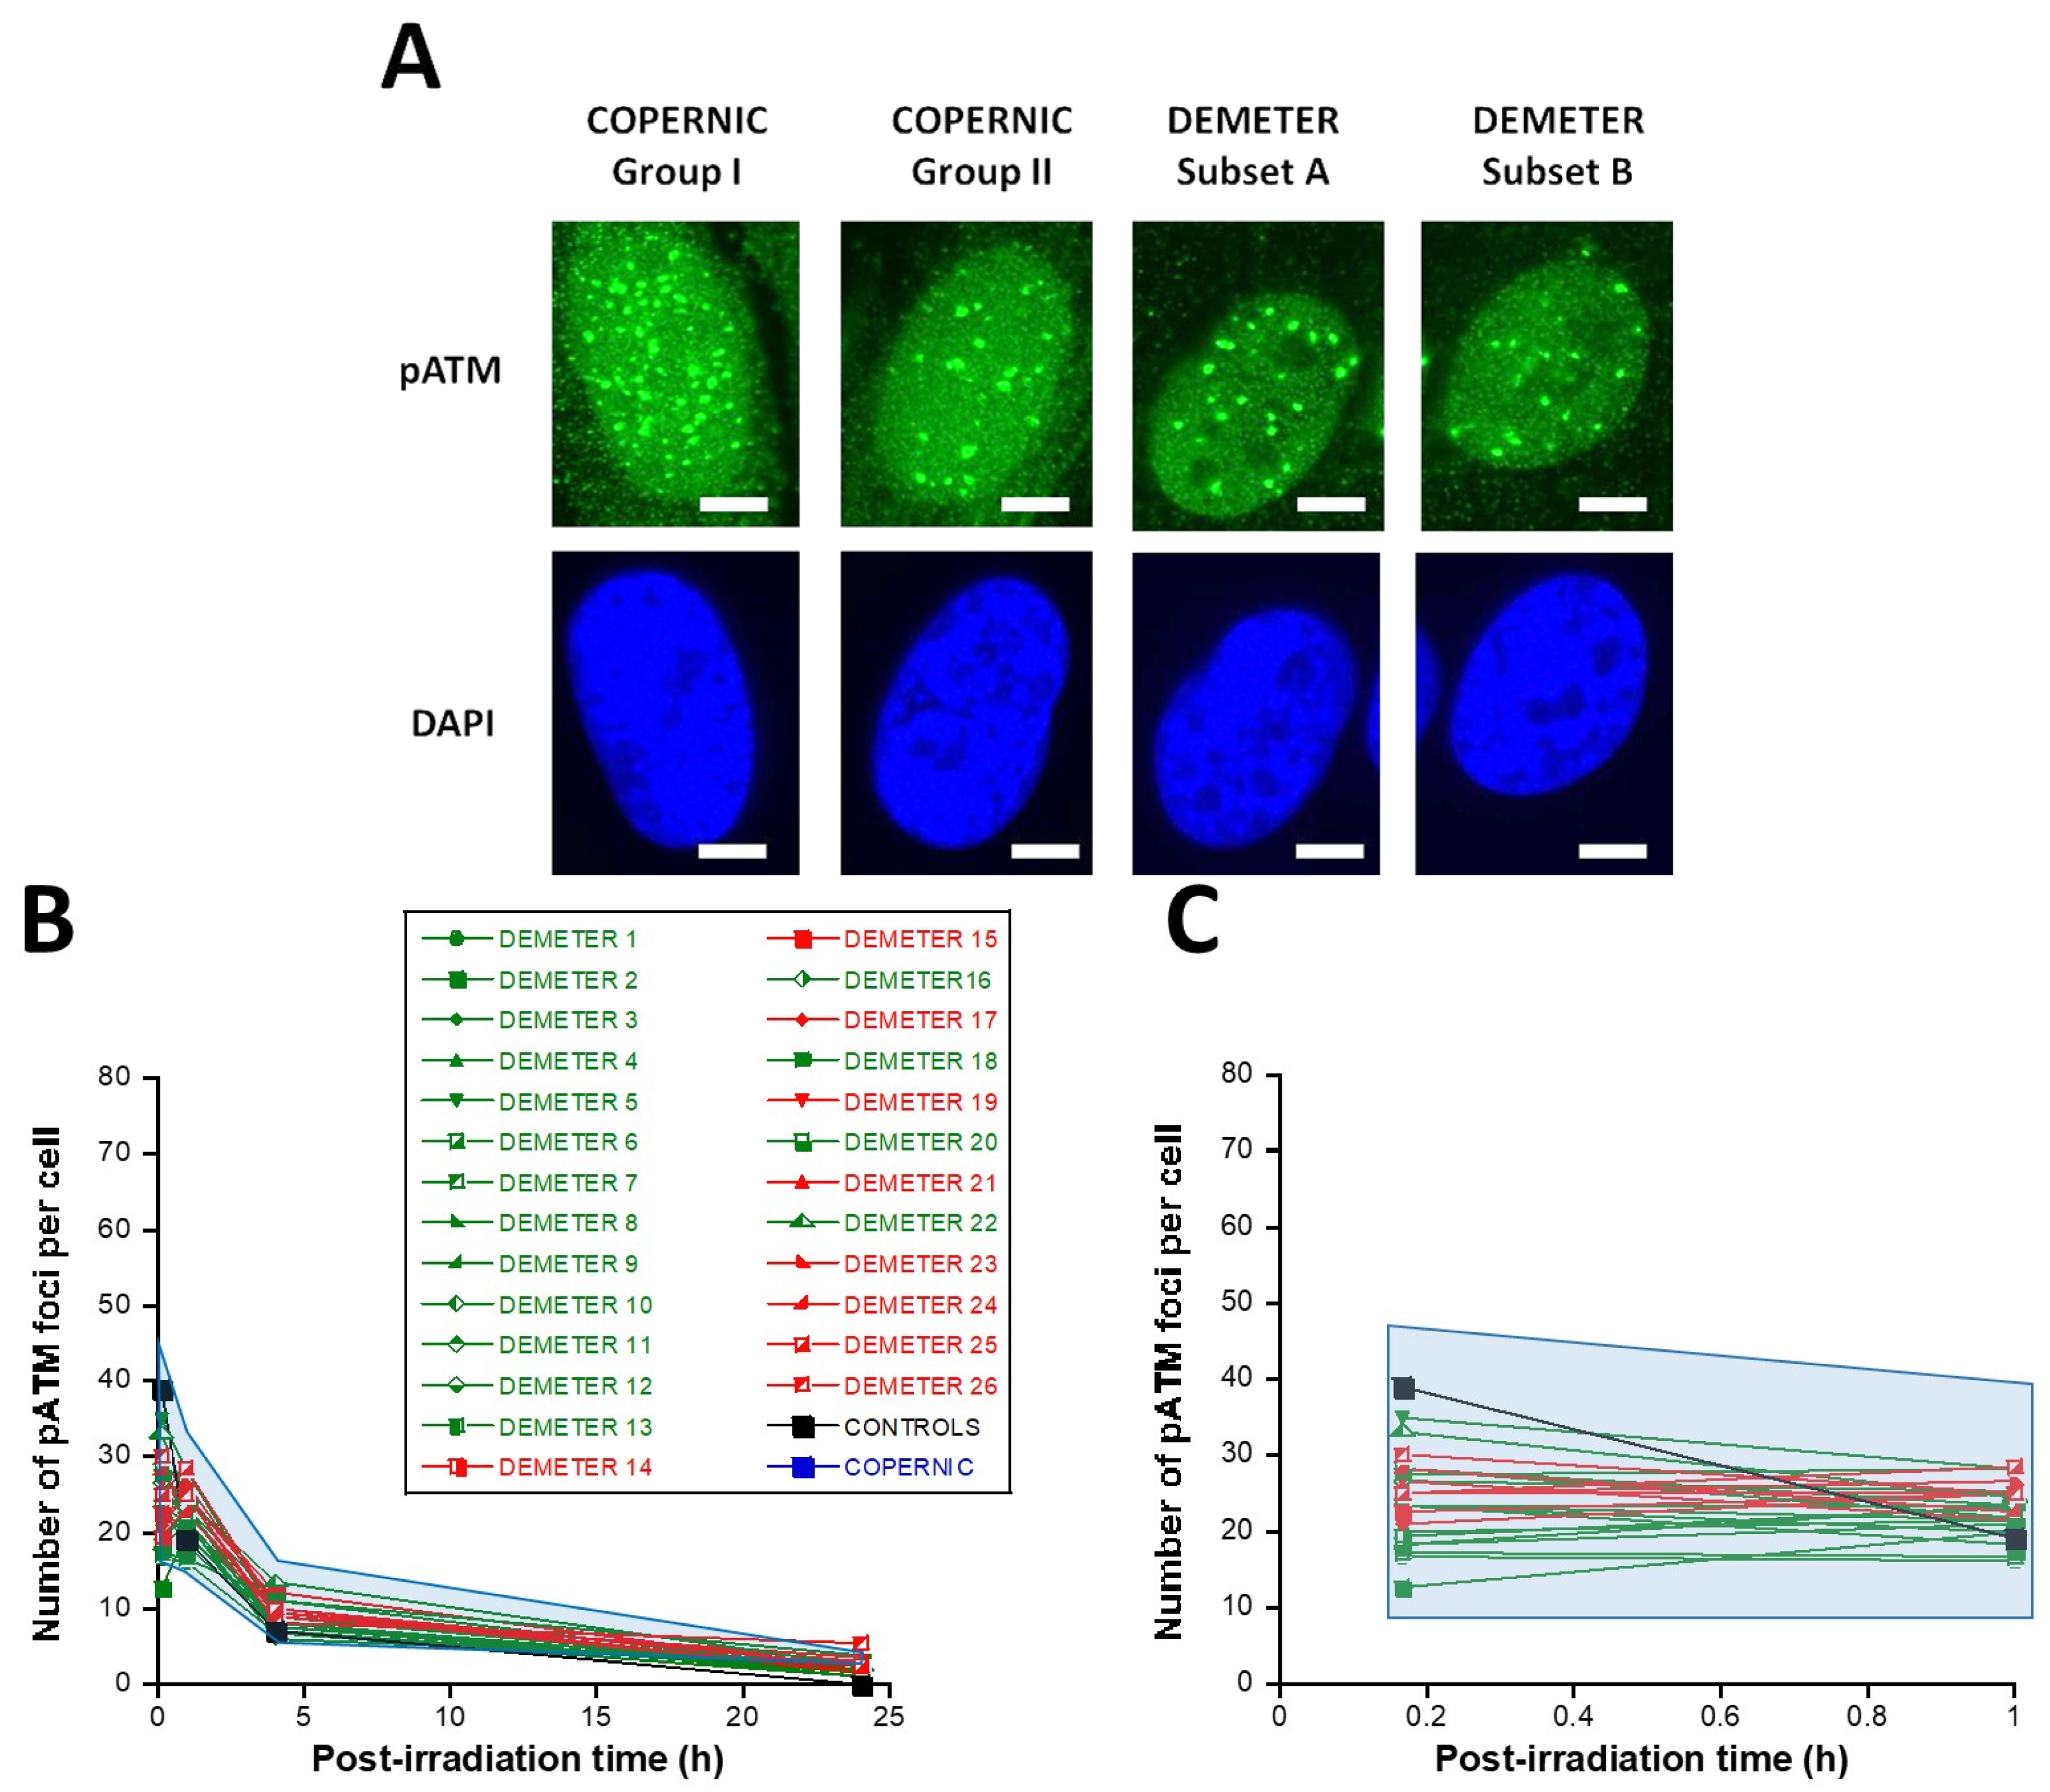
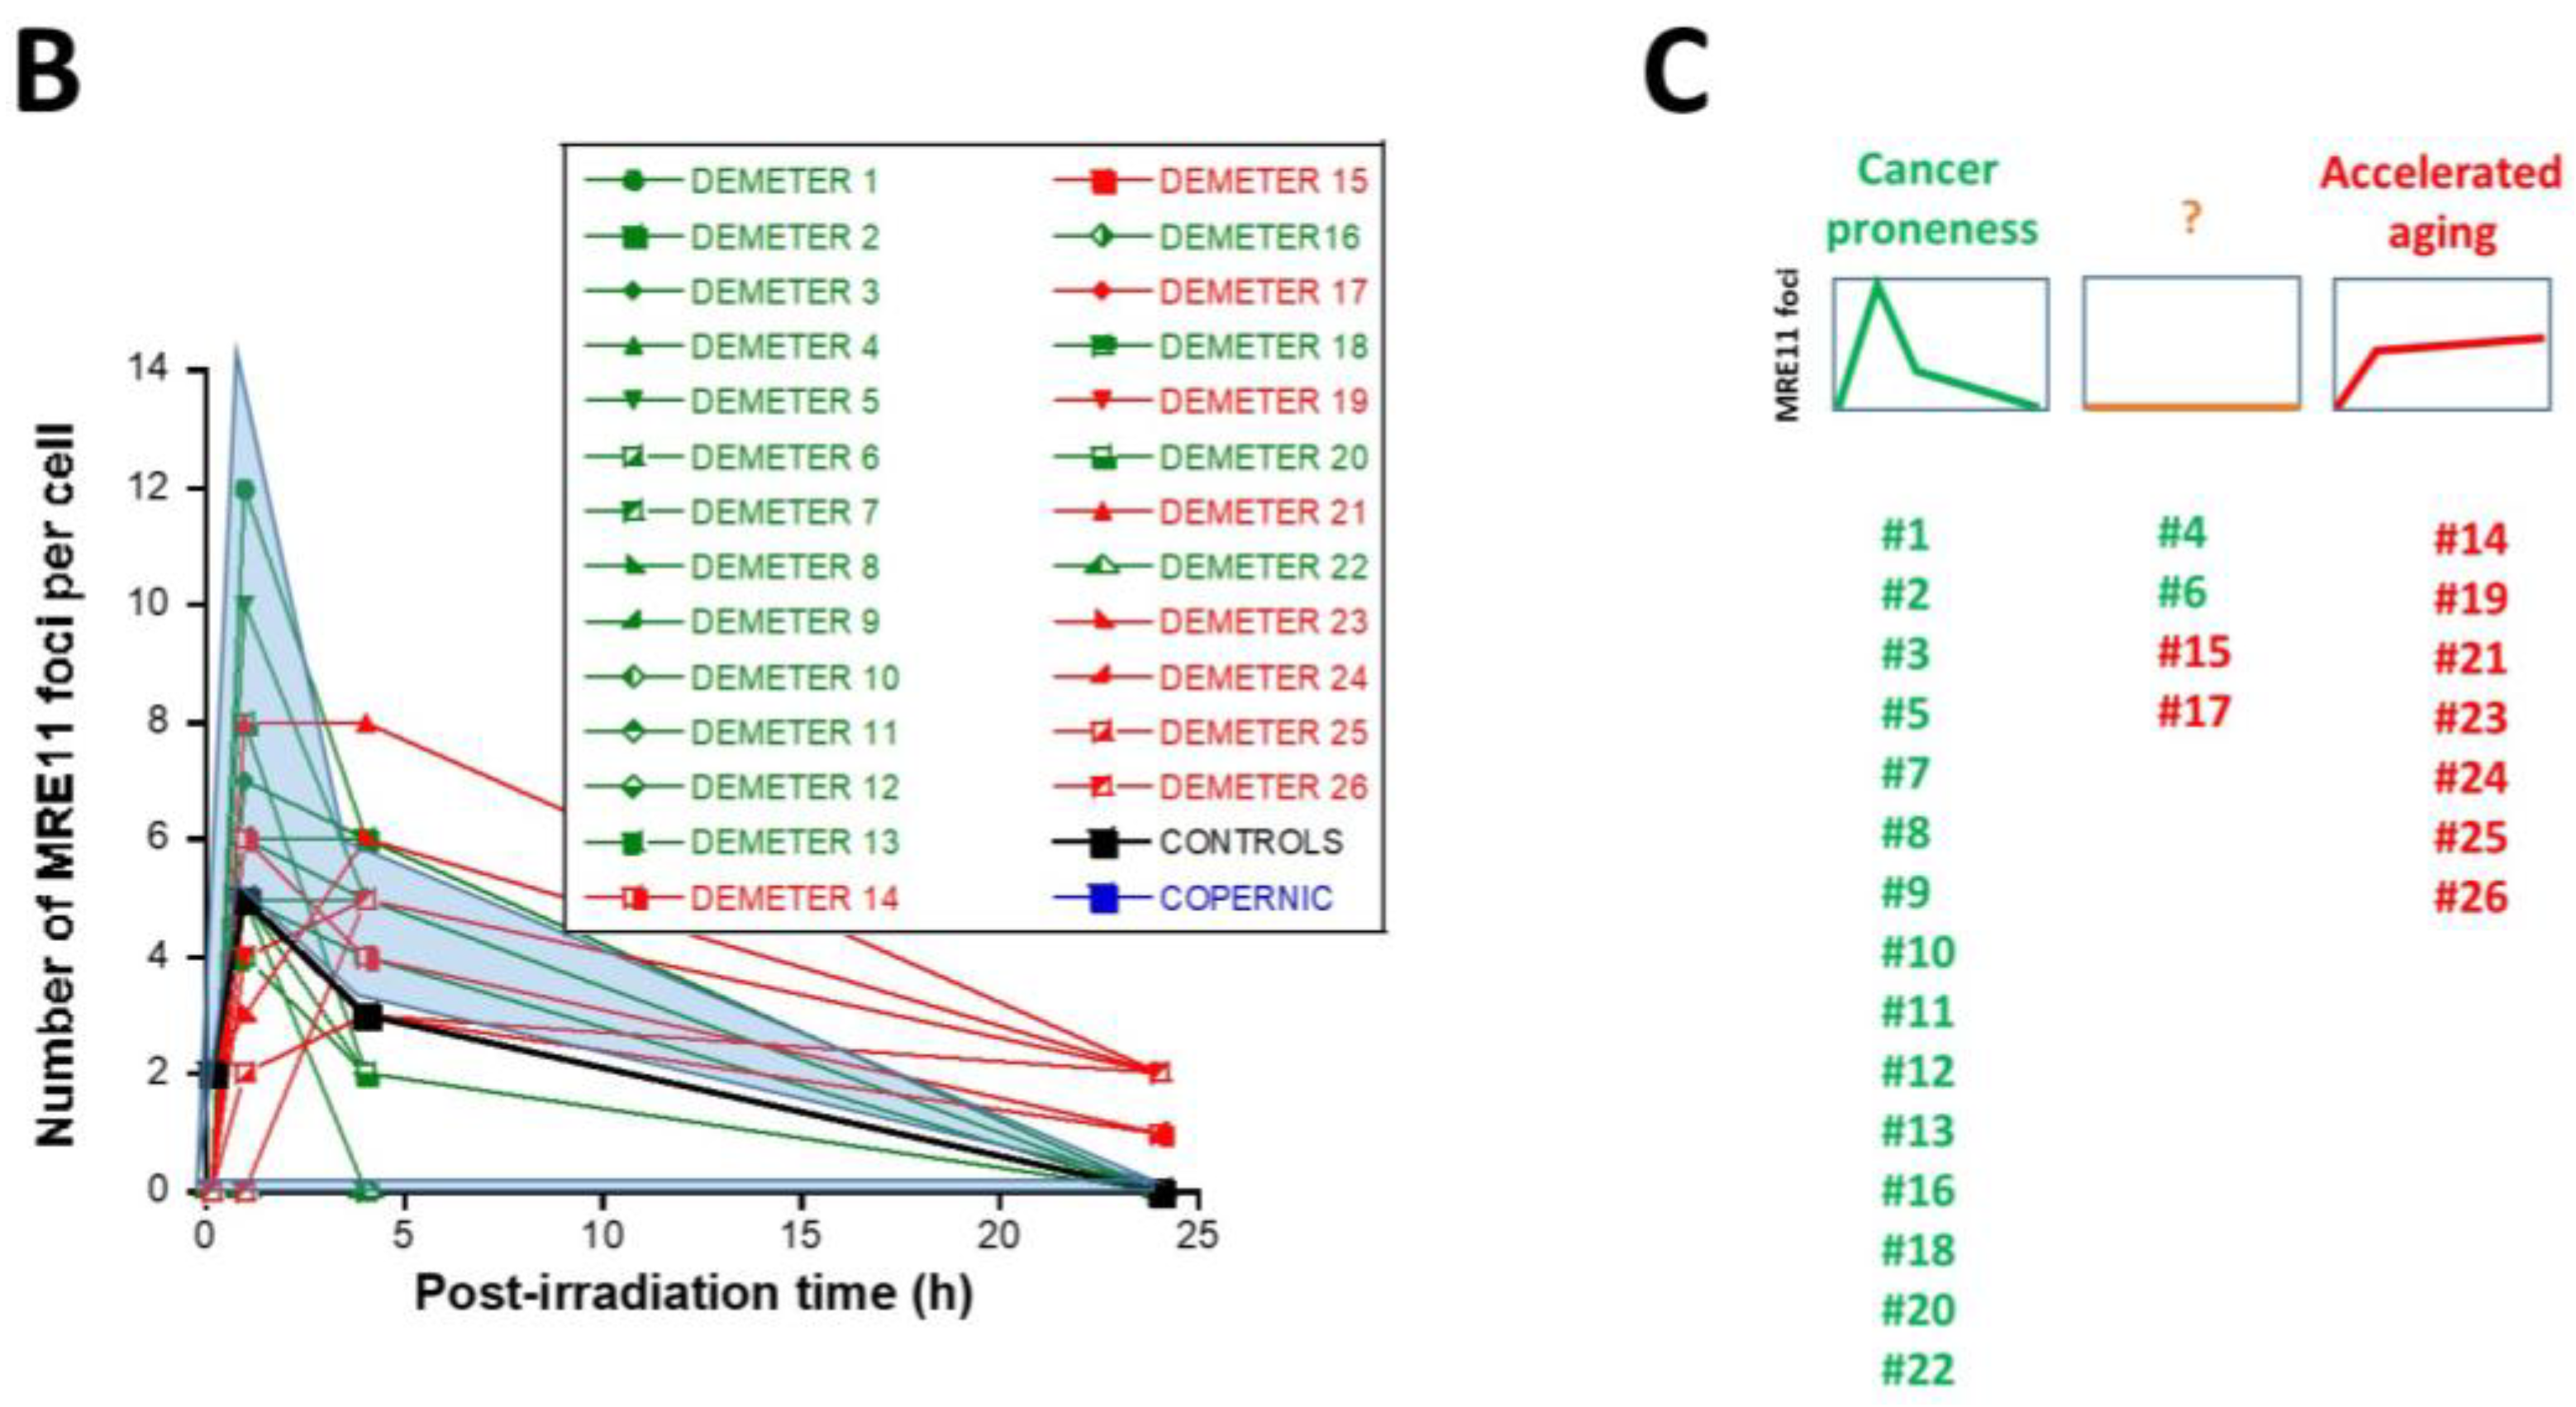
2.2.3. X-Rays-Induced Data from the DEMETER Cohort
- -
- Type 1: an Euler’s gamma function shape with an early peak and a large decrease from 4 h to 24 h post-irradiation. The type 1-shape of MRE11 foci kinetics has been generally observed in cells deriving from cancer syndromes like neurofibromatosis type I syndrome [46].
- -
- Type 2: a “zero” function reflecting the absence of MRE11 foci in the [10 min–24 h] post-irradiation range. The type 2-shape of MRE11 kinetics generally reflects impaired or absent MRE11 foci as observed in syndromes caused by a mutated helicase (Bloom’s syndrome or Werner syndrome) or those caused by mutated protein upstream MRE11 function like ataxia telangiectasia or Nijmegen syndrome [45].
- -
- Type 3: a curvilinear shape with a progressive increase of the number of MRE11 foci and a horizontal or a low-decrease-rated plateau. The type 3-shape of MRE11 kinetics has been generally observed in cells deriving from aging syndromes [45].
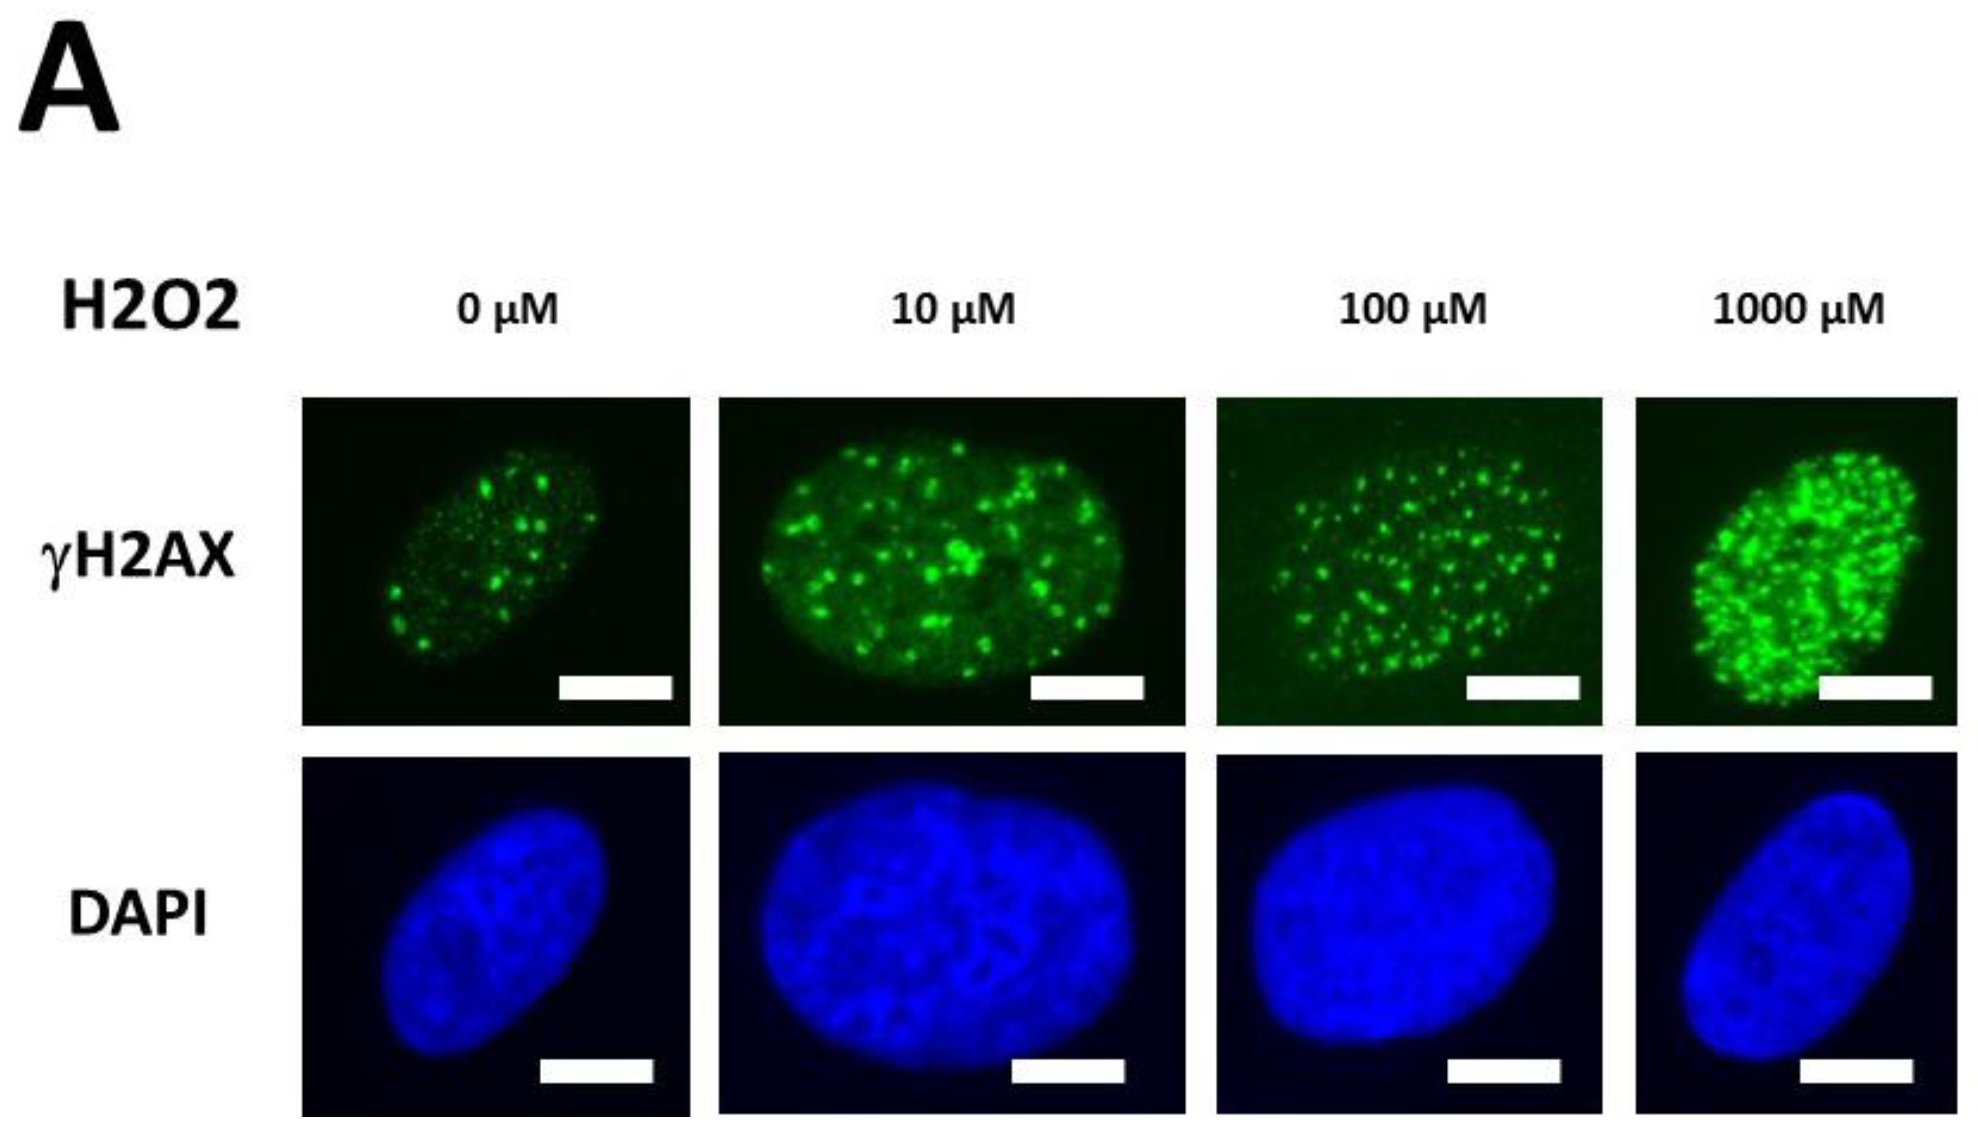
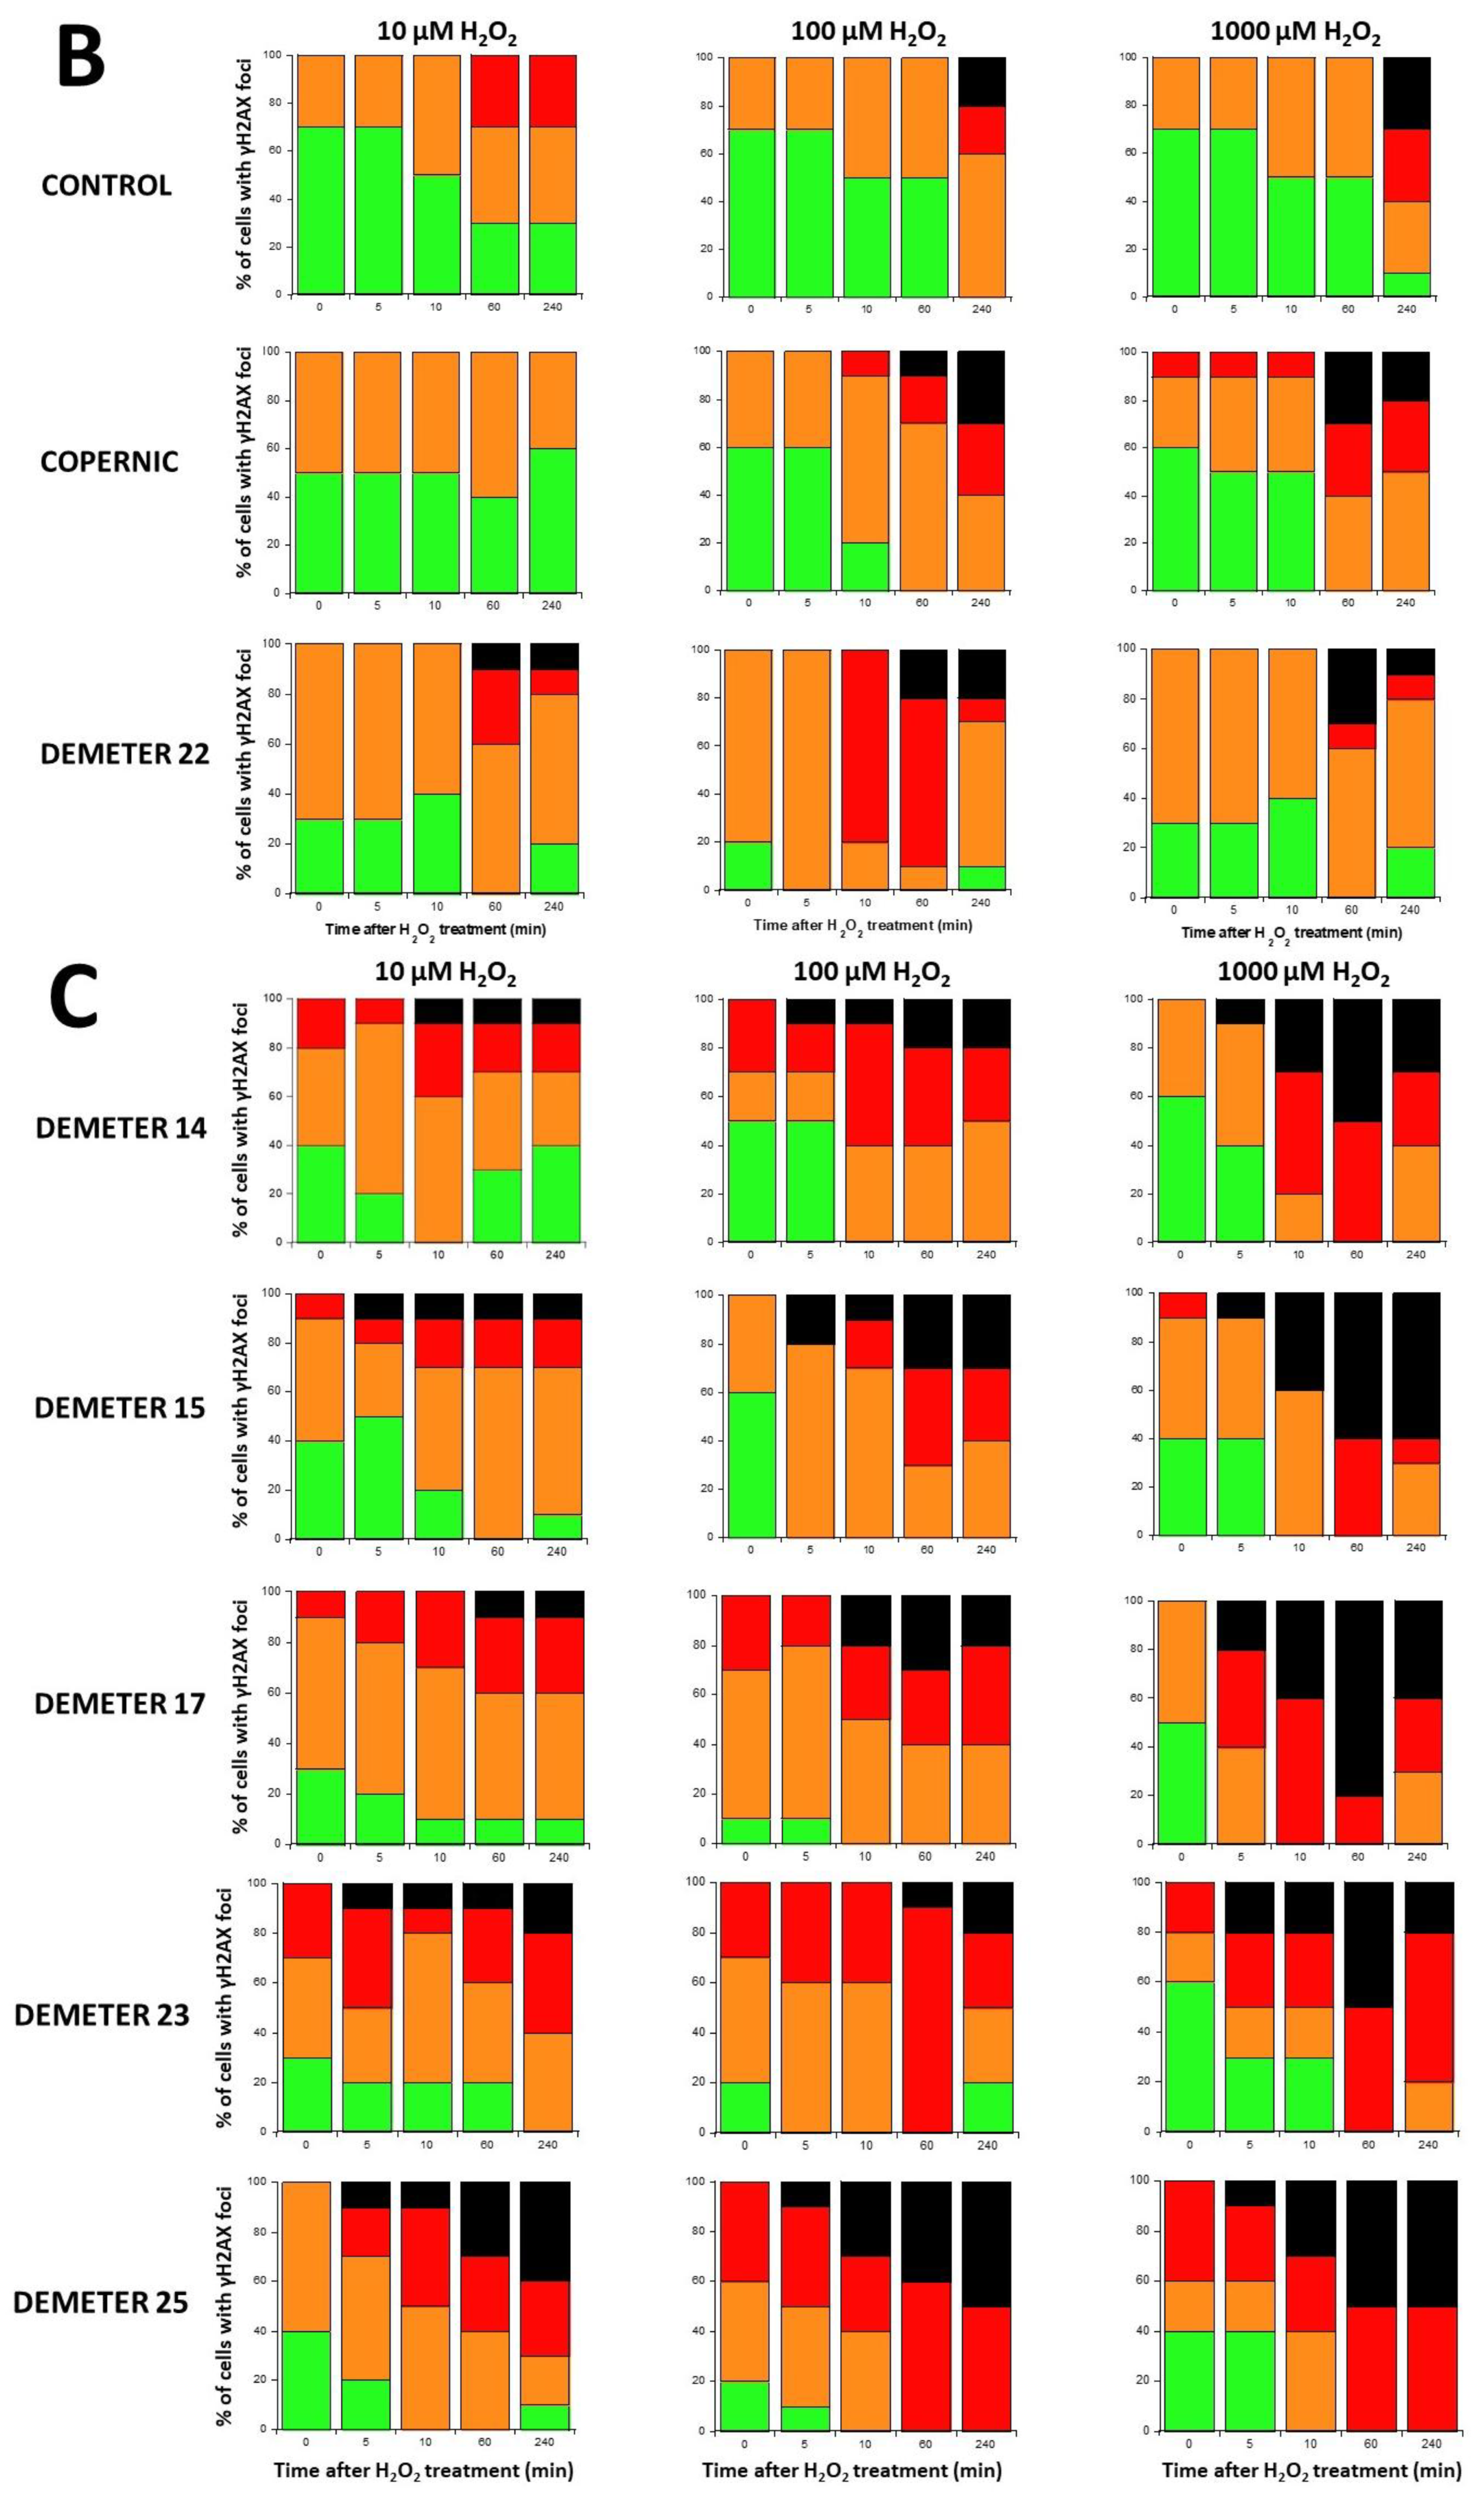
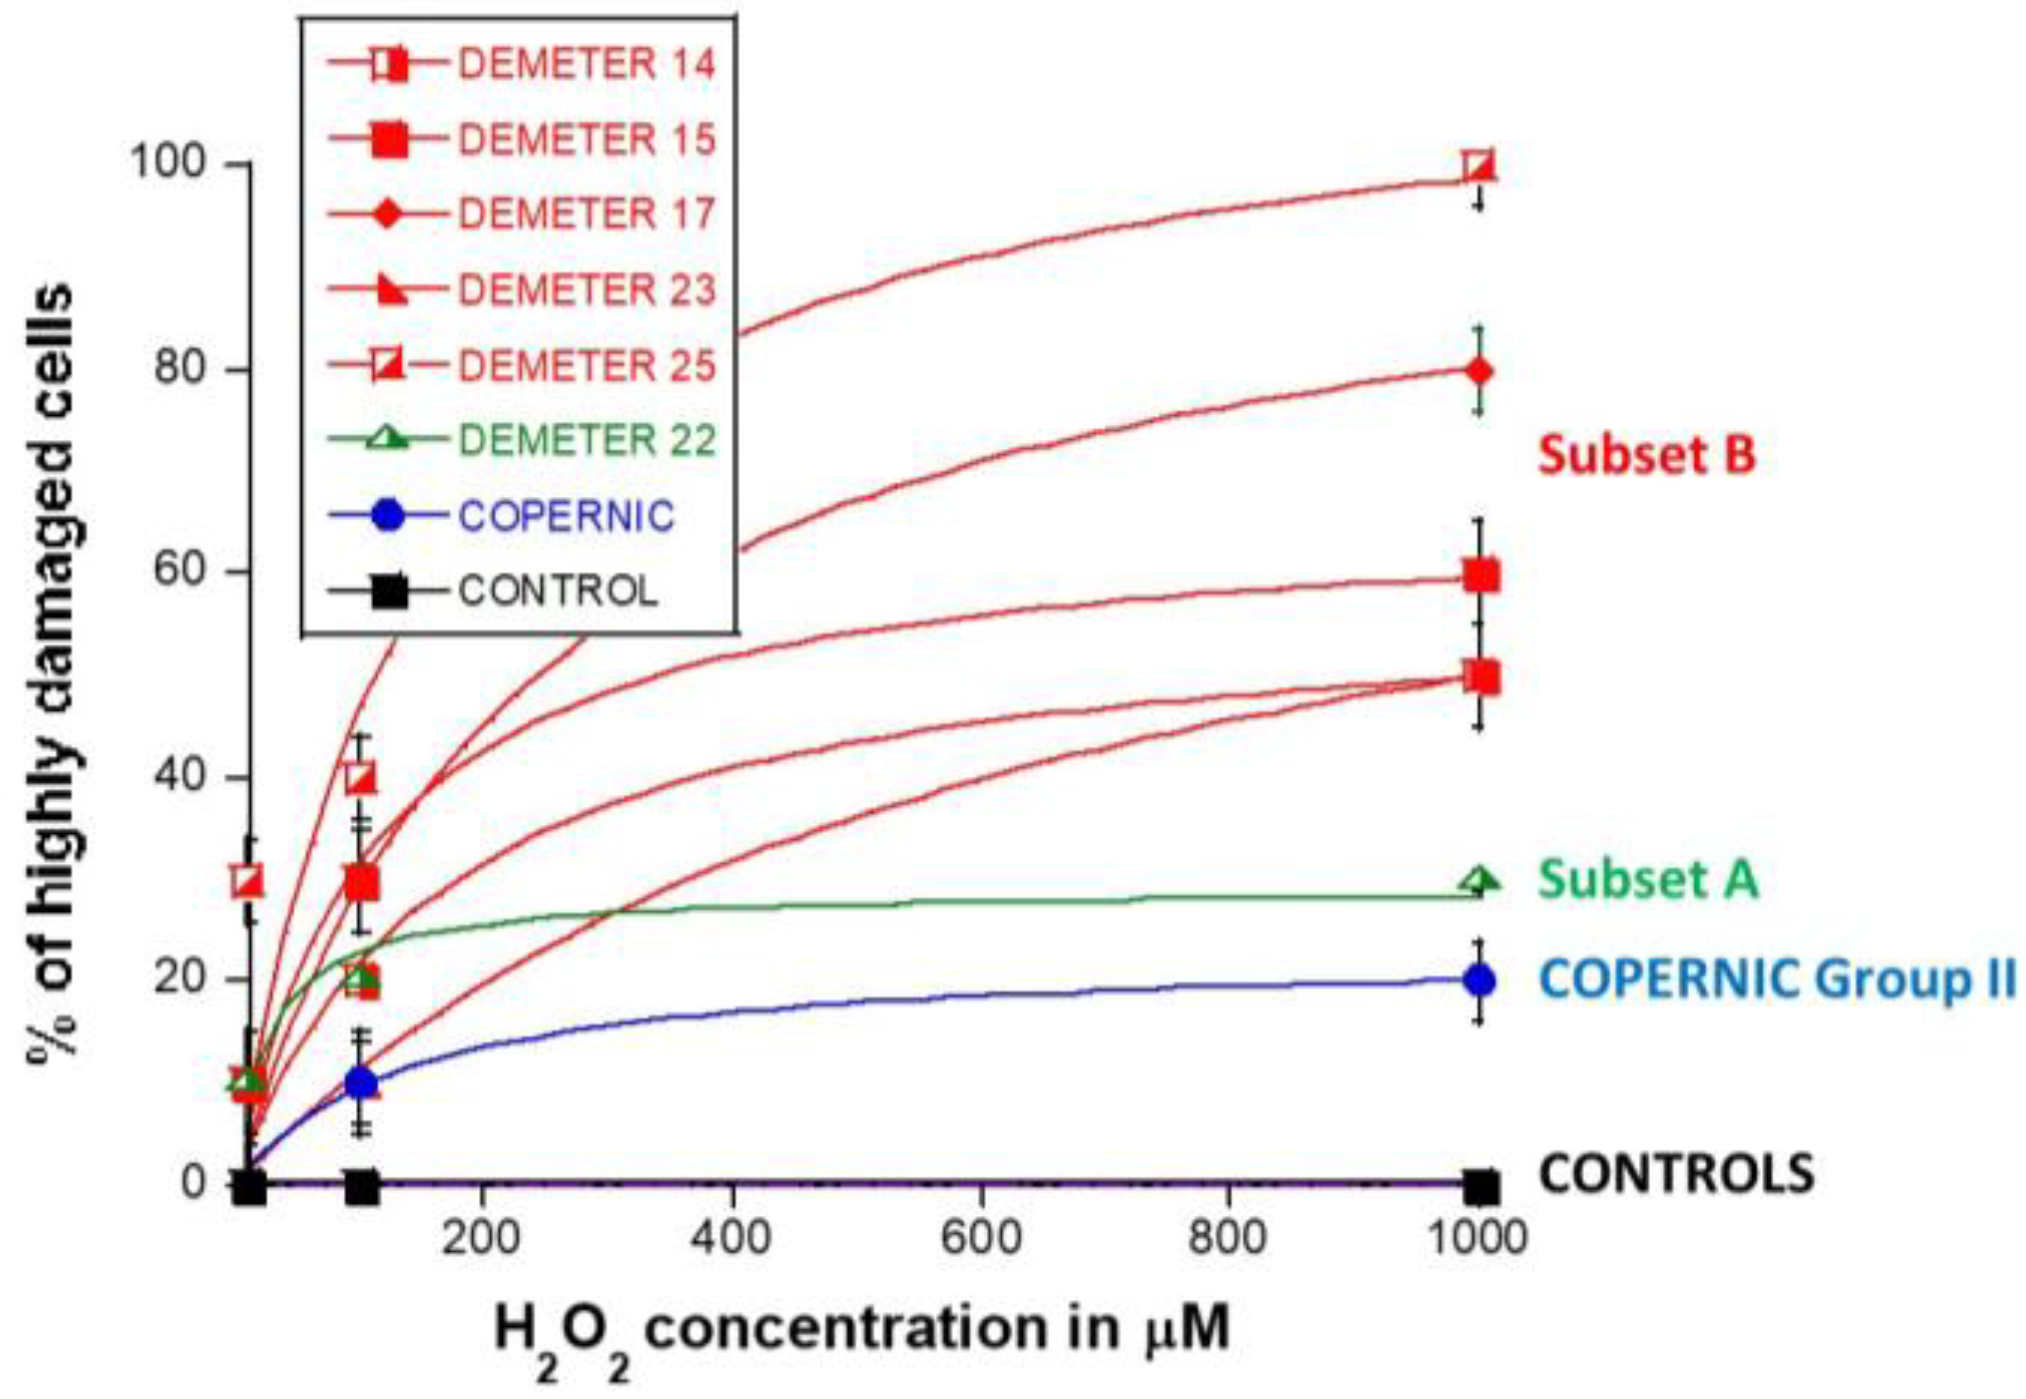
2.2.4. H2O2-Induced Data from the DEMETER Cohort
3. Discussion
3.1. Some Molecular Features to Better Understand EHS?
- -
- part A of the questionnaire (symptoms after exposure to different sources of EMF) suggested 2 subsets of donors (subsets 1 and 2) whose LBHR and HBLR phenotypes were defined quantitatively by the self-assessed intensities symptoms linked to the different sources of EMF.
- -
- from part B of the questionnaire (symptoms after exposure to other sources than EMF), the HBLR phenotype was suggested to be associated with some immunodeficiency.
- -
- in parts C and D of the questionnaire (symptoms before or during exposure to EMF), the highest self-assessed intensities of symptoms were obtained for cerebral features like headaches, tinnitus, slowing down of intellectual activity, fatigue, and sleep disorders.
- -
- parts C and D of the questionnaire also suggested 2 subsets of donors (namely subsets 1′ and 2′) whose definition was based on the self-assessed intensities of symptoms before and during the exposure to EMF, by considering different organs or pathologies. However, the too-frequent null responses did not permit us to obtain a sufficiently high matching ratio (on average, 58%, (Table 7)) with the subsets 1 and 2 defined before.
- -
- parts C and D of the questionnaire also revealed that the HBLR phenotype was particularly associated with fatigue, sleep disorders, and the decrease of intellectual capacity while the LBHR phenotype was particularly associated with impairment of cardiac and digestive systems, mood instability, nervousness, headaches, tinnitus and skin reactions.
- -
- by taking the yield of spontaneous DSB or MN as endpoints, two series of subsets of DEMETER volunteers, namely A and B, and A’ and B’ were defined, respectively. Our data showed that A and A’, on one hand, and B and B’, on another hand, were composed of the same DEMETER donors. In addition, each of the two subsets A and B was found included in one of the two subsets 1 and 2 described above with a matching ratio that did not exceed 64% identity (Table 7).
- -
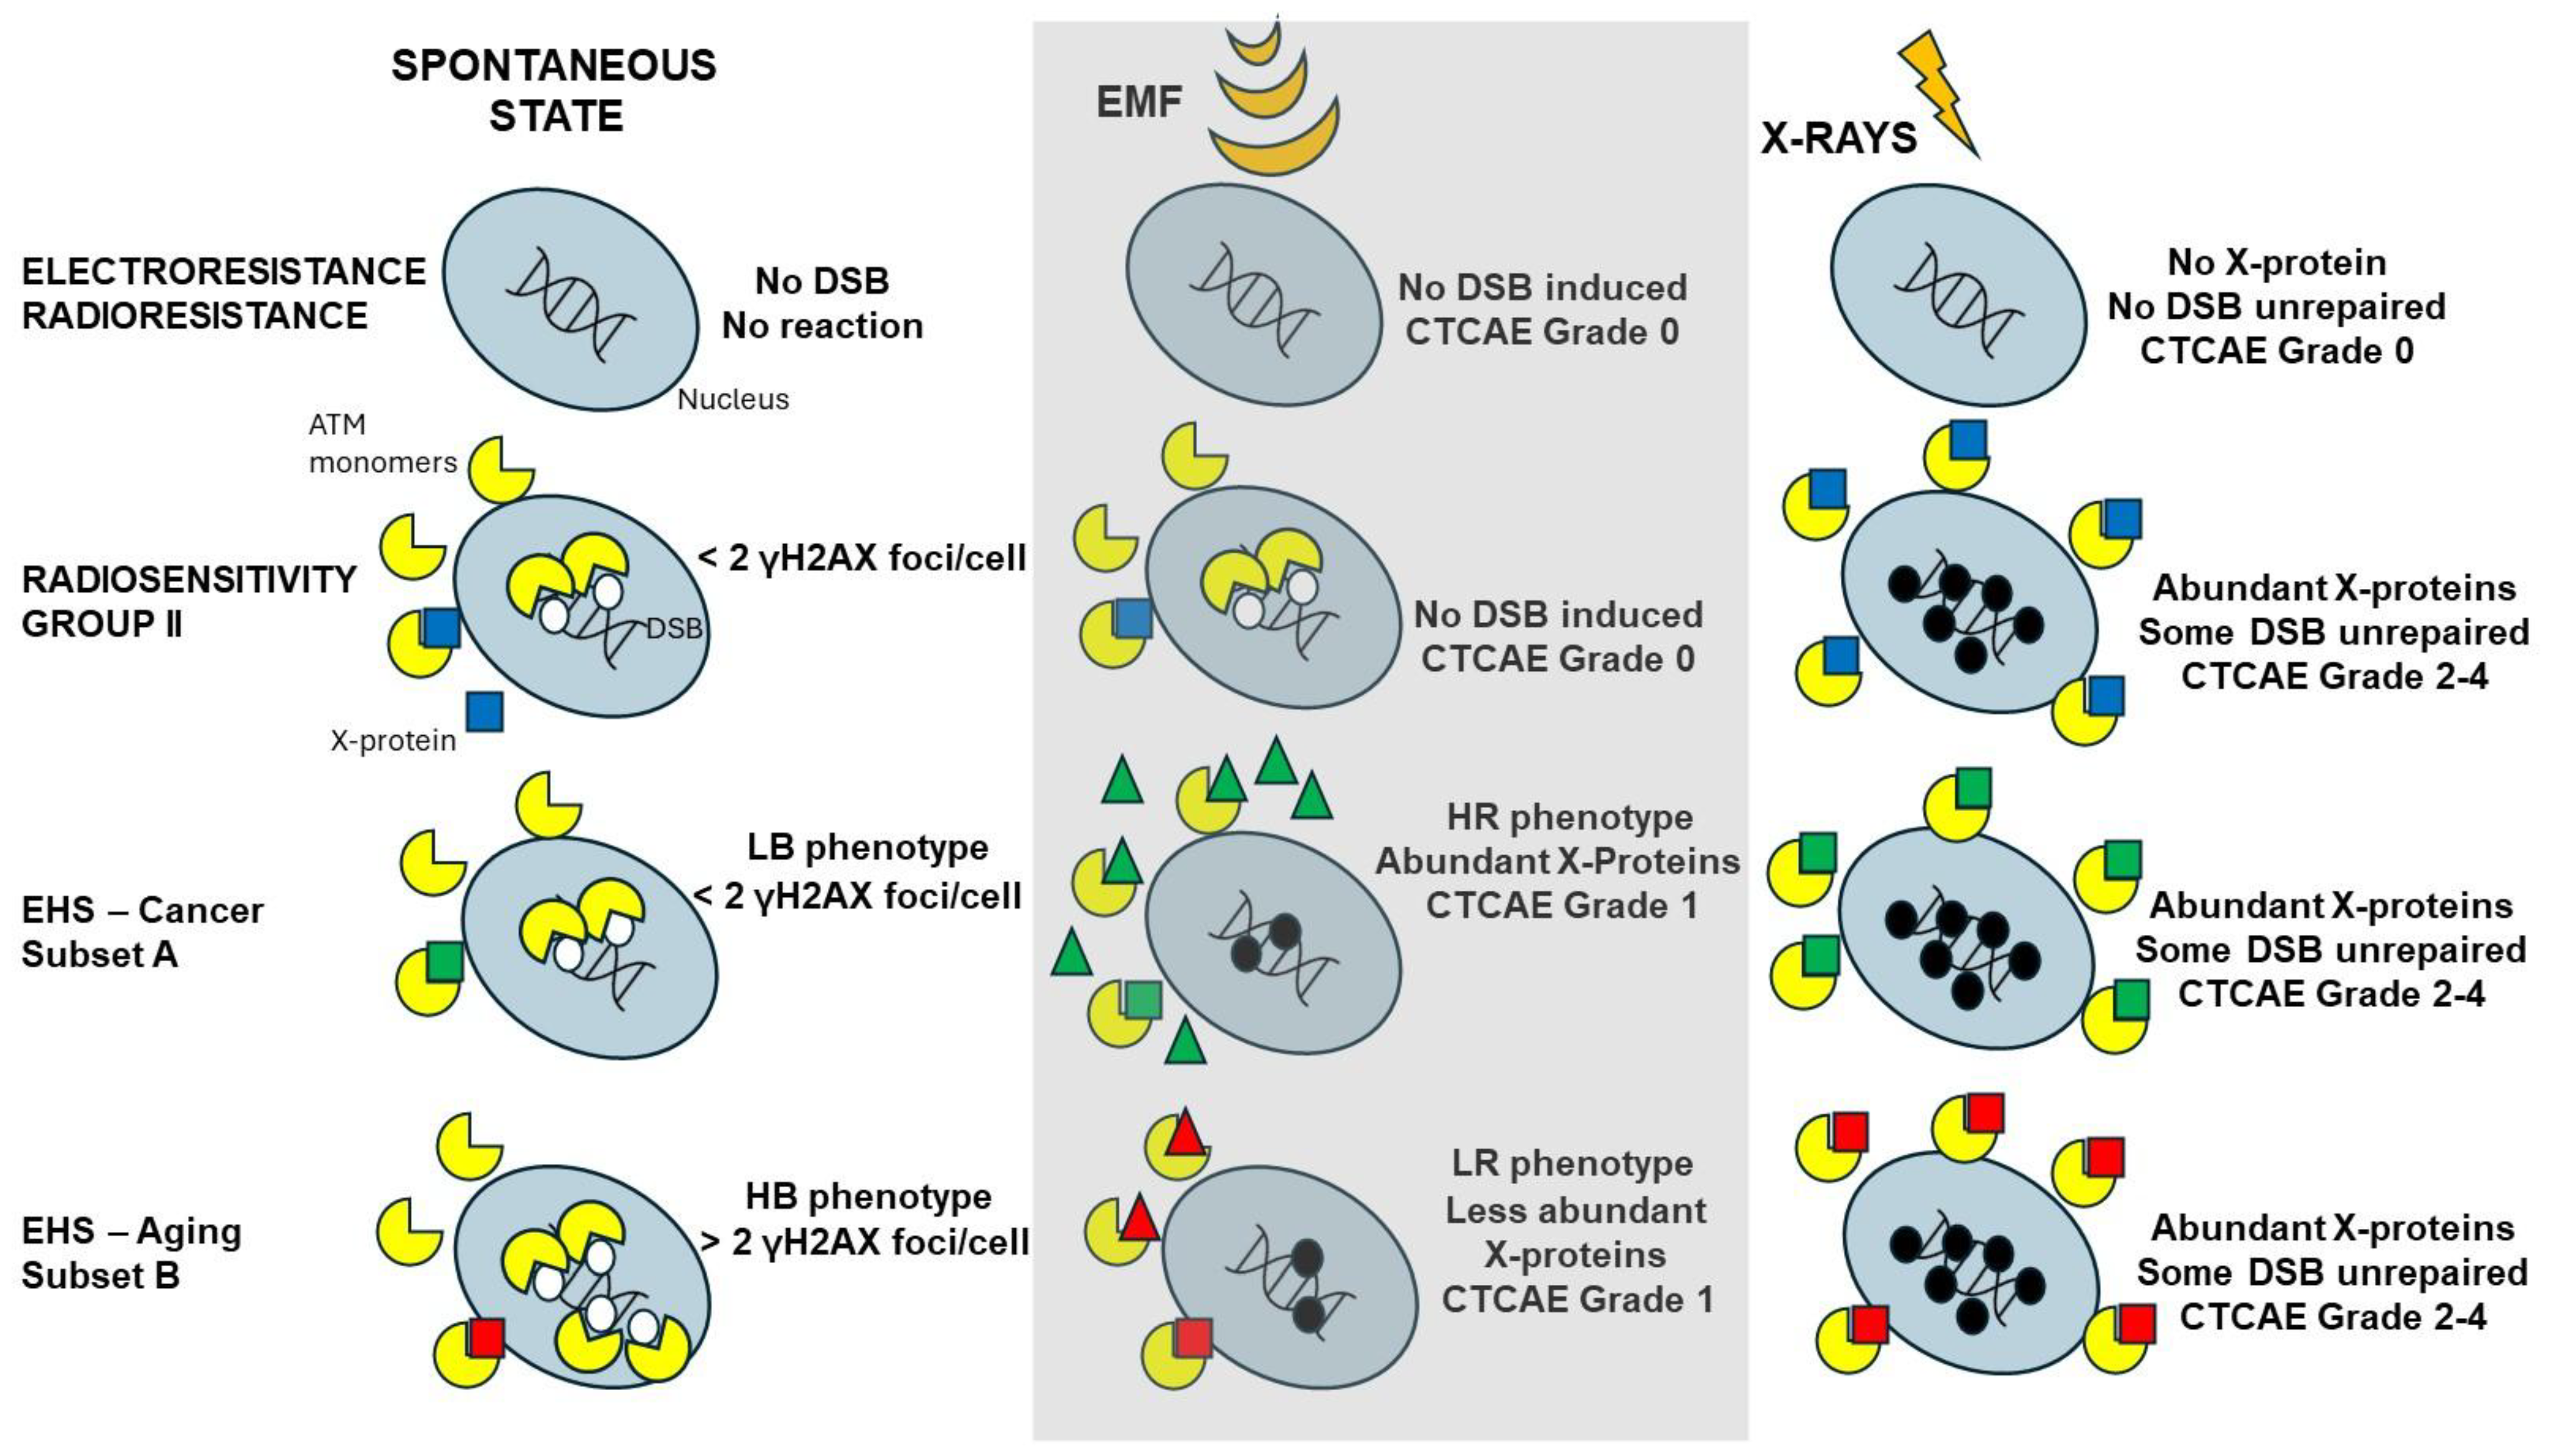
- by applying X-rays, all the DEMETER cell lines (26/26) were characterized by delayed RIANS like the patients of the COPERNIC Group II (who do not suffer from EHS symptoms). These findings suggest that EHS may be systematically linked to delayed RIANS but this statement is not reciprocal. It also means that, like the COPERNIC Group II cells, some X-proteins, ATM substrates, should be overexpressed in the cytoplasm in all the DEMETER cells. Such X-proteins can be specific to each DEMETER individual and its overexpression may result from a heterozygous mutation [44].
- -
- the molecular definition of the subsets A and B was found consolidated by other biomarkers: subset A was associated with an early formation of radiation-induced MRE11 foci while subset B was associated with both spontaneous formation of perinuclear pATM crowns and late formation of radiation-induced MRE11 (92.3% identity). From our documented data published elsewhere [45], these findings suggest that subset A was composed of donors with a high risk of cancer while subset B was composed of donors with a high risk of accelerated aging.
- -
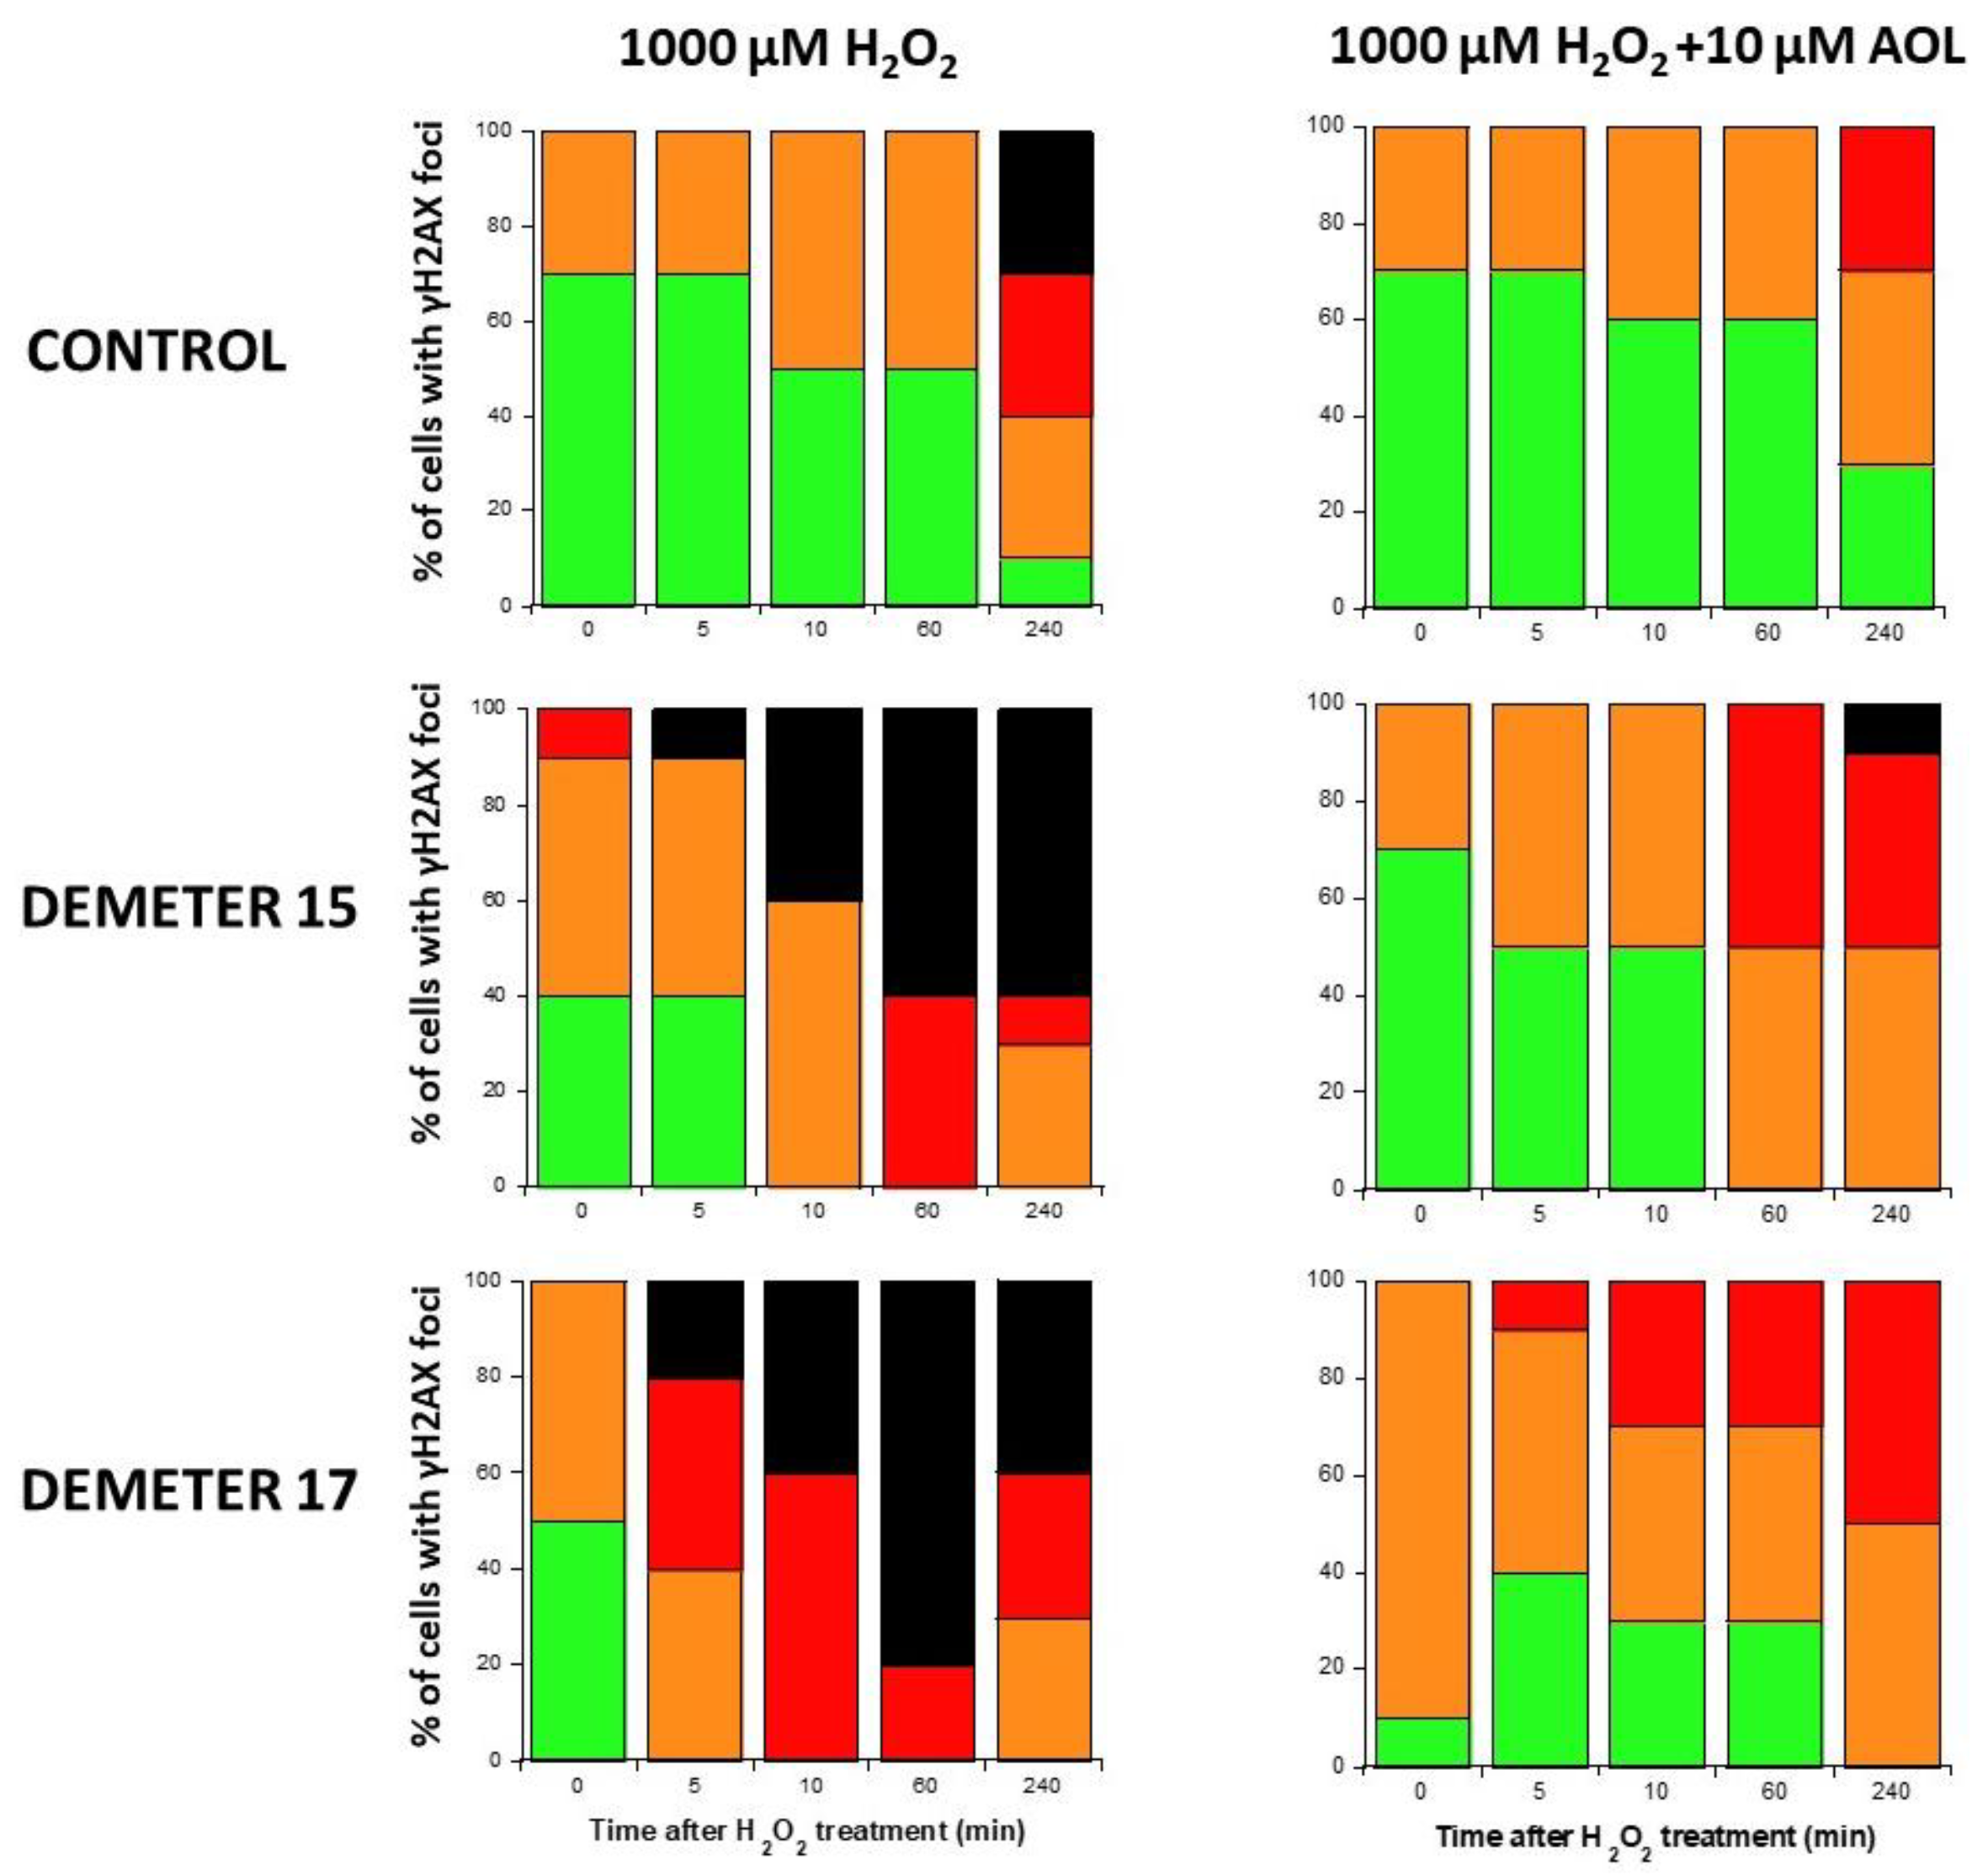
- by applying H2O2 treatment to DEMETER cells, SSB and DSB may lead to the formation of HDC, that were shown to be the final step of perinuclear pATM crowns [42]. The differences observed with H2O2 treatment between subset B (HBLR phenotype) and controls significantly decreased with the application of an anti-oxidative treatment, reinforcing again the model that EHS may be related to the management of SSB and/or DSB.
3.2. The Current Limits of a Self-Assessment Questionnaire
3.3. The Spontaneous Levels of DNA Breaks: A First Prerequisite for EHS?
- -
- at a spontaneous rate, the DSB recognition rate is close to 100% because the number of DSBs is relatively low. However, the permanent stress may be higher in DEMETER subset B cells than in subset A ones, as the phenotype HB suggests, because of an impairment in the management of oxidative stress.
- -
- after 2 Gy X-ray treatment, the DSB recognition rate is 50% for all the COPERNIC Group II and DEMETER cells, whatever the subset. In these conditions, the response of DEMETER Subset B cells is closer than that of COPERNIC Group II than COPERNIC Group III.
3.4. EHS May Be Associated with a Delayed RIANS
3.5. Two Subsets of EHS?
4. Materials and Methods
4.1. The DEMETER Cohort and Fibroblasts Collection
- -
- (A) questions about the intensities of symptoms and discomfort after exposure to some sources of EMF like cell phone (A1), microwave (A2), cordless landline phone (A3), cell phone base station (A4), household electrical appliance (A5), low-energy light bulbs (A6), wired computer (A7), WiFi-on computer (A8), television (A9), WiFi-on box (A10);
- -
- (B) questions about the intensities of symptoms and discomfort after exposure to some non-EMF sources (see Figure 2C and Supplementary Table S1 for details)
- -
- (C) questions about the intensities of symptoms and discomfort according to the tissue/organ exposed before exposure to EMF sources: eye pathologies (C1), respiratory system (C2), pain in muscles and cartilages (C3), cardiac system pathologies (C4), digestive system pathologies (C5), fatigue and sleep disorders (C6), mood instability and nervousness (C7), slowing down of intellectual activity (C8), headaches, tinnitus (C9), skin pathologies (C10), genito-urinary system pathologies (C11).
- -
- (D) questions about the intensities of symptoms and discomfort according to the tissue/organ exposed during exposure to EMF sources: same as part C.
- -
- (P) a free area for personal information to detail eventual medical history and ongoing treatments.
4.2. The COPERNIC Fibroblasts Collection
4.3. Cell Culture
4.4. X-Rays Irradiation
4.5. Treatment with H2O2
4.6. Pre-Treatment with Anethole Trithione
4.7. Immunofluorescence
4.8. Micronuclei Assay
4.9. Statistical Analysis
5. Conclusions
Supplementary Materials
Author Contributions
Funding
Institutional Review Board Statement
Informed Consent Statement
Data Availability Statement
Acknowledgments
Conflicts of Interest
References
- WHO. Radiofrequency Fields; Public Consultation Document; WHO: Geneva, Switzerland, 2014.
- ICNIRP. Exposure to High Frequency Electromagnetic Fields, Biological Effects and Health Consequences (100 kHz–300 GHz)—Review of the Scientific Evidence and Health Consequences; International Commission on Non-Ionizing Radiation Protection: Munich, Germany, 2019. [Google Scholar]
- ICNIRP. Gaps in Knowledge Relevant to the “ICNIRP Guidelines for Limiting Exposure to Time-Varying Electric, Magnetic and Electromagnetic Fields (100 kHz to 300 GHz)”. Health Phys. 2025, 128, 190–202. [Google Scholar] [CrossRef] [PubMed]
- ANSES. Radiofréquences et Santé: Mise à Jour de l’Expertise; ANSES: Paris, France, 2013.
- Schneir, J.R.; Whalley, J.; Amaral, T.P.; Pogorel, G. The implications of 5G networks: Paving the way for mobile innovation? Telecommun. Policy 2018, 42, 583–586. [Google Scholar] [CrossRef]
- Russell, C.L. 5 G wireless telecommunications expansion: Public health and environmental implications. Environ. Res. 2018, 165, 484–495. [Google Scholar] [CrossRef] [PubMed]
- Debouzy, J.C.; Minier, L.; Pierre, V.; Jaoui, R.; Crouzier, D. Biological effects of millimetric waves: Considerations on the Bibiography, for period 2017–2022. Biomed. J. Sci. Tech. Res. 2023, 48, 40171–40180. [Google Scholar]
- Martha, C.; Griffet, J. Brief report: How do adolescents perceive the risks related to cell-phone use? J. Adolesc. 2007, 30, 513–521. [Google Scholar] [CrossRef]
- Sansone, R.A.; Sansone, L.A. Cell Phones: The Psychosocial Risks. Innov. Clin. Neurosci. 2013, 10, 33–37. [Google Scholar]
- Joshi, S.C. Cell Phone Use, Sleep Quality, Academic Performance, and Psychological Well-Being in Young Adults: A Theoretical Framework. Psychol. Res. Pract. 2023, 2, 1–26. [Google Scholar] [CrossRef]
- Olsson, J. Symptoms associated with electromagnetic fields: A critical review. Electromagnetics 1996, 17, 48. [Google Scholar]
- Shacklett, D.E.; Tredici, T.J.; Epstein, D.L. Evaluation of possible microwave-induced lens changes in the United States Air Force. Aviat. Space Environ. Med. 1975, 46, 1403–1406. [Google Scholar]
- Cleary, S.F.; Pasternack, B.S.; Beebe, G.W. Cataract incidence in radar workers. Arch. Environ. Health 1965, 11, 179–182. [Google Scholar] [CrossRef]
- Haider, S. Electromagnetic field hypersensitivity: A clinical review. J. Occup. Med. 1997, 39, 761–764. [Google Scholar]
- Karlsson, B. Electromagnetic hypersensitivity (EHS) in Sweden: A clinical study and review of the literature. Scand. J. Work. Environ. Health 2000, 26, 246–249. [Google Scholar]
- Belyaev, I.; Dean, A.; Eger, H.; Hubmann, G.; Jandrisovits, R.; Kern, M.; Kundi, M.; Moshammer, H.; Lercher, P.; Muller, K.; et al. EUROPAEM EMF Guideline 2016 for the prevention, diagnosis and treatment of EMF-related health problems and illnesses. Rev. Environ. Health 2016, 31, 363–397. [Google Scholar] [CrossRef]
- ANSES. Hypersensibilité Électromagnétique ou Intoléranceenvironnementale Idiopathique Attribuée aux Champs Électromagnétiques; ANSES: Maisons-Alfort, France, 2018.
- ANSES. Exposition aux Champs Électromagnétiques Liée au Déploiement de la Technologie 5G—Avis Actualisé de l’ANSES; ANSES: Maison-Alfort, France, 2022.
- Bosch-Capblanch, X.; Esu, E.; Oringanje, C.M.; Dongus, S.; Jalilian, H.; Eyers, J.; Auer, C.; Meremikwu, M.; Roosli, M. The effects of radiofrequency electromagnetic fields exposure on human self-reported symptoms: A systematic review of human experimental studies. Environ. Int. 2024, 187, 108612. [Google Scholar] [CrossRef]
- Benke, G.; Abramson, M.J.; Brzozek, C.; McDonald, S.; Kelsall, H.; Sanagou, M.; Zeleke, B.M.; Kaufman, J.; Brennan, S.; Verbeek, J.; et al. The effects of radiofrequency exposure on cognition: A systematic review and meta-analysis of human observational studies. Environ. Int. 2024, 188, 108779. [Google Scholar] [CrossRef]
- Johnson, E.E.; Kenny, R.P.W.; Adesanya, A.M.; Richmond, C.; Beyer, F.; Calderon, C.; Rankin, J.; Pearce, M.S.; Toledano, M.; Craig, D.; et al. The effects of radiofrequency exposure on adverse female reproductive outcomes: A systematic review of human observational studies with dose-response meta-analysis. Environ. Int. 2024, 190, 108816. [Google Scholar] [CrossRef]
- Kenny, R.P.W.; Millar, E.B.; Adesanya, A.; Richmond, C.; Beyer, F.; Calderon, C.; Rankin, J.; Toledano, M.; Feychting, M.; Pearce, M.S.; et al. The effects of radiofrequency exposure on male fertility and adverse reproductive outcomes: A protocol for two systematic reviews of human observational studies with meta-analysis. Environ. Int. 2022, 158, 106968. [Google Scholar] [CrossRef]
- Pophof, B.; Kuhne, J.; Schmid, G.; Weiser, E.; Dorn, H.; Henschenmacher, B.; Burns, J.; Danker-Hopfe, H.; Sauter, C. The effect of exposure to radiofrequency electromagnetic fields on cognitive performance in human experimental studies: Systematic review and meta-analyses. Environ. Int. 2024, 191, 108899. [Google Scholar] [CrossRef]
- Slottje, P.; van Moorselaar, I.; van Strien, R.; Vermeulen, R.; Kromhout, H.; Huss, A. Electromagnetic hypersensitivity (EHS) in occupational and primary health care: A nation-wide survey among general practitioners, occupational physicians and hygienists in the Netherlands. Int. J. Hyg. Environ. Health 2017, 220, 395–400. [Google Scholar] [CrossRef]
- Stein, Y.; Udasin, I.G. Electromagnetic hypersensitivity (EHS, microwave syndrome)—Review of mechanisms. Environ. Res. 2020, 186, 109445. [Google Scholar] [CrossRef]
- Carpenter, D.O. The microwave syndrome or electro-hypersensitivity: Historical background. Rev. Environ. Health 2015, 30, 217–222. [Google Scholar] [CrossRef] [PubMed]
- Koteles, F.; Szemerszky, R.; Gubanyi, M.; Kormendi, J.; Szekrenyesi, C.; Lloyd, R.; Molnar, L.; Drozdovszky, O.; Bardos, G. Idiopathic environmental intolerance attributed to electromagnetic fields (IEI-EMF) and electrosensibility (ES)—Are they connected? Int. J. Hyg. Environ. Health 2013, 216, 362–370. [Google Scholar] [CrossRef] [PubMed]
- Foray, N.; Amiel, M.; Mornex, R. Etienne Destot (1864–1918) ou l’autre père de la radiologie française. Cancer Radiothérapie 2017, 21, 138–147. [Google Scholar] [CrossRef] [PubMed]
- Destot, E. Les troubles physiologiques et trophiques dus aux rayons X. Comptes-Rendus l’Académie Sci. 1897, 127, 1114–1116. [Google Scholar]
- Arcelin, F. Existe-t-il en radiothérapie des idiosyncrasies spontanées ou acquises. Arch. d’Electr. Médicale 1911, 10, 37–61. [Google Scholar]
- Meyer, F.; Bitsch, A.; Forman, H.J.; Fragoulis, A.; Ghezzi, P.; Henschenmacher, B.; Kellner, R.; Kuhne, J.; Ludwig, T.; Sachno, D.; et al. The effects of radiofrequency electromagnetic field exposure on biomarkers of oxidative stress in vivo and in vitro: A systematic review of experimental studies. Environ. Int. 2024, 194, 108940. [Google Scholar] [CrossRef]
- Belpomme, D.; Carlo, G.L.; Irigaray, P.; Carpenter, D.O.; Hardell, L.; Kundi, M.; Belyaev, I.; Havas, M.; Adlkofer, F.; Heuser, G.; et al. The Critical Importance of Molecular Biomarkers and Imaging in the Study of Electrohypersensitivity. A Scientific Consensus International Report. Int. J. Mol. Sci. 2021, 22, 7321. [Google Scholar] [CrossRef]
- Leszczynski, D. Review of the scientific evidence on the individual sensitivity to electromagnetic fields (EHS). Rev. Environ. Health 2022, 37, 423–450. [Google Scholar] [CrossRef]
- Eltiti, S.; Wallace, D.; Russo, R.; Fox, E. Symptom Presentation in Idiopathic Environmental Intolerance with Attribution to Electromagnetic Fields: Evidence for a Nocebo Effect Based on Data Re-Analyzed from Two Previous Provocation Studies. Front. Psychol. 2018, 9, 1563. [Google Scholar] [CrossRef]
- Verrender, A.; Loughran, S.P.; Dalecki, A.; Freudenstein, F.; Croft, R.J. Can explicit suggestions about the harmfulness of EMF exposure exacerbate a nocebo response in healthy controls? Environ. Res. 2018, 166, 409–417. [Google Scholar] [CrossRef]
- Johansson, A.; Nordin, S.; Heiden, M.; Sandstrom, M. Symptoms, personality traits, and stress in people with mobile phone-related symptoms and electromagnetic hypersensitivity. J. Psychosom. Res. 2010, 68, 37–45. [Google Scholar] [CrossRef] [PubMed]
- WHO. Electromagnetic hypersensitivity. In Proceedings of the International Workshop on EMF Hypersensitivity, Prague, Czech Republic, 25–27 October 2004. [Google Scholar]
- Rosenthal, A.; Israilevich, R.; Moy, R. Management of acute radiation dermatitis: A review of the literature and proposal for treatment algorithm. J. Am. Acad. Dermatol. 2019, 81, 558–567. [Google Scholar] [CrossRef] [PubMed]
- Lee, J.H.; Paull, T.T. Cellular functions of the protein kinase ATM and their relevance to human disease. Nat. Rev. Mol. Cell Biol. 2021, 22, 796–814. [Google Scholar] [CrossRef]
- Le Reun, E.; Bodgi, L.; Granzotto, A.; Sonzogni, L.; Ferlazzo, M.L.; Al-Choboq, J.; El-Nachef, L.; Restier-Verlet, J.; Berthel, E.; Devic, C.; et al. Quantitative correlations between radiosensitivity biomarkers show that the ATM protein kinase is strongly involved in the radiotoxicities observed after radiotherapy. Int. J. Mol. Sci. 2022, 23, 10434. [Google Scholar] [CrossRef]
- Sonzogni, L.; Granzotto, A.; Le Reun, E.; Al-Choboq, J.; Bourguignon, M.; Foray, N.; Bodgi, L. Prediction of radiotherapy toxicity: 20 years of COPERNIC radiosensitivity diagnosis procedure. Cancer-Radiothérapie 2024, 28, 435–441. [Google Scholar] [CrossRef]
- Berthel, E.; Pujo-Menjouet, L.; Le Reun, E.; Sonzogni, L.; Al-Choboq, J.; Chekroun, A.; Granzotto, A.; Devic, C.; Ferlazzo, M.L.; Pereira, S.; et al. Toward an early diagnosis for Alzheimer’s disease based on the perinuclear localization of the ATM protein. Cells 2023, 12, 1747. [Google Scholar] [CrossRef]
- Restier-Verlet, J.; Ferlazzo, M.L.; Granzotto, A.; Al-Choboq, J.; Bellemou, C.; Estavoyer, M.; Lecomte, F.; Bourguignon, M.; Pujo-Menjouet, L.; Foray, N. Accelerated aging effects observed in vitro after an exposure to gamma-rays delivered at very low and continuous dose-rate equivalent to 1–5 weeks in International Space Station. Cells 2024, 13, 1703. [Google Scholar] [CrossRef]
- Berthel, E.; Foray, N.; Ferlazzo, M.L. The Nucleoshuttling of the ATM Protein: A Unified Model to Describe the Individual Response to High- and Low-Dose of Radiation? Cancers 2019, 11, 905. [Google Scholar] [CrossRef]
- El-Nachef, L.; Al-Choboq, J.; Restier-Verlet, J.; Granzotto, A.; Berthel, E.; Sonzogni, L.; Ferlazzo, M.L.; Bouchet, A.; Leblond, P.; Combemale, P.; et al. Human Radiosensitivity and Radiosusceptibility: What Are the Differences? Int. J. Mol. Sci. 2021, 22, 7158. [Google Scholar] [CrossRef]
- Combemale, P.; Sonzogni, L.; Devic, C.; Bencokova, Z.; Ferlazzo, M.L.; Granzotto, A.; Burlet, S.F.; Pinson, S.; Amini-Adle, M.; Al-Choboq, J.; et al. Individual Response to Radiation of Individuals with Neurofibromatosis Type I: Role of the ATM Protein and Influence of Statins and Bisphosphonates. Mol. Neurobiol. 2022, 59, 556–573. [Google Scholar] [CrossRef]
- Granzotto, A.; El Nachef, L.; Restier-Verlet, J.; Sonzogni, L.; Al-Choboq, J.; Bourguignon, M.; Foray, N. When Chromatin Decondensation Affects Nuclear gammaH2AX Foci Pattern and Kinetics and Biases the Assessment of DNA Double-Strand Breaks by Immunofluorescence. Biomolecules 2024, 14, 703. [Google Scholar] [CrossRef] [PubMed]
- Belkacemi, Y.; Rat, P.; Piel, G.; Christen, M.O.; Touboul, E.; Warnet, J.M. Lens epithelial cell protection by aminothiol WR-1065 and anetholedithiolethione from ionizing radiation. Int. J. Cancer 2001, 96 (Suppl. S1), 15–26. [Google Scholar] [CrossRef] [PubMed]
- Dringen, R.; Hamprecht, B.; Drukarch, B. Anethole dithiolethione, a putative neuroprotectant, increases intracellular and extracellular glutathione levels during starvation of cultured astroglial cells. Naunyn-Schmiedeberg’s Arch. Pharmacol. 1998, 358, 616–622. [Google Scholar] [CrossRef] [PubMed]
- Drukarch, B.; Schepens, E.; Stoof, J.C.; Langeveld, C.H. Anethole dithiolethione prevents oxidative damage in glutathione-depleted astrocytes. Eur. J. Pharmacol. 1997, 329, 259–262. [Google Scholar] [CrossRef]
- Kacprzyk, A.; Kanclerz, G.; Rokita, E.; Taton, G. Which sources of electromagnetic field are of the highest concern for electrosensitive individuals?—Questionnaire study with a literature review. Electromagn. Biol. Med. 2021, 40, 33–40. [Google Scholar] [CrossRef]
- Szemerszky, R.; Gubanyi, M.; Arvai, D.; Domotor, Z.; Koteles, F. Is There a Connection Between Electrosensitivity and Electrosensibility? A Replication Study. Int. J. Behav. Med. 2015, 22, 755–763. [Google Scholar] [CrossRef]
- Taton, G.; Kacprzyk, A.; Rok, T.; Pytlarz, M.; Pawlak, R.; Rokita, E. A survey on electromagnetic hypersensitivity: The example from Poland. Electromagn. Biol. Med. 2022, 41, 52–59. [Google Scholar] [CrossRef]
- Karpen, S.C. The Social Psychology of Biased Self-Assessment. Am. J. Pharm. Educ. 2018, 82, 6299. [Google Scholar] [CrossRef]
- Crowne, D.P.; Marlowe, D. A new scale of social desirability independent of psychopathology. J. Consult. Psychol. 1960, 24, 349–354. [Google Scholar] [CrossRef]
- Ma, W.; Zhou, S. Metabolic Rewiring in the Face of Genomic Assault: Integrating DNA Damage Response and Cellular Metabolism. Biomolecules 2025, 15, 168. [Google Scholar] [CrossRef]
- Grote, S.J.; Joshi, G.P.; Revell, S.H.; Shaw, C.A. Observations of radiation-induced chromosome fragment loss in live mammalian cells in culture, and its effect on colony-forming ability. Int. J. Radiat. Biol. Relat. Stud. Phys. Chem. Med. 1981, 39, 395–408. [Google Scholar] [CrossRef] [PubMed]
- Iliakis, G. The role of DNA double strand breaks in ionizing radiation-induced killing of eukaryotic cells. BioEssays 1991, 13, 641–648. [Google Scholar] [PubMed]
- Lai, H. Genetic effects of non-ionizing electromagnetic fields. Electromagn. Biol. Med. 2021, 40, 264–273. [Google Scholar] [CrossRef] [PubMed]
- De Luca, C.; Thai, J.C.; Raskovic, D.; Cesareo, E.; Caccamo, D.; Trukhanov, A.; Korkina, L. Metabolic and genetic screening of electromagnetic hypersensitive subjects as a feasible tool for diagnostics and intervention. Mediat. Inflamm. 2014, 2014, 924184. [Google Scholar] [CrossRef]
- Belpomme, D.; Irigaray, P. Why electrohypersensitivity and related symptoms are caused by non-ionizing man-made electromagnetic fields: An overview and medical assessment. Environ. Res. 2022, 212, 113374. [Google Scholar] [CrossRef]
- Viau, M.; Sonzogni, L.; Ferlazzo, M.L.; Berthel, E.; Pereira, S.; Bodgi, L.; Granzotto, A.; Devic, C.; Fervers, B.; Charlet, L.; et al. DNA Double-Strand Breaks Induced in Human Cells by Twelve Metallic Species: Quantitative Inter-Comparisons and Influence of the ATM Protein. Biomolecules 2021, 11, 1462. [Google Scholar] [CrossRef]
- Sonzogni, L.; Ferlazzo, M.L.; Granzotto, A.; Fervers, B.; Charlet, L.; Foray, N. DNA Double-Strand Breaks Induced in Human Cells by 6 Current Pesticides: Intercomparisons and Influence of the ATM Protein. Biomolecules 2022, 12, 250. [Google Scholar] [CrossRef]
- Cornforth, M.N.; Bedford, J.S. A quantitative comparison of potentially lethal damage repair and the rejoining of interphase chromosome breaks in low passage normal human fibroblasts. Radiat. Res. 1987, 111, 385–405. [Google Scholar] [CrossRef]
- Taylor, A.M.; Byrd, P.J.; McConville, C.M.; Thacker, S. Genetic and cellular features of ataxia telangiectasia. Int. J. Radiat. Biol. 1994, 65, 65–70. [Google Scholar] [CrossRef]
- El Nachef, L.; Berthel, E.; Ferlazzo, M.L.; Le Reun, E.; Al-Choboq, J.; Restier-Verlet, J.; Granzotto, A.; Sonzogni, L.; Bourguignon, M.; Foray, N. Cancer and Radiosensitivity Syndromes: Is Impaired Nuclear ATM Kinase Activity the Primum Movens? Cancers 2022, 14, 6141. [Google Scholar] [CrossRef]
- Orlacchio, R.; Le Page, Y.; Le Drean, Y.; Le Guevel, R.; Sauleau, R.; Alekseev, S.; Zhadobov, M. Millimeter-wave pulsed heating in vitro: Cell mortality and heat shock response. Sci. Rep. 2019, 9, 15249. [Google Scholar] [CrossRef] [PubMed]
- Le Quement, C.; Nicolas Nicolaz, C.; Zhadobov, M.; Desmots, F.; Sauleau, R.; Aubry, M.; Michel, D.; Le Drean, Y. Whole-genome expression analysis in primary human keratinocyte cell cultures exposed to 60 GHz radiation. Bioelectromagnetics 2012, 33, 147–158. [Google Scholar] [CrossRef]
- Sanford, E.J.; Smolka, M.B. A field guide to the proteomics of post-translational modifications in DNA repair. Proteomics 2022, 22, e2200064. [Google Scholar] [CrossRef] [PubMed]
- Damm, M.; Nusshold, C.; Cantillo, D.; Rechberger, G.N.; Gruber, K.; Sattler, W.; Kappe, C.O. Can electromagnetic fields influence the structure and enzymatic digest of proteins? A critical evaluation of microwave-assisted proteomics protocols. J. Proteom. 2012, 75, 5533–5543. [Google Scholar] [CrossRef] [PubMed]
- Zhen, C.; Zhang, G.; Wang, S.; Wang, J.; Fang, Y.; Shang, P. Electromagnetic fields regulate iron metabolism in living organisms: A review of effects and mechanism. Prog. Biophys. Mol. Biol. 2024, 188, 43–54. [Google Scholar] [CrossRef]
- Restier-Verlet, J.; Joubert, A.; Ferlazzo, M.L.; Granzotto, A.; Sonzogni, L.; Al-Choboq, J.; El Nachef, L.; Le Reun, E.; Bourguignon, M.; Foray, N. X-rays-Induced Bystander Effect Consists in the Formation of DNA Breaks in a Calcium-Dependent Manner: Influence of the Experimental Procedure and the Individual Factor. Biomolecules 2023, 13, 542. [Google Scholar] [CrossRef]


| Average C Intensity | Average D Intensity | D/C Ratio | NR * (%) | LBHR * Matching (%) | HBLR * Matching (%) | |
|---|---|---|---|---|---|---|
| Eyes | 1.16 | 2.62 | 2.25 | 48 | 40 | 12 |
| Respiratory system | 1.11 | 2.08 | 1.87 | 48 | 44 | 8 |
| Muscles and cartilages | 1.48 | 3.44 | 2.32 | 48 | 44 | 8 |
| Cardiac system | 1.00 | 3.32 | 3.32 | 36 | 48 | 16 |
| Digestive system | 1.46 | 2.88 | 1.97 | 32 | 60 | 8 |
| Fatigue, sleep disorders | 2.00 | 4.16 | 2.08 | 32 | 32 | 36 |
| Mood instability nervousness | 1.26 | 3.20 | 2.54 | 28 | 40 | 32 |
| Intellectual activity | 1.50 | 4.04 | 2.69 | 24 | 36 | 40 |
| Headaches, tinnitus | 1.23 | 4.40 | 3.57 | 28 | 48 | 24 |
| Skin | 0.77 | 2.84 | 3.68 | 40 | 56 | 4 |
| Genito-urinary system | 0.88 | 2.00 | 2.27 | 52 | 40 | 8 |
| Organ/ Donor | Eyes | Respiratory Sys. | Muscles | Cardiac Sys. | Digestive Sys. | Sleep Disorder | Mood Instability | Intellect. Activity | Headaches, Tinnitus | Skin | Genital Sys. | NR * (%) | LBHR *(%) | HBLR *(%) | Subset 1′/2′ | Subset 1/2 |
|---|---|---|---|---|---|---|---|---|---|---|---|---|---|---|---|---|
| 1 | 18.1 | 45.4 | 36.3 | 45.4 | ||||||||||||
| 2 | 81.8 | 9.1 | 9.1 | 81.8 | ||||||||||||
| 3 | 9.1 | 0 | 81.8 | 81.8 | ||||||||||||
| 4 | 63.6 | 36.3 | 0 | 63.6 | ||||||||||||
| 5 | 63.6 | 18.1 | 18.1 | 63.6 | ||||||||||||
| 6 | 45.4 | 36.3 | 18.1 | 45.4 | ||||||||||||
| 7 | 0 | 100 | 0 | 100 | ||||||||||||
| 8 | 72.7 | 27.2 | 0 | 72.7 | ||||||||||||
| 9 | 36.3 | 36.3 | 27.2 | 36.3 | ||||||||||||
| 10 | 18.1 | 45.4 | 36.3 | 45.4 | ||||||||||||
| 11 | 72.7 | 9.1 | 18.1 | 72.7 | ||||||||||||
| 12 | 0 | 9.1 | 91 | 91 | ||||||||||||
| 13 | 27.2 | 72.7 | 0 | 72.7 | ||||||||||||
| 14 | 0 | 72.7 | 27.2 | 72.7 | ||||||||||||
| 15 | 54.5 | 45.4 | 0 | 54.5 | ||||||||||||
| 16 | 27.2 | 72.7 | 0 | 72.7 | ||||||||||||
| 17 | 27.2 | 81.8 | 0 | 81.8 | ||||||||||||
| 18 | 36.3 | 0 | 63.6 | 63.6 | ||||||||||||
| 19 | 9 | 91 | 0 | 91 | ||||||||||||
| 20 | 72.7 | 9.1 | 18.1 | 72.7 | ||||||||||||
| 21 | 27.2 | 63.6 | 9.1 | 63.6 | ||||||||||||
| 22 | 63.6 | 27.2 | 9.1 | 63.6 | ||||||||||||
| 23 | 91 | 0 | 9.1 | 91 | ||||||||||||
| 24 | ||||||||||||||||
| 25 | 18.1 | 36.3 | 45.4 | 45.4 | ||||||||||||
| 26 | 18.1 | 36.3 | 45.4 | 45.4 |
| 2 Gy + 10 min | 2 Gy + 24 h | |
|---|---|---|
| COPERNIC Group I (controls) [40] | 79.0 ± 4.0 | 0 ± 1 |
| DEMETER | 38.4 ± 1.1 | 1.68 ± 0.14 |
| DEMETER Subset 1 (LBHR) | 37.8 ± 2.2 | 1.52 ± 0.24 |
| DEMETER Subset 2 (HBLR) | 38.7 ± 1.1 | 1.80 ± 0.17 |
| DEMETER Subset A (LBHR) | 39.5 ± 1.6 | 1.36 ± 0.14 |
| DEMETER Subset B (HBLR) | 36.4 ± 0.3 | 2.19 ± 0.23 |
| COPERNIC Group II [40] | 15–60 | 0–8 |
| COPERNIC Group IIIa [40] | 6.4 ± 3.2 | 0 ± 1 |
| COPERNIC Group IIIb [40] | 78.0 ± 2.0 | 36.6 ± 4.2 |
| 2 Gy + 10 min | 2 Gy + 24 h | |
|---|---|---|
| COPERNIC Group I (controls) [40] | 40.2 ± 2.2 | 0 ± 1 |
| DEMETER | 23.9 ± 1.0 | 2.30 ± 0.18 |
| DEMETER Subset 1 (LBHR) | 21.9 ± 1.6 | 2.02 ± 0.22 |
| DEMETER Subset 2 (HBLR) | 24.9 ± 1.4 | 2.05 ± 0.27 |
| DEMETER Subset A (LBHR) | 23.5 ± 1.4 | 2.00 ± 0.40 |
| DEMETER Subset B (HBLR) | 24.7 ± 1.2 | 2.86 ± 0.45 |
| COPERNIC Group II [40] | 8–30 | 0–4 |
| COPERNIC Group IIIa [40] | 3.2 ± 2.8 | 0 ± 1 |
| COPERNIC Group IIIb [40] | 39.2 ± 3.0 | 17.4 ± 4.2 |
| 2 Gy + 1 h/4 h | 2 Gy + 24 h | |
|---|---|---|
| COPERNIC Group I (controls) [45] | 5–7 | 0 ± 0 |
| DEMETER | 5.52 ±.0.56/4.0 ± 0.45 | 0.47 ± 0.19 |
| DEMETER Subset 1 (LBHR) | 5.88 ± 0.67/3.22 ± 0.76 | 0.18 ± 0.18 |
| DEMETER Subset 2 (HBLR) | 5.25 ± 0.87/4.58 ± 0.51 | 0.66 ± 0.28 |
| DEMETER Subset A (LBHR) | 6.2 ± 0.57/3.8 ± 0.51 | 0 ± 0 |
| DEMETER Subset B (HBLR) | 3.66 ± 1.1/4.5 ± 1.11 | 1.66 ± 0.33 |
| COPERNIC Group II [45] | 5–12/5–0 | 0–5 |
| COPERNIC Group IIIa [45] | Impaired MRE11 foci | Impaired MRE11 foci |
| COPERNIC Group IIIb [45] | Impaired MRE11 foci | Impaired MRE11 foci |
| Parameter a * | Parameter b * in μM | Correlation Coefficient r | |
|---|---|---|---|
| COPERNIC Group I (controls) | 0 | 0 | 1 |
| COPERNIC Group II | 22.8 ± 1.7 | 139 ±38 | 0.995 |
| DEMETER 22 (subset A) | 29.1 ± 2.8 | 27 ± 13 | 0.984 |
| DEMETER 14 (subset B) | 58.0 ± 8.1 | 167 ± 83 | 0.982 |
| DEMETER 15 (subset B) | 66.1 ± 4.8 | 110 ± 29 | 0.994 |
| DEMETER 17 (subset B) | 99.3 ± 6.0 | 240 ± 48 | 0.998 |
| DEMETER 23 (subset B) | 80.8 ± 39.6 | 618 ± 125 | 0.973 |
| DEMETER 25 (subset B) | 113.0 ± 26.3 | 144 ± 69 | 0.945 |
| Donor | Sex | Subsets 1/2 from Part A | Subset 1′/2′ from Parts C and D | Subset A/B from Spontaneous Data | Subset A/B from MRE11 Data | Matching * Subsets 1/2 vs. 1′/2′ | Matching ** Spontaneous vs. MRE11 Data | Matching *** Subsets1/2 vs. A/B |
|---|---|---|---|---|---|---|---|---|
| 01 | M | 0% | 100% | 50% | ||||
| 02 | M | 50% | 100% | 50% | ||||
| 03 | M | 100% | 100% | 50% | ||||
| 04 | F | 50% | 50% | 50% | ||||
| 05 | F | 50% | 100% | 75% | ||||
| 06 | F | 50% | 50% | 0% | ||||
| 07 | F | 0% | 100% | 75% | ||||
| 08 | M | 50% | 100% | 75% | ||||
| 09 | M | 100% | 100% | 100% | ||||
| 10 | F | 0% | 100% | 75% | ||||
| 11 | F | 50% | 100% | 75% | ||||
| 12 | F | 100% | 100% | 50% | ||||
| 13 | F | 0% | 100% | 50% | ||||
| 14 | F | 0% | 100% | 100% | ||||
| 15 | F | 50% | 50% | 0% | ||||
| 16 | F | 100% | 100% | 75% | ||||
| 17 | F | 0% | 50% | 75% | ||||
| 18 | F | 0% | 100% | 75% | ||||
| 19 | F | 0% | 100% | 75% | ||||
| 20 | F | 50% | 100% | 75% | ||||
| 21 | F | 0% | 100% | 100% | ||||
| 22 | F | 50% | 100% | 75% | ||||
| 23 | M | 50% | 100% | 50% | ||||
| 24 | F | nc | 100% | nc | ||||
| 25 | F | 0% | 100% | 50% | ||||
| 26 | F | 100% | 100% | 75% | ||||
| Mean | 40% | 92.3% | 64% |
| Data Source | Endpoint | LBHR Phenotype | HBLR Phenotype |
|---|---|---|---|
| Questionnaire data | Part A | Subset 1: LB if IA5,A6,A7 < 2.48 HR if Iaverage (UHF) − IA5,A6,A7 = 2.7 | Subset 2: HB if IA5,A6,A7 ≥ 2.48 LR if Iaverage (UHF) − IA5,A6,A7 = 0.15 |
| Part B | No particular sensitivity to other chemical or physical agents than EMF sources | Sensitivity to other chemical or physical agents than EMF sources Link to immunodeficiency? | |
| Part P | 28.6% LBHR donors mentioned ongoing treatment and/or medical history | 71.4% HBLR donors mentioned ongoing treatment and/or medical history | |
| Part C,D | Subset 1′: matched with subset 1 at 40% impairment of cardiac and digestive systems, mood instability, nervousness, headaches, tinnitus and skin reactions | Subset 2′: matched with subset 2 at 40% fatigue, sleep disorders and the decrease of the intellectual capacity | |
| Biological data | Spontaneous γH2AX and MN | Subset A: <2 γH2AX foci per cell Subset B: <5 MN per 100 cells matched with subset 2 at 64% | Subset A’: ≥2 γH2AX foci per cell Subset B’: ≥5 MN per 100 cells matched with subset 2 at 64% |
| Perinuclear pATM crowns | No perinuclear pATM crowns at high culture passages | Perinuclear pATM crowns at high culture passages | |
| X-rays-induced γH2AX foci kinetics | Delayed RIANS | Delayed RIANS | |
| X-rays-induced pATM foci kinetics | Delayed RIANS | Delayed RIANS | |
| X-rays-induced MRE11 foci kinetics | Early MRE11 foci (high risk of cancer) | Late MRE11 foci (high risk of accelerated aging) | |
| H2O2-induced γH2AX foci | Low yield of HDC | High yield of HDC |
Disclaimer/Publisher’s Note: The statements, opinions and data contained in all publications are solely those of the individual author(s) and contributor(s) and not of MDPI and/or the editor(s). MDPI and/or the editor(s) disclaim responsibility for any injury to people or property resulting from any ideas, methods, instructions or products referred to in the content. |
© 2025 by the authors. Licensee MDPI, Basel, Switzerland. This article is an open access article distributed under the terms and conditions of the Creative Commons Attribution (CC BY) license (https://creativecommons.org/licenses/by/4.0/).
Share and Cite
Sonzogni, L.; Al-Choboq, J.; Combemale, P.; Massardier-Pilonchéry, A.; Bouchet, A.; May, P.; Doré, J.-F.; Debouzy, J.-C.; Bourguignon, M.; Dréan, Y.L.; et al. Skin Fibroblasts from Individuals Self-Diagnosed as Electrosensitive Reveal Two Distinct Subsets with Delayed Nucleoshuttling of the ATM Protein in Common. Int. J. Mol. Sci. 2025, 26, 4792. https://doi.org/10.3390/ijms26104792
Sonzogni L, Al-Choboq J, Combemale P, Massardier-Pilonchéry A, Bouchet A, May P, Doré J-F, Debouzy J-C, Bourguignon M, Dréan YL, et al. Skin Fibroblasts from Individuals Self-Diagnosed as Electrosensitive Reveal Two Distinct Subsets with Delayed Nucleoshuttling of the ATM Protein in Common. International Journal of Molecular Sciences. 2025; 26(10):4792. https://doi.org/10.3390/ijms26104792
Chicago/Turabian StyleSonzogni, Laurène, Joëlle Al-Choboq, Patrick Combemale, Amélie Massardier-Pilonchéry, Audrey Bouchet, Philippe May, Jean-François Doré, Jean-Claude Debouzy, Michel Bourguignon, Yves Le Dréan, and et al. 2025. "Skin Fibroblasts from Individuals Self-Diagnosed as Electrosensitive Reveal Two Distinct Subsets with Delayed Nucleoshuttling of the ATM Protein in Common" International Journal of Molecular Sciences 26, no. 10: 4792. https://doi.org/10.3390/ijms26104792
APA StyleSonzogni, L., Al-Choboq, J., Combemale, P., Massardier-Pilonchéry, A., Bouchet, A., May, P., Doré, J.-F., Debouzy, J.-C., Bourguignon, M., Dréan, Y. L., & Foray, N. (2025). Skin Fibroblasts from Individuals Self-Diagnosed as Electrosensitive Reveal Two Distinct Subsets with Delayed Nucleoshuttling of the ATM Protein in Common. International Journal of Molecular Sciences, 26(10), 4792. https://doi.org/10.3390/ijms26104792