
Multi-Omics Analysis of the Epigenetic Effects of Inflammation in Murine Type II Pneumocytes

 , , , , , and
Abstract
1. Introduction
2. Results
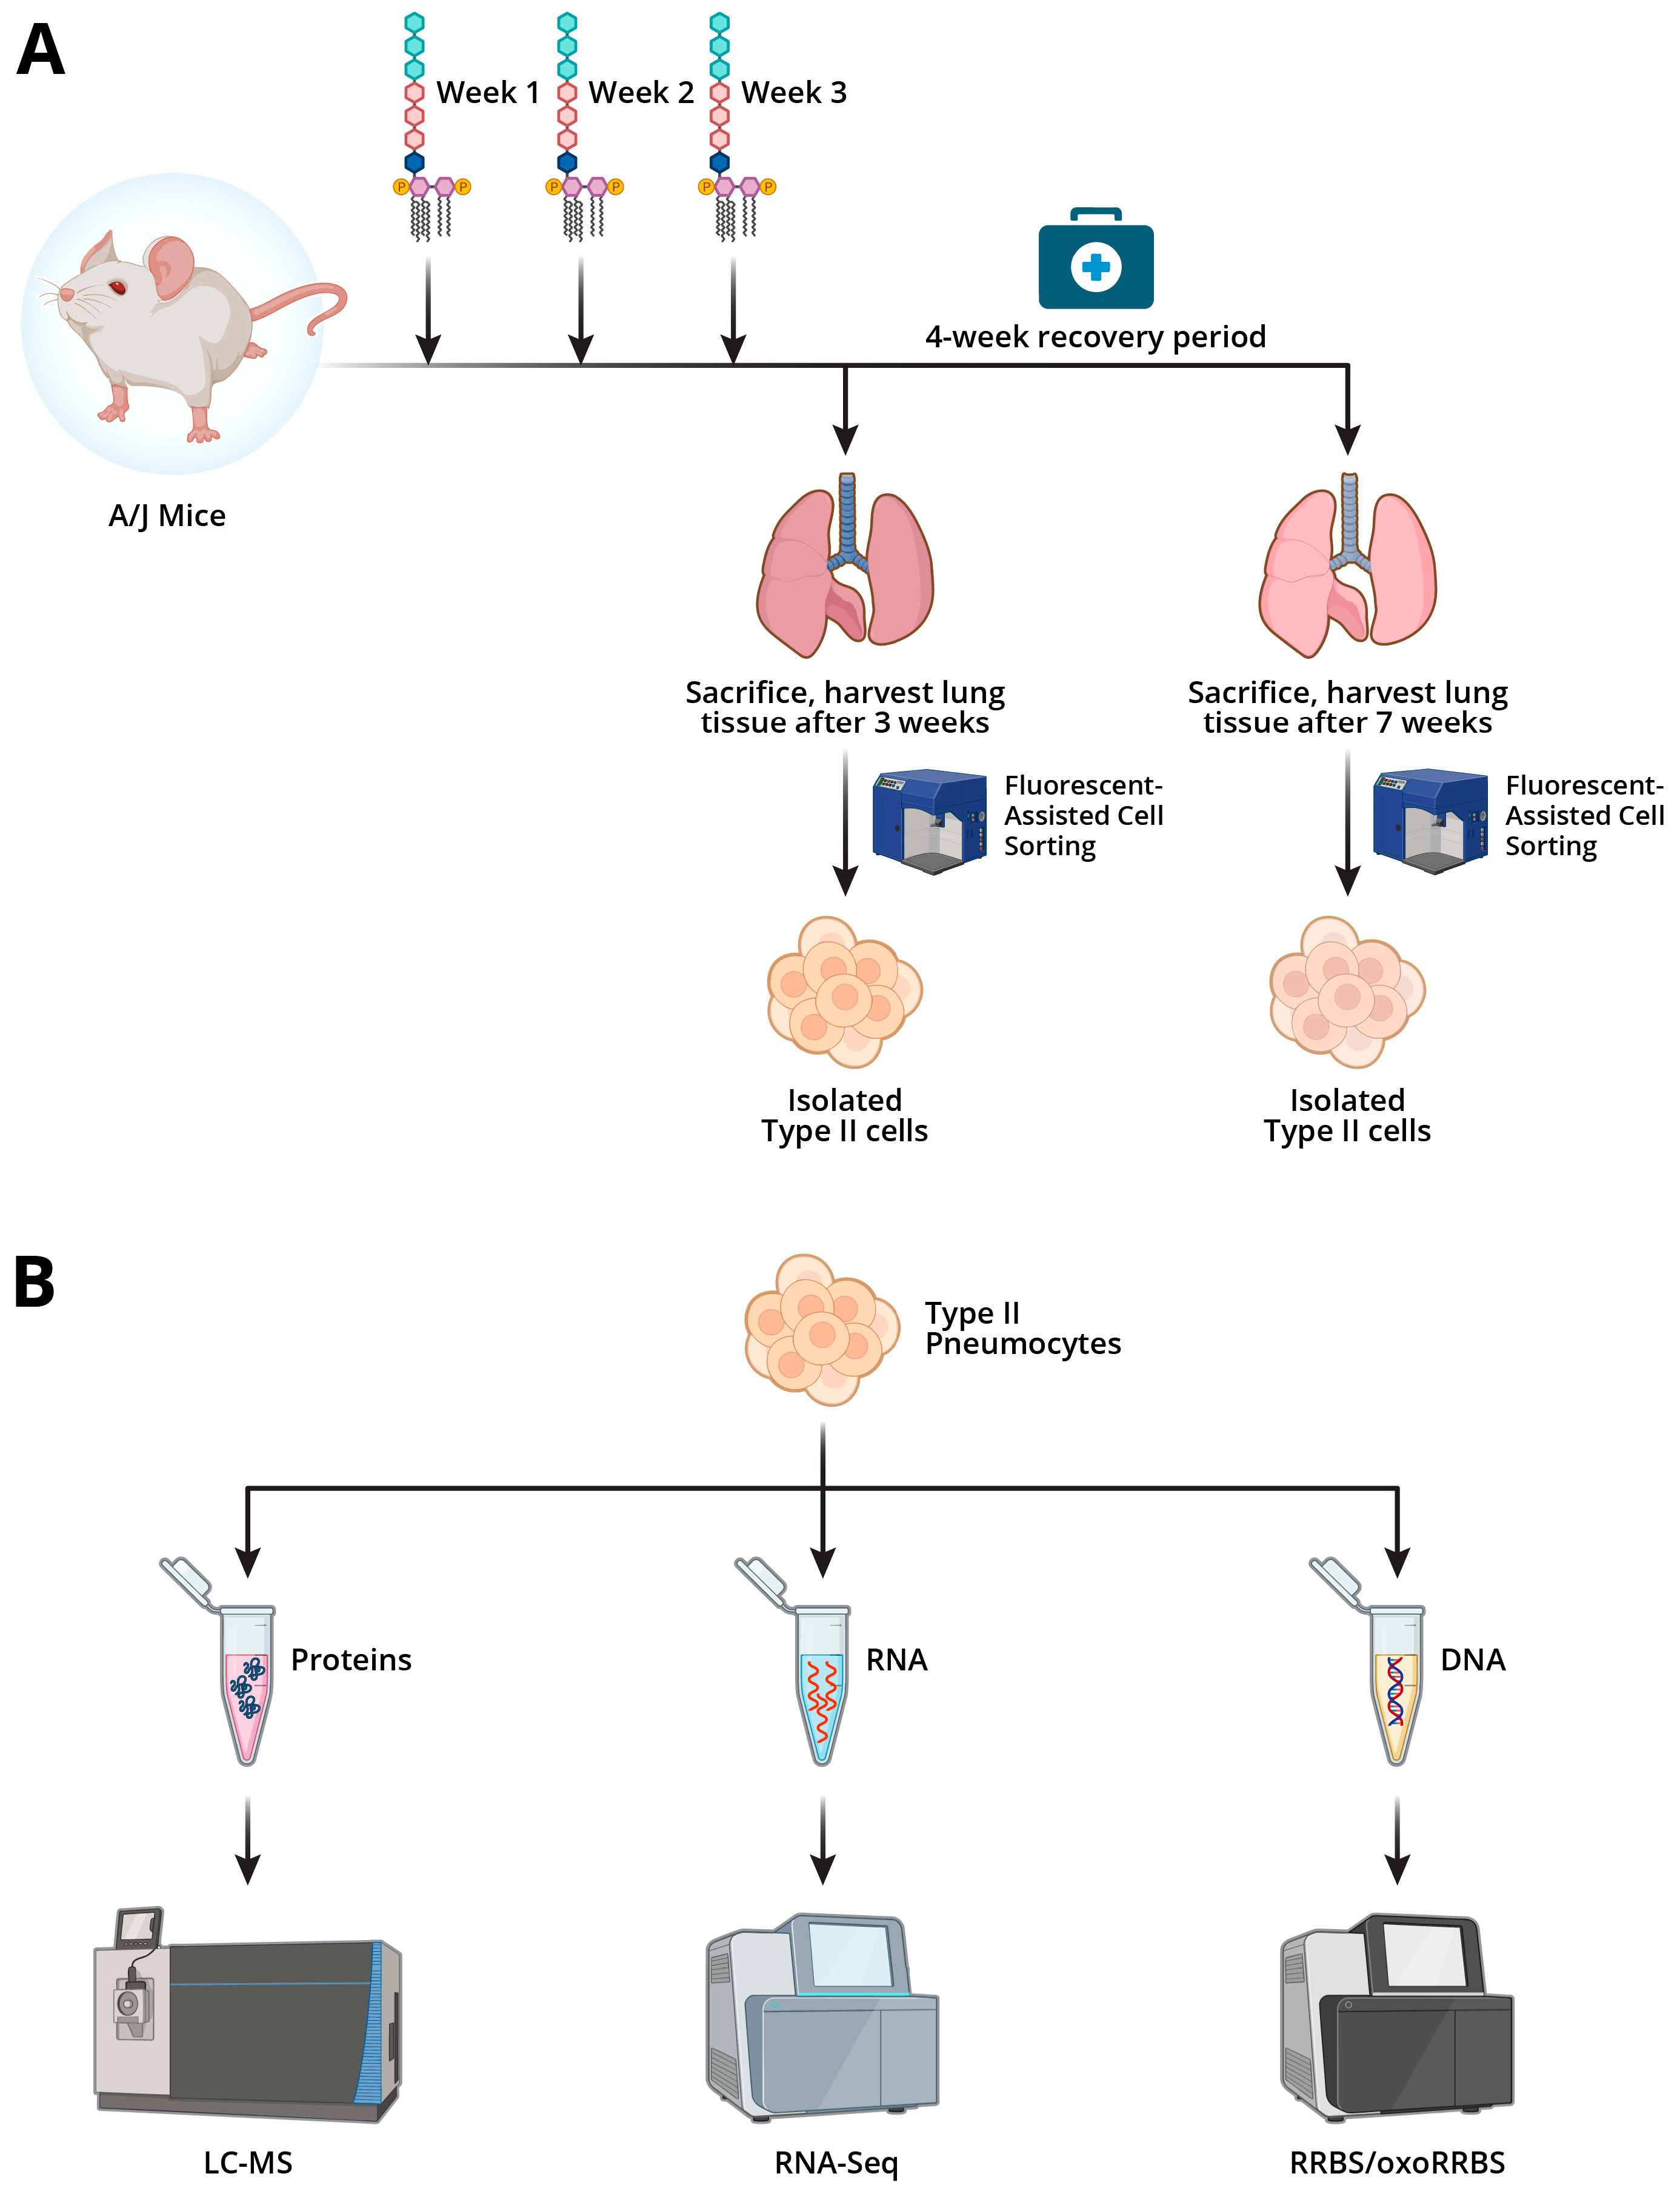
2.1. Animal Studies
2.1.1. Histopathological Examination of Lung Tissues
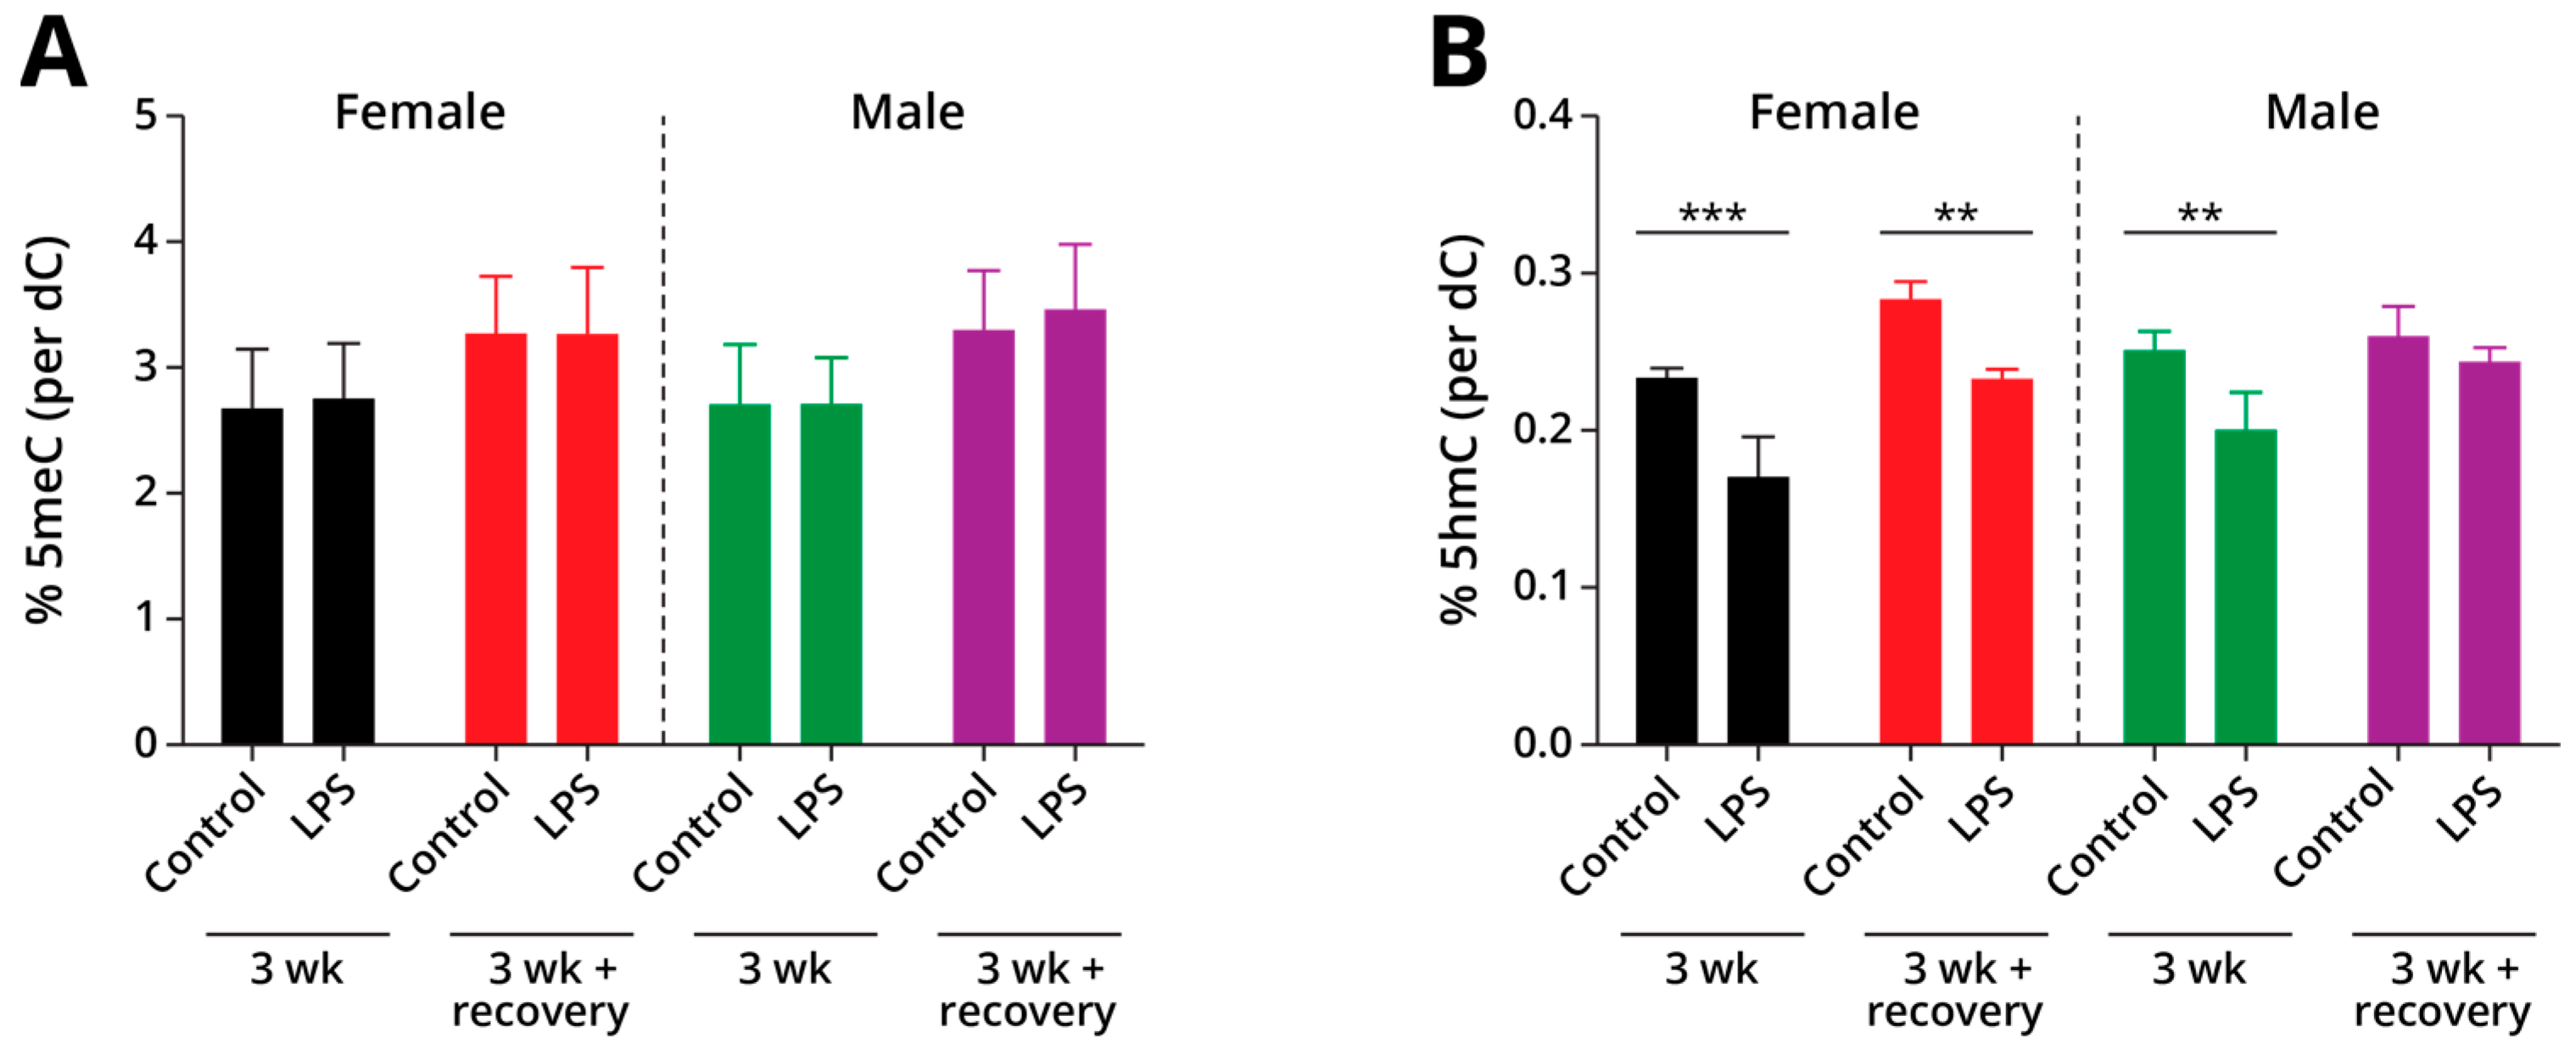
2.1.2. Global Changes in DNA Methylation and Hydroxymethylation in Type II Alveolar Cells
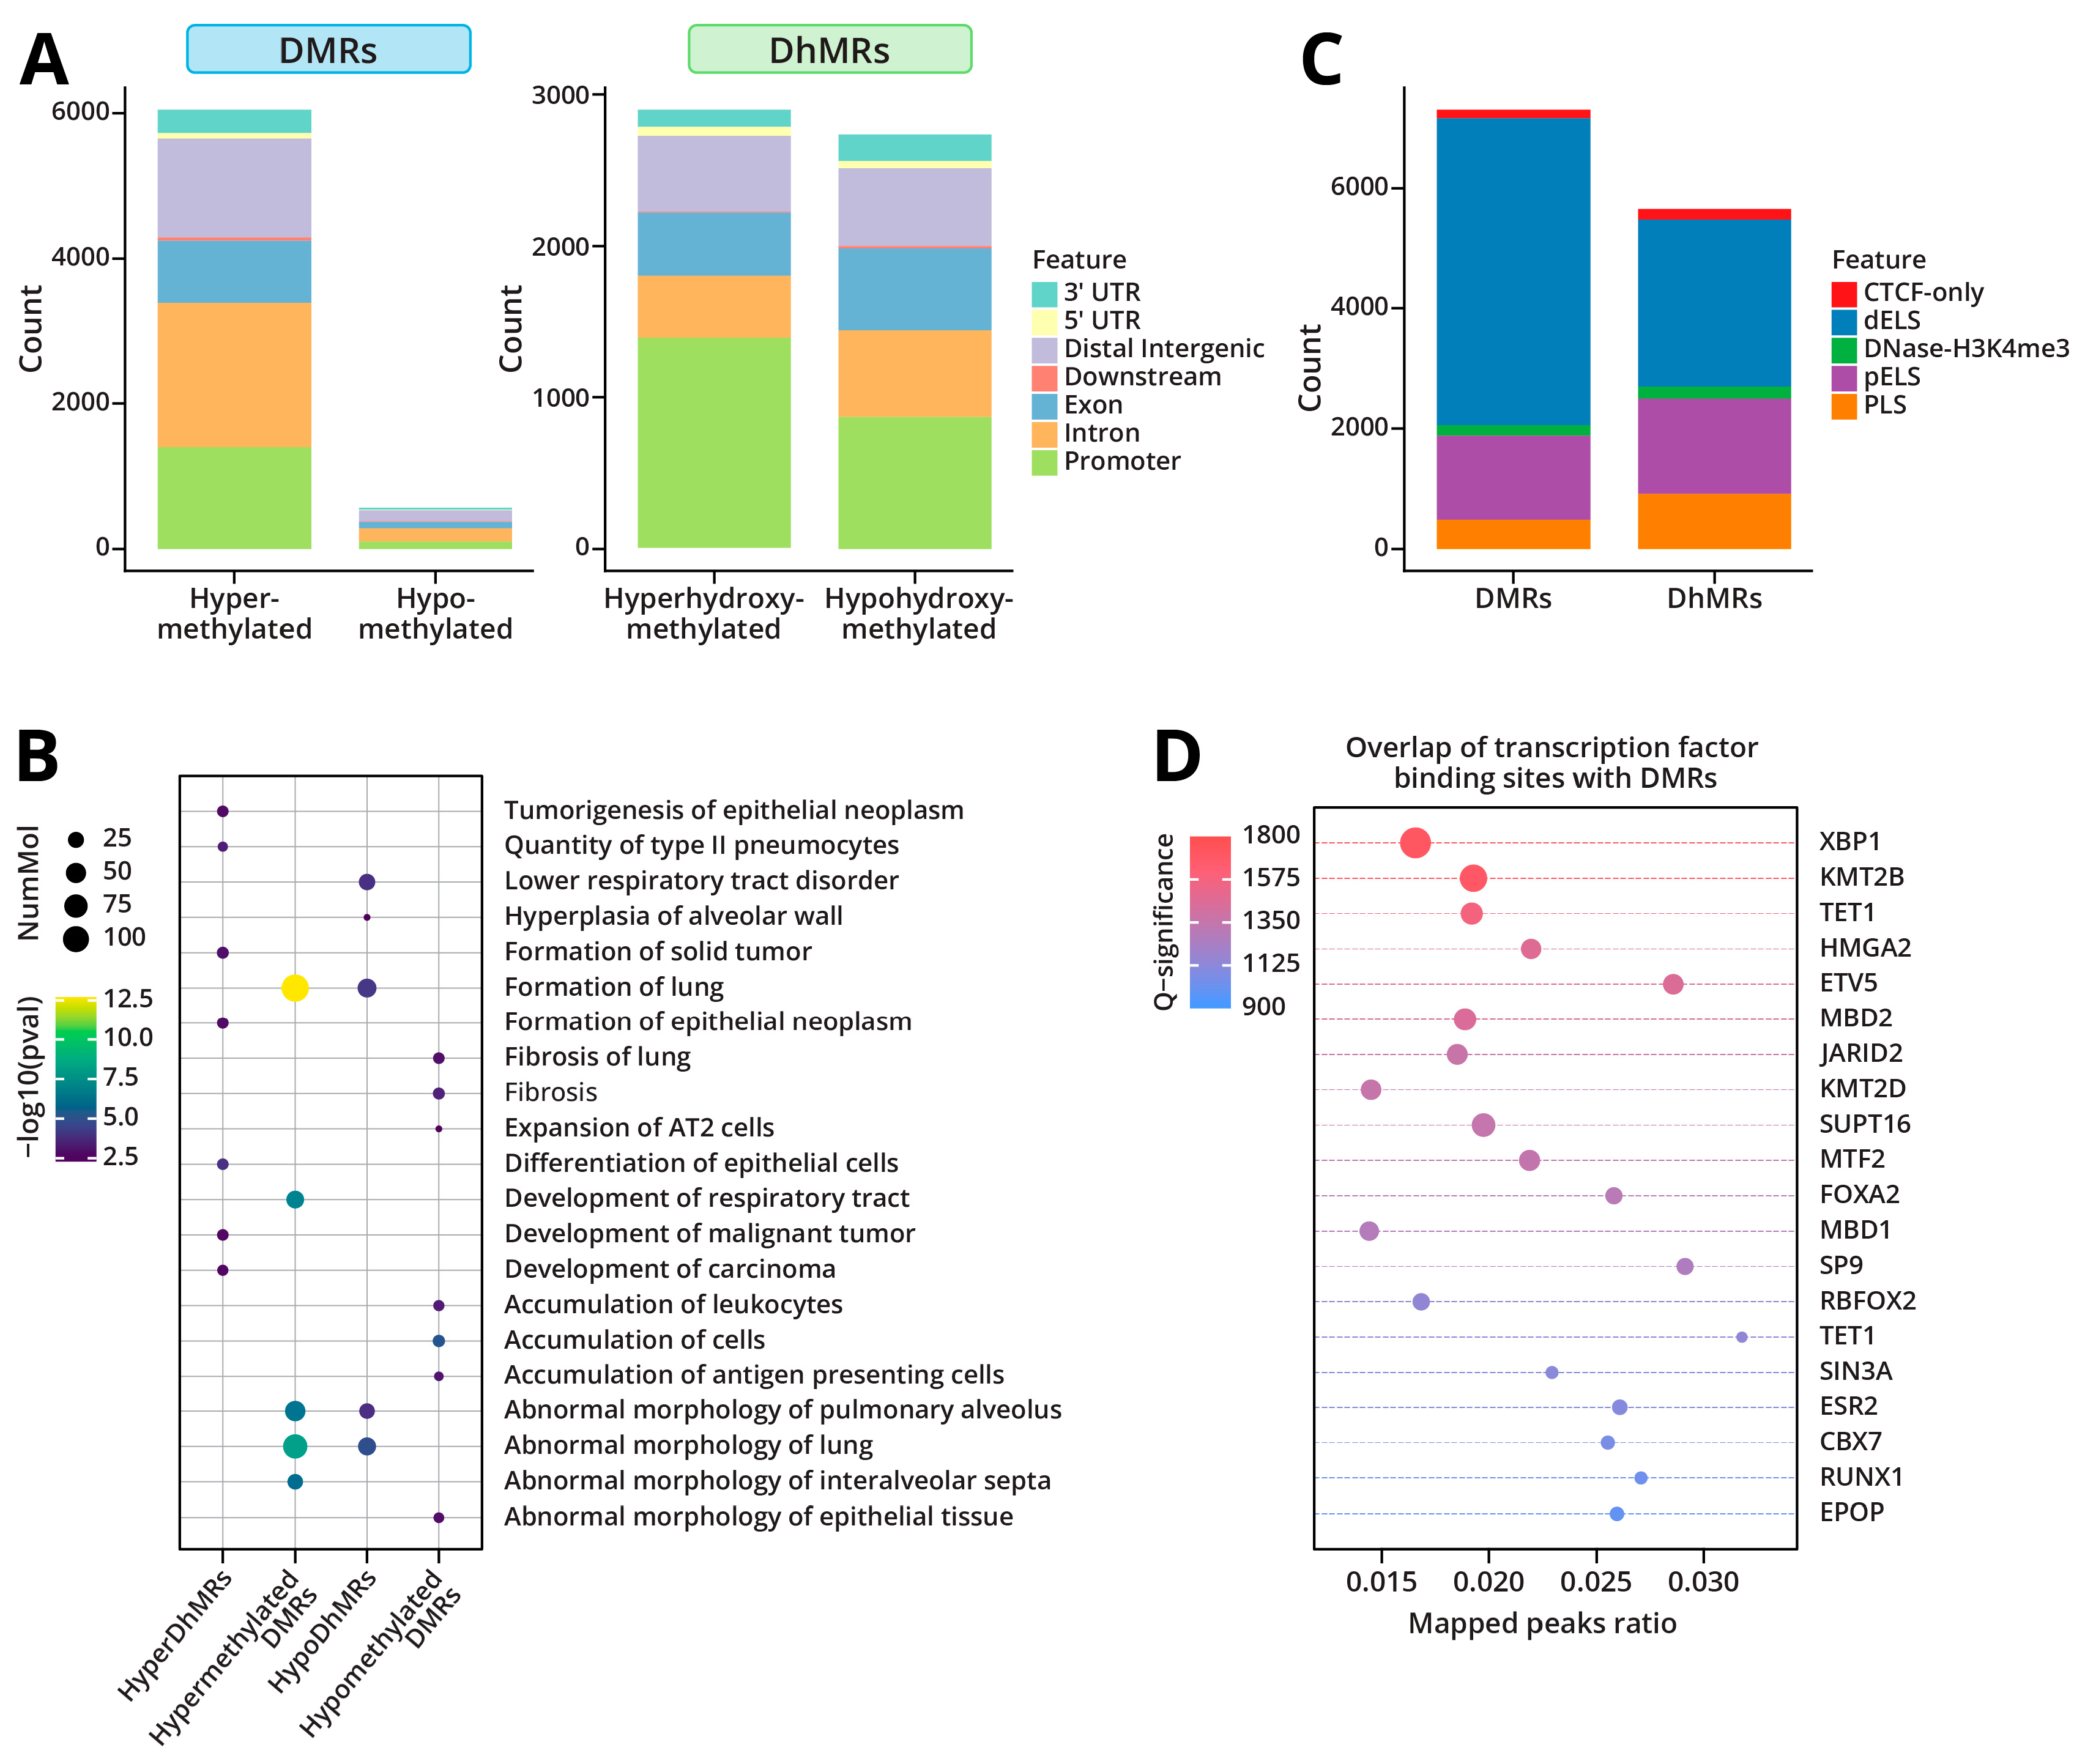
2.1.3. DNA Methylation and Hydroxymethylation Patterns
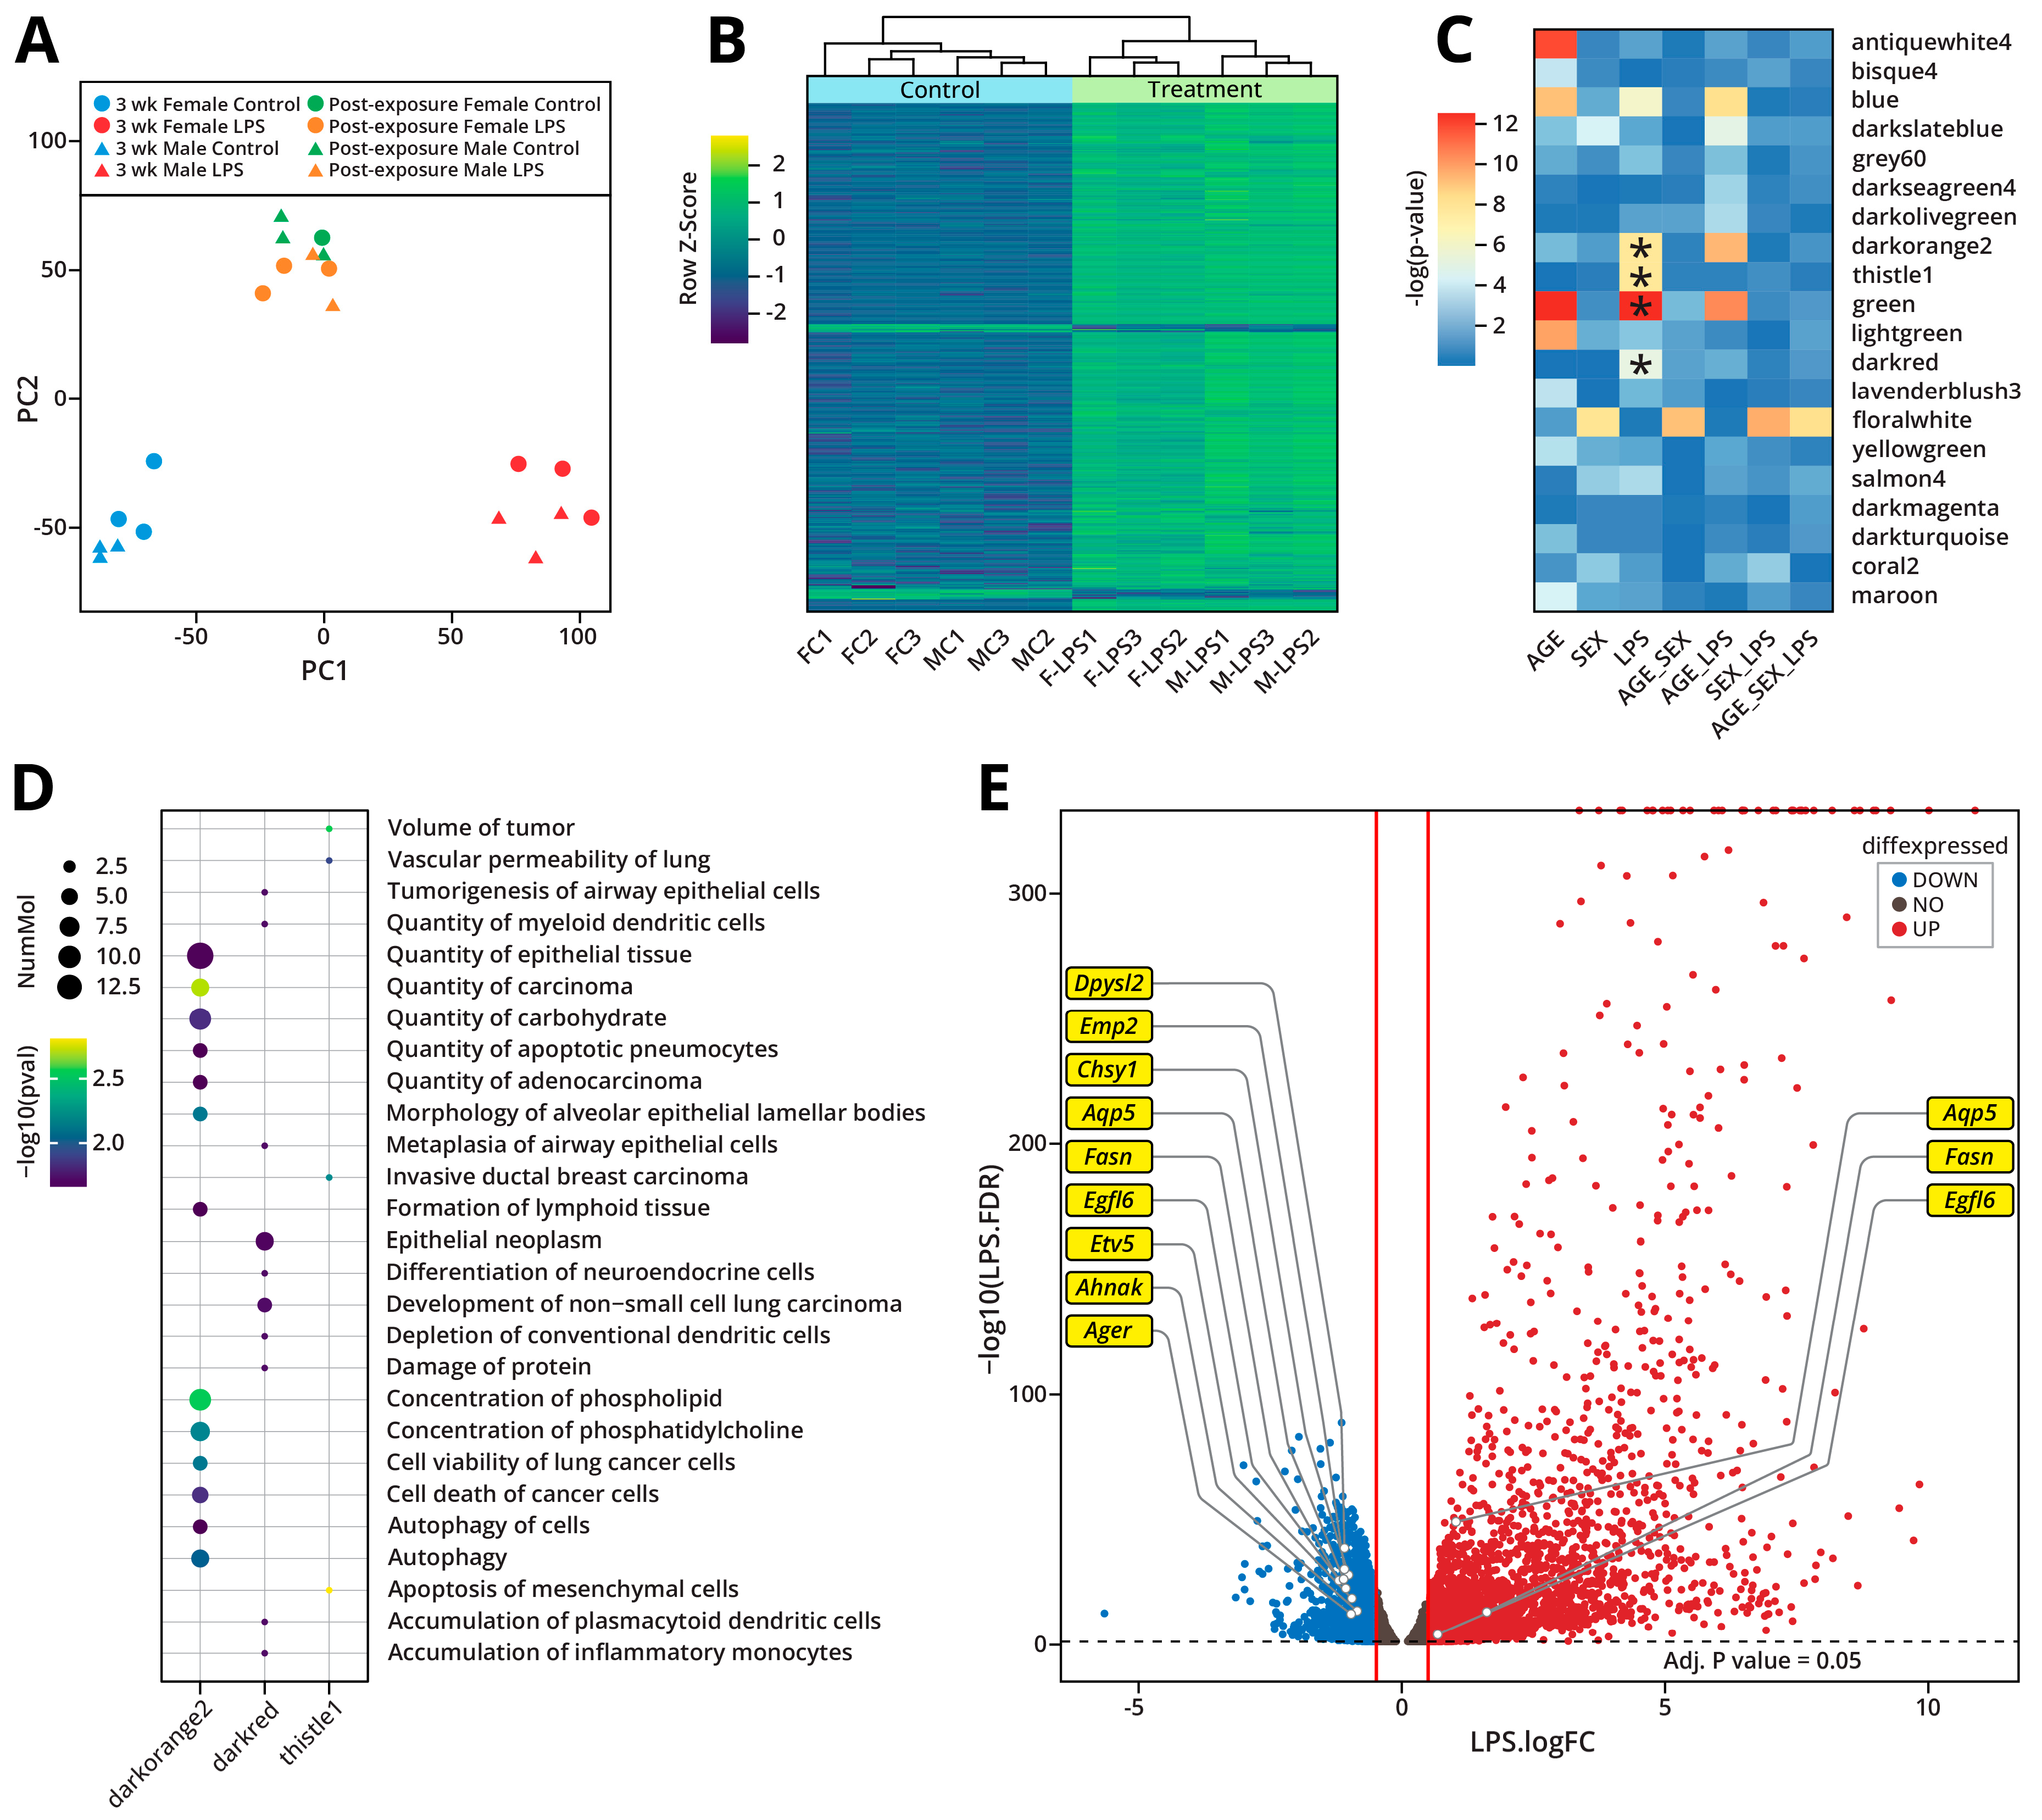
2.1.4. LPS-Induced Gene Expression Changes
2.1.5. LPS-Induced Global Changes in Protein Abundance
2.1.6. Integration of Proteomic and Transcriptomic Data
2.1.7. Integration of the Epigenomic and Transcriptomic Data
3. Discussion
4. Experimental Procedures
4.1. Materials
4.2. Animal Treatments
4.3. Treatment of Mice with LPS
4.4. Alveolar Type II Epithelial Cell Isolation
4.5. Extraction of DNA and RNA from Alveolar Type II Epithelial Cells
4.6. Extraction of Proteins from Alveolar Type II Epithelial Cells
4.7. Histopathology Examination
4.8. Reduced Representation Bisulfite Sequencing (RRBS) and Oxidative Reduced Representation Bisulfite Sequencing (Oxo-RRBS)
4.9. RRBS and Oxo-RRBS Read Handling
4.10. Methylation and Hydroxymethylation Analysis
4.11. DNA Digestion and Enrichment of mC and hmC
4.12. HPLC-ESI+-MS/MS Quantitation of Global Levels of mC and hmC
4.13. RNA-Seq Analysis of Alveolar Type II Epithelial Cell RNA
4.14. RNA-Seq Read Processing
4.15. Expression Quantification and Filtering
4.16. Differential Gene Expression Testing
4.17. Network Analysis
4.18. RNA-Seq Validation via qRT-PCR
4.19. Digestion of Proteins, Labeling, and Fractionation of Peptides
4.20. HPLC-ESI+-MS/MS Analysis of TMT Labeled Peptides
4.21. Global Proteomic Analyses
5. Conclusions
Supplementary Materials
Author Contributions
Funding
Institutional Review Board Statement
Informed Consent Statement
Data Availability Statement
Acknowledgments
Conflicts of Interest
Abbreviations
| AECII | Alveolar Type II epithelial cell |
| LPS | Lipopolysaccharide |
| oxo-RRBS | Oxidative reduced representation bisulfite sequencing |
| RRBS | Reduced Representation Bisulfite Sequencing |
References
- Gabay, C. Interleukin-6 and chronic inflammation. Arthritis Res. Ther. 2006, 8, S3. [Google Scholar] [CrossRef] [PubMed]
- Blasko, I.; Stampfer-Kountchev, M.; Robatscher, P.; Veerhuis, R.; Eikelenboom, P.; Grubeck-Loebenstein, B. How chronic inflammation can affect the brain and support the development of Alzheimer’s disease in old age: The role of microglia and astrocytes. Aging Cell 2004, 3, 169–176. [Google Scholar] [CrossRef] [PubMed]
- Zhang, C.; Hung, C.; Hsu, C. Epidemiology, symptoms and pathophysiology of long COVID complications. J. Cell Immunol. 2024, 6, 219–230. [Google Scholar] [CrossRef]
- Bartsch, H.; Nair, J. Chronic inflammation and oxidative stress in the genesis and perpetuation of cancer: Role of lipid peroxidation, DNA damage, and repair. Langenbecks Arch. Surg. 2006, 391, 499–510. [Google Scholar] [CrossRef]
- Wheelock, C.E.; Rappaport, S.M. The role of gene-environment interactions in lung disease: The urgent need for the exposome. Eur. Respir. J. 2020, 55, 1902064. [Google Scholar] [CrossRef]
- Lee, G.; Walser, T.C.; Dubinett, S.M. Chronic inflammation, chronic obstructive pulmonary disease, and lung cancer. Curr. Opin. Pulm. Med. 2009, 15, 303–307. [Google Scholar] [CrossRef]
- Russell, C.D.; Lone, N.I.; Baillie, J.K. Comorbidities, multimorbidity and COVID-19. Nat. Med. 2023, 29, 334–343. [Google Scholar] [CrossRef] [PubMed]
- Zhang, W.; Qin, C.; Fei, Y.; Shen, M.; Zhou, Y.; Zhang, Y.; Zeng, X.; Zhang, S. Anti-inflammatory and immune therapy in severe coronavirus disease 2019 (COVID-19) patients: An update. Clin. Immunol. 2022, 239, 109022. [Google Scholar] [CrossRef]
- Pauly, J.L.; Paszkiewicz, G. Cigarette smoke, bacteria, mold, microbial toxins, and chronic lung inflammation. J. Oncol. 2011, 2011, 819129. [Google Scholar] [CrossRef]
- Avila-Calderón, E.D.; Ruiz-Palma, M.D.S.; Aguilera-Arreola, M.G.; Velázquez-Guadarrama, N.; Ruiz, E.A.; Gomez-Lunar, Z.; Witonsky, S.; Contreras-Rodríguez, A. Outer membrane vesicles of gram-negative bacteria: An outlook on biogenesis. Front. Microbiol. 2021, 12, 557902. [Google Scholar] [CrossRef]
- Rietschel, E.T.; Kirikae, T.; Schade, F.U.; Mamat, U.; Schmidt, G.; Loppnow, H.; Ulmer, A.J.; Zähringer, U.; Seydel, U.; Di Padova, F.; et al. Bacterial endotoxin: Molecular relationships of structure to activity and function. FASEB J. 1994, 8, 217–225. [Google Scholar] [CrossRef] [PubMed]
- Raetz, C.R.; Whitfield, C. Lipopolysaccharide endotoxins. Annu. Rev. Biochem. 2002, 71, 635. [Google Scholar] [CrossRef] [PubMed]
- Kharitonov, S.A.; Sjöbring, U. Lipopolysaccharide challenge of humans as a model for chronic obstructive lung disease exacerbations. Contrib. Microbiol. 2007, 14, 83–100. [Google Scholar]
- Korsgren, M.; Linden, M.; Entwistle, N.; Cook, J.; Wollmer, P.; Andersson, M.; Larsson, B.; Greiff, L. Inhalation of LPS induces inflammatory airway responses mimicking characteristics of chronic obstructive pulmonary disease. Clin. Physiol. Funct. Imaging 2012, 32, 71–79. [Google Scholar] [CrossRef] [PubMed]
- Melkamu, T.; Qian, X.; Upadhyaya, P.; O’Sullivan, M.G.; Kassie, F. Lipopolysaccharide enhances mouse lung tumorigenesis: A model for inflammation-driven lung cancer. Vet. Pathol. 2013, 50, 895–902. [Google Scholar] [CrossRef]
- Seiler, C.L.; Song, J.M.; Fernandez, J.; Abrahante, J.E.; Kono, T.J.Y.; Chen, Y.; Ren, Y.; Kassie, F.; Tretyakova, N.Y. Epigenetic changes in alveolar type II lung cells of A/J mice following intranasal treatment with lipopolysaccharide. Chem. Res. Toxicol. 2019, 32, 831–839. [Google Scholar] [CrossRef]
- Greten, F.R.; Grivennikov, S.I. Inflammation and cancer: Triggers, mechanisms, and consequences. Immunity 2019, 51, 27–41. [Google Scholar] [CrossRef]
- Han, Q.; Kono, T.J.Y.; Knutson, C.G.; Parry, N.M.; Seiler, C.L.; Fox, J.G.; Tannenbaum, S.R.; Tretyakova, N.Y. Multi-omics characterization of inflammatory bowel disease-induced hyperplasia/dysplasia in the Rag2(-/-)/Il10(-/-) mouse model. Int. J. Mol. Sci. 2020, 22, 364. [Google Scholar] [CrossRef]
- Seiler, C.L.; Song, J.U.M.; Kotandeniya, D.; Chen, J.; Kono, T.J.Y.; Han, Q.; Colwell, M.; Auch, B.; Sarver, A.L.; Upadhyaya, P.; et al. Inhalation exposure to cigarette smoke and inflammatory agents induces epigenetic changes in the lung. Sci. Rep. 2020, 10, 11290. [Google Scholar] [CrossRef]
- Qian, X.; Khammanivong, A.; Song, J.M.; Teferi, F.; Upadhyaya, P.; Dickerson, E.; Kassie, F. RNA-sequencing studies identify genes differentially regulated during inflammation-driven lung tumorigenesis and targeted by chemopreventive agents. Inflamm. Res. 2015, 64, 343–361. [Google Scholar] [CrossRef]
- Belinsky, S.A. Gene-promoter hypermethylation as a biomarker in lung cancer. Nat. Rev. Cancer 2004, 4, 707–717. [Google Scholar] [CrossRef] [PubMed]
- Moldoveanu, B.; Otmishi, P.; Jani, P.; Walker, J.; Sarmiento, X.; Guardiola, J.; Saad, M.; Yu, J. Inflammatory mechanisms in the lung. J. Inflamm. Res. 2009, 2, 1–11. [Google Scholar]
- Hatziapostolou, M.; Iliopoulos, D. Epigenetic aberrations during oncogenesis. Cell Mol. Life Sci. 2011, 68, 1681–1702. [Google Scholar] [CrossRef]
- Moarii, M.; Boeva, V.; Vert, J.-P.; Reyal, F. Changes in correlation between promoter methylation and gene expression in cancer. BMC Genom. 2015, 16, 873. [Google Scholar] [CrossRef]
- Kaluscha, S.; Domcke, S.; Wirbelauer, C.; Stadler, M.B.; Durdu, S.; Burger, L.; Schubeler, D. Evidence that direct inhibition of transcription factor binding is the prevailing mode of gene and repeat repression by DNA methylation. Nat. Genet. 2022, 54, 1895–1906. [Google Scholar] [CrossRef]
- Hammal, F.; de Langen, P.; Bergon, A.; Lopez, F.; Ballester, B. ReMap 2022: A database of human, mouse, drosophila and arabidopsis regulatory regions from an integrative analysis of DNA-binding sequencing experiments. Nucleic Acids Res. 2022, 50, D316–D325. [Google Scholar] [CrossRef] [PubMed]
- Langfelder, P.; Horvath, S. WGCNA: An R package for weighted correlation network analysis. BMC Bioinform. 2008, 9, 559. [Google Scholar] [CrossRef]
- Mirhadi, S.; Zhang, W.; Pham, N.A.; Karimzadeh, F.; Pintilie, M.; Tong, J.; Taylor, P.; Krieger, J.; Pitcher, B.; Sykes, J.; et al. Mitochondrial aconitase ACO2 links iron homeostasis with tumorigenicity in non-small cell lung cancer. Mol. Cancer Res. 2023, 21, 36–50. [Google Scholar] [CrossRef] [PubMed]
- Li, J.J.; Li, R.; Wang, W.; Zhang, B.; Song, X.; Zhang, C.; Gao, Y.; Liao, Q.; He, Y.; You, S.; et al. IDH2 is a novel diagnostic and prognostic serum biomarker for non-small-cell lung cancer. Mol. Oncol. 2018, 12, 602–610. [Google Scholar] [CrossRef]
- Su, C.Y.; Chang, Y.C.; Yang, C.J.; Huang, M.S.; Hsiao, M. The opposite prognostic effect of NDUFS1 and NDUFS8 in lung cancer reflects the oncojanus role of mitochondrial complex I. Sci. Rep. 2016, 6, 31357. [Google Scholar] [CrossRef]
- Wang, X.; Song, H.; Liang, J.; Jia, Y.; Zhang, Y. Abnormal expression of HADH, an enzyme of fatty acid oxidation, affects tumor development and prognosis (Review). Mol. Med. Rep. 2022, 26, 355. [Google Scholar] [CrossRef]
- Qu, T.; Zhang, W.; Yan, C.; Ren, D.; Wang, Y.; Guo, Y.; Guo, Q.; Wang, J.; Liu, L.; Han, L.; et al. ISG15 targets glycosylated PD-L1 and promotes its degradation to enhance antitumor immune effects in lung adenocarcinoma. J. Transl. Med. 2023, 21, 341. [Google Scholar] [CrossRef] [PubMed]
- Liu, S.; Tian, W.; Ma, Y.; Li, J.; Yang, J.; Li, B. Serum exosomal proteomics analysis of lung adenocarcinoma to discover new tumor markers. BMC Cancer 2022, 22, 279. [Google Scholar] [CrossRef]
- Ma, H.; Ge, Y.; Li, Y.; Wang, T.; Chen, W. Construction of a prognostic model based on cuproptosis-related genes and exploration of the value of DLAT and DLST in the metastasis for non-small cell lung cancer. Medicine 2024, 103, e40727. [Google Scholar] [CrossRef] [PubMed]
- Kageyama, T.; Nagashio, R.; Ryuge, S.; Matsumoto, T.; Iyoda, A.; Satoh, Y.; Masuda, N.; Jiang, S.X.; Saegusa, M.; Sato, Y. HADHA is a potential predictor of response to platinum-based chemotherapy for lung cancer. Asian Pac. J. Cancer Prev. 2011, 12, 3457–3463. [Google Scholar] [PubMed]
- Huang, G.; Li, H.; Zhang, H. Abnormal expression of mitochondrial ribosomal proteins and their encoding genes with cell apoptosis and diseases. Int. J. Mol. Sci. 2020, 21, 8879. [Google Scholar] [CrossRef]
- Parma, B.; Ramesh, V.; Gollavilli, P.N.; Siddiqui, A.; Pinna, L.; Schwab, A.; Marschall, S.; Zhang, S.; Pilarsky, C.; Napoli, F.; et al. Metabolic impairment of non-small cell lung cancers by mitochondrial HSPD1 targeting. J. Exp. Clin. Cancer Res. 2021, 40, 248. [Google Scholar] [CrossRef]
- Coussens, L.M.; Werb, Z. Inflammation and cancer. Nature 2002, 420, 860–867. [Google Scholar] [CrossRef]
- Lu, H.; Ouyang, W.; Huang, C. Inflammation, a key event in cancer development. Mol. Cancer Res. 2006, 4, 221–233. [Google Scholar] [CrossRef]
- Gomes, M.; Teixeira, A.L.; Coelho, A.; Araujo, A.; Medeiros, R. The role of inflammation in lung cancer. Adv. Exp. Med. Biol. 2014, 816, 1–23. [Google Scholar]
- Chaturvedi, A.K.; Caporaso, N.E.; Katki, H.A.; Wong, H.L.; Chatterjee, N.; Pine, S.R.; Chanock, S.J.; Goedert, J.J.; Engels, E.A. C-reactive protein and risk of lung cancer. J. Clin. Oncol. 2010, 28, 2719–2726. [Google Scholar] [CrossRef]
- Liu, C.H.; Chen, Z.; Chen, K.; Liao, F.T.; Chung, C.E.; Liu, X.; Lin, Y.C.; Keohavong, P.; Leikauf, G.D.; Di, Y.P. Lipopolysaccharide-mediated chronic inflammation promotes tobacco carcinogen-induced lung cancer and determines the efficacy of immunotherapy. Cancer Res. 2021, 81, 144–157. [Google Scholar] [CrossRef] [PubMed]
- Cho, J.W.; Shim, H.S.; Lee, C.Y.; Park, S.Y.; Hong, M.H.; Lee, I.; Kim, H.R. The importance of enhancer methylation for epigenetic regulation of tumorigenesis in squamous lung cancer. Exp. Mol. Med. 2022, 54, 12–22. [Google Scholar] [CrossRef]
- Fry, E.A.; Mallakin, A.; Inoue, K. Translocations involving ETS family proteins in human cancer. Integr. Cancer Sci. Ther. 2018, 5. [Google Scholar] [CrossRef]
- Zhang, Z.; Newton, K.; Kummerfeld, S.K.; Webster, J.; Kirkpatrick, D.S.; Phu, L.; Eastham-Anderson, J.; Liu, J.; Lee, W.P.; Wu, J.; et al. Transcription factor Etv5 is essential for the maintenance of alveolar type II cells. Proc. Natl. Acad. Sci. USA 2017, 114, 3903–3908. [Google Scholar] [CrossRef] [PubMed]
- Zhang, H.; Liang, J.; Lu, T.; Li, M.; Shan, G.; Bi, G.; Zhao, M.; Jin, X.; Wang, Q.; Chen, Z.; et al. AGRN promotes lung adenocarcinoma progression by activating Notch signaling pathway and acts as a therapeutic target. Pharmacol. Res. 2023, 194, 106819. [Google Scholar] [CrossRef] [PubMed]
- Mozaffari, K.; Mekonnen, M.; Harary, M.; Lum, M.; Aguirre, B.; Chandla, A.; Wadehra, M.; Yang, I. Epithelial membrane protein 2 (EMP2): A systematic review of its implications in pathogenesis. Acta Histochem. 2023, 125, 151976. [Google Scholar] [CrossRef]
- Ma, Y.; Schroder, D.C.; Nenkov, M.; Rizwan, M.N.; Abubrig, M.; Sonnemann, J.; Murrieta-Coxca, J.M.; Morales-Prieto, D.M.; Westermann, M.; Gassler, N.; et al. Epithelial membrane protein 2 suppresses non-small cell lung cancer cell growth by inhibition of MAPK pathway. Int. J. Mol. Sci. 2021, 22, 2944. [Google Scholar] [CrossRef]
- Wu, Y.J.; Nai, A.T.; He, G.C.; Xiao, F.; Li, Z.M.; Tang, S.Y.; Liu, Y.P.; Ai, X.H. DPYSL2 as potential diagnostic and prognostic biomarker linked to immune infiltration in lung adenocarcinoma. World J. Surg. Oncol. 2021, 19, 274. [Google Scholar] [CrossRef]
- Gereke, M.; Autengruber, A.; Grobe, L.; Jeron, A.; Bruder, D.; Stegemann-Koniszewski, S. Flow cytometric isolation of primary murine type II alveolar epithelial cells for functional and molecular studies. J. Vis. Exp. 2012, 70, 4322. [Google Scholar] [CrossRef]
- Krueger, F.; Andrews, S.R. Bismark: A flexible aligner and methylation caller for Bisulfite-Seq applications. Bioinformatics 2011, 27, 1571–1572. [Google Scholar] [CrossRef] [PubMed]
- Song, Q.; Decato, B.; Hong, E.E.; Zhou, M.; Fang, F.; Qu, J.; Garvin, T.; Kessler, M.; Zhou, J.; Smith, A.D. A reference methylome database and analysis pipeline to facilitate integrative and comparative epigenomics. PLoS ONE 2013, 8, e81148. [Google Scholar] [CrossRef]
- Qu, J.; Zhou, M.; Song, Q.; Hong, E.E.; Smith, A.D. MLML: Consistent simultaneous estimates of DNA methylation and hydroxymethylation. Bioinformatics 2013, 29, 2645–2646. [Google Scholar] [CrossRef] [PubMed]
- Quinlan, A.R.; Hall, I.M. BEDTools: A flexible suite of utilities for comparing genomic features. Bioinformatics 2010, 26, 841–842. [Google Scholar] [CrossRef]
- Encode Project Consortium, Expanded encyclopaedias of DNA elements in the human and mouse genomes. Nature 2020, 583, 699–710. [CrossRef]
- Bolger, A.M.; Lohse, M.; Usadel, B. Trimmomatic: A flexible trimmer for Illumina sequence data. Bioinformatics 2014, 30, 2114–2120. [Google Scholar] [CrossRef] [PubMed]
- Kim, D.; Paggi, J.M.; Park, C.; Bennett, C.; Salzberg, S.L. Graph-based genome alignment and genotyping with HISAT2 and HISAT-genotype. Nat. Biotechnol. 2019, 37, 907–915. [Google Scholar] [CrossRef]
- Liao, Y.; Smyth, G.K.; Shi, W. featureCounts: An efficient general purpose program for assigning sequence reads to genomic features. Bioinformatics 2014, 30, 923–930. [Google Scholar] [CrossRef]
- Baller, J.; Kono, T.; Herman, A.; Zhang, Y. CHURP: A lightweight CLI framework to enable novice users to analyze sequencing datasets in parallel. In Practice and Experience in Advanced Research Computing on Rise of the Machines (Learning); Association for Computing Machinery: Chicago, IL, USA, 2019; p. 96. [Google Scholar]
- Robinson, M.D.; McCarthy, D.J.; Smyth, G.K. edgeR: A Bioconductor package for differential expression analysis of digital gene expression data. Bioinformatics 2010, 26, 139–140. [Google Scholar] [CrossRef]
- Hoffman, G.E.; Schadt, E.E. variancePartition: Interpreting drivers of variation in complex gene expression studies. BMC Bioinform. 2016, 17, 483. [Google Scholar] [CrossRef]
- Love, M.I.; Huber, W.; Anders, S. Moderated estimation of fold change and dispersion for RNA-seq data with DESeq2. Genome Biol. 2014, 15, 550. [Google Scholar] [CrossRef] [PubMed]
- Hughes, C.S.; Moggridge, S.; Müller, T.; Sorensen, P.H.; Morin, G.B.; Krijgsveld, J. Single-pot, solid-phase-enhanced sample preparation for proteomics experiments. Nat. Protoc. 2019, 14, 68–85. [Google Scholar] [CrossRef]
- Myers, S.A.; Rhoads, A.; Cocco, A.R.; Peckner, R.; Haber, A.L.; Schweitzer, L.D.; Krug, K.; Mani, D.R.; Clauser, K.R.; Rozenblatt-Rosen, O.; et al. Streamlined protocol for deep proteomic profiling of FAC-sorted cells and its application to freshly isolated murine immune cells. Mol. Cell Proteom. 2019, 18, 995–1009. [Google Scholar] [CrossRef]
- Han, Q.; Fernandez, J.; Rajczewski, A.T.; Kono, T.J.Y.; Weirath, N.A.; Rahim, A.; Lee, A.S.; Seabloom, D.; Tretyakova, N.Y. A Multi-omics study of epigenetic changes in type ii alveolar cells of A/J mice exposed to environmental tobacco smoke. Int. J. Mol. Sci. 2024, 25, 9365. [Google Scholar] [CrossRef] [PubMed]
- Dimayacyac-Esleta, B.R.; Tsai, C.F.; Kitata, R.B.; Lin, P.Y.; Choong, W.K.; Lin, T.D.; Wang, Y.T.; Weng, S.H.; Yang, P.C.; Arco, S.D.; et al. Rapid high-pH Reverse phase StageTip for sensitive small-scale membrane proteomic profiling. Anal. Chem. 2015, 87, 12016–12023. [Google Scholar] [CrossRef]
- Kim, H.; Dan, K.; Shin, H.; Lee, J.; Wang, J.I.; Han, D. An efficient method for high-pH peptide fractionation based on C18 StageTips for in-depth proteome profiling. Anal. Methods 2019, 11, 4693–4698. [Google Scholar] [CrossRef]
- Tyanova, S.; Temu, T.; Cox, J. The MaxQuant computational platform for mass spectrometry-based shotgun proteomics. Nat. Protoc. 2016, 11, 2301–2319. [Google Scholar] [CrossRef]
- Tyanova, S.; Temu, T.; Sinitcyn, P.; Carlson, A.; Hein, M.Y.; Geiger, T.; Mann, M.; Cox, J. The Perseus computational platform for comprehensive analysis of (prote)omics data. Nat. Methods 2016, 13, 731–740. [Google Scholar] [CrossRef] [PubMed]
- Raudvere, U.; Kolberg, L.; Kuzmin, I.; Arak, T.; Adler, P.; Peterson, H.; Vilo, J. g:Profiler: A web server for functional enrichment analysis and conversions of gene lists (2019 update). Nucleic Acids Res. 2019, 47, W191–W198. [Google Scholar] [CrossRef]
- Szklarczyk, D.; Gable, A.L.; Lyon, D.; Junge, A.; Wyder, S.; Huerta-Cepas, J.; Simonovic, M.; Doncheva, N.T.; Morris, J.H.; Bork, P.; et al. Mering, Christian v. STRING v11: Protein–protein association networks with increased coverage, supporting functional discovery in genome-wide experimental datasets. Nucleic Acids Res. 2018, 47, D607–D613. [Google Scholar] [CrossRef]
- Kumar, P.; Panigrahi, P.; Johnson, J.; Weber, W.J.; Mehta, S.; Sajulga, R.; Easterly, C.; Crooker, B.A.; Heydarian, M.; Anamika, K.; et al. QuanTP: A software resource for quantitative proteo-transcriptomic comparative data analysis and informatics. J. Proteome Res. 2019, 18, 782–790. [Google Scholar] [CrossRef] [PubMed]
- Zhu, C.; Shen, H.; Zhu, L.; Zhao, F.; Shu, Y. Plasminogen Activator Inhibitor 1 Promotes Immunosuppression in Human Non-Small Cell Lung Cancers by Enhancing TGF-Beta1 Expression in Macrophage. Cell. Physiol. Biochem. 2017, 44, 2201–2211. [Google Scholar] [CrossRef] [PubMed]
- Guo, J.Y.; Hsu, H.S.; Tyan, S.W.; Li, F.Y.; Shew, J.Y.; Lee, W.H.; Chen, J.Y. Serglycin in tumor microenvironment promotes non-small cell lung cancer aggressiveness in a CD44-dependent manner. Oncogene 2017, 36, 2457–2471. [Google Scholar] [CrossRef] [PubMed]
Disclaimer/Publisher’s Note: The statements, opinions and data contained in all publications are solely those of the individual author(s) and contributor(s) and not of MDPI and/or the editor(s). MDPI and/or the editor(s) disclaim responsibility for any injury to people or property resulting from any ideas, methods, instructions or products referred to in the content. |
© 2025 by the authors. Licensee MDPI, Basel, Switzerland. This article is an open access article distributed under the terms and conditions of the Creative Commons Attribution (CC BY) license (https://creativecommons.org/licenses/by/4.0/).
Share and Cite
Fernandez, J.A.; Han, Q.; Rajczewski, A.T.; Kono, T.; Weirath, N.A.; Lee, A.S.; Rahim, A.; Tretyakova, N.Y. Multi-Omics Analysis of the Epigenetic Effects of Inflammation in Murine Type II Pneumocytes. Int. J. Mol. Sci. 2025, 26, 4692. https://doi.org/10.3390/ijms26104692
Fernandez JA, Han Q, Rajczewski AT, Kono T, Weirath NA, Lee AS, Rahim A, Tretyakova NY. Multi-Omics Analysis of the Epigenetic Effects of Inflammation in Murine Type II Pneumocytes. International Journal of Molecular Sciences. 2025; 26(10):4692. https://doi.org/10.3390/ijms26104692
Chicago/Turabian StyleFernandez, Jenna A., Qiyuan Han, Andrew T. Rajczewski, Thomas Kono, Nicholas A. Weirath, Alexander S. Lee, Abdur Rahim, and Natalia Y. Tretyakova. 2025. "Multi-Omics Analysis of the Epigenetic Effects of Inflammation in Murine Type II Pneumocytes" International Journal of Molecular Sciences 26, no. 10: 4692. https://doi.org/10.3390/ijms26104692
APA StyleFernandez, J. A., Han, Q., Rajczewski, A. T., Kono, T., Weirath, N. A., Lee, A. S., Rahim, A., & Tretyakova, N. Y. (2025). Multi-Omics Analysis of the Epigenetic Effects of Inflammation in Murine Type II Pneumocytes. International Journal of Molecular Sciences, 26(10), 4692. https://doi.org/10.3390/ijms26104692