Article

Integrated Application of Transcriptomics and Metabolomics Provides Insights into the Different Body-Size Growth in Chinese Mitten Crab (Eriocheir sinensis)

1
Wuxi Fisheries College, Nanjing Agricultural University, Wuxi 214081, China
2
Key Laboratory of Integrated Rice-Fish Farming Ecology, Ministry of Agriculture and Rural Affairs, Freshwater Fisheries Research Center, Chinese Academy of Fishery Sciences, Wuxi 214081, China
*
Authors to whom correspondence should be addressed.
Int. J. Mol. Sci. 2025, 26(10), 4617; https://doi.org/10.3390/ijms26104617
Submission received: 31 March 2025 / Revised: 30 April 2025 / Accepted: 3 May 2025 / Published: 12 May 2025
(This article belongs to the Special Issue Recent Advances in Crustacean Aquaculture)

Abstract

:
The Chinese mitten crab, Eriocheir sinensis, is a water-dwelling crustacean that is widely distributed in northern hemisphere water systems. Body size is one of the crucial indicators determining the economic value of E. sinensis. However, research on the genetic basis and regulatory mechanisms of body size in this species is limited, with only a few relevant genes reported. Therefore, it is imperative to investigate the regulatory pathways associated with its growth. This study first utilized transcriptomic profiling and metabolomic sequencing to construct gene expression profiles and metabolite profiles of E. sinensis of different body sizes. Subsequently, through integrated omics analysis, the key genes and regulatory pathways involved in controlling the growth and size of crabs were preliminarily identified. This study found that larger female crabs exhibited significantly enhanced digestive functions, primarily reflected in the upregulation of trypsin-1 expression, suggesting its potentially pivotal role in regulating the growth and development of crabs. Interestingly, a variety of tissue-specific proteins such as APOLPP, RICK A, AGMO, and NEPHRIN, as well as REXO1L1P and ZCCHC24, indirectly influence the growth and development of crabs through their respective functional pathways. In addition, the key KEGG pathways, such as ECM–receptor interaction, cell adhesion, and the PI3K-Akt signaling pathway, were revealed to play central roles in the growth regulation of E. sinensis. These findings expand our understanding of the growth regulation mechanisms in crustaceans and offer potential molecular targets for body-size improvement in aquaculture.

1. Introduction

The Chinese mitten crab Eriocheir sinensis is a migratory species that is widely distributed in northern hemisphere water systems [1]. As a significant aquatic economic species in China, the crab industry holds a prominent position in terms of farming scale, market demand, and cultural value [2,3]. The production of E. sinensis reached 888,629 tons in 2023, according to the China Fishery Statistical Yearbook [4]. E. sinensis, renowned for its delicious meat and rich nutritional value, enjoys a vast market prospect and is deeply cherished by consumers [5]. The body size of a crab is one of the pivotal economic traits directly influencing market value and consumer preference. Therefore, the body size of E. sinensis is a key focus trait for researchers in genetic breeding.
In aquatic vertebrates, body size regulation has been well-explored, and the GH-IGF axis is crucial for regulating body size. In striped bass (Morone saxatilis), insulin-like growth factor 1 (IGF-1) regulates the growth by modulating the synthesis and release of growth hormone [6,7]. Similarly, IGF-II plays a critical role in the growth of channel catfish (Ictalurus punctatus) [8]. The GH/IGF-1 axis signaling pathway is closely related to the growth regulation of Nile tilapia (Oreochromis niloticus) [9]. In addition, molecular markers associated with growth traits have been developed in various fish species, e.g., rainbow trout (Oncorhynchus mykiss), mandarin fish (Siniperca chuatsi), zebrafish (Danio rerio), and turbot (Scophthalmus maximus) [10,11,12,13].
In aquatic invertebrates, however, body size regulation has lagged behind relatively. Similar to the study in fish, the IGF-1/AKT signaling pathway influences muscle tissue deposition and growth, thereby regulating the body size of the Pacific oyster (Crassostrea gigas) [14]. Meanwhile, insulin-like peptide receptors (ILPRs), such as PI3K-AKT, RAS-MAPK, and TOR, play a significant role in regulating the growth of C. gigas [15]. However, research in this field on crustaceans remains relatively scarce, and the molecular mechanisms underlying their size regulation are still not well understood. Currently, research on the growth of Chinese mitten crabs primarily focuses on the genes associated with the molting process. Studies have found that genes such as cyp15a1, cyp3a4, EcR, MIH, and chitinase (chi) play crucial roles in the molting process of these crabs [16,17,18]. Additionally, phenoloxidase (PO) regulates the growth of these crabs by promoting the hardening of the new exoskeleton after molting [19,20]. Given that only a few genes associated with the growth of E. sinensis were reported, further in-depth exploration is urgently needed.
Aiming to explore the growth regulation mechanisms in E. sinensis, this study collected crabs of different body sizes from the same pond. By using transcriptomic and metabolomic integrative analysis, we identified differentially expressed genes and pathways associated with the growth phenotypes. These findings will enhance public understanding of the growth regulation mechanisms in crustaceans and provide a scientific basis for genetic selection and breeding improvement in crabs.

2. Results

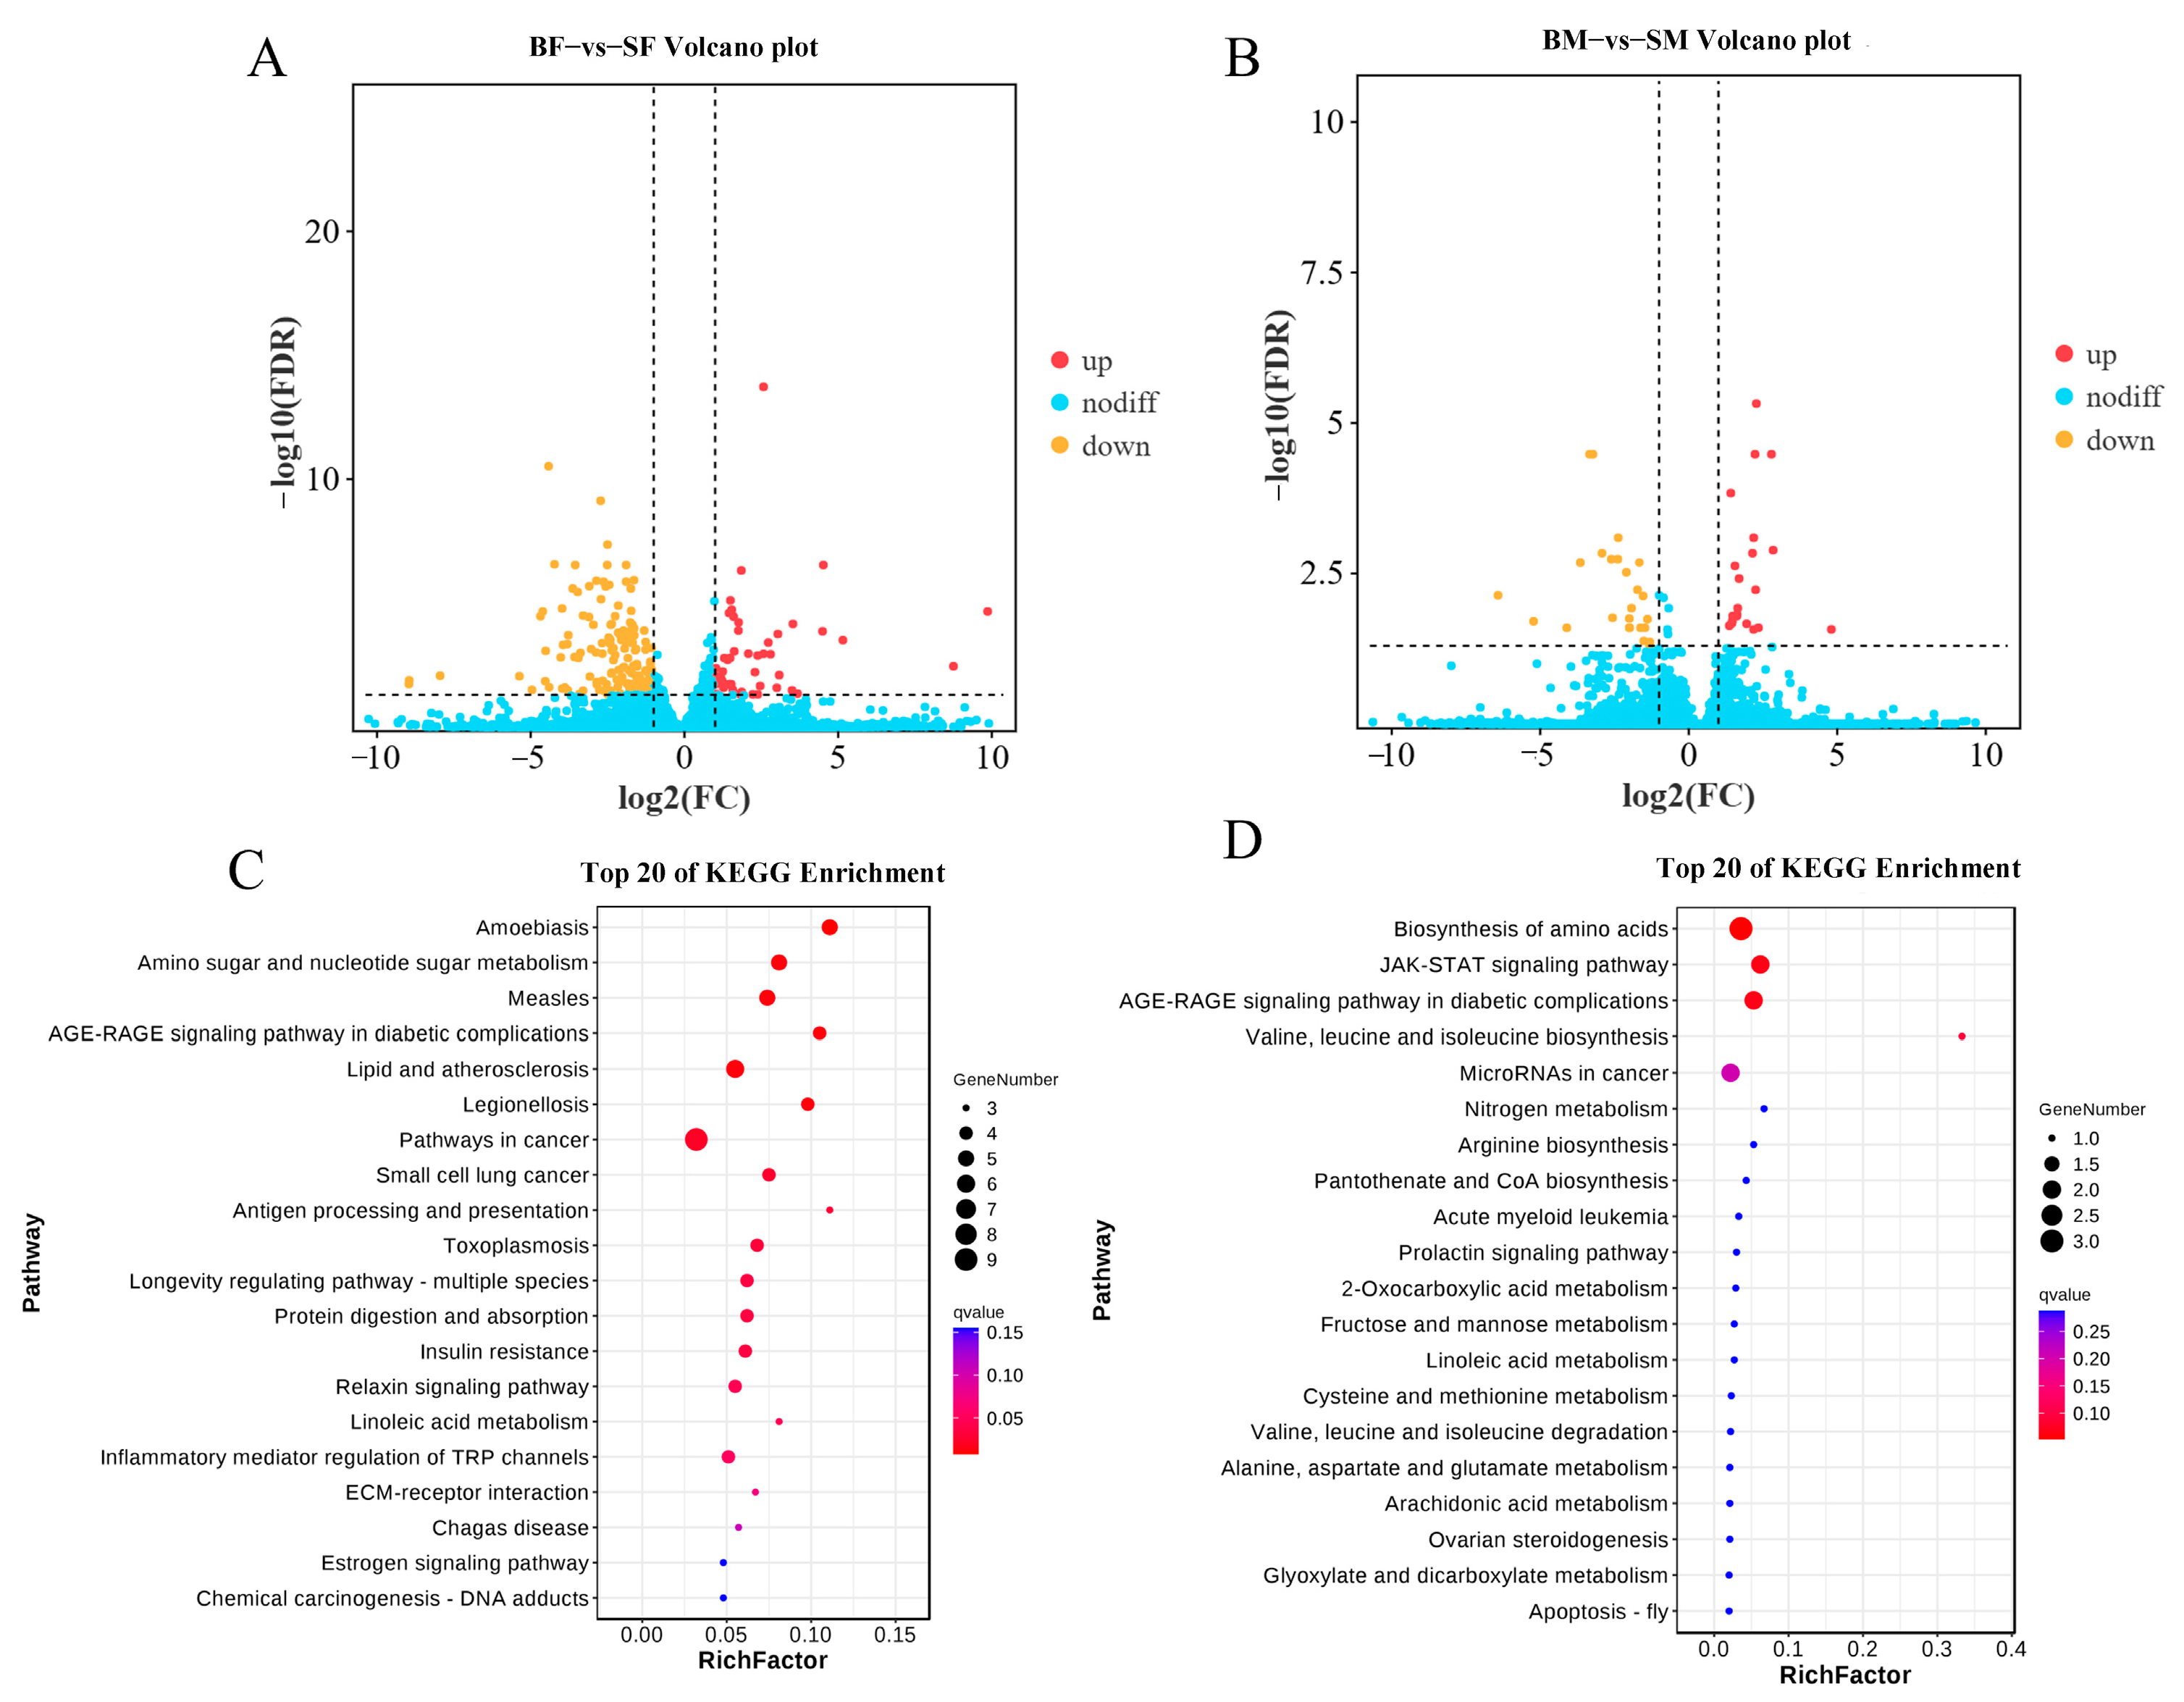
2.1. Changes in Gene Expression of Different Body Sizes of E. sinensis

A total of 24 cDNA libraries of muscle tissues of E. sinensis were constructed and sequenced. A total of 166.60 Gb of clean data was obtained, with more than 6.94 Gb of each sample. The Q30 ratio was larger than 90.08% for all samples. All clean reads of each sample were compared with the assembled reference genome. The average mapping rate was 88.38% (Table S1).
There were 208 different expression genes (DEGs) (49 upregulated and 159 downregulated) and 47 different expression genes (DEGs) (22 upregulated and 25 downregulated) identified in the BF-SF and BM-SM groups, respectively (Figure 1A,B). In the BF-SF group, 15 KEGG pathways were significantly enriched, including amino sugar and nucleotide sugar metabolism, the AGE-RAGE signaling pathway in diabetic complications and insulin resistance, and other pathways (Figure 1C). In the BM-SM group, DEGs were enriched mainly in 7 KEGG pathways, including the biosynthesis of amino acids, the JAK-STAT signaling pathway, the AGE-RAGE signaling pathway in diabetic complications, as well as valine, leucine, and isoleucine biosyntheses, MicroRNAs in cancer, nitrogen metabolism, and arginine biosynthesis (Figure 1D).
The expressions of six DEGs, ccna2, cht2, ago2, fcn2, pim3, and tpi1, were consistent with the results of the RNA-Seq analysis (Figure 2). These findings confirmed the integrity and reliability of the transcriptome analysis.

2.2. Differential Metabolites Analysis

In total, 244 (123 upregulated and 121 downregulated) and 209 (100 upregulated and 109 downregulated) differential metabolites (DEMs) were identified from the comparisons of the BF-SF and BM-SM groups, respectively (Figure 3A–C). According to the result of KEGG enrichment, drug metabolism-cytochrome P450, secondary bile acid biosynthesis, and lysine degradation were the top three pathways in the BF-SF group (Figure 3D). Microbial metabolism in diverse environments, D-Amino acid metabolism, and proximal tubule bicarbonate reclamation were the top three pathways in the BM-SM group (Figure 3E).

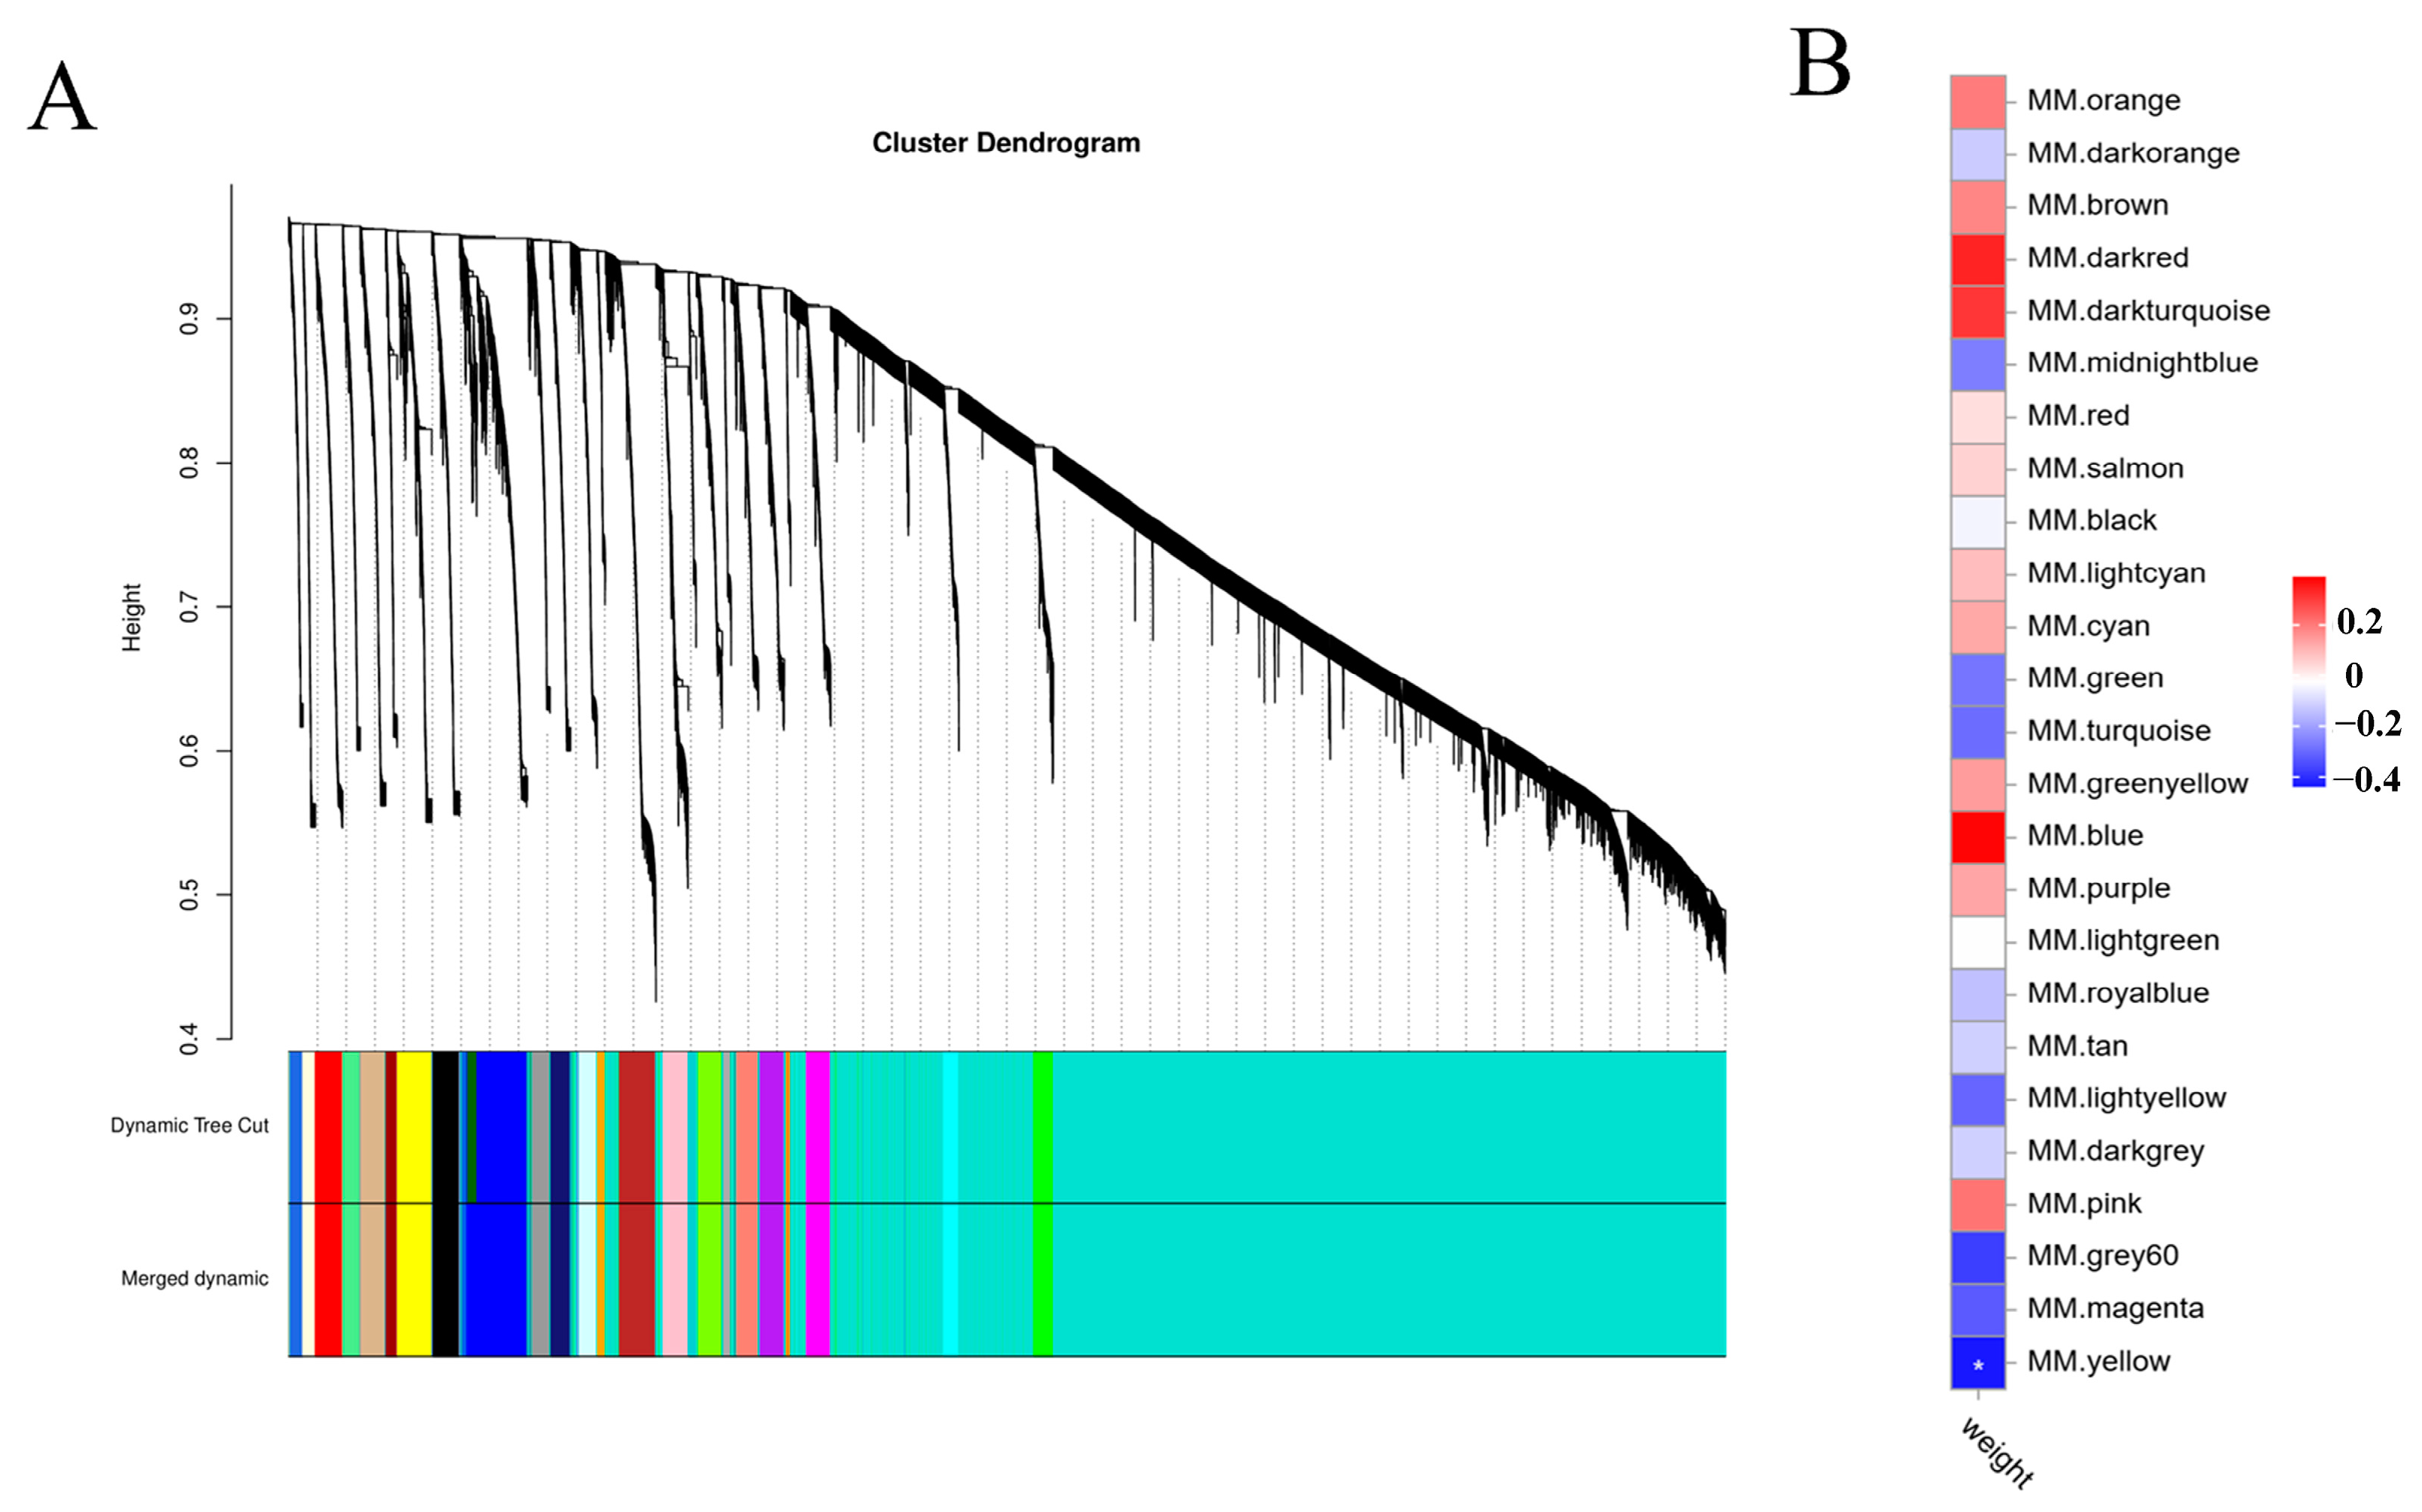
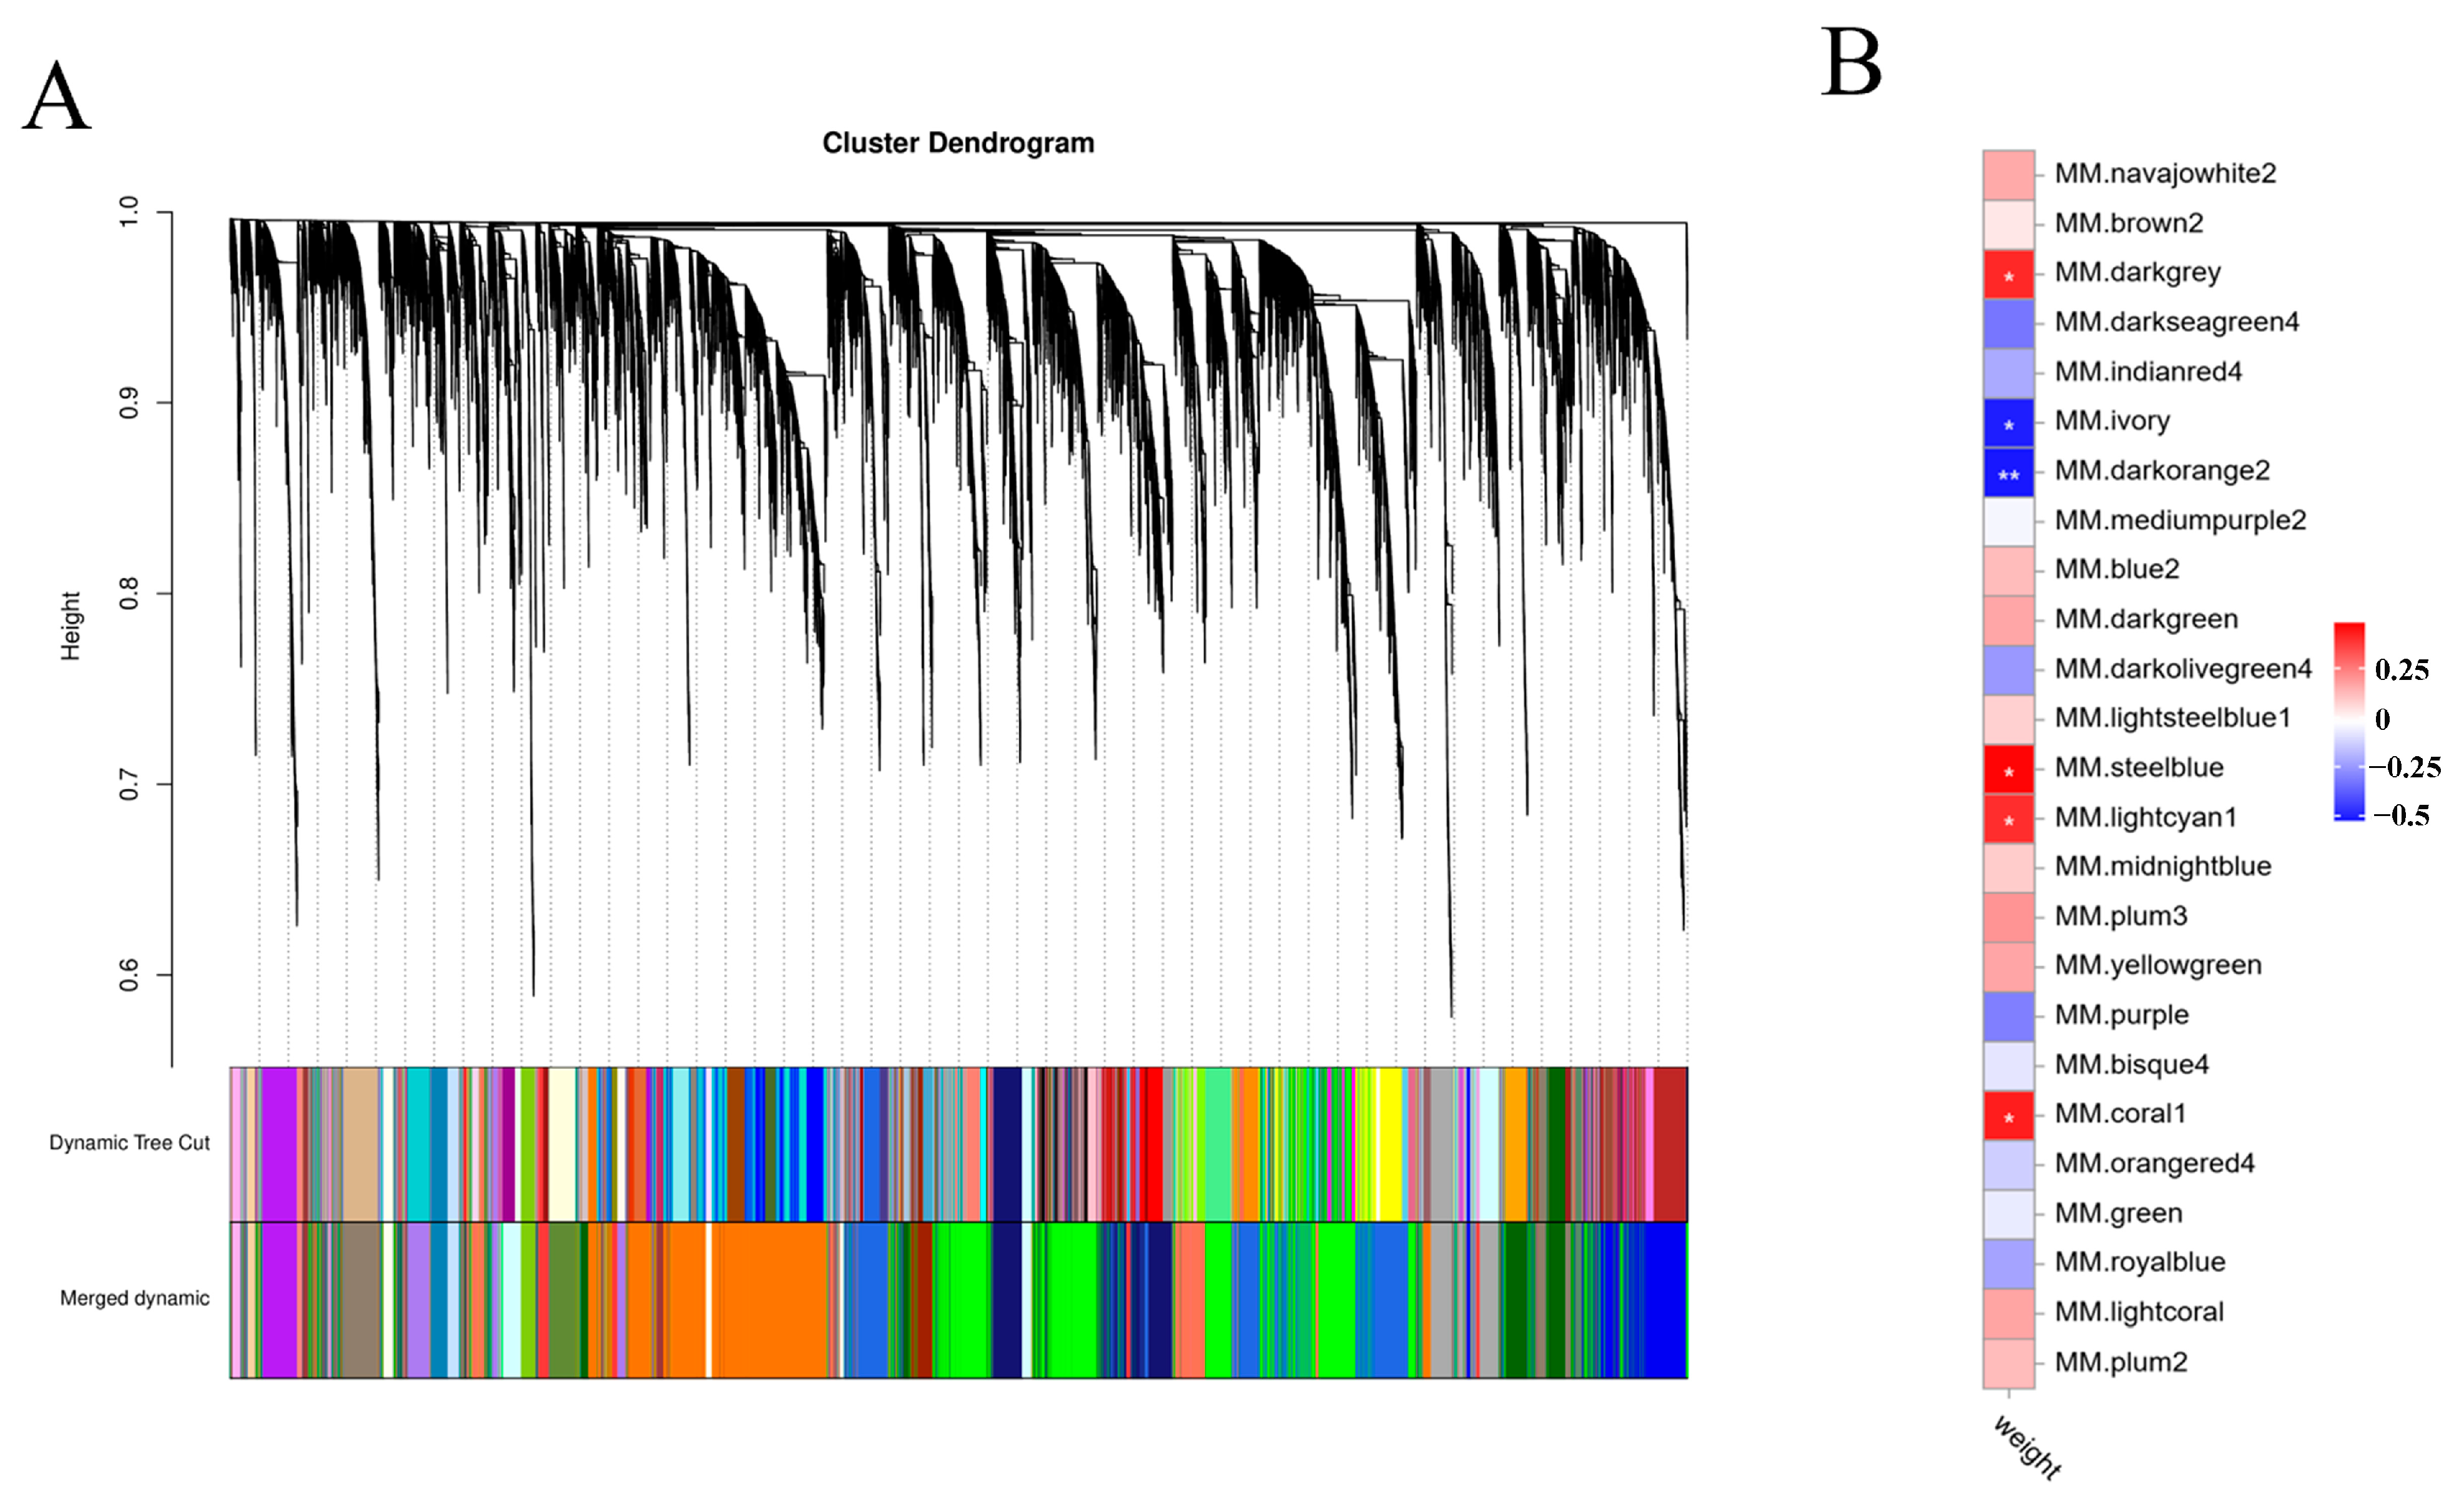
2.3. Weighted Gene Co-Expression Network Analysis (WGCNA)

WGCNA was used to further elucidate the relationship between all genes and body weight. In total, 25 modules were identified, and the yellow module was closely related to body weight traits (Figure 4A). The yellow module, which contains 3097 genes, was negatively associated with body weight (Figure 4B).
WGCNA was used to elucidate the relationship between DEMs and body weight. In total, six significant modules were identified (Figure 5A,B). To further clarify key metabolites, the top 10 hub metabolites were screened from the six significant modules (Table 1).

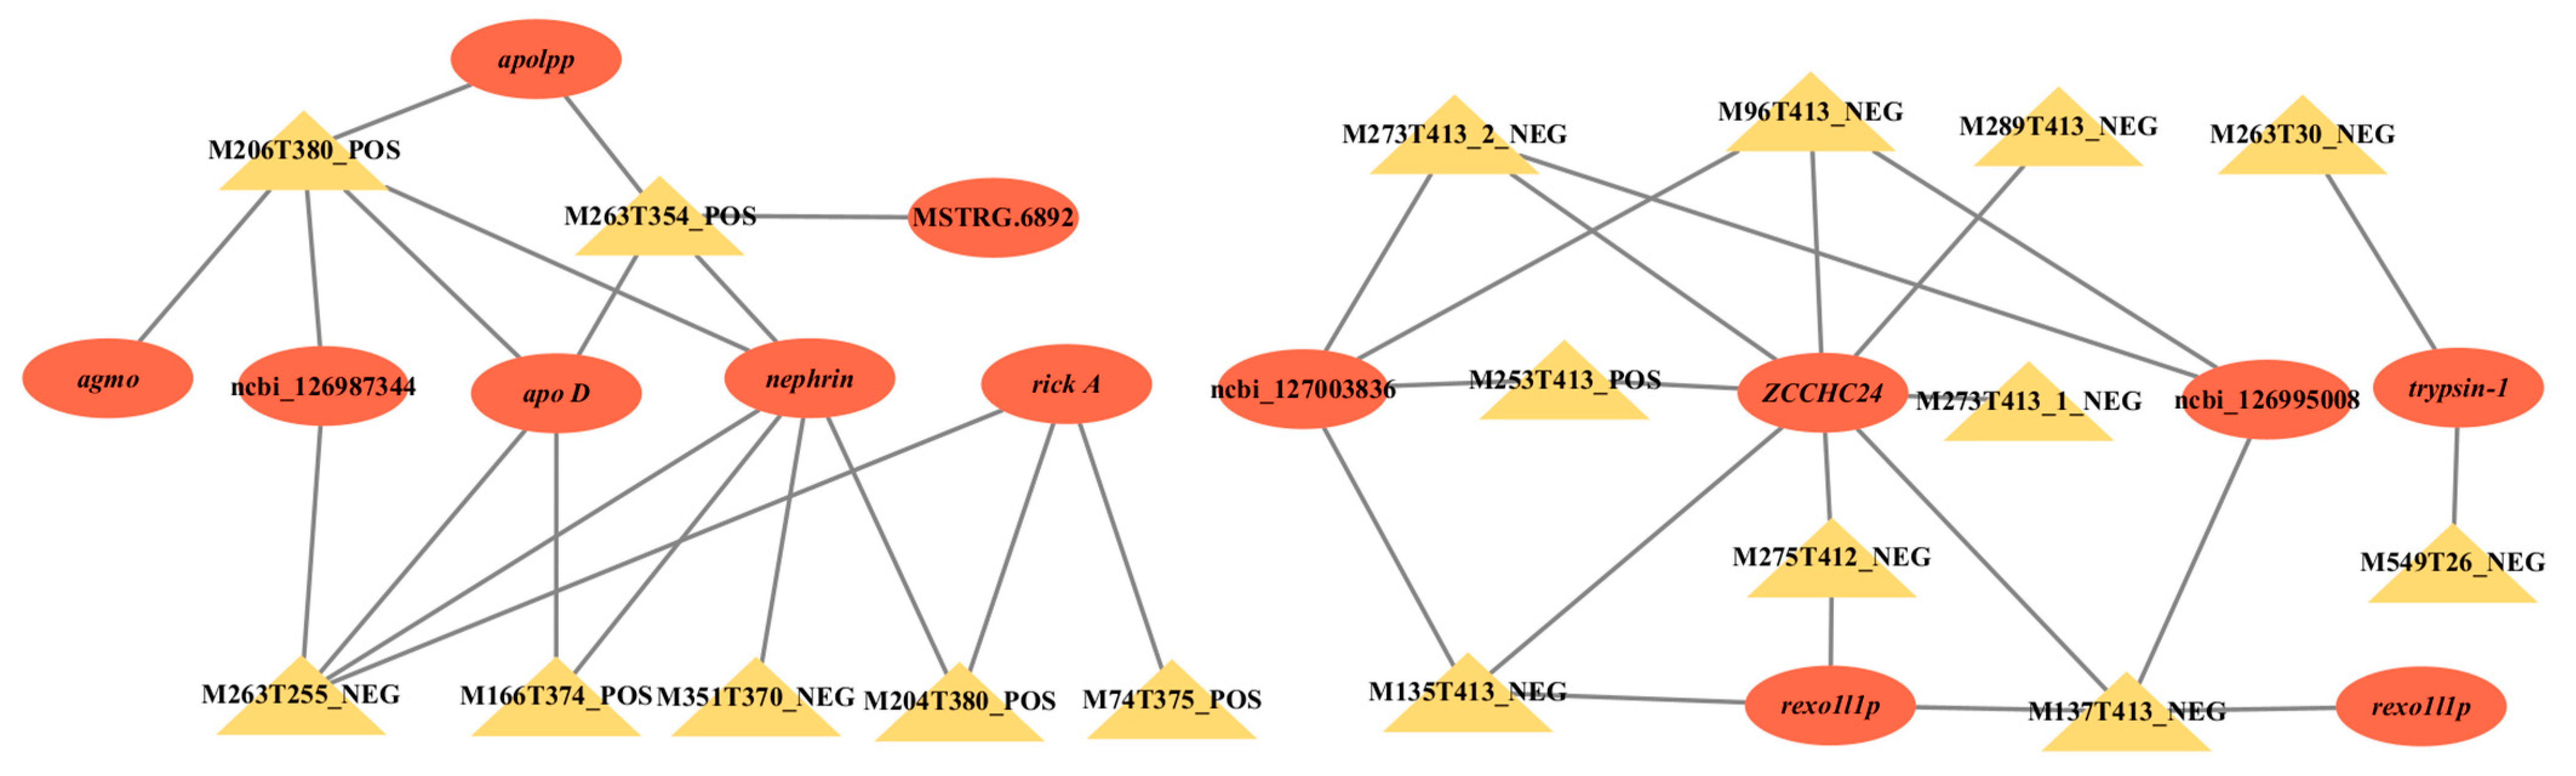
2.4. Transcriptomics-Metabolomics Co-Regulated Network Analysis

The co-expression network diagram was established by screening the relationship pairs of the top 30 correlation coefficients (Figure 6). The key genes are apolipoprotein (apolpp), apolipoprotein D (apo D), alkylglycerol monooxygenase (agmo), nephrin, trypsin-1, arp2/3 complex-activating protein rick A (rick A), exonuclease GOR (rexo1l1p), putative exonuclease GOR (rexo1l1p), and zinc finger CCHC domain-containing protein 24 (zcchc24), and there were some uncharacterized genes (NCBI-126987344, NCBI-127003836, NCBI-126995008, MSTRG.6892). These key genes are mainly concentrated in six pathways, including the PI3K-Akt signaling pathway (ko04151), focal adhesion (ko04510), extracellular matrix (ECM)–receptor interaction (ko04512), neuroactive ligand–receptor interaction (ko04080), pancreatic secretion (ko04972), and protein digestion and absorption (ko04974) (Figure 7).

3. Discussion

Aquatic animals differ greatly in body size and growth strategies [21]. This is true even in the same growing environment [22,23]. In order to further explore the molecular mechanism of the growth differences in individuals, juvenile crabs cultured in the same pond were selected. After maturity, the crabs were classified by their body sizes, and the large and small body-sized crabs were separately sampled. To analyze the pattern of unsynchronized growth for large-body-size and small-body-size crabs, the muscles of crabs were sampled from each group for transcriptome and metabolome detection.
Based on the analysis of transcriptomic and metabolomic data, the transcriptome results showed that the amino sugar and nucleotide sugar metabolism and insulin signaling pathways were significantly enriched pathways in female crabs. Carbohydrate metabolism is crucial for the regulation of growth and development [24]. Amino sugar and nucleotide sugar metabolism regulate the absorption and assimilation of nutrients at lower levels [25]. The insulin-like peptide system in female mud crabs is involved in the regulation of yolk formation [26]. These signaling pathways in female crabs might be related to their reproductive needs, such as vitellogenesis. In male crabs, there are specifically and significantly enriched signaling pathways, including the biosynthesis of amino acids, the JAK-STAT signaling pathway, and nitrogen metabolism. The amino acid biosynthesis pathway is crucial for protein synthesis and muscle growth [27]. The enrichment of the JAK-STAT signaling pathway reflects differences in disease resistance or the stress response in crabs [28]. Nitrogen metabolism is associated with growth regulation-related metabolic adaptations [29]. The enhanced amino acid metabolism and nitrogen metabolism in male crabs might support their somatic growth, particularly muscle development. The results indicated that insulin resistance might constrain the growth of small body-sized female crabs, while large body-sized female crabs might prioritize energy storage through efficient glucose metabolism. For male crabs, large-body-sized crabs might achieve faster growth rates by enhancing amino acid biosynthesis and activating the JAK-STAT signaling pathway. The metabolite results showed that drug metabolism-cytochrome P450, secondary bile acid biosynthesis, and lysine degradation were the top three pathways in female crabs. In crustaceans, cytochrome P450 enzymes are involved in the synthesis of molting hormones (ecdysteroids) [30]. Cytochrome P450 2 plays an essential role in the mud crab Scylla paramamosain antioxidant defense and immune responses [31]. Bile acids play an important physiological role in modulating a number of hepatic and intestinal functions and exerting systemic effects such as increasing energy expenditure and improving insulin sensitivity [32]. Lysine improves the growth performance, molting frequency, and lipid metabolism of postlarval mud crab Scylla paramamosain [33]. The enriched pathways in female crabs indicated their higher demand for lipid metabolism, particularly for energy storage, including vitellogenesis during ovarian development. In male crabs, the three pathways highlighted the significance of microbial interactions and acid-based balance regulation. These results showed that different body sizes of female crabs primarily exhibit lipid metabolism and stress-response regulatory pathways, while different body sizes of male crabs mainly showed pathways related to microbial community maintenance and osmoregulation.
Based on the integrated analysis of transcriptomic and metabolomic data, a total of 13 key genes have been identified. Among these, NCBI-126984229 (apolpp) is enriched in the following pathways: PI3K-Akt signaling pathway, ECM–receptor interaction, and focal adhesion. NCBI-127006026 (trypsin-1) is enriched in the following pathways: Neuroactive ligand–receptor interaction, pancreatic secretion, and protein digestion and absorption. NCBI-127007012 (agmo) encodes an enzyme that catalyzes the breakdown of alkylglycerols and is involved in processes such as cell membrane composition, embryonic development, neural development, and metabolic regulation [34]. NCBI-127009577 (rick A) is a highly elastic protein commonly found in the exoskeletons of arthropods. During insect development, the expression of the resilin gene influences their elasticity and locomotor capabilities. The elasticity of insects aids in flight and movement, thereby impacting their survival and reproduction [35]. NCBI-127004947 (nephrin) encodes the NPHS protein, which is involved in the regulation of kidney function [36]. NCBI-127002774 (rexo1l1p), NCBI-127002775 (rexo1l1p), and NCBI-126982641 (zcchc24) are involved in RNA metabolism or the regulation of gene expression [37]. Therefore, several genes were studied and analyzed in this study.
Apolpp is a member of the apoB family, conserved across the animal kingdom [38]. Apolpp is the apoB homologous apolipoprotein in fruit flies [38]. The apolpp is involved in lipid transport and energy metabolism [39]. A previous study had shown that inhibiting apoLpp in the fat body significantly reduces systemic lipid levels in fruit flies fed a standard diet, highlighting the critical contribution of the fat body apoLpp to systemic lipid metabolism [40]. In this study, apolpp is involved in the ECM–receptor interaction, focal adhesion, and PI3K-Akt signaling pathways. As shown in the pathway diagram, when receptors such as integrins bind to the ECM, they recruit various signaling molecules and cytoskeletal proteins to form the focal adhesion complex. Focal adhesion can indirectly regulate the PI3K-Akt pathway by activating downstream signaling molecules such as FAK. In the large body-sized crab, the apolpp is upregulated in the three pathways. In the ECM–receptor interaction, the ECM is composed of glycoproteins, collagen, and proteoglycans, forming a complex, dynamic structure. In the process of myogenesis, integrins participate in the interaction between cells and the ECM, as well as the formation of sarcomeres, which play a significant role in the formation and growth of muscles [41]. In addition, according to the relevant report, the integrin genes in fast-growing oysters are upregulated in the ECM–receptor interaction signaling pathway, indicating active interactions between cells and the extracellular matrix (ECM) [42]. Focal adhesions are dynamic connecting structures between cells and the extracellular matrix (ECM), primarily mediated by receptors such as integrins. They play a crucial role in regulating cell adhesion, migration, proliferation, differentiation, and signal transduction [43]. Focal adhesions activate downstream signaling pathways, such as the FAK, Src, PI3K-Akt, and MAPK pathways, through integrins, thereby regulating cell growth, survival, and differentiation [44]. The PI3K-Akt signaling pathway plays a crucial role in the growth and development of animals. It is a highly conserved signaling pathway that influences embryonic development, tissue formation, and organ function by regulating cell growth, proliferation, survival, metabolism, and differentiation. During animal growth and development, the homeostasis of glucose metabolism is crucial for maintaining animal health. The PI3K-Akt signaling pathway sustains cellular energy balance by regulating glucose uptake, glycogen synthesis, and lipid metabolism [45]. Han [46] found that gene variations in the PI3K-Akt signaling pathway can affect the growth performance of animals. In addition, in this study, the transcriptome results showed that the ECM–receptor interaction was the main enrichment pathway of differential genes in female crabs. Differential genes of large-body-sized crabs enriched in this pathway are also upregulated. Therefore, key biological processes such as apoIpp, as well as the ECM–receptor interaction, cell adhesion, and PI3K-Akt signaling pathway, play a central role in growth regulation.
Trypsin-1 activates the conversion of trypsinogen to trypsin, thereby initiating the digestive enzyme cascade reaction and promoting the digestion and absorption of proteins [47]. Trypsin-1 influences the absorption and utilization of nutrients by regulating protein digestion, thereby indirectly affecting growth and development. Mutations in Trypsin-1 can lead to enterokinase deficiency, a malabsorption disorder characterized by diarrhea and growth retardation [47,48]. The normal development of the intestinal tract is crucial for the overall growth of an individual. Similarly, in our study, we also found that trypsin-1 is involved in the pancreatic secretion protein digestion and absorption pathway. Trypsin-1 in large-body-sized crabs is upregulated. Currently, Trypsin-1 is primarily recognized for its association with digestive functions, influencing animal growth by regulating the digestion and absorption of nutrients as well as intestinal development. In addition, in our study, Trypsin-1, involved in the neuroactive ligand–receptor interaction, was also upregulated. This result indicates that trypsin-1 in large-body-sized crabs exhibits a high digestive capacity and plays a crucial role in neural development.
In this study, we found several other genes, such as rick A, agmo, nephrin, rexo1l1p, and zcchc24. Rick A induced actin polymerization [49], while the Arp2/3 complex alone is a weak actin nucleator, the rate of Arp2/3-mediated actin polymerization is increased in the presence of a class of proteins known as nucleation-promoting factors [50,51,52,53]. Meanwhile, AMGO is the only known alkylglycerol monooxygenase, an orphan tetrahydrobiopterin-dependent enzyme that cleaves the ether linkage in alkylglycerols. AMGO is capable of catalyzing the breakdown of alkylglycerols, producing glycerol and corresponding aldehydes [54]. AMGO is involved in the metabolism of ether lipids, which play significant roles in cell signaling and membrane structure [34]. By regulating ether lipid metabolism, AMGO may influence cell growth, differentiation, and signaling. Mutations, copy number variations, and deletions in the agmo gene can lead to microcephaly and neurodevelopmental disorders [55,56]. The relationship between NERPHRIN and animal growth and development is mainly reflected in kidney development and function. The nephrin gene encodes a transmembrane protein known as NERPHRIN, which is primarily expressed in glomerular podocytes [36]. The absence or mutation of the NERPHRIN can lead to abnormal glomerular development, thereby affecting kidney function. In humans, mutations in the nephrin gene can cause Congenital Nephrotic Syndrome (CNS), which is characterized by growth retardation [57]. REXO1L1P and ZCCHC24 are involved in RNA metabolism or the regulation of gene expression [37,58]. Thus, proteins regulated by these genes influence animal growth and development by participating in tissue specificity, lipid metabolism, kidney development, RNA metabolism, and gene expression pathways.

4. Materials and Methods

4.1. Ethics Statement

This study was conducted in accordance with the guidelines of the Animal Care and Use Committee of Nanjing Agricultural University, Nanjing, China. The protocol was approved by the Animal Research Committee of Nanjing Agricultural University (permit number: SYXK (XU) 2023–0108; approved on 6 January 2023).

4.2. Experimental Design and Sample Collection

The cultivation of E. sinensis was conducted at the Yangzhong Experimental Base (Zhenjiang, China), Freshwater Fisheries Research Center, Chinese Academy of Fishery Sciences, from January to November 2023. The cultivation conditions and management methods for E. sinensis are described in a previous study [59]. A total of 72 healthy crabs (18-month-old mature) cultivated in the same pond were divided into 4 groups, with 18 crabs in each group, namely large-sized female crabs (BF, 196.42 ± 3.12 g), large-sized male crabs (BM, 248.01 ± 3.89 g), small-sized female crabs (SF, 111.06 ± 2.51 g) and small-sized male crabs (SM, 160.50 ± 3.42 g). They were anesthetized on ice before sampling to measure the wet weight (using an electronic scale, accurate to 0.01 g) and carapace length and width (using a digital caliper, accurate to 0.01 mm). Then, the muscle tissue of the BF, BM, SF, and SM groups was collected for transcriptome and metabolomics analyses. All samples were immediately frozen in liquid nitrogen and then stored at −80 °C before use.

4.3. Transcriptome Sequencing and Differential Expressed Genes Analysis

We constructed 24 sequencing libraries, six libraries for each group. The RNA for the muscle tissue was extracted by using a Trizol reagent kit (Invitrogen, Carlsbad, CA, USA). Furthermore, cDNA library construction and sequencing were performed on an Illumina NovaSeq 6000 platform, as previously described [59,60]. The quality check of raw sequence reads was performed via FastQC v0.11.2 [61]. Transcriptome assembly was accomplished using Trinity [62]. Gene function was annotated based on the following databases: Nr, the UniProt-SwissProt, KEGG, KOG, COG, GO, and the Pfam database. Gene expression levels were estimated via RSEM [63] for each sample. Gene levels were estimated as fragments per kilobase of transcript per million mapped reads (FPKM). Differential gene expression between the nitrite-treated and control groups was determined using DESeq2 (version 1.26.0). An absolute log2 fold change (FC) > 1 and false discovery rate (FDR) < 0.05 were set as the thresholds for differentially expressed genes (DEGs). The DEGs were further subjected to the GO and KEGG enrichment analyses [64].

4.4. qRT-PCR Validation

To validate the reliability of the transcriptome data, six DEGs (ccna2, cht2, ago2, fcn2, pim3, and tpi1) were selected to measure their mRNA expression levels by qRT-PCR. Total RNA from each group of 18 muscles was extracted with RNAiso Plus reagent (Takara Bio Inc., Beijing, China) and removed from contaminating genomic DNA with RNase-free DNase (Takara Bio Inc., Beijing, China). The OD values at 260 and 280 nm and their ratios (A260/A280 were 1.8–2.1) were used to assess the quality and quantity of the extracted RNA. cDNA was synthesized using 1 μg of extracted RNA and used to detect the expression of the target genes by quantitative real-time PCR (qRT-PCR) using the TB Green™ Premix Ex Taq™ II kit (Takara Bio Inc., Beijing, China). Furthermore, qRT-PCR was performed as follows: 95 °C for 30 s, followed by 40 cycles of 95 °C for 5 s and 60 °C for 1 min. The 2−∆∆Ct method [65] was used to calculate the relative expression levels of the target genes with β-actin as the housekeeping gene. The primers are shown in Table 2.

4.5. Metabolite Extraction and LC-MS/MS Analysis

The metabolomics analysis based on LC-MS/MS was performed on 24 muscle samples in E. sinensis with six bio-replicates of each group. Tissues of 80 mg were cut on dry ice and homogenized with 200 μL of H2O and five ceramic beads. Then, 800 μL of methanol/acetonitrile (1:1, v/v) was added to the homogenized solution for metabolite extraction. After the mixture was centrifuged for 15 min (14,000× g, 4 °C), the supernatant was dried and re-dissolved in 100 μL of acetonitrile/water (1:1, v/v) solvent. LC-MS/MS analysis was performed using a UHPLC system (Agilent 1290 Infinity LC, Thermo Fisher Scientific, Waltham, MA, USA) and an AB TripleTOF 6600 mass spectrometer was used for the acquisition of primary and secondary spectra of the samples.
Data were normalized to exclude QC sample variables with a relative standard deviation (RSD) greater than 30%. Autoscaling, mean-centering, and scaled-to-unit variance (UV) were performed before conducting Orthogonal Projections to Latent Structures Discriminant Analysis (OPLS-DA) [66] to perform automatic modeling analysis. Then, DEMs were identified by Variable Importance in the Projection, VIP > 1 and p < 0.05 [67], and analyzed with KOBAS and Fisher’s exact tests to explore the enriched KEGG pathways [68].

4.6. Transcriptomics-Metabolomics Co-Regulated Network Analysis

We first applied Weighted Gene Co-expression Network Analysis (WGCNA) to identify the modules significantly correlated with traits in both the transcriptomic and metabolomic datasets. Subsequently, the top 10 metabolites from the trait-associated modules were screened using Cytoscape v3.7.2. Finally, correlation analysis was performed between the trait-related genes and these selected metabolites. Pearson correlations between DEGs and DEMs were calculated using the Psych package from the R project (V3.6.2). Further screening results showed that the correlation coefficient was ≥0.80 with a p-value < 0.05. All DEGs and DEMs were mapped to the KEGG pathway database to screen for the primary genes and signaling pathways [69]. Cytoscape software (V3.7.2) was used to map the network regulation of the related results.

5. Conclusions

By integrating transcriptomic and metabolomic data, this study is the first to systematically reveal the differences in molecular regulatory mechanisms among crabs of different body sizes. This study found that larger female crabs exhibit significantly enhanced digestive functions, primarily reflected in the upregulation of trypsin-1 expression. This gene plays a pivotal role in pancreatic secretion, protein breakdown, and neuroactive ligand–receptor interactions, thereby regulating the growth and development of crabs. Further, a variety of tissue-specific proteins, such as APOLPP, RICK A, AGMO, and NEPHRIN, as well as REXO1L1P and ZCCHC24, which are related to RNA metabolism and gene expression stability, indirectly influence the growth and development of the crab through their respective functional pathways. In addition, the results revealed that key KEGG pathways, such as the ECM–receptor interaction, cell adhesion, and PI3K-Akt signaling pathway, play a central role in growth regulation.

Supplementary Materials

The following supporting information can be downloaded at: https://www.ncbi.nlm.nih.gov/bioproject/PRJNA1240068, accessed on 10 May 2025.

Author Contributions

S.C. collected samples, generated and analyzed data, wrote the original draft, and performed experiments; J.G. collected samples and designed and supervised the study; H.Z. collected samples and analyzed data; J.D., L.C. and Y.Z. reviewed the manuscript; G.X. and B.L. drew the figures, reviewed, edited the manuscript, administrated project and acquired funding. All authors have read and agreed to the published version of the manuscript.

Funding

This research was funded by Central Public-interest Scientific Institution Basal Research Fund, CAFS (2025JBFZ02, 2025JBFM09), National Key R&D Program of China (2022YFD2400700) and the earmarked fund for CARS-48.

Institutional Review Board Statement

This study was conducted in accordance with the guidelines of the Animal Care and Use Committee of Nanjing Agricultural University, Nanjing, China. The protocol was approved by the Animal Research Committee of Nanjing Agricultural University (permit number: SYXK (XU) 2023–0108; approved on 6 January 2023).

Informed Consent Statement

Not applicable.

Data Availability Statement

All the data of the transcriptome are available at the NCBI SRA database (PRJNA1240068).

Conflicts of Interest

The authors declare no conflicts of interest.

References

  1. Sui, L.Y.; Zhang, F.M.; Wang, X.M.; Bossier, P.; Sorgeloos, P.; Hänfling, B. Genetic diversity and population structure of the Chinese mitten crab Eriocheir sinensis in its native range. Mar. Biol. 2009, 156, 1573–1583. [Google Scholar] [CrossRef]
  2. Cheng, Y.X.; Wu, X.G.; Li, J.Y. Chinese mitten Crab Culture: Current Status and Recent Progress Towards Sustainable Development. Aquaculture 2018, 197–217. [Google Scholar] [CrossRef]
  3. Xu, F.; Xing, X.M.; Zhang, K.; Zhang, C. Status and prospects of product processing and sustainable utilization of Chinese mitten crab (Eriocheir sinensis). Heliyon 2024, 10, 32922. [Google Scholar] [CrossRef]
  4. Fishery administration Bureau of the ministry of agriculture and villages; National aquatic products technology extension station; China Society of Fisheries. China Fishery Statistical Yearbook; Chinese Agricultural Press: Beijing, China, 2024; p. 180. [Google Scholar]
  5. Wu, C.; Shan, J.F.; Feng, J.C.; Jiang, A.; Nie, G.X.; Wang, X.H. Changes in the growth, nutritional quality and gut microbiota of the adult Chinese mitten crab, Eriocheir sinensis, following overwinter rearing. Aquac. Res. 2022, 53, 1348–1362. [Google Scholar] [CrossRef]
  6. Fruchtman, S.; Jackson, L.; Borski, R. Insulin-like growth factor I disparately regulates prolactin and growth hormone synthesis and secretion: Studies using the teleost pituitary model. Endocrinology 2000, 141, 2886–2894. [Google Scholar] [CrossRef] [PubMed]
  7. Picha, M.E.; Strom, C.N.; Riley, L.G.; Walker, A.A.; Won, E.T.; Johnstone, W.M.; Borski, R.J. Plasma ghrelin and growth hormone regulation in response to metabolic state in hybrid striped bass: Effects of feeding, ghrelin and insulin-like growth factor-I on in vivo and in vitro GH secretion. Gen. Comp. Endocr. 2009, 161, 365–372. [Google Scholar] [CrossRef]
  8. Peterson, B.C.; Waldbieser, G.C.; Bilodeau, L. IGF-I and IGF-II mRNA expression in slow and fast-growing families of USDA103 channel catfish (Ictalurus punctatus). Comp. Biochem. Phys. A 2004, 139, 317–323. [Google Scholar] [CrossRef]
  9. Huang, C.W.; Li, Y.H.; Hu, S.Y.; Chi, J.R.; Lin, G.H.; Lin, C.C.; Gong, H.Y.; Chen, J.Y.; Chen, R.H.; Chang, S.J.; et al. Differential expression patterns of growth-related microRNAs in the skeletal muscle of Nile tilapia (Oreochromis niloticus). J. Anim. Sci. 2012, 90, 4266–4279. [Google Scholar] [CrossRef]
  10. Salem, M.; Vallejo, R.L.; Leeds, T.D.; Palti, Y.; Liu, S.; Sabbagh, A.; Rexroad, C.E., 3rd; Yao, J. RNA-Seq identifies SNP markers for growth traits in rainbow trout. PLoS ONE 2012, 7, e36264. [Google Scholar] [CrossRef]
  11. Liu, D.R.; Zhang, J.; Zou, Z.J.; Long, C.; Lin, J.Q.; Zeng, J.Y.; Hou, J.P.; Han, L.Q.; Jiang, Y.L.; Li, S.S.; et al. Identification of SNPs and candidate genes associate with growth performance in all-female mandarin fish (Siniperca chuatsi) by a genome-wide association study. Aquaculture 2024, 586, 740778. [Google Scholar] [CrossRef]
  12. Ulloa, P.E.; Rincón, G.; Islas-Trejo, A.; Araneda, C.; Iturra, P.; Neira, R.; Medrano, J.F. RNA Sequencing to Study Gene Expression and SNP Variations Associated with Growth in Zebrafish Fed a Plant Protein-Based Diet. Mar. Biotechnol. 2015, 17, 353–363. [Google Scholar] [CrossRef] [PubMed]
  13. Robledo, D.; Rubiolo, J.A.; Cabaleiro, S.; Martínez, P.; Bouza, C. Differential gene expression and SNP association between fast- and slow-growing turbot (Scophthalmus maximus). Sci. Rep.-UK 2017, 7, 12105. [Google Scholar] [CrossRef]
  14. Kim, E.Y.; Choi, Y.H. Regulation of adductor muscle growth by the IGF-1/AKT pathway in the triploid Pacific oyster, Crassostrea gigas. Fish. Aquat. Sci. 2019, 22, 19. [Google Scholar] [CrossRef]
  15. Li, Y.; Fu, H.; Zhang, F.; Ren, L.; Tian, J.; Li, Q.; Liu, S. Insulin-Like Peptide Receptor-Mediated Signaling Pathways Orchestrate Regulation of Growth in the Pacific Oyster (Crassostrea gigas), as Revealed by Gene Expression Profiles. Int. J. Mol. Sci. 2021, 22, 5259. [Google Scholar] [CrossRef] [PubMed]
  16. Liu, R.C.; Lin, X.R.; Hu, J.H.; Yang, J.J.; Li, X.G.; Wang, G.; Yang, Y.Z.; Chen, Y.C.; Pan, J.L.; Guan, W.B.; et al. Analysis of molecular advantages in offspring of large-sized Chinese mitten crabs based on reproductive lineage. Aquaculture 2025, 596, 741870. [Google Scholar] [CrossRef]
  17. Zhang, C.; Song, X.Z.; Zhang, Q.; Pang, Y.Y..; Lv, J.H.; Tang, B.P.; Cheng, Y.X.; Yang, X.Z. Changes in bud morphology, growth-related genes and nutritional status during cheliped regeneration in the Chinese mitten crab, Eriocheir sinensis. PLoS ONE 2018, 13, e0209617. [Google Scholar] [CrossRef] [PubMed]
  18. Riddiford, L.M.; Hiruma, K.; Zhou, X.F.; Nelson, C.A. Insights into the molecular basis of the hormonal control of molting and metamorphosis from Manduca sexta and Drosophila melanogaster. Insect Biochem. Molec. 2003, 33, 1327–1338. [Google Scholar] [CrossRef]
  19. Perazzolo, L.M.; Barracco, M.A. The prophenoloxidase activating system of the shrimp Penaeus paulensis and associated factors. Dev. Comp. Immunol. 1997, 21, 385–395. [Google Scholar] [CrossRef]
  20. Alvarez, J.V.; Chung, J.S. The Involvement of Hemocyte Prophenoloxidase in the Shell-Hardening Process of the Blue Crab, Callinectes sapidus. PLoS ONE 2015, 10, e0136916. [Google Scholar] [CrossRef]
  21. Maszczyk, P.; Brzeziński, T. Body Size, Maturation Size, and Growth Rate of Crustaceans. Life Hist. 2018, 5, 35–65. [Google Scholar]
  22. Tamayo, D.; Ibarrola, I.; Urrutxurtu, I.; Navarro, E. Physiological basis of extreme growth rate differences in the spat of oyster (Crassostrea gigas). Mar. Biol. 2014, 161, 1627–1637. [Google Scholar] [CrossRef]
  23. Tamayo, D.; Azpeitia, K.; Markaide, P.; Navarro, E.; Ibarrola, I. Food regime modulates physiological processes underlying size differentiation in juvenile intertidal mussels Mytilus galloprovincialis. Mar. Biol. 2016, 163, 131. [Google Scholar] [CrossRef]
  24. Guo, X.M.; Luo, T.; Han, D.M.; Zhu, D.F.; Li, Z.Y.; Wu, Z.Y.; Wu, Z.X. Multi-omics analysis revealed room temperature storage affected the quality of litchi by altering carbohydrate metabolism. Sci. Hortic. 2022, 293, 110663. [Google Scholar] [CrossRef]
  25. Niu, J.; Lin, H.Z.; Jiang, S.G.; Chen, X.; Wu, K.C.; Liu, Y.J.; Wang, S.; Tian, L.X. Comparison of effect of chitin, chitosan, chitosan oligosaccharide and N-acetyl-d-glucosamine on growth performance, antioxidant defenses and oxidative stress status of Penaeus monodon. Aquaculture 2013, 372–375, 1–8. [Google Scholar] [CrossRef]
  26. Huang, X.S.; Ye, H.H.; Feng, B.Y.; Huang, H.Y. Insights into insulin-like peptide system in invertebrates from studies on IGF binding domain-containing proteins in the female mud crab, Scylla paramamosain. Mol. Cell. Endocrinol. 2015, 416, 36–45. [Google Scholar] [CrossRef]
  27. Liu, J.D.; Li, E.; Li, X.Y.; Wang, X.D.; Huang, Q.C.; Wang, H.; Miao, Y.X.; Shi, Q.C.; Qin, J.G.; Chen, L.Q. Effects of dietary methionine on the growth and protein synthesis of juvenile Chinese mitten crabs (Eriocheir sinensis) fed fish meal-free diets. Anim. Nutr. 2024, 19, 226–239. [Google Scholar] [CrossRef]
  28. Deng, H.W.; Xian, D.R.; Lian, T.X.; He, M.Y.; Li, J.J.; Xu, X.P.; Guo, Z.X.; He, J.G.; Weng, S.P. A Dicer2 from Scylla paramamosain activates JAK/STAT signaling pathway to restrain mud crab reovirus. Dev. Comp. Immuno. 2022, 127, 104267. [Google Scholar] [CrossRef] [PubMed]
  29. Quijada-Rodriguez, A.R.; Allen, G.J.P.; Nash, M.T.; Weihrauch, D. Postprandial nitrogen and acid-base regulation in the seawater acclimated green crab, Carcinus maenas. Comp. Biochem. Phys. A 2022, 267, 111171. [Google Scholar] [CrossRef]
  30. James, M.O.; Boyle, S.M. Cytochromes P450 in crustacea1This article was invited by Guest Editors Dr John J. Stegeman and Dr David R. Livingstone to be part of a special issue of CBP on cytochrome P450. Comp. Biochem. Phys. C 1998, 121, 157–172. [Google Scholar]
  31. Cheng, C.H.; Zhang, S.F.; Ma, H.L.; Liu, G.X.; Fan, S.G.; Deng, Y.Q.; Jiang, J.J.; Feng, J.; Guo, Z.X. Essential role of the Cytochrome P450 2 (CYP2) in the mud crab Scylla paramamosain antioxidant defense and immune responses. Fish Shellfish Immun. 2023, 135, 108674. [Google Scholar] [CrossRef]
  32. Ticho, A.L.; Malhotra, P.; Dudeja, P.K.; Gill, R.K.; Alrefai, W.A. Intestinal Absorption of Bile Acids in Health and Disease. Compr. Physiol. 2019, 10, 21–56. [Google Scholar] [CrossRef] [PubMed]
  33. Wu, D.T.; Xu, H.Y.; Feng, W.P.; Yang, Y.X.; Han, T.; Wang, J.T. Optimal dietary lysine improves the growth performance, molting frequency, lipid metabolism, immunity and antioxidant of postlarval mud crab Scylla paramamosain. Aquaculture 2024, 579, 740145. [Google Scholar] [CrossRef]
  34. Sailer, S.; Keller, M.A.; Werner, E.R.; Watschinger, K. The Emerging Physiological Role of AGMO 10 Years after Its Gene Identification. Life 2021, 11, 88. [Google Scholar] [CrossRef]
  35. Qin, G.K.; Hu, X.; Cebe, P.; Kaplan, D.L. Mechanism of resilin elasticity. Nat. Commun. 2012, 3, 1003. [Google Scholar] [CrossRef]
  36. Lenkkeri, U.; Männikkö, M.; McCready, P.; Lamerdin, J.; Gribouval, O.; Niaudet, P.M.; Antignac, C.K.; Kashtan, C.E.; Homberg, C.; Olsen, A.; et al. Structure of the gene for congenital nephrotic syndrome of the finnish type (NPHS1) and characterization of mutations. Am. J. Hum. Genet. 1999, 64, 51–61. [Google Scholar] [CrossRef] [PubMed]
  37. Meneguello, L. Investigating Tolerance Mechanisms to Oncogene-Induced Genome Instability. Ph.D Thesis, University College London, London, UK, 2024. [Google Scholar]
  38. Palm, W.; Sampaio, J.L.; Brankatschk, M.; Carvalho, M.; Mahmoud, A.; Shevchenko, A.; Eaton, S. Lipoproteins in Drosophila melanogaster-Assembly, Function, and Influence on Tissue Lipid Composition. PloS Genet. 2012, 8, e1002828. [Google Scholar] [CrossRef]
  39. Kolasa, A.M.; Bhogal, J.K.; DiAngelo, J.R. The heterogeneous nuclear ribonucleoprotein (hnRNP) glorund functions in the Drosophila fat body to regulate lipid storage and transport. Biochem. Biophys. Rep. 2021, 25, 100919. [Google Scholar] [CrossRef]
  40. Lee, S.; Bao, H.; Ishikawa, Z.; Wang, W.; Lim, H.Y. Cardiomyocyte Regulation of Systemic Lipid Metabolism by the Apolipoprotein B-Containing Lipoproteins in Drosophila. PLoS Genet. 2017, 13, 1006555. [Google Scholar] [CrossRef]
  41. Velleman, S.G. Role of the extracellular matrix in muscle growth and development. J. Anim. Sci. 2002, 80, E8–E13. [Google Scholar] [CrossRef]
  42. Hao, R.J.; Du, X.D.; Yang, C.Y.; Deng, Y.W.; Zheng, Z.; Wang, Q.H. Integrated application of transcriptomics and metabolomics provides insights into unsynchronized growth in pearl oyster Pinctada fucata martensii. Sci. Total Environ. 2019, 666, 46–56. [Google Scholar] [CrossRef]
  43. Stricker, J.; Aratyn-Schaus, Y.; Oakes, P.W.; Gardel, M.L. Spatiotemporal Constraints on the Force-Dependent Growth of Focal Adhesions. Biophys. J. 2011, 100, 2883–2893. [Google Scholar] [CrossRef] [PubMed]
  44. Flück, M.; Carson, J.A.; Gordon, S.E.; Ziemiecki, A.; Booth, F.W. Focal adhesion proteins FAK and paxillin increase in hypertrophied skeletal muscle. Am. J. Physiol. 1999, 277, C152–C162. [Google Scholar] [CrossRef] [PubMed]
  45. Guo, S. Molecular Basis of Insulin Resistance: The Role of IRS and Foxo1 in the Control of Diabetes Mellitus and Its Complications. Drug Discov. Today Dis. Mech. 2013, 10, e27–e33. [Google Scholar] [CrossRef] [PubMed]
  46. Han, B.; Yuan, Y.W.; Shi, L.J.; Li, Y.H.; Liu, L.; Sun, D.X. Identification of single nucleotide polymorphisms of PIK3R1 and DUSP1 genes and their genetic associations with milk production traits in dairy cows. J. Anim. Sci. Biotechno. 2019, 10, 81. [Google Scholar] [CrossRef]
  47. Sofia, V.M.; Da Sacco, L.; Surace, C.; Tomaiuolo, A.C.; Genovese, S.; Grotta, S.; Gnazzo, M.; Ciocca, L.; Petrocchi, S.; Alghisi, F.; et al. Extensive molecular analysis suggested the strong genetic heterogeneity of idiopathic chronic pancreatitis. Mol. Med. 2016, 22, 300–309. [Google Scholar] [CrossRef]
  48. Berni Canani, R.; Terrin, G.; Cardillo, G.; Tomaiuolo, R.; Castaldo, G. Congenital diarrheal disorders: Improved understanding of gene defects is leading to advances in intestinal physiology and clinical management. J. Pediatr. Gastroenterol Nutr. 2010, 50, 360–366. [Google Scholar] [CrossRef]
  49. Yarar, D.; To, W.; Abo, A.; Welch, M.D. The Wiskott-Aldrich syndrome protein directs actin-based motility by stimulating actin nucleation with the Arp2/3 complex. Curr. Biol. 1999, 9, 555–558. [Google Scholar] [CrossRef]
  50. Uruno, T.; Zhang, P.; Liu, J.; Hao, J.J.; Zhan, X. Haematopoietic lineage cell-specific protein 1 (HS1) promotes actin-related protein (Arp) 2/3 complex-mediated actin polymerization. Biochem. J. 2003, 371 Pt 2, 485–493. [Google Scholar] [CrossRef]
  51. Uruno, T.; Liu, J.; Zhang, P.; Fan, Y.; Egile, C.; Li, R.; Mueller, S.C.; Zhan, X. Activation of Arp2/3 complex-mediated actin polymerization by cortactin. Nat. Cell Biol. 2001, 3, 259–266. [Google Scholar] [CrossRef]
  52. Gouin, E.; Egile, C.; Dehoux, P.; Villiers, V.; Adams, J.; Gertler, F.; Li, R.; Cossart, P. The RickA protein of Rickettsia conorii activates the Arp2/3 complex. Nature 2004, 427, 457–461. [Google Scholar] [CrossRef]
  53. Mullins, R.D.; Heuser, J.A.; Pollard, T.D. The interaction of Arp2/3 complex with actin: Nucleation, high affinity pointed end capping, and formation of branching networks of filaments. Proc. Natl. Acad. Sci. USA 1998, 95, 6181–6186. [Google Scholar] [CrossRef]
  54. Duncan, A.R.; González, D.P.; Del Viso, F.; Robson, A.; Khokha, M.K.; Griffin, J.N. Alkylglycerol monooxygenase, a heterotaxy candidate gene, regulates left-right patterning via Wnt signaling. Dev. Biol. 2019, 456, 1–7. [Google Scholar] [CrossRef] [PubMed]
  55. Alrayes, N.; Mohamoud, H.S.; Ahmed, S.; Almramhi, M.M.; Shuaib, T.M.; Wang, J.; Al-Aama, J.Y.; Everett, K.; Nasir, J.; Jelani, M. The alkylglycerol monooxygenase (AGMO) gene previously involved in autism also causes a novel syndromic form of primary microcephaly in a consanguineous Saudi family. J. Neurol. Sci. 2016, 363, 240–244. [Google Scholar] [CrossRef]
  56. Okur, V.; Watschinger, K.; Niyazov, D.; McCarrier, J.; Basel, D.; Hermann, M.; Werner, E.R.; Chung, W.K. Biallelic variants in AGMO with diminished enzyme activity are associated with a neurodevelopmental disorder. Hum. Genet. 2019, 138, 1259–1266. [Google Scholar] [CrossRef]
  57. Patrakka, J.; Kestilä, M.; Wartiovaara, J.; Ruotsalainen, V.; Tissari, P.; Lenkkeri, U.; Männikkö, M.; Visapää, I.; Holmberg, C.; Rapola, J.; et al. Congenital nephrotic syndrome (NPHS1): Features resulting from different mutations in Finnish patients. Kidney Int. 2000, 58, 972–980. [Google Scholar] [CrossRef]
  58. Uchida, Y.; Kurimoto, R.; Chiba, T.; Matsushima, T.; Oda, G.; Onishi, I.; Takeuchi, Y.; Gotoh, N.; Asahara, H. RNA binding protein ZCCHC24 promotes tumorigenicity in triple-negative breast cancer. Empo. Rep. 2024, 25, 5352–5382. [Google Scholar] [CrossRef] [PubMed]
  59. Gao, J.C.; Tai, X.F.; Shao, N.L.; Sun, Y.; Nie, Z.J.; Wang, Y.Y.; Li, Q.J.; Xu, P.; Xu, G.C. Effects of effective microorganisms on the growth performance, nutritional composition and flavour quality of the pond-cultured (Eriocheir sinensis). Aquac. Res. 2021, 52, 871–880. [Google Scholar] [CrossRef]
  60. Wang, L.M.; Gao, J.C.; Cao, X.; Du, J.L.; Cao, L.P.; Nie, Z.J.; Xu, G.C.; Dong, Z.J. Integrated Analysis of Transcriptomics and Metabolomics Unveil the Novel Insight of One-Year-Old Precocious Mechanism in the Chinese Mitten Crab, Eriocheir sinensis. Int. J. Mol. Sci. 2023, 24, 11171. [Google Scholar] [CrossRef]
  61. Schmieder, R.; Edwards, R. Quality control and preprocessing of metagenomic datasets. Bioinformatics 2011, 27, 863–864. [Google Scholar] [CrossRef]
  62. Grabherr, M.G.; Haas, B.J.; Yassour, M.; Levin, J.Z.; Thompson, D.A.; Amit, I.; Adiconis, X.; Fan, L.; Raychowdhury, R.; Zeng, Q.; et al. Full-length transcriptome assembly from RNA-Seq data without a reference genome. Nat. Biotechnol. 2011, 29, 644–652. [Google Scholar] [CrossRef]
  63. Li, B.; Dewey, C.N. RSEM: Accurate transcript quantification from RNA-Seq data with or without a reference genome. BMC Bioinform. 2011, 12, 323. [Google Scholar] [CrossRef] [PubMed]
  64. Duan, G.C.; Chen, X.B.; Hou, Y.R.; Jiang, T.; Liu, H.B.; Yang, J. Combined transcriptome and metabolome analysis reveals the mechanism of high nitrite tolerance in freshwater mussel Anodonta woodiana. Comp. Biochem. Phys. D 2024, 52, 101359. [Google Scholar] [CrossRef] [PubMed]
  65. Livak, K.J.; Schmittgen, T.D. Analysis of relative gene expression data using real-time quantitative PCR and the 2(-Delta Delta C(T)) Method. Methods 2001, 25, 402–408. [Google Scholar] [CrossRef] [PubMed]
  66. Trygg, J.; Wold, S. Orthogonal projections to latent structures (O-PLS). J. Chemometr. 2002, 16, 119–128. [Google Scholar] [CrossRef]
  67. Saccenti, E.; Hoefsloot, H.C.J.; Smilde, A.K.; Westerhuis, J.A.; Hendriks, M.M.W.B. Reflections on univariate and multivariate analysis of metabolomics data. Metabolomics. 2014, 10, 361–374. [Google Scholar] [CrossRef]
  68. Xia, J.; Sinelnikov, I.V.; Han, B.; Wishart, D.S. MetaboAnalyst 3.0--making metabolomics more meaningful. Nucleic Acids Res. 2015, 43, W251–W257. [Google Scholar] [CrossRef]
  69. Chen, Y.Y.; Wu, X.Y.; Lai, J.S.; Liu, Y.; Song, M.J.; Li, F.Y.; Gong, Q. Integrated biochemical, transcriptomic and metabolomic analyses provide insight into heat stress response in Yangtze sturgeon (Acipenser dabryanus). Ecotox. Environ. Safe. 2023, 249, 114366. [Google Scholar] [CrossRef]
Figure 1. Transcriptome gene differential analysis and differential gene enrichment analysis. Volcano plot maps and summary of DEGs in the comparison of BFSF (A) and BMSM (B). The red and yellow dots show significantly upregulated genes and downregulated genes, respectively. Scatter plot of the top 20 KEGG enrichment pathways of DEGs in BFSF (C) and BMSM (D). The larger the enrichment factor in the scatter plot, the more significant the enrichment level of the DEGs in this pathway. The color of the dot represents the q value, and the size of the dot represents the number of DEGs in the pathway.
Ijms 26 04617 g001
Figure 2. Comparison of relative gene expressions between RNASeq and qRTPCR data.
Ijms 26 04617 g002
Figure 3. Differential metabolites analysis and differential metabolites enrichment analysis. (A) A scatter plot of multiple sets of differences between upregulated and downregulated DEMs. Volcano plot of the differential metabolites in BFSF (B) and BMSM (C) under anion (Pos) and cation (Neg) modes. Scatter plot of the top 20 KEGG enrichment pathways of DEMs in BFSF (D) and BMSM (E).
Ijms 26 04617 g003
Figure 4. All gene expression results of WGCNA analysis. (A) The cluster tree shows 25 coexpressed gene modules identified by WGCNA with different colors. (B) Heat map showing module body weight correlations. The column corresponds to body weight. Each row corresponds to a module indicated by different colors. The red color indicates a positive correlation between the cluster and the tissue. The blue color indicates a negative correlation, * p < 0.05.
Ijms 26 04617 g004
Figure 5. All metabolite results from the WGCNA analysis. (A) The cluster tree shows 25 metabolite modules identified by WGCNA with different colors. (B) Heat map showing module body weight correlations, * p < 0.05, ** p < 0.01.
Ijms 26 04617 g005
Figure 6. Co-expression network between key genes and hub metabolites related to the body weight of E. sinensis. The ellipses are key genes; rectangles are hub metabolites; gray lines indicate positive correlations.
Ijms 26 04617 g006
Figure 7. Key genes enrichment KEGG pathway.
Ijms 26 04617 g007
Table 1. Top 10 hub metabolites in each module.
Modules
DarkgreyIvoryDarkorange2SteelblueLightcyan1Coral1
M934T411_2_POSM273T413_1_NEGM1143T298_POSM74T375_POSM263T30_NEGM368T388_NEG
M1173T410_POSM96T413_NEGM499T298_NEGM166T374_POSM527T31_NEGM513T382_NEG
M1162T410_4_POSM724T155_POSM376T298_POSM206T380_POSM237T31_NEGM552T387_NEG
M1172T410_4_POSM275T412_NEGM822T298_POSM75T374_POSM551T30_NEGM697T382_NEG
M1172T410_1_POSM289T413_NEGM374T298_NEGM351T370_NEGM309T28_POSM144T306_NEG
M1162T410_1_POSM135T413_NEGM251T298_POSM506T394_NEGM573T26_1_NEGM475T377_NEG
M1162T410_3_POSM253T413_POSM626T298_POSM204T380_POSM249T30_NEGM551T383_NEG
M1181T410_2_POSM439T153_1_POSM624T298_NEGM263T255_NEGM262T55_NEGM130T295_POS
M1172T410_2_POSM273T413_2_NEGM874T298_NEGM242T404_1_POSM549T26_NEGM446T389_POS
M1182T410_1_POSM137T413_NEGM564T298_POSM263T354_POSM187T86_POSM611T383_NEG
Table 2. The primers and sequences referred to in the experiment.
PrimersPositionPrimer SequenceAccession No.
ccna2ForwardCACCCATATGGTCAAGGAGCTAAXM_050835160.1
ReverseCTCTGATATGGAGAACTCCAGGC
cht2ForwardAACACCACCTACACCATGAAGTCXM_050884678.1
ReverseTTCTTGTCCACGAACCTCTCAAG
ago2ForwardGATGGAGTAGGAAAGTCAGGCAAXM_050835160.1 P
ReverseTGATTGTGTTGTCCACTGTTGTG
fcn2ForwardTGAATCACTACGACAACCGACCXM_050849112.1
ReverseGTACACTTGGCGAATGCCCTTG
pim3ForwardCGACTTAATGCTACAGGTGGTGAXM_050869002.1
ReverseCAGGTTCTCGTCCTTGATGTCG
tpi1ForwardACAGAACTGCTACAAGGAACCACXM_050875155.1
ReverseCCAAGGATCACCCACTCACATC
β-actinForwardTCATCACCATCGGCAATGAXM_050843215.1
ReverseTTGTAAGTGGTCTCGTGGATG
Disclaimer/Publisher’s Note: The statements, opinions and data contained in all publications are solely those of the individual author(s) and contributor(s) and not of MDPI and/or the editor(s). MDPI and/or the editor(s) disclaim responsibility for any injury to people or property resulting from any ideas, methods, instructions or products referred to in the content.

