
Peroxisome Proliferator-Activated Receptors (PPARs) May Mediate the Neuroactive Effects of Probiotic Metabolites: An In Silico Approach

 ,
,  , , , , and
Abstract
1. Introduction
2. Results
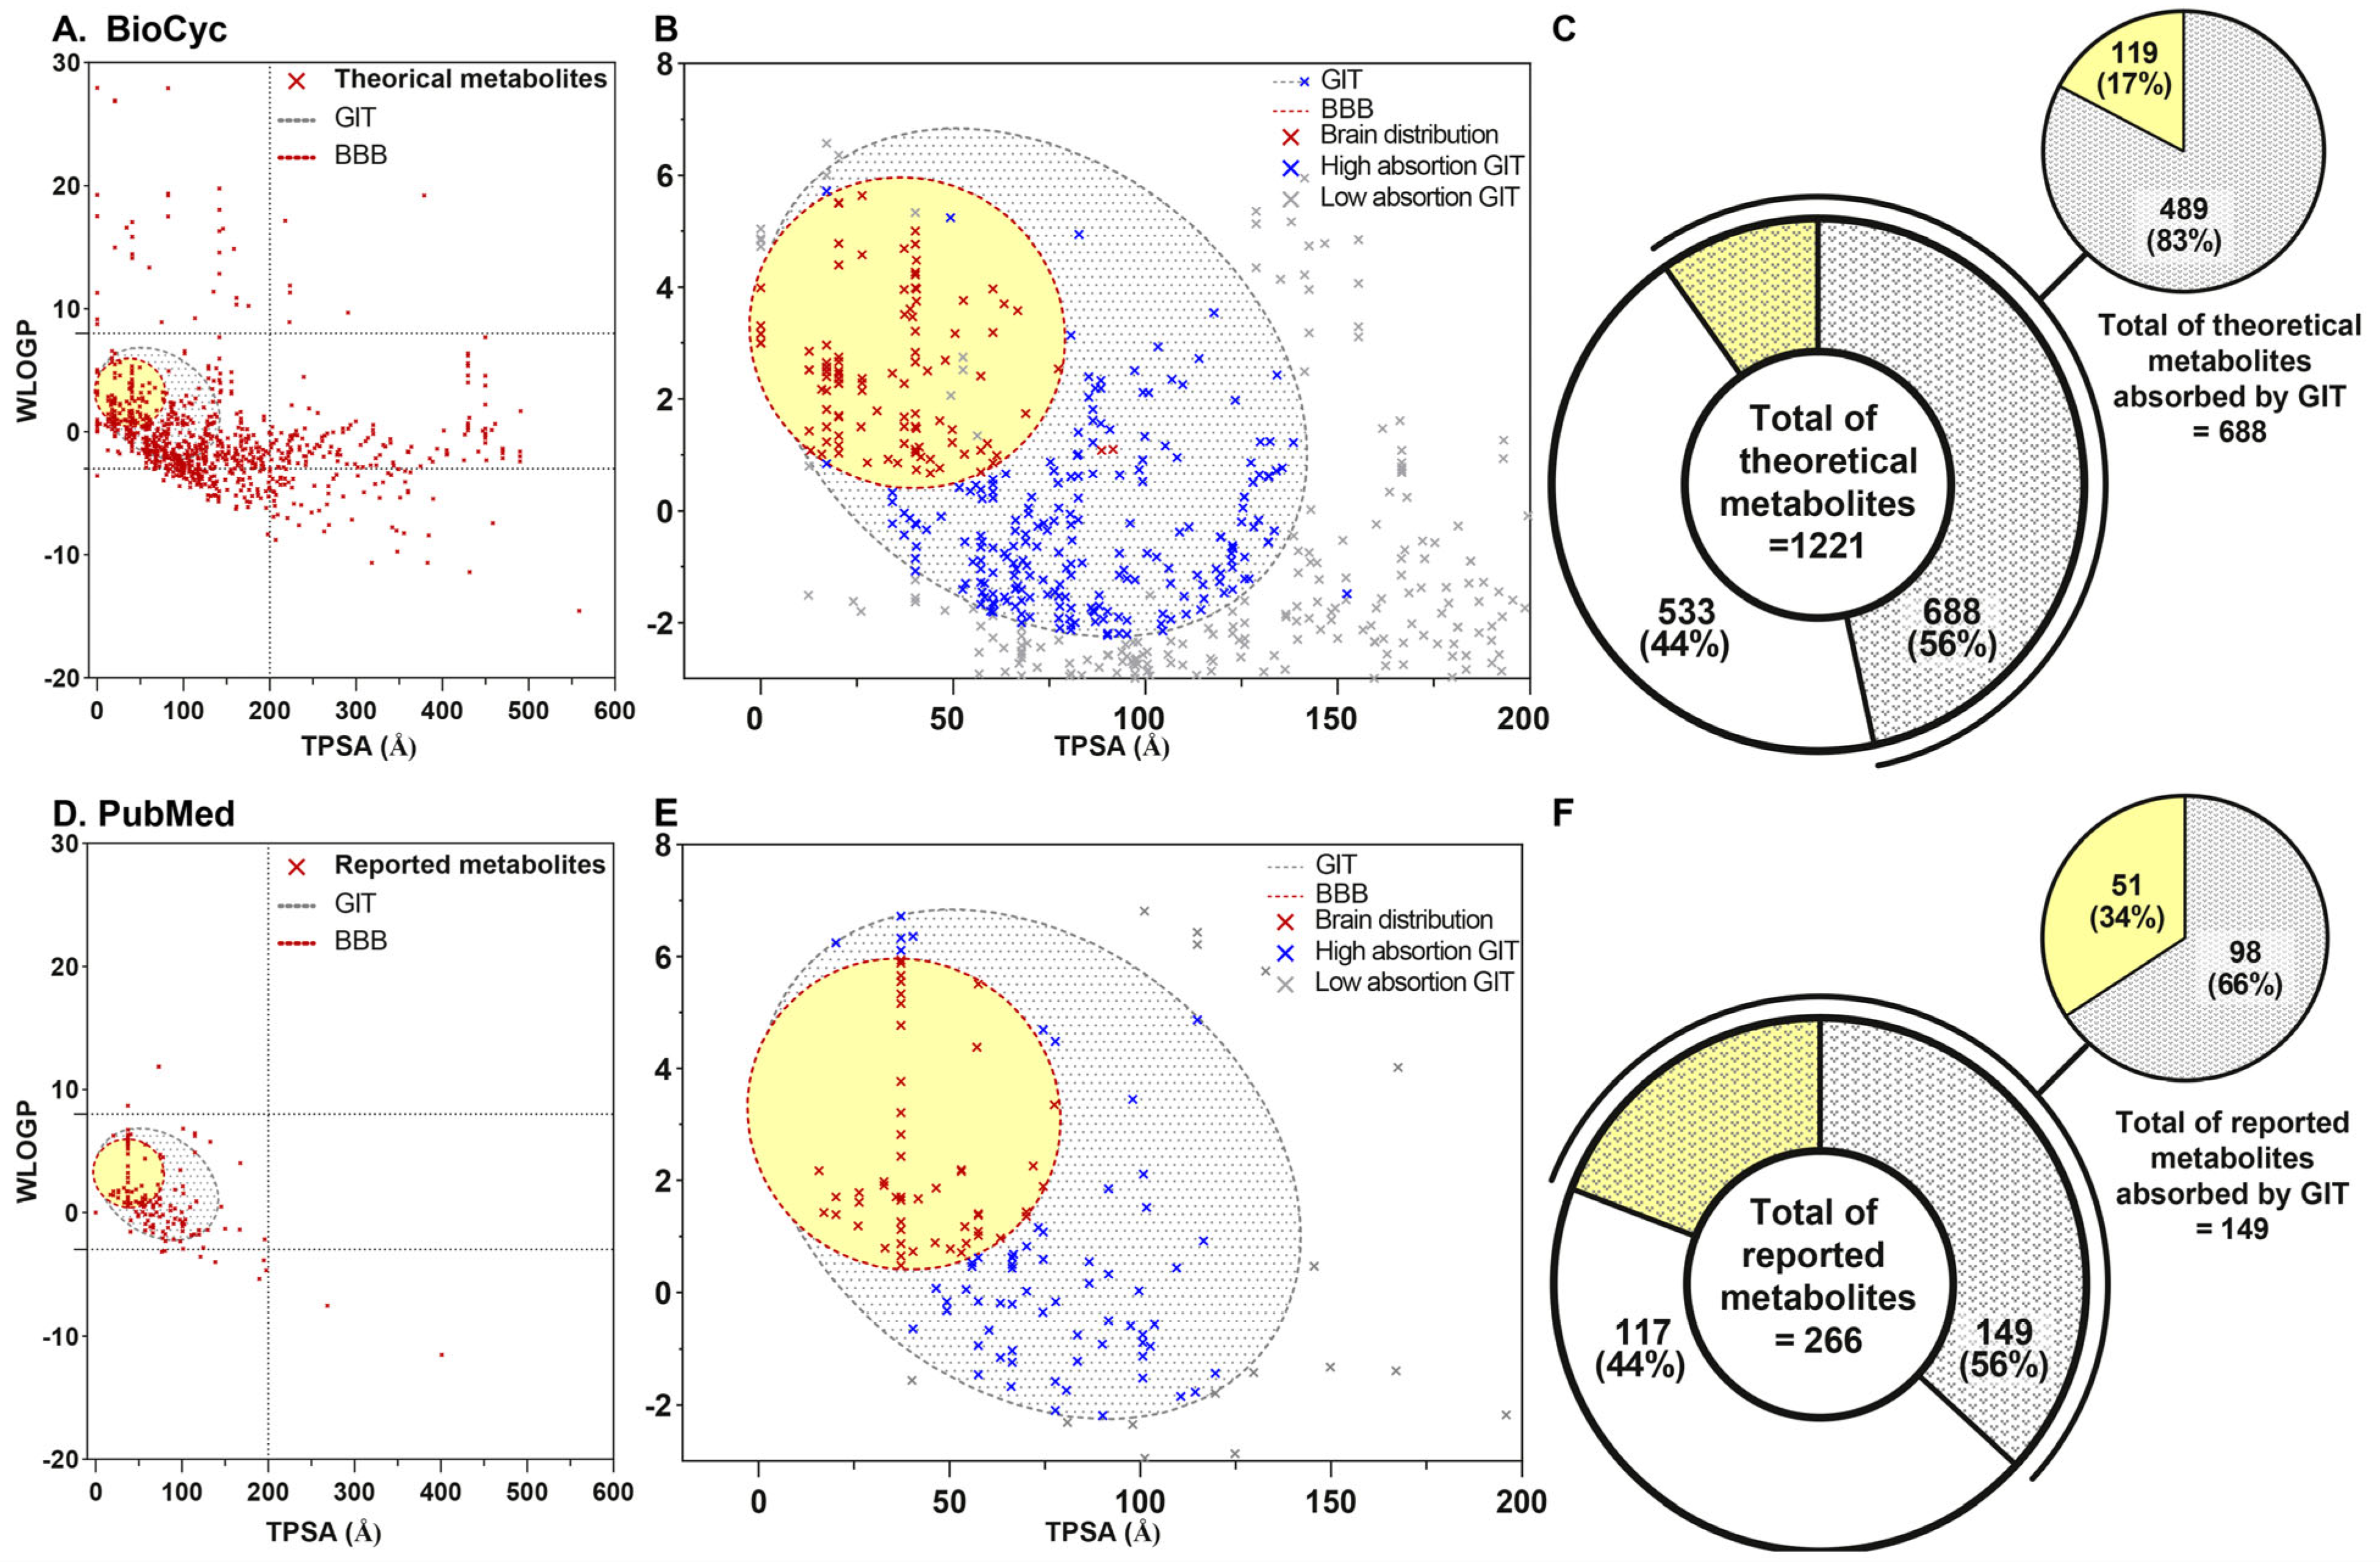
2.1. Structural Similarity Analysis
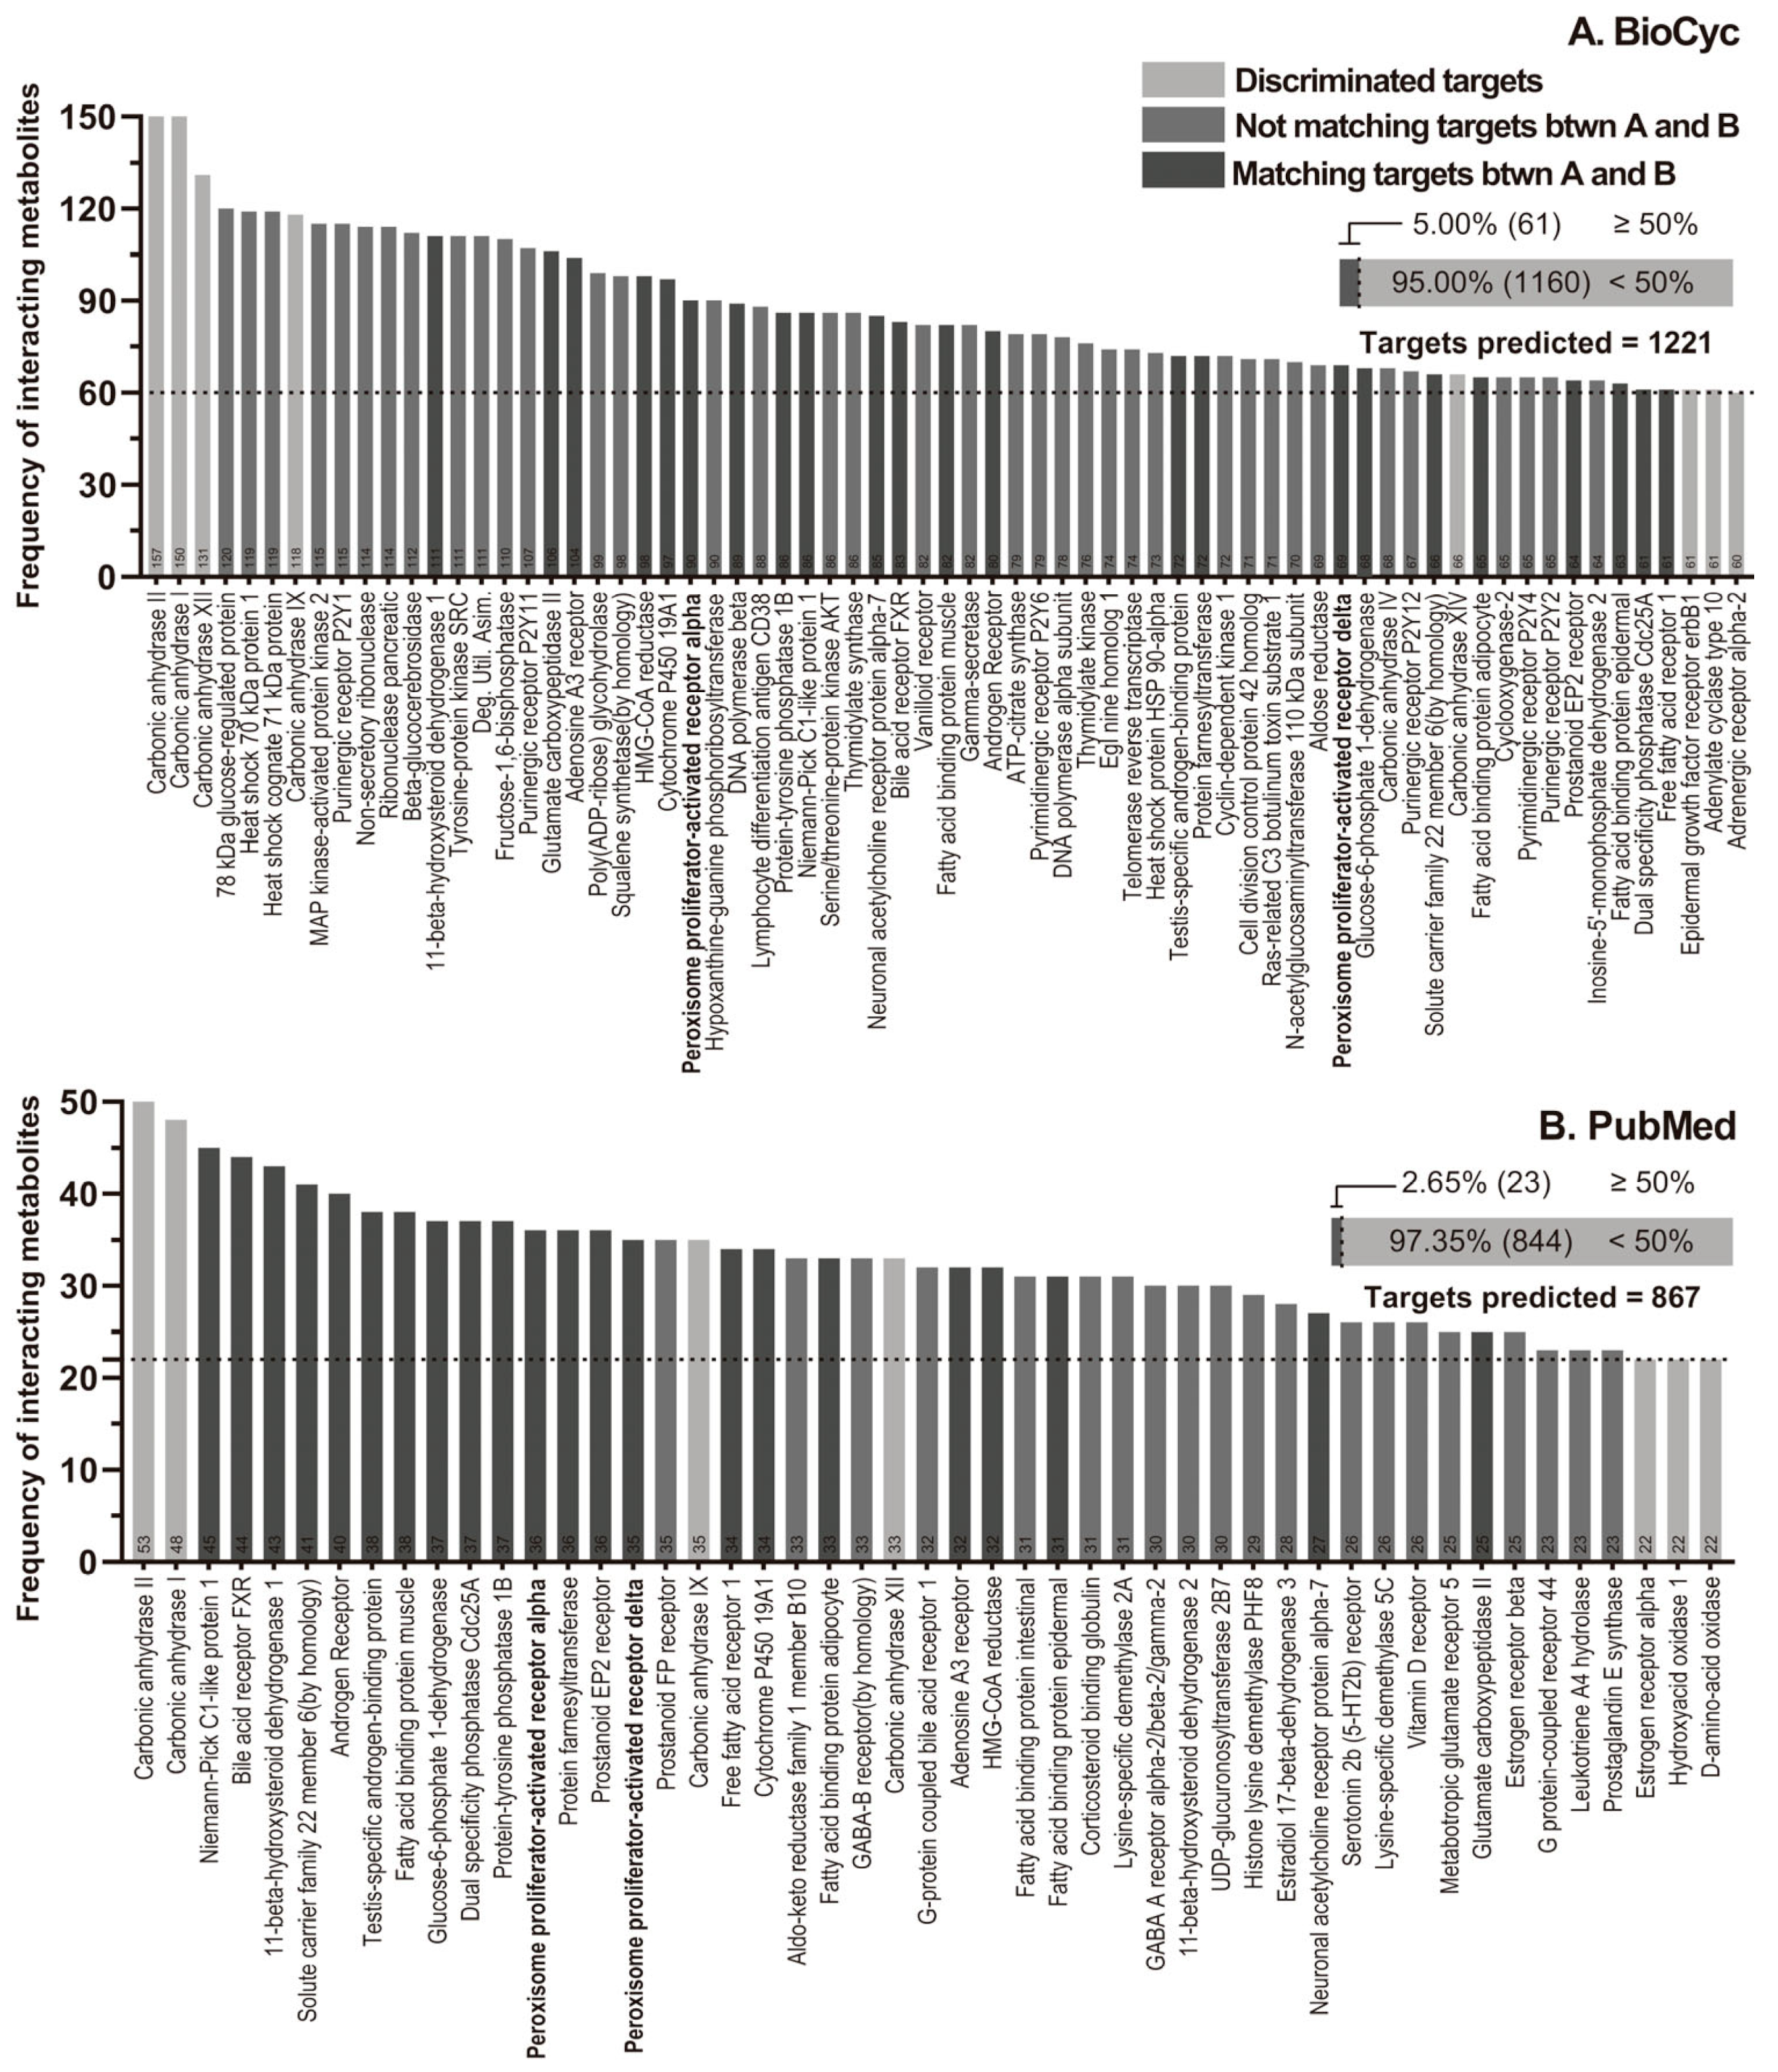
2.2. Molecular Targets Selection
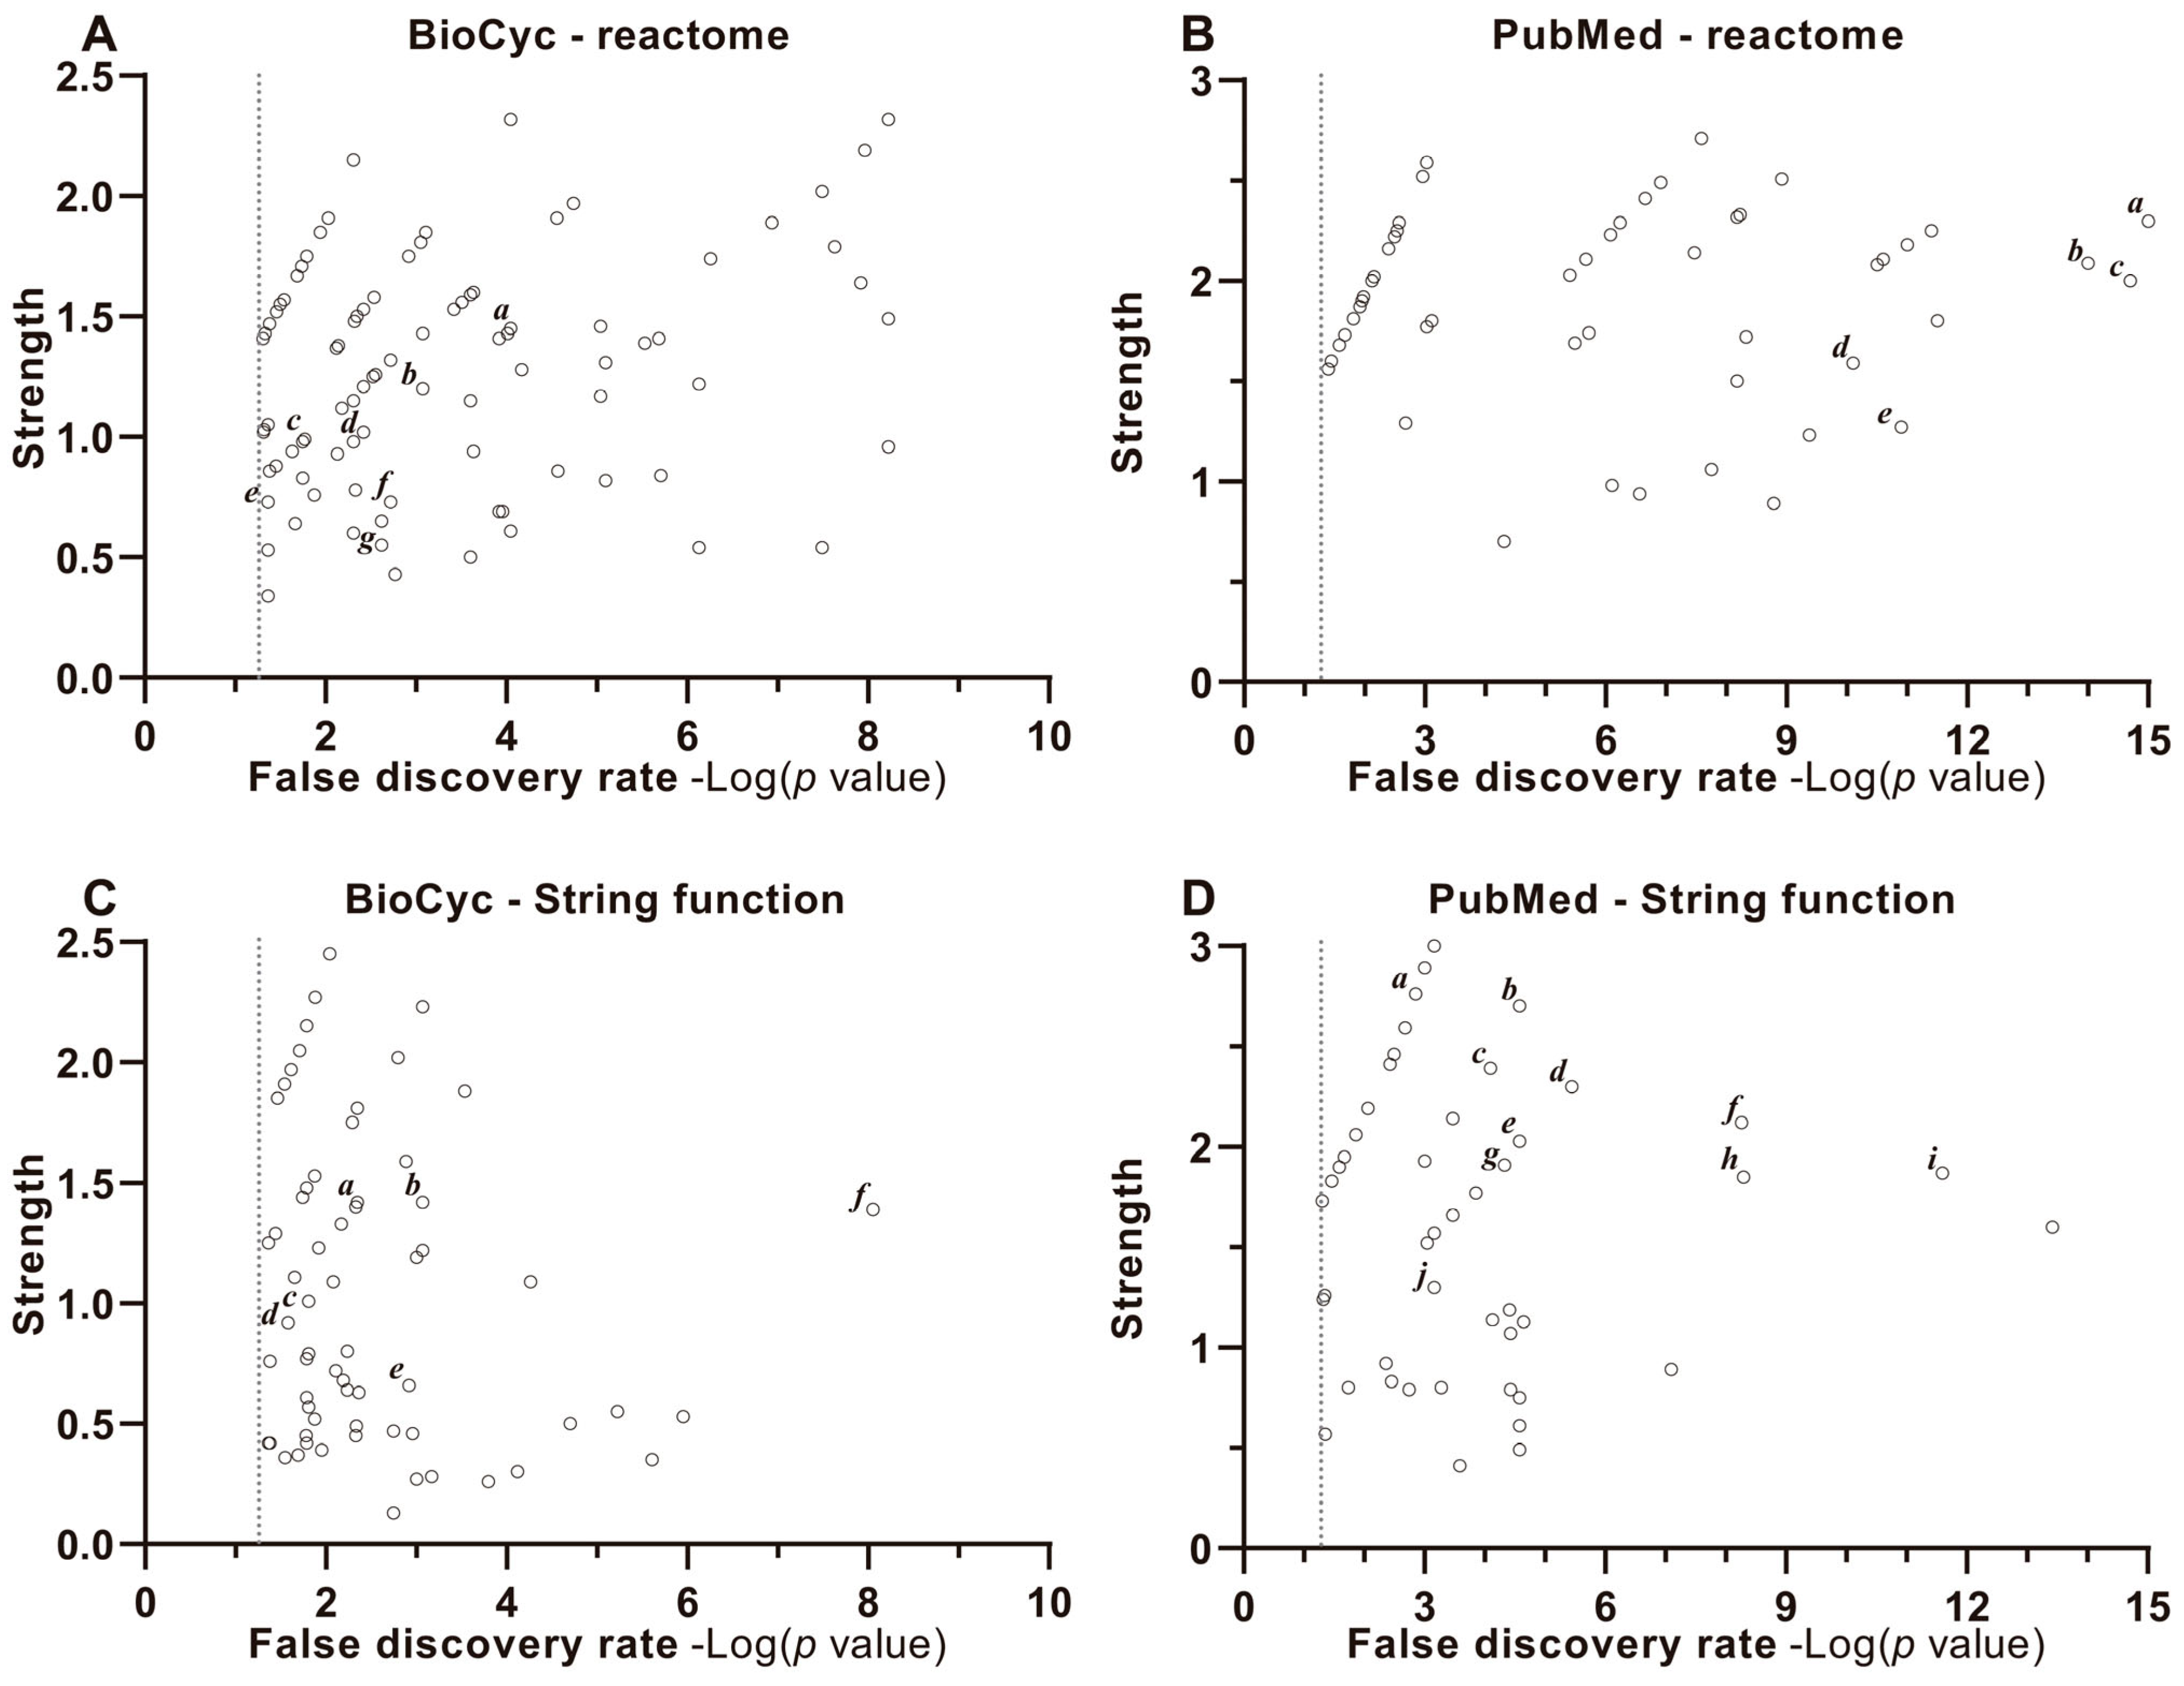
2.2.1. Reactome
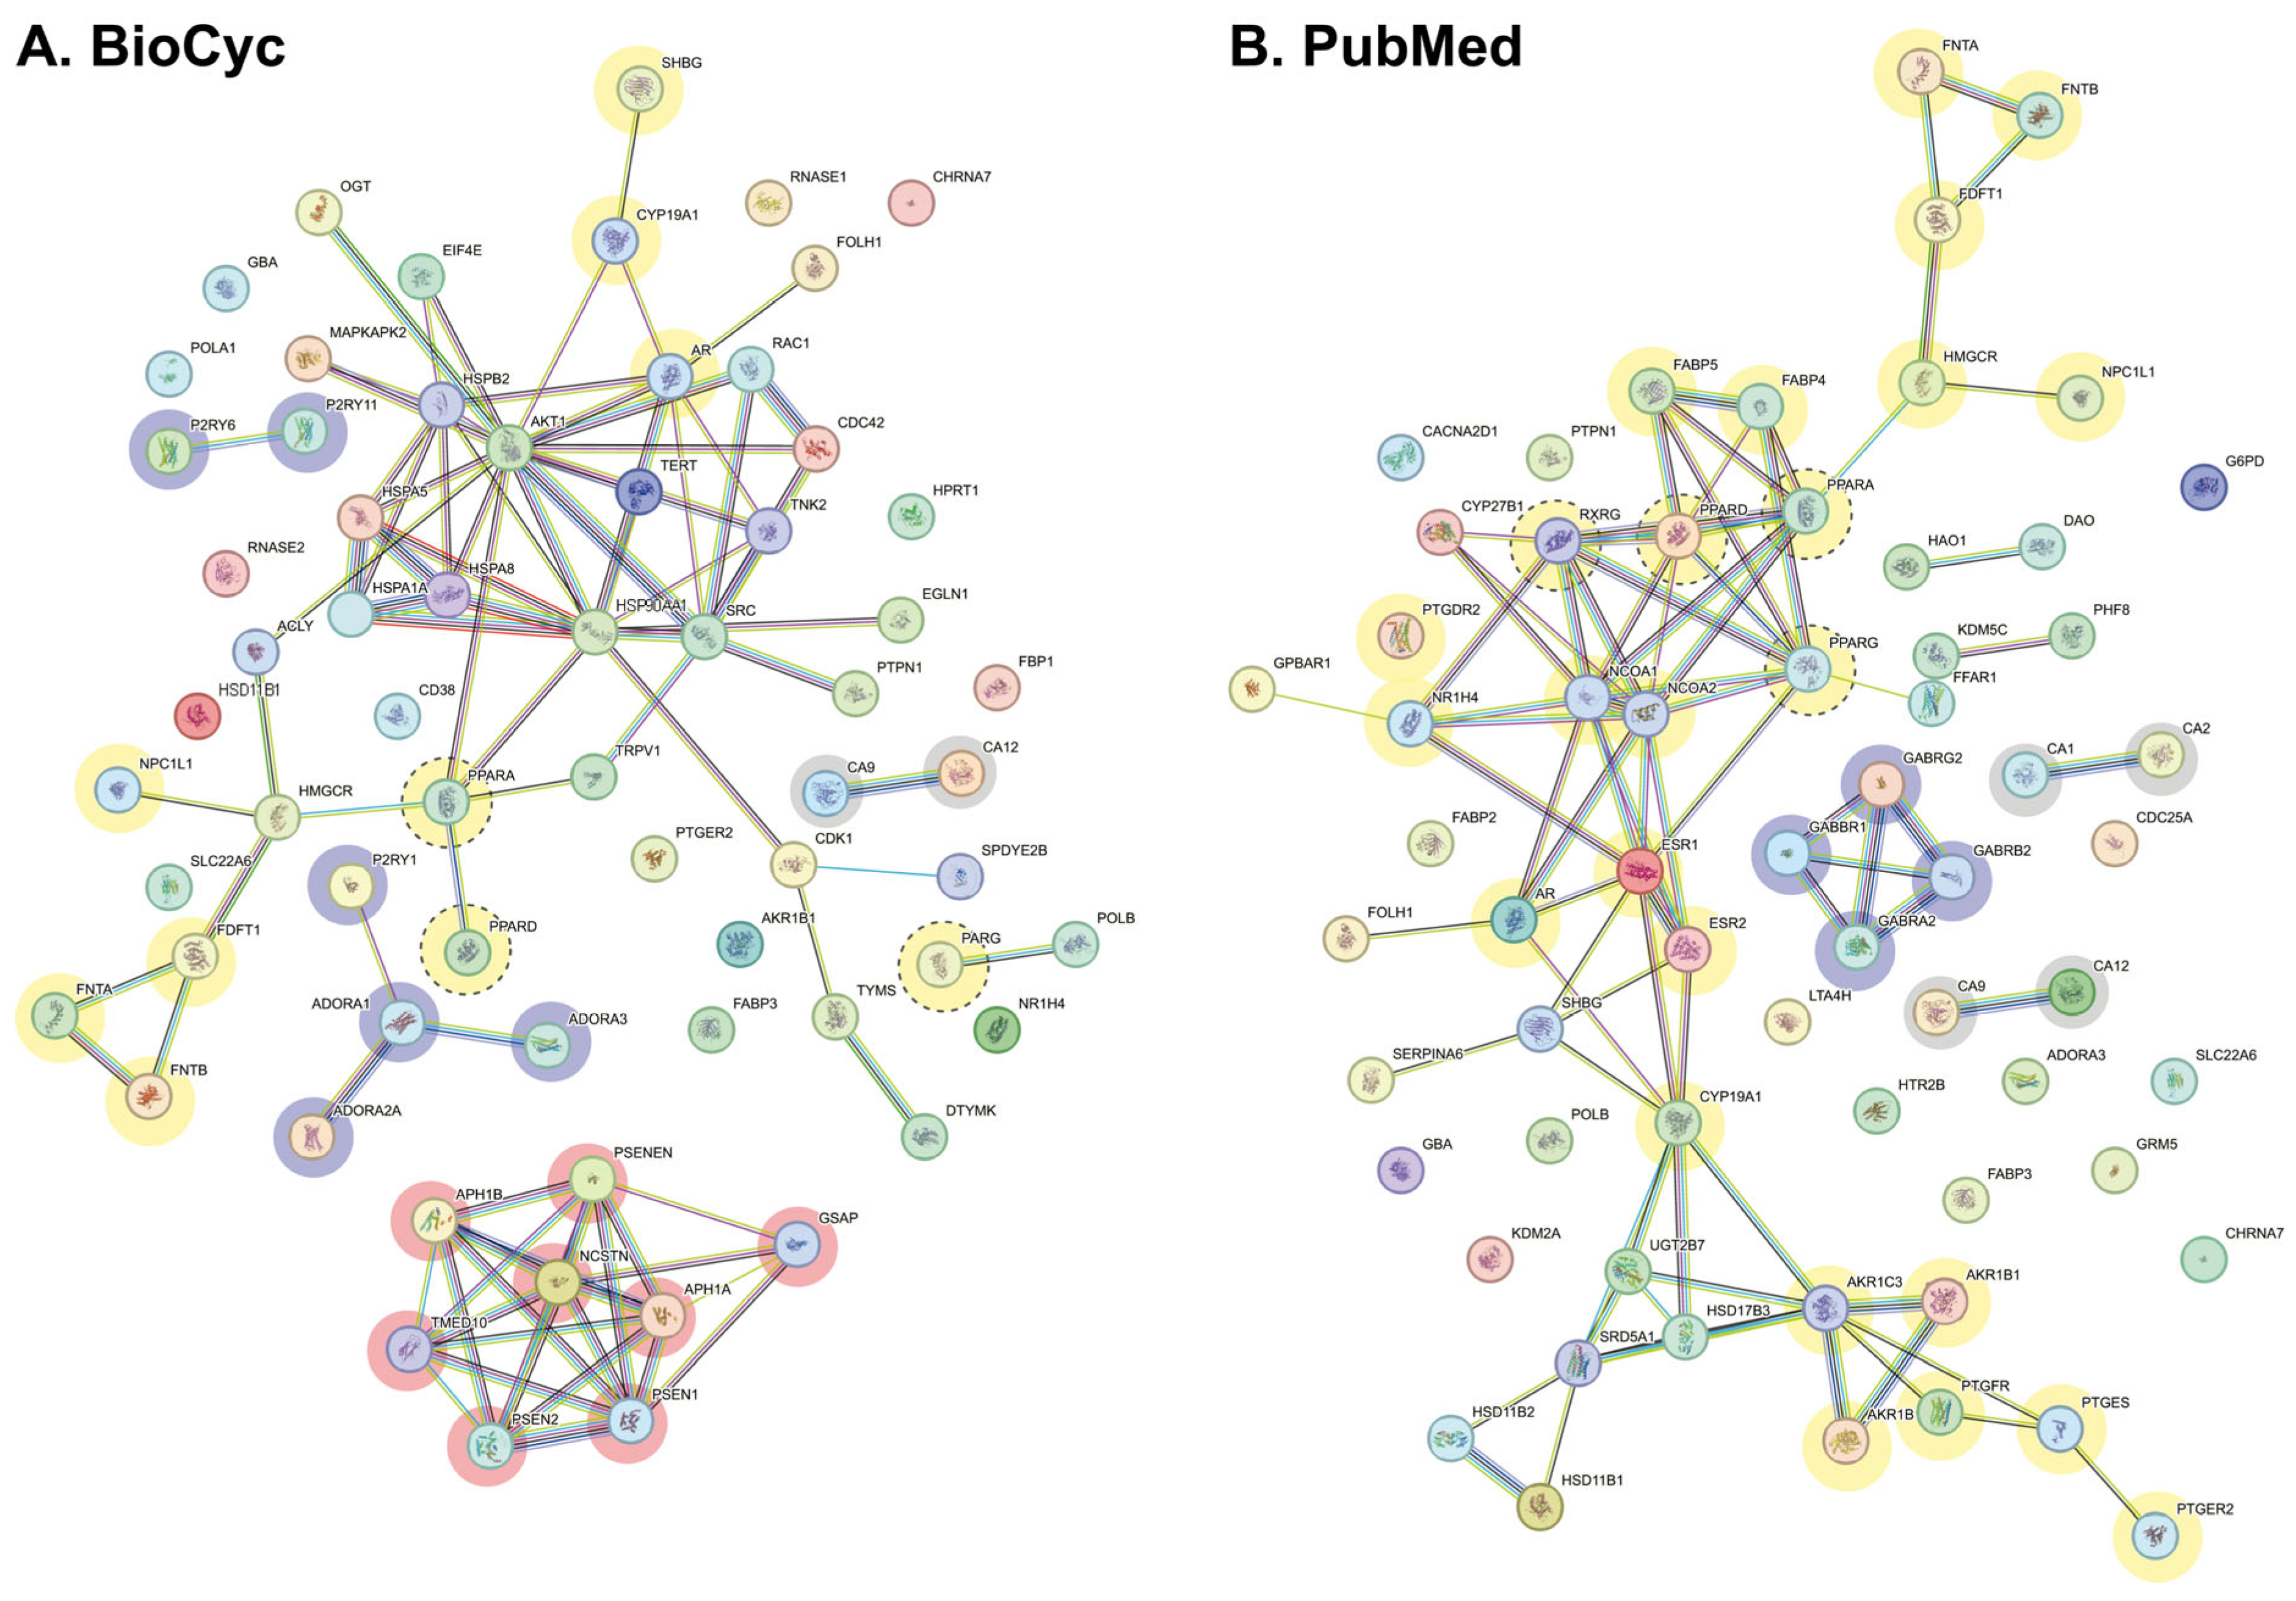
2.2.2. Interactome
2.2.3. Enrichment, Strength and Validation Analysis of Protein Interactions
2.3. Molecular Docking Studies
2.3.1. Choice of Ligands
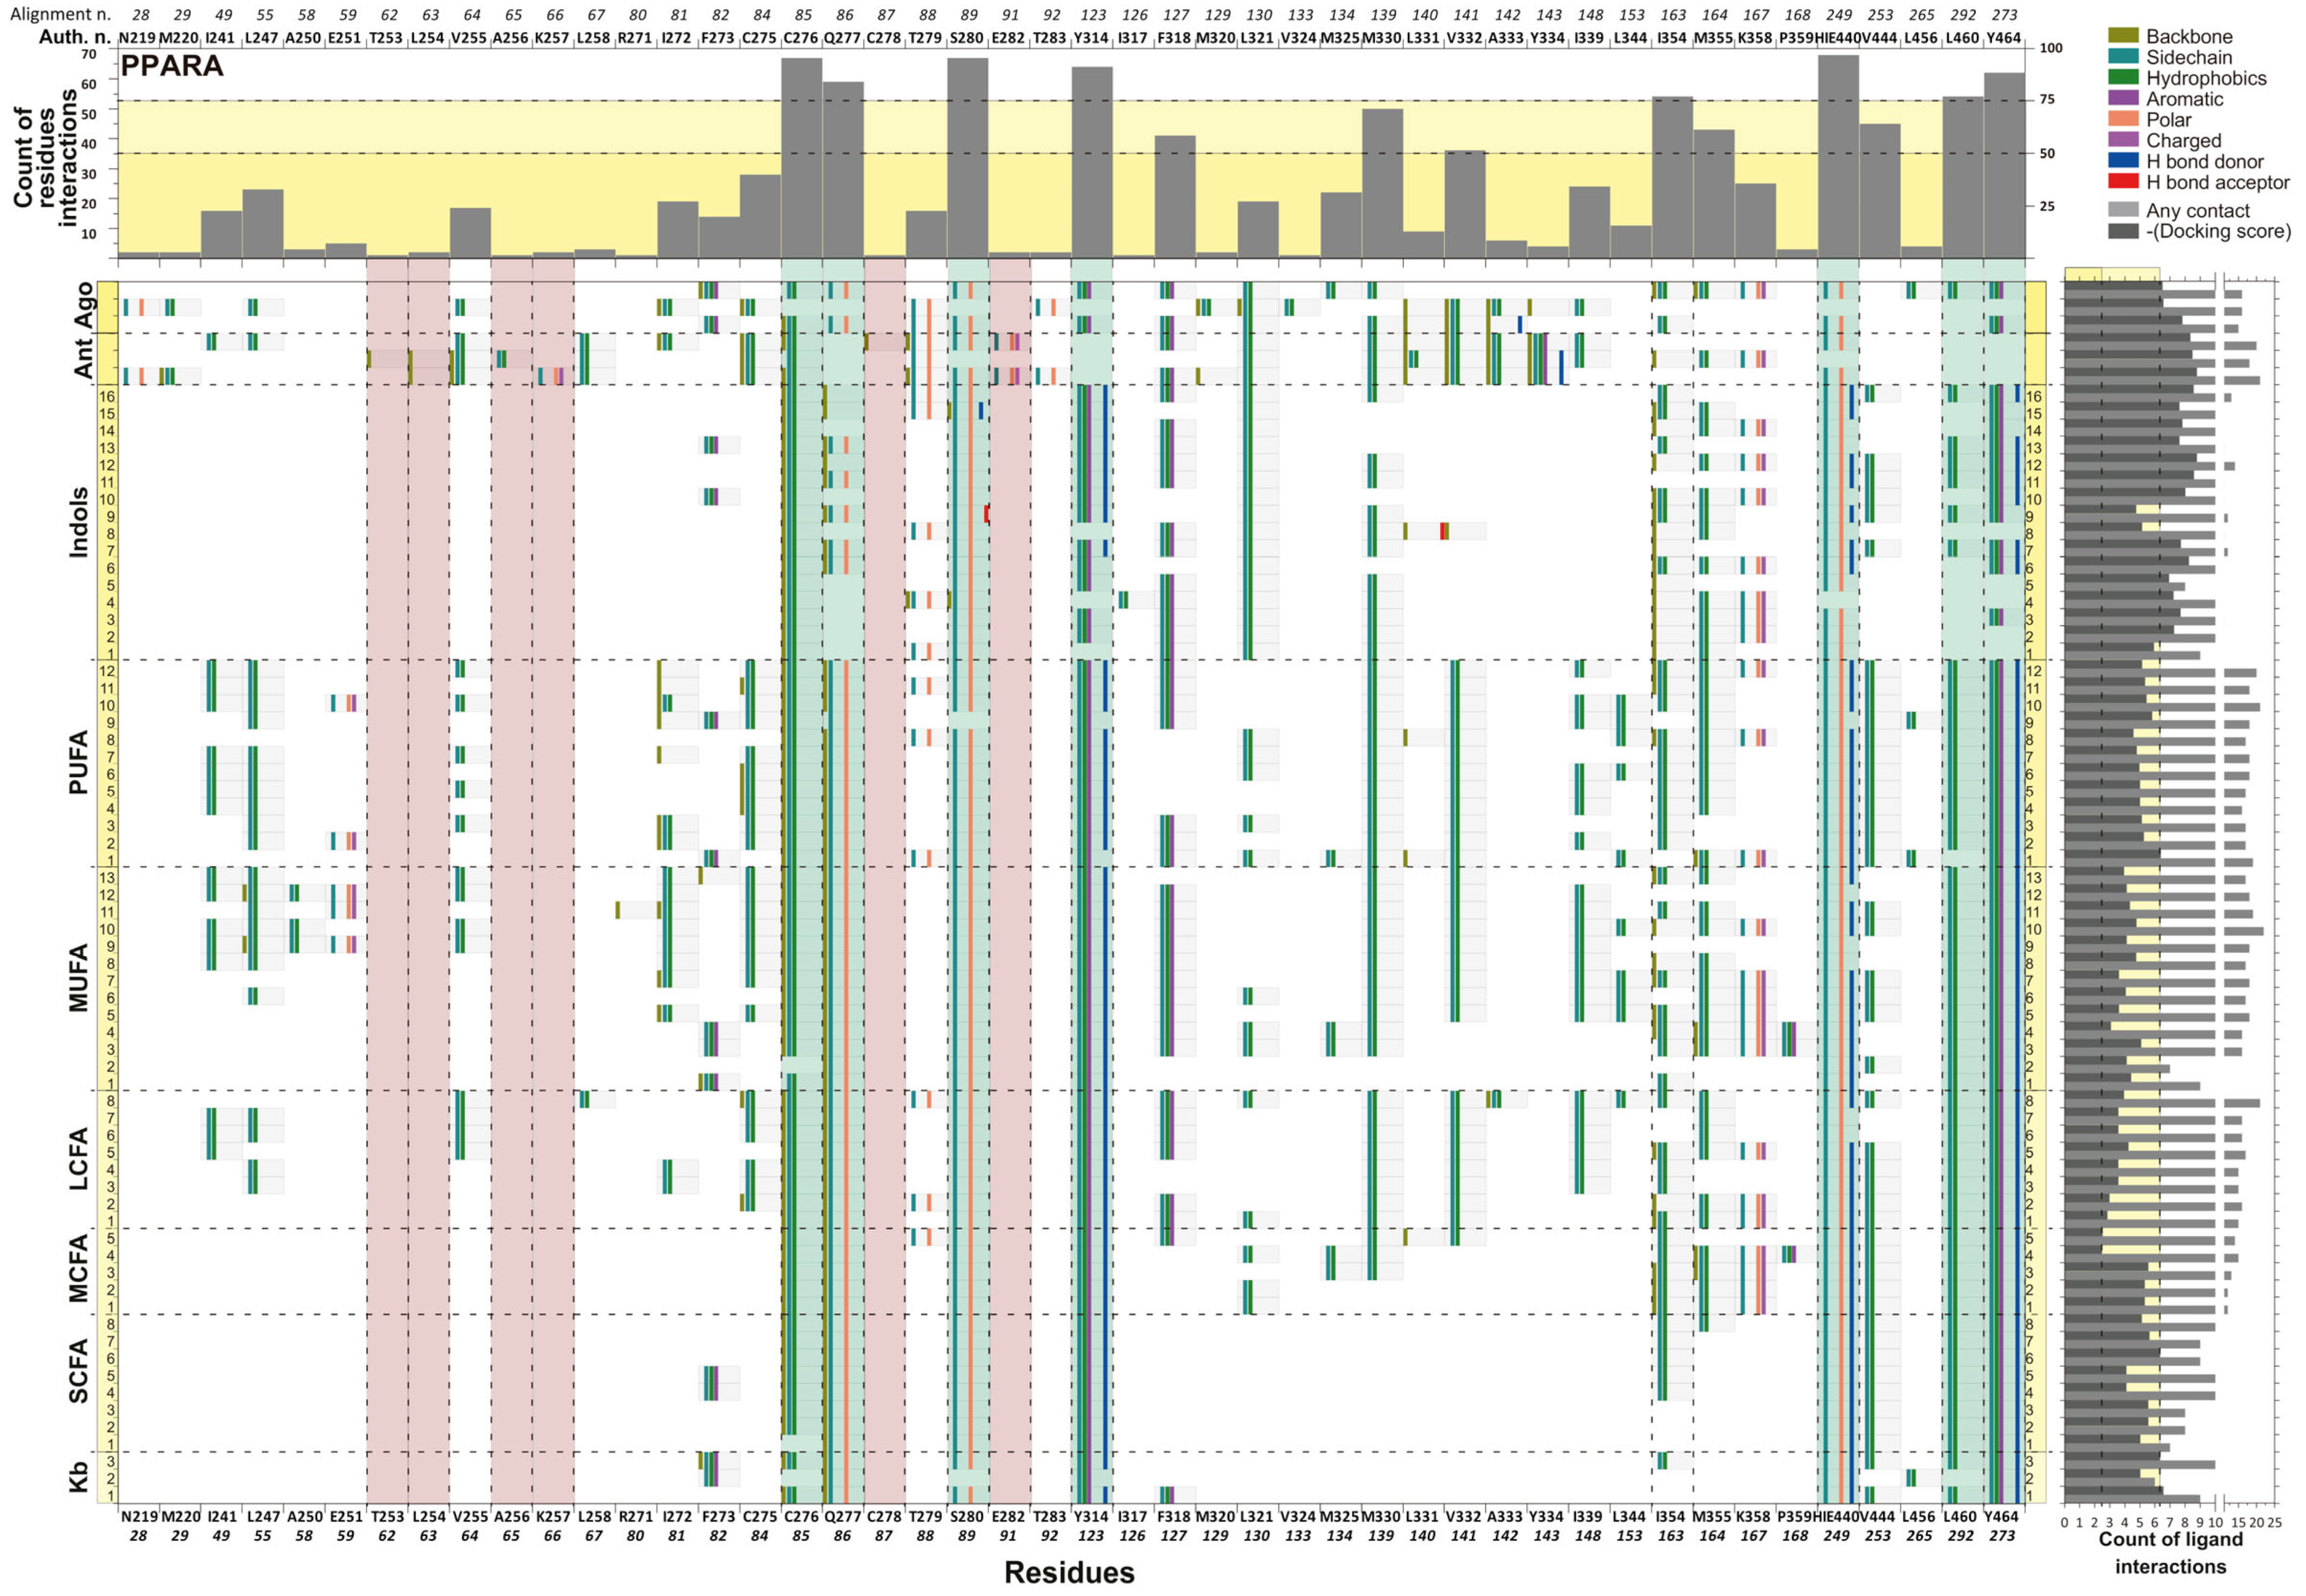
2.3.2. Molecular Interaction and Multiple Sequence Alignment
3. Discussion
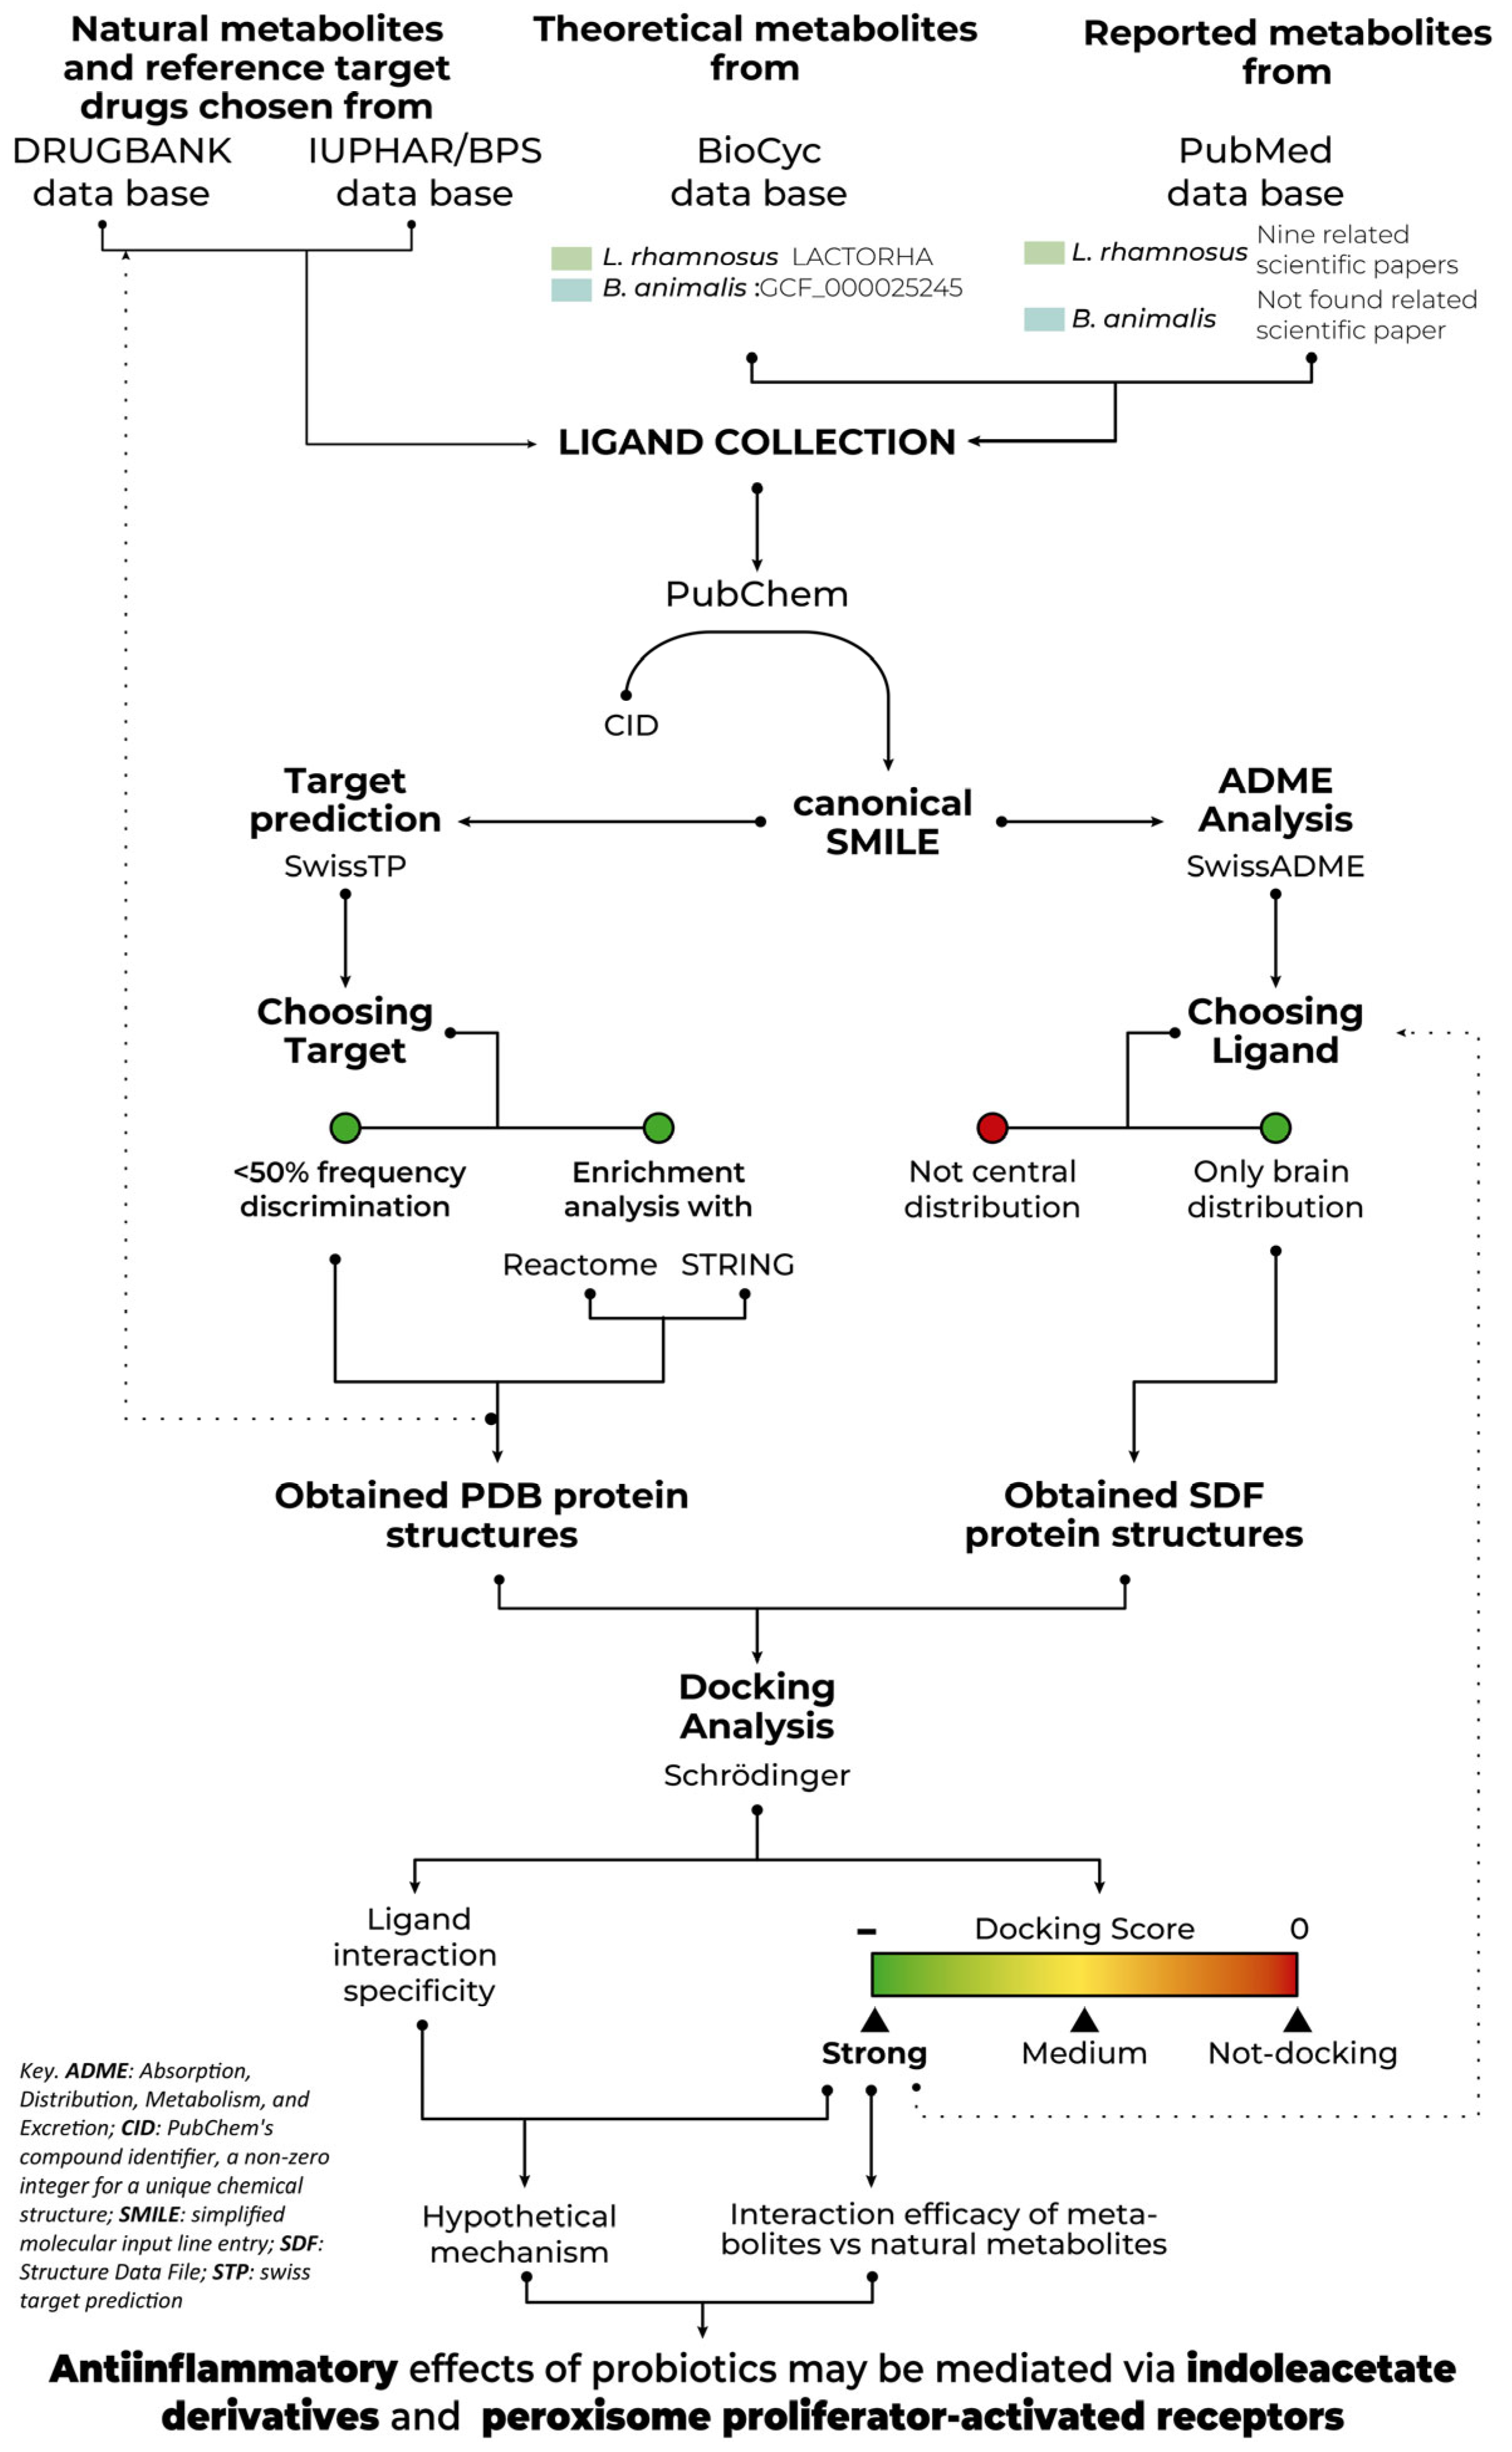
4. Materials and Methods
4.1. Database, Webpage and Software
4.2. Data Collection
4.2.1. Theoretical Metabolites Collection
4.2.2. Reported Metabolites Collection
4.2.3. Natural Metabolites and Reference Drugs of Target Chosen Collection
4.3. Target Key Molecules
4.3.1. Choice of Ligands
4.3.2. Choice of Target Proteins
4.3.3. Frequency Discrimination
4.3.4. Enrichment Analysis Discrimination
4.4. Docking Analysis
4.4.1. Metabolites, Ligand, and Protein Preparation
4.4.2. Ligand Structure Obtention
4.4.3. Protein Structure Obtention
4.5. Statistical Analysis, Validation and Exclusion Criteria
5. Conclusions
Supplementary Materials
Author Contributions
Funding
Institutional Review Board Statement
Informed Consent Statement
Data Availability Statement
Conflicts of Interest
Nomenclature
| AHR | Aryl Hydrocarbon Receptor |
| ADME | Absorption, Distribution, Metabolism, and Excretion |
| AF-2 helix | Activation function-2 helix |
| Ago | Agonist |
| AKT | Protein kinase B |
| Ant | Antagonist |
| B. animalis | Bifidobacterium animalis spp. lactis |
| B. lactis | Bifidobacterium animalis spp. lactis |
| BBB | Blood-Brain Barrier |
| BioCyc DB | BioCyc Database Collection |
| CA | Carbonic anhydrase |
| CFU | Colony-forming units |
| CID | Compound Identifier (PubChem) |
| CNS | Central Nervous System |
| DHA | Docosahexaenoic acid, a polyunsaturated fatty acid (PUFA) |
| EC | EC Number |
| EPA | Eicosapentaenoic acid, a polyunsaturated fatty acid (PUFA) |
| FA | Fatty Acids |
| FDR | False discovery rate |
| FMT | Fecal microbiota transplantation |
| GABA | Gamma-aminobutyric acid |
| GBA | Gut-Brain Axis |
| GIT | Gastrointestinal Tract |
| GM | Gut Microbiota |
| HGNC | Human Gene Nomenclature Committee |
| HIE | Polar histidine |
| KB | Ketone Bodies |
| LCFAs | Long-Chain Fatty Acids |
| LBD | Ligand-binding domain |
| L. rhamnosus | Lacticaseibacillus rhamnosus |
| MAPK | Mitogen-activated protein kinases |
| MCFA | Medium-chain fatty acid |
| MUFAs | Monounsaturated Fatty Acids |
| NCOA1 | Nuclear Receptor Coactivator 1 |
| NOTCH | Eurogenic locus notch homolog protein |
| PD | Parkinson Disease |
| PubMed DB | PubMed Database |
| PXR | Pregnane X Receptor |
| PPARs | Peroxisome Proliferator-Activated Receptors |
| PPARA | Peroxisome Proliferator-Activated Receptor Alpha |
| PPARB/D | Peroxisome Proliferator-Activated Receptor Beta/Delta |
| PPARG | Peroxisome Proliferator-Activated Receptor Gamma |
| PUFAs | Polyunsaturated Fatty Acids |
| RXRA | Retinoid X Receptor Alpha |
| RXRB | Retinoid X Receptor Beta |
| RXRG | Retinoid X Receptor Gamma |
| SDF | Structure Data File |
| SMILES | Simplified Molecular Input Line Entry Specification |
| SFA | Saturated Fatty Acids |
| SCFAs | Short-Chain Fatty Acids |
| STP | Swiss Target Prediction |
| STRING | Search Tool for the Retrieval of Interacting Genes/Proteins |
| TGF | Transforming growth factor beta receptor |
| TMAO | Tryptophan metabolites, trimethylamine-N-oxide |
| tPSA | Topological polar surface area |
| TRPV | Transient receptor potential cation channel subfamily V member |
| UNIPROT | Universal Protein Resource |
| Wlog P | n-octanol/partition co-efficient water |
References
- Abenavoli, L.; Scarpellini, E.; Colica, C.; Boccuto, L.; Salehi, B.; Sharifi-Rad, J.; Aiello, V.; Romano, B.; De Lorenzo, A.; Izzo, A.A.; et al. Gut Microbiota and Obesity: A Role for Probiotics. Nutrients 2019, 11, 2690. [Google Scholar] [CrossRef]
- Kelly, J.R.; Kennedy, P.J.; Cryan, J.F.; Dinan, T.G.; Clarke, G.; Hyland, N.P. Breaking down the barriers: The gut microbiome, intestinal permeability and stress-related psychiatric disorders. Front. Cell Neurosci. 2015, 9, 392. [Google Scholar] [CrossRef]
- Liu, J.; Tan, Y.; Cheng, H.; Zhang, D.; Feng, W.; Peng, C. Functions of Gut Microbiota Metabolites, Current Status and Future Perspectives. Aging Dis. 2022, 13, 1106–1126. [Google Scholar] [CrossRef] [PubMed]
- Rea, K.; Dinan, T.G.; Cryan, J.F. The microbiome: A key regulator of stress and neuroinflammation. Neurobiol. Stress 2016, 4, 23–33. [Google Scholar] [CrossRef] [PubMed]
- Kolzhetsov, N.; Markelova, N.; Frolova, M.; Alikina, O.; Glazunova, O.; Safonova, L.; Kalashnikova, I.; Yudin, V.; Makarov, V.; Keskinov, A.; et al. Enterotype-Dependent Probiotic-Mediated Changes in the Male Rat Intestinal Microbiome In Vivo and In Vitro. Int. J. Mol. Sci. 2024, 25, 4558. [Google Scholar] [CrossRef]
- Liu, L.; Wang, H.; Chen, X.; Zhang, Y.; Zhang, H.; Xie, P. Gut microbiota and its metabolites in depression: From pathogenesis to treatment. EBioMedicine 2023, 90, 104527. [Google Scholar] [CrossRef] [PubMed]
- Almikhlafi, M.A. A review of the gastrointestinal, olfactory, and skin abnormalities in patients with Parkinson’s disease. Neurosciences 2024, 29, 4–9. [Google Scholar] [CrossRef]
- Atak, E.S.; Yıldız, D.; Kocatürk, R.R.; Temizyürek, A.; Özcan, Ö.Ö.; Ergüzel, T.T.; Karahan, M.; Tarhan, N. Therapeutic Targets of Probiotics in Parkinson Disease: A Systematic Review of Randomized Controlled Trials. Basic Clin. Neurosci. 2024, 15, 165–174. [Google Scholar] [CrossRef]
- Bhardwaj, K.; Singh, A.A.; Kumar, H. Unveiling the Journey from the Gut to the Brain: Decoding Neurodegeneration-Gut Connection in Parkinson’s Disease. ACS Chem. Neurosci. 2024, 15, 2454–2469. [Google Scholar] [CrossRef]
- Chang, J.J.; Kulkarni, S.; Pasricha, T.S. Upper Gastrointestinal Mucosal Damage and Subsequent Risk of Parkinson Disease. JAMA Netw. Open 2024, 7, e2431949. [Google Scholar] [CrossRef]
- Kerstens, R.; Joyce, P. The Gut Microbiome as a Catalyst and Emerging Therapeutic Target for Parkinson’s Disease: A Comprehensive Update. Biomedicines 2024, 12, 1738. [Google Scholar] [CrossRef] [PubMed]
- Candeias, E.; Pereira-Santos, A.R.; Empadinhas, N.; Cardoso, S.M.; Esteves, A.R.F. The Gut-Brain Axis in Alzheimer’s and Parkinson’s Diseases: The Catalytic Role of Mitochondria. J. Alzheimer’s Dis. 2024, 100, 413–429. [Google Scholar] [CrossRef] [PubMed]
- Benvenuti, L.; Di Salvo, C.; Bellini, G.; Seguella, L.; Rettura, F.; Esposito, G.; Antonioli, L.; Ceravolo, R.; Bernardini, N.; Pellegrini, C.; et al. Gut-directed therapy in Parkinson’s disease. Front. Pharmacol. 2024, 15, 1407925. [Google Scholar] [CrossRef]
- Jia, X.; Wang, Q.; Liu, M.; Ding, J.Y. The interplay between gut microbiota and the brain-gut axis in Parkinson’s disease treatment. Front. Neurol. 2024, 15, 1415463. [Google Scholar] [CrossRef]
- Pasricha, T.S.; Guerrero-Lopez, I.L.; Kuo, B. Management of Gastrointestinal Symptoms in Parkinson’s Disease: A Comprehensive Review of Clinical Presentation, Workup, and Treatment. J. Clin. Gastroenterol. 2024, 58, 211–220. [Google Scholar] [CrossRef]
- Chen, Y.; Ma, W.; Zhao, J.; Stanton, C.; Ross, R.P.; Zhang, H.; Chen, W.; Yang, B. Ameliorates Colorectal Cancer by Ameliorating the Intestinal Barrier through the CLA-PPAR-γ Axis. J. Agric. Food Chem. 2024, 72, 19766–19785. [Google Scholar] [CrossRef] [PubMed]
- Chen, L.; Li, H.; Chen, Y.; Yang, Y. Probiotic Lactobacillus rhamnosus GG reduces mortality of septic mice by modulating gut microbiota composition and metabolic profiles. Nutrition 2020, 78, 110863. [Google Scholar] [CrossRef]
- Sun, M.-F.; Zhu, Y.-L.; Zhou, Z.-L.; Jia, X.-B.; Xu, Y.-D.; Yang, Q.; Cui, C.; Shen, Y.-Q. Neuroprotective effects of fecal microbiota transplantation on MPTP-induced Parkinson’s disease mice: Gut microbiota, glial reaction and TLR4/TNF-α signaling pathway. Brain Behav. Immun. 2018, 70, 48–60. [Google Scholar] [CrossRef]
- Miao, X.; Jiang, Y.; Kong, D.; Wu, Z.; Liu, H.; Ye, X.; Gong, W. Lactobacillus rhamnosus HN001 Ameliorates BEZ235-Induced Intestinal Dysbiosis and Prolongs Cardiac Transplant Survival. Microbiol. Spectr. 2022, 10, e0079422. [Google Scholar] [CrossRef]
- McFarland, L.V. Use of probiotics to correct dysbiosis of normal microbiota following disease or disruptive events: A systematic review. BMJ Open 2014, 4, e005047. [Google Scholar] [CrossRef]
- Du, Q.; Li, Q.; Liu, C.; Liao, G.; Li, J.; Yang, J.; Zhang, Q.; Gong, X.; Li, K. Probiotics/prebiotics/synbiotics and human neuropsychiatric outcomes: An umbrella review. Benef. Microbes 2024, 15, 589–608. [Google Scholar] [CrossRef]
- Skalny, A.V.; Aschner, M.; Gritsenko, V.A.; Martins, A.C.; Tizabi, Y.; Korobeinikova, T.V.; Paoliello, M.M.; Tinkov, A.A. Modulation of gut microbiota with probiotics as a strategy to counteract endogenous and exogenous neurotoxicity. Adv. Neurotoxicol. 2024, 11, 133–176. [Google Scholar] [CrossRef] [PubMed]
- Jach, M.E.; Serefko, A.; Szopa, A.; Sajnaga, E.; Golczyk, H.; Santos, L.S.; Borowicz-Reutt, K.; Sieniawska, E. The Role of Probiotics and Their Metabolites in the Treatment of Depression. Molecules 2023, 28, 3213. [Google Scholar] [CrossRef] [PubMed]
- Mazziotta, C.; Tognon, M.; Martini, F.; Torreggiani, E.; Rotondo, J.C. Probiotics Mechanism of Action on Immune Cells and Beneficial Effects on Human Health. Cells 2023, 12, 184. [Google Scholar] [CrossRef] [PubMed]
- Zhai, T.; Ren, W.; Wang, P.; Zheng, L. Lactobacillus rhamnosus GG protects against atherosclerosis by improving ketone body synthesis. Appl. Microbiol. Biotechnol. 2022, 106, 8233–8243. [Google Scholar] [CrossRef]
- Nosrani, E.A.; Tamtaji, O.R.; Alibolandi, Z.; Sarkar, P.; Ghazanfari, M.; Tameh, A.A.; Taghizadeh, M.; Banikazemi, Z.; Hadavi, R.; Taheri, M.N. Neuroprotective effects of probiotics bacteria on animal model of Parkinson’s disease induced by 6-hydroxydopamine: A behavioral, biochemical, and histological study. J. Immunoass. Immunochem. 2021, 42, 106–120. [Google Scholar] [CrossRef] [PubMed]
- Sun, J.; Li, H.; Jin, Y.; Yu, J.; Mao, S.; Su, K.-P.; Ling, Z.; Liu, J. Probiotic Clostridium butyricum ameliorated motor deficits in a mouse model of Parkinson’s disease via gut microbiota-GLP-1 pathway. Brain Behav. Immun. 2021, 91, 703–715. [Google Scholar] [CrossRef]
- Plaza-Diaz, J.; Ruiz-Ojeda, F.J.; Gil-Campos, M.; Gil, A. Mechanisms of Action of Probiotics. Adv. Nutr. 2019, 10, S49–S66. [Google Scholar] [CrossRef] [PubMed]
- de Melo Pereira, G.V.; de Oliveira Coelho, B.; Júnior, A.I.M.; Thomaz-Soccol, V.; Soccol, C.R. How to select a probiotic? A review and update of methods and criteria. Biotechnol. Adv. 2018, 36, 2060–2076. [Google Scholar] [CrossRef]
- Rahman, S.; O’Connor, A.L.; Becker, S.L.; Patel, R.K.; Martindale, R.G.; Tsikitis, V.L. Gut microbial metabolites and its impact on human health. Ann. Gastroenterol. 2023, 36, 360–368. [Google Scholar] [CrossRef]
- Agus, A.; Planchais, J.; Sokol, H. Gut Microbiota Regulation of Tryptophan Metabolism in Health and Disease. Cell Host Microbe 2018, 23, 716–724. [Google Scholar] [CrossRef] [PubMed]
- Roth, W.; Zadeh, K.; Vekariya, R.; Ge, Y.; Mohamadzadeh, M. Tryptophan Metabolism and Gut-Brain Homeostasis. Int. J. Mol. Sci. 2021, 22, 2973. [Google Scholar] [CrossRef]
- Cuevas-Carbonell, S.G.; Vásquez-Celaya, L.; García-López, D.; Granados-Patrón, D.; García-Miss, M.d.R.; Álvarez-Cervera, F.J.; Mut-Martín, M.; Parra, I.; Mendieta, L.; Salgado, H.; et al. Chronic Treatment with the Probiotics Lacticaseibacillus rhamnosus GG and Bifidobacterium lactis BB12 Attenuates Motor Impairment, Striatal Microglial Activation, and Dopaminergic Loss in Rats with 6-Hydroxydopamine-induced Hemiparkinsonism. Neuroscience 2022, 507, 79–98. [Google Scholar] [CrossRef]
- Parra, I.; Martínez, I.; Vásquez-Celaya, L.; Gongora-Alfaro, J.L.; Tizabi, Y.; Mendieta, L. Neuroprotective and Immunomodulatory Effects of Probiotics in a Rat Model of Parkinson’s Disease. Neurotox. Res. 2023, 41, 187–200. [Google Scholar] [CrossRef]
- Arenas-Padilla, M.; Duarte-Gutiérrez, J.L.; Mata-Haro, V. Bifidobacterium animalis ssp. lactis Bb12 induces IL-10 through cell membrane-associated components via TLR2 in swine. J. Appl. Microbiol. 2018, 125, 1881–1889. [Google Scholar] [CrossRef]
- Castelli, V.; d’Angelo, M.; Lombardi, F.; Alfonsetti, M.; Antonosante, A.; Catanesi, M.; Benedetti, E.; Palumbo, P.; Cifone, M.G.; Giordano, A.; et al. Effects of the probiotic formulation SLAB51 in. Aging 2020, 12, 4641–4659. [Google Scholar] [CrossRef]
- Dwyer, Z.; Chaiquin, M.; Landrigan, J.; Ayoub, K.; Shail, P.; Rocha, J.; Childers, C.L.; Storey, K.B.; Philpott, D.J.; Sun, H.; et al. The impact of dextran sodium sulphate and probiotic pre-treatment in a murine model of Parkinson’s disease. J. Neuroinflamm. 2021, 18, 20. [Google Scholar] [CrossRef] [PubMed]
- Hsieh, T.-H.; Kuo, C.-W.; Hsieh, K.-H.; Shieh, M.-J.; Peng, C.-W.; Chen, Y.-C.; Chang, Y.-L.; Huang, Y.-Z.; Chen, C.-C.; Chang, P.-K.; et al. Probiotics Alleviate the Progressive Deterioration of Motor Functions in a Mouse Model of Parkinson’s Disease. Brain Sci. 2020, 10, 206. [Google Scholar] [CrossRef] [PubMed]
- Ishii, T.; Furuoka, H.; Kaya, M.; Kuhara, T. Oral Administration of Probiotic. Biomedicines 2021, 9, 167. [Google Scholar] [CrossRef]
- Solano-Aguilar, G.; Shea-Donohue, T.; Madden, K.B.; Quinoñes, A.; Beshah, E.; Lakshman, S.; Xie, Y.; Dawson, H.; Urban, J.F. Bifidobacterium animalis subspecies lactis modulates the local immune response and glucose uptake in the small intestine of juvenile pigs infected with the parasitic nematode Ascaris suum. Gut Microbes 2018, 9, 422–436. [Google Scholar] [CrossRef]
- Srivastav, S.; Neupane, S.; Bhurtel, S.; Katila, N.; Maharjan, S.; Choi, H.; Hong, J.T.; Choi, D.-Y. Probiotics mixture increases butyrate, and subsequently rescues the nigral dopaminergic neurons from MPTP and rotenone-induced neurotoxicity. J. Nutr. Biochem. 2019, 69, 73–86. [Google Scholar] [CrossRef]
- Wang, Y.; Liu, Y.; Kirpich, I.; Ma, Z.; Wang, C.; Zhang, M.; Suttles, J.; McClain, C.; Feng, W. Lactobacillus rhamnosus GG reduces hepatic TNFα production and inflammation in chronic alcohol-induced liver injury. J. Nutr. Biochem. 2013, 24, 1609–1615. [Google Scholar] [CrossRef]
- Xie, C.; Prasad, A.A. Probiotics Treatment Improves Hippocampal Dependent Cognition in a Rodent Model of Parkinson’s Disease. Microorganisms 2020, 8, 1661. [Google Scholar] [CrossRef] [PubMed]
- Işık, M.; Köse, F.; Özbayer, C.; Budak, Ö.; Kaya, R.K.; Erdoğan, D.G.; Demirci, M.A.; Doğanay, S.; Bağcı, C. Promising Antidepressant Potential: The Role of Lactobacillus rhamnosus GG in Mental Health and Stress Response. Probiotics Antimicrob. Proteins 2025, 1–31. [Google Scholar] [CrossRef]
- Kim, J.H.; Choi, Y.; Lee, S.; Oh, M.S. Probiotics as Potential Treatments for Neurodegenerative Diseases: A Review of the Evidence from. Biomol. Ther. 2025, 33, 54–74. [Google Scholar] [CrossRef] [PubMed]
- Kumar, D.; Bishnoi, M.; Kondepudi, K.K.; Sharma, S.S. Gut Microbiota-Based Interventions for Parkinson’s Disease: Neuroprotective Mechanisms and Current Perspective. Probiotics Antimicrob. Proteins 2025, 1–23. [Google Scholar] [CrossRef] [PubMed]
- Aktas, B.; Aslim, B.; Ozdemir, D.A. A neurotherapeutic approach with Lacticaseibacillus rhamnosus E9 on gut microbiota and intestinal barrier in MPTP-induced mouse model of Parkinson’s disease. Sci. Rep. 2024, 14, 15460. [Google Scholar] [CrossRef]
- Panaitescu, P.; Răzniceanu, V.; Mocrei-Rebrean, Ș.-M.; Neculicioiu, V.S.; Dragoș, H.-M.; Costache, C.; Filip, G.A. The Effect of Gut Microbiota-Targeted Interventions on Neuroinflammation and Motor Function in Parkinson’s Disease Animal Models-A Systematic Review. Curr. Issues Mol. Biol. 2024, 46, 3946–3974. [Google Scholar] [CrossRef]
- Rojo, N.D.; Benítez, M.B.; Cava, R.; Fuentes, J.M.; Cortés, S.C.; Polo, R.A.G. Convergence of Neuroinflammation, Microbiota, and Parkinson’s Disease: Therapeutic Insights and Prospects. Int. J. Mol. Sci. 2024, 25, 11629. [Google Scholar] [CrossRef]
- Supuran, C.T. Carbonic anhydrases: Novel therapeutic applications for inhibitors and activators. Nat. Rev. Drug Discov. 2008, 7, 168–181. [Google Scholar] [CrossRef]
- Supuran, C.T. Structure and function of carbonic anhydrases. Biochem. J. 2016, 473, 2023–2032. [Google Scholar] [CrossRef] [PubMed]
- Carrasco-Carballo, A.; Mendoza-Lara, D.F.; Rojas-Morales, J.A.; Alatriste, V.; Merino-Montiel, P.; Luna, F.; Sandoval-Ramirez, J. In silico study of coumarins derivatives with potential use in systemic diseases. Biointerface Res. Appl. Chem. 2023, 13, 240. [Google Scholar] [CrossRef]
- Taylor, W.R. Residual colours: A proposal for aminochromography. Protein Eng. 1997, 10, 743–746. [Google Scholar] [CrossRef]
- Zoete, V.; Grosdidier, A.; Michielin, O. Peroxisome proliferator-activated receptor structures: Ligand specificity, molecular switch and interactions with regulators. Biochim. Biophys. Acta 2007, 1771, 915–925. [Google Scholar] [CrossRef] [PubMed]
- Gao, G.; Shen, S.; Zhang, T.; Zhang, J.; Huang, S.; Sun, Z.; Zhang, H. Lacticaseibacillus rhamnosus Probio-M9 enhanced the antitumor response to anti-PD-1 therapy by modulating intestinal metabolites. EBioMedicine 2023, 91, 104533. [Google Scholar] [CrossRef] [PubMed]
- Alfonsetti, M.; Castelli, V.; D’angelo, M. Are We What We Eat? Impact of Diet on the Gut-Brain Axis in Parkinson’s Disease. Nutrients 2022, 14, 380. [Google Scholar] [CrossRef]
- Avagliano, C.; Coretti, L.; Lama, A.; Pirozzi, C.; De Caro, C.; De Biase, D.; Turco, L.; Mollica, M.P.; Paciello, O.; Calignano, A.; et al. Dual-Hit Model of Parkinson’s Disease: Impact of Dysbiosis on 6-Hydroxydopamine-Insulted Mice-Neuroprotective and Anti-Inflammatory Effects of Butyrate. Int. J. Mol. Sci. 2022, 23, 6367. [Google Scholar] [CrossRef]
- McGuinness, A.J.; Davis, J.A.; Dawson, S.L.; Loughman, A.; Collier, F.; O’hely, M.; Simpson, C.A.; Green, J.; Marx, W.; Hair, C.; et al. A systematic review of gut microbiota composition in observational studies of major depressive disorder, bipolar disorder and schizophrenia. Mol. Psychiatry 2022, 27, 1920–1935. [Google Scholar] [CrossRef] [PubMed]
- Zhang, P.; Kong, L.; Huang, H.; Pan, Y.; Zhang, D.; Jiang, J.; Shen, Y.; Xi, C.; Lai, J.; Ng, C.H.; et al. Gut Microbiota—A Potential Contributor in the Pathogenesis of Bipolar Disorder. Front. Neurosci. 2022, 16, 830748. [Google Scholar] [CrossRef]
- Delgado, S.; Sánchez, B.; Margolles, A.; Ruas-Madiedo, P.; Ruiz, L. Molecules Produced by Probiotics and Intestinal Microorganisms with Immunomodulatory Activity. Nutrients 2020, 12, 391. [Google Scholar] [CrossRef]
- Orsi, D.L.; Ferrara, S.J.; Siegel, S.; Friberg, A.; Bouché, L.; Pook, E.; Lienau, P.; Bluck, J.P.; Lemke, C.T.; Akcay, G.; et al. Discovery and characterization of orally bioavailable 4-chloro-6-fluoroisophthalamides as covalent PPARG inverse-agonists. Bioorg. Med. Chem. 2023, 78, 117130. [Google Scholar] [CrossRef] [PubMed]
- Hong, F.; Pan, S.; Guo, Y.; Xu, P.; Zhai, Y. PPARs as Nuclear Receptors for Nutrient and Energy Metabolism. Molecules 2019, 24, 2545. [Google Scholar] [CrossRef] [PubMed]
- Murru, E.; Carta, G.; Manca, C.; Sogos, V.; Pistis, M.; Melis, M.; Banni, S. Conjugated Linoleic Acid and Brain Metabolism: A Possible Anti-Neuroinflammatory Role Mediated by PPARα Activation. Front. Pharmacol. 2020, 11, 587140. [Google Scholar] [CrossRef]
- Sagheddu, C.; Melis, M.; Muntoni, A.L.; Pistis, M. Repurposing Peroxisome Proliferator-Activated Receptor Agonists in Neurological and Psychiatric Disorders. Pharmaceuticals 2021, 14, 1025. [Google Scholar] [CrossRef]
- Strosznajder, A.K.; Wójtowicz, S.; Jeżyna, M.J.; Sun, G.Y.; Strosznajder, J.B. Recent Insights on the Role of PPAR-β/δ in Neuroinflammation and Neurodegeneration, and Its Potential Target for Therapy. Neuromol. Med. 2021, 23, 86–98. [Google Scholar] [CrossRef]
- Heuvel, J.P.V. The PPAR resource page. Biochim. Biophys. Acta 2007, 1771, 1108–1112. [Google Scholar] [CrossRef]
- Roager, H.M.; Licht, T.R. Microbial tryptophan catabolites in health and disease. Nat. Commun. 2018, 9, 3294. [Google Scholar] [CrossRef]
- Herraiz, T.; Galisteo, J. Endogenous and dietary indoles: A class of antioxidants and radical scavengers in the ABTS assay. Free Radic. Res. 2004, 38, 323–331. [Google Scholar] [CrossRef] [PubMed]
- Rahman, A.; Haider, M.F. A comprehensive review on glucocorticoids induced osteoporosis: A medication caused disease. Steroids 2024, 207, 109440. [Google Scholar] [CrossRef]
- Braissant, O.; Foufelle, F.; Scotto, C.; Dauça, M.; Wahli, W. Differential expression of peroxisome proliferator-activated receptors (PPARs): Tissue distribution of PPAR-alpha, -beta, and -gamma in the adult rat. Endocrinology 1996, 137, 354–366. [Google Scholar] [CrossRef]
- Cai, W.; Yang, T.; Liu, H.; Han, L.; Zhang, K.; Hu, X.; Zhang, X.; Yin, K.-J.; Gao, Y.; Bennett, M.V.; et al. Peroxisome proliferator-activated receptor γ (PPARγ): A master gatekeeper in CNS injury and repair. Prog. Neurobiol. 2018, 163–164, 27–58. [Google Scholar] [CrossRef] [PubMed]
- Gensel, J.C.; Zhang, B. Macrophage activation and its role in repair and pathology after spinal cord injury. Brain Res. 2015, 1619, 1–11. [Google Scholar] [CrossRef] [PubMed]
- Greene, M.E.; Blumberg, B.; McBride, O.W.; Yi, H.F.; Kronquist, K.; Kwan, K.; Hsieh, L.; Greene, G.; Nimer, S.D. Isolation of the human peroxisome proliferator activated receptor gamma cDNA: Expression in hematopoietic cells and chromosomal mapping. Gene Expr. 1995, 4, 281–299. [Google Scholar]
- Grygiel-Górniak, B. Peroxisome proliferator-activated receptors and their ligands: Nutritional and clinical implications--a review. Nutr. J. 2014, 13, 17. [Google Scholar] [CrossRef] [PubMed]
- Mukherjee, R.; Jow, L.; Croston, G.E.; Paterniti, J.R. Identification, characterization, and tissue distribution of human peroxisome proliferator-activated receptor (PPAR) isoforms PPARgamma2 versus PPARgamma1 and activation with retinoid X receptor agonists and antagonists. J. Biol. Chem. 1997, 272, 8071–8076. [Google Scholar] [CrossRef]
- Roy, A.; Pahan, K. PPARα signaling in the hippocampus: Crosstalk between fat and memory. J. Neuroimmune Pharmacol. 2015, 10, 30–34. [Google Scholar] [CrossRef]
- Fagerberg, L.; Hallström, B.M.; Oksvold, P.; Kampf, C.; Djureinovic, D.; Odeberg, J.; Habuka, M.; Tahmasebpoor, S.; Danielsson, A.; Edlund, K.; et al. Analysis of the human tissue-specific expression by genome-wide integration of transcriptomics and antibody-based proteomics. Mol. Cell Proteom. 2014, 13, 397–406. [Google Scholar] [CrossRef]
- Uhlén, M.; Fagerberg, L.; Hallström, B.M.; Lindskog, C.; Oksvold, P.; Mardinoglu, A.; Sivertsson, Å.; Kampf, C.; Sjöstedt, E.; Asplund, A.; et al. Proteomics. Tissue-based map of the human proteome. Science 2015, 347, 1260419. [Google Scholar] [CrossRef]
- Sjöstedt, E.; Zhong, W.; Fagerberg, L.; Karlsson, M.; Mitsios, N.; Adori, C.; Oksvold, P.; Edfors, F.; Limiszewska, A.; Hikmet, F.; et al. An atlas of the protein-coding genes in the human, pig, and mouse brain. Science 2020, 367, eaay5947. [Google Scholar] [CrossRef]
- Bernardo, A.; Levi, G.; Minghetti, L. Role of the peroxisome proliferator-activated receptor-gamma (PPAR-gamma) and its natural ligand 15-deoxy-Delta12, 14-prostaglandin J2 in the regulation of microglial functions. Eur. J. Neurosci. 2000, 12, 2215–2223. [Google Scholar] [CrossRef]
- Carta, A.R.; Pisanu, A. Modulating microglia activity with PPAR-γ agonists: A promising therapy for Parkinson’s disease? Neurotox. Res. 2013, 23, 112–123. [Google Scholar] [CrossRef] [PubMed]
- Kumar, A.P.; Kumar, B.R.; Jeyarani, V.; Dhanabal, S.P.; Justin, A. Glitazones; PPAR-γ; Neuroprotection. Mini Rev. Med. Chem. 2021, 21, 1457–1464. [Google Scholar] [CrossRef]
- Hunter, R.L.; Choi, D.Y.; Kincer, J.F.; Cass, W.A.; Bing, G.; Gash, D.M. Fenbendazole treatment may influence lipopolysaccharide effects in rat brain. Comp. Med. 2007, 57, 487–492. [Google Scholar] [PubMed]
- Hunter, R.L.; Choi, D.Y.; Ross, S.A.; Bing, G. Protective properties afforded by pioglitazone against intrastriatal LPS in Sprague-Dawley rats. Neurosci. Lett. 2008, 432, 198–201. [Google Scholar] [CrossRef]
- Swanson, C.R.; Joers, V.; Bondarenko, V.; Brunner, K.; Simmons, H.A.; Ziegler, T.E.; Kemnitz, J.W.; Johnson, J.A.; Emborg, M.E. The PPAR-γ agonist pioglitazone modulates inflammation and induces neuroprotection in parkinsonian monkeys. J. Neuroinflamm. 2011, 8, 91. [Google Scholar] [CrossRef]
- Nurrahma, B.A.; Tsao, S.-P.; Wu, C.-H.; Yeh, T.-H.; Hsieh, P.-S.; Panunggal, B.; Huang, H.-Y. Probiotic Supplementation Facilitates Recovery of 6-OHDA-Induced Motor Deficit via Improving Mitochondrial Function and Energy Metabolism. Front. Aging Neurosci. 2021, 13, 668775. [Google Scholar] [CrossRef]
- Visñuk, D.P.; de Giori, G.S.; LeBlanc, J.G.; de LeBlanc, A.D.M. Neuroprotective effects associated with immune modulation by selected lactic acid bacteria in a Parkinson’s disease model. Nutrition 2020, 79–80, 110995. [Google Scholar] [CrossRef]
- Karp, P.D.; Billington, R.; Caspi, R.; Fulcher, C.A.; Latendresse, M.; Kothari, A.; Keseler, I.M.; Krummenacker, M.; Midford, P.E.; Ong, Q.; et al. The BioCyc collection of microbial genomes and metabolic pathways. Brief. Bioinform. 2019, 20, 1085–1093. [Google Scholar] [CrossRef] [PubMed]
- Karp, P.D.; Billington, R.; Holland, T.A.; Kothari, A.; Krummenacker, M.; Weaver, D.; Latendresse, M.; Paley, S. Computational Metabolomics Operations at BioCyc.org. Metabolites 2015, 5, 291–310. [Google Scholar] [CrossRef]
- Caspi, R.; Billington, R.; Keseler, I.M.; Kothari, A.; Krummenacker, M.; Midford, P.E.; Ong, W.K.; Paley, S.; Subhraveti, P.; Karp, P.D. The MetaCyc database of metabolic pathways and enzymes—A 2019 update. Nucleic Acids Res. 2020, 48, D445–D453. [Google Scholar] [CrossRef]
- Liu, Y.; Hoang, T.K.; Taylor, C.M.; Park, E.S.; Freeborn, J.; Luo, M.; Roos, S.; Rhoads, J.M. Limosilactobacillus reuteri and Lacticaseibacillus rhamnosus GG differentially affect gut microbes and metabolites in mice with Treg deficiency. Am. J. Physiol.-Gastrointest. Liver Physiol. 2021, 320, G969–G981. [Google Scholar] [CrossRef] [PubMed]
- Qu, H.; Zong, L.; Sang, J.; Wa, Y.; Chen, D.; Huang, Y.; Chen, X.; Gu, R. Effect of Lactobacillus rhamnosus hsryfm 1301 Fermented Milk on Lipid Metabolism Disorders in High-Fat-Diet Rats. Nutrients 2022, 14, 4850. [Google Scholar] [CrossRef] [PubMed]
- Cheong, Y.E.; Kim, J.; Jin, Y.S.; Kim, K.H. Elucidation of the fucose metabolism of probiotic Lactobacillus rhamnosus GG by metabolomic and flux balance analyses. J. Biotechnol. 2022, 360, 110–116. [Google Scholar] [CrossRef]
- Shi, X.; Wei, X.; Yin, X.; Wang, Y.; Zhang, M.; Zhao, C.; Zhao, H.; McClain, C.J.; Feng, W.; Zhang, X. Hepatic and fecal metabolomic analysis of the effects of Lactobacillus rhamnosus GG on alcoholic fatty liver disease in mice. J. Proteome Res. 2015, 14, 1174–1182. [Google Scholar] [CrossRef]
- Chamberlain, M.; O’Flaherty, S.; Cobián, N.; Barrangou, R. Metabolomic Analysis of Lactobacillus acidophilus, L. gasseri, L. crispatus, and Lacticaseibacillus rhamnosus Strains in the Presence of Pomegranate Extract. Front. Microbiol. 2022, 13, 863228. [Google Scholar] [CrossRef] [PubMed]
- Knox, C.; Wilson, M.; Klinger, C.M.; Franklin, M.; Oler, E.; Wilson, A.; Pon, A.; Cox, J.; Chin, N.E.; Strawbridge, S.A.; et al. DrugBank 6.0: The DrugBank Knowledgebase for 2024. Nucleic Acids Res. 2024, 52, D1265–D1275. [Google Scholar] [CrossRef]
- Harding, S.D.; Armstrong, J.F.; Faccenda, E.; Southan, C.; Alexander, S.P.H.; Davenport, A.P.; Spedding, M.; Davies, J.A. The IUPHAR/BPS Guide to PHARMACOLOGY in 2024. Nucleic Acids Res. 2024, 52, D1438–D1449. [Google Scholar] [CrossRef]
- Daina, A.; Michielin, O.; Zoete, V. SwissTargetPrediction: Updated data and new features for efficient prediction of protein targets of small molecules. Nucleic Acids Res. 2019, 47, W357–W364. [Google Scholar] [CrossRef]
- Gfeller, D.; Michielin, O.; Zoete, V. Shaping the interaction landscape of bioactive molecules. Bioinformatics 2013, 29, 3073–3079. [Google Scholar] [CrossRef]
- Daina, A.; Michielin, O.; Zoete, V. SwissADME: A free web tool to evaluate pharmacokinetics, drug-likeness and medicinal chemistry friendliness of small molecules. Sci. Rep. 2017, 7, 42717. [Google Scholar] [CrossRef]
- Daina, A.; Zoete, V. A BOILED-Egg to Predict Gastrointestinal Absorption and Brain Penetration of Small Molecules. ChemMedChem 2016, 11, 1117–1121. [Google Scholar] [CrossRef] [PubMed]
- Galeana-Ascencio, R.A.; Mendieta, L.; Limon, D.I.; Gnecco, D.; Terán, J.L.; Orea, M.L.; Carrasco-Carballo, A. -Secretase-1: In Silico Drug Reposition for Alzheimer’s Disease. Int. J. Mol. Sci. 2023, 24, 8164. [Google Scholar] [CrossRef] [PubMed]
- Fabregat, A.; Sidiropoulos, K.; Viteri, G.; Forner, O.; Marin-Garcia, P.; Arnau, V.; D’eustachio, P.; Stein, L.; Hermjakob, H. Reactome pathway analysis: A high-performance in-memory approach. BMC Bioinform. 2017, 18, 142. [Google Scholar] [CrossRef]
- Szklarczyk, D.; Kirsch, R.; Koutrouli, M.; Nastou, K.; Mehryary, F.; Hachilif, R.; Gable, A.L.; Fang, T.; Doncheva, N.T.; Pyysalo, S.; et al. The STRING database in 2023: Protein-protein association networks and functional enrichment analyses for any sequenced genome of interest. Nucleic Acids Res. 2023, 51, D638–D646. [Google Scholar] [CrossRef]
- Sastry, G.M.; Adzhigirey, M.; Day, T.; Annabhimoju, R.; Sherman, W. Protein and ligand preparation: Parameters, protocols, and influence on virtual screening enrichments. J. Comput. Aided Mol. Des. 2013, 27, 221–234. [Google Scholar] [CrossRef]
- Kim, S.; Chen, J.; Cheng, T.; Gindulyte, A.; He, J.; He, S.; Li, Q.; Shoemaker, B.A.; Thiessen, P.A.; Yu, B.; et al. PubChem 2023 update. Nucleic Acids Res. 2023, 51, D1373–D1380. [Google Scholar] [CrossRef] [PubMed]
- Singh, J.; Deng, Z.; Narale, G.; Chuaqui, C. Structural interaction fingerprints: A new approach to organizing, mining, analyzing, and designing protein-small molecule complexes. Chem. Biol. Drug Des. 2006, 67, 5–12. [Google Scholar] [CrossRef]
- Duan, J.; Dixon, S.L.; Lowrie, J.F.; Sherman, W. Analysis and comparison of 2D fingerprints: Insights into database screening performance using eight fingerprint methods. J. Mol. Graph. Model. 2010, 29, 157–170. [Google Scholar] [CrossRef]


| BioCyc | ||||||||
|---|---|---|---|---|---|---|---|---|
| CID | Trivial Name | PPARA | PPARB | PPARG | RXRA | RXRB | RXRG |  |
| Limit of 95% percentile | −8.13 | −7.05 | −7.52 | −7.14 | −6.85 | −6.84 | ||
| 397 | Indole-3-acetamide | −8.22 | −7.61 | −7.97 | −7.98 | −7.83 | ||
| 995 | Phenanthrene | −7.31 | −8.54 | −8.50 | −8.48 | |||
| 6780 | Anthraquinone | −7.48 | −8.02 | −8.23 | −8.09 | |||
| 6986 | P-menthan-3-one | −7.00 | −6.80 | |||||
| 7108 | Phenothiazine | −7.12 | −8.11 | −8.09 | −7.91 | |||
| 7460 | Alpha-phellandrene | −7.05 | ||||||
| 8400 | Benzoin | −7.05 | −7.80 | −7.36 | −7.22 | |||
| 11142 | Beta-phellandrene | −6.80 | ||||||
| 26049 | 3-carene | −7.01 | −7.10 | |||||
| 28649 | Stilbene oxide | −7.10 | −7.13 | −7.25 | ||||
| 62349 | Menthone lactone | −7.16 | −7.25 | −7.24 | −7.18 | |||
| 70117 | 3-chlorobenzyl alcohol | −6.94 | ||||||
| 234817 | Pinoresinol | −8.17 | ||||||
| 363863 | Maackiain | −7.90 | −7.84 | |||||
| 439901 | 4′-o-methylisoflavone | −8.25 | −7.33 | −7.73 | −7.10 | |||
| 445354 | Retinol; vitamin a | −9.02 | −7.99 | −8.18 | −8.13 | |||
| 494912 | Nsc636229 | −7.55 | −7.55 | −7.01 | ||||
| 623060 | Medicarpin(p) | −8.06 | −7.06 | |||||
| 3326923 | Ibuprofen anion | −8.71 | −7.76 | |||||
| 4055279 | 1-phenylpropan-2-ylazanium | −6.85 | ||||||
| 5377291 | Hinokiresinol | −7.29 | −7.32 | −6.96 | −7.33 | |||
| 6440617 | (z)-hinokiresinol | −8.52 | −8.78 | −7.71 | −7.06 | |||
| 10966551 | 4′-hydroxyisoflavone | −7.63 | −8.05 | −7.81 | −7.33 | −7.86 | ||
| 25246088 | Cis-12,13-epoxy-9-octadecenoic acid | −7.30 | −7.23 | |||||
| 77916059 | Noroxomaritidine | −8.48 | −8.62 | −6.92 | ||||
| 146037227 | Oxomaritinamine | −7.99 | −7.81 | |||||
| PubMed | ||||||||
| CID | Trivial Name | PPARA | PPARB | PPARG | RXRA | RXRB | RXRG | |
| Limit of 95% percentile | −8.12 | −7.13 | −7.17 | −7.28 | −6.94 | −7.00 | ||
| 322 | 4-trans-4-Hydroxycinnamic acid | −7.29 | ||||||
| 800 | 2-(1H-indol-3-yl)acetaldehyde | −6.99 | −7.23 | −7.23 | −7.16 | |||
| 803 | Indole-3-pyruvic acid | −8.79 | −7.82 | −7.24 | −7.05 | −7.01 | ||
| 1150 | Tryptamine | −8.01 | −7.50 | −7.66 | −7.23 | |||
| 3744 | 3-Indolepropionic acid | −8.60 | −7.50 | −6.85 | ||||
| 10394 | 3-(4-Hydroxyphenyl)propionic acid | −7.40 | ||||||
| 10685 | Tryptophol | −6.98 | −7.10 | |||||
| 14558 | Indol-3-acrylic acid | −8.26 | −7.07 | −6.89 | ||||
| 73863 | 3-Indoleglyoxylic acid | −8.02 | −7.40 | −7.10 | −6.92 | |||
| Vit. A | CID | Name | PPARA | PPARB | PPARG | RXRA | RXRB | RXRG | |
|---|---|---|---|---|---|---|---|---|---|
| 1 | 445354-BBB | Retinol | −7.014 | −7.825 | −9.024 | −7.992 | −8.181 | −8.129 |  |
| 2 | 6419707 | Retinoate | −8.453 | −7.825 | −7.543 | −8.310 | −9.383 | −9.680 | |
| 3 | 638015 | Retinal | −8.021 | −6.080 | −7.497 | −8.913 | −7.593 | −7.880 | |
| 4 | 449171-BBB | Retinoic acid | −9.790 | −9.700 | −9.509 | ||||
| Kb | CID | Name | PPARA | PPARB | PPARG | RXRA | RXRB | RXRG | |
| 1 | 4071895 | 2-hydroxybutyrate | −6.327 | −5.505 | −5.391 | −5.829 | −5.428 | −5.542 | |
| 2 | 180 | acetone | −5.023 | −4.554 | −4.615 | −4.373 | −4.389 | −4.490 | |
| 3 | 6971017 | acetoacetate | −6.571 | −5.395 | −6.229 | −6.382 | −5.711 | −5.823 | |
| SCFA | CID | Name | PPARA | PPARB | PPARG | RXRA | RXRB | RXRG | |
| 1 | 283 | Methanoate (Formiate) | −5.019 | −3.795 | −4.432 | −3.392 | −3.427 | −4.199 | |
| 2 | 175 | Ethanoate (Acetate) | −5.573 | −4.312 | −4.934 | −5.303 | −4.643 | −4.762 | |
| 3 | 176 | Ethanoic (Acetic) acid | −5.573 | −4.312 | −4.934 | −5.303 | −4.643 | −4.762 | |
| 4 | 104745 | Propanoate | −4.115 | −2.710 | −3.432 | −4.449 | −3.204 | −4.131 | |
| 5 | 1032-BBB | Propanoic (Propionic) acid | −4.112 | −2.708 | −3.430 | −4.447 | −3.202 | −4.129 | |
| 6 | 264-BBB | Butanoic (Butyric) acid | −6.320 | −5.000 | −5.590 | −6.094 | −5.576 | −5.670 | |
| 7 | 7991-BBB | Pentanoic (Valeric) acid | −5.633 | −4.942 | −4.846 | −5.577 | −4.631 | −5.271 | |
| 8 | 8892-BBB | Hexanoic acid (Caproic acid) | −5.126 | −3.836 | −4.998 | −5.347 | −4.956 | −4.486 | |
| MCFA | CID | Name | PPARA | PPARB | PPARG | RXRA | RXRB | RXRG | |
| 1 | 119389-BBB | Octanoate (Caprylate) | −5.318 | −3.839 | −4.974 | −5.415 | −4.839 | −5.405 | |
| 2 | 379-BBB | Octanoic (caprylic) acid | −5.315 | −3.836 | −4.971 | −5.412 | −4.836 | −5.402 | |
| 3 | 8158-BBB | Nonanoic (pelargonic) acid | −5.559 | −4.129 | −3.245 | −5.725 | −4.448 | −5.551 | |
| 4 | 2969-BBB | Decanoic (capric) acid | −2.473 | −1.548 | −3.480 | −3.678 | −3.478 | −3.765 | |
| 5 | 4149208-BBB | Dodecanoate (laurate) | −2.521 | −2.652 | −1.423 | −4.770 | −3.904 | −4.077 | |
| LCFA | CID | Name | PPARA | PPARB | PPARG | RXRA | RXRB | RXRG | |
| 1 | 11005-BBB | Tetradecanoic (Myristic) acid | −2.847 | −1.169 | −1.731 | −4.993 | −4.607 | −4.769 | |
| 2 | 13849-BBB | pentadecanoic acid | −2.991 | −1.823 | −1.844 | −5.786 | −5.031 | −5.088 | |
| 3 | 504166-BBB | Hexadecanoate (Palmitate) | −3.578 | −2.276 | −1.883 | −5.878 | −5.398 | −5.662 | |
| 4 | 985-BBB | Hexadecanoic (Palmitic acid) | −3.575 | −2.273 | −1.880 | −5.875 | −5.395 | −5.659 | |
| 5 | 10465-BBB | Heptadecanoic acid | −4.241 | −2.703 | −2.175 | −6.517 | −6.103 | −6.162 | |
| 6 | 3033836 | Octadecanoate (Stearate) | −3.581 | −3.511 | −2.928 | −3.219 | −1.485 | −2.856 | |
| 7 | 5281 | Octadecanoic (Stearic) acid | −3.578 | −3.508 | −2.925 | −3.216 | −1.482 | −2.853 | |
| 8 | 12591 | Nonadecanoic acid | −3.937 | −1.175 | −2.888 | −3.040 | −1.611 | −2.890 | |
| MUFA | CID | Name | PPARA | PPARB | PPARG | RXRA | RXRB | RXRG | |
| 1 | 19499-BBB | but-2-enoic acid | −4.408 | −3.736 | −4.482 | −4.874 | −4.560 | −4.792 | |
| 2 | 19499-BBB | but-2-enoic acid | −4.126 | −3.308 | −3.926 | −4.709 | −3.794 | −3.850 | |
| 3 | 151007-BBB | dodec-5-enoic acid | −5.090 | −2.392 | −4.630 | −4.986 | −4.335 | −4.942 | |
| 4 | 151007-BBB | (Z)-dodec-5-enoic acid (Lauroleinic acid) | −3.088 | −2.366 | −1.959 | −4.607 | −4.275 | −4.506 | |
| 5 | 5461012-BBB | (Z)-hexadec-9-enoate (Palmitoleate) | −3.621 | −2.500 | −2.775 | −5.762 | −5.211 | −6.290 | |
| 6 | 4668-BBB | hexadec-9-enoic acid | −4.056 | −2.681 | −2.772 | −6.277 | −5.741 | −5.630 | |
| 7 | 4668-BBB | hexadec-9-enoic acid (Palmitoleic acid) | −3.618 | −2.497 | −2.538 | −5.759 | −5.208 | −6.287 | |
| 8 | 5461069 | (Z)-octadec-11-enoate (Vaccenate) | −4.755 | −2.254 | −3.408 | −6.545 | −6.377 | −6.270 | |
| 9 | 5460221-BBB | (Z)-octadec-9-enoate (Oleate) | −4.130 | −3.831 | −2.946 | −3.632 | −3.445 | −6.620 | |
| 10 | 12745 | octadec-10-enoic acid | −4.334 | −2.947 | −3.766 | −7.002 | −5.919 | −5.977 | |
| 11 | 12745 | octadec-10-enoic acid (cis-10-Oleic acid) | −3.945 | −2.531 | −3.234 | −6.013 | −5.900 | −4.571 | |
| 12 | 965 | octadec-9-enoic acid | −4.777 | −3.983 | −2.943 | −6.762 | −3.442 | −6.617 | |
| 13 | 965 | octadec-9-enoic acid (cis-9-Oleic acid) | −4.127 | −3.828 | −3.848 | −3.629 | −6.084 | −6.617 | |
| PUFA | CID | Name | PPARA | PPARB | PPARG | RXRA | RXRB | RXRG | |
| 1 | 3931-BBB | (9Z,12Z)-octadeca-9,12-dienoic acid (Linoleic acid) | −5.805 | −3.795 | −6.315 | −7.147 | −6.515 | −6.805 | |
| 2 | 3931-BBB | octadeca-9,12-dienoic acid | −5.435 | −3.479 | −5.907 | −7.089 | −6.513 | −6.43 | |
| 3 | 3931-BBB | octadeca-9,12-dienoic acid | −5.342 | −2.787 | −5.761 | −7.02 | −6.476 | −6.394 | |
| 4 | 3931-BBB | octadeca-9,12-dienoic acid | −5.141 | −2.386 | −3.474 | −6.558 | −6.263 | −6.364 | |
| 5 | 860-BBB | octadeca-9,12,15-trienoic acid | −6.388 | −4.839 | −6.407 | −7.015 | −6.713 | −6.859 | |
| 6 | 860-BBB | octadeca-9,12,15-trienoic acid | −5.267 | −4.74 | −6.128 | −7.001 | −6.539 | −6.804 | |
| 7 | 860-BBB | octadeca-9,12,15-trienoic acid | −5.123 | −4.262 | −3.892 | −6.772 | −6.51 | −6.712 | |
| 8 | 860-BBB | octadeca-9,12,15-trienoic acid | −4.992 | −4.247 | −3.867 | −6.74 | −6.301 | −6.548 | |
| 9 | 860-BBB | octadeca-9,12,15-trienoic acid | −4.992 | −4.16 | −3.307 | −6.62 | −5.864 | −6.526 | |
| 10 | 860-BBB | (9Z,12Z,15Z)-octadeca-9,12,15-trienoic acid (alpha-Linolenic acid) | −4.973 | −4.129 | −3.286 | −6.501 | −5.773 | −6.265 | |
| 11 | 860-BBB | octadeca-9,12,15-trienoic acid | −4.786 | −2.834 | −3.028 | −6.173 | −5.633 | −6.028 | |
| 12 | 860-BBB | octadeca-9,12,15-trienoic acid | −4.58 | −2.706 | −3.001 | −3.615 | −4.045 | −5.125 | |
| 445580 | (4Z,7Z,10Z,13Z,16Z,19Z)-docosa-4,7,10,13,16,19-hexaenoic acid (DHA) | −7.014 | −7.416 | −8.724 | −8.746 | −9.264 | −9.512 | ||
| 446284 | (5Z,8Z,11Z,14Z,17Z)-eicosa-5,8,11,14,17-pentaenoic acid (EPA) | −8.815 | −7.433 | −6.911 | −8.441 | −6.812 | −7.845 | ||
| PubMed | |||||||||
| Indole | CID | Name | PPARA | PPARB | PPARG | RXRA | RXRB | RXRG | |
| 1 | 798-BBB | indole | −5.934 | −5.692 | −5.840 | −6.131 | −6.164 | −6.177 | |
| 2 | 10256-BBB | 1H-indole-3-carbaldehyde | −7.272 | −6.528 | −6.521 | −6.647 | −6.598 | −6.685 | |
| 3 | 800-BBB | 2-(1H-indol-3-yl)acetaldehyde | −7.715 | −6.991 | −7.035 | −7.227 | −7.234 | −7.160 | |
| 4 | 1150-BBB | 2-(1H-indol-3-yl)ethanamine | −7.231 | −8.007 | −6.737 | −7.497 | −7.657 | −7.232 | |
| 5 | 10685-BBB | 2-(1H-indol-3-yl)ethanol | −6.942 | −6.926 | −6.405 | −7.085 | −6.977 | −7.102 | |
| 6 | 14558-BBB | 3-(1H-indol-3-yl)prop-2-enoic acid | −8.258 | −7.067 | −6.570 | −6.679 | −6.889 | −6.594 | |
| 7 | 14558-BBB | 3-(1H-indol-3-yl)prop-2-enoic acid | −7.733 | −6.943 | −6.094 | −6.329 | −6.251 | −5.938 | |
| 8 | 14558-BBB | 3-(1H-indol-3-yl)prop-2-enoic acid | −5.135 | −4.448 | −4.461 | −5.225 | −5.464 | −5.033 | |
| 9 | 14558-BBB | 3-(1H-indol-3-yl)prop-2-enoic acid | −4.749 | −3.815 | −3.898 | −4.963 | −4.891 | −4.967 | |
| 10 | 73863-BBB | 2-(1H-indol-3-yl)-2-oxo-acetic acid | −8.016 | −7.400 | −7.097 | −7.119 | −6.917 | −6.937 | |
| 11 | 3744-BBB | 3-(1H-indol-3-yl)propanoic acid | −8.599 | −7.499 | −6.597 | −6.801 | −6.851 | −6.737 | |
| 12 | 803-BBB | 3-(1H-indol-3-yl)-2-oxo-propanoic acid | −8.790 | −7.815 | −7.243 | −7.006 | −7.045 | −7.008 | |
| 13 | 6932058 | 1H-indole-3-carboxylate | −7.624 | −6.243 | −6.505 | −6.643 | −6.749 | −6.465 | |
| 14 | 801 | 2-(1H-indol-3-yl)acetate (Indolacetate) | −7.827 | −7.306 | −6.719 | −7.047 | −7.065 | −7.283 | |
| 15 | 3080590 | 2-(2-oxoindolin-3-yl)acetic acid | −7.619 | −6.742 | −7.175 | −7.063 | −7.151 | −6.989 | |
| 16 | 92904 | 2-hydroxy-3-(1H-indol-3-yl)propanoic acid | −8.578 | −8.014 | −6.787 | −7.225 | −7.066 | −7.210 | |
| Action | CID | Trivial Name | GIT | BBB | IUPHAR/BPS | DB | PPARA | PPARB | PPARG | RXRA | RXRB | RXRG | |
|---|---|---|---|---|---|---|---|---|---|---|---|---|---|
| Antagonist (Anta) | 446738 | GW 6471 | Low | No | Yes | No | −8.79 |  | |||||
| −8.51 | |||||||||||||
| −8.35 | |||||||||||||
| 46233311 | GSK0660 | Low | No | Yes | No | −5.21 | |||||||
| −4.87 | |||||||||||||
| 82146 | Bexarotene | High | No | Yes | Yes | −9.16 | |||||||
| 445154 | Resveratrol | High | Yes | Yes | Yes | −8.46 | |||||||
| −4.53 | |||||||||||||
| 3033 | Diclofenac | High | Yes | Yes | Yes | −7.75 | |||||||
| Agonist (Ago) | 3339 | Fenofibrate | High | Yes | Yes | Yes | −7.82 | ||||||
| 2796 | Clofibrate | High | Yes | Yes | Yes | −6.50 | |||||||
| 9864881 | Elafibranor | High | No | Yes | Yes | −6.57 | |||||||
| 9891946 | L-796449 | Low | No | Yes | No | −9.24 | |||||||
| 11236126 | Seladelpar | Low | No | Yes | Yes | −8.15 | |||||||
| 4075 | Mesalamine | High | No | Yes | Yes | −5.83 | |||||||
| 3715 | Indomethacin | High | Yes | Yes | Yes | −9.25 | |||||||
| 4829 | Pioglitazone | High | No | Yes | Yes | −8.19 | |||||||
| −7.71 | |||||||||||||
| −6.71 | |||||||||||||
| −5.90 | |||||||||||||
| 77999 | Rosiglitazone | High | No | Yes | Yes | −8.13 | |||||||
| −7.76 | |||||||||||||
| −7.37 | |||||||||||||
| −7.01 | |||||||||||||
| 9864881 | Elafibranor | High | No | Yes | Yes | −7.29 | |||||||
| Antagonist (Anta) | 1548887 | Sulindac | High | No | Yes | Yes | −8.88 | ||||||
| 3922 | LG-100268 | High | Yes | Yes | No | −9.43 | |||||||
| 3922 | LG-100268 | High | Yes | Yes | No | −8.85 | |||||||
| 3922 | LG-100268 | High | Yes | Yes | No | −8.26 | |||||||
| Agonist (Ago) | 25195496 | Fluorobexarotene | High | No | Yes | No | −10.60 | ||||||
| Activator | 82146 | Bexarotene | High | No | Yes | Yes | −9.92 | ||||||
| 82146 | Bexarotene | High | No | Yes | Yes | −10.06 | |||||||
| 82146 | Bexarotene | High | No | Yes | Yes | −10.22 |
| A. Alignment numbering | 26 | 29 | 59 | 62 | 63 | 65 | 66 | 67 | 78 | 85 | 86 | 87 | 88 | 89 | 91 | 95 | 96 | 123 | 126 | 127 | 130 | 139 | 141 | 152 | 156 | 160 | 163 | 164 | 167 | 249 | 253 | 265 | 292 | 273 | |
| Residues dock agonist | PPARA | - | - | - | - | - | - | - | - | - | C276 | Q277 | - | - | S280 | - | - | - | Y314 | - | F318 | - | M330 | V332 | - | - | - | I354 | K358 | - | H440 | V444 | - | L460 | Y464 |
| PPARB | - | - | - | - | - | - | - | - | - | C285 | Q286 | - | - | T289 | - | - | - | H323 | - | F327 | - | L330 | V341 | - | - | - | I363 | I364 | - | H449 | M453 | - | L469 | Y473 | |
| PPARG | - | - | - | - | - | - | - | - | - | C285 | - | - | R288 | S289 | - | - | - | - | L326 | Y327 | L330 | - | L341 | - | - | - | - | - | - | - | - | - | - | - | |
| Residues dock antagonist | PPARA | - | - | - | T253 | L254 | A256 | K257 | - | - | - | - | C278 | - | - | E282 | - | - | - | - | - | - | - | - | - | - | - | - | - | - | - | - | - | - | - |
| PPARB | - | - | - | - | - | - | - | - | - | - | - | C287 | - | - | E291 | E295 | - | - | - | - | - | - | - | - | - | - | - | - | - | - | - | - | - | - | |
| PPARG | - | - | - | - | - | - | - | - | - | - | - | - | - | - | - | - | - | - | - | - | - | - | - | - | - | - | - | - | - | - | - | - | - | - | |
| Specific residues | PPARA | - | M220 | E251 | T253 | L254 | A256 | - | L258 | - | - | - | - | - | - | - | - | - | - | - | - | - | - | - | - | - | - | - | - | - | - | - | L456 | - | - |
| PPARB | - | - | - | - | - | - | - | - | - | - | - | - | - | - | - | - | - | - | - | - | - | - | - | F352 | - | - | - | - | - | - | - | - | - | - | |
| PPARG | F226 | - | - | - | - | - | - | - | A278 | - | - | - | - | - | - | - | I296 | - | - | - | - | - | - | - | L356 | F360 | - | - | - | - | - | - | - | - | |
| Blood: residue that interact >75% residues; green: residues that dock with antagonist; Red: residues that dock with agonist; yellow: specific PPAR residues that dock with any molecule. | |||||||||||||||||||||||||||||||||||
| B. Alignment numbering | 50 | 54 | 88 | 91 | 92 | 95 | 124 | 127 | 128 | 131 | 214 | 217 | 218 | 221 | |||||||||||||||||||||
| Agonist | RXRA | I268 | A272 | N306 | L309 | - | F313 | V342 | L345 | F346 | V349 | C432 | H435 | L436 | F439 | ||||||||||||||||||||
| RXRB | L339 | A343 | N377 | - | I381 | F384 | V413 | I416 | F417 | V420 | C503 | H506 | L507 | F510 | |||||||||||||||||||||
| RXRG | V266 | I269 | N307 | - | L311 | F314 | V343 | L346 | F347 | V350 | C433 | H436 | L437 | F440 | |||||||||||||||||||||
| Blood: residue that interact >75% residues; normal: residue that interact >75% residues; green: residues that dock with agonist; red: residues that dock with antagonist; yellow; residues that only appear in one protein isotype. | |||||||||||||||||||||||||||||||||||
Disclaimer/Publisher’s Note: The statements, opinions and data contained in all publications are solely those of the individual author(s) and contributor(s) and not of MDPI and/or the editor(s). MDPI and/or the editor(s) disclaim responsibility for any injury to people or property resulting from any ideas, methods, instructions or products referred to in the content. |
© 2025 by the authors. Licensee MDPI, Basel, Switzerland. This article is an open access article distributed under the terms and conditions of the Creative Commons Attribution (CC BY) license (https://creativecommons.org/licenses/by/4.0/).
Share and Cite
Parra, I.; Carrasco-Carballo, A.; Palafox-Sanchez, V.; Martínez-García, I.; Aguilera, J.; Góngora-Alfaro, J.L.; Aranda-González, I.I.; Tizabi, Y.; Mendieta, L. Peroxisome Proliferator-Activated Receptors (PPARs) May Mediate the Neuroactive Effects of Probiotic Metabolites: An In Silico Approach. Int. J. Mol. Sci. 2025, 26, 4507. https://doi.org/10.3390/ijms26104507
Parra I, Carrasco-Carballo A, Palafox-Sanchez V, Martínez-García I, Aguilera J, Góngora-Alfaro JL, Aranda-González II, Tizabi Y, Mendieta L. Peroxisome Proliferator-Activated Receptors (PPARs) May Mediate the Neuroactive Effects of Probiotic Metabolites: An In Silico Approach. International Journal of Molecular Sciences. 2025; 26(10):4507. https://doi.org/10.3390/ijms26104507
Chicago/Turabian StyleParra, Irving, Alan Carrasco-Carballo, Victoria Palafox-Sanchez, Isabel Martínez-García, José Aguilera, José L. Góngora-Alfaro, Irma Isela Aranda-González, Yousef Tizabi, and Liliana Mendieta. 2025. "Peroxisome Proliferator-Activated Receptors (PPARs) May Mediate the Neuroactive Effects of Probiotic Metabolites: An In Silico Approach" International Journal of Molecular Sciences 26, no. 10: 4507. https://doi.org/10.3390/ijms26104507
APA StyleParra, I., Carrasco-Carballo, A., Palafox-Sanchez, V., Martínez-García, I., Aguilera, J., Góngora-Alfaro, J. L., Aranda-González, I. I., Tizabi, Y., & Mendieta, L. (2025). Peroxisome Proliferator-Activated Receptors (PPARs) May Mediate the Neuroactive Effects of Probiotic Metabolites: An In Silico Approach. International Journal of Molecular Sciences, 26(10), 4507. https://doi.org/10.3390/ijms26104507