
Genome-Wide Characterization of the Heat Shock Transcription Factor Gene Family in Betula platyphylla Reveals Promising Candidates for Heat Tolerance

 ,
,  and
and
Abstract
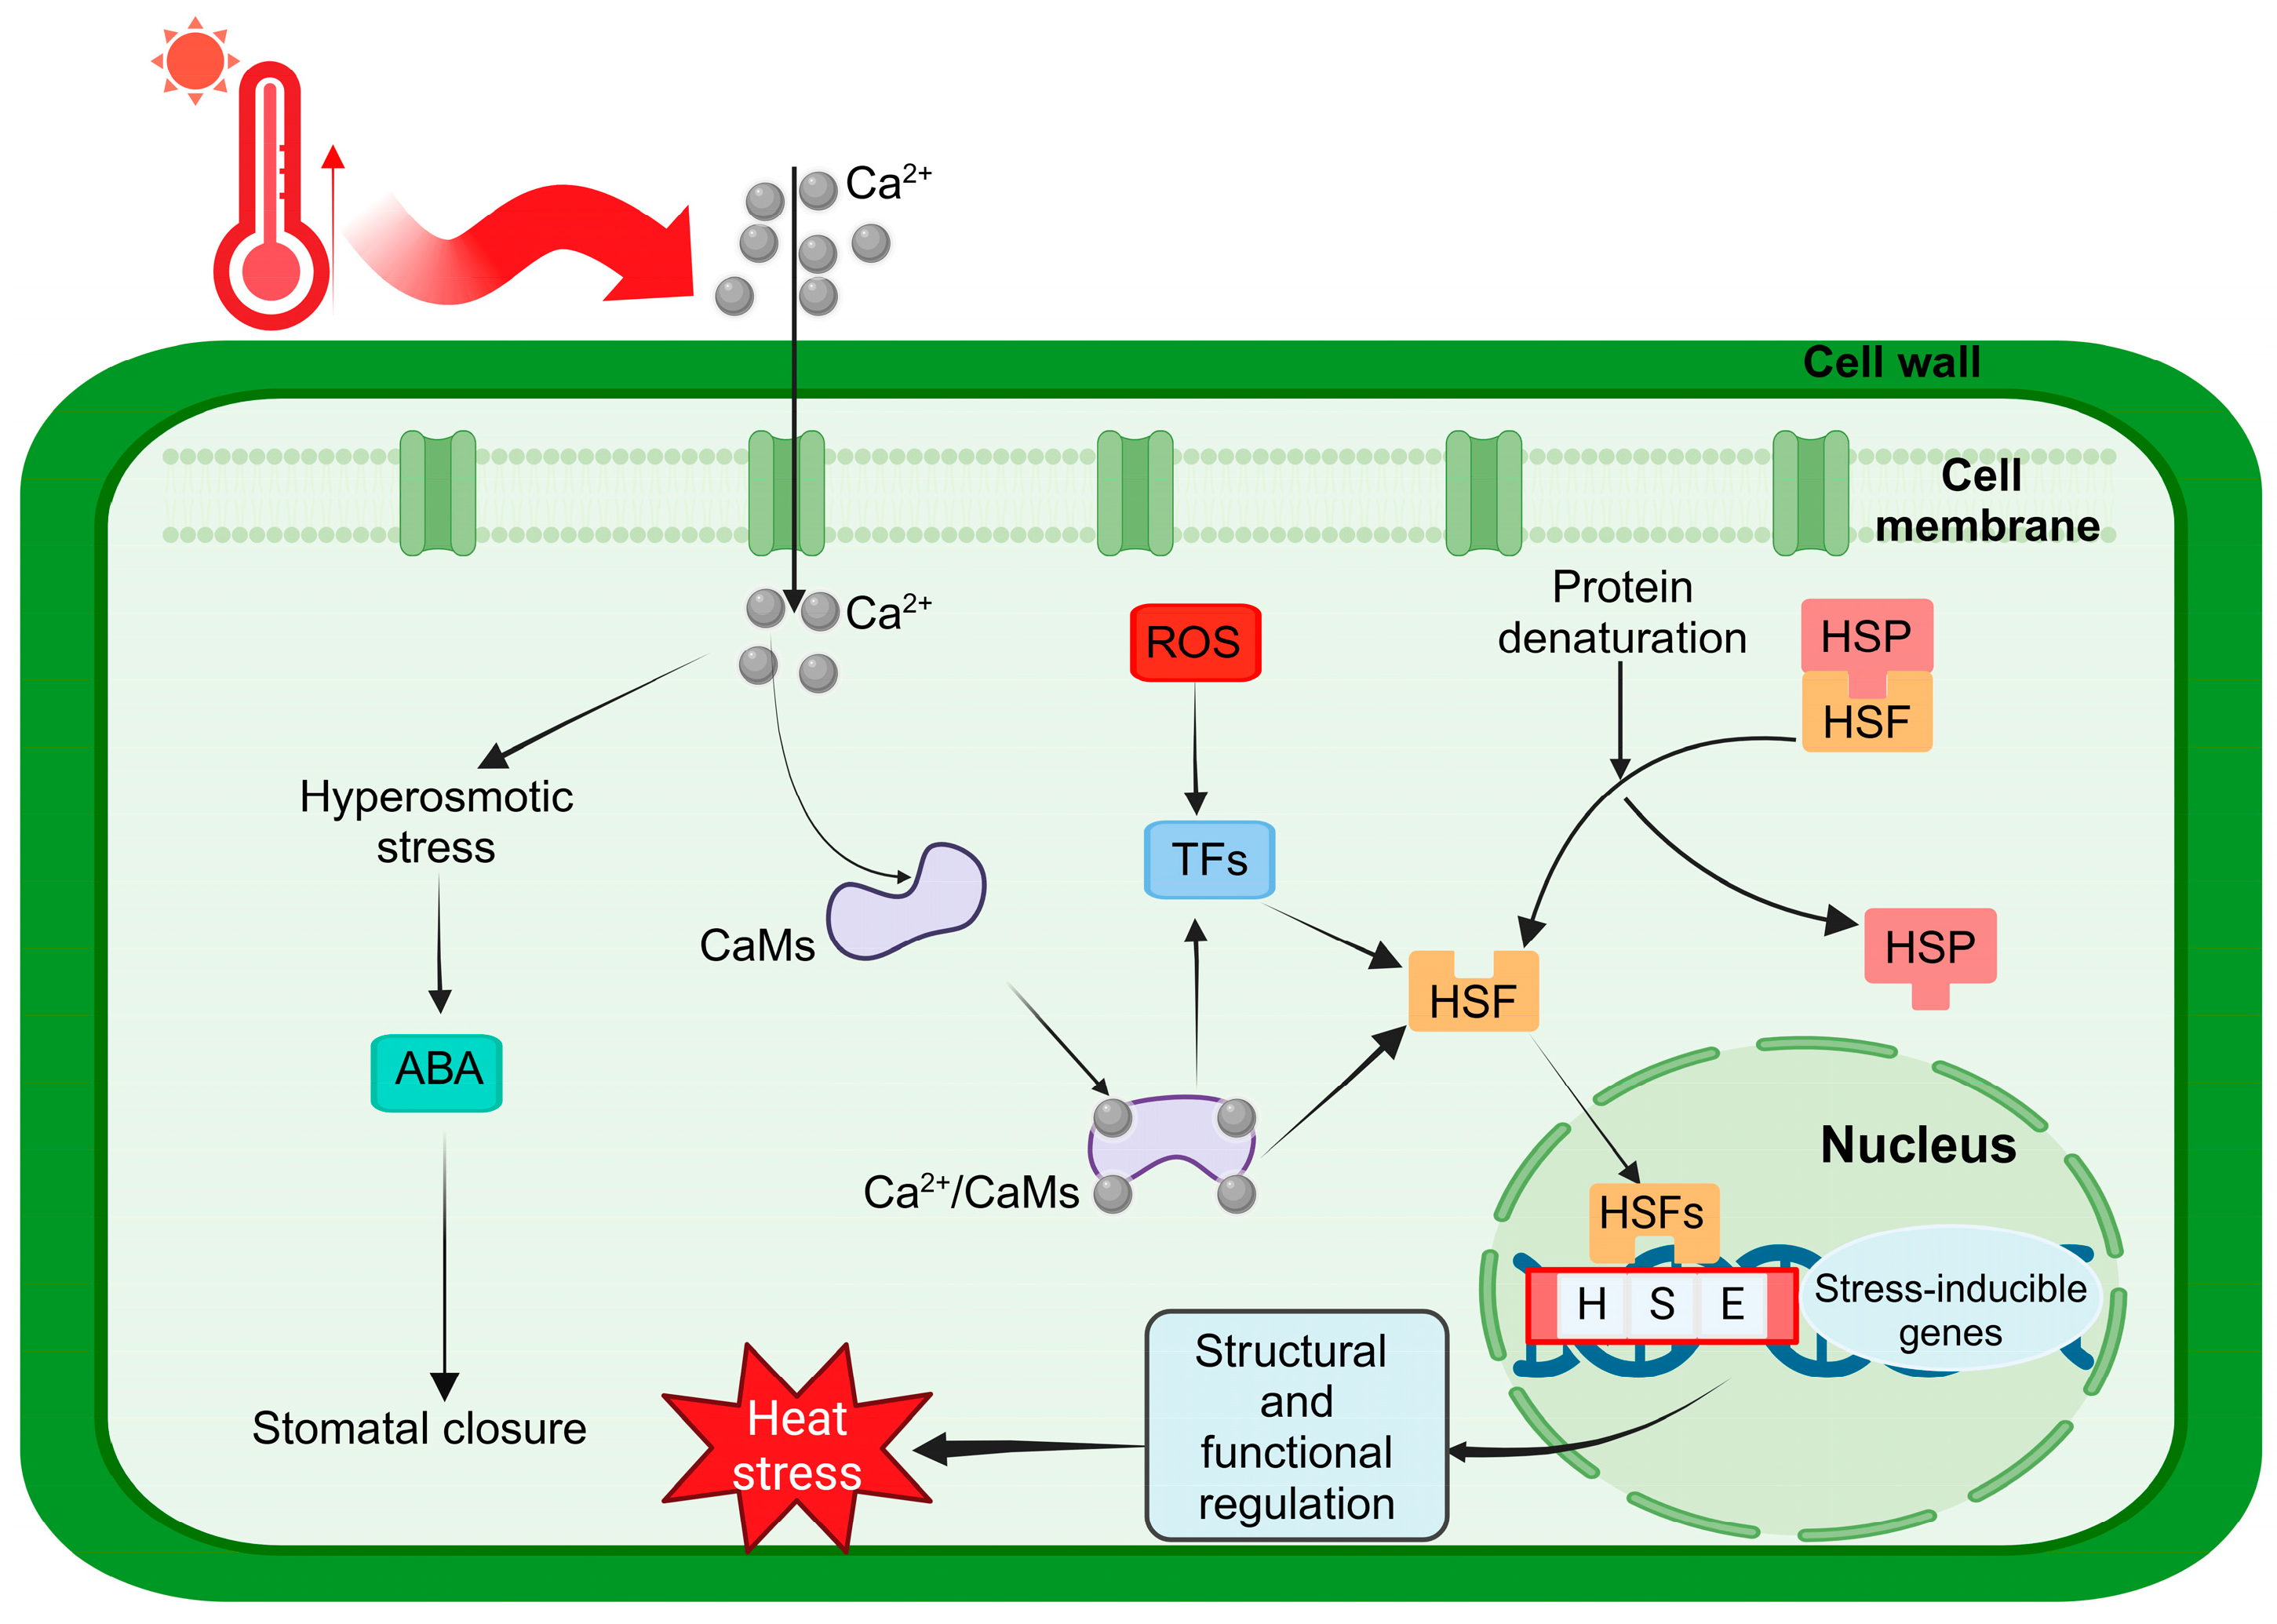
:1. Introduction
2. Results
2.1. Identification and Physicochemical Characterization of the BpHSF Gene Family
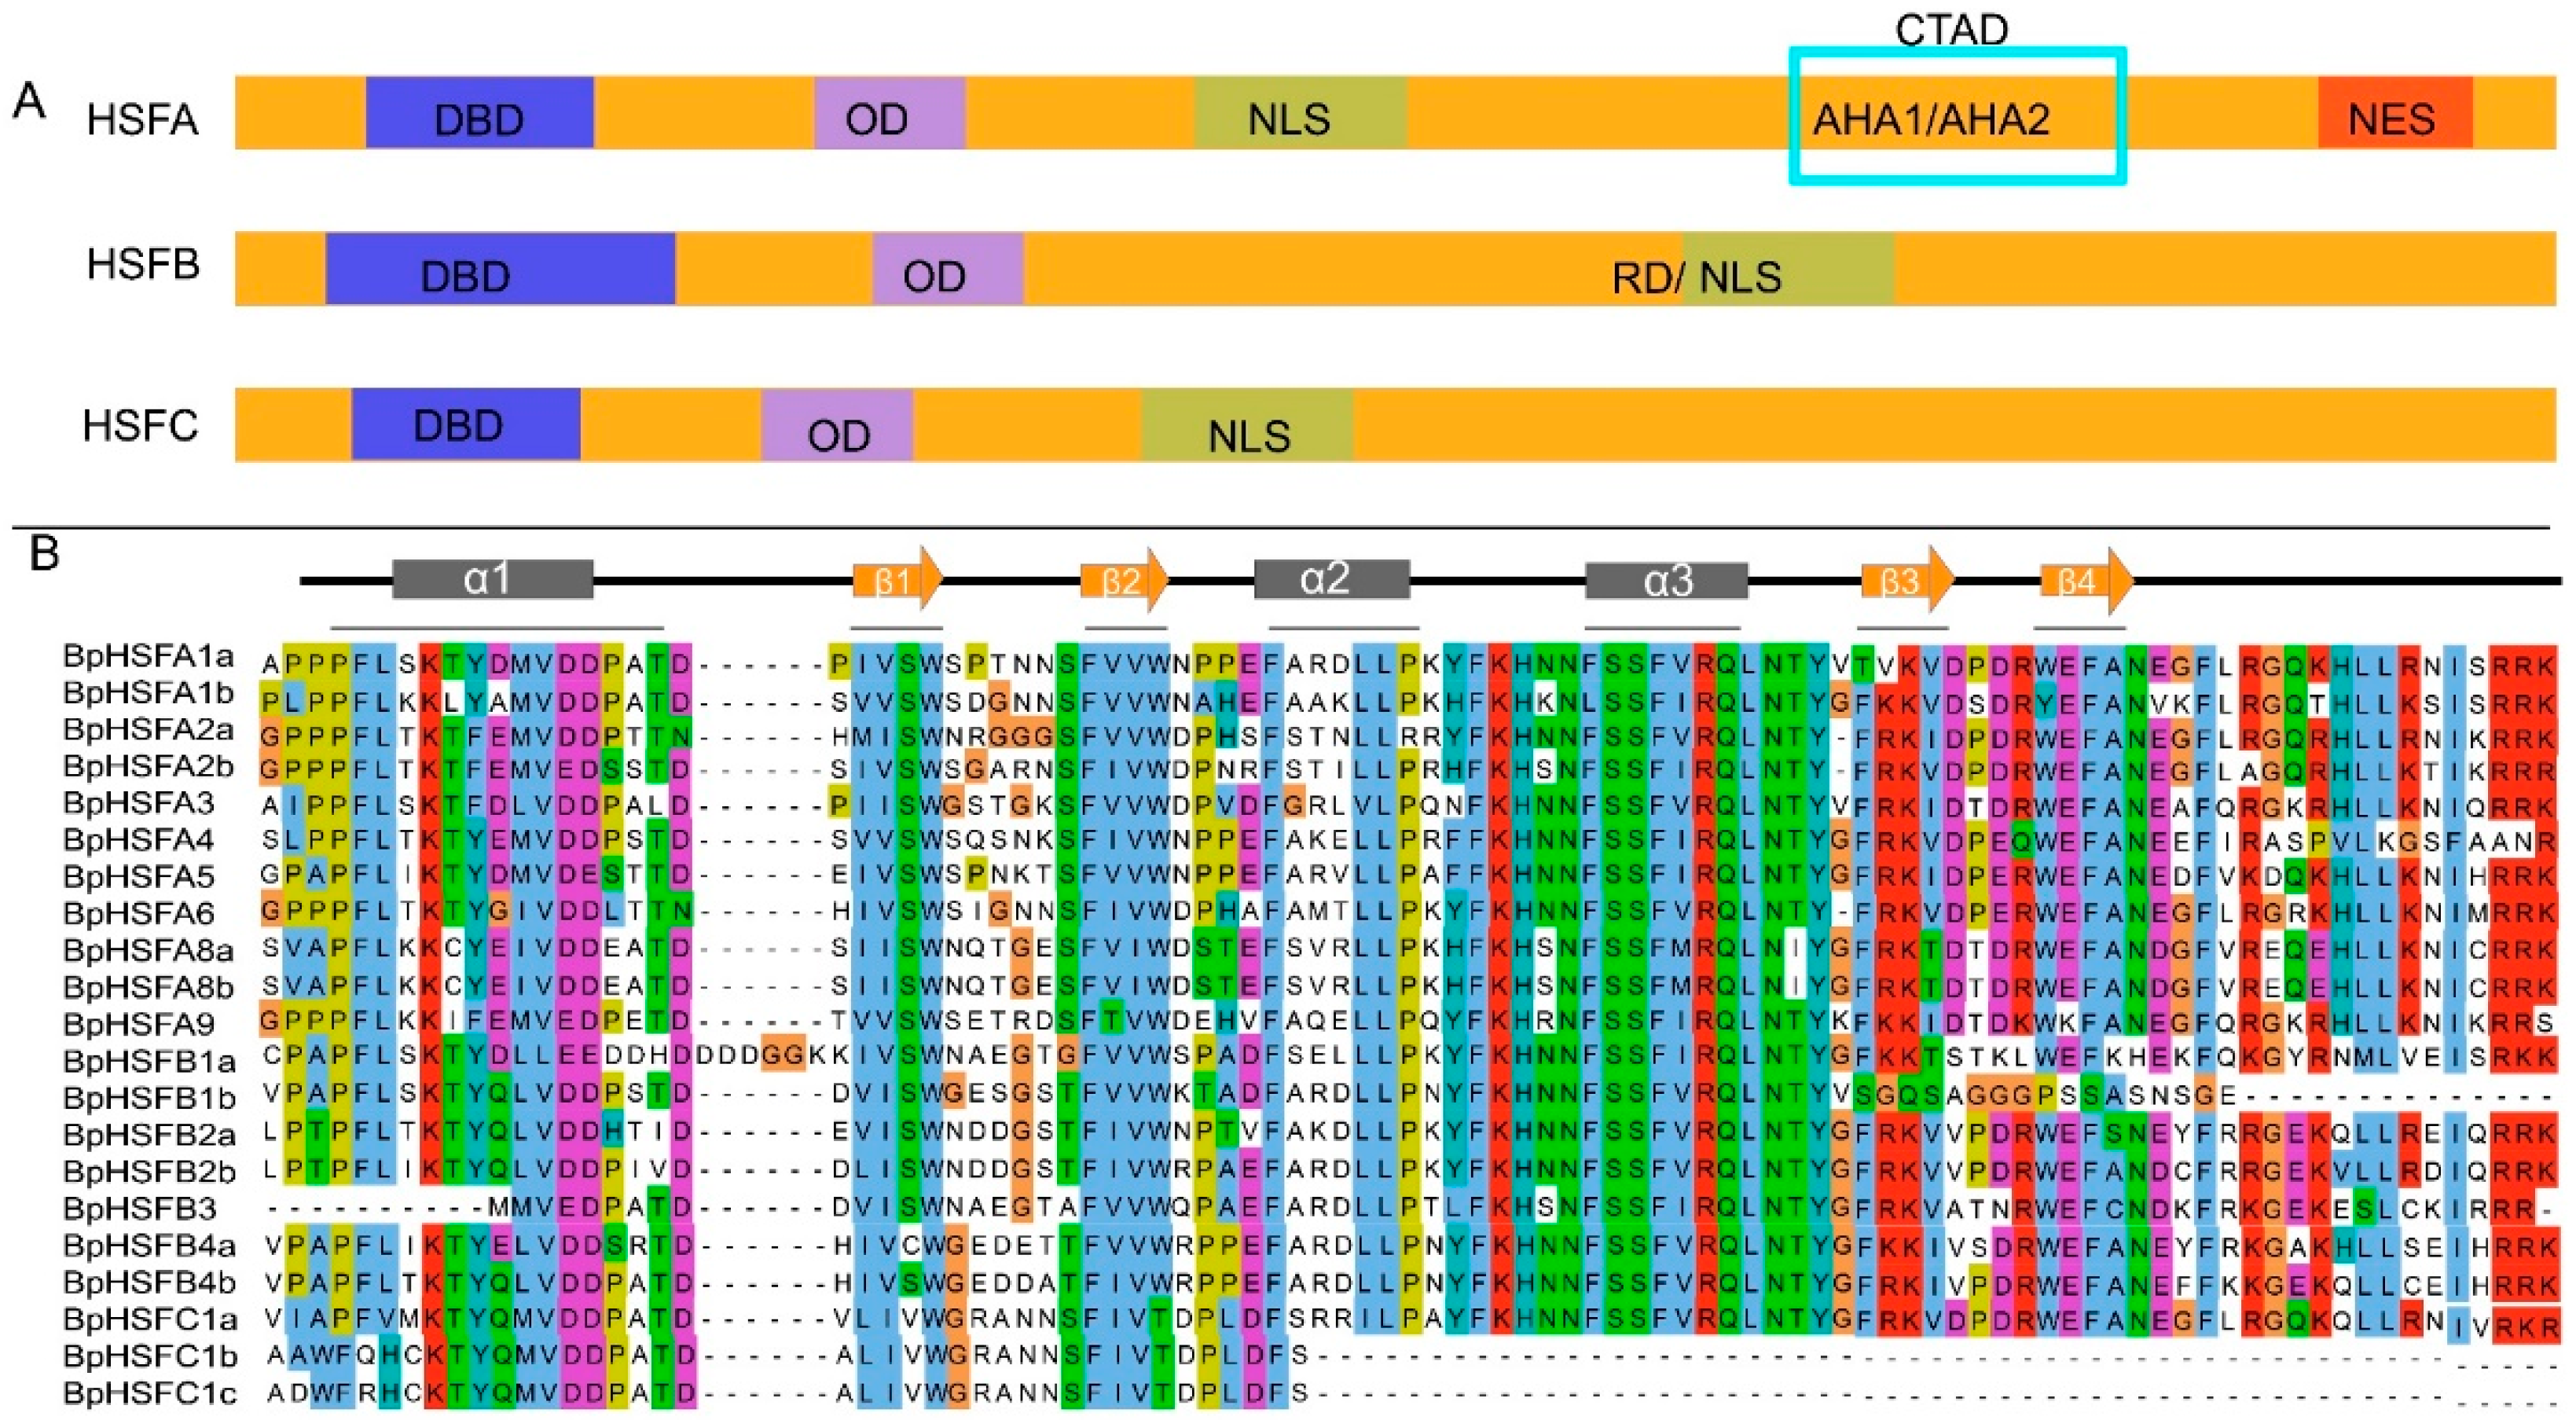
2.2. BpHSF Protein Multiple Sequence Comparison
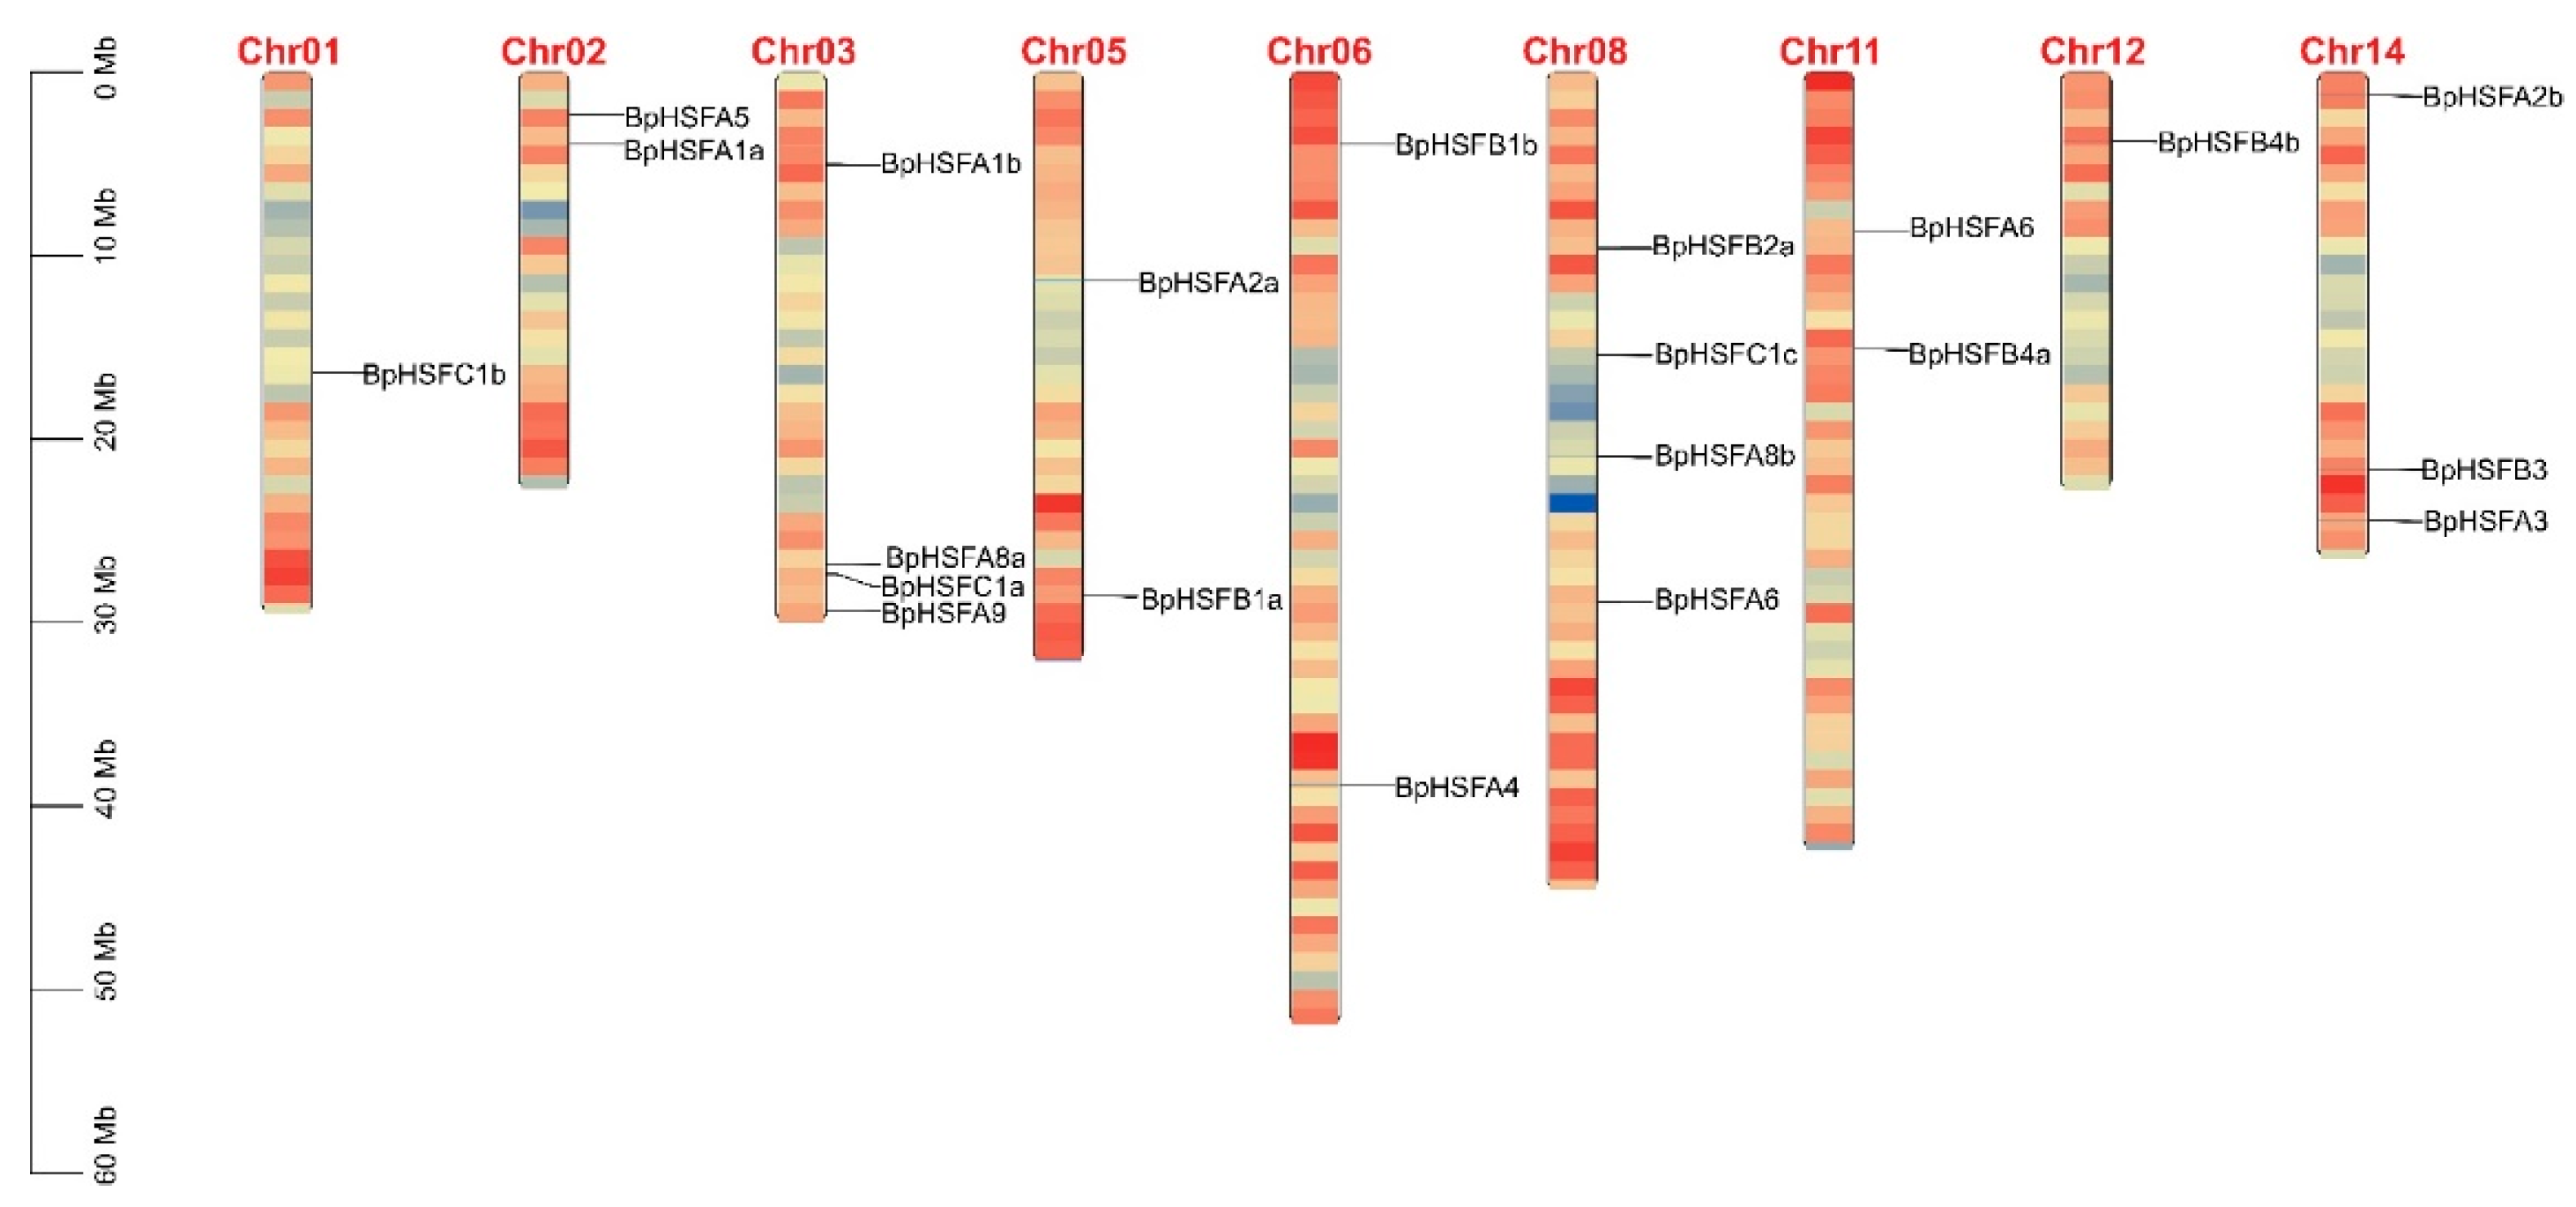
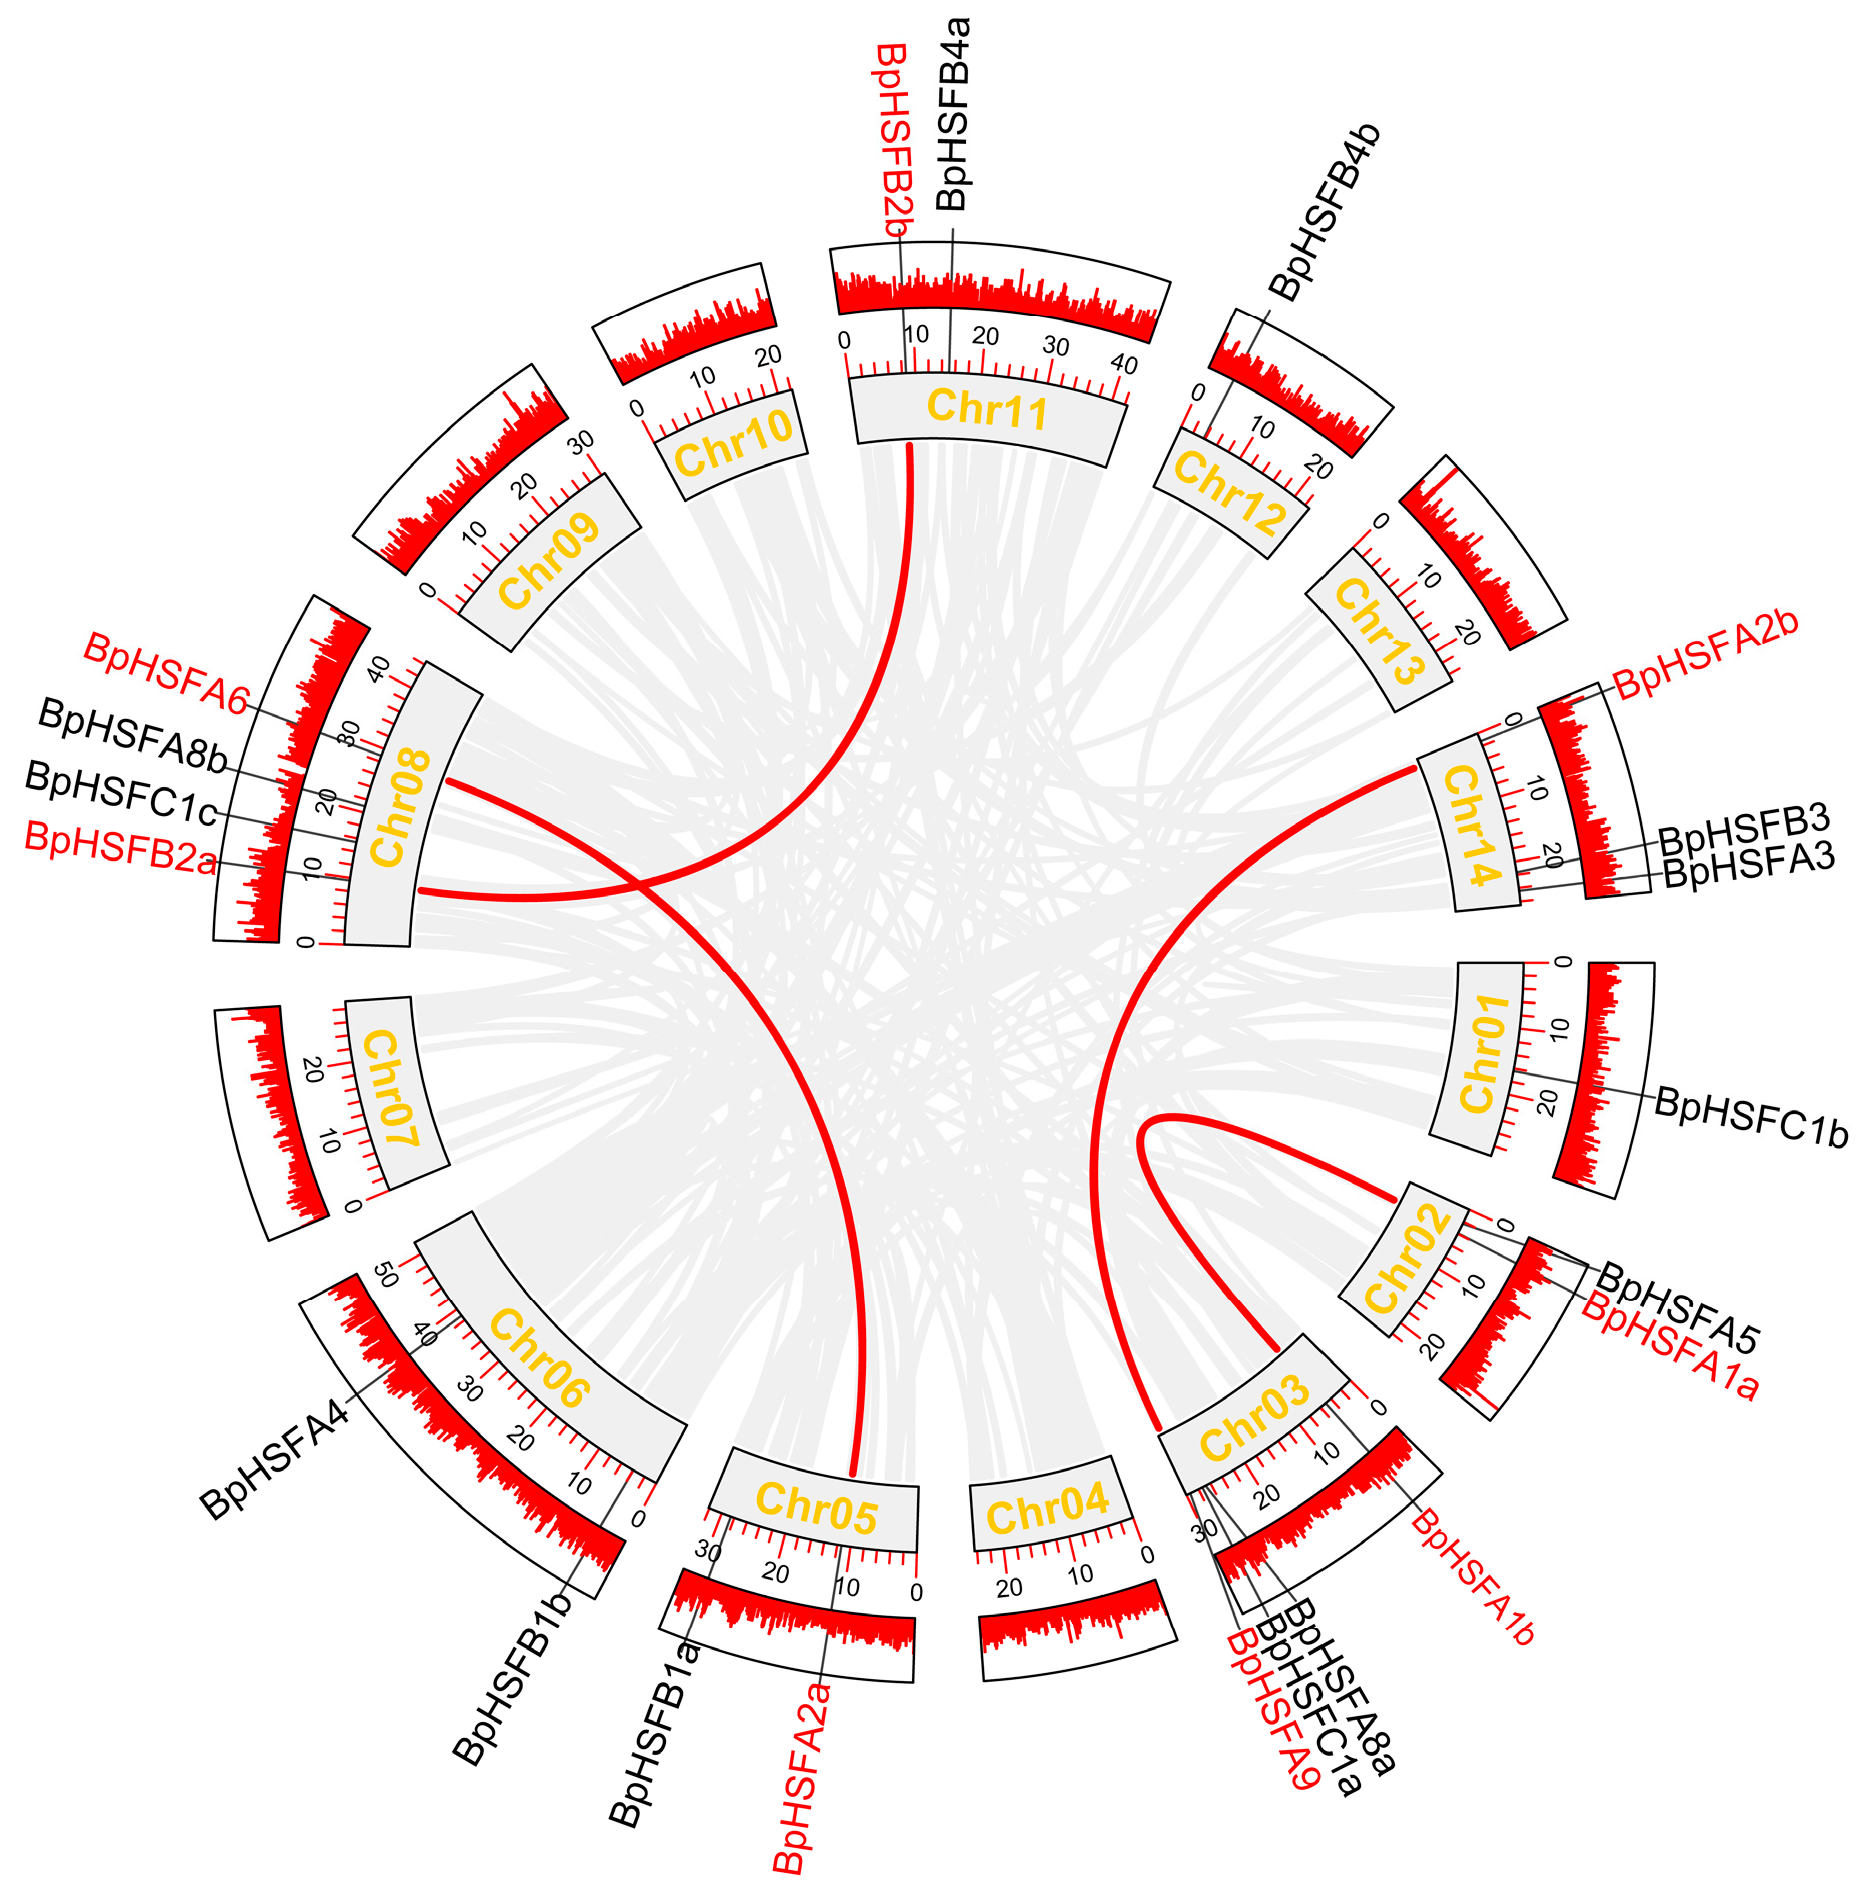
2.3. Chromosomal Localization of BpHSF Genes
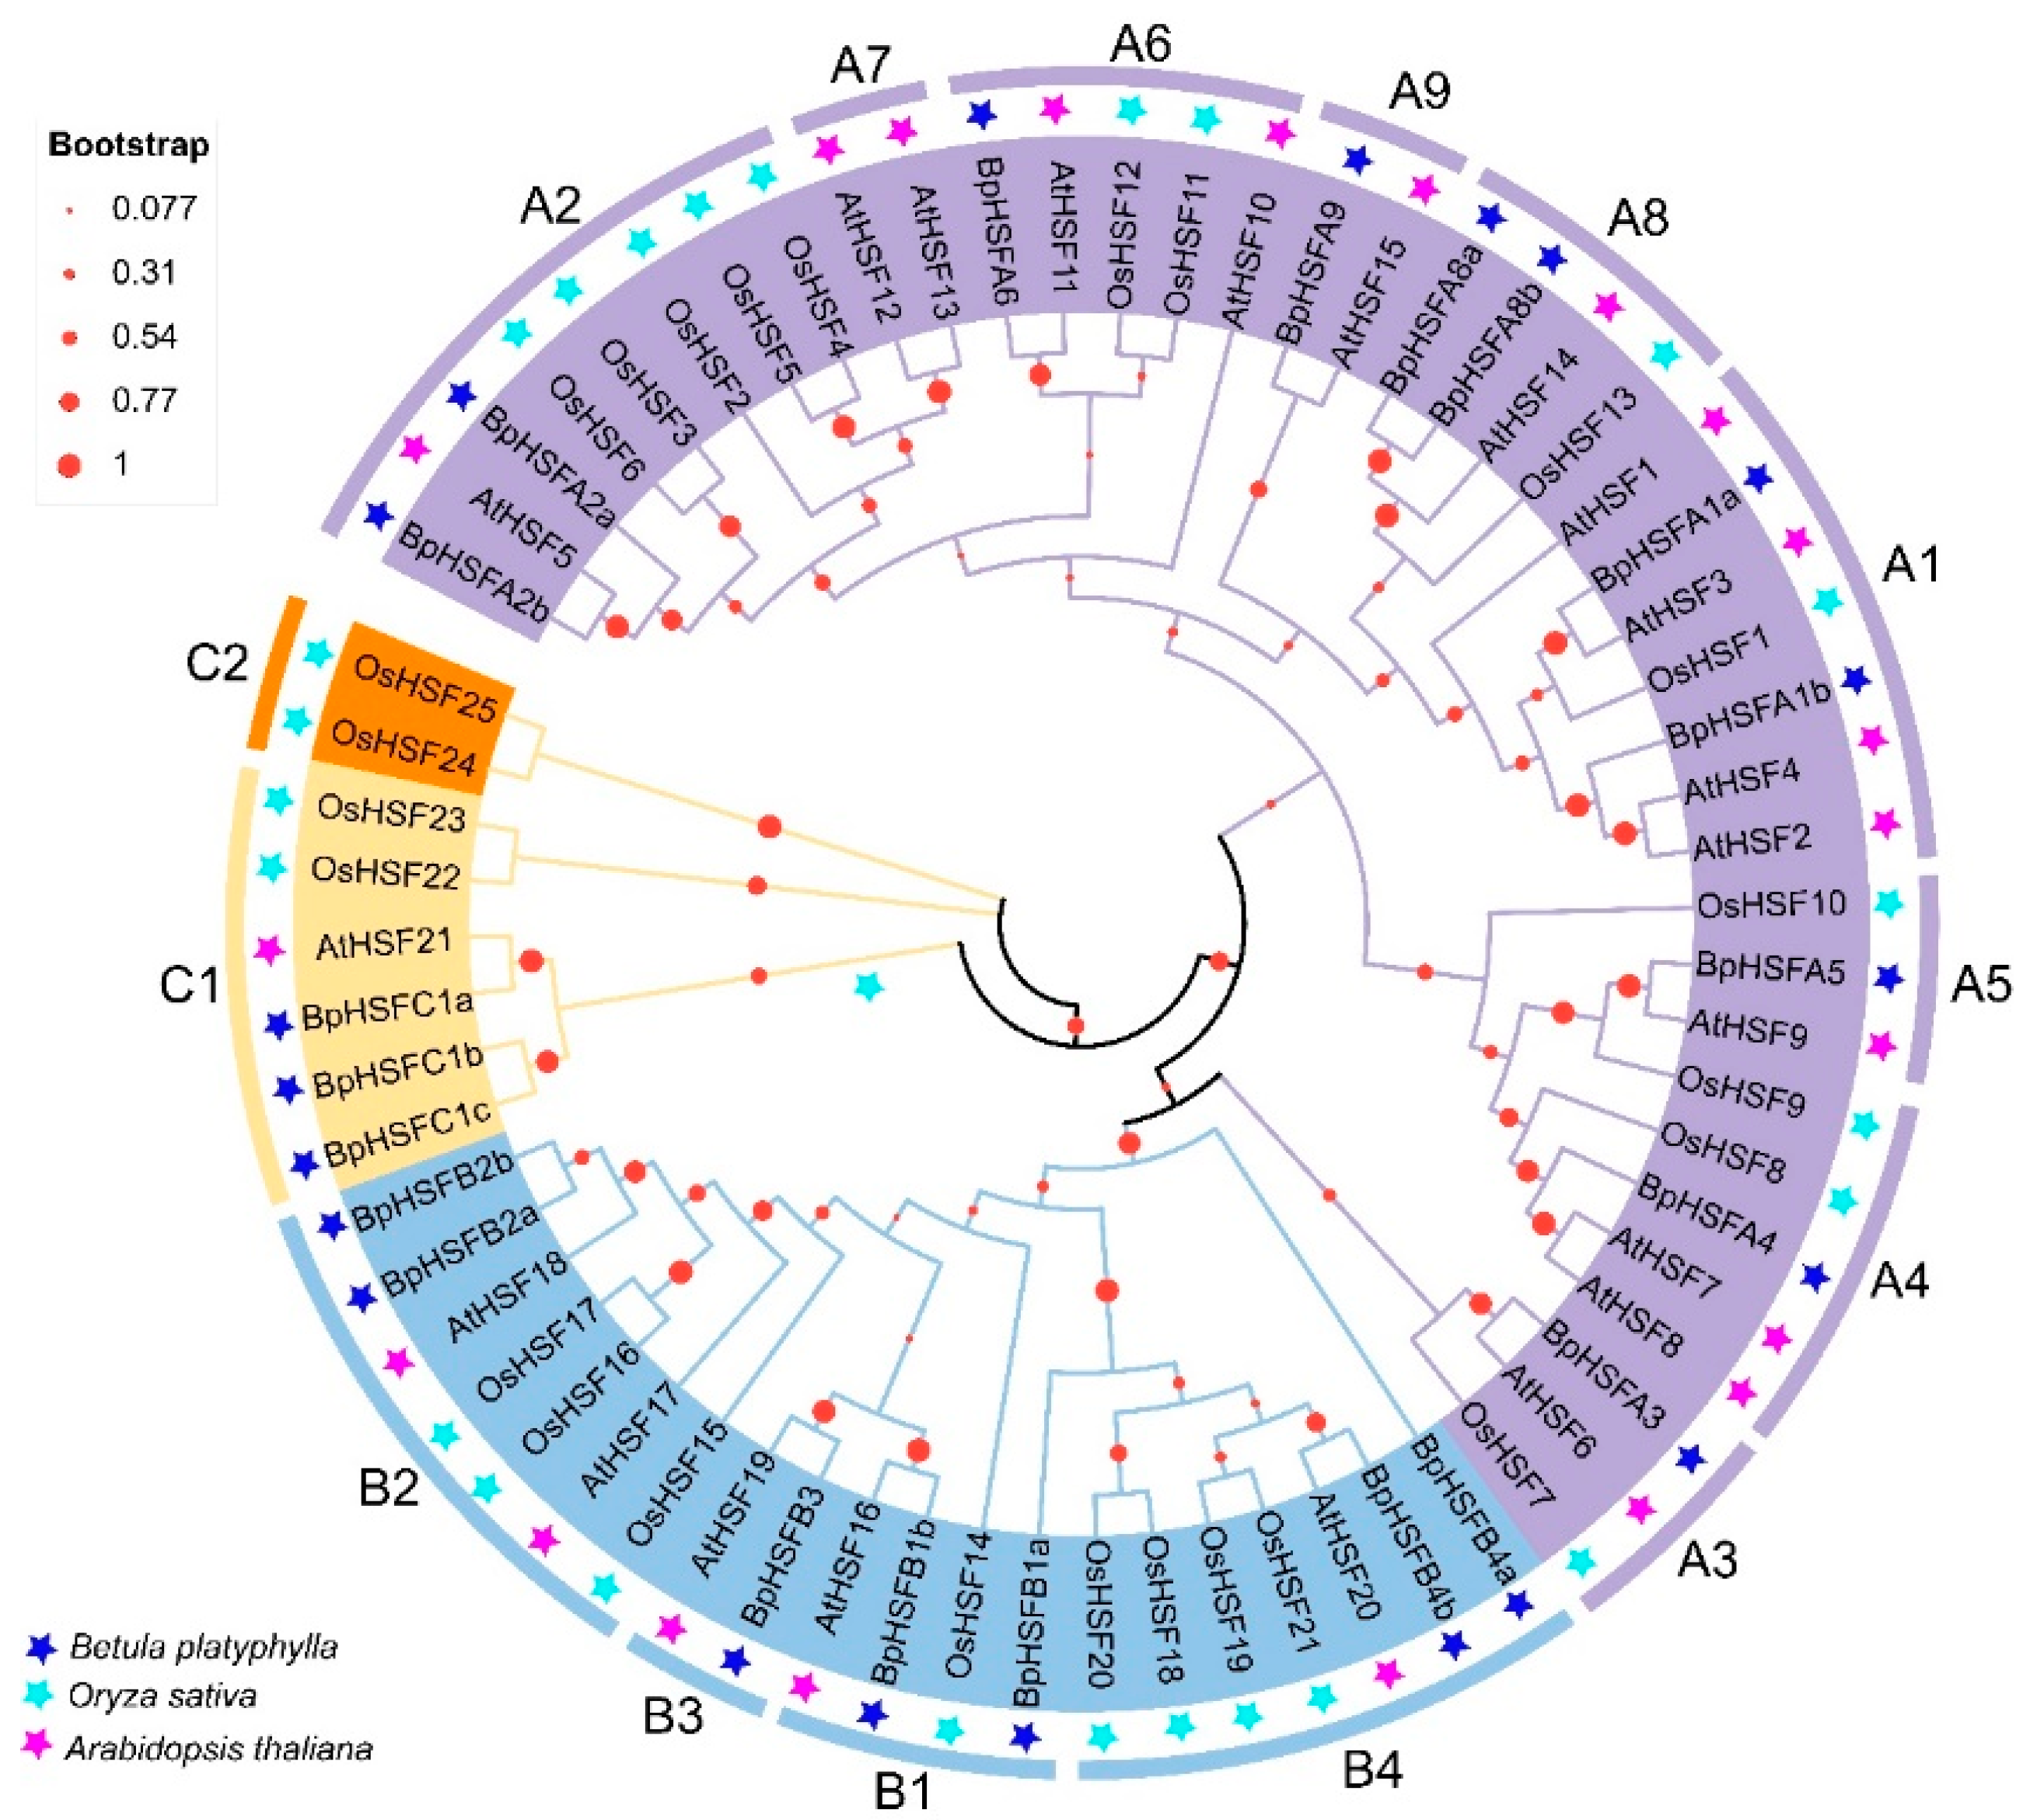
2.4. BpHSF Evolutionary Tree Analysis
2.5. Protein Motifs and Gene Structure of BpHSF Genes
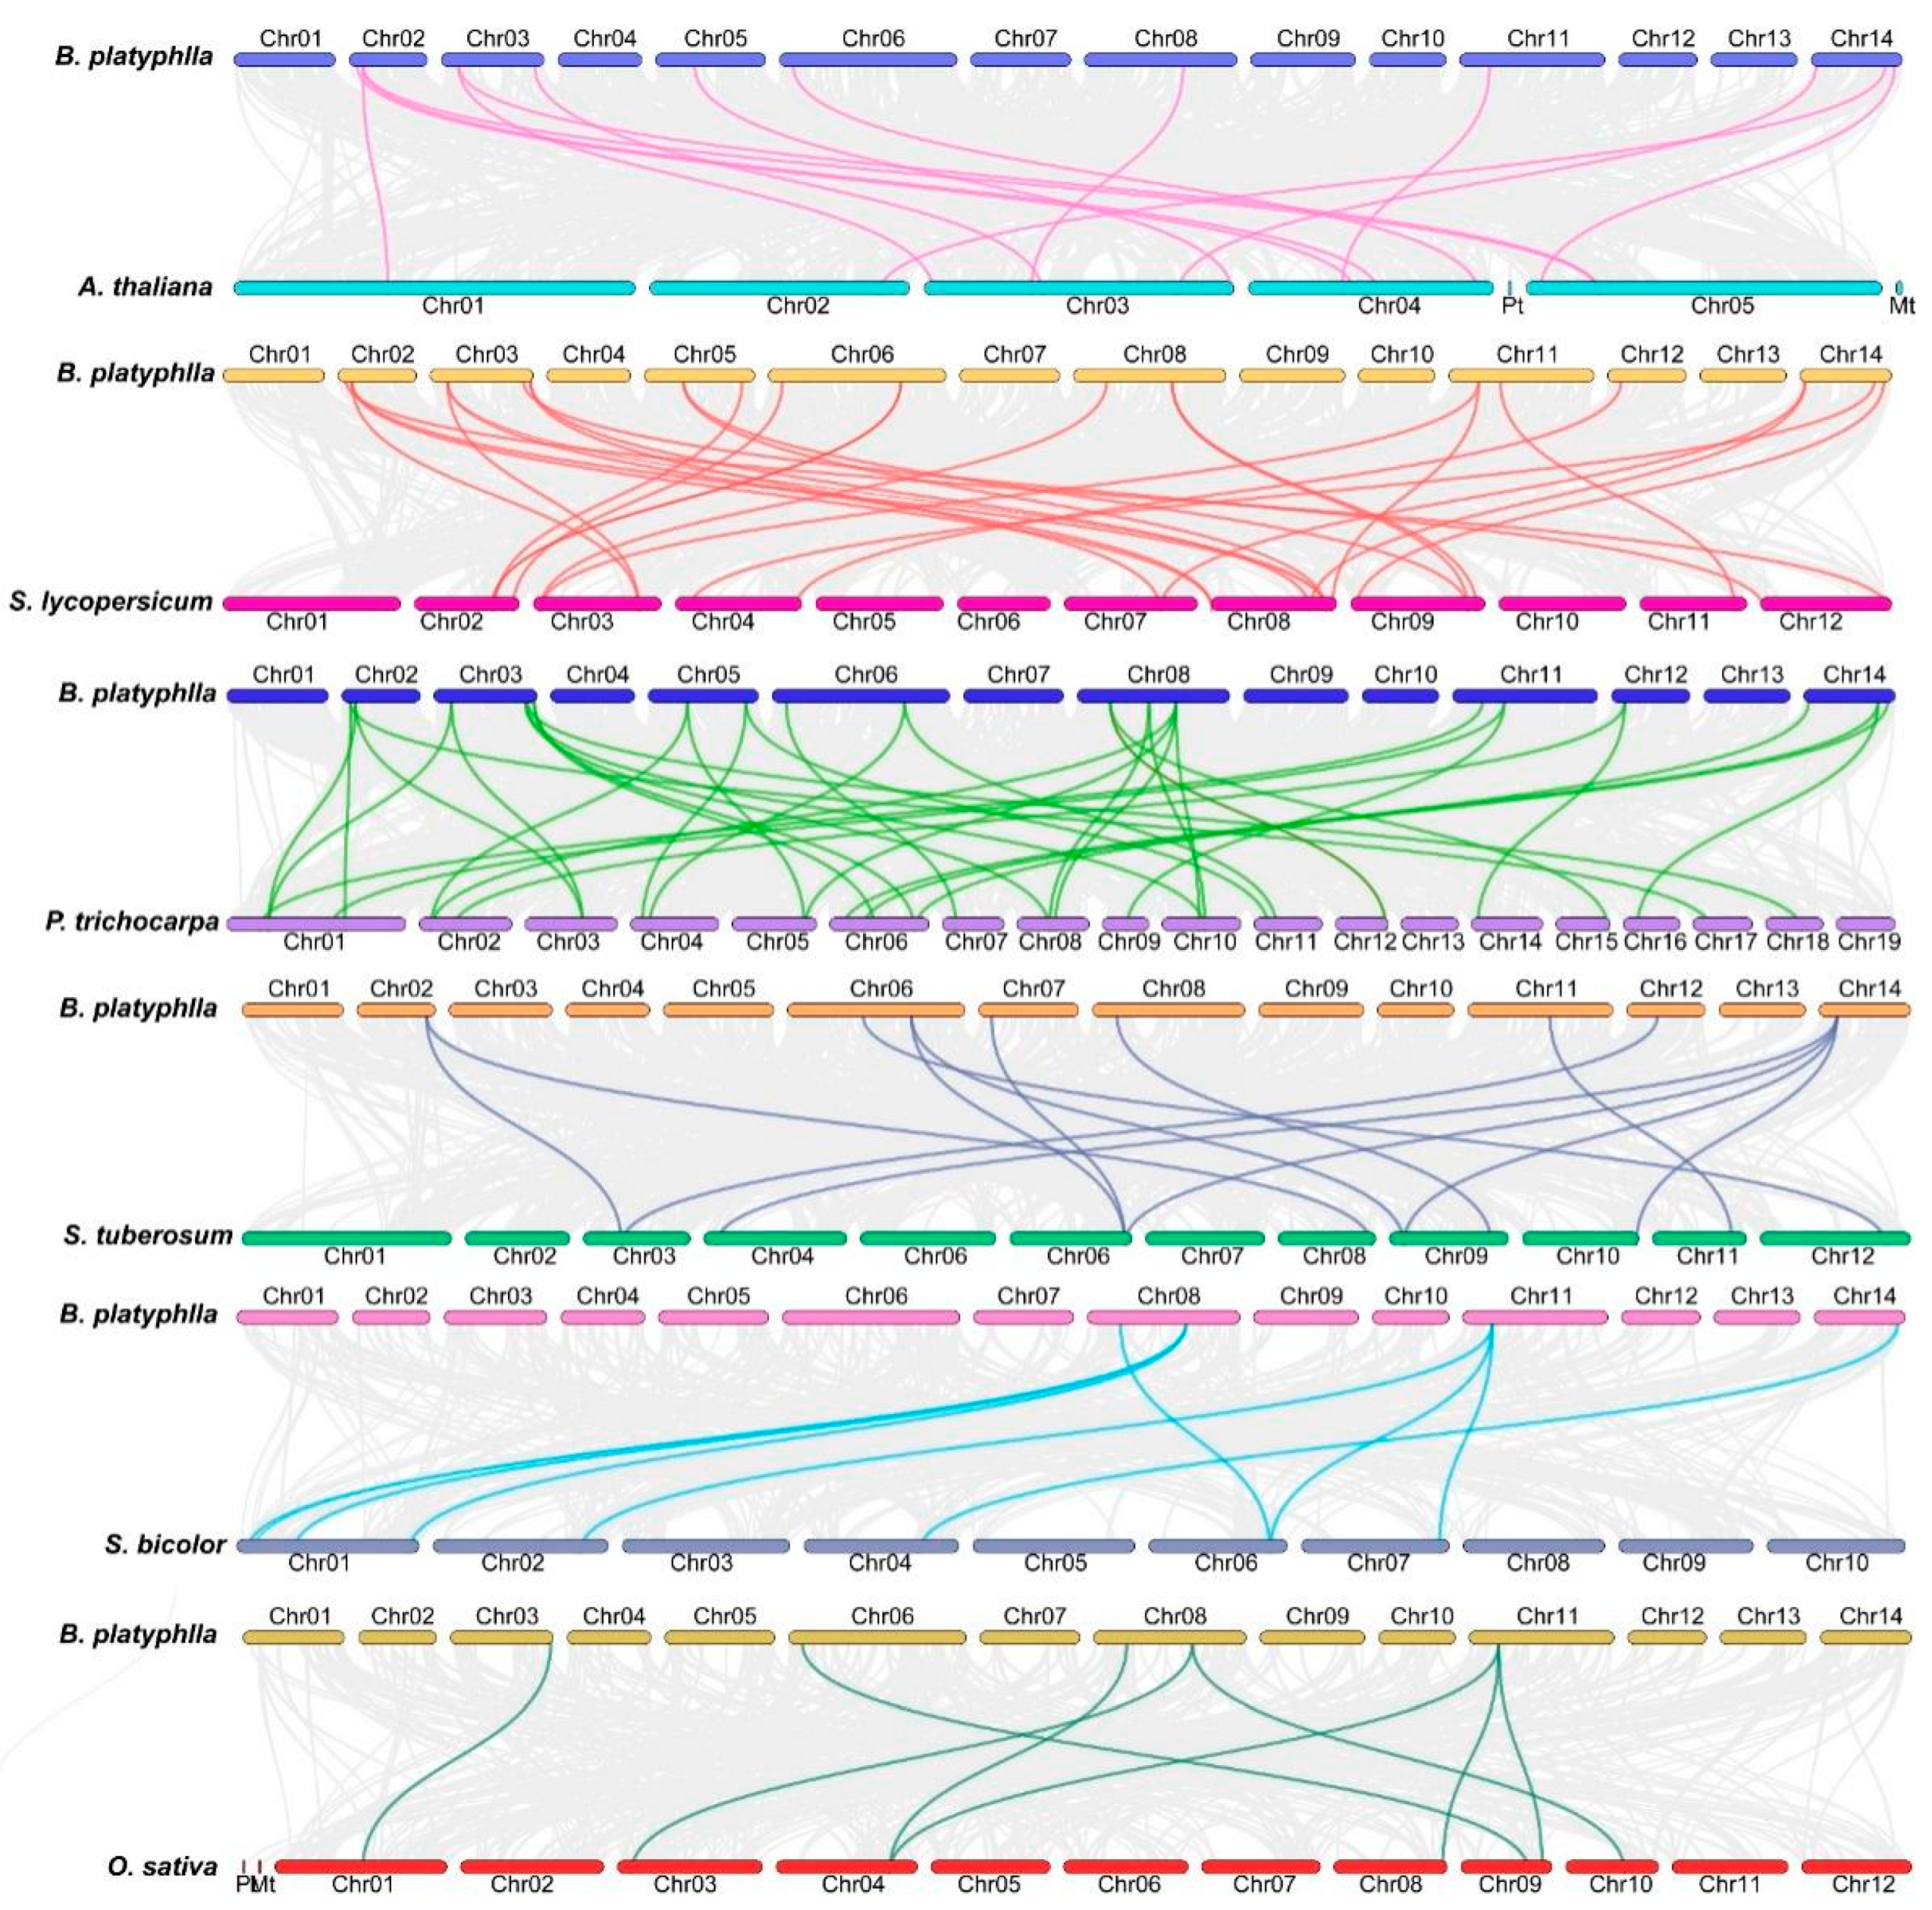
2.6. Covariance Analysis of BpHSF
2.7. Analysis of BpHSF Promoter Cis-Acting Elements
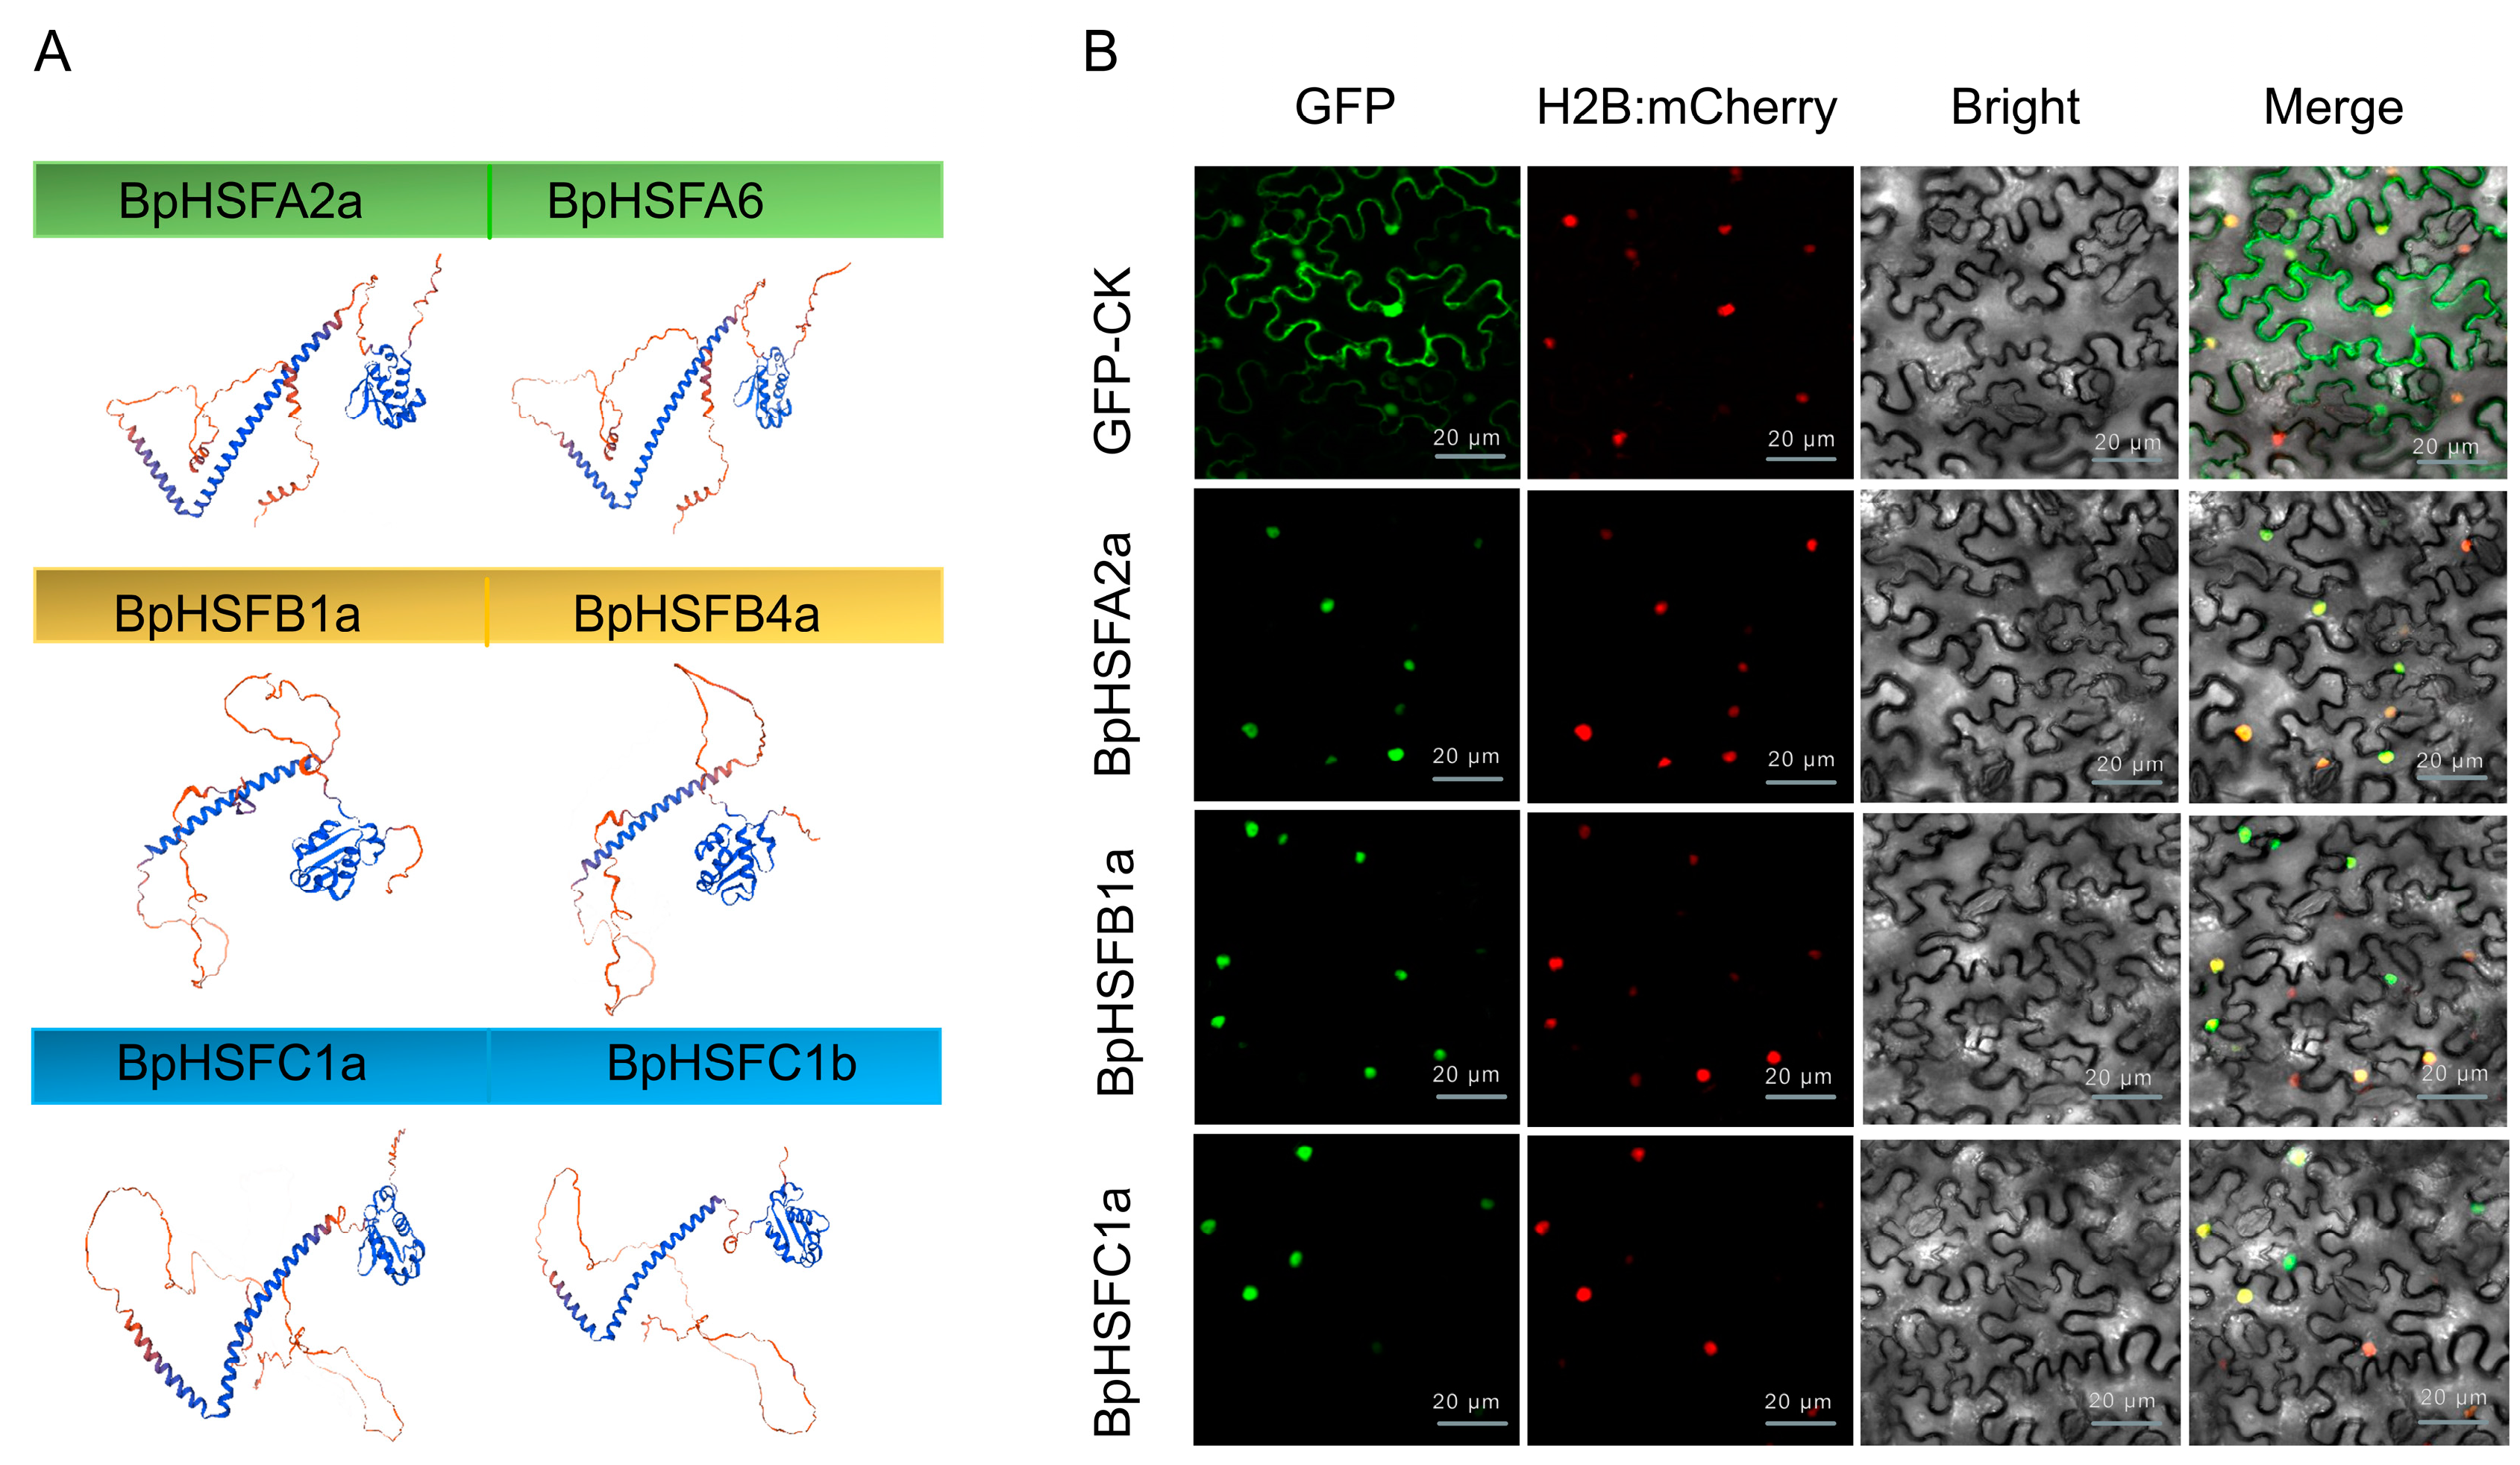
2.8. Secondary and Tertiary Structure Prediction and Subcellular Localization of the BpHSF Protein
2.9. Expression of BpHSF Gene in Different Tissues and Its Response to High-Temperature Stress
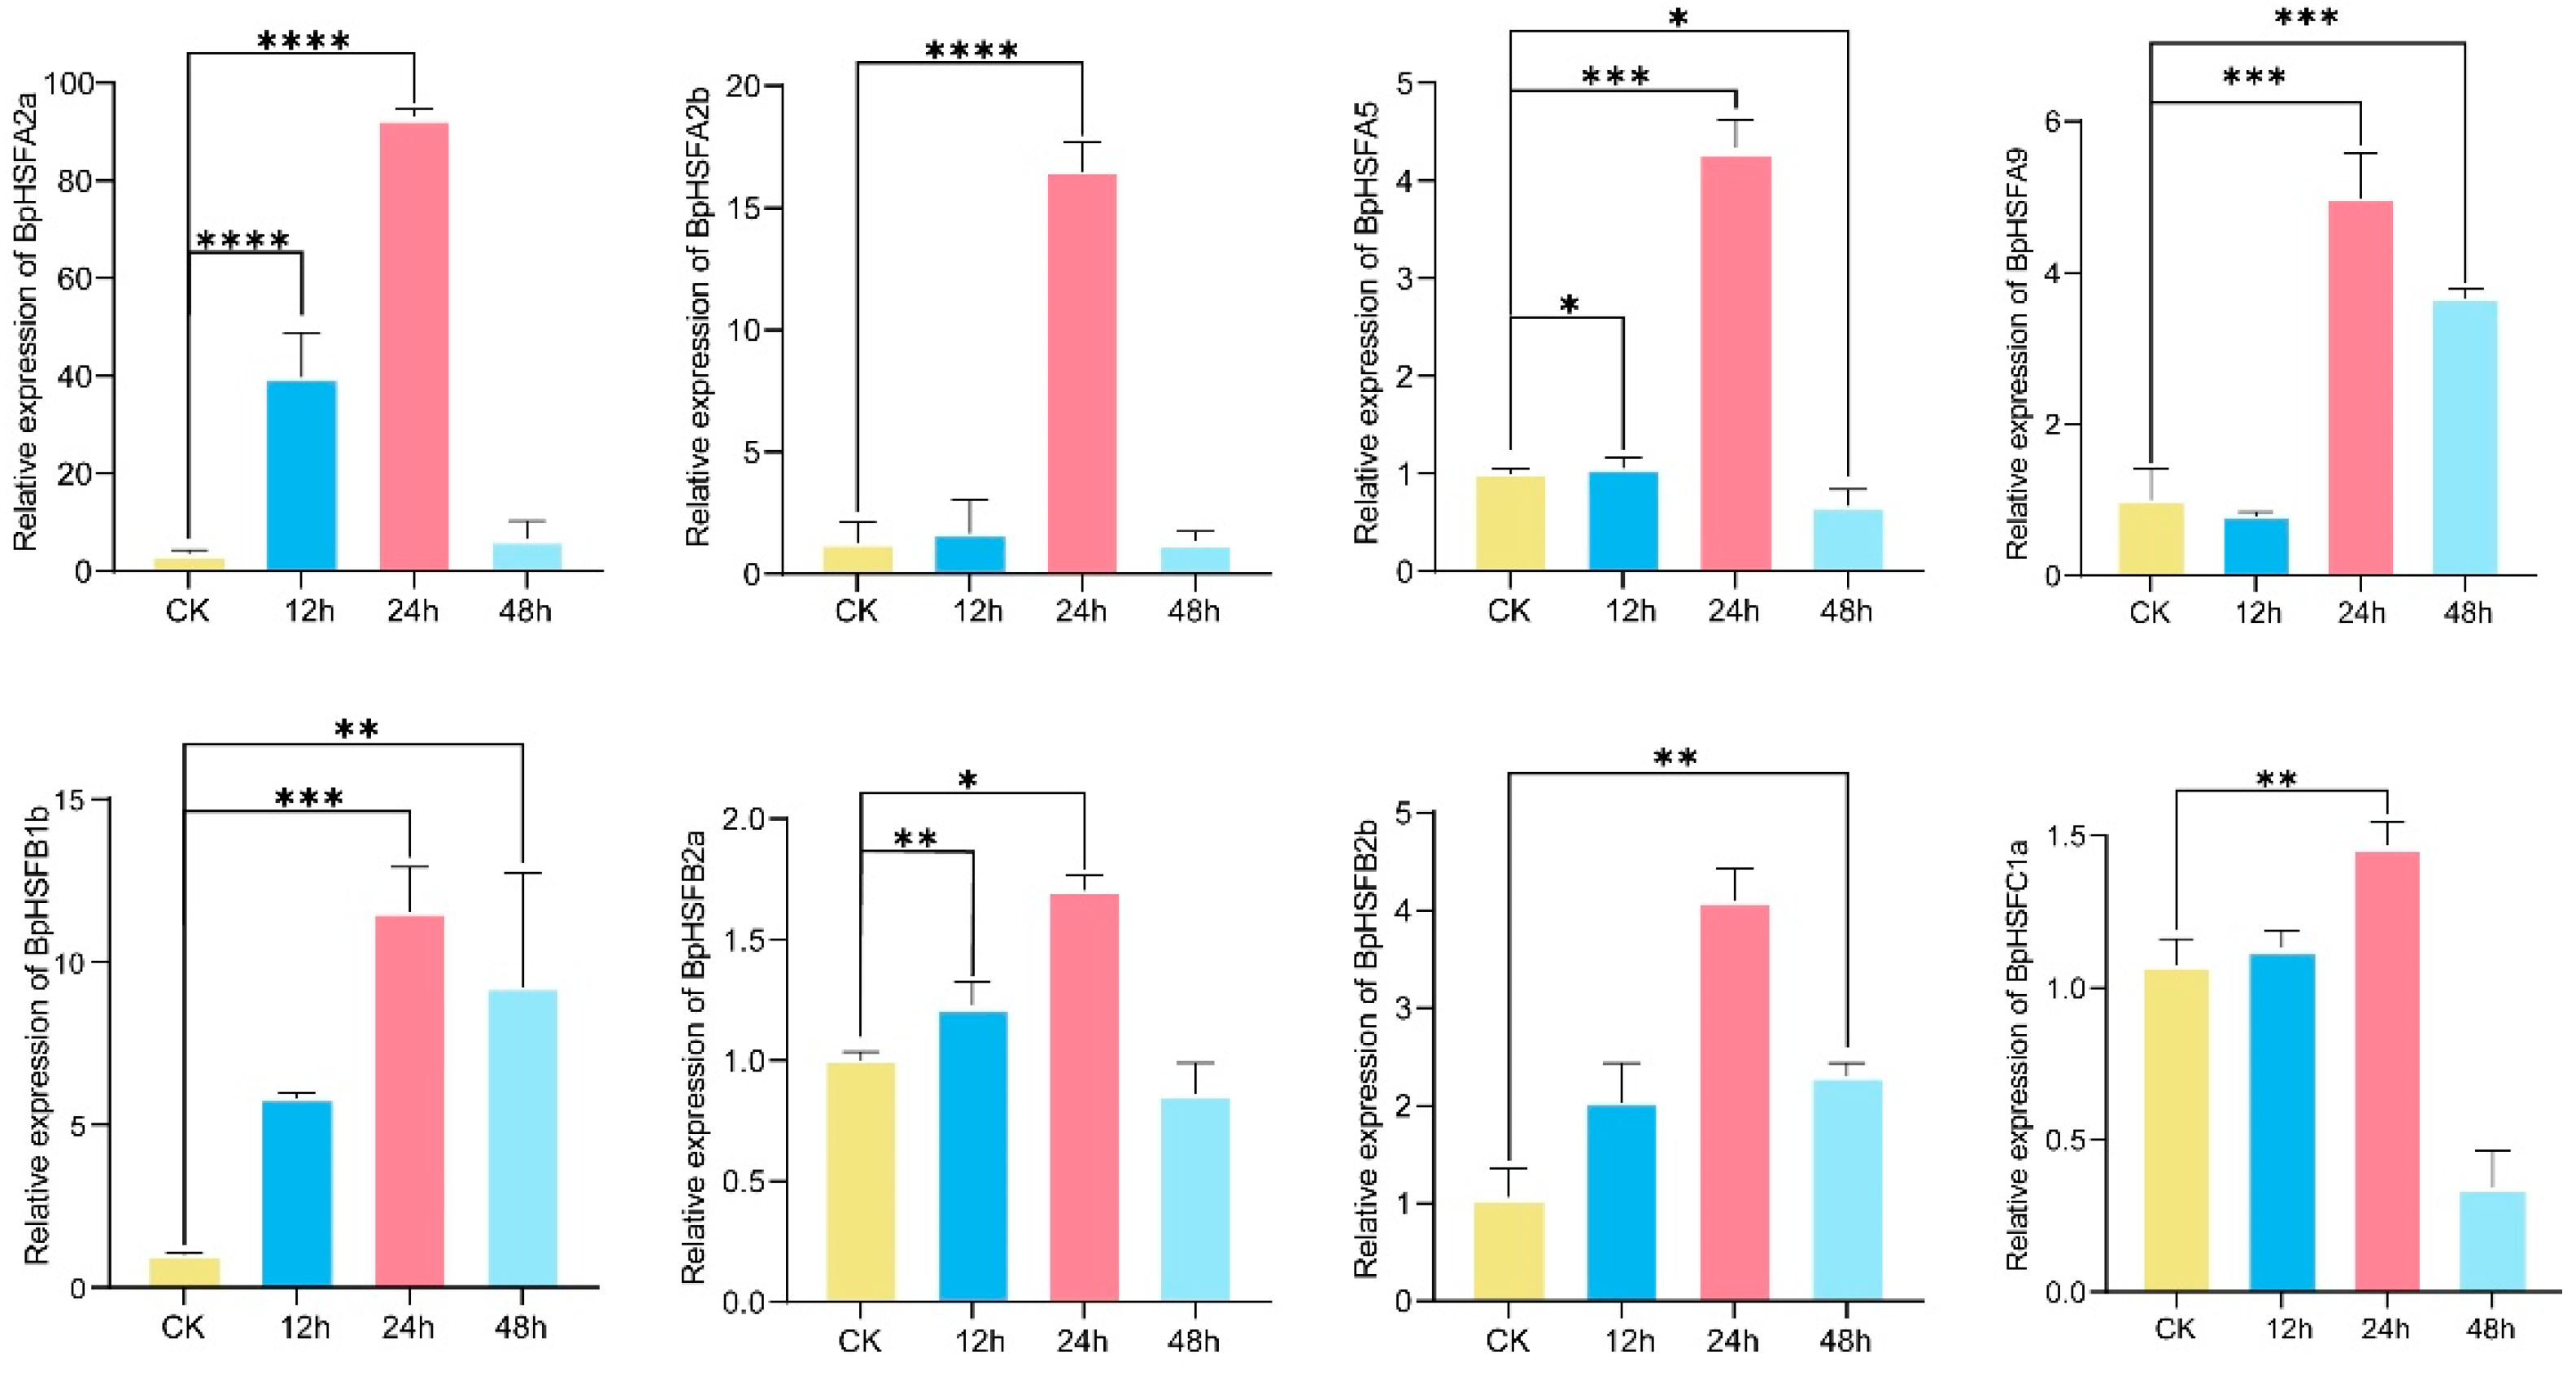
2.10. BpHSF Expression Validation Through qRT-PCR
3. Discussion
4. Materials and Methods
4.1. BpHSF Gene Family Identification and Characterization
4.2. Multiple Sequence Alignment, Chromosomal Localization, and Phylogeny
4.3. BpHSF Conserved Motif Prediction and Gene Structure Analysis
4.4. Analysis of BpHSF Covariance and Cis-Acting Elements
4.5. BpHSF Protein Structure Prediction and Subcellular Localization
4.6. Plant Materials and Treatments
4.7. Expression Profiles Based on RNA-Seq Data
4.8. RNA Extraction and Quantitative Real-Time PCR Analysis
5. Conclusions
Supplementary Materials
Author Contributions
Funding
Institutional Review Board Statement
Informed Consent Statement
Data Availability Statement
Conflicts of Interest
References
- Koyama, T. Regulatory mechanisms of transcription factors in plant morphology and function. Int. J. Mol. Sci. 2023, 24, 7039. [Google Scholar] [CrossRef] [PubMed]
- Xu, B.; Ohtani, M.; Yamaguchi, M.; Toyooka, K.; Wakazaki, M.; Sato, M.; Kubo, M.; Nakano, Y.; Sano, R.; Hiwatashi, Y.; et al. Contribution of NAC transcription factors to plant adaptation to land. Science 2014, 343, 1505–1508. [Google Scholar] [CrossRef] [PubMed]
- Yang, M.; He, G.; Hou, Q.; Fan, Y.; Duan, L.; Li, K.; Wei, X.; Qiu, Z.; Chen, E.; He, T. Systematic analysis and expression profiles of TCP gene family in Tartary buckwheat (Fagopyrum tataricum (L.) Gaertn.) revealed the potential function of FtTCP15 and FtTCP18 in response to abiotic stress. BMC Genom. 2022, 23, 415. [Google Scholar] [CrossRef]
- He, X.; Zhang, M.M.; Huang, Y.; Yu, J.; Zhao, X.; Zheng, Q.; Liu, Z.J.; Lan, S. Genome-Based Identification of the Dof Gene Family in Three Cymbidium Species and Their Responses to Heat Stress in Cymbidium goeringii. Int. J. Mol. Sci. 2024, 25, 7662. [Google Scholar] [CrossRef]
- Schwechheimer, C.; Schröder, P.M.; Blaby-Haas, C.E. Plant GATA Factors: Their Biology, Phylogeny, and Phylogenomics. Annu Rev Plant Biol. 2022, 73, 123–148. [Google Scholar] [CrossRef]
- Liang, J.; Fang, Y.; An, C.; Yao, Y.; Wang, X.; Zhang, W.; Liu, R.; Wang, L.; Aslam, M.; Cheng, Y. Genome-wide identification and expression analysis of the bHLH gene family in passion fruit (Passiflora edulis) and its response to abiotic stress. Int. J. Biol. Macromol. 2023, 225, 389–403. [Google Scholar] [CrossRef] [PubMed]
- Sharma, L.; Priya, M.; Kaushal, N.; Bhandhari, K.; Chaudhary, S.; Dhankher, O.P.; Prasad, P.V.V.; Siddique, K.H.M.; Nayyar, H. Plant growth-regulating molecules as thermoprotectants: Functional relevance and prospects for improving heat tolerance in food crops. J. Exp. Bot. 2020, 71, 569–594. [Google Scholar] [CrossRef]
- Xu, Y.; Yuan, Y.H.; Du, N.S.; Wang, Y.; Shu, S.; Sun, J.; Guo, S.R. Proteomic analysis of heat stress resistance of cucumber leaves when grafted onto Momordica rootstock. Hortic. Res-Engl. 2018, 5, 23. [Google Scholar] [CrossRef]
- Sato, H.; Mizoi, J.; Shinozaki, K.; Yamaguchi-Shinozaki, K. Complex plant responses to drought and heat stress under climate change. Plant J. 2024, 117, 1873–1892. [Google Scholar] [CrossRef]
- Wu, T.Y.; Hoh, K.L.; Boonyaves, K.; Krishnamoorthi, S.; Urano, D. Diversification of heat shock transcription factors expanded thermal stress responses during early plant evolution. Plant Cell 2022, 34, 3557–3576. [Google Scholar] [CrossRef] [PubMed]
- Scharf, K.D.; Berberich, T.; Ebersberger, I.; Nover, L. The plant heat stress transcription factor (Hsf) family: Structure, function and evolution. Biochim. Biophys. Acta 2012, 1819, 104–119. [Google Scholar] [CrossRef]
- Andrási, N.; Pettkó-Szandtner, A.; Szabados, L. Diversity of plant heat shock factors: Regulation, interactions, and functions. J. Exp. Bot. 2021, 72, 1558–1575. [Google Scholar] [CrossRef]
- Peteranderl, R.; Rabenstein, M.; Shin, Y.K.; Liu, C.W.; Wemmer, D.E.; King, D.S.; Nelson, H.C. Biochemical and biophysical characterization of the trimerization domain from the heat shock transcription factor. Biochemistry 1999, 38, 3559–3569. [Google Scholar] [CrossRef]
- Nover, L.; Bharti, K.; Döring, P.; Mishra, S.K.; Ganguli, A.; Scharf, K.D. Arabidopsis and the heat stress transcription factor world: How many heat stress transcription factors do we need? Cell Stress. Chaperones 2001, 6, 177–189. [Google Scholar] [CrossRef] [PubMed]
- Kotak, S.; Port, M.; Ganguli, A.; Bicker, F.; von Koskull-Döring, P. Characterization of C-terminal domains of Arabidopsis heat stress transcription factors (Hsfs) and identification of a new signature combination of plant class A Hsfs with AHA and NES motifs essential for activator function and intracellular localization. Plant J. 2004, 39, 98–112. [Google Scholar] [CrossRef] [PubMed]
- Heerklotz, D.; Döring, P.; Bonzelius, F.; Winkelhaus, S.; Nover, L. The balance of nuclear import and export determines the intracellular distribution and function of tomato heat stress transcription factor HsfA2. Mol. Cell Biol. 2001, 21, 1759–1768. [Google Scholar] [CrossRef]
- von Koskull-Döring, P.; Scharf, K.D.; Nover, L. The diversity of plant heat stress transcription factors. Trends Plant Sci. 2007, 12, 452–457. [Google Scholar] [CrossRef]
- Scharf, K.D.; Rose, S.; Zott, W.; Schöffl, F.; Nover, L. Three tomato genes code for heat stress transcription factors with a region of remarkable homology to the DNA-binding domain of the yeast HSF. Embo J. 1990, 9, 4495–5501. [Google Scholar] [CrossRef] [PubMed]
- Wiederrecht, G.; Seto, D.; Parker, C.S. Isolation of the gene encoding the S. cerevisiae heat shock transcription factor. Cell 1988, 54, 841–853. [Google Scholar] [CrossRef]
- Guo, J.; Wu, J.; Ji, Q.; Wang, C.; Luo, L.; Yuan, Y.; Wang, Y.; Wang, J. Genome-wide analysis of heat shock transcription factor families in rice and Arabidopsis thaliana. J. Genet. Genom. 2008, 35, 105–118. [Google Scholar] [CrossRef] [PubMed]
- Wang, C.; Zhang, Q.; Shou, H.X. Identification and expression analysis of OsHsfs in rice. J. Zhejiang Univ. Sci. B 2009, 10, 291–300. [Google Scholar] [CrossRef] [PubMed]
- Wang, F.; Dong, Q.; Jiang, H.; Zhu, S.; Chen, B.; Xiang, Y. Genome-wide analysis of the heat shock transcription factors in Populus trichocarpa and Medicago truncatula. Mol. Biol. Rep. 2012, 39, 1877–1886. [Google Scholar] [CrossRef]
- Zheng, R.; Chen, J.; Peng, Y.; Zhu, X.; Niu, M.; Chen, X.; Xie, K.; Huang, R.; Zhan, S.; Su, Q.; et al. General analysis of heat shock factors in the cymbidium ensifolium genome provided insights into their evolution and special roles with response to temperature. Int. J. Mol. Sci. 2024, 25, 1002. [Google Scholar] [CrossRef] [PubMed]
- Ogawa, D.; Yamaguchi, K.; Nishiuchi, T. High-level overexpression of the Arabidopsis thaliana HsfA2 gene confers not only increased themotolerance but also salt/osmotic stress tolerance and enhanced callus growth. J. Exp. Bot. 2007, 58, 3373–3383. [Google Scholar] [CrossRef]
- Chan-Schaminet, K.Y.; Baniwal, S.K.; Bublak, D.; Nover, L.; Scharf, K.D. Specific Interaction between tomato HsfA1 and HsfA2 creates hetero-oligomeric superactivator complexes for synergistic activation of heat stress gene expression. J. Biol. Chem. 2009, 284, 20848–20857. [Google Scholar] [CrossRef] [PubMed]
- Huang, Y.C.; Niu, C.Y.; Yang, C.R.; Jinn, T.L. The heat stress factor HSFA6b connects ABA signaling and ABA-Mediated heat responses. Plant Physiol. 2016, 172, 1182–1199. [Google Scholar] [CrossRef] [PubMed]
- Nishizawa, A.; Yabuta, Y.; Yoshida, E.; Maruta, T.; Yoshimura, K.; Shigeoka, S. Arabidopsis thaliana heat shock transcription factor A2 as a key regulator in response to several types of environmental stress. Plant J. 2006, 48, 535–547. [Google Scholar] [CrossRef]
- Guo, M.; Lu, J.P.; Zhai, Y.F.; Chai, W.G.; Gong, Z.H.; Lu, M.H. Genome-wide analysis, expression profile of heat shock factor gene family (CaHsfs) and characterisation of CaHsfA2 in pepper (Capsicum annuum L.). BMC Plant Biol. 2015, 15, 151. [Google Scholar] [CrossRef] [PubMed]
- Li, P.S.; Yu, T.F.; He, G.H.; Chen, M.; Zhou, Y.B.; Chai, S.C.; Xu, Z.S.; Ma, Y.Z. Genome-wide analysis of the Hsf family in soybean and functional identification of GmHsf-34 involvement in drought and heat stresses. BMC Genom. 2014, 15, 1009. [Google Scholar] [CrossRef] [PubMed]
- Zhang, X.; Xu, W.; Ni, D.; Wang, M.; Guo, G. Genome-wide characterization of tea plant (Camellia sinensis) Hsf transcription factor family and role of CsHsfA2 in heat tolerance. BMC Plant Biol. 2020, 20, 244. [Google Scholar] [CrossRef] [PubMed]
- Yang, Y.; Yin, J.; Zhu, L.; Xu, L.; Wu, W.; Lu, Y.; Chen, J.; Shi, J.; Hao, Z. Genome-wide analysis of the liriodendron chinense Hsf gene family under abiotic stress and characterization of the LcHsfA2a gene. Int. J. Mol. Sci. 2024, 25, 2733. [Google Scholar] [CrossRef]
- Rastogi, S.; Pandey, M.M.; Rawat, A.K.S. Medicinal plants of the Betula-Traditional uses and a phytochemical-pharmacological review. J. Ethnopharmacol. 2015, 159, 62–83. [Google Scholar] [CrossRef]
- Liu, D.; An, Y.; Li, Z.; Wang, Z.H.; Zhao, Y.H.; Wang, X.C. Differences and similarities in radial growth of Betula species to climate change. J. For. Res. 2024, 35, 40. [Google Scholar] [CrossRef]
- Chen, S.; Wang, Y.C.; Yu, L.L.; Zheng, T.; Wang, S.; Yue, Z.; Jiang, J.; Kumari, S.; Zheng, C.F.; Tang, B.; et al. Genome sequence and evolution of B. Platyphylla. Hortic. Res. 2021, 8, 37. [Google Scholar] [CrossRef] [PubMed]
- Wang, J.; Hu, H.; Wang, W.; Wei, Q.; Hu, T.; Bao, C. Genome-wide identification and functional characterization of the heat shock factor family in eggplant (Solanum melongena L.) under abiotic stress conditions. Plants 2020, 9, 915. [Google Scholar] [CrossRef] [PubMed]
- Liu, X.J.; Meng, P.P.; Yang, G.Y.; Zhang, M.Y.; Peng, S.B.; Zhai, M.Z. Genome-wide identification and transcript profiles of walnut heat stress transcription factor involved in abiotic stress. BMC Genom. 2020, 21, 474. [Google Scholar] [CrossRef] [PubMed]
- Zhu, X.Y.; Huang, C.Q.; Zhang, L.; Liu, H.F.; Yu, J.H.; Hu, Z.Y.; Hua, W. Systematic analysis of family genes in the genome reveals novel responses to heat, drought and high CO2 stresses. Front. Plant Sci. 2017, 8, 1174. [Google Scholar] [CrossRef] [PubMed]
- Zhou, M.; Zheng, S.G.; Liu, R.; Lu, J.; Lu, L.; Zhang, C.H.; Liu, Z.H.; Luo, C.P.; Zhang, L.; Yant, L.; et al. Genome-wide identification, phylogenetic and expression analysis of the heat shock transcription factor family in bread wheat (Triticum aestivum L.). BMC Genom. 2019, 20, 505. [Google Scholar] [CrossRef] [PubMed]
- Duan, S.N.; Liu, B.H.; Zhang, Y.Y.; Li, G.L.; Guo, X.L. Genome-wide identification and abiotic stress-responsive pattern of heat shock transcription factor family in Triticum aestivum L. BMC Genom. 2019, 20, 257. [Google Scholar] [CrossRef] [PubMed]
- Shamshad, A.; Rashid, M.; Zaman, Q.U. In-silico analysis of heat shock transcription factor (OsHSF) gene family in rice (Oryza sativa L.). BMC Plant Biol. 2023, 23, 395. [Google Scholar] [CrossRef]
- Liao, W.H.; Tang, X.H.; Li, J.S.; Zheng, Q.M.; Wang, T.; Cheng, S.Z.; Chen, S.P.; Cao, S.J.; Cao, G.Q. Genome wide investigation of Hsf gene family in Phoebe bournei: Identification, evolution, and expression after abiotic stresses. J. For. Res. 2024, 35, 11. [Google Scholar] [CrossRef]
- Li, W.; Wan, X.L.; Yu, J.Y.; Wang, K.L.; Zhang, J. Genome-wide identification, classification, and expression analysis of the Hsf gene family in carnation (Dianthus caryophyllus). Int. J. Mol. Sci. 2019, 20, 5233. [Google Scholar] [CrossRef] [PubMed]
- Giorno, F.; Guerriero, G.; Baric, S.; Mariani, C. Heat shock transcriptional factors in Malus domestica: Identification, classification and expression analysis. BMC Genom. 2012, 13, 639. [Google Scholar] [CrossRef] [PubMed]
- Tang, M.J.; Xu, L.; Wang, Y.; Cheng, W.W.; Luo, X.B.; Xie, Y.; Fan, L.X.; Liu, L.W. Genome-wide characterization and evolutionary analysis of heat shock transcription factors (HSFs) to reveal their potential role under abiotic stresses in radish (Raphanus sativus L.). BMC Genom. 2019, 20, 772. [Google Scholar] [CrossRef] [PubMed]
- Bautista-Bautista, Y.; Arroyo-Alvarez, E.; Fuentes, G.; Girón-Ramírez, A.; Chan-León, A.; Estrella-Maldonado, H.; Xoconostle, B.; Santamaría, J.M. Genome-wide analysis of HSF genes and their role in the response to drought stress in wild and commercial Carica papaya L. genotypes. Sci. Hortic-Amst. 2024, 328, 112889. [Google Scholar] [CrossRef]
- Zhao, K.; Dang, H.; Zhou, L.D.; Hu, J.; Jin, X.; Han, Y.Z.; Wang, S.J. Genome-wide identification and expression analysis of the HSF gene family in Poplar. Forests 2023, 14, 510. [Google Scholar] [CrossRef]
- Xu, Y.A.; Jin, Y.; He, D.; Di, H.C.; Liang, Y.; Xu, Y.X. A Genome-Wide analysis and expression profile of heat shock transcription factor (Hsf) gene family in Rhododendron simsii. Plants 2023, 12, 3917. [Google Scholar] [CrossRef] [PubMed]
- Wang, Q.; Zhang, Z.B.; Guo, C.; Zhao, X.B.; Li, Z.Y.; Mou, Y.F.; Sun, Q.X.; Wang, J.; Yuan, C.L.; Li, C.J.; et al. Hsf transcription factor gene family in peanut (Arachis hypogaea L.): Genome-wide characterization and expression analysis under drought and salt stresses. Front. Plant Sci. 2023, 14, 1214732. [Google Scholar] [CrossRef] [PubMed]
- Qu, R.J.; Wang, S.W.; Wang, X.X.; Peng, J.M.; Guo, J.; Cui, G.H.; Chen, M.L.; Mu, J.; Lai, C.J.S.; Huang, L.Q.; et al. Genome-Wide characterization and expression of the Hsf gene family in Salvia miltiorrhiza (Danshen) and the potential thermotolerance of SmHsf1 and SmHsf7 in Yeast. Int. J. Mol. Sci. 2023, 24, 8461. [Google Scholar] [CrossRef] [PubMed]
- Guo, X.L.; Yuan, S.N.; Zhang, H.N.; Zhang, Y.Y.; Zhang, Y.J.; Wang, G.Y.; Li, Y.Q.; Li, G.L. Heat-response patterns of the heat shock transcription factor family in advanced development stages of wheat (Triticum aestivum L.) and thermotolerance-regulation by TaHsfA2-10. BMC Plant Biol. 2020, 20, 364. [Google Scholar] [CrossRef] [PubMed]
- Liu, M.; Huang, Q.; Sun, W.; Ma, Z.; Huang, L.; Wu, Q.; Tang, Z.; Bu, T.; Li, C.; Chen, H. Genome-wide investigation of the heat shock transcription factor (Hsf) gene family in Tartary buckwheat (Fagopyrum tataricum). BMC Genom. 2019, 20, 871. [Google Scholar] [CrossRef] [PubMed]
- Wang, L.; Liu, Y.; Chai, G.; Zhang, D.; Fang, Y.; Deng, K.; Aslam, M.; Niu, X.; Zhang, W.; Qin, Y.; et al. Identification of passion fruit HSF gene family and the functional analysis of PeHSF-C1a in response to heat and osmotic stress. Plant Physiol. Biochem. 2023, 200, 107800. [Google Scholar] [CrossRef]
- Zhao, D.X.; Qi, X.Y.; Zhang, Y.; Zhang, R.L.; Wang, C.; Sun, T.X.; Zheng, J.; Lu, Y.Z. Genome-wide analysis of the heat shock transcription factor gene family in (Hance) Hedl identifies potential candidates for resistance to abiotic stresses. Plant Physiol. Bioch. 2022, 175, 68–80. [Google Scholar] [CrossRef] [PubMed]
- Qian, G.T.; Meng, X.X.; Wang, S.F.; Mi, Y.L.; Qin, Z.F.; Liu, T.X.; Zhang, Y.M.; Wan, H.H.; Chen, W.Q.; Sun, W.; et al. Genome-wide identification of HSF gene family and their expression analysis in vegetative tissue of young seedlings of hemp under different light treatments. Ind. Crop Prod. 2023, 204, 117375. [Google Scholar] [CrossRef]
- Hu, Y.; Han, Y.T.; Zhang, K.; Zhao, F.L.; Li, Y.J.; Zheng, Y.; Wang, Y.J.; Wen, Y.Q. Identification and expression analysis of heat shock transcription factors in the wild Chinese grapevine (Vitis pseudoreticulata). Plant Physiol. Bioch. 2016, 99, 1–10. [Google Scholar] [CrossRef] [PubMed]
- Mishra, S.K.; Poonia, A.K.; Chaudhary, R.; Baranwal, V.K.; Arora, D.; Kumar, R.; Chauhan, H. Genome-wide identification, phylogeny and expression analysis of HSF gene family in barley during abiotic stress response and reproductive development. Plant Gene 2020, 23, 100231. [Google Scholar] [CrossRef]
- Zhang, L.; Li, T.; Wang, L.; Cao, K.; Gao, W.; Yan, S.; Cao, J.; Lu, J.; Ma, C.; Chang, C.; et al. A wheat heat shock transcription factor gene, TaHsf-7A, regulates seed dormancy and germination. Plant Physiol. Biochem. 2024, 210, 108541. [Google Scholar] [CrossRef]
- Sun, T.; Wang, W.; Hu, X.; Meng, L.; Xiang, L.; Wang, Y.; Wang, C.; Luo, H.; Ziyomo, C.; Chan, Z. HSFA3 functions as a positive regulator of HSFA2a to enhance thermotolerance in perennial ryegrass. Plant Physiol. Biochem. 2024, 208, 108512. [Google Scholar] [CrossRef] [PubMed]
- Lin, Y.X.; Jiang, H.Y.; Chu, Z.X.; Tang, X.L.; Zhu, S.W.; Cheng, B.J. Genome-wide identification, classification and analysis of heat shock transcription factor family in maize. BMC Genom. 2011, 12, 76. [Google Scholar] [CrossRef] [PubMed]
- Banakar, S.N.; PrasannaKumar, M.K.; Mahesh, H.B.; Parivallal, P.B.; Puneeth, M.E.; Gautam, C.; Pramesh, D.; Shiva Kumara, T.N.; Girish, T.R.; Nori, S.; et al. Red-seaweed biostimulants differentially alleviate the impact of fungicidal stress in rice (Oryza sativa L.). Sci. Rep. 2022, 12, 5993. [Google Scholar] [CrossRef]
- Zhang, J.; Jia, H.; Li, J.; Li, Y.; Lu, M.; Hu, J. Molecular evolution and expression divergence of the Populus euphratica Hsf genes provide insight into the stress acclimation of desert poplar. Sci. Rep. 2016, 6, 30050. [Google Scholar] [CrossRef] [PubMed]
- Zhang, J.; Liu, B.; Li, J.; Zhang, L.; Wang, Y.; Zheng, H.; Lu, M.; Chen, J. Hsf and Hsp gene families in Populus: Genome-wide identification, organization and correlated expression during development and in stress responses. BMC Genom. 2015, 16, 181. [Google Scholar] [CrossRef] [PubMed]
- Evrard, A.; Kumar, M.; Lecourieux, D.; Lucks, J.; von Koskull-Döring, P.; Hirt, H. Regulation of the heat stress response in Arabidopsis by MPK6-targeted phosphorylation of the heat stress factor HsfA2. PeerJ 2013, 1, e59. [Google Scholar] [CrossRef] [PubMed]
- Khanduja, J.S.; Calvo, I.A.; Joh, R.I.; Hill, I.T.; Motamedi, M. Nuclear Noncoding RNAs and Genome Stability. Mol. Cell 2016, 63, 7–20. [Google Scholar] [CrossRef] [PubMed]
- Ni, W.J.; Xie, F.; Leng, X.M. Terminus-Associated Non-coding RNAs: Trash or Treasure? Front. Genet. 2020, 11, 552444. [Google Scholar] [CrossRef]
- Fujita, Y.; Fujita, M.; Shinozaki, K.; Yamaguchi-Shinozaki, K. ABA-mediated transcriptional regulation in response to osmotic stress in plants. J. Plant Res. 2011, 124, 509–525. [Google Scholar] [CrossRef] [PubMed]
- Vishwakarma, K.; Upadhyay, N.; Kumar, N.; Yadav, G.; Singh, J.; Mishra, R.K.; Kumar, V.; Verma, R.; Upadhyay, R.G.; Pandey, M.; et al. Abscisic Acid Signaling and Abiotic Stress Tolerance in Plants: A Review on Current Knowledge and Future Prospects. Front. Plant Sci. 2017, 8, 161. [Google Scholar] [CrossRef]
- Bae, H.; Coller, J. Codon optimality-mediated mRNA degradation: Linking translational elongation to mRNA stability. Mol. Cell 2022, 82, 1467–1476. [Google Scholar] [CrossRef] [PubMed]
- Cheng, S.; Gutmann, B.; Zhong, X.; Ye, Y.; Fisher, M.F.; Bai, F.; Castleden, I.; Song, Y.; Song, B.; Huang, J.; et al. Redefining the structural motifs that determine RNA binding and RNA editing by pentatricopeptide repeat proteins in land plants. Plant J. 2016, 85, 532–547. [Google Scholar] [CrossRef]
- Bakery, A.; Vraggalas, S.; Shalha, B.; Chauhan, H.; Benhamed, M.; Fragkostefanakis, S. Heat stress transcription factors as the central molecular rheostat to optimize plant survival and recovery from heat stress. New Phytol. 2024, 244, 51–64. [Google Scholar] [CrossRef] [PubMed]
- Zhang, Q.; Geng, J.; Du, Y.; Zhao, Q.; Zhang, W.; Fang, Q.; Yin, Z.; Li, J.; Yuan, X.; Fan, Y. Heat shock transcription factor (Hsf) gene family in common bean (Phaseolus vulgaris): Genome-wide identification, phylogeny, evolutionary expansion and expression analyses at the sprout stage under abiotic stress. BMC Plant Biol. 2022, 22, 33. [Google Scholar] [CrossRef]
- Guo, M.; Liu, J.H.; Ma, X.; Luo, D.X.; Gong, Z.H.; Lu, M.H. The plant heat stress transcription factors (HSFs): Structure, regulation, and function in response to abiotic stresses. Front. Plant Sci. 2016, 7, 114. [Google Scholar] [CrossRef]
- Chen, C.J.; Wu, Y.; Li, J.W.; Wang, X.; Zeng, Z.H.; Xu, J.; Liu, Y.L.; Feng, J.T.; Chen, H.; He, Y.H.; et al. TBtools-II: A “one for all, all for one” bioinformatics platform for biological big-data mining. Mol. Plant 2023, 16, 1733–1742. [Google Scholar] [CrossRef] [PubMed]
- Hu, B.; Jin, J.; Guo, A.Y.; Zhang, H.; Luo, J.; Gao, G. GSDS 2.0: An upgraded gene feature visualization server. Bioinformatics 2015, 31, 1296–1297. [Google Scholar] [CrossRef] [PubMed]
- Chen, S.; Zhou, Y.; Chen, Y.; Gu, J. fastp: An ultra-fast all-in-one FASTQ preprocessor. Bioinformatics 2018, 34, i884–i890. [Google Scholar] [CrossRef]
- Kim, D.; Paggi, J.M.; Park, C.; Bennett, C.; Salzberg, S.L. Graph-based genome alignment and genotyping with HISAT2 and HISAT-genotype. Nat. Biotechnol. 2019, 37, 907–915. [Google Scholar] [CrossRef]
- Liao, Y.; Smyth, G.K.; Shi, W. feature counts: An efficient general purpose program for assigning sequence reads to genomic features. Bioinformatics 2014, 30, 923–930. [Google Scholar] [CrossRef]
- Peng, Y.; Fang, T.; Zhang, Y.; Zhang, M.; Zeng, L. Genome-Wide identification and expression analysis of auxin response factor (ARF) gene family in Longan (Dimocarpus longan L.). Plants 2020, 9, 221. [Google Scholar] [CrossRef] [PubMed]
- Livak, K.J.; Schmittgen, T.D. Analysis of relative gene expression data using real-time quantitative PCR and the 2−ΔΔCT Method. Methods 2001, 25, 402–408. [Google Scholar] [CrossRef]


| Number | Gene Name | MF | MW | pI | II | AI | GRAVY | SL |
|---|---|---|---|---|---|---|---|---|
| 1 | BpHSFA1a | C2707H4259N761O880S27 | 62,410.79 | 4.85 | 67.51 | 68.25 | −0.615 | Nucleus |
| 2 | BpHSFA1b | C2443H3836N696O789S23 | 56,318.90 | 5.14 | 52.68 | 69.32 | −0.643 | Nucleus |
| 3 | BpHSFA2a | C1760H2779N509O536S14 | 40,094.36 | 5.94 | 63.46 | 64.21 | −0.908 | Nucleus |
| 4 | BpHSFA2b | C1878H2982N540O608S13 | 43,270.37 | 4.86 | 58.74 | 79.59 | −0.517 | Nucleus |
| 5 | BpHSFA3 | C2831H4389N759O901S18 | 64,050.62 | 4.77 | 57.57 | 70.76 | −0.511 | Nucleus |
| 6 | BpHSFA4 | C1993H3072N552O615S16 | 45,118.61 | 5.50 | 39.18 | 67.27 | −0.476 | Nucleus |
| 7 | BpHSFA5 | C2363H3686N678O765S13 | 54,250.12 | 5.50 | 59.56 | 63.02 | −0.774 | Nucleus |
| 8 | BpHSFA6 | C1673H2617N473O507S12 | 37,853.77 | 5.39 | 56.14 | 78.14 | −0.700 | Nucleus |
| 9 | BpHSFA9 | C2463H3909N681O822S22 | 56,918.52 | 4.73 | 70.13 | 69.69 | −0.707 | Nucleus |
| 10 | BpHSFA8a | C1022H1586N284O309S7 | 23,019.97 | 6.15 | 43.09 | 69.59 | −0.763 | Nucleus |
| 11 | BpHSFA8b | C1795H2828N490O578S23 | 41,258.52 | 4.80 | 49.06 | 67.60 | −0.772 | Nucleus |
| 12 | BpHSFB1a | C1046H1643N291O315S11 | 23,687.97 | 8.78 | 49.70 | 66.80 | −0.726 | Nucleus |
| 13 | BpHSFB1b | C1055H1653N305O364S9 | 24,722.10 | 4.90 | 30.82 | 56.64 | −0.707 | Nucleus |
| 14 | BpHSFB2a | C1475H2318N416O468S10 | 33,687.74 | 5.47 | 53.72 | 67.22 | −0.687 | Nucleus |
| 15 | BpHSFB2b | C1579H2492N454O528S6 | 36,476.24 | 4.64 | 54.29 | 74.85 | −0.702 | Nucleus |
| 16 | BpHSFB3 | C1013H1615N293O316S10 | 23,275.34 | 8.61 | 58.36 | 64.75 | −0.766 | Nucleus |
| 17 | BpHSFB4a | C1583H2405N441O469S10 | 35,438.78 | 7.31 | 57.09 | 64.90 | −0.708 | Nucleus |
| 18 | BpHSFB4b | C1718H2657N475O508S13 | 38,510.65 | 8.20 | 60.45 | 74.93 | −0.462 | Nucleus |
| 19 | BpHSFC1a | C1602H2508N446O496S19 | 36,561.37 | 5.29 | 68.69 | 66.41 | −0.550 | Nucleus |
| 20 | BpHSFC1b | C1139H1770N310O349S15 | 25,871.35 | 5.76 | 54.05 | 67.00 | −0.340 | Nucleus |
| 21 | BpHSFC1c | C822H1226N216O267S9 | 18,694.60 | 4.34 | 55.65 | 53.63 | −0.351 | Nucleus |
Disclaimer/Publisher’s Note: The statements, opinions and data contained in all publications are solely those of the individual author(s) and contributor(s) and not of MDPI and/or the editor(s). MDPI and/or the editor(s) disclaim responsibility for any injury to people or property resulting from any ideas, methods, instructions or products referred to in the content. |
© 2024 by the authors. Licensee MDPI, Basel, Switzerland. This article is an open access article distributed under the terms and conditions of the Creative Commons Attribution (CC BY) license (https://creativecommons.org/licenses/by/4.0/).
Share and Cite
Guo, S.; Chen, H.; Wu, H.; Xu, Z.; Yang, H.; Lin, Q.; Feng, H.; Zeng, Z.; Wang, S.; Liu, H.; et al. Genome-Wide Characterization of the Heat Shock Transcription Factor Gene Family in Betula platyphylla Reveals Promising Candidates for Heat Tolerance. Int. J. Mol. Sci. 2025, 26, 172. https://doi.org/10.3390/ijms26010172
Guo S, Chen H, Wu H, Xu Z, Yang H, Lin Q, Feng H, Zeng Z, Wang S, Liu H, et al. Genome-Wide Characterization of the Heat Shock Transcription Factor Gene Family in Betula platyphylla Reveals Promising Candidates for Heat Tolerance. International Journal of Molecular Sciences. 2025; 26(1):172. https://doi.org/10.3390/ijms26010172
Chicago/Turabian StyleGuo, Shengzhou, Hao Chen, Hongwei Wu, Zuyuan Xu, Hao Yang, Qinmin Lin, Hanyu Feng, Zilu Zeng, Sanjiao Wang, Haolin Liu, and et al. 2025. "Genome-Wide Characterization of the Heat Shock Transcription Factor Gene Family in Betula platyphylla Reveals Promising Candidates for Heat Tolerance" International Journal of Molecular Sciences 26, no. 1: 172. https://doi.org/10.3390/ijms26010172
APA StyleGuo, S., Chen, H., Wu, H., Xu, Z., Yang, H., Lin, Q., Feng, H., Zeng, Z., Wang, S., Liu, H., Liu, X., Cao, S., & Wang, K. (2025). Genome-Wide Characterization of the Heat Shock Transcription Factor Gene Family in Betula platyphylla Reveals Promising Candidates for Heat Tolerance. International Journal of Molecular Sciences, 26(1), 172. https://doi.org/10.3390/ijms26010172