
Birinapant Reshapes the Tumor Immunopeptidome and Enhances Antigen Presentation
 , and
, and
Abstract
1. Introduction
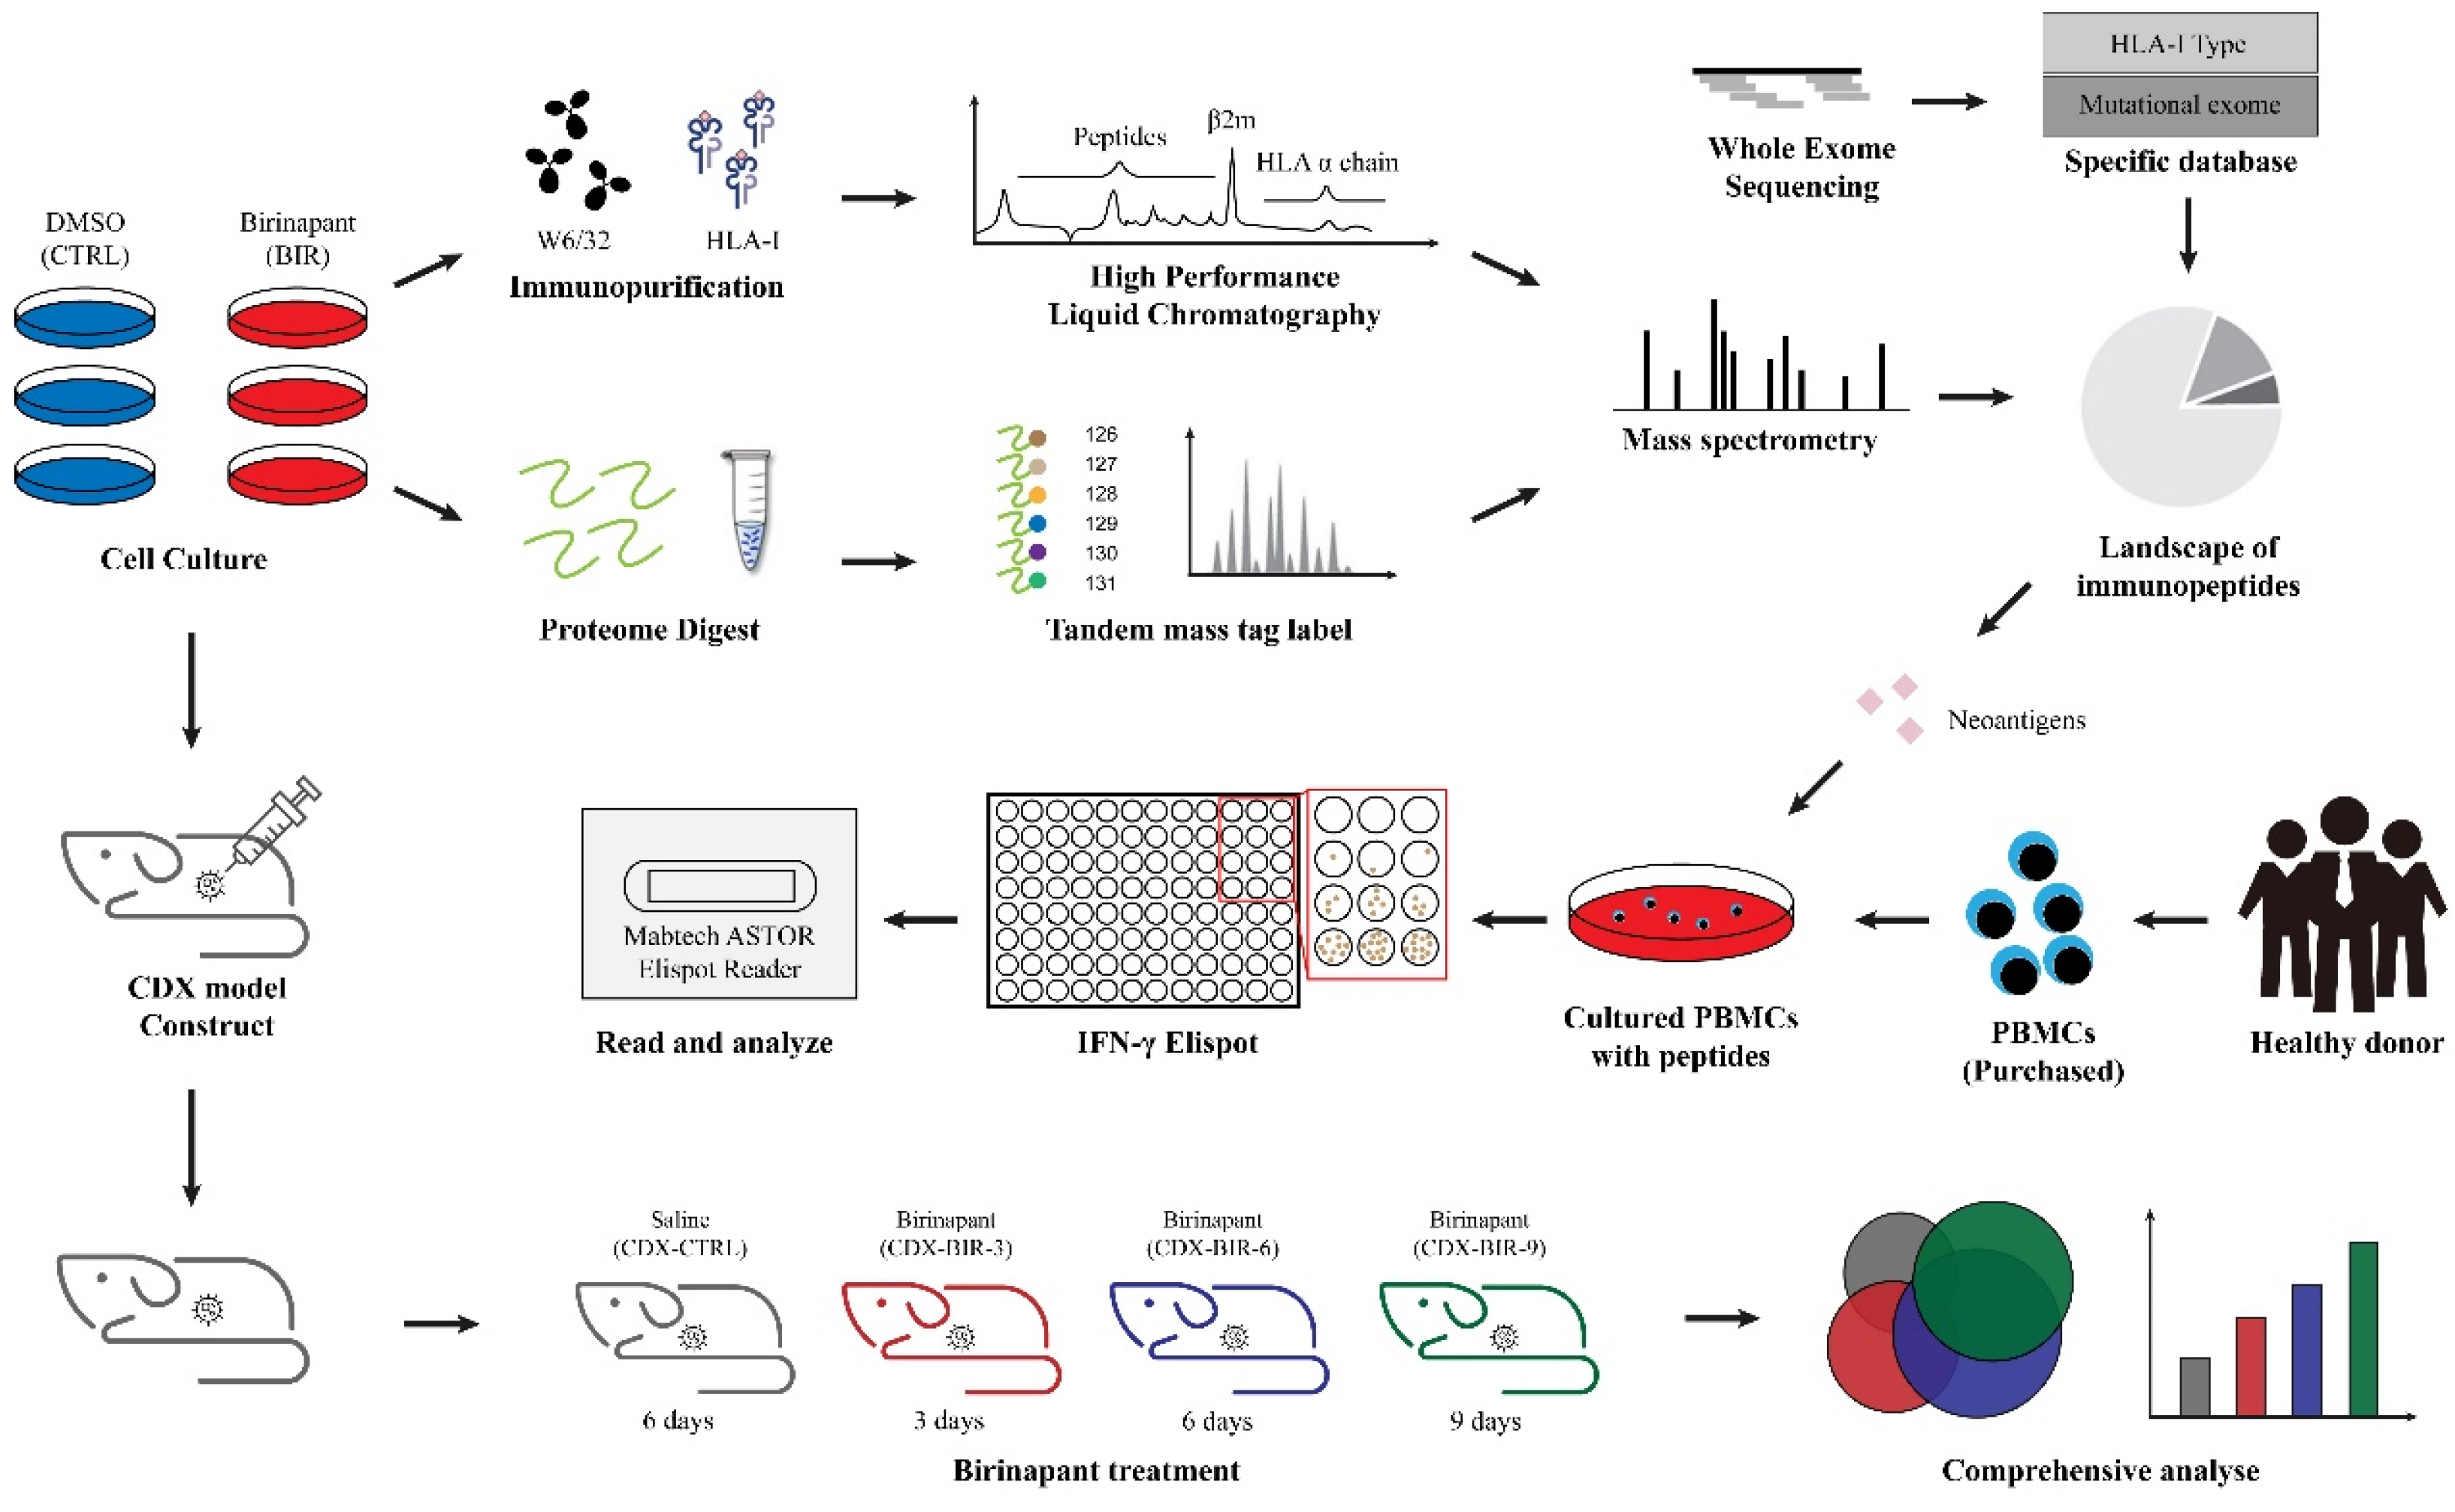
2. Results
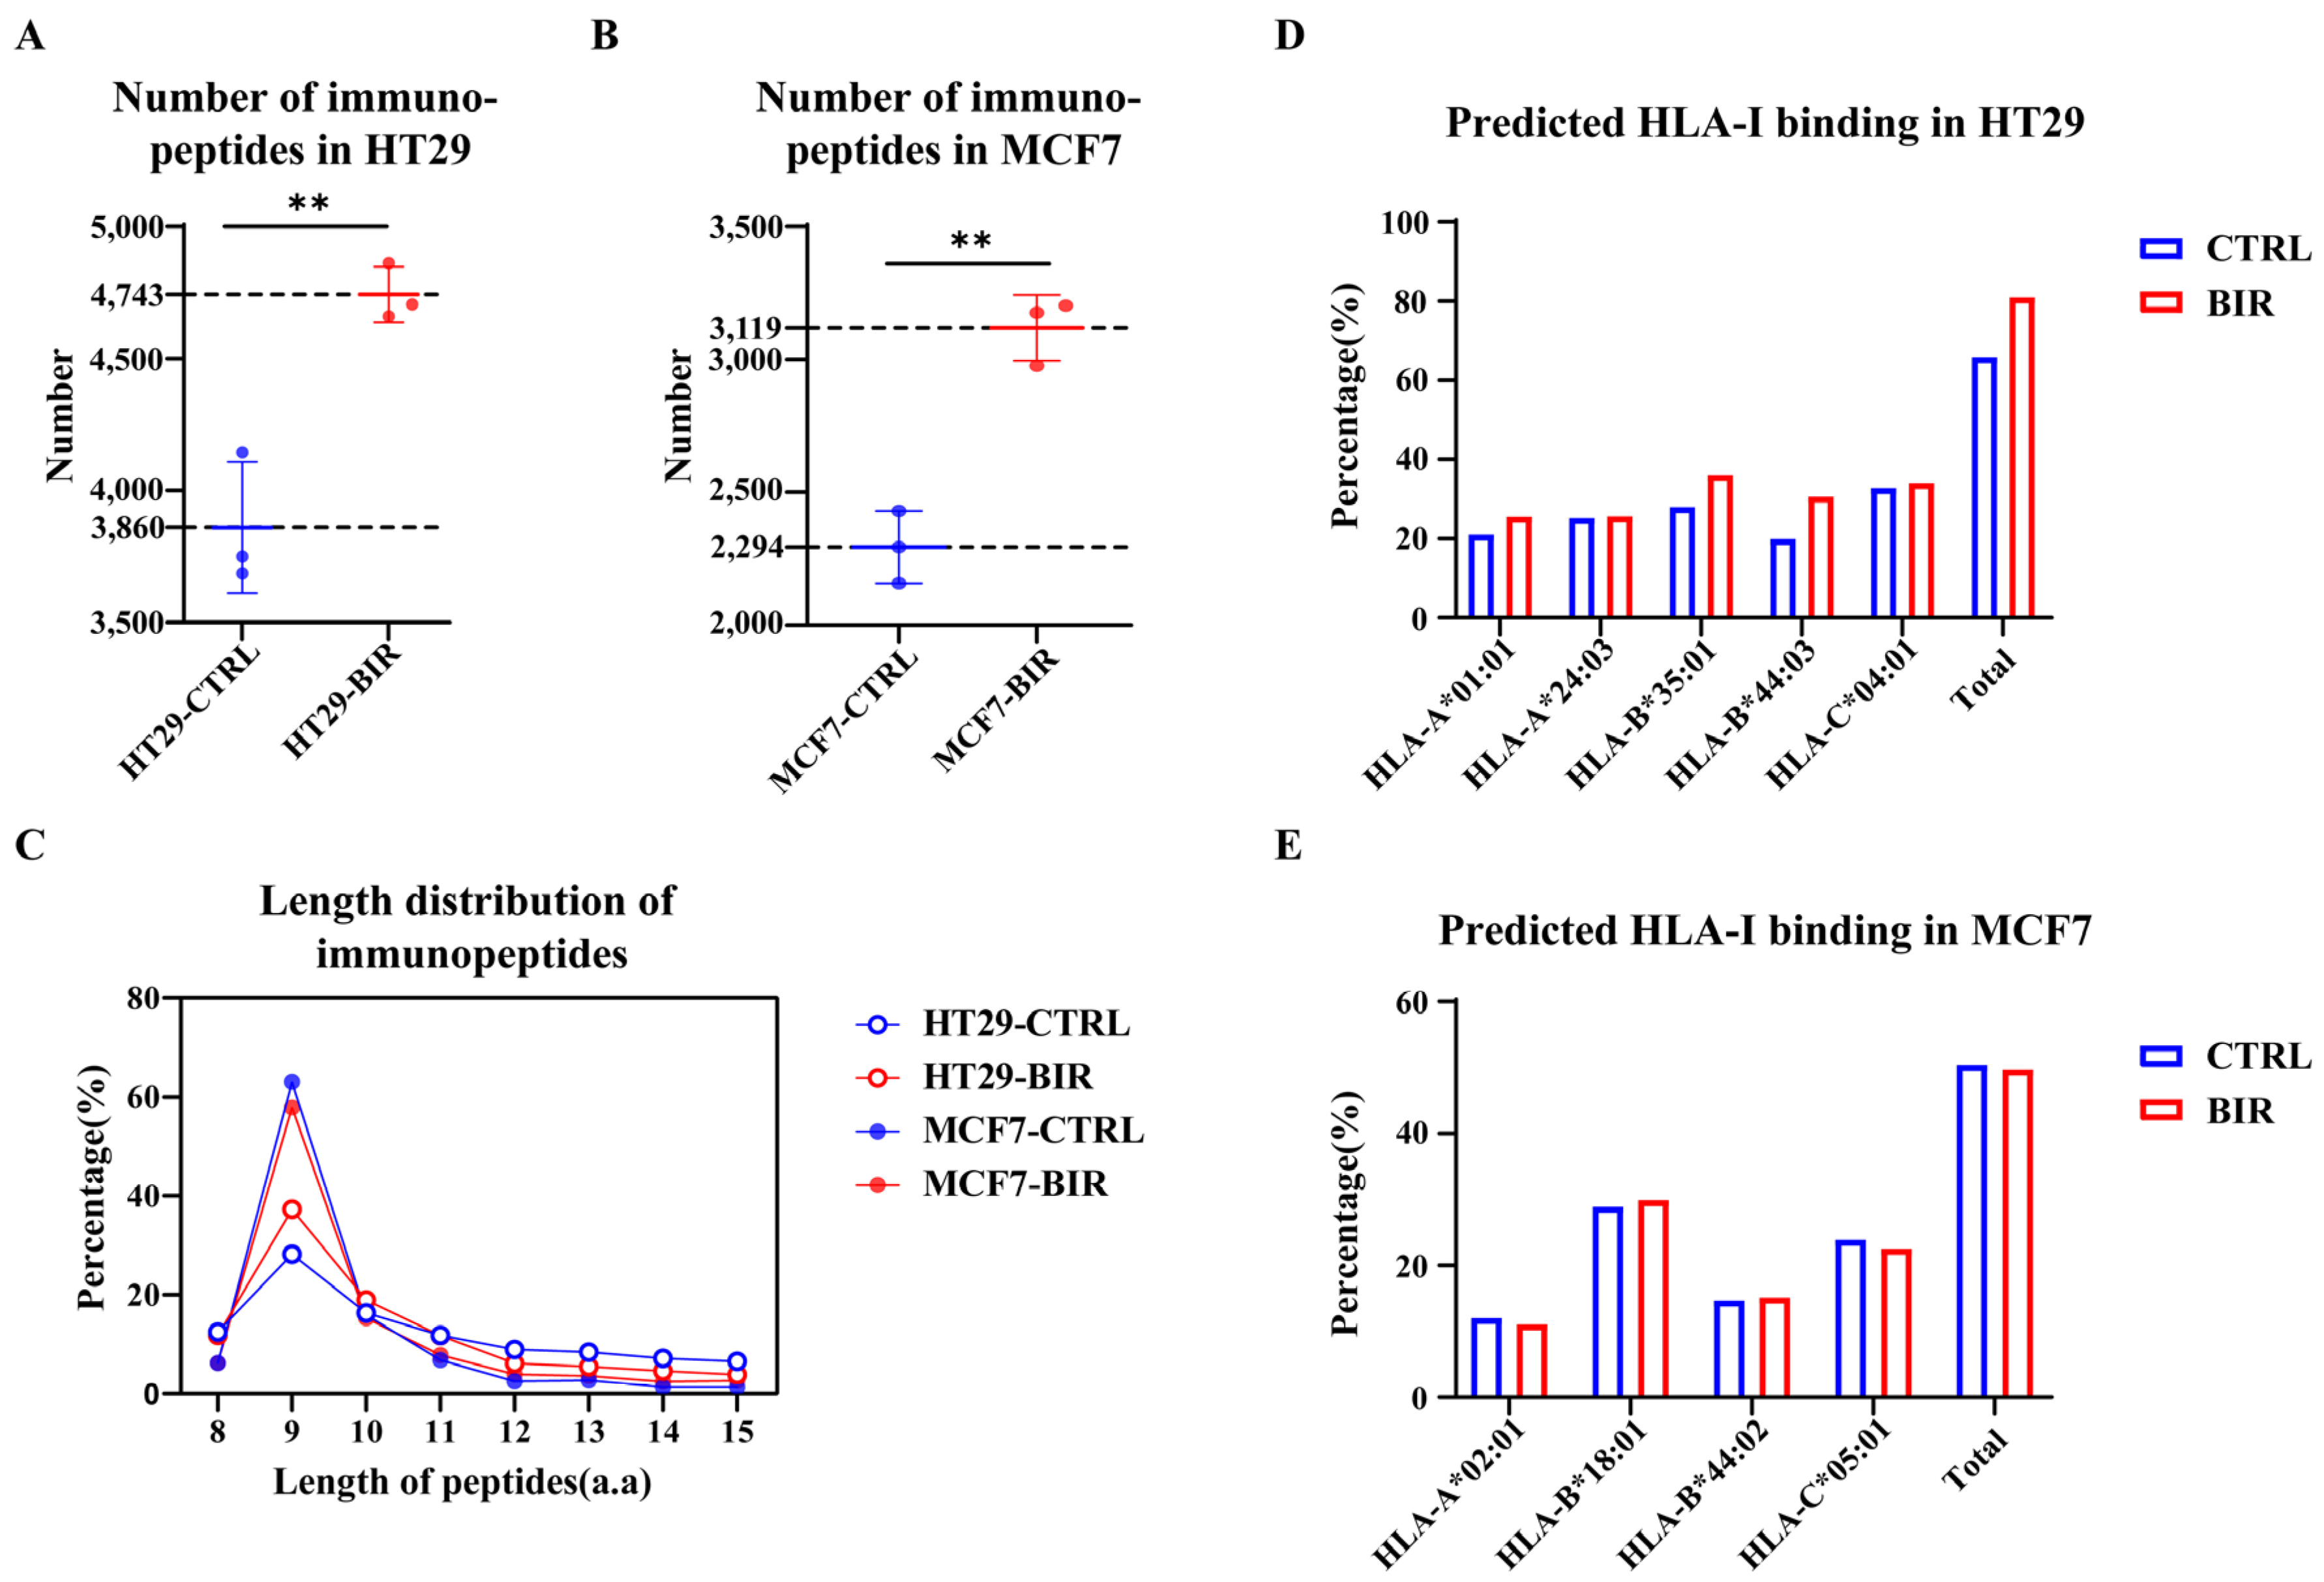
2.1. Birinapant Reshapes the Immunopeptidome In Vitro
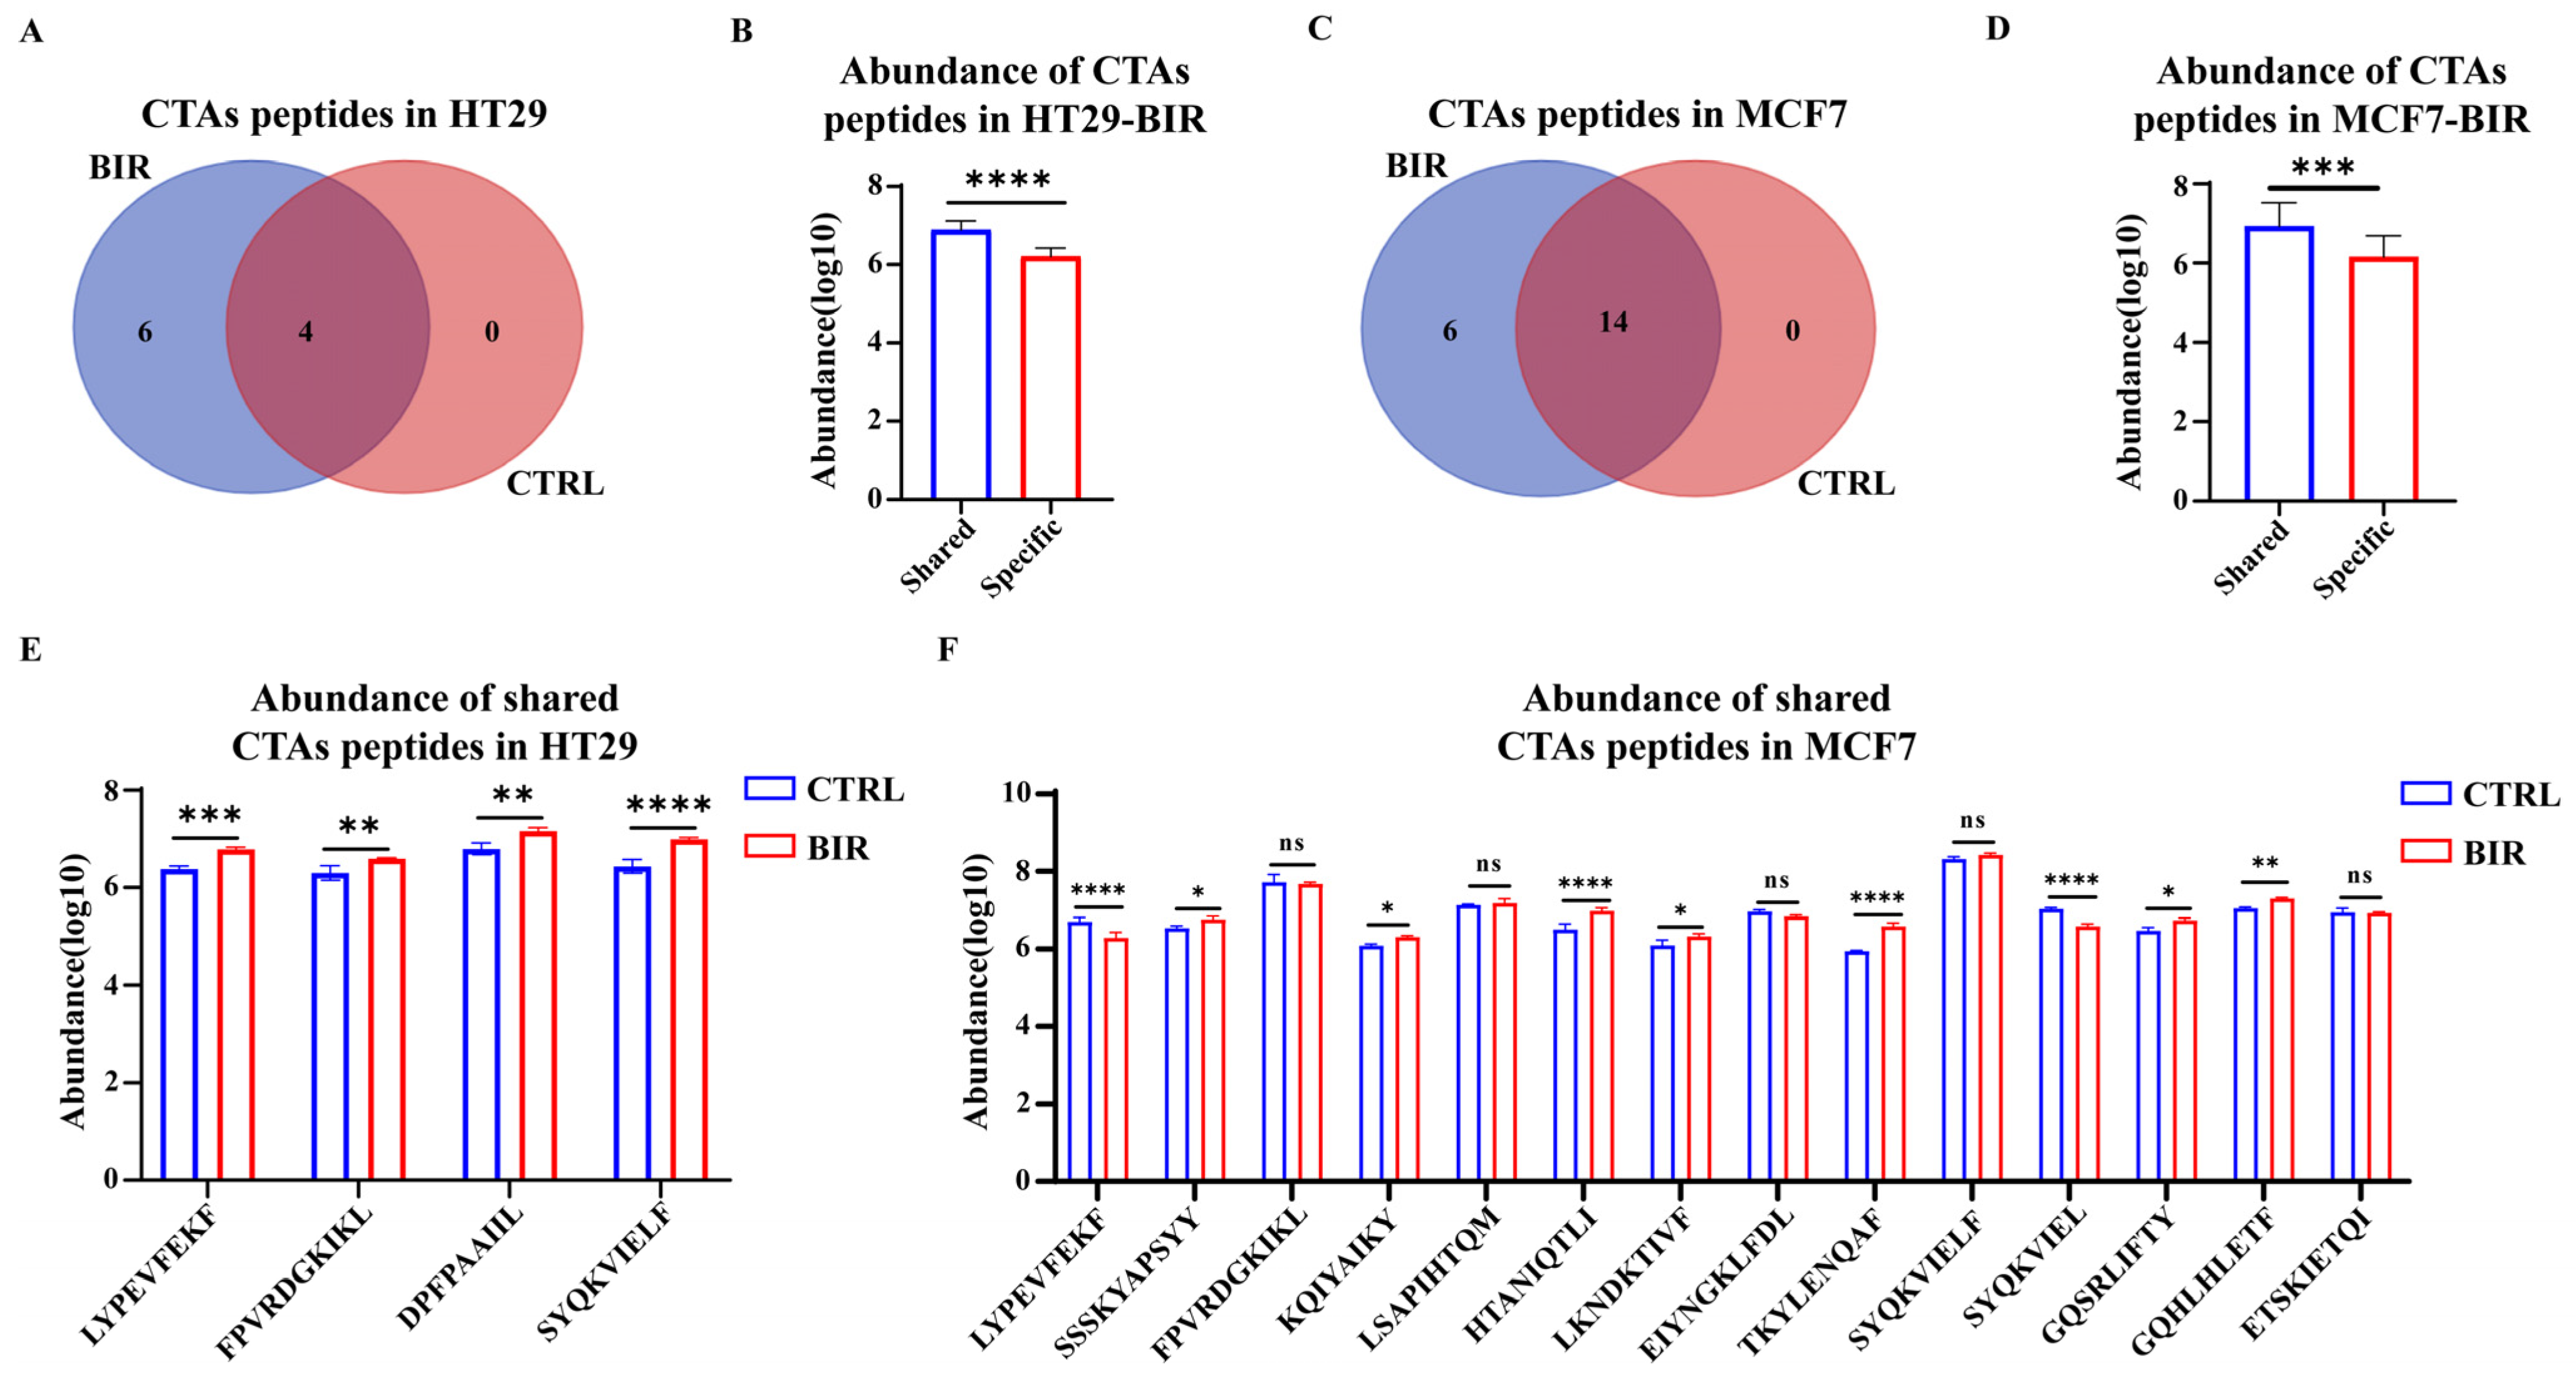
2.2. Birinapant Increases the Presentation of CTA Peptides and Neoantigens
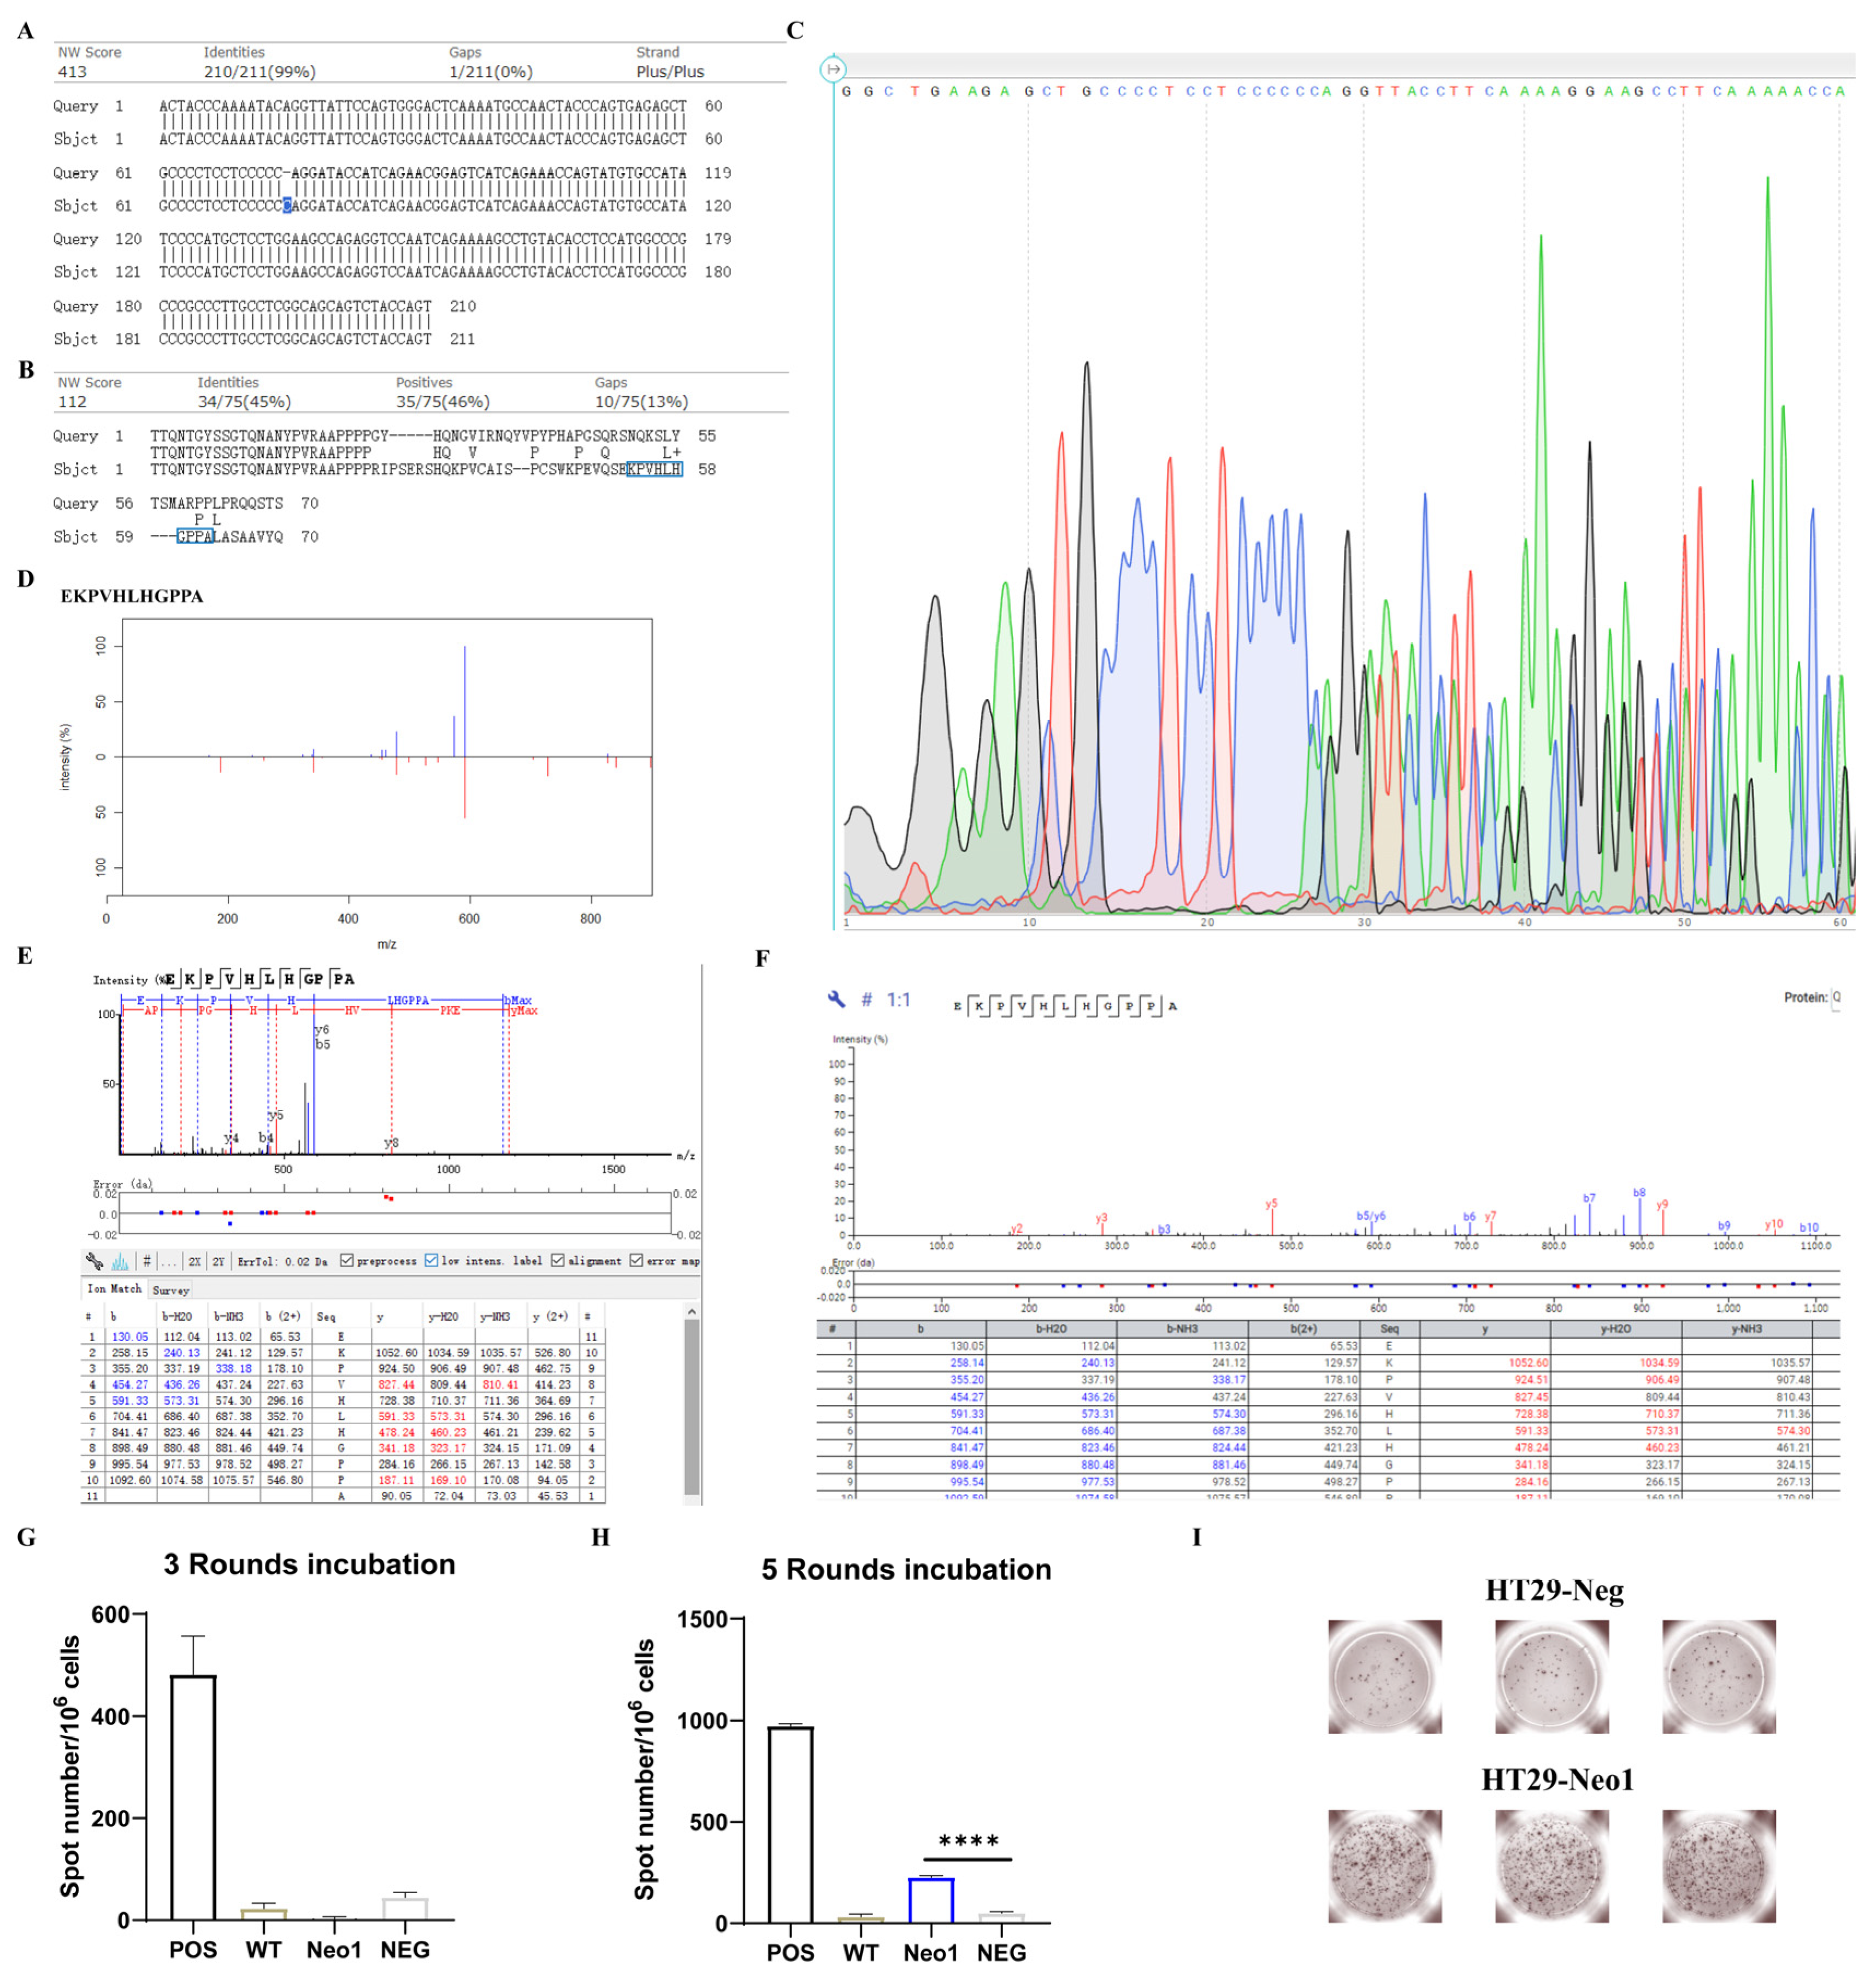
2.3. Neoantigens in BIR Display Stronger Immunogenicity
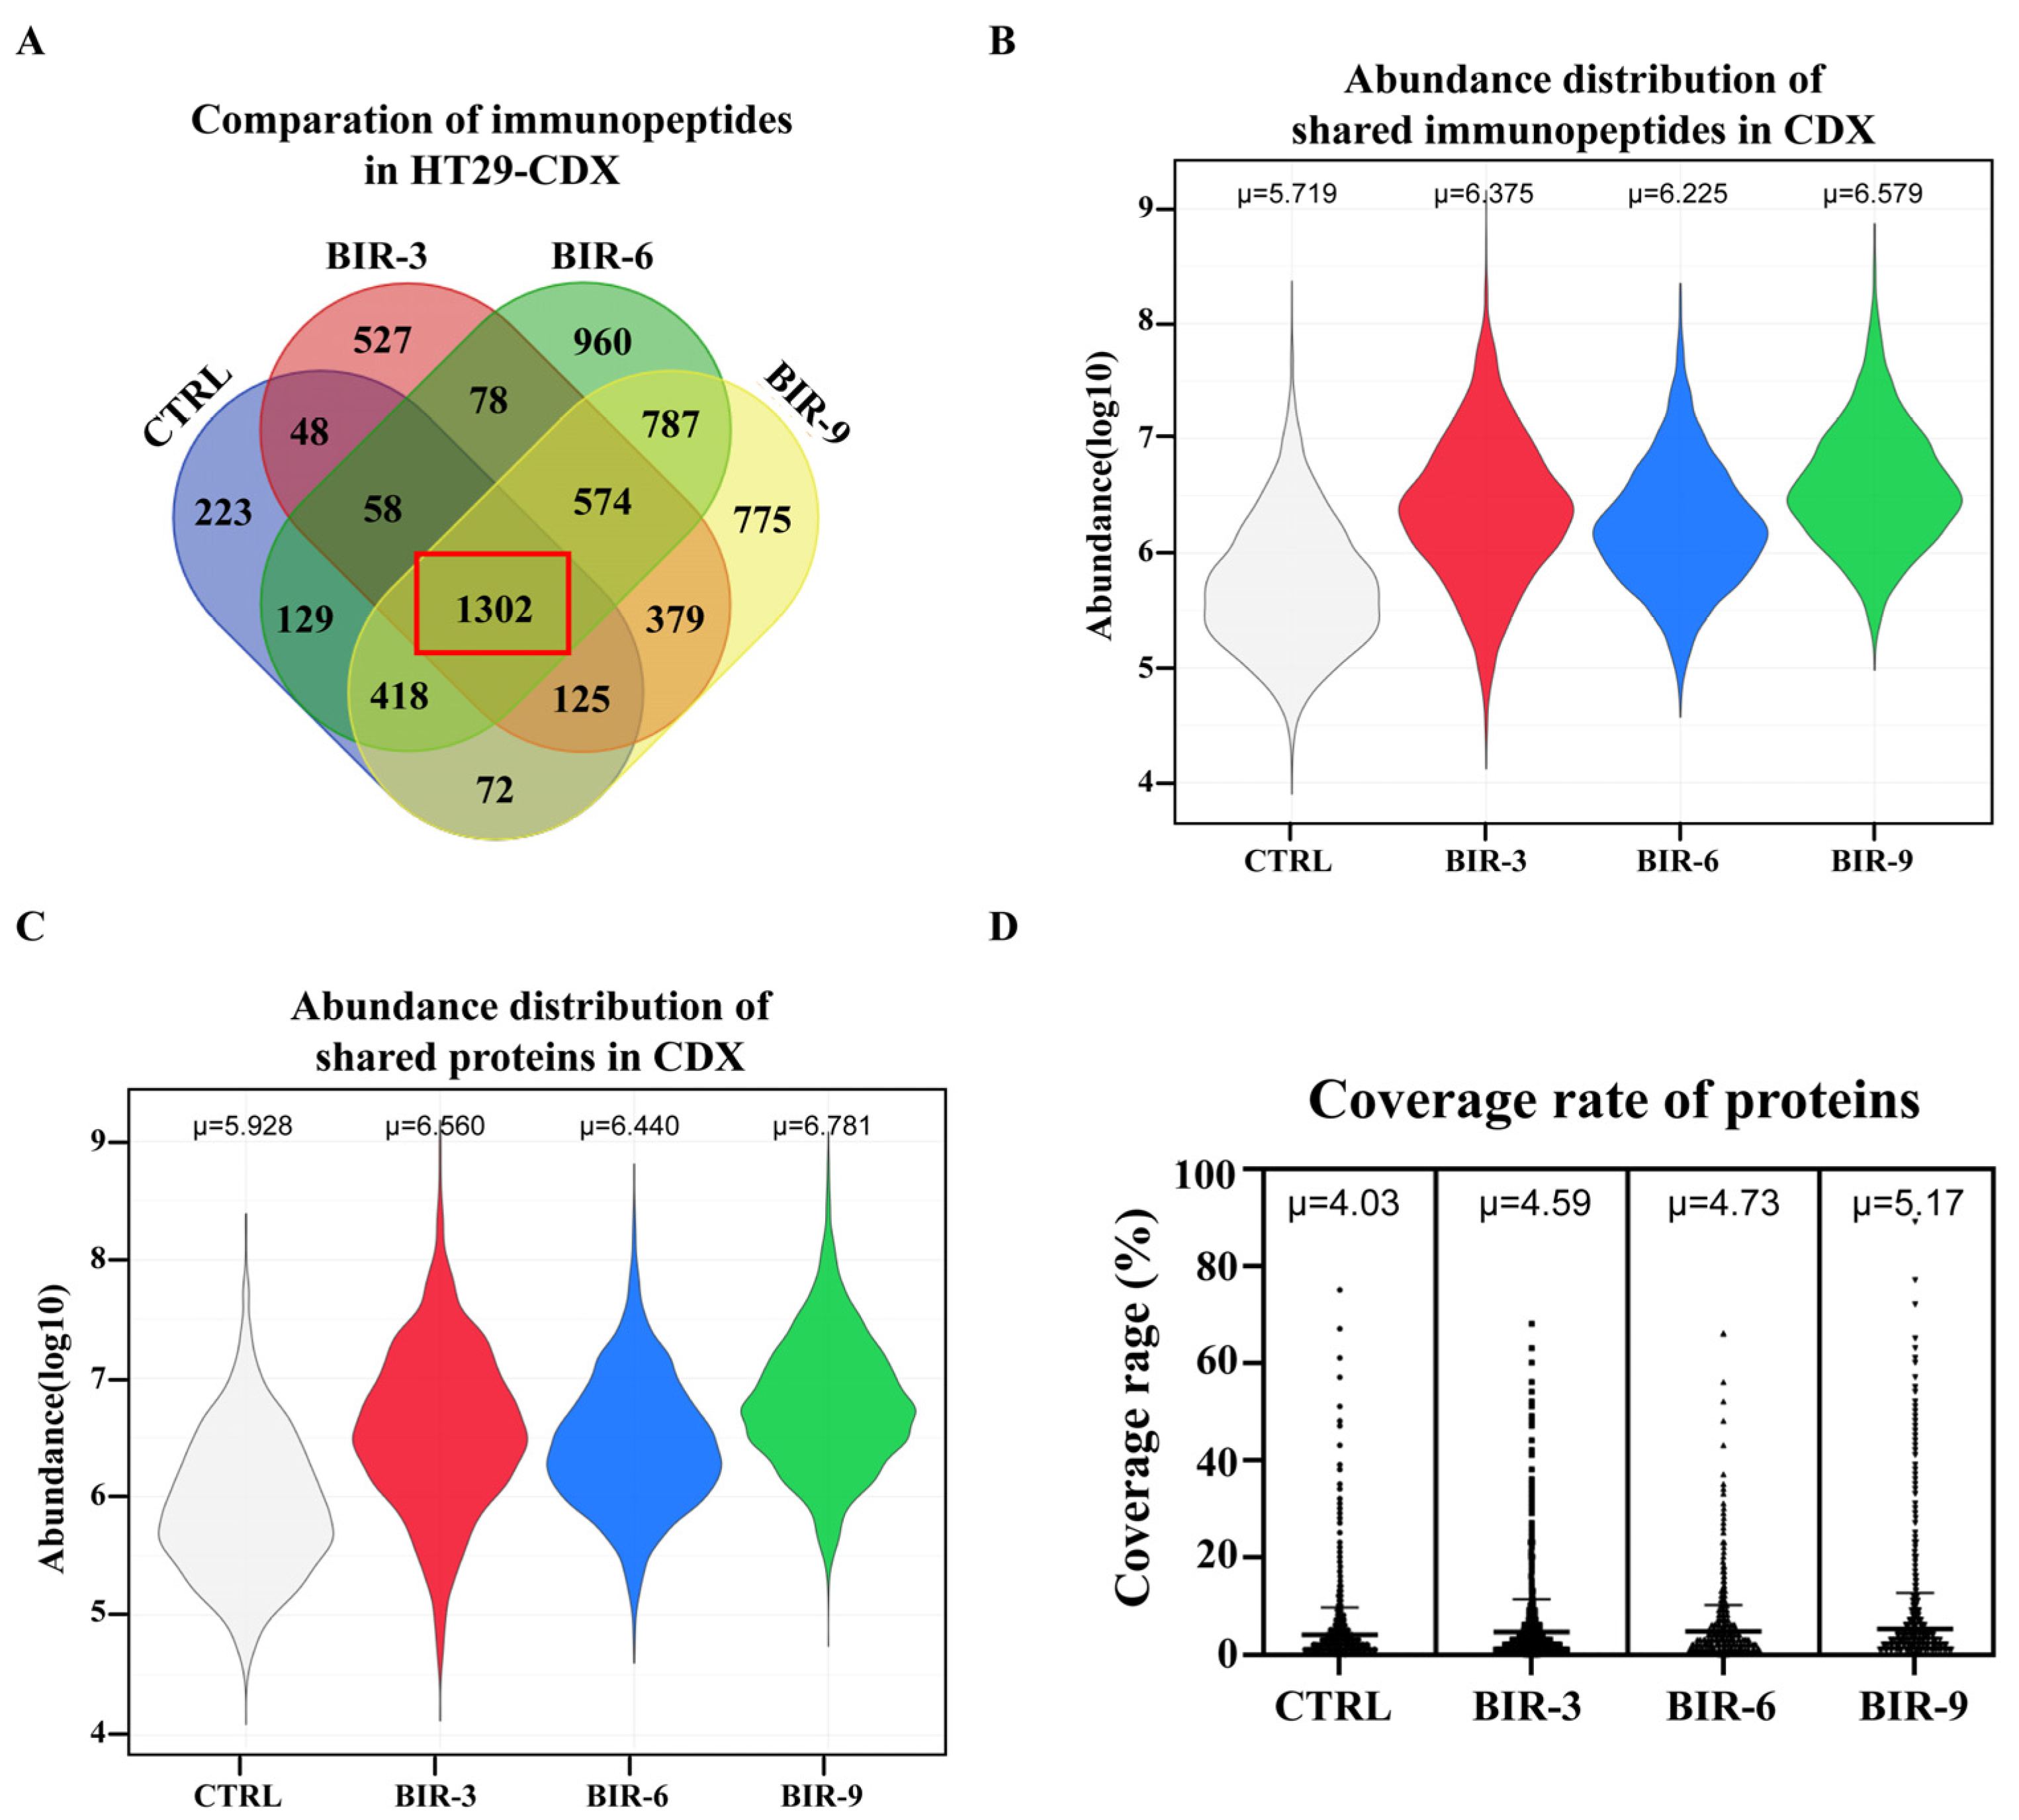
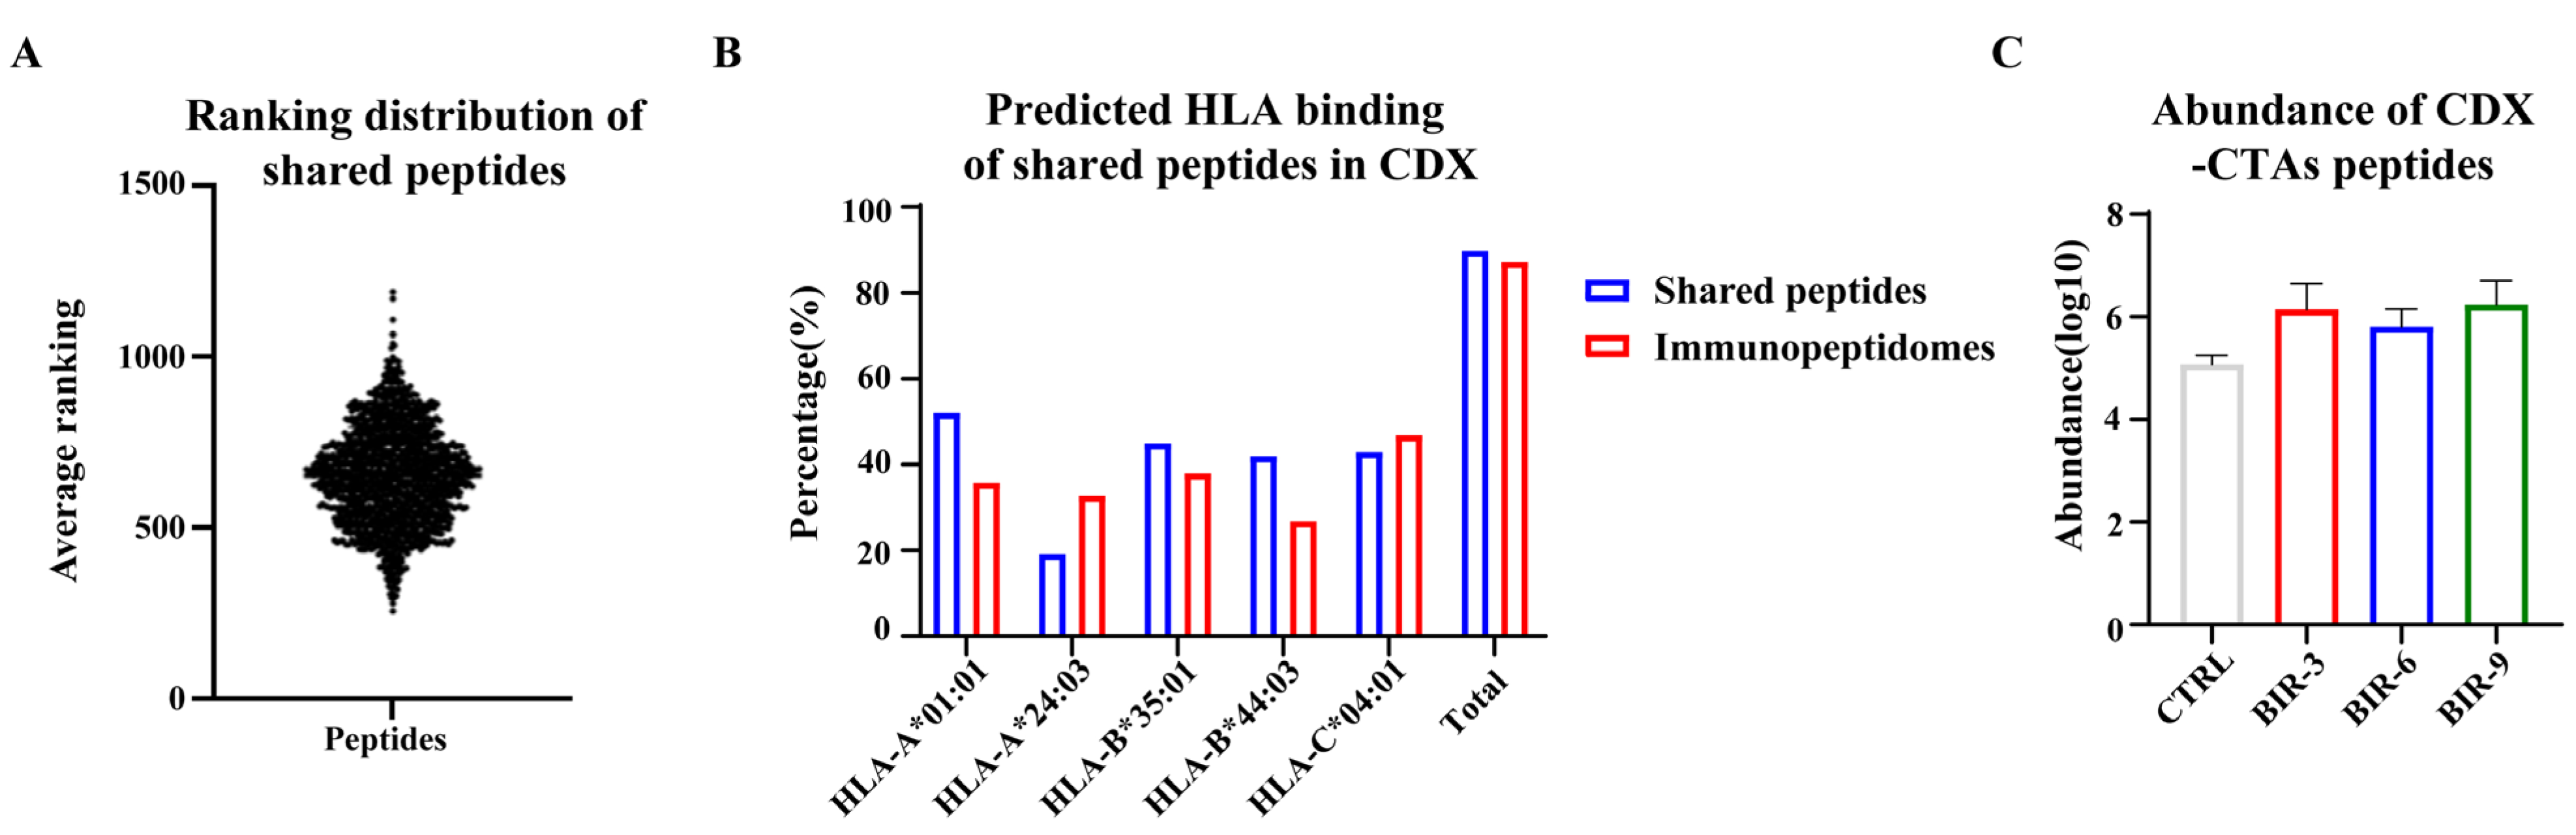
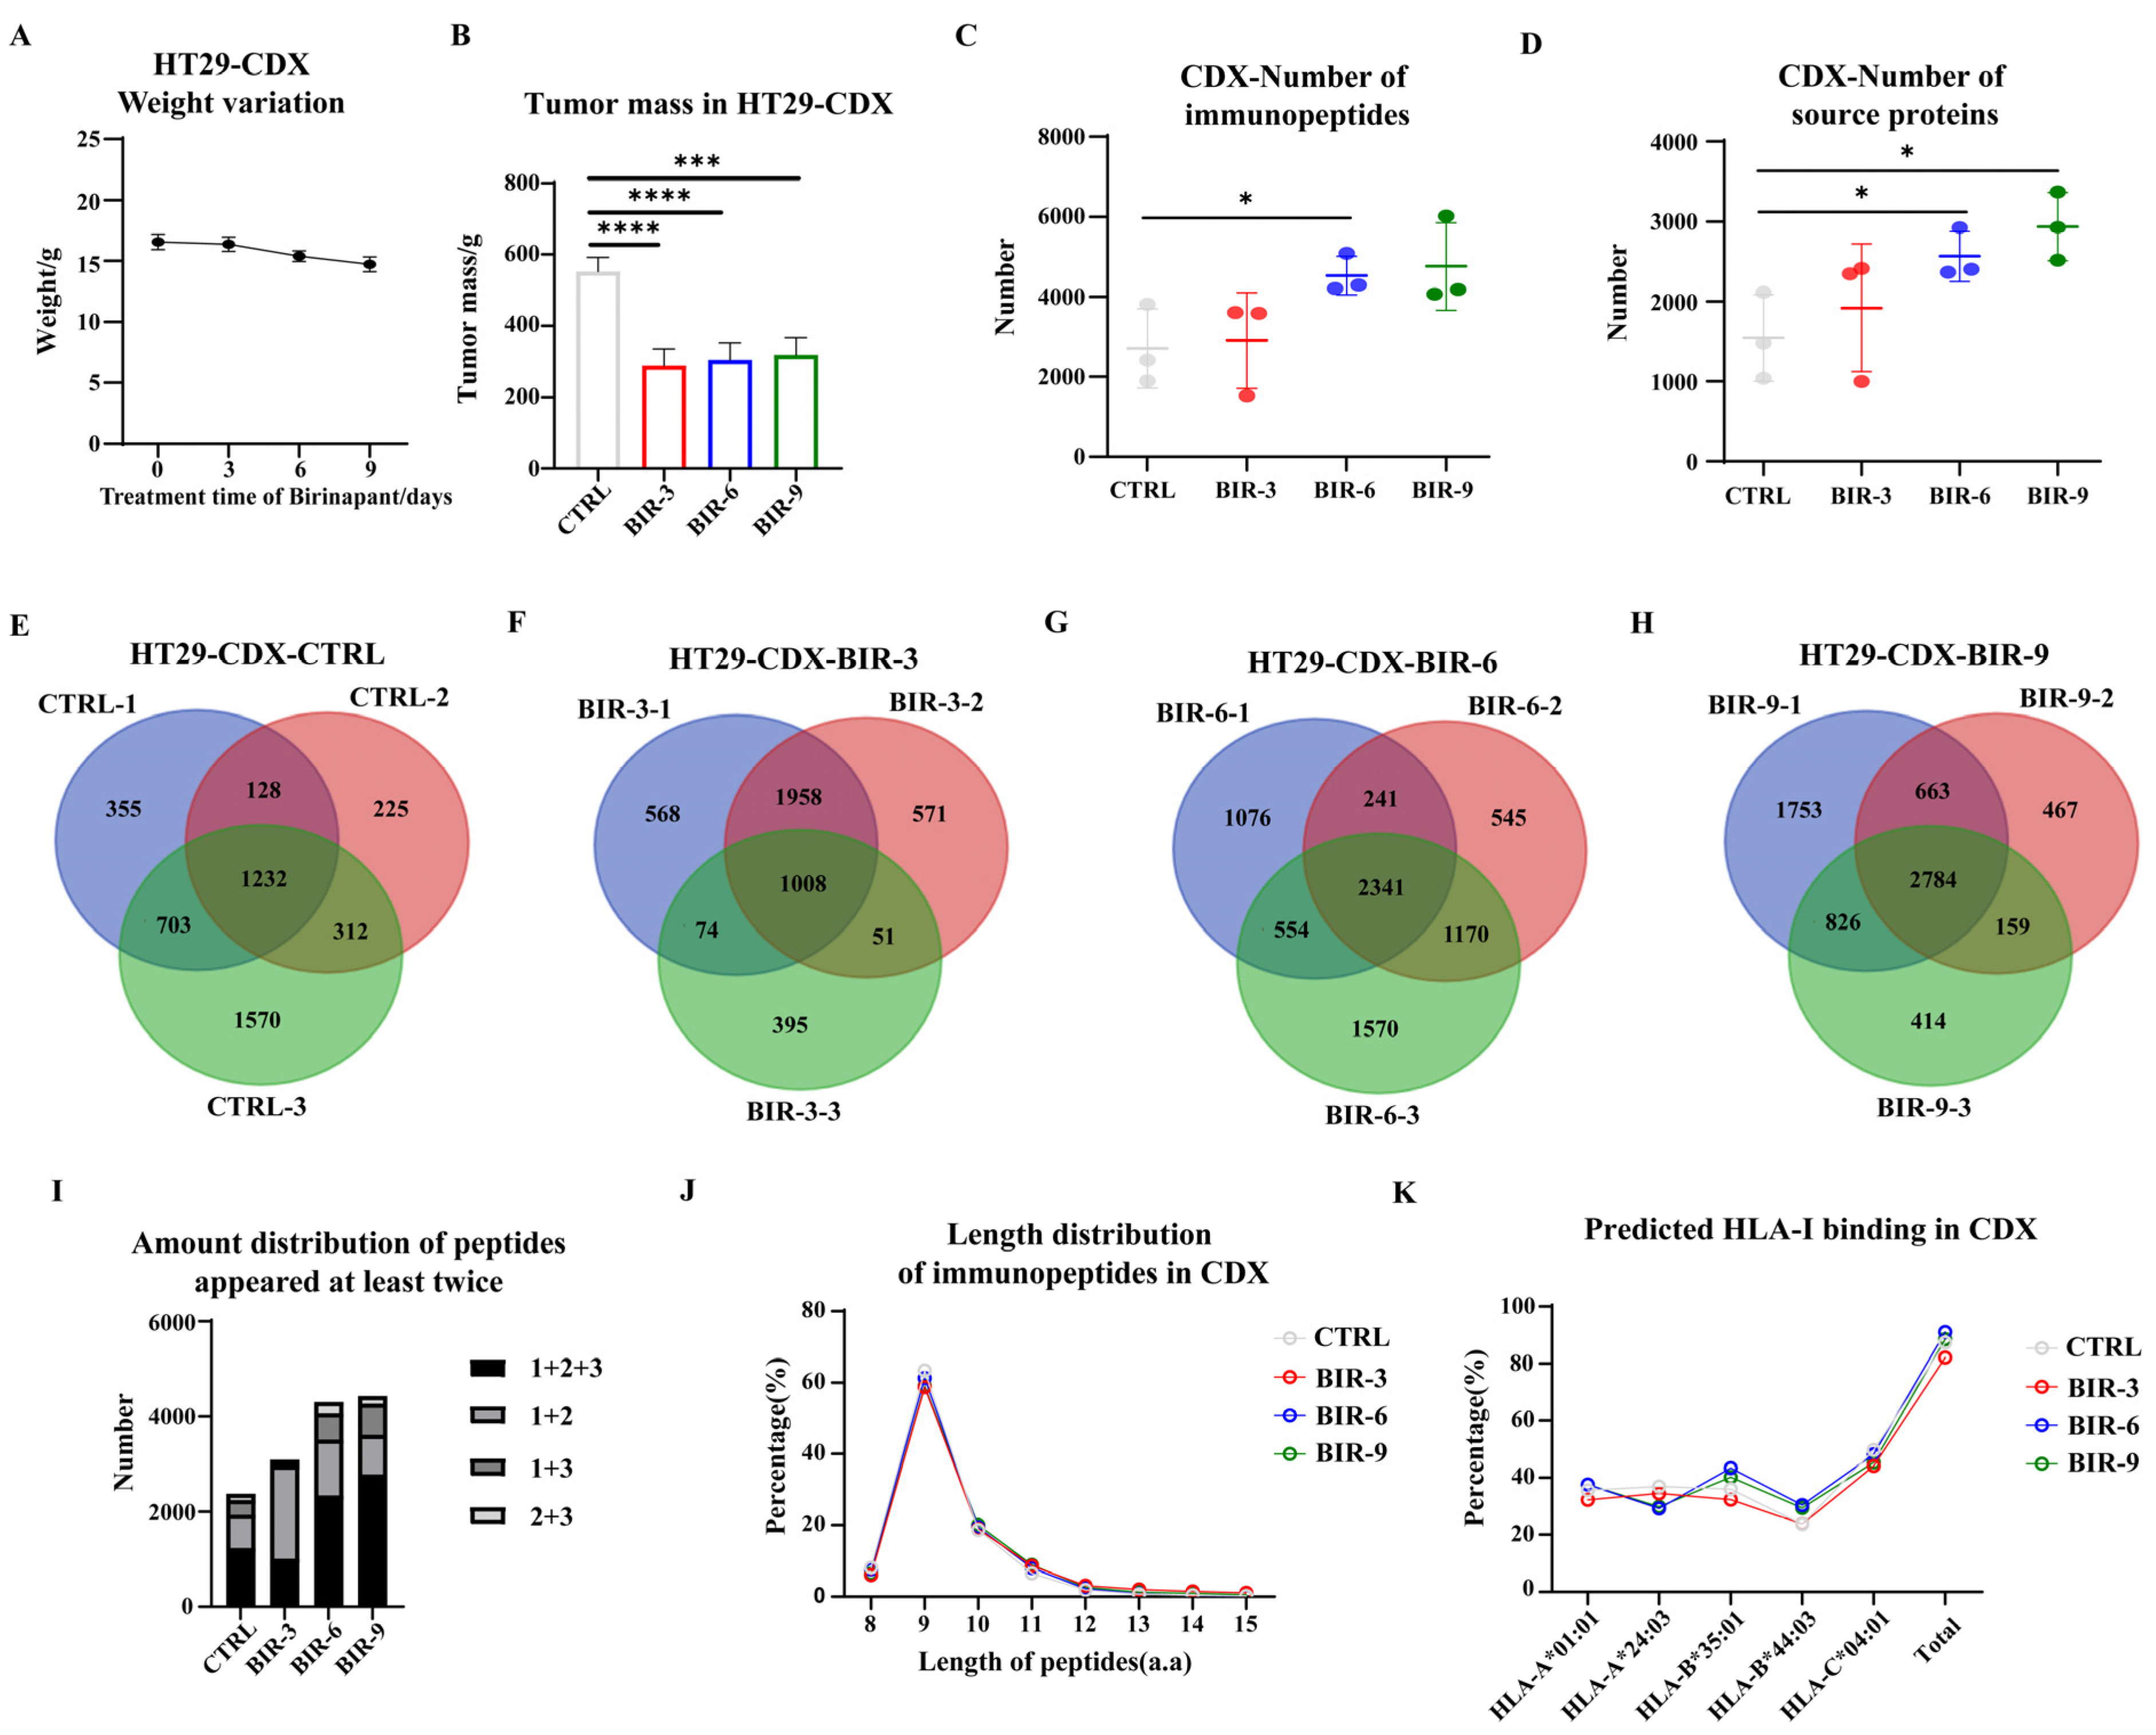
2.4. Birinapant Promotes Antigen Presentation In Vivo
3. Discussion
4. Materials and Methods
4.1. Instrument, Software and Reagent
4.2. Cell Culture
4.3. Whole-Exome Sequencing and HLA-I Typing
4.4. HLA-I Immunoprecipitation
4.5. Mass Spectrometry of Immunopeptidomes
4.6. Immunoblotting
4.7. Protein Desalting
4.8. Sixplex-Tandem Mass Tag (TMT)-Labeled Proteome
4.9. Horseradish Peroxidase (HRP) Fractionation and Mass Spectrometry of Proteome
4.10. Peptide Synthesis and Mass Spectrometry Analysis
4.11. mRNA Isolation and Reverse Transcription
4.12. Detection of Neoantigen Immunogenicity by Enzyme-Linked Immuno-Spot
4.13. Flow Cytometry
4.14. Cell-Derived Xenograft Construction and Drug Treatment
4.15. Statistical Analysis
Supplementary Materials
Author Contributions
Funding
Institutional Review Board Statement
Informed Consent Statement
Data Availability Statement
Acknowledgments
Conflicts of Interest
References
- Baxevanis, C.N.; Perez, S.A.; Papamichail, M. Cancer immunotherapy. Crit. Rev. Clin. Lab. Sci. 2009, 46, 167–189. [Google Scholar] [CrossRef]
- Kirchhammer, N.; Trefny, M.P.; der Maur, P.A.; Läubli, H.; Zippelius, A. Combination cancer immunotherapies: Emerging treatment strategies adapted to the tumor microenvironment. Sci. Transl. Med. 2022, 14, eabo3605. [Google Scholar] [CrossRef]
- da Silva, J.L.; Dos Santos, A.L.S.; Nunes, N.C.C.; da Silva, F.D.L.; Ferreira, C.G.M.; de Melo, A.C. Cancer immunotherapy: The art of targeting the tumor immune microenvironment. Cancer Chemother. Pharmacol. 2019, 84, 227–240. [Google Scholar] [CrossRef]
- Bagchi, S.; Yuan, R.; Engleman, E.G. Immune Checkpoint Inhibitors for the Treatment of Cancer: Clinical Impact and Mechanisms of Response and Resistance. Annu. Rev. Pathol. Mech. Dis. 2021, 16, 223–249. [Google Scholar] [CrossRef]
- Darvin, P.; Toor, S.M.; Nair, V.S.; Elkord, E. Immune checkpoint inhibitors: Recent progress and potential biomarkers. Exp. Mol. Med. 2018, 50, 1–11. [Google Scholar] [CrossRef]
- Rosenberg, S.A. A New Era for Cancer Immunotherapy Based on the Genes that Encode Cancer Antigens. Immunity 1999, 10, 281–287. [Google Scholar] [CrossRef] [PubMed]
- Oh, C.Y.; Klatt, M.G.; Bourne, C.; Dao, T.; Dacek, M.M.; Brea, E.J.; Mun, S.S.; Chang, A.Y.; Korontsvit, T.; Scheinberg, D.A. ALK and RET Inhibitors Promote HLA Class I Antigen Presentation and Unmask New Antigens within the Tumor Immunopeptidome. Cancer Immunol. Res. 2019, 7, 1984–1997. [Google Scholar] [CrossRef] [PubMed]
- Amaria, R.N.; Reddy, S.M.; Tawbi, H.A.; Davies, M.A.; Ross, M.I.; Glitza, I.C.; Cormier, J.N.; Lewis, C.; Hwu, W.-J.; Hanna, E.; et al. Neoadjuvant immune checkpoint blockade in high-risk resectable melanoma. Nat. Med. 2018, 24, 1649–1654. [Google Scholar] [CrossRef] [PubMed]
- Li, S.; Yu, W.; Xie, F.; Luo, H.; Liu, Z.; Lv, W.; Shi, D.; Yu, D.; Gao, P.; Chen, C.; et al. Neoadjuvant therapy with immune checkpoint blockade, antiangiogenesis, and chemotherapy for locally advanced gastric cancer. Nat. Commun. 2023, 14, 8. [Google Scholar] [CrossRef] [PubMed]
- Litchfield, K.; Reading, J.L.; Puttick, C.; Thakkar, K.; Abbosh, C.; Bentham, R.; Watkins, T.B.K.; Rosenthal, R.; Biswas, D.; Rowan, A.; et al. Meta-analysis of tumor- and T cell-intrinsic mechanisms of sensitization to checkpoint inhibition. Cell 2021, 184, 596–614.e14. [Google Scholar] [CrossRef] [PubMed]
- Cristescu, R.; Mogg, R.; Ayers, M.; Albright, A.; Murphy, E.; Yearley, J.; Sher, X.; Liu, X.Q.; Lu, H.; Nebozhyn, M.; et al. Pan-tumor genomic biomarkers for PD-1 checkpoint blockade-based immunotherapy. Science 2019, 362, eaar3593. [Google Scholar] [CrossRef] [PubMed]
- Lee, J.H.; Shklovskaya, E.; Lim, S.Y.; Carlino, M.S.; Menzies, A.M.; Stewart, A.; Pedersen, B.; Irvine, M.; Alavi, S.; Yang, J.Y.H.; et al. Transcriptional downregulation of MHC class I and melanoma de- differentiation in resistance to PD-1 inhibition. Nat. Commun. 2020, 11, 1897. [Google Scholar] [CrossRef]
- McGranahan, N.; Rosenthal, R.; Hiley, C.T.; Rowan, A.J.; Watkins, T.B.K.; Wilson, G.A.; Birkbak, N.J.; Veeriah, S.; Van Loo, P.; Herrero, J.; et al. Allele-Specific HLA Loss and Immune Escape in Lung Cancer Evolution. Cell 2017, 171, 1259–1271.e11. [Google Scholar] [CrossRef]
- Yuan, J.; Khilnani, A.; Brody, J.; Andtbacka, R.H.; Hu-Lieskovan, S.; Luke, J.J.; Diab, A.; Marabelle, A.; Snyder, A.; Cao, Z.A.; et al. Current strategies for intratumoural immunotherapy—Beyond immune checkpoint inhibition. Eur. J. Cancer 2021, 157, 493–510. [Google Scholar] [CrossRef] [PubMed]
- D’amico, S.; Tempora, P.; Melaiu, O.; Lucarini, V.; Cifaldi, L.; Locatelli, F.; Fruci, D. Targeting the antigen processing and presentation pathway to overcome resistance to immune checkpoint therapy. Front. Immunol. 2022, 13, 948297. [Google Scholar] [CrossRef]
- Jhunjhunwala, S.; Hammer, C.; Delamarre, L. Antigen presentation in cancer: Insights into tumour immunogenicity and immune evasion. Nat. Rev. Cancer 2021, 21, 298–312. [Google Scholar] [CrossRef] [PubMed]
- Conway, J.R.; Kofman, E.; Mo, S.S.; Elmarakeby, H.; Van Allen, E. Genomics of response to immune checkpoint therapies for cancer: Implications for precision medicine. Genome Med. 2018, 10, 93. [Google Scholar] [CrossRef]
- Aruga, A.; Takeshita, N.; Kotera, Y.; Okuyama, R.; Matsushita, N.; Ohta, T.; Takeda, K.; Yamamoto, M. Long-term Vaccination with Multiple Peptides Derived from Cancer-Testis Antigens Can Maintain a Specific T-cell Response and Achieve Disease Stability in Advanced Biliary Tract Cancer. Clin. Cancer Res. 2013, 19, 2224–2231. [Google Scholar] [CrossRef]
- Kono, K.; Iinuma, H.; Akutsu, Y.; Tanaka, H.; Hayashi, N.; Uchikado, Y.; Noguchi, T.; Fujii, H.; Okinaka, K.; Fukushima, R.; et al. Multicenter, phase II clinical trial of cancer vaccination for advanced esophageal cancer with three peptides derived from novel cancer-testis antigens. J. Transl. Med. 2012, 10, 141. [Google Scholar] [CrossRef]
- Chandran, S.S.; Ma, J.; Klatt, M.G.; Dündar, F.; Bandlamudi, C.; Razavi, P.; Wen, H.Y.; Weigelt, B.; Zumbo, P.; Fu, S.N.; et al. Immunogenicity and therapeutic targeting of a public neoantigen derived from mutated PIK3CA. Nat. Med. 2022, 28, 946–957. [Google Scholar] [CrossRef]
- Repáraz, D.; Ruiz, M.; Llopiz, D.; Silva, L.; Vercher, E.; Aparicio, B.; Egea, J.; Tamayo-Uria, I.; Hervás-Stubbs, S.; García-Balduz, J.; et al. Neoantigens as potential vaccines in hepatocellular carcinoma. J. Immunother. Cancer 2022, 10, e003978. [Google Scholar] [CrossRef]
- Cafri, G.; Gartner, J.J.; Zaks, T.; Hopson, K.; Levin, N.; Paria, B.C.; Parkhurst, M.R.; Yossef, R.; Lowery, F.J.; Jafferji, M.S.; et al. mRNA vaccine–induced neoantigen-specific T cell immunity in patients with gastrointestinal cancer. J. Clin. Investig. 2020, 130, 5976–5988. [Google Scholar] [CrossRef] [PubMed]
- Ott, P.A.; Hu, Z.; Keskin, D.B.; Shukla, S.A.; Sun, J.; Bozym, D.J.; Zhang, W.; Luoma, A.; Giobbie-Hurder, A.; Peter, L.; et al. An immunogenic personal neoantigen vaccine for patients with melanoma. Nature 2017, 547, 217–221, Erratum in Nature 2018, 555, 402. [Google Scholar] [CrossRef] [PubMed]
- Ott, P.A.; Hu-Lieskovan, S.; Chmielowski, B.; Govindan, R.; Naing, A.; Bhardwaj, N.; Margolin, K.; Awad, M.M.; Hellmann, M.D.; Lin, J.J.; et al. A Phase Ib Trial of Personalized Neoantigen Therapy Plus Anti-PD-1 in Patients with Advanced Melanoma, Non-small Cell Lung Cancer, or Bladder Cancer. Cell 2020, 183, 347–362.e24. [Google Scholar] [CrossRef] [PubMed]
- Roudko, V.; Greenbaum, B.; Bhardwaj, N. Computational Prediction and Validation of Tumor-Associated Neoantigens. Front. Immunol. 2020, 11, 27. [Google Scholar] [CrossRef]
- Wells, D.K.; van Buuren, M.M.; Dang, K.K.; Hubbard-Lucey, V.M.; Sheehan, K.C.; Campbell, K.M.; Lamb, A.; Ward, J.P.; Sidney, J.; Blazquez, A.B.; et al. Key Parameters of Tumor Epitope Immunogenicity Revealed through a Consortium Approach Improve Neoantigen Prediction. Cell 2020, 183, 818–834.e13. [Google Scholar] [CrossRef]
- Bjerregaard, A.-M.; Nielsen, M.; Jurtz, V.; Barra, C.M.; Hadrup, S.R.; Szallasi, Z.; Eklund, A.C. An Analysis of Natural T Cell Responses to Predicted Tumor Neoepitopes. Front. Immunol. 2017, 8, 1566. [Google Scholar] [CrossRef] [PubMed]
- Castle, J.C.; Kreiter, S.; Diekmann, J.; Löwer, M.; van de Roemer, N.; de Graaf, J.; Selmi, A.; Diken, M.; Boegel, S.; Paret, C.; et al. Exploiting the Mutanome for Tumor Vaccination. Cancer Res. 2012, 72, 1081–1091. [Google Scholar] [CrossRef]
- Shapiro, I.E.; Bassani-Sternberg, M. The impact of immunopeptidomics: From basic research to clinical implementation. Semin. Immunol. 2023, 66, 101727. [Google Scholar] [CrossRef]
- Bassani-Sternberg, M.; Bräunlein, E.; Klar, R.; Engleitner, T.; Sinitcyn, P.; Audehm, S.; Straub, M.; Weber, J.; Slotta-Huspenina, J.; Specht, K.; et al. Direct identification of clinically relevant neoepitopes presented on native human melanoma tissue by mass spectrometry. Nat. Commun. 2016, 7, 13404. [Google Scholar] [CrossRef]
- Löffler, M.W.; HEPAVAC Consortium; Mohr, C.; Bichmann, L.; Freudenmann, L.K.; Walzer, M.; Schroeder, C.M.; Trautwein, N.; Hilke, F.J.; Zinser, R.S.; et al. Multi-omics discovery of exome-derived neoantigens in hepatocellular carcinoma. Genome Med. 2019, 11, 28. [Google Scholar] [CrossRef]
- Pak, H.; Michaux, J.; Huber, F.; Chong, C.; Stevenson, B.J.; Müller, M.; Coukos, G.; Bassani-Sternberg, M. Sensitive Immunopeptidomics by Leveraging Available Large-Scale Multi-HLA Spectral Libraries, Data-Independent Acquisition, and MS/MS Prediction. Mol. Cell. Proteom. 2021, 20, 100080. [Google Scholar] [CrossRef]
- Newey, A.; Griffiths, B.; Michaux, J.; Pak, H.S.; Stevenson, B.J.; Woolston, A.; Semiannikova, M.; Spain, G.; Barber, L.J.; Matthews, N.; et al. Immunopeptidomics of colorectal cancer organoids reveals a sparse HLA class I neoantigen landscape and no increase in neoantigens with interferon or MEK-inhibitor treatment. J. Immunother. Cancer 2019, 7, 309. [Google Scholar] [CrossRef]
- Chen, R.; Fulton, K.M.; Twine, S.M.; Li, J. Identification of MHC Peptides Using Mass Spectrometry for Neoantigen Discovery and Cancer Vaccine Development. Mass Spectrom. Rev. 2019, 40, 110–125. [Google Scholar] [CrossRef] [PubMed]
- Becker, J.P.; Riemer, A.B. The Importance of Being Presented: Target Validation by Immunopeptidomics for Epitope-Specific Immunotherapies. Front. Immunol. 2022, 13, 883989. [Google Scholar] [CrossRef] [PubMed]
- Zhu, D.L.; Shuai, L.Y. Effects of Birinapant on Proliferation and Invasion of MGC-803 Gastric Cancer Cells and Mechanism Underlying These Effects. Bull. Exp. Biol. Med. 2021, 171, 56–61. [Google Scholar] [CrossRef] [PubMed]
- Ding, J.; Qin, D.; Zhang, Y.; Li, Q.; Li, Y.; Li, J. SMAC mimetic birinapant inhibits hepatocellular carcinoma growth by activating the cIAP1/TRAF3 signaling pathway. Mol. Med. Rep. 2020, 21, 1251–1257. [Google Scholar] [CrossRef]
- Lalaoui, N.; Merino, D.; Giner, G.; Vaillant, F.; Chau, D.; Liu, L.; Kratina, T.; Pal, B.; Whittle, J.R.; Etemadi, N.; et al. Targeting triple-negative breast cancers with the Smac-mimetic birinapant. Cell Death Differ. 2020, 27, 2768–2780. [Google Scholar] [CrossRef]
- Xie, X.; Lee, J.; Liu, H.; Pearson, T.; Lu, A.Y.; Tripathy, D.; Devi, G.R.; Bartholomeusz, C.; Ueno, N.T. Birinapant Enhances Gemcitabine’s Antitumor Efficacy in Triple-Negative Breast Cancer by Inducing Intrinsic Pathway—Dependent Apoptosis. Mol. Cancer Ther. 2021, 20, 296–306. [Google Scholar] [CrossRef]
- Cerna, D.; Lim, B.; Adelabu, Y.; Yoo, S.; Carter, D.; Fahim, A.; Mitsuuchi, Y.; Teicher, B.A.; Bernhard, E.; Coleman, C.N.; et al. SMAC Mimetic/IAP Inhibitor Birinapant Enhances Radiosensitivity of Glioblastoma Multiforme. Radiat. Res. 2021, 195, 549–560. [Google Scholar] [CrossRef] [PubMed]
- Gu, S.S.; Zhang, W.; Wang, X.; Jiang, P.; Traugh, N.; Li, Z.; Meyer, C.; Stewig, B.; Xie, Y.; Bu, X.; et al. Therapeutically Increasing MHC-I Expression Potentiates Immune Checkpoint Blockade. Cancer Discov. 2021, 11, 1524–1541. [Google Scholar] [CrossRef] [PubMed]
- Bai, L.; Smith, D.C.; Wang, S. Small-molecule SMAC mimetics as new cancer therapeutics. Pharmacol. Ther. 2014, 144, 82–95. [Google Scholar] [CrossRef] [PubMed]
- Boddu, P.; Carter, B.Z.; Verstovsek, S.; Pemmaraju, N. SMAC mimetics as potential cancer therapeutics in myeloid malignancies. Br. J. Haematol. 2019, 185, 219–231. [Google Scholar] [CrossRef] [PubMed]
- Goncalves, G.; Mullan, K.A.; Duscharla, D.; Ayala, R.; Croft, N.P.; Faridi, P.; Purcell, A.W. IFNγ Modulates the Immunopeptidome of Triple Negative Breast Cancer Cells by Enhancing and Diversifying Antigen Processing and Presentation. Front. Immunol. 2021, 12, 645770. [Google Scholar] [CrossRef] [PubMed]
- Olsson, N.; Heberling, M.L.; Zhang, L.; Jhunjhunwala, S.; Phung, Q.T.; Lin, S.; Anania, V.G.; Lill, J.R.; Elias, J.E. An Integrated Genomic, Proteomic, and Immunopeptidomic Approach to Discover Treatment-Induced Neoantigens. Front. Immunol. 2021, 12, 662443. [Google Scholar] [CrossRef] [PubMed]
- Zhou, Y.; Zhou, B.; Pache, L.; Chang, M.; Khodabakhshi, A.H.; Tanaseichuk, O.; Benner, C.; Chanda, S.K. Metascape provides a biologist-oriented resource for the analysis of systems-level datasets. Nat. Commun. 2019, 10, 1523. [Google Scholar] [CrossRef]
- Hilf, N.; Kuttruff-Coqui, S.; Frenzel, K.; Bukur, V.; Stevanović, S.; Gouttefangeas, C.; Platten, M.; Tabatabai, G.; Dutoit, V.; Van Der Burg, S.H.; et al. Actively personalized vaccination trial for newly diagnosed glioblastoma. Nature 2019, 565, 240–245, Erratum in Nature 2019, 566, E13. [Google Scholar] [CrossRef] [PubMed]
- Fan, C.; Qu, H.; Wang, X.; Sobhani, N.; Wang, L.; Liu, S.; Xiong, W.; Zeng, Z.; Li, Y. Cancer/testis antigens: From serology to mRNA cancer vaccine. Semin. Cancer Biol. 2021, 76, 218–231. [Google Scholar] [CrossRef]
- Smith, C.C.; Selitsky, S.R.; Chai, S.; Armistead, P.M.; Vincent, B.G.; Serody, J.S. Alternative tumour-specific antigens. Nat. Rev. Cancer 2019, 19, 465–478. [Google Scholar] [CrossRef]
- Finn, O.J. A Believer’s Overview of Cancer Immunosurveillance and Immunotherapy. J. Immunol. 2018, 200, 385–391. [Google Scholar] [CrossRef]
- Salewski, I.; Gladbach, Y.S.; Kuntoff, S.; Irmscher, N.; Hahn, O.; Junghanss, C.; Maletzki, C. In vivo vaccination with cell line-derived whole tumor lysates: Neoantigen quality, not quantity matters. J. Transl. Med. 2020, 18, 402. [Google Scholar] [CrossRef]
- Zhang, W.; Yin, Q.; Huang, H.; Lu, J.; Qin, H.; Chen, S.; Zhang, W.; Su, X.; Sun, W.; Dong, Y.; et al. Personal Neoantigens from Patients with NSCLC Induce Efficient Antitumor Responses. Front. Oncol. 2021, 11, 628456. [Google Scholar] [CrossRef]
- Zhou, F. Molecular Mechanisms of IFN-γ to Up-Regulate MHC Class I Antigen Processing and Presentation. Int. Rev. Immunol. 2009, 28, 239–260. [Google Scholar] [CrossRef]
- Jørgensen, N.; Sayed, A.; Jeppesen, H.B.; Persson, G.; Weisdorf, I.; Funck, T.; Hviid, T.V.F. Characterization of HLA-G Regulation and HLA Expression in Breast Cancer and Malignant Melanoma Cell Lines upon IFN-γ Stimulation and Inhibition of DNA Methylation. Int. J. Mol. Sci. 2020, 21, 4307. [Google Scholar] [CrossRef]
- Zhao, M.-Z.; Sun, Y.; Jiang, X.-F.; Liu, L.; Sun, L.-X. Promotion on NLRC5 upregulating MHC-I expression by IFN-γ in MHC-I—Deficient breast cancer cells. Immunol. Res. 2019, 67, 497–504. [Google Scholar] [CrossRef]
- Chen, Y.; Du, M.; Yuan, Z.; Chen, Z.; Yan, F. Spatiotemporal control of engineered bacteria to express interferon-γ by focused ultrasound for tumor immunotherapy. Nat. Commun. 2022, 13, 4468. [Google Scholar] [CrossRef] [PubMed]
- Martini, M.; Testi, M.G.; Pasetto, M.; Picchio, M.C.; Innamorati, G.; Mazzocco, M.; Ugel, S.; Cingarlini, S.; Bronte, V.; Zanovello, P.; et al. IFN-γ-mediated upmodulation of MHC class I expression activates tumor-specific immune response in a mouse model of prostate cancer. Vaccine 2010, 28, 3548–3557. [Google Scholar] [CrossRef]
- Ye, W.; Gunti, S.; Allen, C.T.; Hong, Y.; Clavijo, P.E.; Van Waes, C.; Schmitt, N.C. ASTX660, an antagonist of cIAP1/2 and XIAP, increases antigen processing machinery and can enhance radiation-induced immunogenic cell death in preclinical models of head and neck cancer. OncoImmunology 2020, 9, 1710398. [Google Scholar] [CrossRef] [PubMed]
- Pan, W.; Luo, Q.; Yan, X.; Yuan, L.; Yi, H.; Zhang, L.; Li, B.; Zhang, Y.; Sun, J.; Qiu, M.-Z.; et al. A novel SMAC mimetic APG-1387 exhibits dual antitumor effect on HBV-positive hepatocellular carcinoma with high expression of cIAP2 by inducing apoptosis and enhancing innate anti-tumor immunity. Biochem. Pharmacol. 2018, 154, 127–135. [Google Scholar] [CrossRef] [PubMed]
- Mayer, R.L.; Verbeke, R.; Asselman, C.; Aernout, I.; Gul, A.; Eggermont, D.; Boucher, K.; Thery, F.; Maia, T.M.; Demol, H.; et al. Immunopeptidomics-based design of mRNA vaccine formulations against Listeria monocytogenes. Nat. Commun. 2022, 13, 6075. [Google Scholar] [CrossRef] [PubMed]
- Leddy, O.; White, F.M.; Bryson, B.D. Immunopeptidomics reveals determinants of Mycobacterium tuberculosis antigen presentation on MHC class I. eLife 2023, 12, e84070. [Google Scholar] [CrossRef]
- Heather, J.M.; Myers, P.T.; Shi, F.; Aziz-Zanjani, M.O.; Mahoney, K.E.; Perez, M.; Morin, B.; Brittsan, C.; Shabanowitz, J.; Hunt, D.F.; et al. Murine xenograft bioreactors for human immunopeptidome discovery. Sci. Rep. 2019, 9, 18558. [Google Scholar] [CrossRef]
- Morad, G.; Helmink, B.A.; Sharma, P.; Wargo, J.A. Hallmarks of response, resistance, and toxicity to immune checkpoint blockade. Cell 2021, 184, 5309–5337. [Google Scholar] [CrossRef]
- Peng, M.; Mo, Y.; Wang, Y.; Wu, P.; Zhang, Y.; Xiong, F.; Guo, C.; Wu, X.; Li, Y.; Li, X.; et al. Neoantigen vaccine: An emerging tumor immunotherapy. Mol. Cancer 2019, 18, 128. [Google Scholar] [CrossRef]
- Pemmaraju, N.; Carter, B.Z.; Bose, P.; Jain, N.; Kadia, T.M.; Garcia-Manero, G.; Bueso-Ramos, C.E.; DiNardo, C.D.; Bledsoe, S.; Daver, N.G.; et al. Final results of a phase 2 clinical trial of LCL161, an oral SMAC mimetic for patients with myelofibrosis. Blood Adv. 2021, 5, 3163–3173. [Google Scholar] [CrossRef]
- Johnson, M.L.; Patel, M.R.; Aljumaily, R.; Jones, S.F.; Burris, I.H.A.; Spigel, D.R. A Phase Ib Dose-Escalation Study of LCL161 Plus Oral Topotecan for Patients with Relapsed/Refractory Small Cell Lung Cancer and Select Gynecologic Malignancies. Oncol. 2023, 28, 640–e559. [Google Scholar] [CrossRef] [PubMed]
- Noonan, A.M.; Bunch, K.P.; Chen, J.; Herrmann, M.A.; Lee, J.; Kohn, E.C.; O’Sullivan, C.C.; Jordan, E.; Houston, N.; Takebe, N.; et al. Pharmacodynamic markers and clinical results from the phase 2 study of the SMAC mimetic birinapant in women with relapsed platinum-resistant or -refractory epithelial ovarian cancer. Cancer 2015, 122, 588–597. [Google Scholar] [CrossRef] [PubMed]
- Amaravadi, R.K.; Schilder, R.J.; Martin, L.P.; Levin, M.; Graham, M.A.; Weng, D.E.; Adjei, A.A. A Phase I Study of the SMAC-Mimetic Birinapant in Adults with Refractory Solid Tumors or Lymphoma. Mol. Cancer Ther. 2015, 14, 2569–2575. [Google Scholar] [CrossRef] [PubMed]
- Purcell, A.W.; Ramarathinam, S.H.; Ternette, N. Mass spectrometry–based identification of MHC-bound peptides for immunopeptidomics. Nat. Protoc. 2019, 14, 1687–1707. [Google Scholar] [CrossRef] [PubMed]
- Hulsen, T.; de Vlieg, J.; Alkema, W. BioVenn—A web application for the comparison and visualization of biological lists using area-proportional Venn diagrams. BMC Genom. 2008, 9, 488. [Google Scholar] [CrossRef] [PubMed]


| Sequence | Group | Length | Immunogenicity | Binding Affinity (nM) | CTA |
|---|---|---|---|---|---|
| DPFPAAIIL | BIR and CTRL | 9 | 0.29185 | 330.78 | PBK |
| FAITEPLVTF | BIR | 10 | 0.21604 | 83.05 | CEP55 |
| VYVPHIHVW | BIR | 9 | 0.21044 | 3.93 | ATAD2 |
| LYPEVFEKF | BIR and CTRL | 9 | 0.20605 | 2.46 | ATAD2 |
| SALPTVVAY | BIR | 9 | 0.1196 | 6.14 | SPAG1 |
| LLDDTGLAY | BIR | 9 | 0.11272 | 11.13 | CNOT9 |
| TAAPVPTTL | BIR | 9 | 0.08674 | 320.51 | CNOT9 |
| SYQKVIELF | BIR and CTRL | 9 | −0.0111 | 1.92 | PBK |
| FPVRDGKIKL | BIR and CTRL | 10 | −0.0966 | 714.63 | KDM5B |
| FLDPRQPSY | BIR | 9 | −0.16862 | 95.31 | DCAF12 |
| Sequence | Group | Length | Immunogenicity | Binding Affinity (nM) | CTA |
|---|---|---|---|---|---|
| KKYAEDRERFF | BIR | 11 | 0.414 | 26,765.26 | KIF20B |
| AEDRERFF | BIR | 8 | 0.3043 | 4319.36 | KIF20B |
| DPFPAAIIL | BIR | 9 | 0.29185 | 7475.95 | PBK |
| GQSRLIFTY | BIR and CTRL | 9 | 0.23434 | 783.95 | KIF20B |
| LYPEVFEKF | BIR and CTRL | 9 | 0.20605 | 13,409.88 | ATAD2 |
| GQHLHLETF | BIR and CTRL | 9 | 0.12758 | 4437.84 | PRAME |
| LSAPIHTQM | BIR and CTRL | 9 | 0.12667 | 1147.05 | KNL1 |
| HTANIQTLI | BIR and CTRL | 9 | 0.05303 | 3629.06 | KNL1 |
| KQIYAIKY | BIR and CTRL | 8 | 0.02086 | 9150.76 | TTK |
| TKYLENQAF | BIR and CTRL | 9 | 0.00415 | 4136.18 | KIF2C |
| SYQKVIEL | BIR and CTRL | 8 | −0.00462 | 25,404.92 | PBK |
| SYQKVIELF | BIR and CTRL | 9 | −0.0111 | 6746.93 | PBK |
| LKNDKTIVF | BIR and CTRL | 9 | −0.0168 | 8977.57 | KNL1 |
| ETSKIETQI | BIR | 9 | −0.08177 | 23,727.05 | KIF20B |
| EIYNGKLFDL | BIR and CTRL | 10 | −0.08339 | 29,211.47 | KIF2C |
| FPVRDGKIKL | BIR and CTRL | 10 | −0.0966 | 24,543.03 | KDM5B |
| SKYAPSYY | BIR | 8 | −0.13148 | 28,744 | ATAD2 |
| TKIATKMGF | BIR | 9 | −0.21103 | 17,176.42 | KDM5B |
| ETASAMATL | BIR and CTRL | 9 | −0.22527 | 24,710.9 | KDM5B |
| SSSKYAPSYY | BIR and CTRL | 10 | −0.38842 | 15,093.97 | ATAD2 |
| Sequence | Group | Protein | −10LgP | Type | Binding Affinity (nM) | Binding Percentage (%) |
|---|---|---|---|---|---|---|
| LPIIQKVEPQ | HT29 BIR | PLIN2 L72V | 9.26 | SNV | 30,867.68 | 2.2(B*35:01) |
| FTPVEEFVP | HT29 CTRL | HAP1 A480V | 5.88 | SNV | 26,466.92 | 1.4(B*35:01) |
| KLSPYLAR | HT29 BIR | DNHD1 H2861Y | 6.73 | SNV | 19,405.62 | 32(A*01:01) |
| EVLLQLPT | HT29 BIR | C1orf87 P228L | 7.88 | SNV | 19,127.34 | 44(A*01:01) |
| EKPVHLHGPPA (Neo1) | HT29 BIR | MYO1E | 6.95 | Indel | 35,015.57 | 0.45(B*35:01) |
| PGPPLIPVPVGV | MCF7 BIR and CTRL | DNM2 A796V | 6.66 | SNV | 1058.45 | 0.12(A*02:01) |
| RIQRAYKLYR | MCF7 BIR | ASPM L3132R | 5.7 | SNV | 24,357.58 | 1.6(C*05:01) |
| LYLTAETLKNRM | MCF7 CTRL | NPIPB6 P232L | 6.77 | SNV | 20,515.42 | 0.63(B*44:02) |
| DGANRHITN | MCF7 BIR | CLPB S187N | 7.07 | SNV | 33,381.86 | 23(B*18:01) |
| GPISVPIPGPIS | MCF7 BIR | TPRX1 P204S | 7.54 | SNV | 35,104.33 | 3.8(C*05:01) |
| Sequence | Group | Length | Immunogenicity | Binding Affinity (nM) | CTA |
|---|---|---|---|---|---|
| DPFPAAIIL | BIR-3, BIR-6, and BIR-9 | 9 | 0.29185 | 330.78 | PBK |
| AYAIIKEEL | BIR-3 and BIR-9 | 9 | 0.21622 | 27.20 | ATAD2 |
| VYVPHIHVW | BIR-3, BIR-6, and BIR-9 | 9 | 0.21044 | 3.93 | ATAD2 |
| LYPEVFEKF | CTRL, BIR-3, BIR-6, and BIR-9 | 9 | 0.20605 | 2.46 | ATAD2 |
| SALPTVVAY | BIR-6 and BIR-9 | 9 | 0.1196 | 6.14 | SPAG1 |
| LLDDTGLAY | BIR-9 | 9 | 0.11272 | 11.13 | CNOT9 |
| TAAPVPTTL | CTRL, BIR-6, and BIR-9 | 9 | 0.08674 | 320.51 | CNOT9 |
| HANDQTVIF | BIR-6 | 9 | 0.05656 | 12.86 | KNL1 |
| IATSHNIVY | BIR-6 | 9 | 0.00798 | 11.59 | KNL1 |
| SYQKVIELF | BIR-3, BIR-6, and BIR-9 | 9 | −0.0111 | 1.92 | PBK |
| SFNEAMTQI | CTRL and BIR-6 | 9 | −0.06347 | 149.40 | KIF2C |
| EITGMNTL | BIR-6 | 8 | −0.09763 | 19,865.35 | KNL1 |
| DEAVGVQKW | BIR-6 and BIR-9 | 9 | −0.09766 | 67.79 | BLTP2 |
| KYAPSYYHV | BIR-3 | 9 | −0.14726 | 3.47 | ATAD2 |
| FLDPRQPSY | BIR-6 and BIR-9 | 9 | −0.16862 | 26.67 | DCAF12 |
| ETEESNLNMY | BIR-3 | 10 | −0.15265 | 33.81 | ATAD2 |
| EENQKRYYL | BIR-3, BIR-6, and BIR-9 | 9 | −0.28522 | 720.96 | ATAD2 |
| RYSGVNQSMLF | BIR-3 | 11 | −0.40891 | 3.18 | ATAD2 |
| Sequence | Group | Protein | −10LgP | Type | Immuno-Genicity | Binding Affinity (nM) | Binding Percentage |
|---|---|---|---|---|---|---|---|
| LRVQLHLKK | BIR-3 | DNAH3 P1197L | 22.69 | SNV | −0.21887 | 35,502.71 | 17.805 |
| LRVQPHLKK | — | DNAH3 WT | — | WT | — | 38,195.54 | 14.797 |
| SEIRHTANRW | BIR-6 and BIR-9 | HSPB1 D93N | 24.99 | SNV | 0.22619 | 11.18 | 0.0099 |
| SEIRHTADRW | — | HSPB1 WT | — | WT | — | 13.98 | 0.03 |
Disclaimer/Publisher’s Note: The statements, opinions and data contained in all publications are solely those of the individual author(s) and contributor(s) and not of MDPI and/or the editor(s). MDPI and/or the editor(s) disclaim responsibility for any injury to people or property resulting from any ideas, methods, instructions or products referred to in the content. |
© 2024 by the authors. Licensee MDPI, Basel, Switzerland. This article is an open access article distributed under the terms and conditions of the Creative Commons Attribution (CC BY) license (https://creativecommons.org/licenses/by/4.0/).
Share and Cite
Zhang, W.; Sun, S.; Zhu, W.; Meng, D.; Hu, W.; Yang, S.; Gao, M.; Yao, P.; Wang, Y.; Wang, Q.; et al. Birinapant Reshapes the Tumor Immunopeptidome and Enhances Antigen Presentation. Int. J. Mol. Sci. 2024, 25, 3660. https://doi.org/10.3390/ijms25073660
Zhang W, Sun S, Zhu W, Meng D, Hu W, Yang S, Gao M, Yao P, Wang Y, Wang Q, et al. Birinapant Reshapes the Tumor Immunopeptidome and Enhances Antigen Presentation. International Journal of Molecular Sciences. 2024; 25(7):3660. https://doi.org/10.3390/ijms25073660
Chicago/Turabian StyleZhang, Weiyan, Shenghuan Sun, Wenyuan Zhu, Delan Meng, Weiyi Hu, Siqi Yang, Mingjie Gao, Pengju Yao, Yuhao Wang, Qingsong Wang, and et al. 2024. "Birinapant Reshapes the Tumor Immunopeptidome and Enhances Antigen Presentation" International Journal of Molecular Sciences 25, no. 7: 3660. https://doi.org/10.3390/ijms25073660
APA StyleZhang, W., Sun, S., Zhu, W., Meng, D., Hu, W., Yang, S., Gao, M., Yao, P., Wang, Y., Wang, Q., & Ji, J. (2024). Birinapant Reshapes the Tumor Immunopeptidome and Enhances Antigen Presentation. International Journal of Molecular Sciences, 25(7), 3660. https://doi.org/10.3390/ijms25073660