Article

Cellooligomer/CELLOOLIGOMER RECEPTOR KINASE1 Signaling Exhibits Crosstalk with PAMP-Triggered Immune Responses and Sugar Metabolism in Arabidopsis Roots

1
Matthias Schleiden Institute of Genetics, Bioinformatics and Molecular Botany, Department of Plant Physiology, Friedrich-Schiller-University Jena, Dornburger Str. 159, 07743 Jena, Germany
2
Department of Biochemistry, Max-Planck-Institute for Chemical Ecology, Hans Knöll Str. 8, 07745 Jena, Germany
3
Research Group Plant Defense Physiology, Max Planck Institute for Chemical Ecology, Hans Knöll Str. 8, 07745 Jena, Germany
*
Author to whom correspondence should be addressed.
Int. J. Mol. Sci. 2024, 25(6), 3472; https://doi.org/10.3390/ijms25063472
Submission received: 25 February 2024 / Revised: 12 March 2024 / Accepted: 14 March 2024 / Published: 19 March 2024
(This article belongs to the Special Issue Latest Research on Plant Cell Wall)

Abstract

:
The degradation of cellulose generates cellooligomers, which function as damage-associated molecular patterns and activate immune and cell wall repair responses via the CELLOOLIGOMER RECEPTOR KINASE1 (CORK1). The most active cellooligomer for the induction of downstream responses is cellotriose, while cellobiose is around 100 times less effective. These short-chain cellooligomers are also metabolized after uptake into the cells. In this study, we demonstrate that CORK1 is mainly expressed in the vascular tissue of the upper, fully developed part of the roots. Cellooligomer/CORK1-induced responses interfere with chitin-triggered immune responses and are influenced by BRASSINOSTEROID INSENSITIVE 1-ASSOCIATED RECEPTOR KINASE1 and the receptor kinase FERONIA. The pathway also controls sugar transporter and metabolism genes and the phosphorylation state of these proteins. Furthermore, cellotriose-induced ROS production and WRKY30/40 expression are controlled by the sugar transporters SUCROSE-PROTON SYMPORTER1, SUGARS WILL EVENTUALLY BE EXPORTED TRANSPORTER11 (SWEET11), and SWEET12. Our data demonstrate that cellooligomer/CORK1 signaling is integrated into the pattern recognition receptor network and coupled to the primary sugar metabolism in Arabidopsis roots.

1. Introduction

The plant cell wall is a natural barrier against abiotic and biotic stress [1,2,3]. Breakdown of the cell wall results in the apoplastic accumulation of oligosaccharides, which are recognized by cell surface receptors as damage-associated molecular patterns (DAMPs). The pattern recognition receptors (PRRs) for the breakdown products of pectin and oligogalacturonides are WALL-ASSOCIATED KINASES [4], and for cellooligomers derived from cellulose is the CELLOOLIGOMER RECEPTOR KINASE1 (CORK1)/IMPAIRED IN GLUCAN PERCEPTION1 (IGP1) [5,6]. The perception of mixed-linkage β-1,3/1,4-glucan oligosaccharides from the breakdown of some hemicelluloses involves IGP2/3 and IGP4 [6], CHITIN ELICITOR RECEPTOR KINASE1 (CERK1), and the LysM-containing receptor-like kinases 4 and 5 (LYK4 and LYK5) [7,8,9]. Breakdown of callose results in the accumulation of non-branched β-1,3-glucan oligosaccharides perceived by CERK1, LYK4, and LYK5 [7]. Xyloglucans from hemicellulose function as DAMPs in different plant systems; however, a receptor has not yet been identified [10]. Cellooligosaccharide perception is considered as an alarm system which informs the cell about the integrity of its wall [11]. Besides cell wall repair mechanisms, the responses triggered by cell wall degradation products overlap with those triggered by pathogen-associated molecular patterns (PAMPs) from pathogens [12]. Furthermore, cell wall degradation products are energy sources for the plant cells as well as for their interacting microbes [13].
Cellulose breakdown generates cellooligomers, of which those with 2–7 glucose moieties induce cytoplasmic Ca2+ ([Ca2+]cyt) elevation, reactive oxygen species (ROS) generation, plasma membrane depolarization, alterations in the phosphorylation patterns of numerous proteins, and defense gene activation via MAPK3/6 signaling [5,6,14,15]. Among the rapidly stimulated genes which respond to cellooligomer application to Arabidopsis roots are the WRKY30 and WRKY40 transcription factors [5]. Cellotriose (CT) is the most active cellooligomer [14], and CT and cellopentaose bind to the ectodomain of CORK1/IGP1, a leucine-rich repeat (LRR)-malectin receptor kinase [6]. Furthermore, the CYTOPLASMIC Ca2+ ELEVATION MUTANT (CYCAM) protein, which is the only poly(A)-ribonuclease in Arabidopsis, is required for the CT-induced responses in Arabidopsis [14]. Among the rapidly phosphorylated proteins upon CT application to wild-type roots, but not cork1 roots, are BRASSINOSTEROID INSENSITIVE 1-ASSOCIATED RECEPTOR KINASE1 (BAK1) and FERONIA (FER) [5], suggesting crosstalk between CORK1, BAK1, and FER signaling. BAK1 is the coreceptor of many PRRs, including BRASSINOSTEROID INSENSITIVE1 (BRI1), FLAGELLIN-SENSITIVE2 (FLS2) [16,17,18,19], EF-TU RECEPTOR, and PEP1 RECEPTOR1/2 [20,21,22,23,24,25], and it interacts with ERECTA and ERECTA-LIKE1, which recognize the peptides EPIDERMAL PATTERNING FACTOR1 (EPF1) and EPF2 involved in stomatal development and patterning [26]. BAK1 also participates in ROOT GROWTH FACTOR RECEPTOR 1 (RGFR1) and RGFR5 signaling, which perceive ROOT GROWTH FACTOR peptides and mediate root meristem development [27,28]. FER is involved in growth and development, biotic and abiotic stress responses, and reproduction [29,30]. Furthermore, since cellooligomer-induced responses overlap with those induced by chitin [14], we compared them with responses induced by chitin to investigate whether there was crosstalk between the signaling pathways in Arabidopsis roots. Networks between PRRs, coreceptors, and associated signaling components have been well investigated [31,32]; however, whether there is crosstalk between the cellooligomer/CORK1 pathway and other PRRs has not yet been studied.
Cellulose degradation by plant and microbial enzymes generates short-chain cellooligomers and ultimately glucose, which are both taken up by the cell. It is believed that most of the degradation products are utilized for cell wall regeneration [33]; however, it is also possible that some of them are integrated into the primary sugar metabolism and serve as an energy source. The availability of reduced carbon also impacts the growth of the symbiotic and pathogenic microorganism associated with the hosts [13,33]. SUGAR TRANSPORTER PROTEINs (STPs) are proton-coupled symporters responsible for the uptake of glucose from the apoplast into plant cells, where they function as key signaling molecules and play a vital role in plant responses to stressors such as dehydration and prevalent fungal infections [34,35]. The SUGARS WILL EVENTUALLY BE EXPORTED TRANSPORTERS (SWEETs) redirect sugars in the plant tissues and deprive colonizing microorganisms of reduced carbon, thereby interfering with the innate immune responses [34,36]. Multiple studies suggest that there is crosstalk between the oligosaccharide/DAMP-triggered cell wall surveillance systems and the primary sugar metabolism in the plant cell. STP13 affects glucose transport, activates biotic and abiotic stress signaling, and confers basal resistance against pathogens [37,38,39]. Trehalose-6-phosphate is a central regulator of sugar metabolism in plants and modulates basal defense responses [40,41,42]. The systemic defense signaling molecules AZELAIC ACID INDUCED1 and glycerol-3-phosphate are connected to sugar signaling [43,44]. AZELAIC ACID INDUCED1 is a protein which is required for azelaic acid transport, or the transport of an azelaic acid-induced signal to activate immune responses in systemic tissues [43]. Moreover, Kohorn et al. [45] have shown that cell wall sensing via pectin breakdown regulates the vacuolar invertase involved in the solute sugar metabolism. The cellulose breakdown product cellobiose (CB) stimulates the primary sugar metabolism and evokes innate immune responses [46]. The stimulation of immune responses by cellooligomers may result in a shift of the growth/defense balance towards defense, which not only inhibits growth and activates defense gene expression but also affects the amino acid profile [47,48,49]. Under unfavorable conditions, specific stress-related amino acids accumulate for counteracting stress situations, as well as redox, metabolic, and osmotic imbalances [49]. Here, we present evidence that cellooligomer/CORK1 signaling controls genes involved in sugar distribution and metabolism, and that sugar transport mutants are impaired in immune responses elicited by cellooligomer/CORK1 signaling. Our study demonstrates that cellooligomer/CORK1 signaling is integrated into the PRR network that is active in Arabidopsis roots and coupled to the primary sugar metabolism.

2. Results

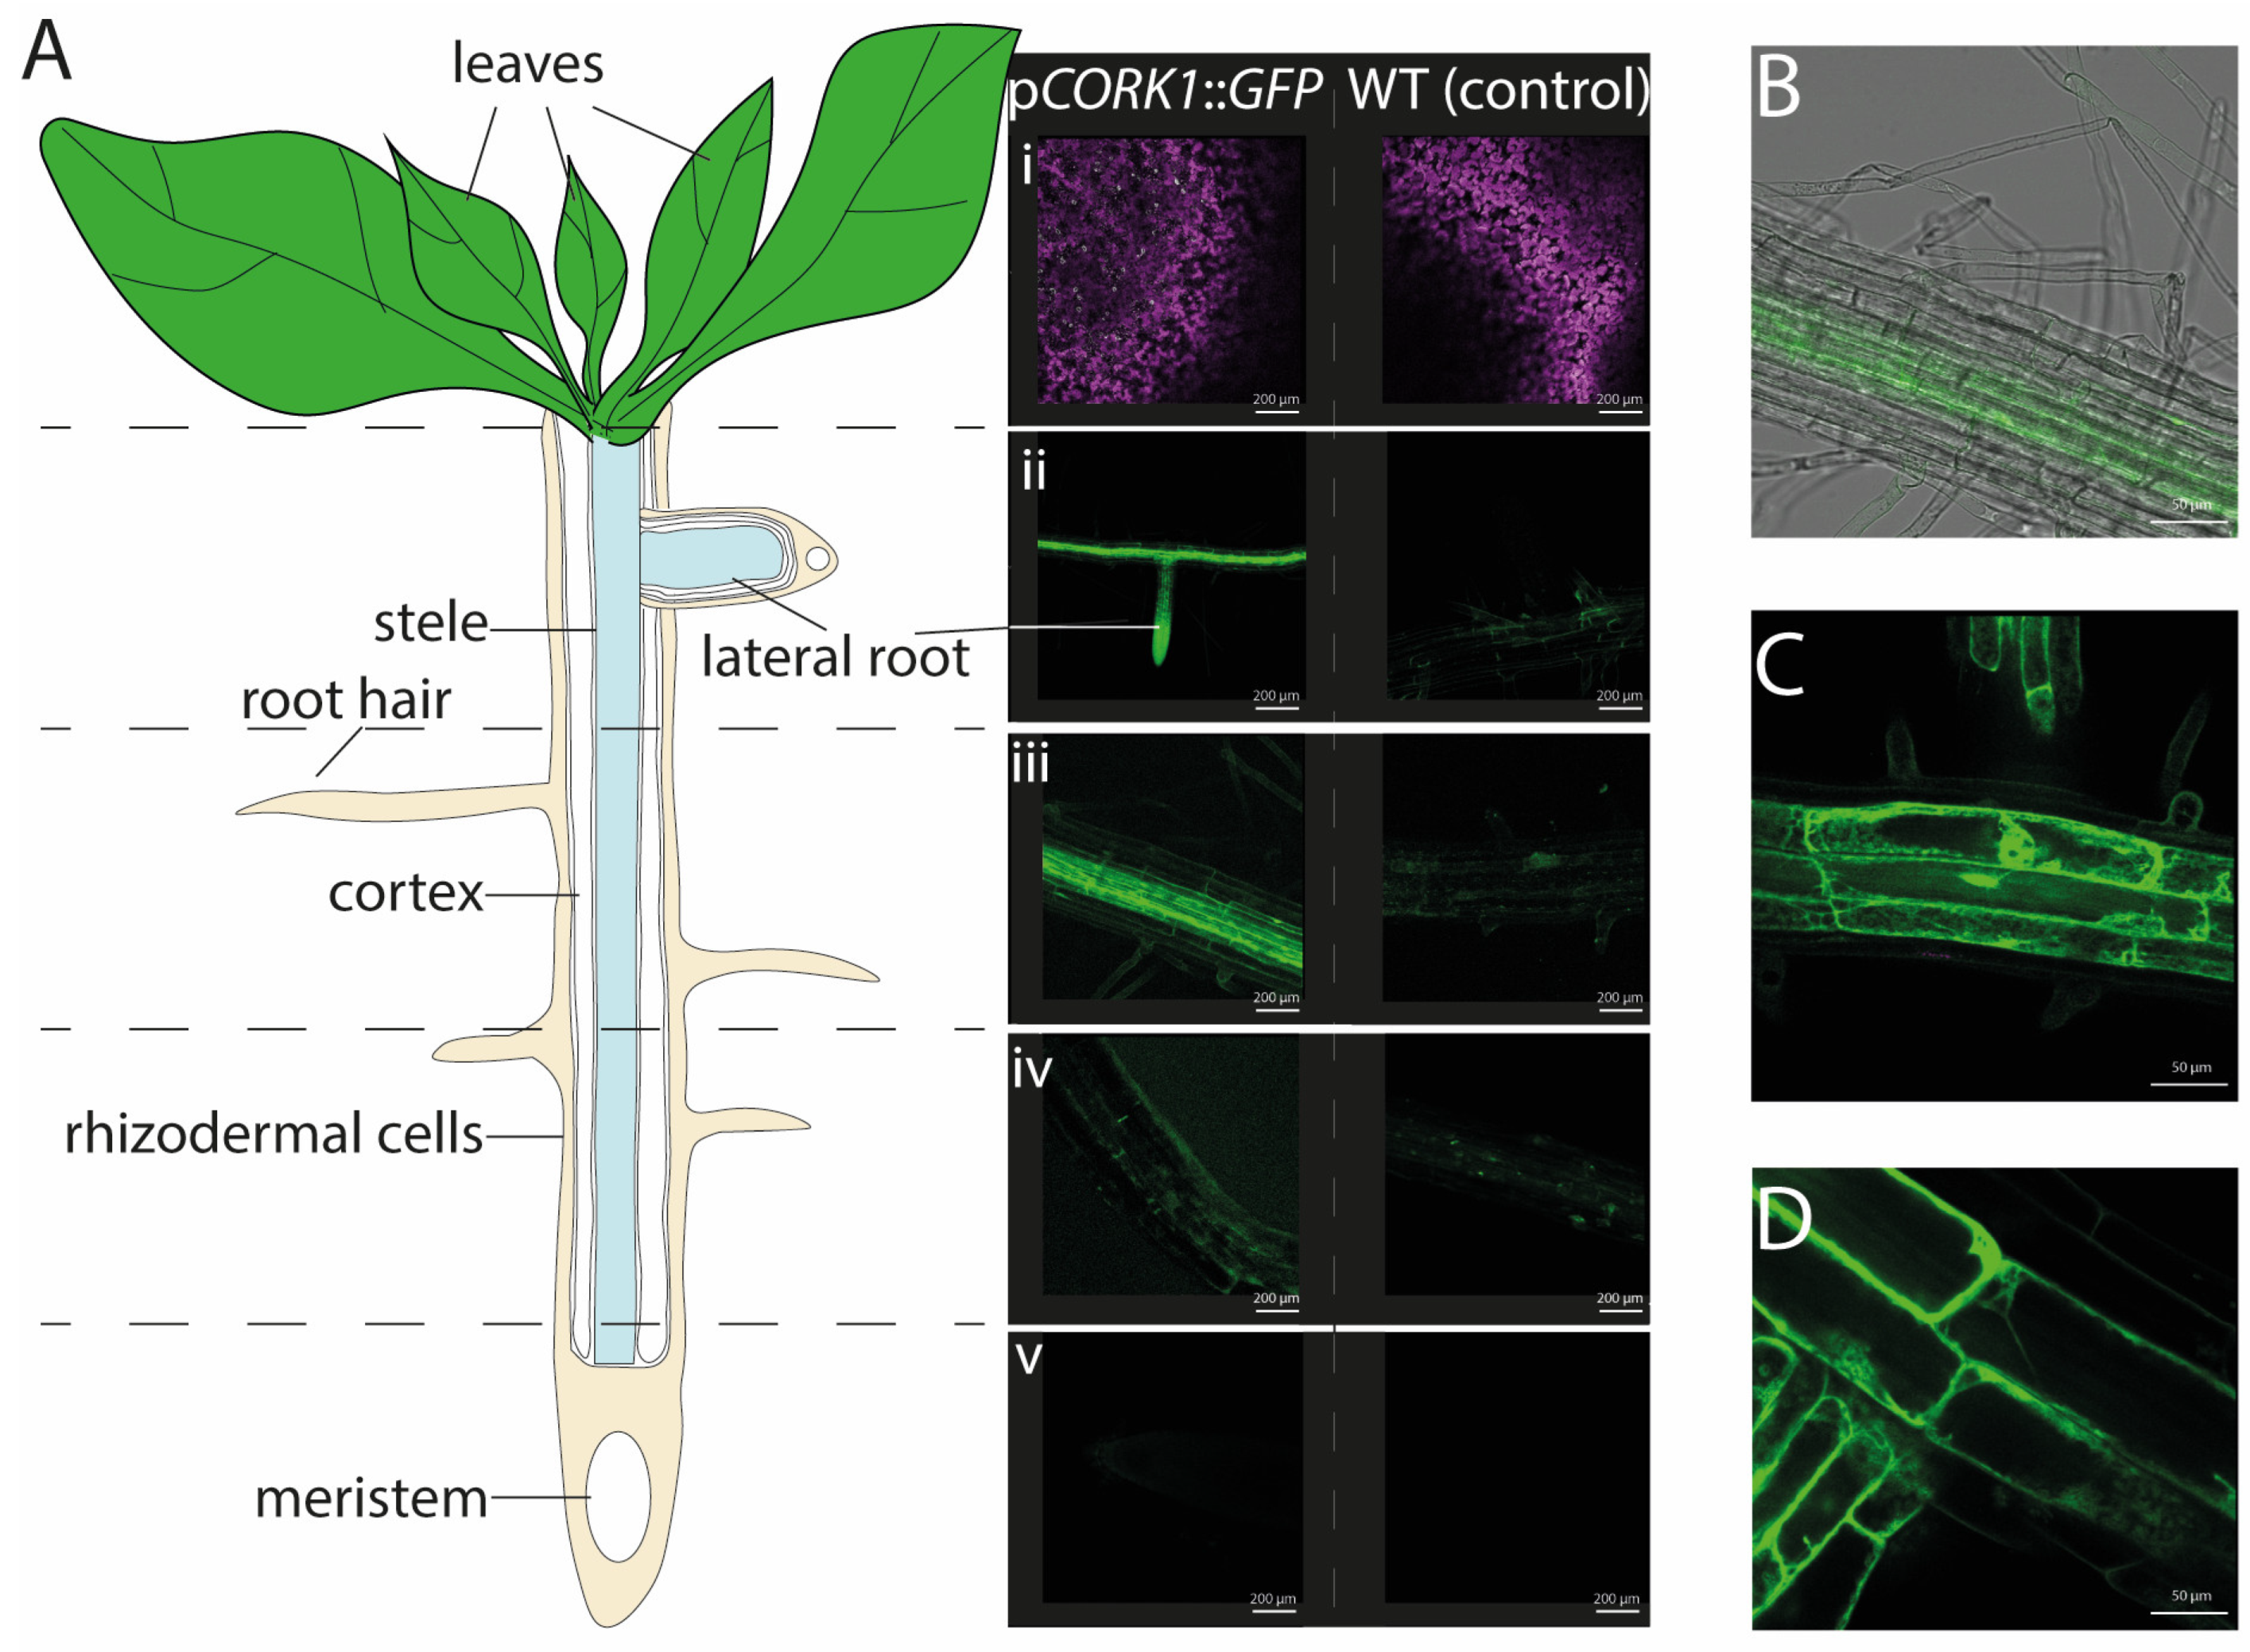
2.1. CORK1 Localization

Expression profiles [5] and the response patterns of Arabidopsis seedlings to cellooligomer treatments [5,14] suggest that CORK1 is mainly active in the roots. In this study, confocal laser scanning microscopy of Arabidopsis seedlings expressing a CORK1 promoter::GFP fusion construct confirmed that GFP signals were preferentially detectable in the roots and barely in the leaf and stem tissues (Figure 1A). The highest fluorescence was found in the upper part of the main roots, the root stele, the cortical tissue, as well as in the lateral roots emerging from them. Interestingly, the tips of these lateral roots emitted quite high fluorescence (Figure 1A(ii)). Furthermore, the GFP activity was mainly detectable in the vascular tissue (Figure 1A,B), not in the rhizodermal, subepidermal, or epidermal cell layers, nor in the root hairs (Figure 1B). When sections from the lower part of the roots were analyzed, the activity appeared to decline gradually towards the root tip. GFP signals were still measurable in the elongation zone, while no fluorescence was visible in the root tip (Figure 1A). At the cellular level, the fluorescence signals from the soluble GFP were visible in the cytoplasm between the large vacuole and the plasma membrane, often enriched around the nucleus (Figure 1C,D). Taken together, the CORK1 promoter appears to be mainly active in the vascular tissue of the upper part of the roots. This is consistent with RT-qPCR analyses which show that the CORK1 transcript level is significantly higher in roots than in shoots of 14-day-old Arabidopsis seedlings (roots: 22.2 ± 0.5; shoots 3.1 ± 0.3 ****; n = 9).

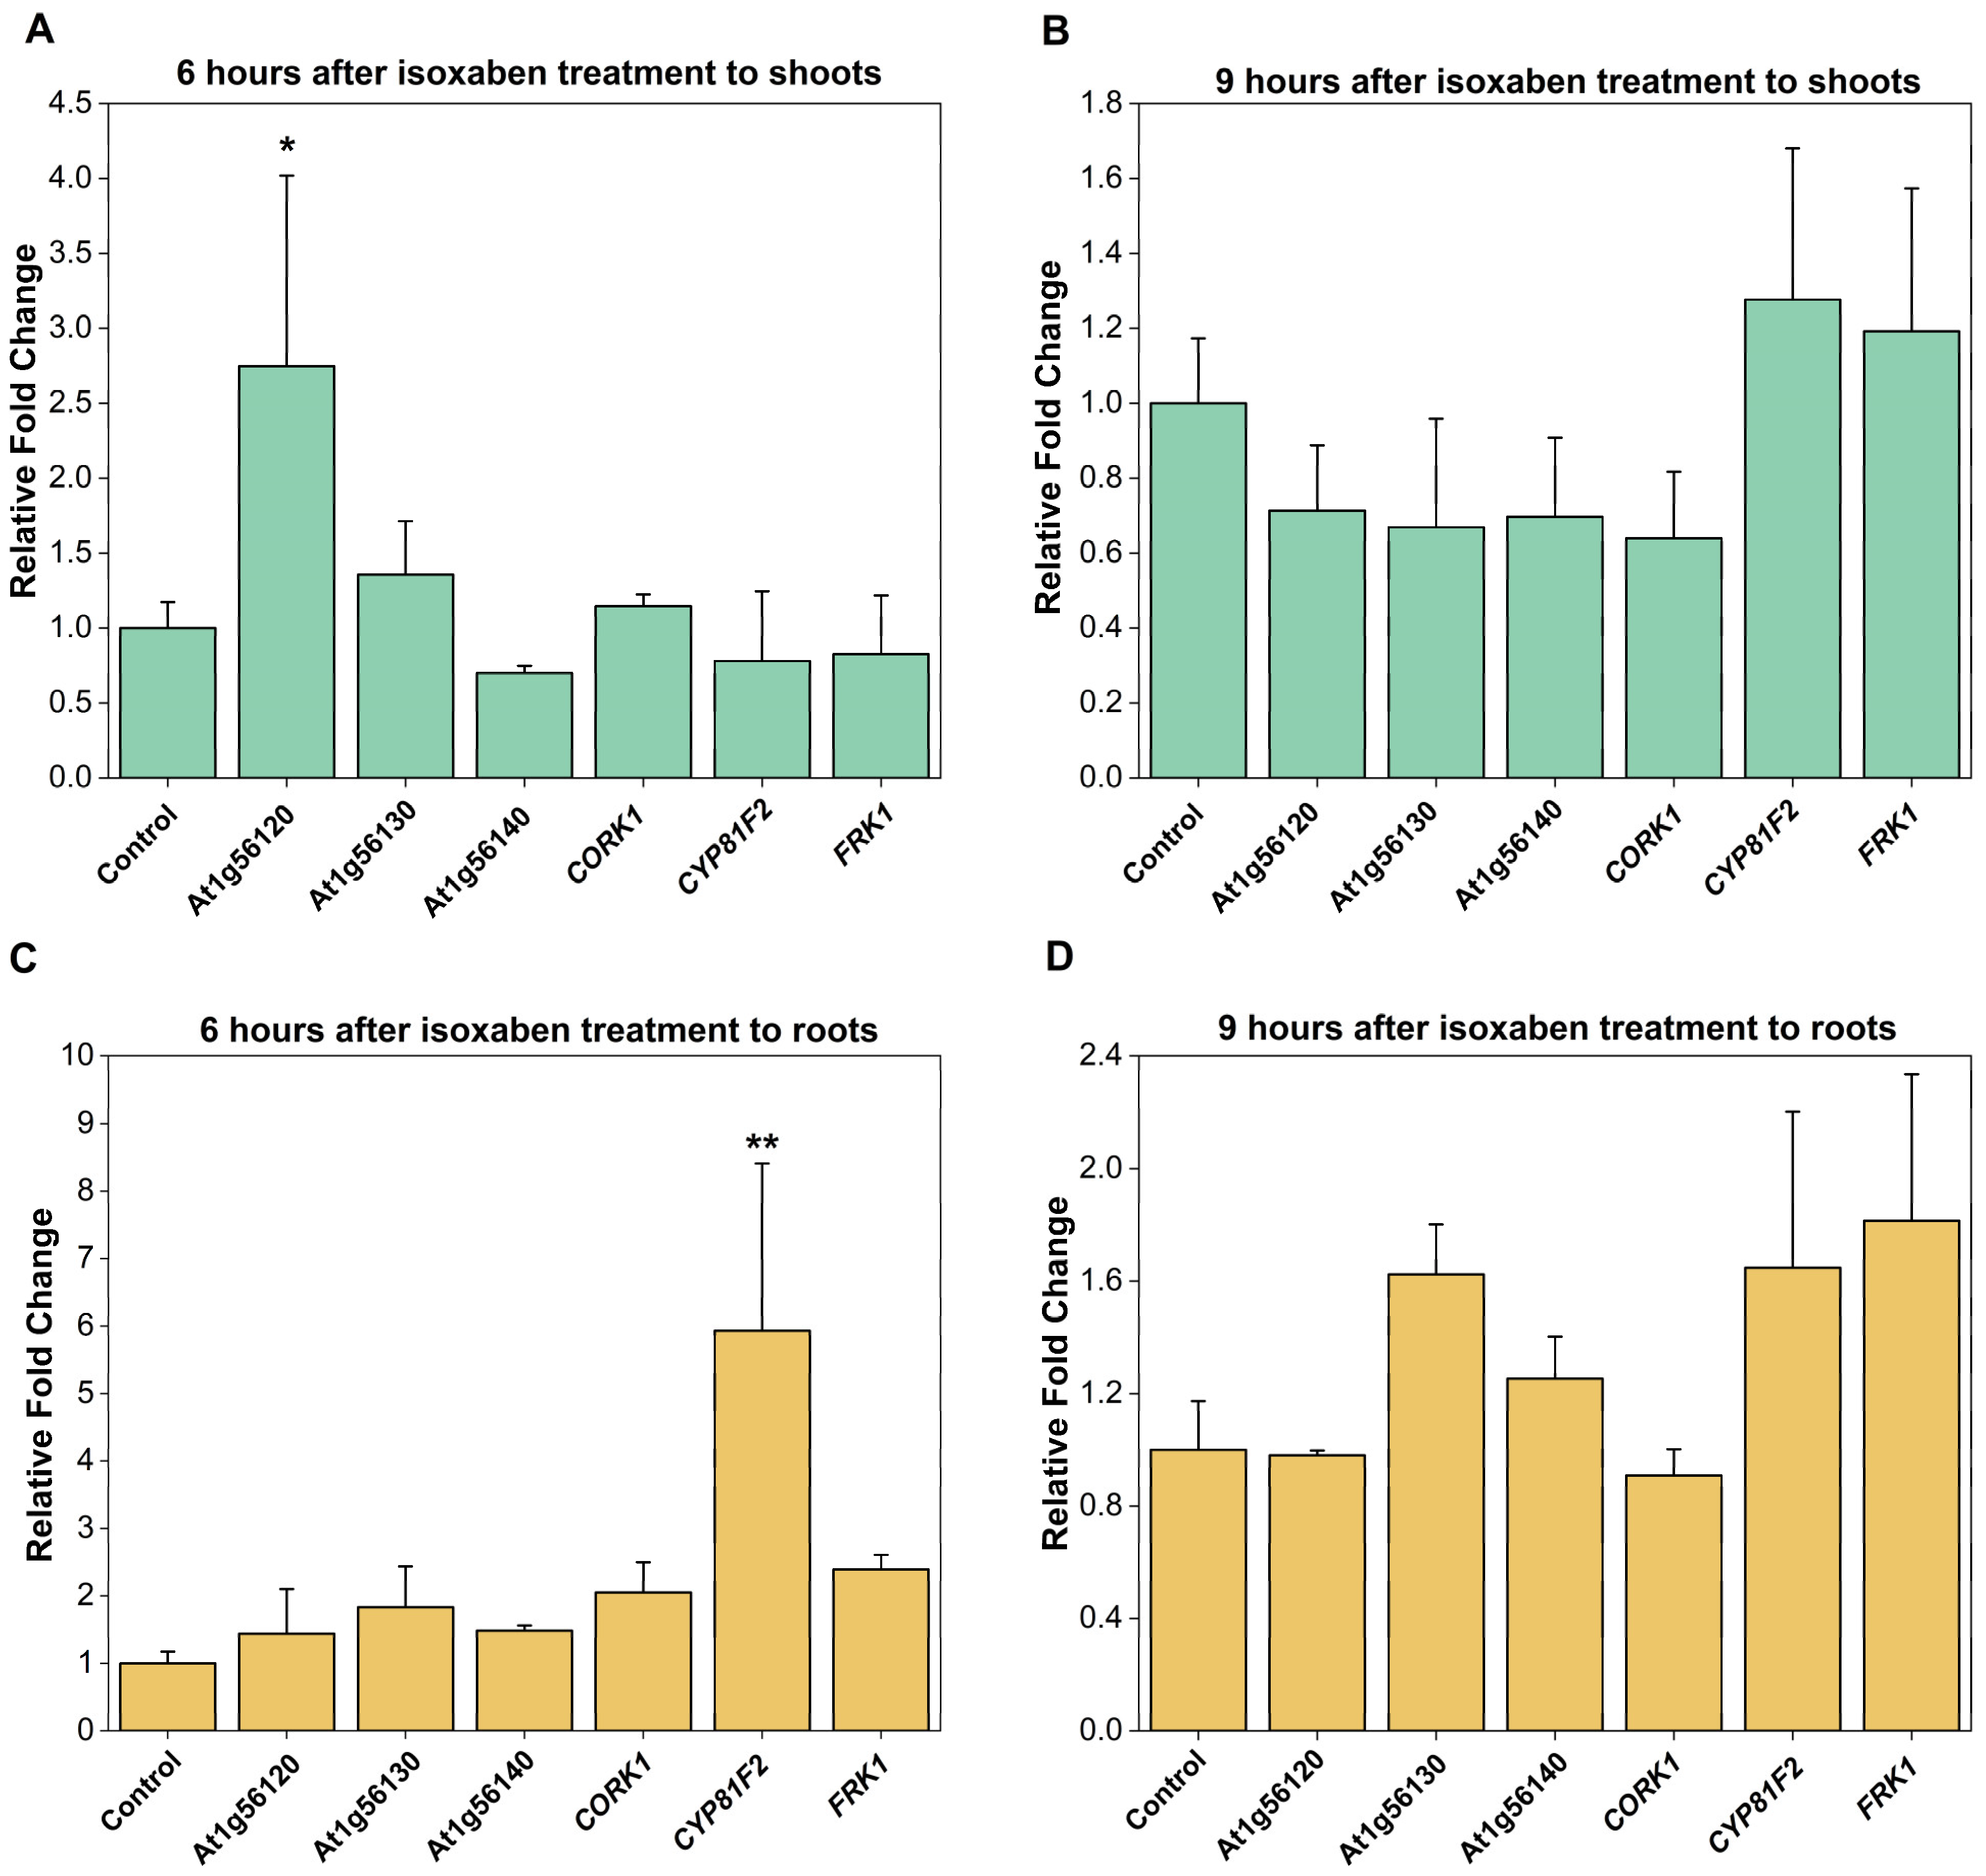
2.2. CORK1 Expression Is Not Stimulated by Isoxaben (ISX)

CORK1, and the phylogenetically related At1g56130 (IGP2/3) and At1g56140 (IGP4) have been shown to be involved in glycan perception, and knock-out or point mutation mutants are defective in the activation of pattern-triggered immunity mediated by CT (CORK1) or mixed-linked β-1,3/β-1,4-glucan oligosaccharides (At1g56130 and At1g56140), but not by fungal chitin oligosaccharides [5,6]. When ISX, which inhibits cellulose biosynthesis and thus impairs proper de novo cell wall biosynthesis [50], was applied to Arabidopsis roots for 6 or 9 h, we observed no effect on the expression of CORK1 and the related malectin-containing receptor kinase genes At1g56130 and At1g56140 in the roots (Figure 2). Only the uncharacterized At1g56120 gene, which is closely related to the CORK1, IGP2/3, and IGP4 genes, and also a member of the LRR-malectin domain-receptor kinase gene subfamily [6,10], was significantly upregulated in the shoots (cf. Section 3). These results suggest that the CORK1, At1g56130, and At1g56140 genes do not respond to the inhibition of cellulose biosynthesis (cf. Section 3).

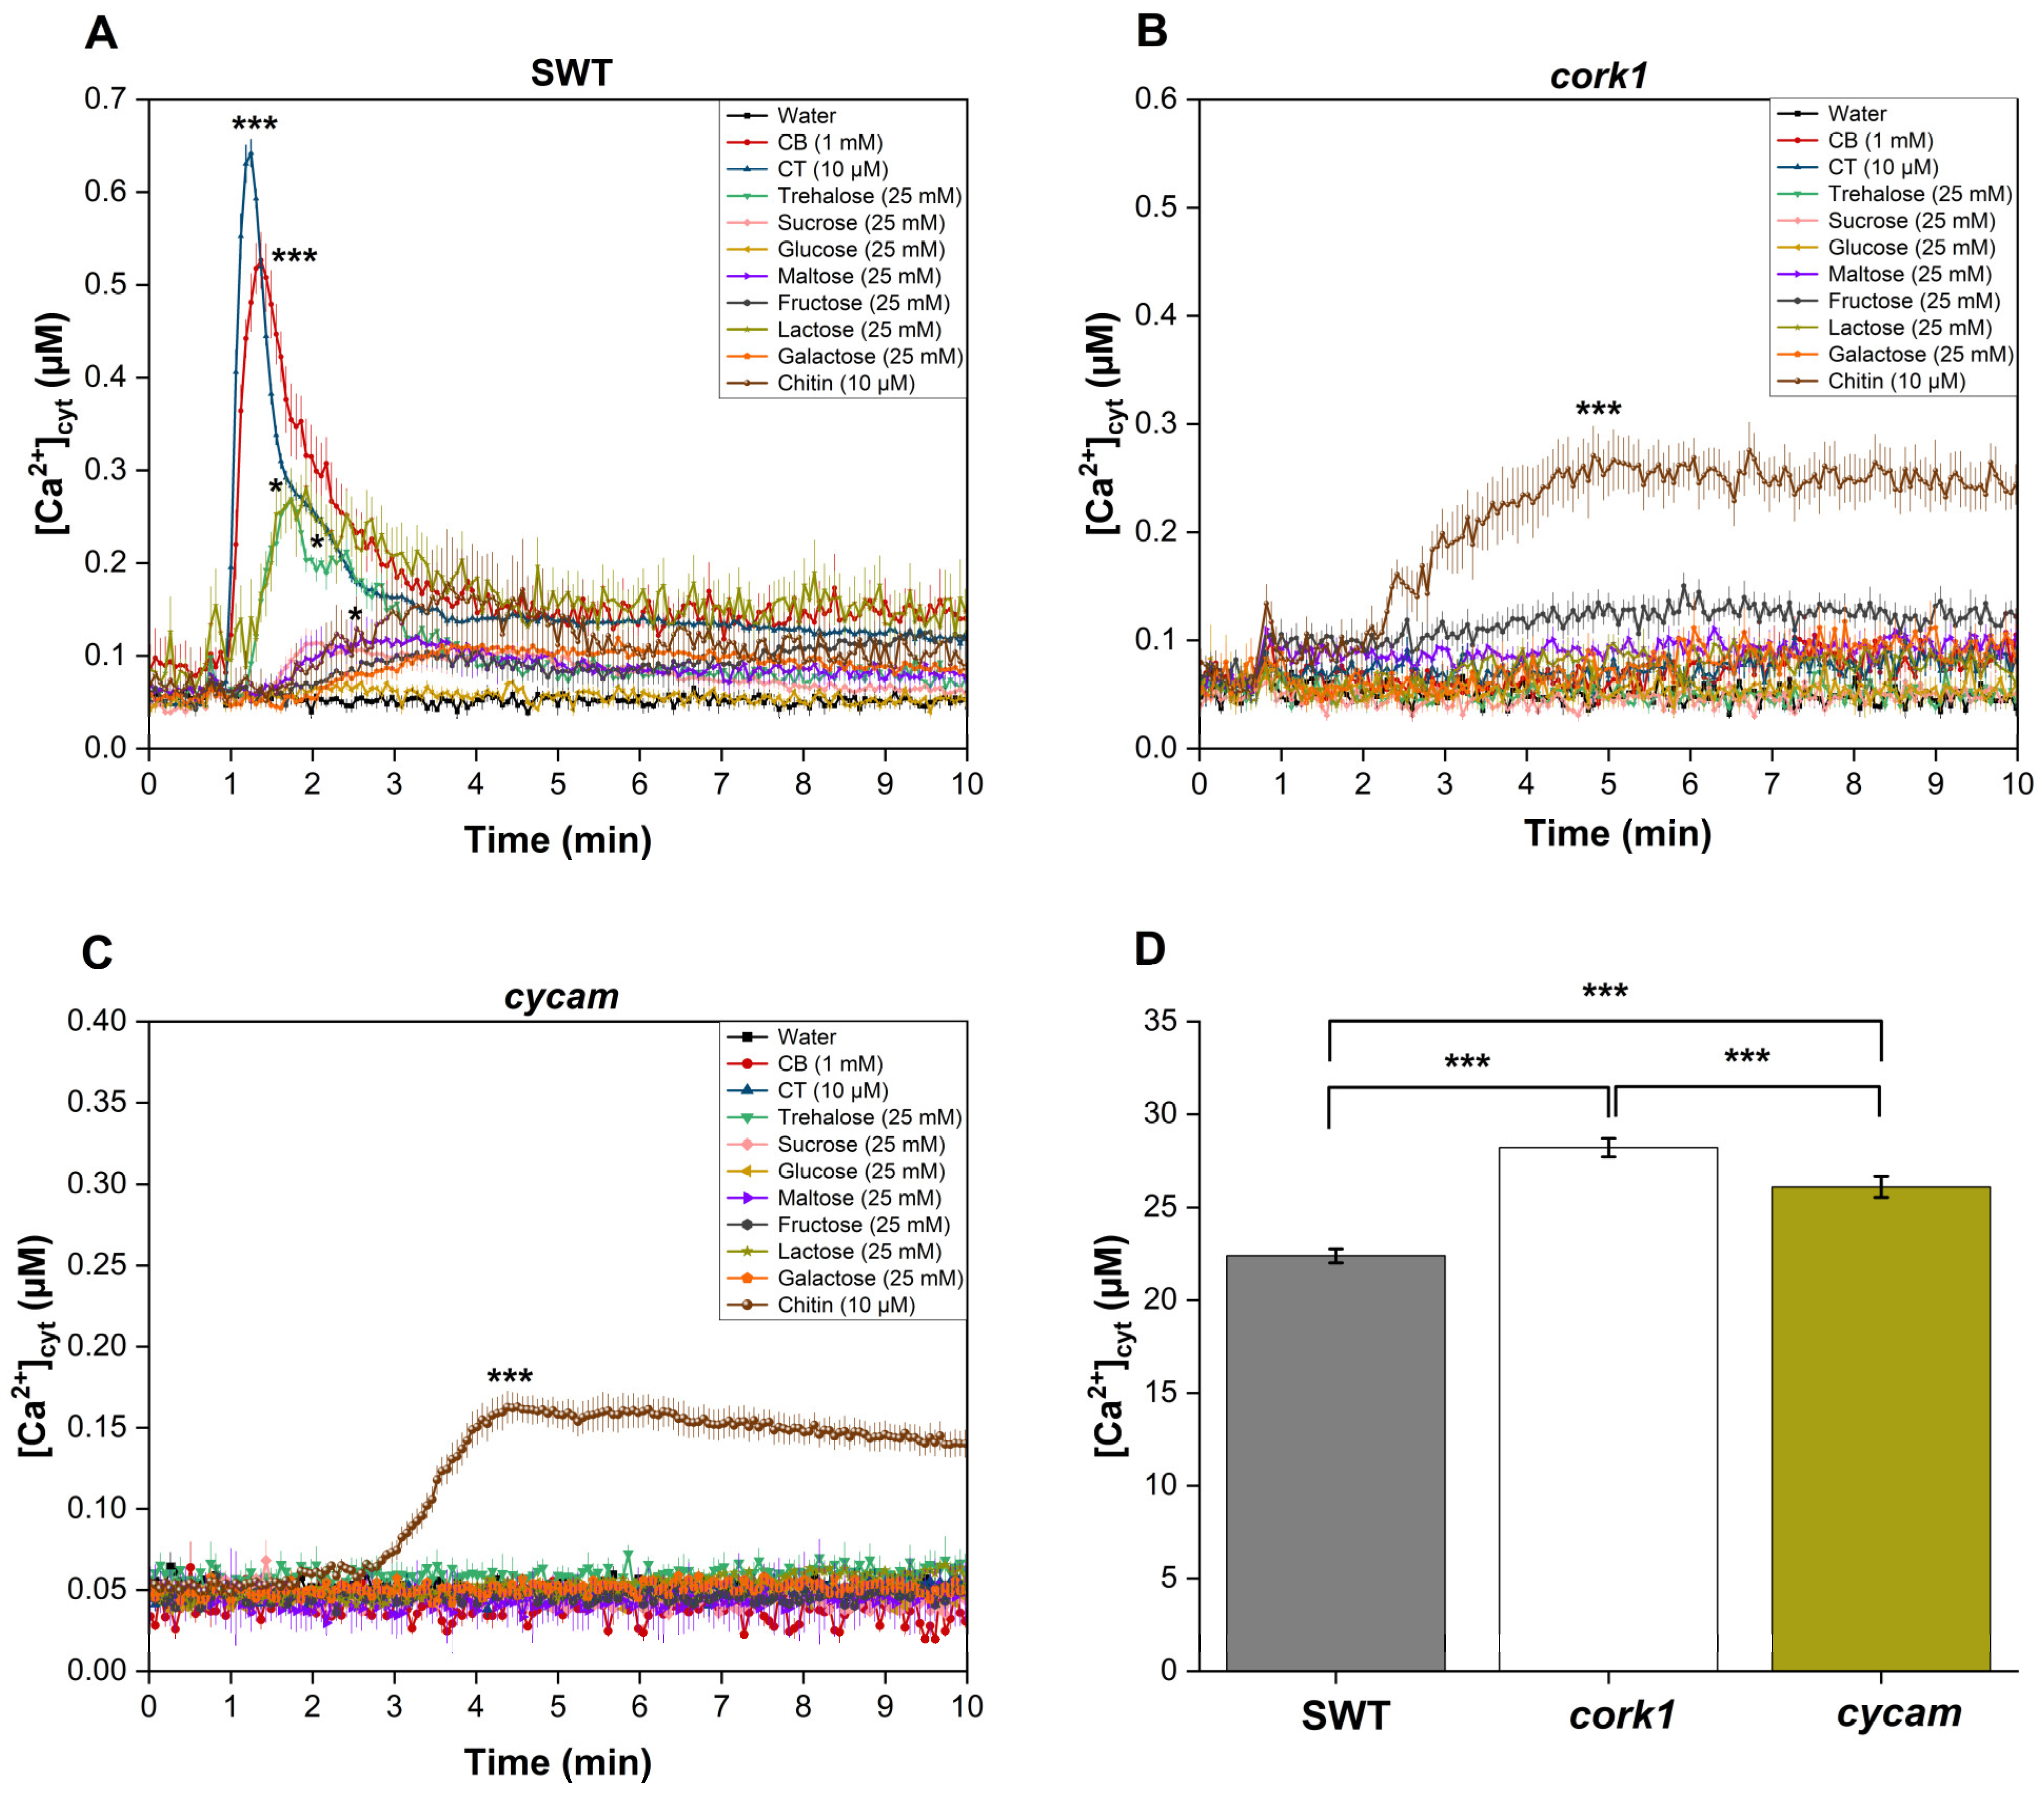
2.3. Activation of CORK1-Dependent Responses by Disaccharides

Previous studies have suggested that cellooligomers with 2–7 glucose moieties are perceived by root cells [14]. CB was intensively studied by Souza et al. [51]. CT, the most active cellooligomer, activated various CORK1-dependent cellular responses [5]. Martin-Dacal et al. [6] demonstrated the binding of CT and cellopentaose to the ectodomain of the LRR-malectin receptor kinase CORK1/IGP1. The mammalian malectin proteins recognize the disaccharides maltose and, to a lesser extent, nigerose [52]. Therefore, we tested whether disaccharides other than CB induce cellular responses in Arabidopsis roots of the segregating wild-type (SWT), but not cork1 mutant seedlings. CORK1-dependent [Ca2+]cyt elevation (Figure 3), ROS production (Figure 4), and WRKY30 and WRKY40 expression (Figure 5) were stimulated by 10 µM CT. WRKY30 and WRKY40 have been previously identified to be strongly upregulated after CT application to Arabidopsis roots [5,51]. Therefore, the two genes are ideal for assaying cellooligomer-induced changes in gene expression. CORK1-dependent responses to CB required at least 1 mM, while those induced by lactose and trehalose required 25 mM. An amount of 25 mM sucrose, glucose, maltose, fructose, nigerose, or galactose did not induce the three cellular responses in a CORK1-dependent manner. Furthermore, the previously characterized cycam mutant, which is impaired in the poly(A)-ribonuclease in Arabidopsis [14], also failed to induce [Ca2+]cyt elevation (Figure 3), ROS production (Figure 4), and WRKY30/40 expression (Figure 5) in response to CT (10 µM) [14], CB (1 mM), and lactose and trehalose (25 mM). Although the high disaccharide concentrations are unphysiological, the differences in the responses of the SWT and cork1/cycam seedlings observed for lactose and trehalose demonstrated a requirement of CORK1 and the poly(A)ribonuclease for the induction of the responses. Apparently, CORK1 and the poly(A) ribonuclease are common signaling components for the responses induced by CT and the three disaccharides (cf. Section 3).

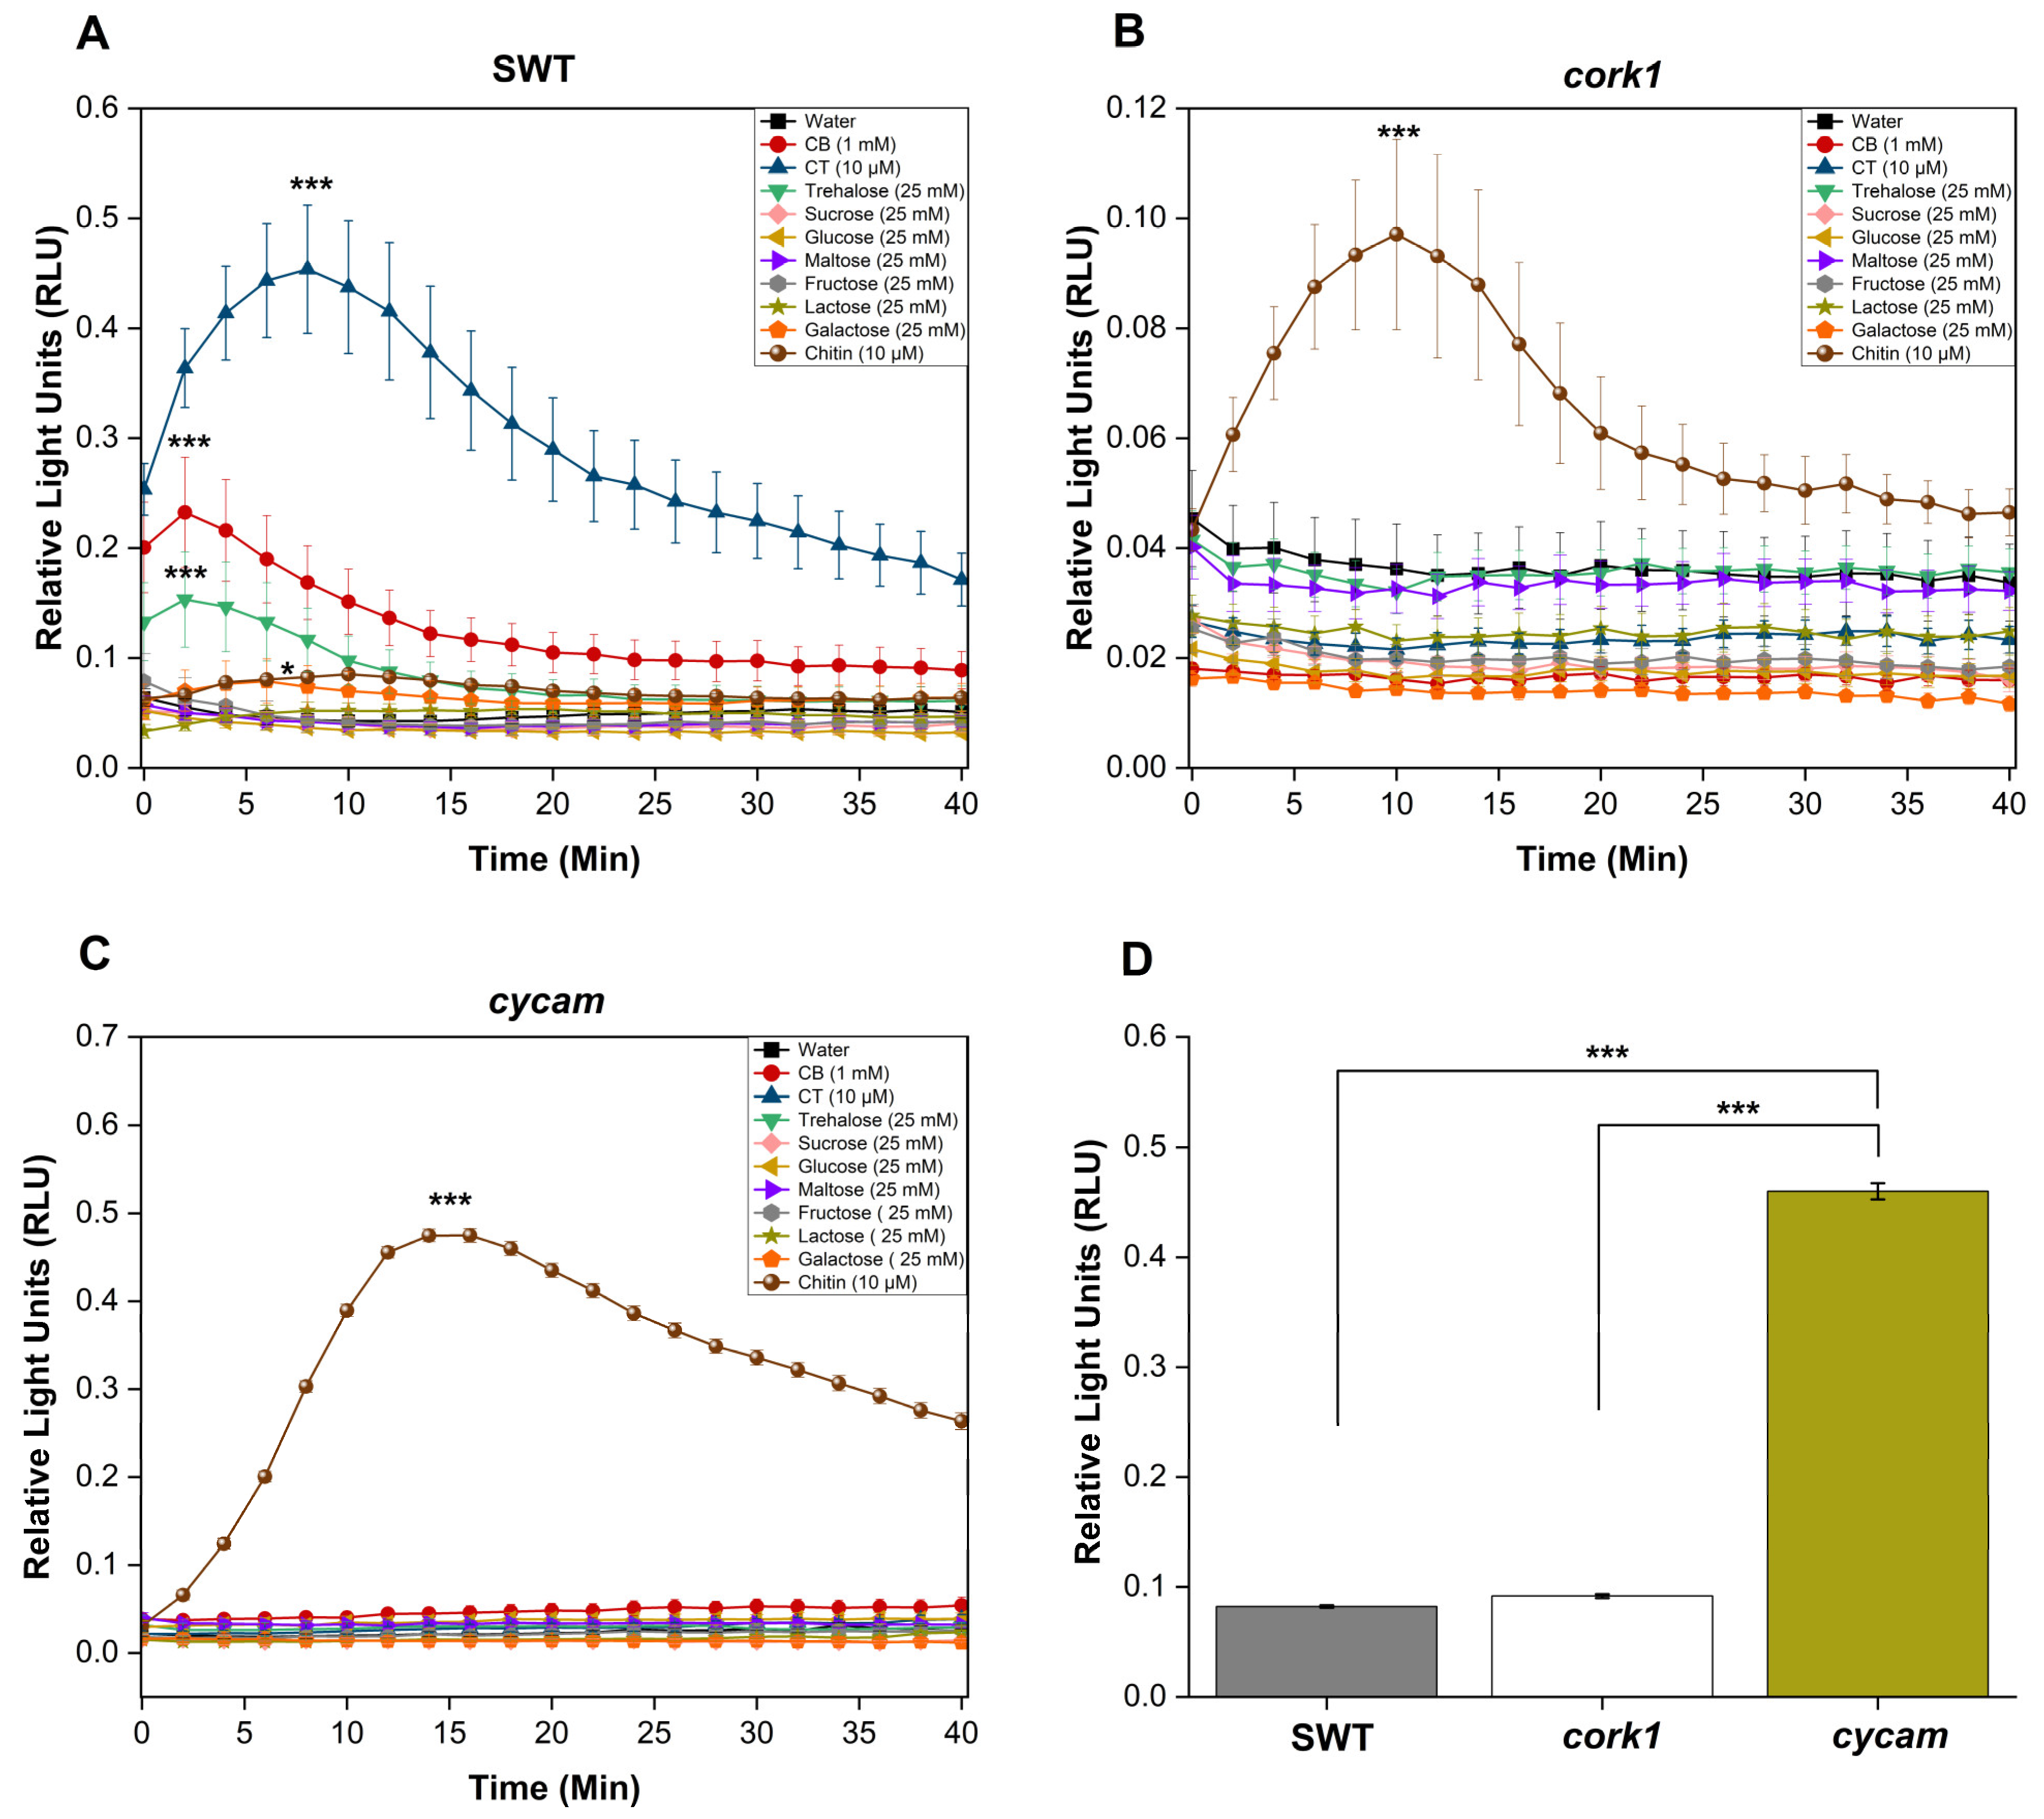
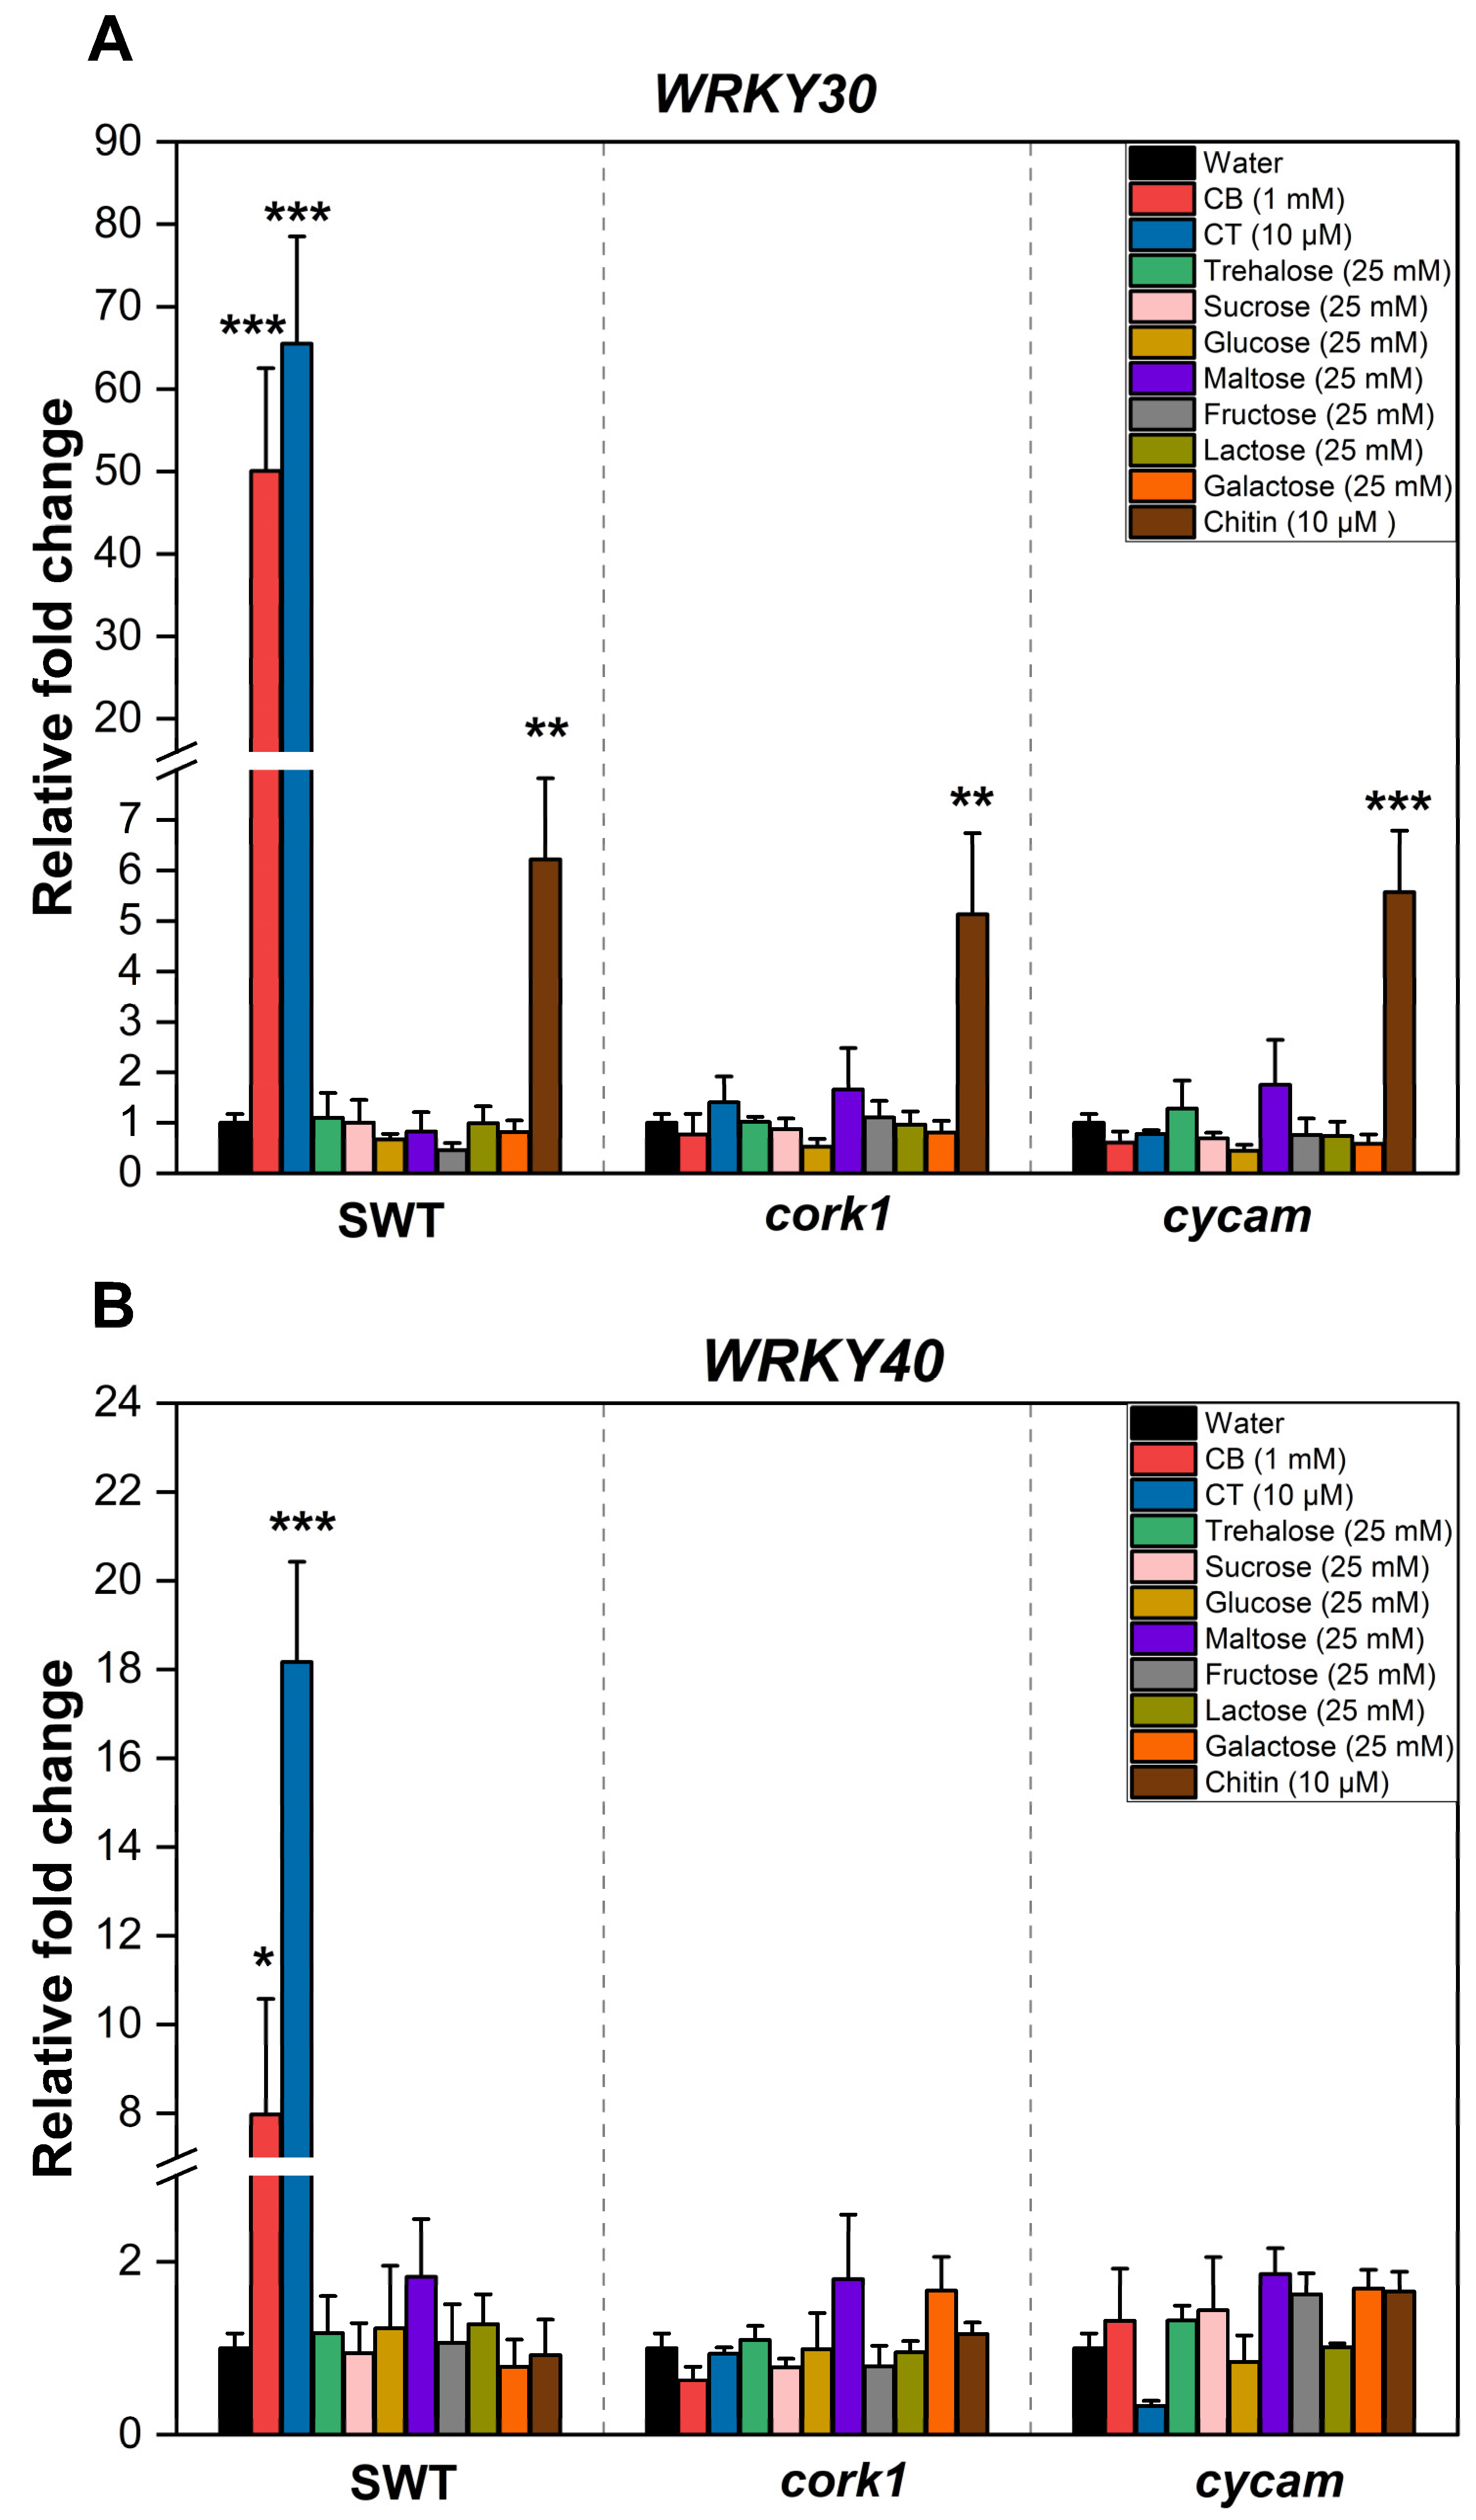
2.4. Crosstalk between CT and Chitin Signaling

Chitin induces [Ca2+]cyt elevation (Figure 3), ROS production (Figure 4), and WRKY30/40 expression (Figure 5) in the SWT, cork1, and cycam mutants; however, we observed marked differences. The [Ca2+]cyt elevation in response to chitin application was significantly lower in the SWT compared to both mutants, indicating that CORK1 and CYCAM inhibit chitin-induced [Ca2+]cyt elevation (Figure 3D). Moreover, ROS production in response to chitin application was comparable for the SWT and the cork1 mutant but significantly higher in the cycam mutant (Figure 4D). This suggests crosstalk between the CT- and chitin-triggered signaling pathways, and that CORK1 and CYCAM have different effects on the two responses (cf. Section 3). No significant differences were observed for the chitin-induced WRKY30 and WRKY40 expression (Figure 5). Thus, the increase in [Ca2+]cyt elevation does not correlate quantitatively with the regulation of the defense genes.

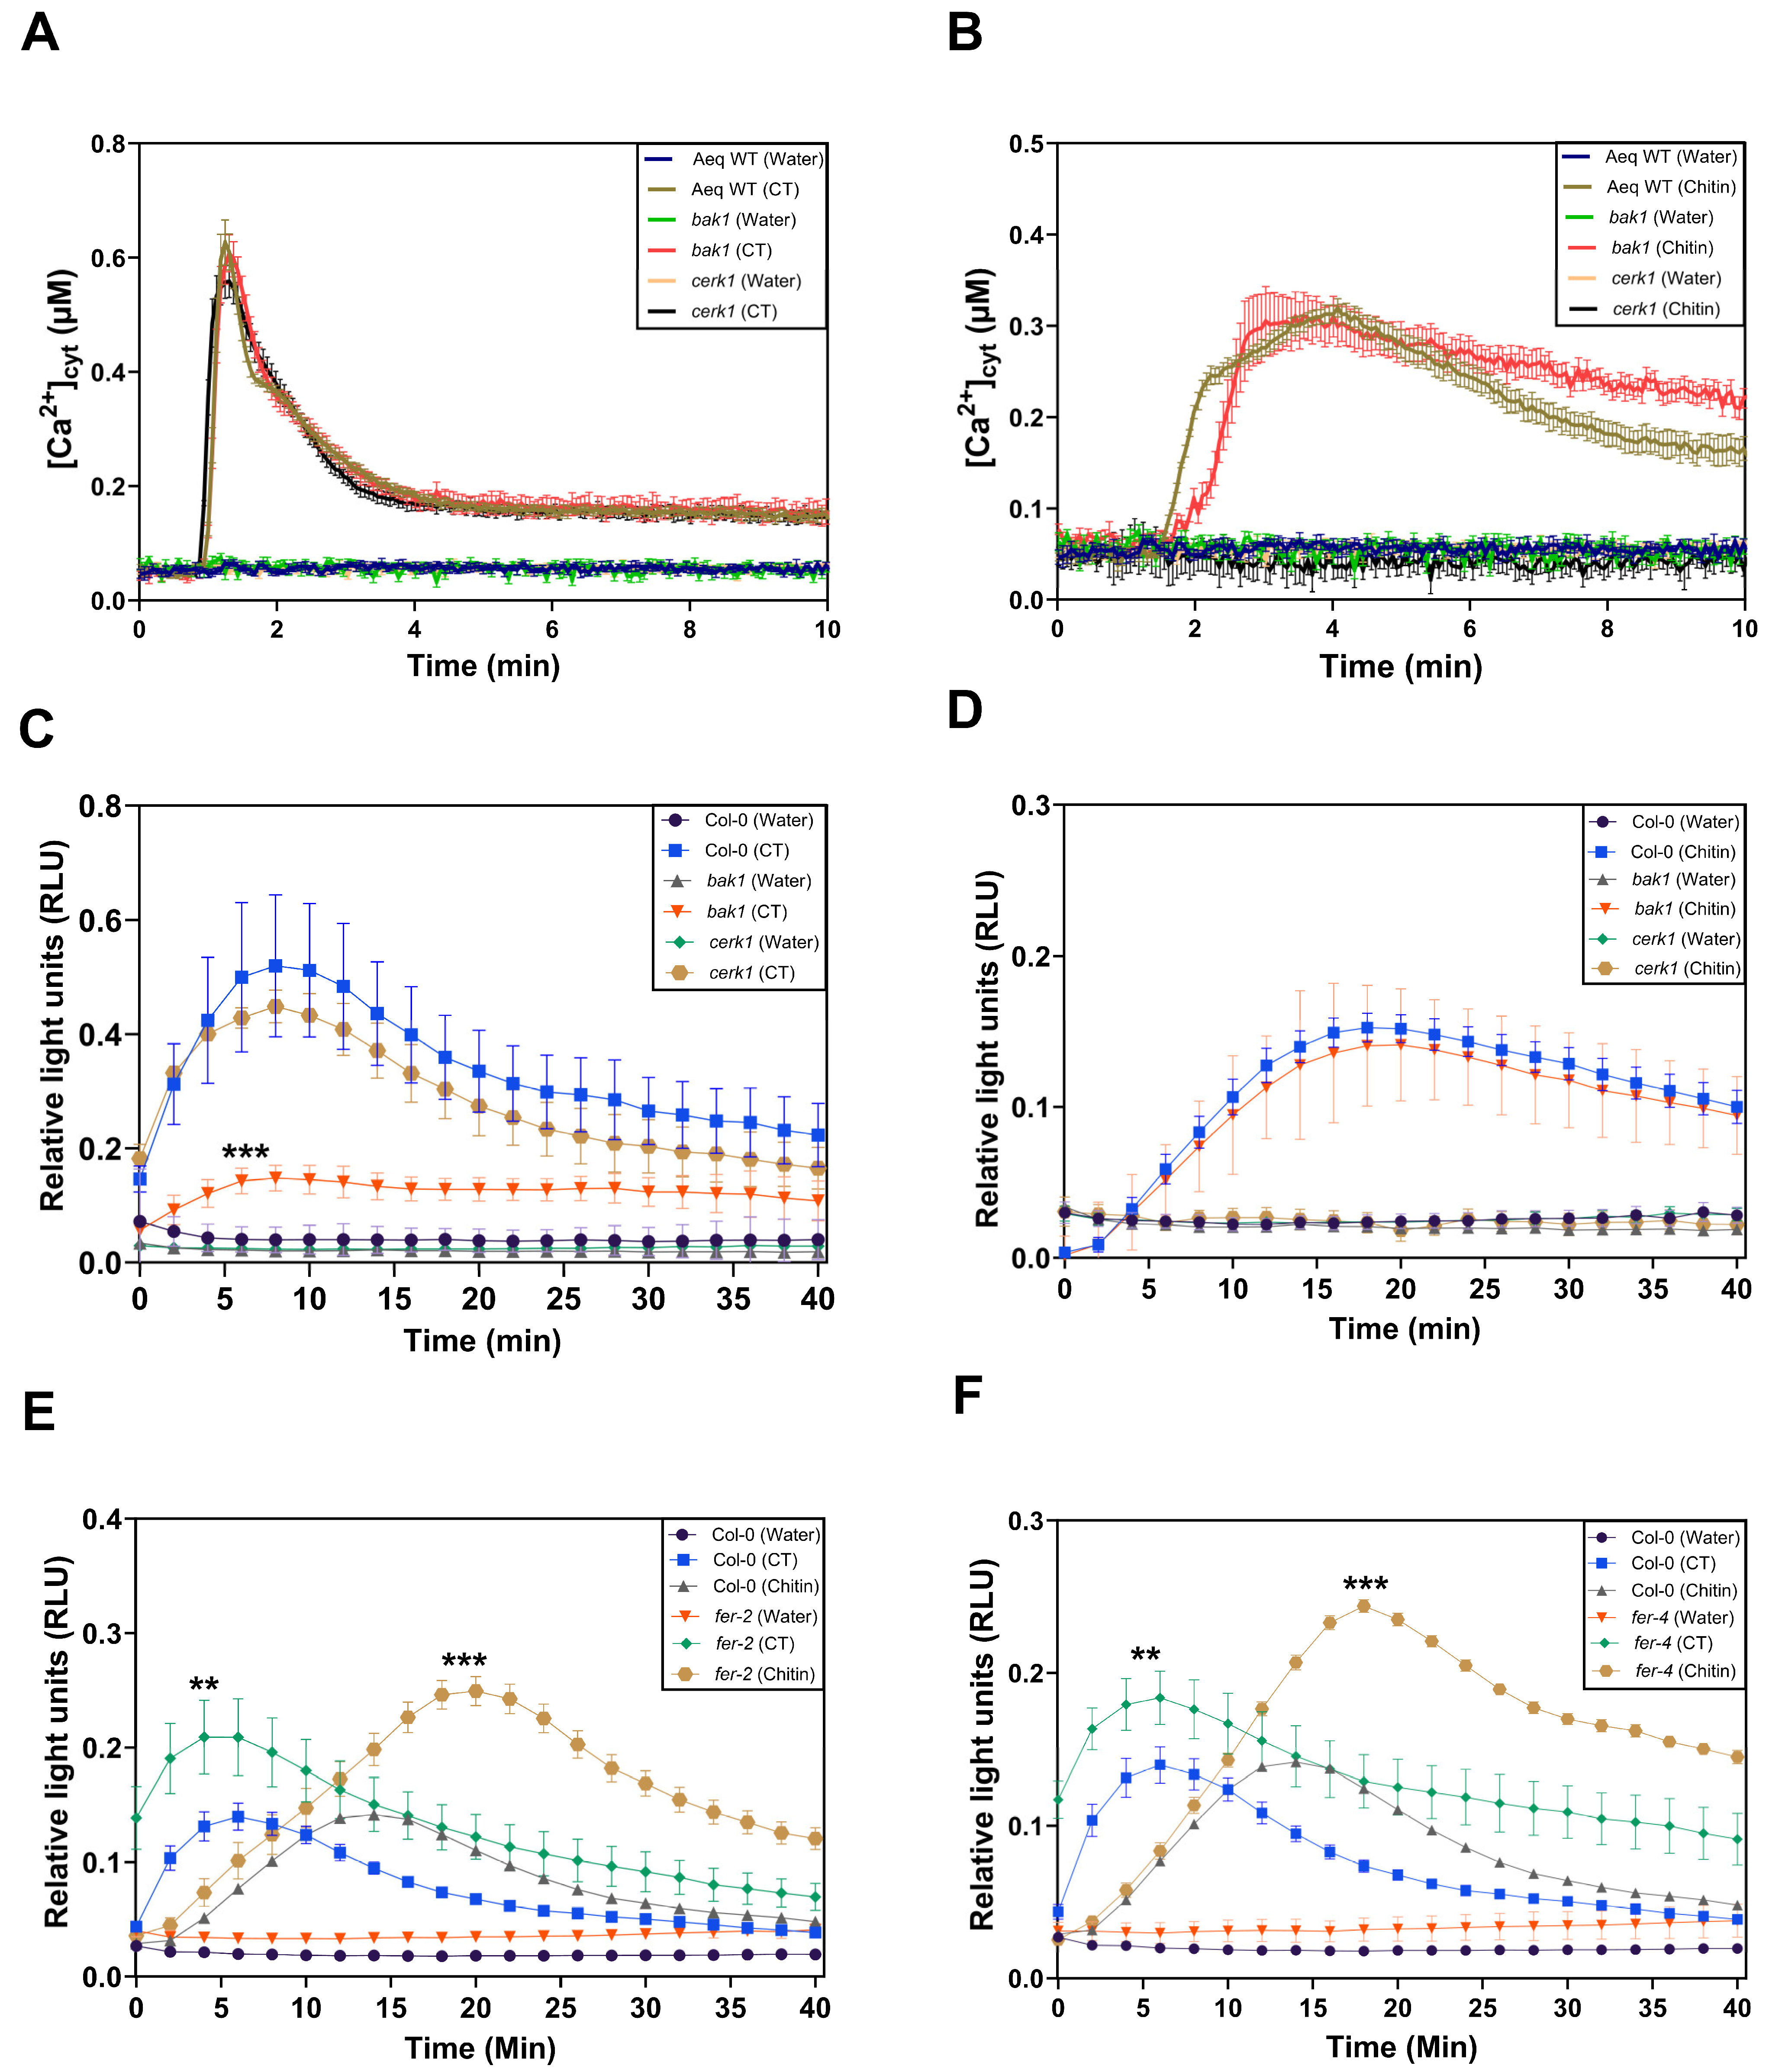
2.5. BAK1 Inhibits CT-Induced ROS Production in Arabidopsis Roots

The application of CT to Arabidopsis roots leads to the rapid phosphorylation of BAK1, and the response requires CORK1 [5]. Since BAK1 is a coreceptor of many PRRs (cf. Section 1), we tested whether BAK1 is involved in CT-induced [Ca2+]cyt elevation or ROS production in Arabidopsis roots. We compared CT-induced responses in wild-type and bak1 roots (Figure 6A–D). Chitin was used as a control. [Ca2+]cyt elevation in response to CT or chitin application was not affected by the bak1 mutation (Figure 6A,B), while ROS production was significantly lower after CT application, but not chitin application, to the bak1 mutant, when compared to the wild-type and cerk1 roots (Figure 6C,D). This indicates that BAK1 affects CT-, but not chitin-induced ROS production, while [Ca2+]cyt elevation in response to both D/PAMPs is not affected by BAK1. CT-induced [Ca2+]cyt elevation and ROS production are not affected in the cerk1 mutant (Figure 6A,C).

2.6. FER Restricts CT- and Chitin-Induced ROS Production in Arabidopsis Roots

The malectin domain containing receptor kinase FER is rapidly phosphorylated in SWT roots, but not cork1 roots, exposed to CT [5]. ROS production in two FER mutants, fer-2 (Figure 6E) and fer-4 (Figure 6F), in response to 10 μM CT or 10 μM chitin application, was significantly higher in comparison to the SWT seedlings. Since no significant differences for CT- or chitin-induced WRKY30 and WRKY40 expression were observed for the wild-type and the two fer mutants (Supplementary Figure S1), the FER-mediated restriction of ROS production in response to the two D/PAMPs might be caused by the direct inhibition of the NADPH oxidase activity (cf. Section 3).

2.7. CT Alters the Expression and Phosphorylation Patterns of Sugar Transport and Metabolism Proteins

The inspection of expression profiles of CT-responsive genes in Arabidopsis roots [5] uncovered that the mRNA levels for sugar-related genes, in particular sugar transporter genes, are either up- or downregulated in the SWT, but not in the cork1 mutant, 1 h after CT application. For instance, genes for EARLY RESPONSE TO DEHYDRATION6 (ERD6) and POLYOL/MONOSACCHARIDE TRANSPORTER6 (PMT6) are upregulated while those for the SUCROSE-PROTON SYMPORTER2 (SUC2), the SUGAR TRANSPORT PROTEIN1 (STP1) and STP4, ERD6-LIKE1, and the SUCROSE TRANSPORTER2 (SUT2) are downregulated in SWT roots, but not—or to a significantly lesser extent—in the cork1 mutant roots (Supplementary Table S1). Furthermore, the phosphorylation patterns of proteins involved in sugar transport and metabolism also changed in response to CT application in the SWT, but not in the cork1 roots. This was observed for the sugar transporters ERD6, SWEET12, STP7, and MONOSACCHARIDE-SENSING1 (MSSP1), but also for enzymes involved in the sugar metabolism (SUCROSE-PHOSPHATE SYNTHASE1 (SPS1) and SPS2; SUCROSE SYNTHASE6 (SUS6)) and for the SUCROSE NONFERMENTING 4-LIKE PROTEIN (SNF4) which regulates the cell response to glucose starvation (TAIR) (Supplementary Table S2). Since none of these proteins are directly involved in cellulose biosynthesis, we hypothesized that CT/CORK1 signaling exhibits crosstalk with the primary sugar metabolism/transport.

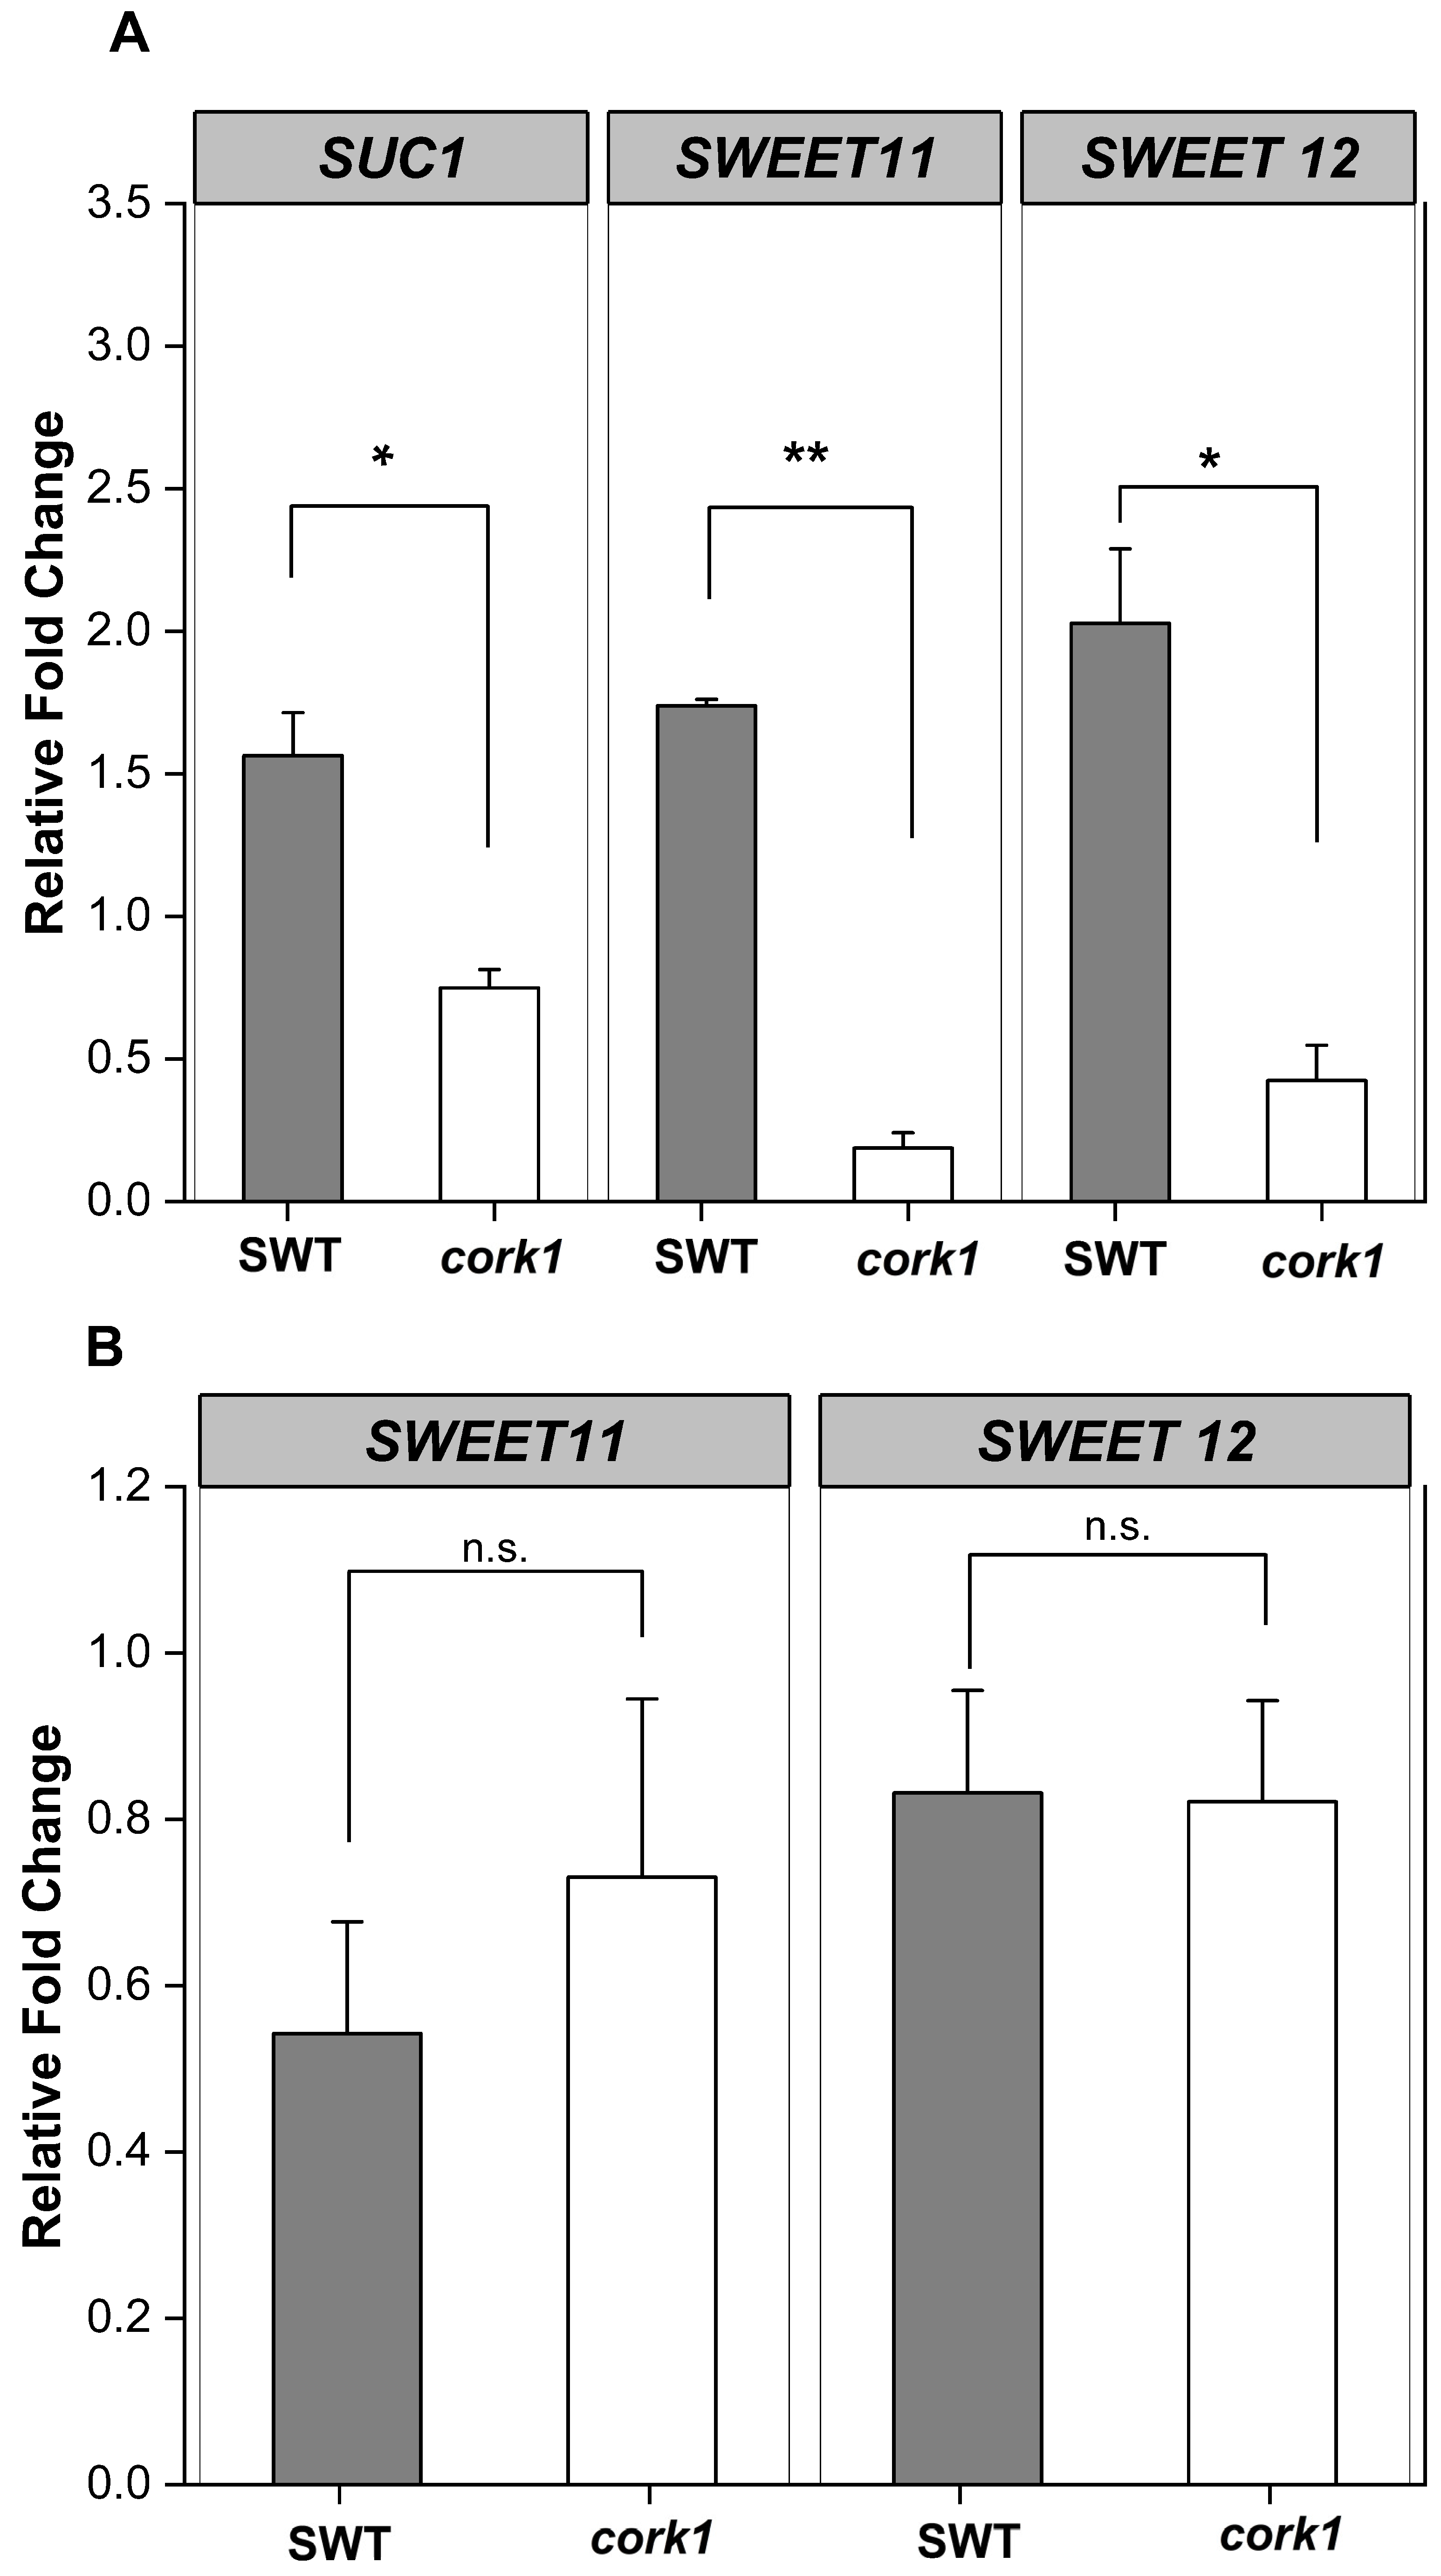
2.8. Sucrose Stimulates SUC1, SWEET11, and SWEET12 Expression in SWT Roots and Inhibits Their Expression in cork1 Roots

To further investigate whether CORK1 is involved in the sugar metabolism/transport, we investigated the expression of SUC1, SWEET11, and SWEET12 in the roots of SWT and cork1 seedlings. These genes were chosen because they are expressed in roots and involved in sucrose distribution in the root tissue (cf. Section 3). qPCR analyses for SUC1, SWEET11, and SWEET12 demonstrate that sucrose, but not glucose, stimulates their expression in SWT roots within 1 h, whereas their expression is inhibited in cork1 roots (Figure 7). The requirement of CORK1 for the stimulatory sucrose effect, combined with the strong inhibition of their expression in the cork1 mutant line, provides further evidence for crosstalk between CORK1 signaling and the sugar transporters (cf. Section 3).

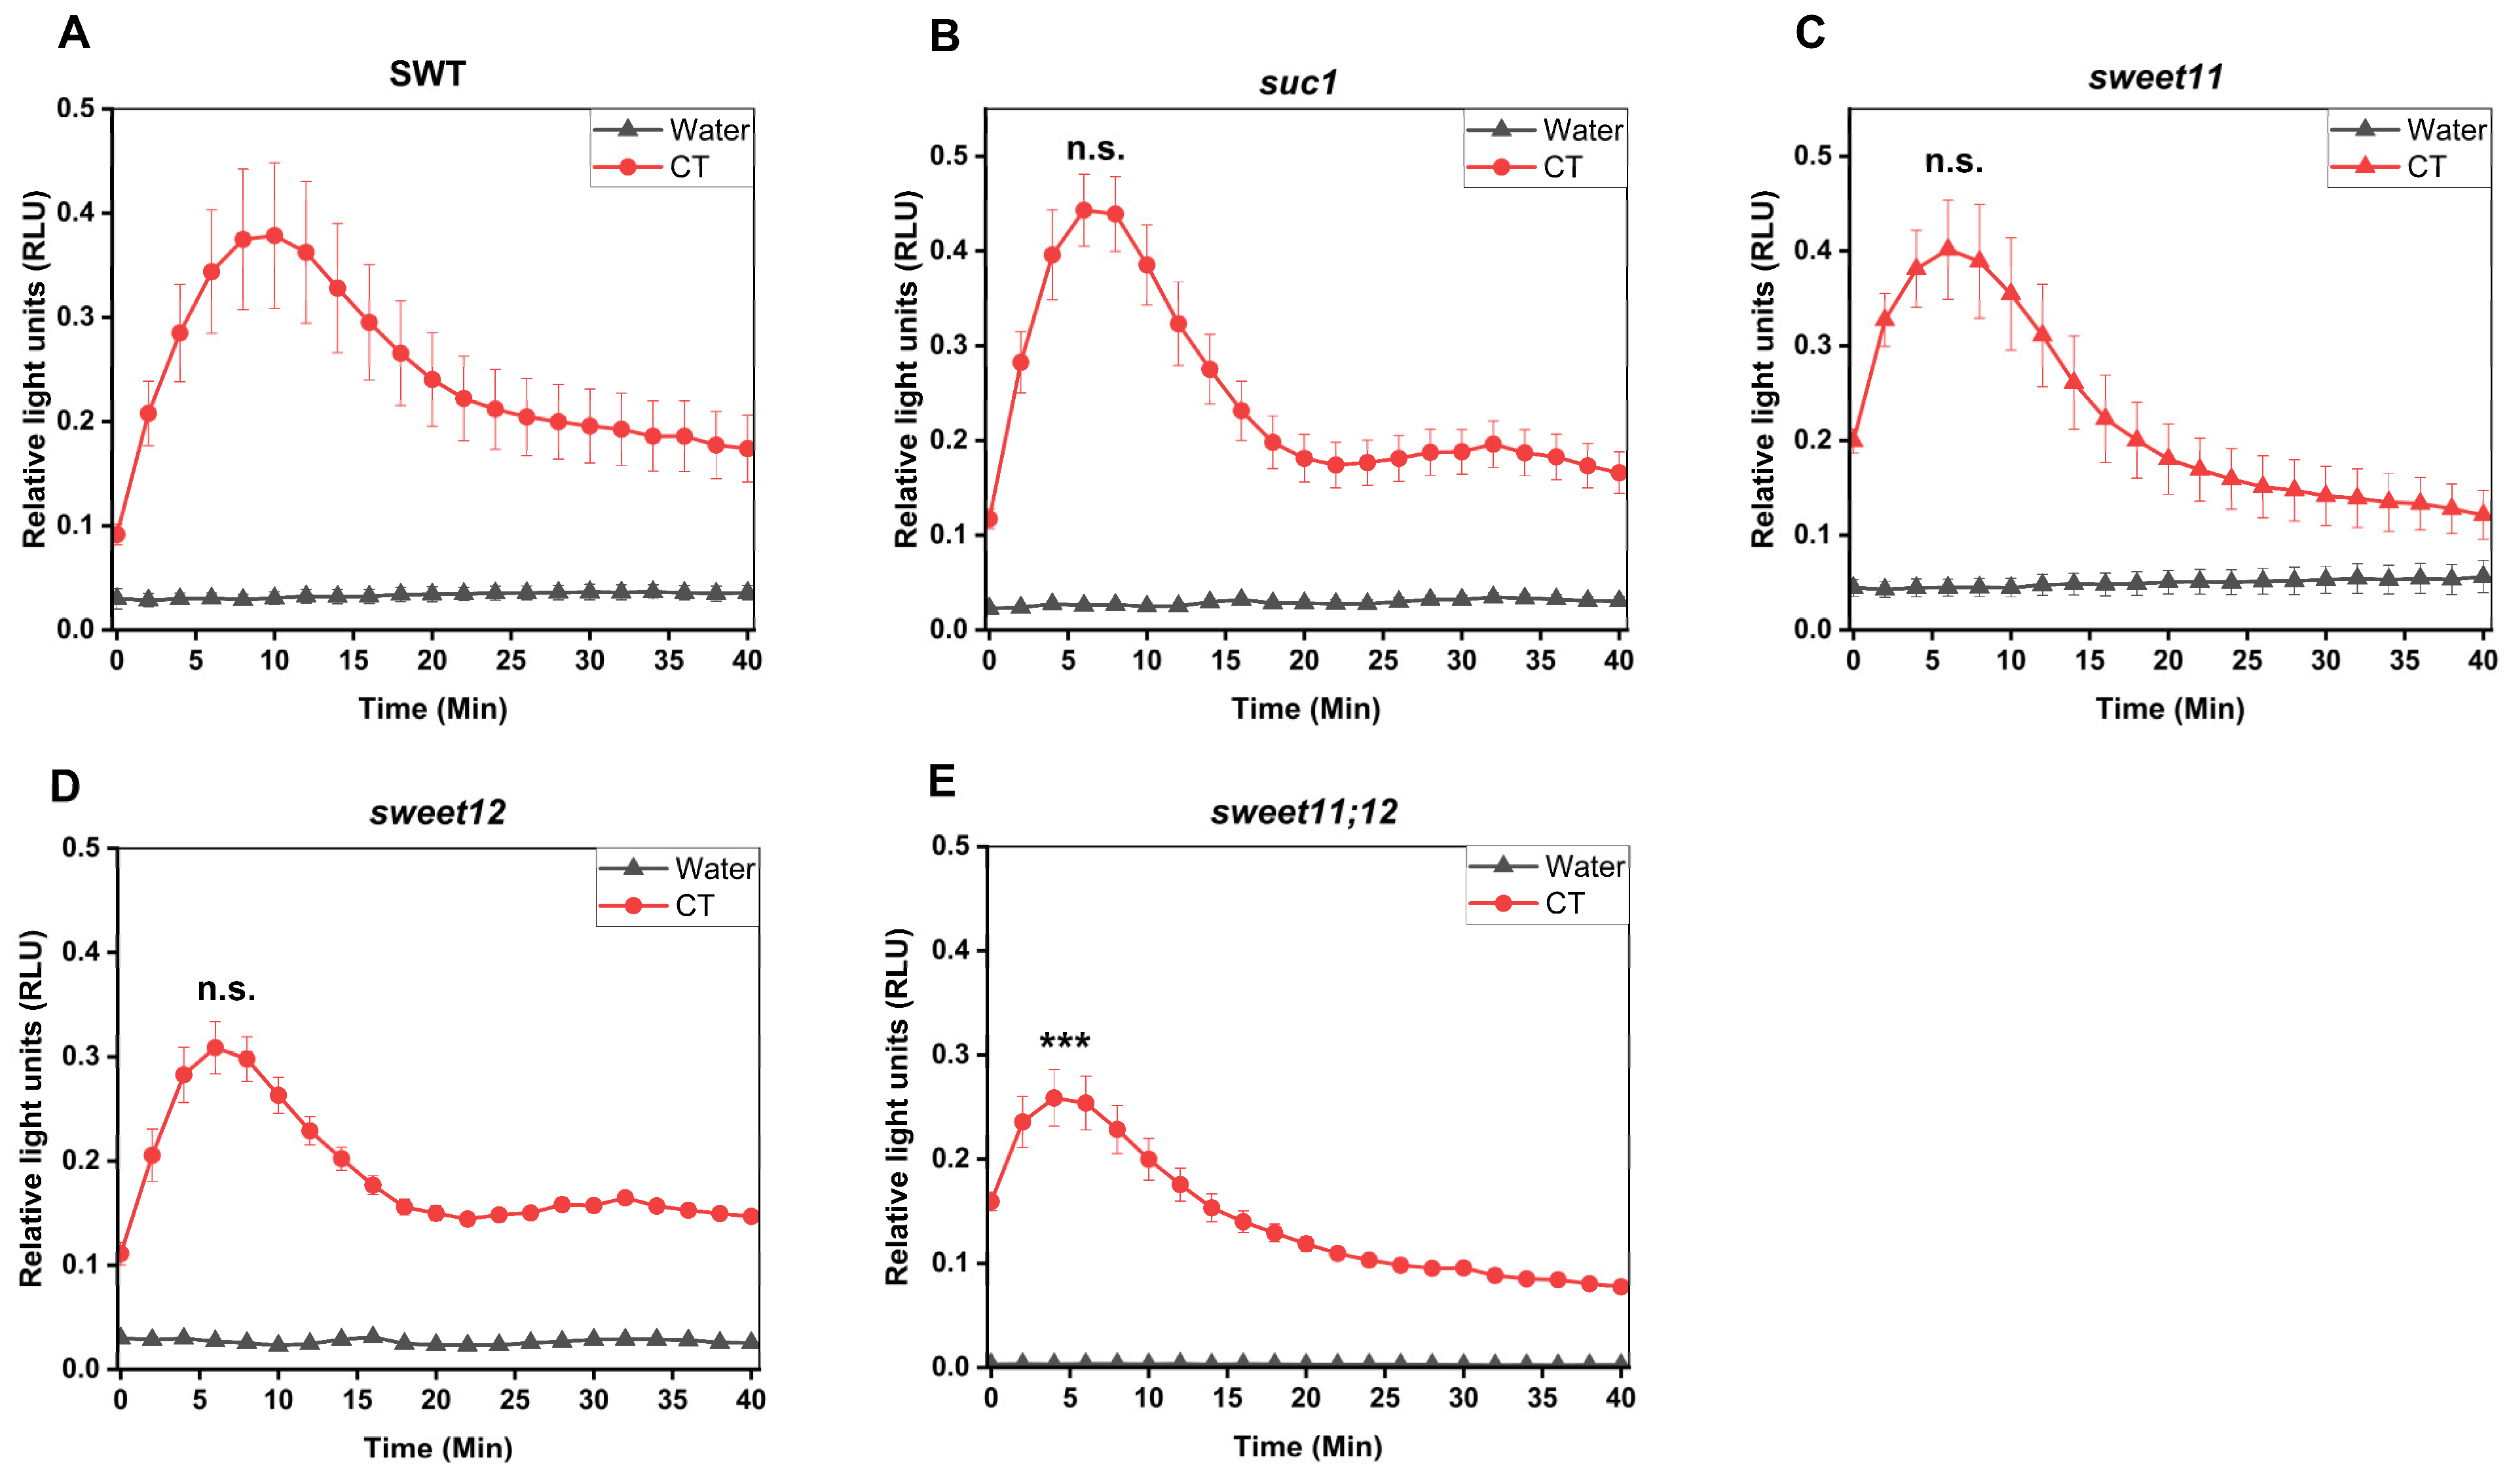
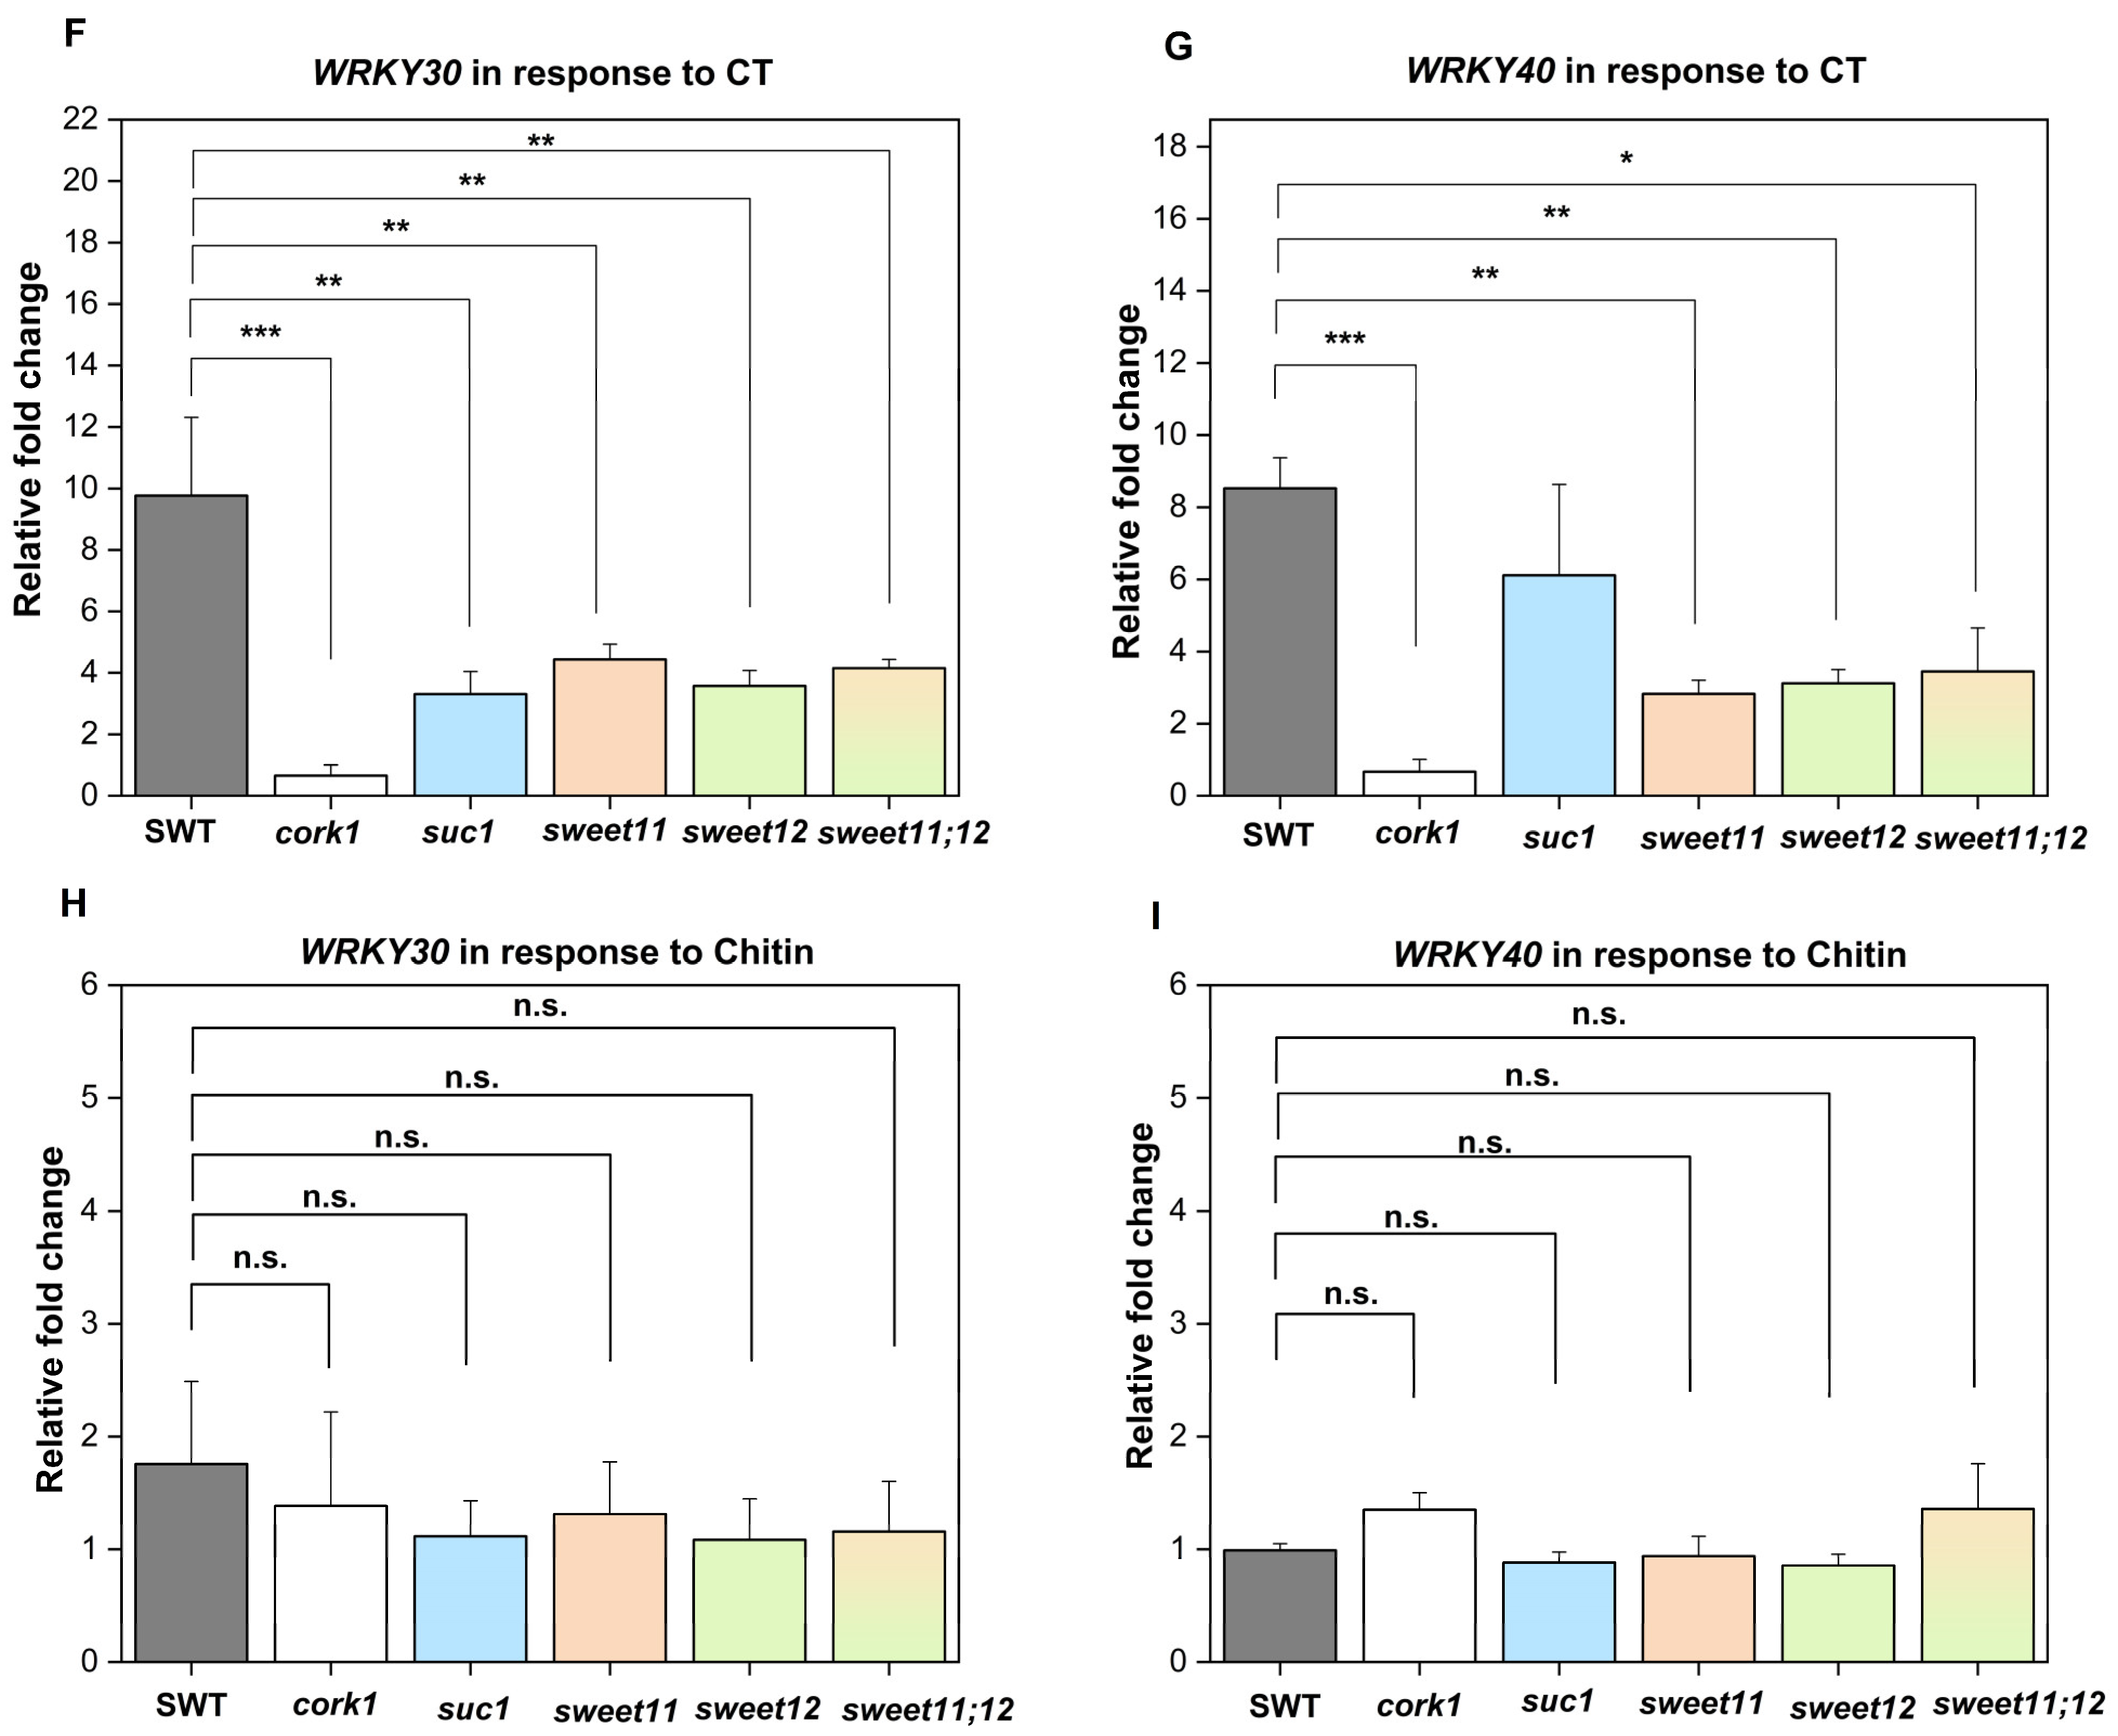
2.9. SUC1, SWEET11, and SWEET12 Control CT-Induced ROS Production and WRKY30/40 Expression

To test whether CT-induced responses are dependent on the sugar transporters SUC1, SWEET11, and SWEET12, we compared ROS production as well as WRKY30/40 gene expression in SWT seedlings and suc1, sweet11, sweet12, and sweet11;12 double knock-out lines. Figure 8A–E demonstrates that ROS production in response to CT application in the sweet11;12 double knock-out line was significantly reduced compared to the wild-type and all single knock-out lines. Furthermore, stimulation of WRKY30 and WRKY40 expression by CT was significantly inhibited in all sugar mutants, while no significant differences were observed for their regulation in response to chitin (Figure 8F–I). This demonstrates that knocking out these sugar transporters represses CT-induced WRKY30/40 expression, while ROS production is less affected in the sugar transporter mutants. In conclusion, Figure 7 and Figure 8 demonstrate that CT/CORK1 influences the expression of sugar transporter genes and sugar transporters influence CT/CORK1-induced responses.

2.10. Long- and Short-Term Exposure of SWT and cork1 Seedlings to CT or CB
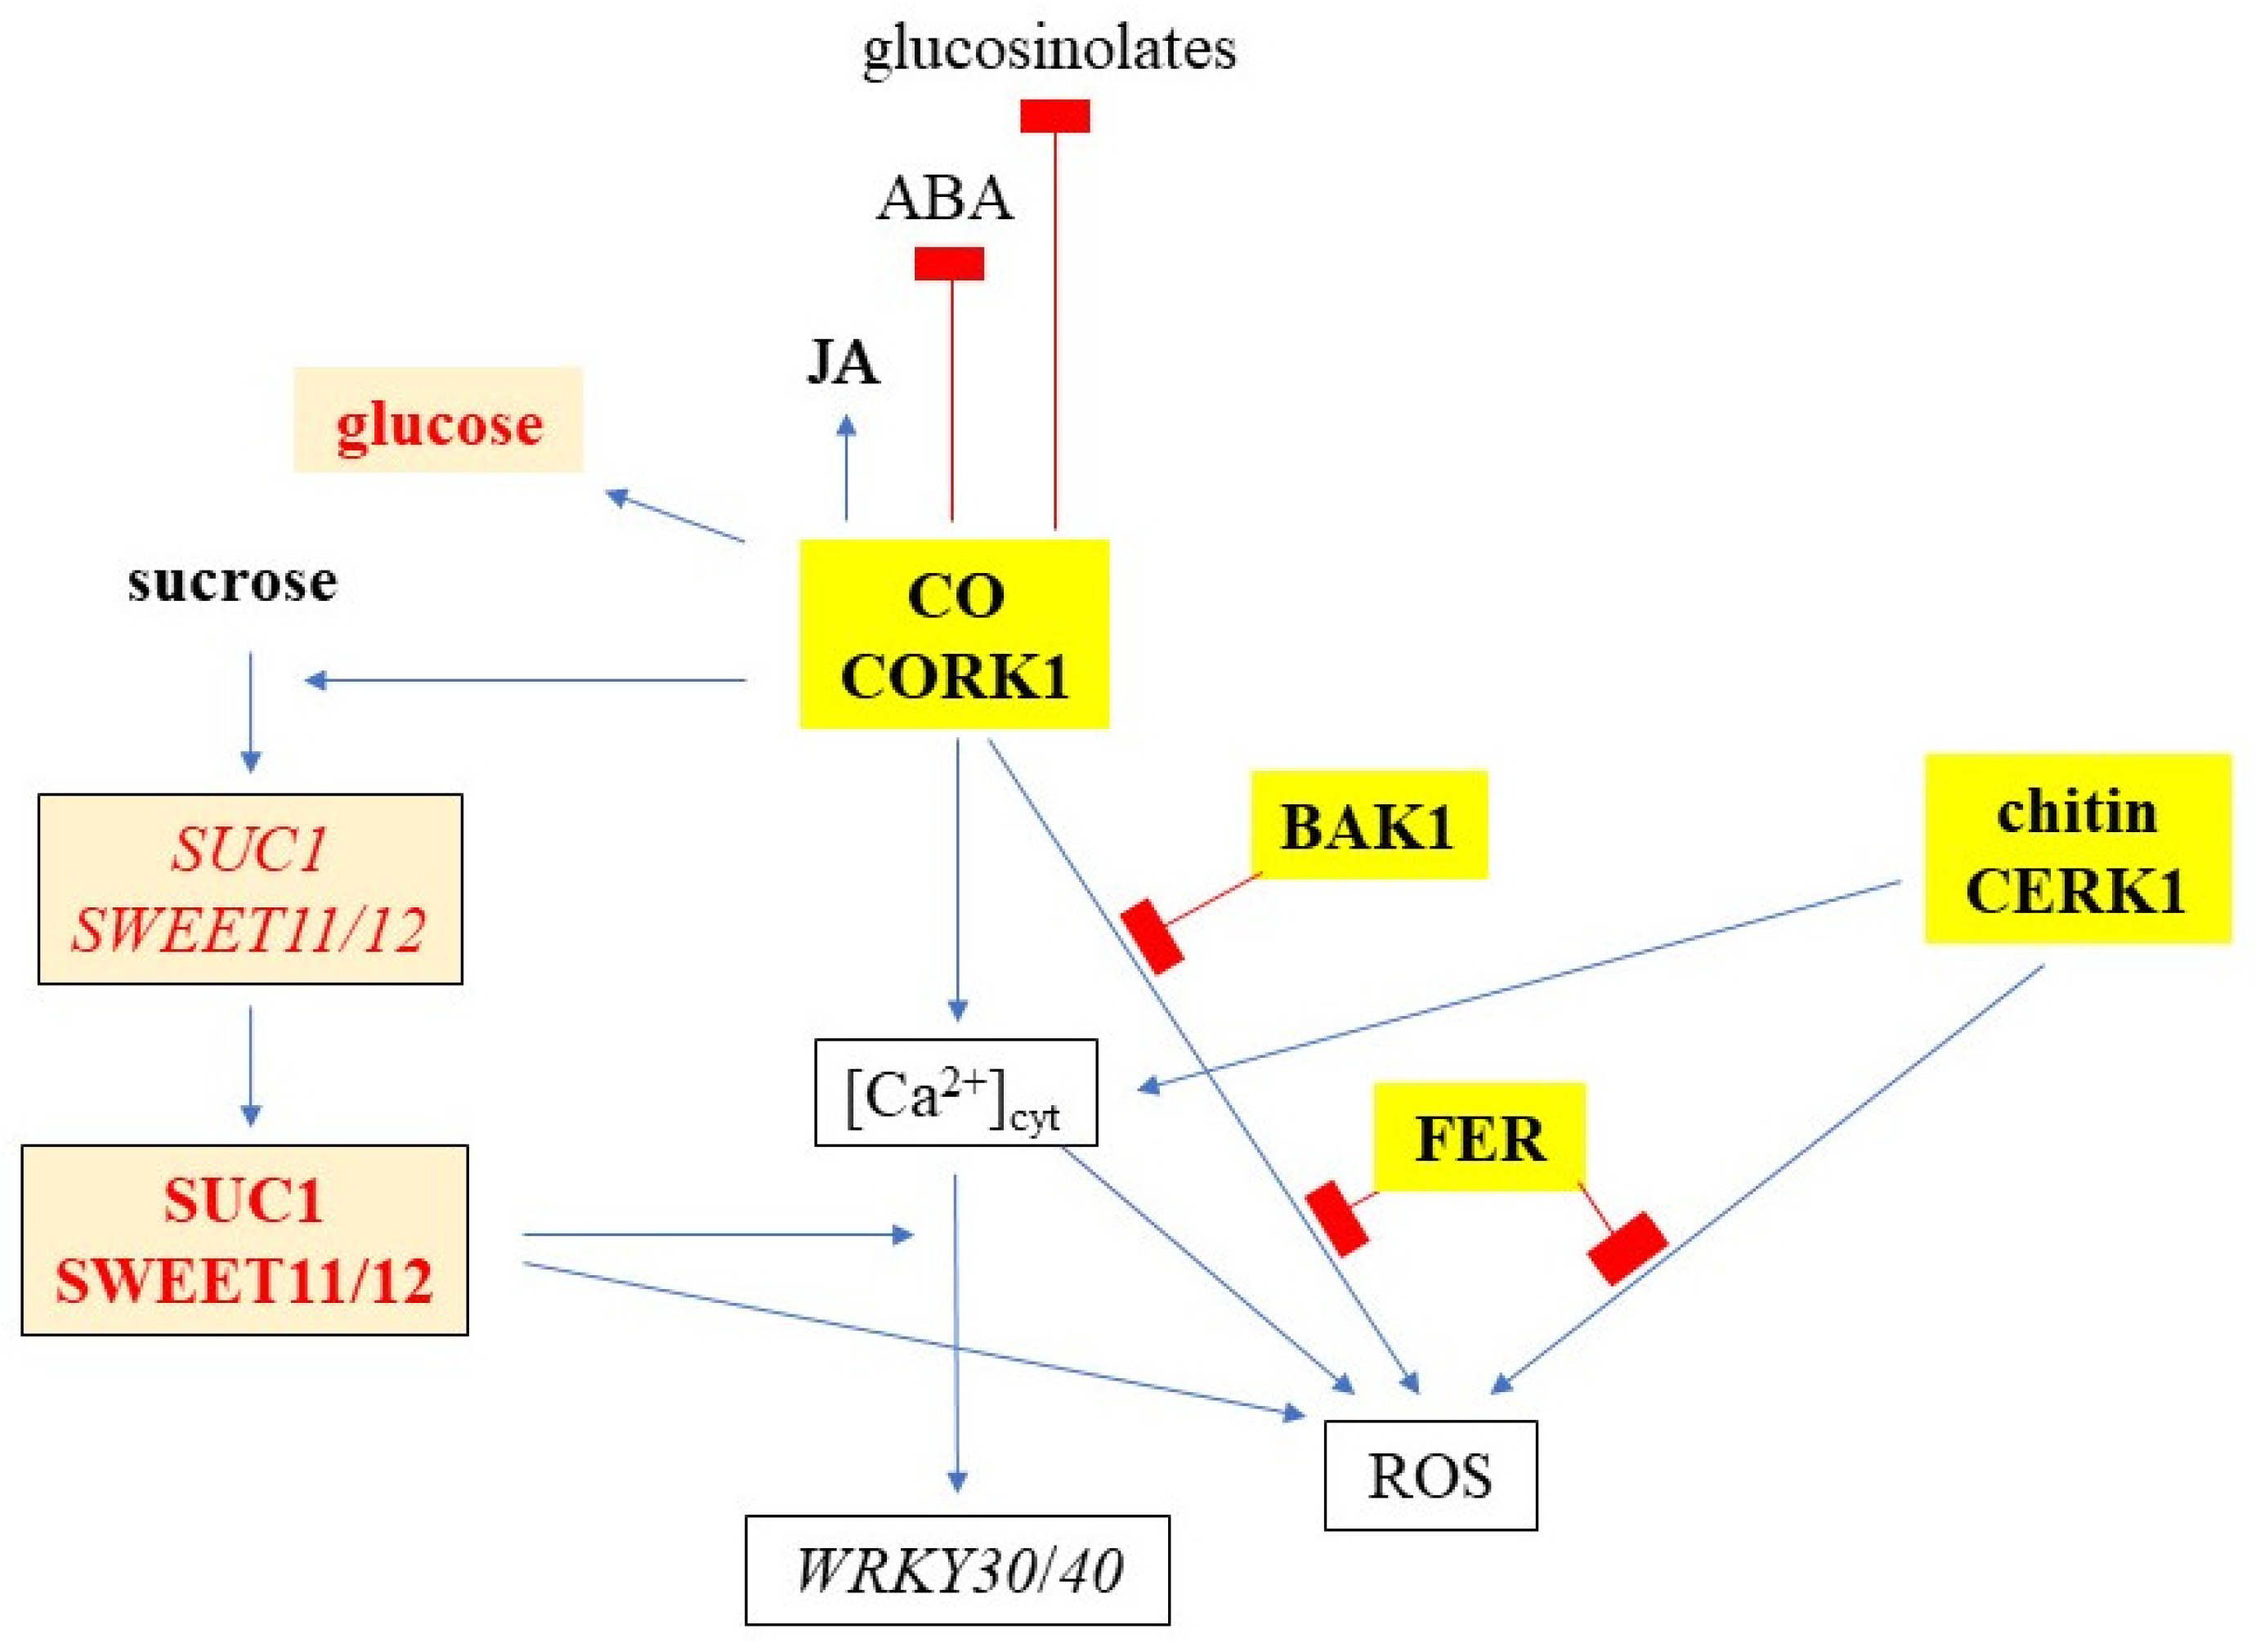
The activation of immune and stress responses by cellooligomers [5,6,14] suggests that the growth/stress response balance might be altered. In addition, in Arabidopsis roots many CT-responsive genes are also induced by PAMPs, such as chitin [5,14], which restricts growth in favor of defense activation. When nine-day-old SWT and cork1 seedlings were either transferred to plant nutrient media (PNM) [53] with different CB concentrations (0–100 mM), or to PNM media with 10 µM CT for an additional 6 days, we observed that the root weights, but not fresh shoot weights, of the SWT seedlings were reduced after the application of 10 µM CT or CB concentrations > 30 mM, in contrast to the cork1 seedlings where this reduction was not observed (Supplementary Figures S1 and S2). Sugar, glucosinolate, and phytohormone profiles were not affected by these treatments (Supplementary Figures S1 and S2) (cf. Section 3). This suggests that the inhibition of root growth by long-term exposure to cellooligomers requires CORK1.
To test whether the growth inhibition by long-term exposure of the seedlings to CB might be caused by changes in the cellular metabolite profiles, we exposed 14-day-old SWT and cork1 seedlings to 0, 10, and 100 mM CB for 6 h and measured the amino acid, glucosinolate, sugar, and phytohormone profiles in the roots. The rationale behind this experiment was that changes in these metabolite profiles are expected to occur early after the application of the cellooligomers and are no longer detectable after longer periods due to compensatory mechanisms in the plants (Supplementary Figure S2). Furthermore, CB can be metabolized faster by the roots than CT. PEG 6000 was used as a control to eliminate the effect of osmotic stress on the downstream responses caused by the highest CB concentration (100 mM). The comparison of the amino acid profiles of the SWT and cork1 roots exposed to 100 mM CB or water uncovered that glutamic acid, glutamine, and asparagine contents were significantly higher in CB-treated SWT plants (Figure 9). Since this was not observed in the cork1 roots after 100 mM CB treatment, the higher levels of these three amino acids should be caused by CB-mediated CORK1 activation (cf. Section 3). Moreover, the glutamic acid content in the CB-treated SWT roots was significantly higher than in the cork1 roots.
Interestingly, the total glucosinolate content in the SWT roots was significantly reduced upon exposure to 10 and 100 mM CB, while it was not affected by the CB treatments in the cork1 roots (Figure 10A). However, the cork1 roots which were not treated with CB contained already significantly lower glucosinolate levels than the SWT roots. This suggests that the restriction of glucosinolate accumulation in the SWT occurs via CB. The lower level of the secondary metabolites in the cork1 roots is independent of CB and points to a CB-independent role of CORK1 in promoting glucosinolate biosynthesis.
While no significant differences were observed in the fructose and sucrose levels in the CB-treated or untreated SWT and cork1 roots (Figure 10C,D), the glucose level was significantly higher in the SWT roots than in the cork1 roots upon 100 mM CB treatment (Figure 10B).
Finally, among the analyzed phytohormones, only the jasmonic acid (JA) level increased in the SWT (but not cork1) roots (although not significantly), while the abscisic acid level increased in the cork1 (but not SWT) roots upon treatment with 10 mM CB (Figure 11A,B). The highest ABA content was found in the cork1 roots treated with 100 mM CB. The levels of all other phytohormones or their precursors were comparable in all samples.
Overall, these results indicate that the CB/CORK1 pathway promotes the accumulation of three amino acids (glutamic acid, glutamine, and asparagine), glucose, and ABA, while JA is downregulated (cf. Section 3). Higher JA levels in the SWT may indicate defense gene activation upon CB treatment, whereas stimulation of the ABA level by CB in the mutant suggests that it is stressed after cellooligomer application. The lower glucosinolate level in unchallenged cork1 mutants suggests that CORK1 might have a function that does not require receptor activation.

3. Discussion

3.1. CORK1 Localization and Inhibition of Cellulose Biosynthesis

We demonstrated that CORK1 is preferentially expressed in the vascular tissue of the upper part of the roots (Figure 1), i.e., tissue with differentiated cells and established cell walls. Expression in root tissue points to a specific role of this receptor kinase in sensing signals from the rhizosphere. It appears unlikely that the receptor kinase is part of the general cell wall integrity surveying system operating in the whole plant. Expression in the vascular root tissue might explain why the inhibition of cellulose biosynthesis by ISX did not stimulate CORK1 expression (Figure 2), since de novo synthesis of cell wall material in the differentiated cell is low compared to the growing cells. Moreover, CORK1 is not only involved in cellooligomer perception but may also function as a coreceptor for the perception of mixed-linked β-1,3/1,4-glucan oligosaccharides [6]. The expression of At1g56130 (IGP2/3) and At1g56140 (IGP4), whose gene products are involved in the perception of mixed-linkage β-1,3/1,4-glucan oligosaccharides [6], is also not stimulated after the application of ISX (Figure 2). The three LRR-malectin receptor kinases might perceive cellooligomers or mixed-linked glucan oligosaccharides in the apoplast which accumulate when more damage- or stress-exposed peripheral cells of the roots are damaged, e.g., after a pathogen attack or due to stressful conditions in the rhizosphere. Cellooligomers in the root tissue might also derive from root-colonizing microbes, as shown in the case of Piriformospora indica [14], or decomposing material in the root environment. In the vascular tissue, CORK1 is protected against biotic and abiotic stresses by the epidermal and subepidermal cell layers. Therefore, this receptor kinase probably does not belong to the first line of defense against stress in Arabidopsis roots.
Interestingly, the At1g56120 message was upregulated 6 h after ISX application in the shoots (Figure 2), but not in the roots, indicating that the function of this receptor kinase might differ from CORK1, At1g56130 (IGP2/3), and At1g56140 (IGP4). The At1g56120 expression profile is also different when compared to the expression profiles of the other three receptor kinase genes (www.arabidopsis.org, accessed on 15 November 2023). Furthermore, CORK1, At1g56130 (IGP2/3), and At1g56140 (IGP4) were found in mutant screens for the perception of cellooligomers or mixed-linked glucan oligosaccharides [5,6], while At1g56120 was not. The function of At1g56120, which is closely related to CORK1, IGP2/3, and IGP4, and is also a member of the LRR-malectin domain-receptor kinase subfamily [6,10], has to be elucidated.

3.2. Activation of CORK1 by Different Disaccharides

Non-plant malectins bind the disaccharides maltose and nigerose, which raises the question whether CORK1 activation is restricted to cellooligomers with β-1,4-bound glucose moieties, or whether other sugars can also induce cellular response in a CORK1-dependent manner. We found that—besides CT—only the disaccharides CB, and, to a much lesser extent, lactose (with a β-1,4 bond) and trehalose, can activate cellular processes in a CORK1-dependent manner (Figure 3, Figure 4 and Figure 5). The concentration of CB (1 mM) which is required for a detectable difference in the readouts between the SWT and cork1 roots is at least 100 times higher than that for CT (10 µM), and those for lactose and trehalose (25 mM) are physiologically irrelevant. However, these results might give us hints for future biochemical studies of cellooligomer recognition by CORK1. Moreover, disaccharides are easily taken up by the cells and used as an energy source (cf. below). Therefore, understanding which disaccharide can induce cellular responses in a CORK1-dependent manner, besides being used as an energy source, is important to understand potential crosstalk with the primary sugar metabolism. Interestingly, maltose with an α-1,4 bond is active in mammals, while CT, CB, and lactose with β-1,4 bonds are active in plants. We assume that the ability to bind sugars with β-1,4 bonds is an evolutionary adaption of CORK1 to the plant cell wall chemistry, and that the high activity of the CT might ensure that mass disaccharides in the apoplast do not activate the receptor. During cellulose degradation, CB is an intermediate that is cleaved to two glucose moieties. The perception of CB would directly interfere with the primary sugar metabolism. CT is a nonabundant or very low-abundant intermediate during cellulose degradation by plant enzymes, but the abundance may differ when microbial enzymes degrade the plant cell wall. Thus, CT perception might inform the root cell about the presence of pathogenic microbes. Furthermore, at least one disaccharide without a 1–4 bond is recognized by non-plant malectin proteins (nigerose) and active in plants (trehalose).

3.3. Cellooligomer/CORK1 Signaling Exhibits Crosstalk with Chitin Signaling, FER, and BAK1

Figure 3 and Figure 4 suggest that CORK1 and CYCAM inhibits chitin-induced [Ca2+]cyt elevation, while chitin-induced ROS production is inhibited by CYCAM, but not CORK1. No significant differences were observed for chitin-induced WRKY30 and WRKY40 expression between the wild-type and mutant seedlings (Figure 5). This indicates crosstalk between cellooligomer and chitin signaling which probably occurs at different levels. Yeh et al. [54] have shown that the Arabidopsis receptor-like kinase IMPAIRED OOMYCETE SUSCEPTIBILITY1 (IOS1), which also contains a malectin domain, physically associates with CERK1, and that IOS1 is critical for chitin-mediated PAMP-triggered immunity. Similarly, the malectin-like domain-containing receptor-like kinase FER promotes chitin signaling, whereas the RAPID ALKALINIZATION FACTOR23 (RALF23) ligand-bound FER plays an opposite role ([54], see below). Our physiological studies demonstrate that CORK1 is another LRR-malectin receptor kinase which interferes with chitin signaling, whereas chitin-induced [Ca2+]cyt elevation (Figure 3) but not WRKY30 expression was inhibited by CORK1 (Figure 5 and Figure 12).
FER restricted ROS production induced by CT or chitin in roots (Figure 6). FER is involved in numerous physiological processes and regulated by a myriad of apoplastic and cytoplasmic factors [55,56,57,58,59]. The receptor kinase also modulates cellulose and starch content [60,61,62,63], and acts as a scaffold to promote PAMP-triggered immunity [64]; however, we did not observe that stimulation of WRKY30/40 expression by chitin or CT was affected by FER (Supplementary Figure S3). FER is a receptor for RALF peptide ligands, in particular RALF1 and RALF23. Upon FER activation, a rapid increase in [Ca2+]cyt elevation precedes NADPH oxidase-dependent ROS production [55,59]. The regulation of the NADPH oxidase by FER requires a GPI-anchored membrane-protein produced by LORELEI or LORELEI-like proteins [65]. The restriction of chitin-induced ROS production by FER might occur at extra- and/or intracellular levels. An example of an extracellular inhibition of the FER function provides the SITE1-PROTEASE which cleaves RALF propeptides. Without cleavage, FER facilitates the ligand-induced complex formation of the immune receptor kinases EF-TU RECEPTOR and FLS2 with their coreceptor BAK1 to initiate immune signaling [64]. Furthermore, IOS1 associates with BAK1 in a ligand-independent manner, and stimulates the FLS2-BAK1 complex formation upon PAMP treatment [54]. More recently, Gronnier et al. [66] have shown that FER regulates the plasma membrane nanoscale organization of FLS2 and BAK1. Akin to FER, extensin proteins contribute to RALF23 responsiveness and regulate BAK1 nanoscale organization and immune signaling. RALF23 perception leads to the rapid modification of FLS2 and BAK1 nanoscale organization, and its inhibitory activity on immune signaling relies on FER kinase activity. This example provides additional evidence for the flexibility of the PRR signaling network. Our data suggest that CT/CORK1 signaling is also part of this regulatory circuit. Protein interaction studies and the role of RALF peptide ligands are required to understand (i) the role of the extracellular environment for CORK1 function in the PRR network, (ii) which interactions occur at the plasma membrane, and (iii) which occur during D/PAMP-induced ROS production.
Besides FER, CT application also results in the rapid phosphorylation of BAK1 in a CORK1-dependent manner [5]. Furthermore, Zarrattini et al. [67] have shown that CB upregulates BAK1, FER, and CERK1 to trigger innate immunity. Figure 6A,C demonstrates that CT-induced [Ca2+]cyt elevation was not affected by bak1 inactivation, while CT-induced ROS production was significantly lower in the bak1 mutant than in the wild-type seedling. BAK1 might inhibit CT-activated NADH oxidase activity or the activities of other ROS-producing enzymes. Using gene silencing in Nicotiana benthamiana, Segonzaz et al. [68] have shown that the PAMP-triggered Ca2+ burst is upstream of separate signaling branches, one leading to MAPK activation and then gene expression, and another to ROS production. Likewise, CT-triggered ROS production may include post-translational modification operating at the NADH oxidase. The N-terminus of the NADH oxidase contains Ca2+ binding EF-hands, and the Ca2+ might be provided by CT- or chitin-triggered [Ca2+]cyt elevation. In addition, NADPH oxidase activity is also regulated by phosphorylation, cysteine oxidation, S-nitrosation, phosphatidic acid, and ubiquitination [69,70]. Nitric oxide initiates a negative feedback loop limiting ROS production by NADH oxidases [71]. More research including the generation of double knock-out lines is required to understand how BAK1 specifically inhibits CT-induced ROS production and whether CT/CORK1 signaling affects NADH oxidase activity or the activities of other ROS-producing enzymes independently of [Ca2+]cyt elevation.

3.4. CORK1 Restricts Sucrose-Induced Sugar Transporter Gene Expression

SUC1 is highly expressed in roots, and its expression profile under different conditions suggests that the protein is involved in the uptake of sucrose, unloaded from the phloem, into growing root cells with no symplastic connection [72,73]. The stimulation of SUC1 expression by sucrose is CORK1-dependent, and the inactivation of CORK1 represses SUC1 expression (Figure 7). These effects are even stronger for the SWEET11 and SWEET12 genes. SWEET11 and SWEET12 transport predominantly hexoses or sucrose, and pathogens induce SWEET genes to promote secretion of sucrose into the cell wall space, where it is used as an energy source after cleavage by cell wall invertases [35]. The downregulation of sucrose-induced SWEET gene expression in the cork1 mutant lowers the apoplastic sugar level. Since less sugar is in the apoplast, SUC1 is less required for sucrose translocation from the apoplast into the root cells. Higher cellular sugar levels might promote the primary sugar metabolism in the cell. Although this requires further investigation, it is obvious that CORK1 interferes with the sugar (sucrose) transport in Arabidopsis roots (Figure 12).
Crosstalk between sugar transport and innate immunity or stress responses is well documented [13,35]. SWEET and STP transporters enhance or restrict disease through controlling the level of nutrients provided to pathogens [35]. ERD6 is a putative sucrose transporter and its gene is induced by dehydration and cold (TAIR, 2 January 2024). STPs are hexose-specific H+-symporters and involved in stress responses. STP4 is induced by wounding, STP13 is involved in programmed cell death, and STP13 resorbs hexoses to support the host with energy for defense compounds and to deprive apoplastic microbes by changing sugar fluxes toward host cells [38]. Furthermore, the transcriptional activation of STR13 synchronizes biotic and abiotic stress signaling [37] and confers a powdery mildew resistance in Medicago truncatula [39]. SWEET11b protects rice plants against Xanthomonas oryzae [74], and cabbage SWEETs participate in chilling and clubroot disease responses [75]. Therefore, it is conceivable that cellulose degradation products activate both transport and immune responses, and that crosstalk between these signaling process ensures synchronized responses. Furthermore, sugar metabolites trigger immune responses. CB elicits immunity in lettuce [46] and Arabidopsis [51], and stimulates SUC1 and STP4 expression [67]. Fructans prime ROS dynamics and Botrytis cinerea resistance [76], while trehalose modulates defense responses in Arabidopsis [40,42]. Our data show that CT/CORK1 alters the expression or phosphorylation of sugar transporter genes and thus the sugar distribution, and mutations in sugar transporter genes impact CT/CORK1-induced responses in Arabidopsis roots (Figure 7, Figure 8 and Figure 12; Supplementary Tables S5 and S6). Furthermore, the levels of some sugar metabolites (Figure 9), as well as the phosphorylation state of enzymes involved in the primary sugar metabolism, respond to cellooligomer applications to the roots of wild-type seedlings but not cork1 mutant seedlings (Supplementary Table S7).

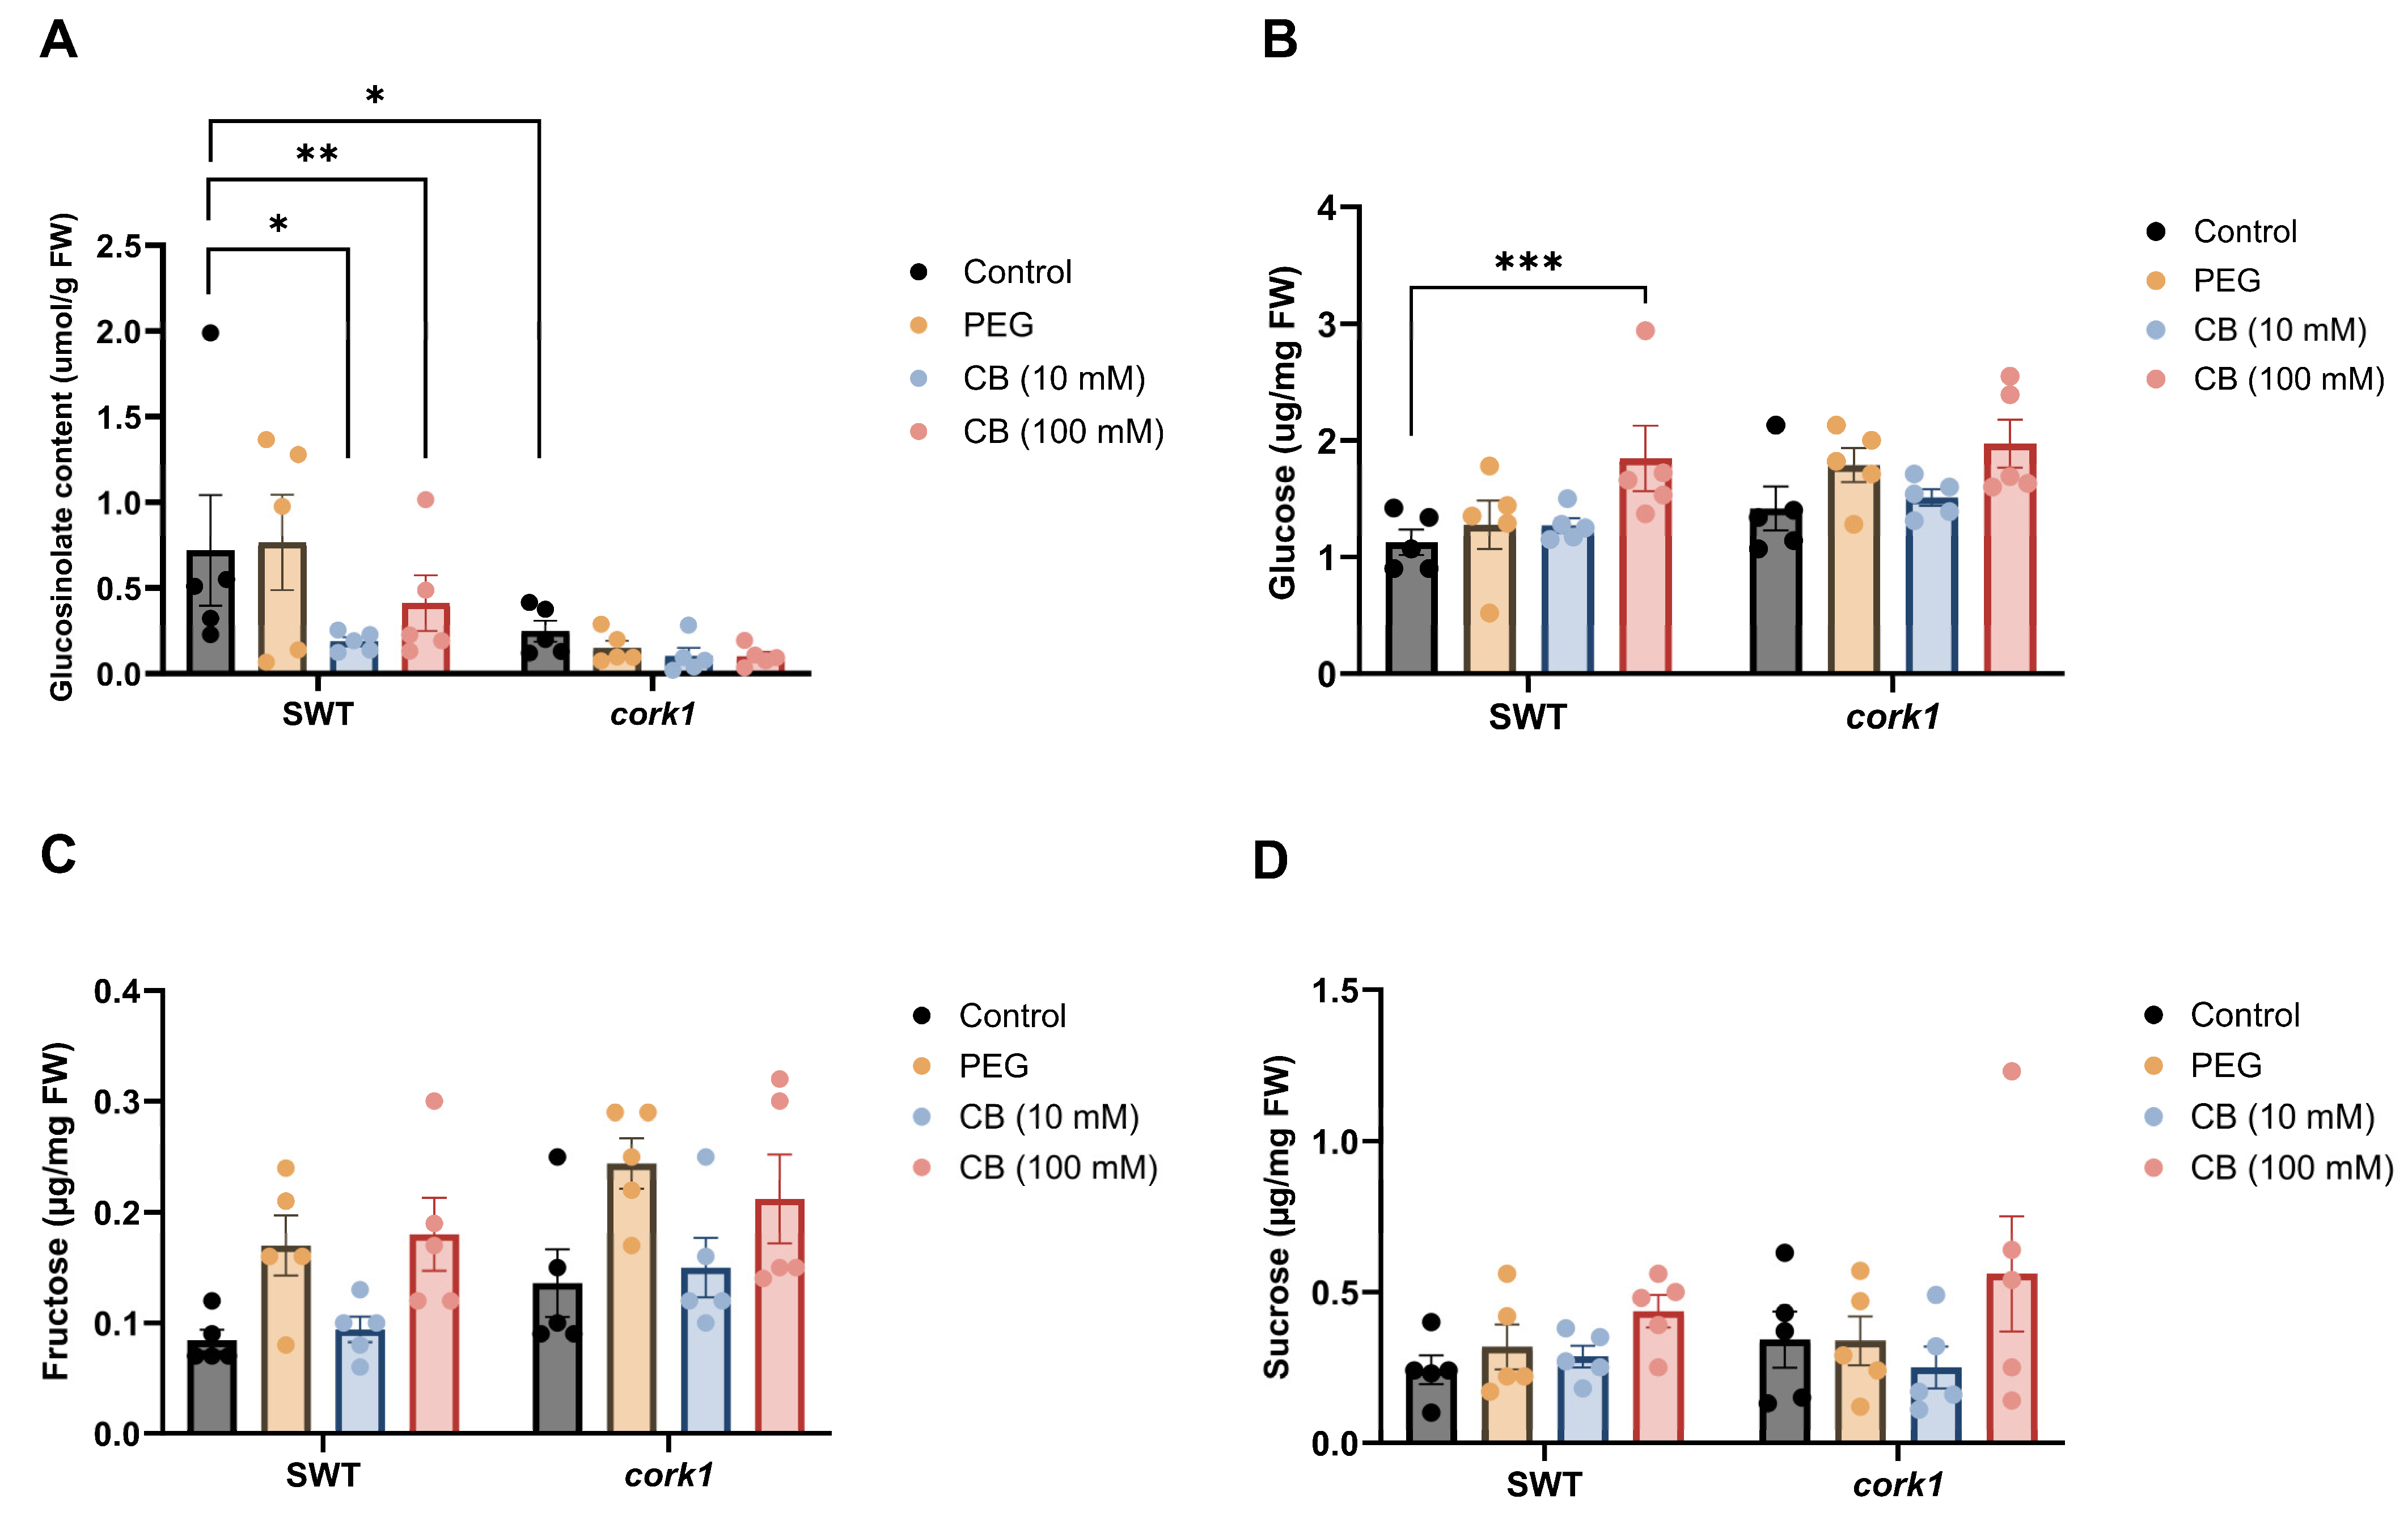
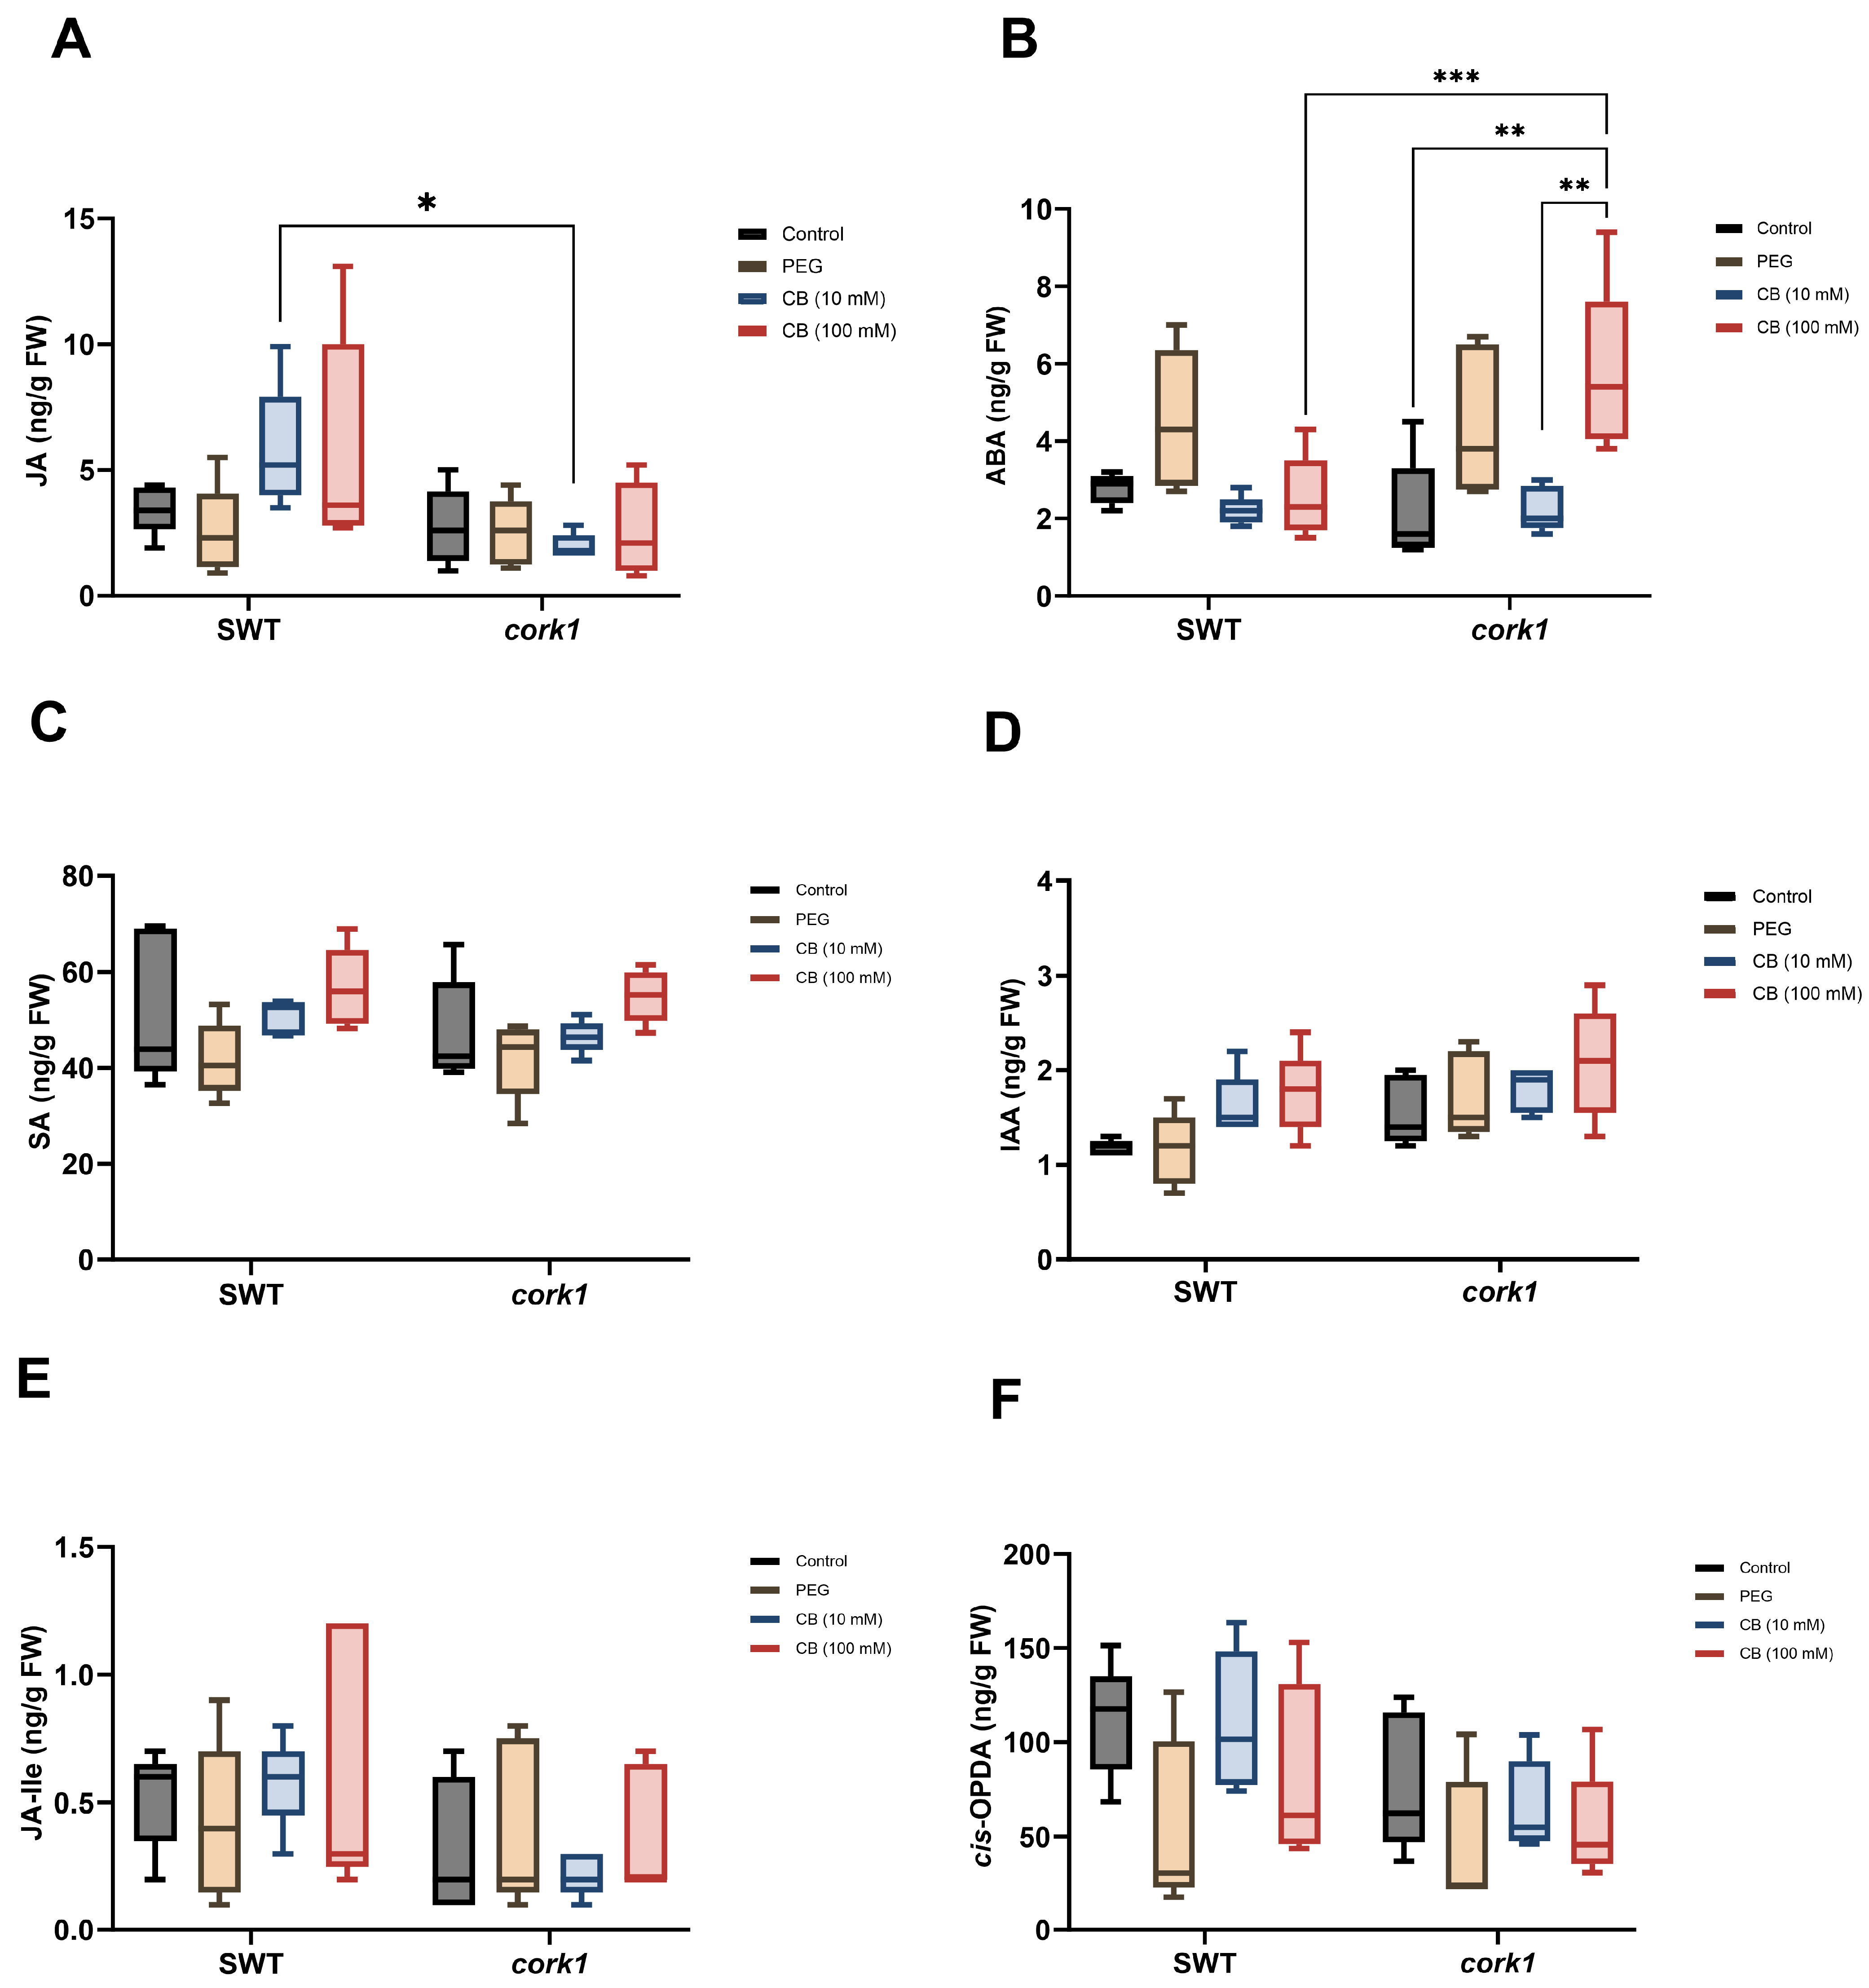
3.5. Cellooligomer/CORK1 Signaling Alters the Amino Acid, Sugar, Glucosinolate, and Phytohormone Patterns in Arabidopsis Roots

The glutamic acid, glutamine, and asparagine levels are slightly upregulated after CORK1 activation (Figure 9). These amino acids play crucial roles in nitrogen metabolism, which is intricately linked to stress and defense responses in plants [77]. Glutamine, the first amino acid synthesized in nitrogen assimilation in plants, is the building block for protein synthesis and an N-donor for the biosynthesis of amino acids, nucleic acids, amino sugars, vitamin B coenzymes, and N-containing secondary metabolites [78]. The amino acid induces immune responses in Arabidopsis, by stimulating the expression of wound-, defense-, and stress-related genes [79]. Moreover, the application of glutamate to roots activates PAMP-, salicylic acid-, and JA-inducible genes and primes chitin-induced responses in leaves, possibly through the transcriptional activation of the chitin receptor LYK5 [79]. Asparagine belongs to the high-abundant amino acids which are synthesized during abiotic stress to act as osmolytes [80]. The asparagine synthetase 2 mutant exhibits low salt stress tolerance [81] and the amino acid is imbedded into a signaling network involved in stress resistance in Arabidopsis [82,83]. Glucose is an important regulator of plant defense, e.g., by controlling the interaction and phosphorylation of BRI1 and BAK1 [84]. Also, the phytohormone ABA is a well-investigated abiotic stress hormone [85]. In our results, although the [Ca2+]cyt level is not elevated, the ABA level is stimulated in the CB-exposed cork1 roots (Figure 11). Either both responses are independently regulated by the cellooligomer/CORK1 pathway, or the [Ca2+]cyt pool induced by this pathway is different from the pool required for many ABA responses. Elevated ABA levels in the cork1 roots upon 100 mM CB application indicates that the mutant suffers under stress. Since ABA does not increase if SWT roots are exposed to 100 mM CB, the activated CORK1 might diminish the stress situation.
Souza et al. [51] have demonstrated that CB-treated roots exhibit the upregulation of LIPOXYGENASE (LOX)3 and LOX4, genes encoding proteins in the octadecanoid pathway leading to the production of JA. This finding aligns with the observed increase of the JA level in the wild-type, but not the cork1 roots (Figure 11). Interestingly, the levels of the JA precursor cis-OPDA and the physiologically active JA-isoleucine did not respond to the cellooligomer/CORK1 pathway. Either they are not the primary targets of CB-induced signaling, or the elevated physiologically inactive JA level is established to prime stress response in local and/or systemic tissue.
The lower glucosinolate levels in CB-exposed wild-type roots may indicate a trade-off between stress and growth responses. Glucosinolates are mainly involved in defense responses, while cellooligomers are DAMPs which respond to cell wall damage. Therefore, cellooligomer-exposed roots might prioritize the allocation of resources for growth and/or cell wall repair rather than defense compounds. The lower glucosinolate levels in mutant roots without exposure to cellooligomers are not clear. A possible explanation could be that CORK1 is a positive regulator of glucosinolate biosynthesis [86], and the binding of the cellooligomer to CORK1 or inactivation of the genes represses CORK1 function. Overall, the majority of the data are consistent with the idea that the cellooligomer/CORK1 pathway targets those metabolite levels which counteract stress.

4. Materials and Methods

4.1. Plant Material and Growth Conditions

The Arabidopsis cork1-2 insertion mutant line (N674063; SALK_021490C) was obtained from Nottingham Arabidopsis Stock Center (NASC). Homozygous seedlings were crossed with the aequorin-containing wild-type line pMAQ2. The corresponding SWT and homozygous seedlings from the F3 generation were used for experiments, as earlier described in [5]. The seeds of these lines were surface-sterilized for 8 min in sterilizing solution containing lauryl sarcosine (1%) and Clorox cleaner (23%). The surface-sterilized seeds were washed with sterilized water eight times and placed on Petri dishes with a Murashige and Skoog medium (Duchefa Biochemie, Haarlem, The Netherlands) supplemented with 0.3% gelrite [87]. After cold treatment at 4 °C for 48–72 h, the plates were incubated at 22 °C under long day conditions (16 h light/8 h dark; 80 µmol m−2 s−1). In addition, insertion lines in the genes for SUC1, SWEET11, SWEET12 and the double insertion line in the genes for SWEET11 and SWEET12 were used in this study [72]. The cytoplasmic Ca2+ elevation mutant (cycam), as well as the aequorin-containing bak1 and cerk1 insertion lines were generated or described in an earlier study [14,88].
Arabidopsis thaliana ecotype Col-0 was used as a control for ISX treatment and for expression analysis in feronia (fer) mutants. The fer2 [89] and fer4 (N69044) mutants were provided by Dr. Judith Fliegmann (ZMBP, University of Tübingen). Twelve-day-old seedlings were transferred to PNM with a nylon membrane. The next day, the plants were mock treated, or treated with 0.6 μM ISX by pipetting the solution to the roots. Both treatments had an equal amount of dimethyl sulphoxide (DMSO). The roots and shoots were harvested separately 6 and 9 h after the treatment.

4.2. Chemicals for Elicitation

CT (C1167, Sigma-Aldrich, St. Louis, MO, USA, or 0-CTR-50MG, Megazyme, Wicklow, Ireland) and chitin (chitohexaose, OH07433 [Carbosynth]) were dissolved in distilled water to make a 10 µM working solution. CB (528-50-7, Carl Roth, Germany) dissolved in distilled water was used at a concentration of 1 mM. Other sugars (sucrose, glucose, galactose, trehalose, maltose, fructose) were also purchased from Carl Roth (Karlsruhe, Germany) while lactose was obtained from Merck (Darmstadt, Germany). These sugars were used at a concentration of 25 mM. ISX (36138, Sigma-Aldrich) was dissolved in DMSO to make a stock of 5 mM and used at a final concentration of 0.6 µM. PEG 6000 was purchased from Carl Roth (Karlsruhe, Germany).

4.3. ROS Measurements

ROS was detected using a luminol-based chemiluminescence assay as described previously [5]. Briefly, the seedlings were grown vertically for 14 days on a Hoagland medium with agar (Hoagland’s No. 2 Basal Salt Mixture; Sigma-Aldrich). The root tissues were incubated in 150 µL of autoclaved double distilled water in a 96-well plate in the dark. After 90 min, the water was gently replaced with 150 µL of working solution containing 2 µg/mL horseradish peroxidase (Sigma-Aldrich) and 100 µM luminol derivative, L-012 (FUJIFILM Wako Chemicals Europe GmbH, Neuss, Germany). Luminescence from each well was measured over 40 min after the addition of elicitors using a luminometer (Luminoskan Ascent v2.4, Thermo Fisher Scientific, Dreieich, Germany), and the results are displayed as relative light units (RLUs). Eight plants were used per treatment and three independent replicates were performed.

4.4. Cytosolic Calcium Measurements

The seedlings were grown vertically on a Hoagland medium and an entire, individual root from 15-day-old seedlings expressing aequorin was incubated overnight in 150 µL of 7.5 μM coelenterazine solution (P.J.K. GmbH, Kleinblittersdorf, Germany) in the dark for reconstitution [90,91]. The luminescence counts were recorded using a microplate luminometer (Luminoskan Ascent v2.4, Thermo Fisher Scientific, Dreieich, Germany). After the measurement, a discharging solution containing 1 M CaCl2 and 10% ethanol (v/v) was added to estimate the amount of residual aequorin. Cytosolic calcium concentrations were calculated using the equation of Rentel and Knight [92].

4.5. RNA Isolation, cDNA Synthesis, and RT-qPCR

10-day-old (n = 20–24) excised root samples were treated with the above-mentioned concentrations of sugars for one hour. The roots were harvested and homogenized in liquid nitrogen. RNA was extracted with TrizolTM (Thermo Fisher Scientific, Waltham, USA) and chloroform according to the manufacturer’s protocol. The RNA isolation was followed by an additional cleaning step to remove excess salts using 3 M sodium acetate (1/10 (v/v) in RNase-free water, pH = 5.2), 600 μL of ice-cold ethanol, and overnight incubation at −20 °C. One µg of total RNA was reverse-transcribed with a RevertAid RT Reverse Transcription Kit (Thermo Fisher Scientific).
Dream Taq DNA Polymerase (Thermo Fisher Scientific, Germany) and Evagreen® (Biotium, Fremont, CA, USA) were used for quantitative reverse transcription PCRs (RT-qPCRs). CFX ConnectTM Real-Time PCR Detection System (Bio-Rad, Feldkirchen, Germany) was used for running and analyzing qPCRs. The expression of genes was normalized to the housekeeping gene encoding a ribosomal protein (RPS; At1g34030), using the 2−∆∆CT method [93]. All primers used are mentioned in Supplementary Table S3.

4.6. Generation of the CORK1 Promoter::GFP Fusion Construct and Plant Transformation

The plant tissue was homogenized and DNA extraction was performed according to [94]. An approximately 1.5 kb promoter region of CORK1 (At1g56145.1) (starting one nucleotide before the ATG codon) was amplified from Arabidopsis thaliana genomic DNA by PCR using PhusionTM High-Fidelity DNA Polymerase (Thermo Fisher Scientific) with SacI and SpeI restriction sites in the forward and reverse primers, respectively. The promoter fragment was digested using Sac1 and Spe1 restriction enyzmes. The GFP fragment was amplified using EGFP_Spe1_FWD, T35S_Xma1_REV, and digested using Spe1 and Xma1. pB7FWG2 was digested with SpeI and XmaI and ligated with the PCR fragment SpeI-EGFP-T35S-XmaI. Then, this plasmid was digested with SacI and SpeI, and ligated with the PCR fragment SacI-pCORK1-SpeI to create the pCORK1::EGFP construct. The primers used are listed in the Supplementary Table S3. The promoter sequence was confirmed by Sanger sequencing (Eurofins Genomics, GmBH, 85560 Ebersberg, Germany). The transformation of Arabidopsis was performed by floral dip with the Agrobacterium GV3101 strain as described previously [95]. Transgenic plants were selected using BASTA (Bayer AG, Leverkusen, Germany).

4.7. Confocal Microscopy

The fourteen-day-old Arabidopsis seedlings were examined using an LSM 880 microscope (Zeiss Microscopy GmbH, München, Germany) with the 488 nm laser line produced by an argon multiline laser (11.5 mW). The images were taken by use of a 40× objective (Plan-Apochromat 40_/0.8). Lambda stacks were created using the 32 channel GaAsP detector followed by linear unmixing with the ZEN (black) 2.3 SP1 software. Z-stacks were taken from relevant areas of the samples and maximum intensity projections were produced with the ZEN software (Zeiss Microscopy GmbH).

4.8. Long Term Exposure to CB and CT

The SWT and cork1 mutant seedlings were grown on half Murashige and Skoog media for 9 days, and on the 10th day, they were transferred to PNM either without CB/CT (control) or with filter-sterilized CB (1 mM, 10 mM, 30 mM, 50 mM, 100 mM) and grown for an additional 6 days. For the CT experiment, 10 µM of filter-sterilized CT was added to PNM media. The roots of 15-day-old plants from both experiments (10 mM CB or 10 µM CT) were harvested separately, and weights were measured and used for phytohormone, sugars, and glucosinolate analyses.

4.9. Short Term Exposure to CB

The SWT and cork1 mutant seedlings were grown for 14 days on half Murashige and Skoog media. An amount of 48–60 seedlings were then transferred to PNM media (control), PNM with PEG 6000, CB (10 mM), or CB (100 mM). An amount of 15 mM PEG 6000 was used, as its osmotic potential is the same as that of 100 mM CB. PEG 6000 was used to eliminate the effect of osmotic stress shock on downstream responses caused by high amounts of CB. The plants were harvested after 6 h and used for sugar, amino acid, glucosinolate, and phytohormone analyses.

4.10. Phytohormone Analyses by Lipid Chromatography (LC)-Mass Spectrometry (MS)/MS

To quantify phytohormone profiles, 150–210 mg of fresh frozen tissue was extracted with 1 mL of 80% methanol (v/v) containing 40 ng D4-SA (Santa Cruz Biotechnology, Dallas, TX, USA), 40 ng D6-ABA (Toronto Research Chemicals, Toronto, ON, Canada), 40 ng D6-JA, 8 ng D6-JA-Ile (both HPC Standards GmbH, Cunnersdorf, Germany) and 40 ng of D5-indole-3-acetic-acid (OlChemIm s.r.o., Olomouc, Czech Republic). Phytohormone analysis was performed on an Agilent 1260 series high-performance LC (HPLC) system (Agilent Technologies, Santa Clara, CA, USA) as in [96], with the modification that a tandem mass spectrometer QTRAP 6500 (SCIEX, Darmstadt, Germany) was used in multiple reaction monitoring (MRM) mode with parameters listed in Supplementary Table S4. Concentrations of cis-(+)-12-oxo-phytodienoic acid (cis-OPDA) and OH-JA were determined relative to the quantity of the internal standard D6-JA applying a response factor (RF) of 1.0, while OH-JA-Ile and COOH-JA-Ile were quantified relative to D6-JA-Ile, applying an RF of 1.0. Since we observed that both the D6-labeled JA and D6-labeled JA-Ile standards (HPC Standards GmbH, Cunnersdorf, Germany) contained 40% of the corresponding D5-labeled compounds, the sum of the peak areas of the D5- and D6-labeled compounds was used for quantification. Indole-3-acetic acid (IAA) was measured with the same LC-MS system and the same chromatographic parameters, but ionization was in positive mode with MRM parameters, as shown in Supplementary Table S5.

4.11. Sugar Measurements

Soluble sugars were analyzed from the 80% (v/v) methanol extracts for phytohormone analysis at 1:10 dilution in water containing 5 µg/mL 13C6-glucose (Sigma-Aldrich) and 5 µg/mL 13C6-fructose (Toronto Research Chemicals, Toronto, Canada), by LC-MS/MS as described in [97]. Sugars were analyzed using an Agilent 1200 HPLC system equipped with an API3200 tandem mass spectrometer (AB Sciex, Darmstadt, Germany). The HPLC was equipped with a hydrophilic interaction liquid chromatography (HILIC) column (apHera-NH2 Polymer; Supelco, Bellefonte, PA, USA), and chromatographic separation was performed using water and acetonitrile as mobile phases A and B, respectively, with a flow rate of 1.0 mL min−1. The column temperature was maintained at 20 °C. The mass spectrometer equipped with a turbo spray ion source was operated in the negative ionization mode. The ion spray voltage was maintained at −4500 eV and the turbo gas temperature was set at 600 °C. Nebulizing gas was set at 60 psi, curtain gas at 40 psi, heating gas at 60 psi, and collision gas at a medium level. Multiple reaction monitoring (MRM) was used to monitor the analyte parent ion to product ion formation (Supplementary Table S6). Data were acquired using the software Analyst 1.5.1 and quantification was performed using the software MultiQuant 3.0.3 (Sciex, Framingham, MA, USA). The concentrations of glucose and fructose were determined relative to the internal standards of 13C6-glucose and 13C6-fructose, respectively. The contents of sucrose, trehalose (both from Sigma-Aldrich), and mannitol (Honeywell Fluka, Marxen, Germany) were calculated based on external standard curves.

4.12. Quantifcation of Glucosinolates

Glucosinolate concentrations were quantified using the same raw extracts as used to quantify phytohormone profiles, and analyzed by HPLC-ultraviolet detection (UV) as described in [98]. In short, a 700 µL aliquot of the 80% methanol raw extract for phytohormone analysis was loaded onto DEAE Sephadex A-25 columns and treated with arylsulfatase for desulfation (Sigma-Aldrich) [99]. The eluted desulfoglucosinolates were separated using HPLC (Agilent 1100 HPLC system, Agilent Technologies) on a reversed phase C-18 column (Nucleodur Sphinx RP, 250 × 4.6 mm, 5 µm, Machrey-Nagel, Düren, Germany) with a water (A)–acetonitrile (B) gradient (0–1 min, 1.5% B; 1–6 min, 1.5–5% B; 6–8 min, 5–7% B; 8–18 min, 7–21% B; 18–23 min, 21–29% B; 23–23.1 min, 29–100% B; 23.1–24 min 100% B, and 24.1–28 min 1.5% B; flow 1.0 mL min−1). Detection was performed with a photodiode array detector and peaks were integrated at 229 nm. Desulfated glucosinolates were identified by comparison of the retention time and UV spectra to those of purified standards previously extracted from Arabidopsis thaliana [99]. We used the following molar response factors for the quantification of individual glucosinolates relative to the internal standard (4-hydroxybenzyl glucosinolate): aliphatic glucosinolates 2.0, indole glucosinolates 0.5 [93].

4.13. Amino acid Analysis

Amino acids were quantified with an LC-MS/MS using a C18-column (XDB-C18, 50 × 4.6 mm × 1.8 µm; Agilent, Santa Clara, CA, USA) after diluting the 80% methanol extracts from phytohormone analysis by 1:10 (v:v) with water containing 10 µg ml−1 of a mixture of 15N/13C labeled amino acids (Isotec, Miamisburg, OH, USA) and 5 µM of D5-tryptophane (Cambridge Isotope Laboratories, Inc., Andover, MA, USA). For details on the chromatography and mass spectrometry (Agilent 1260 LC system; Agilent Technologies, Santa Clara, CA, USA) coupled with a QTRAP 6500 tandem mass spectrometer (SCIEX, Darmstadt, Germany), see [100] and Supplementary Table S7. The mass spectrometer was operated in positive ionization mode in multiple reaction monitoring mode. All amino acids were quantified relative to the peak area of the corresponding isotopically-labeled compound, except for asparagine (using isotopically-labeled aspartate and a response factor of 1.0).

4.14. Statistical Analysis

GraphPad PRISM 9 and ORIGINPRO 2023 softwares were used for data analysis and plotting graphs. The statistical details of the experiments are specified in the figure legends. Statistical significance of data under normal distribution was tested using a two-tailed unpaired Student’s t-test for pairwise comparisons. For experiments involving one or two classes of factors, statistically significant differences were calculated using one- and two-way analysis of variance with the Holm–Sidak multiple comparison test and Tukey’s post hoc test. Normality was verified using the Shapiro–Wilk test. Data that did not pass this test were subjected to log transformation or the Kruska–Walis test. The significance threshold was set at p < 0.05. Figures were arranged with LibreOffice Draw 5.1.6.2.

5. Conclusions

We present physiological evidence that the cellooligomer/CORK1 signaling pathway exhibits crosstalk with PAMP- and DAMP-triggered immune responses and the sugar metabolism in Arabidopsis roots. Further studies are required to confirm this at the molecular and genetic levels.

Supplementary Materials

The following supporting information can be downloaded at: https://www.mdpi.com/article/10.3390/ijms25063472/s1.

Author Contributions

A.G. and R.O. developed the idea and organized the project. A.G. performed the experiments, collected the samples and data, analyzed the results, and plotted the figures. M.R. carried out metabolomics and data analysis. A.F. performed confocal microscopy and arranged the figures. A.M. provided the materials for short-term exposure experiment and proofread the manuscript. A.G. and R.O. wrote up the study. All authors contributed to the manuscript. All authors have read and agreed to the published version of the manuscript.

Funding

This work was supported by the Deutsche Forschungsgemeinschaft (CRC1127, project ID: 239748522 to R.O.).

Institutional Review Board Statement

Not applicable.

Informed Consent Statement

Not applicable.

Data Availability Statement

Raw sequences for the GWAS have been deposited to the NCBI Gene Expression Omnibus (GEO) database (accession no. GSE197891). For transcriptome analysis, raw sequences and the count tables after DESeq2 analysis have been deposited to the Gene Expression Omnibus (GEO) database (accession no. GSE198092). The mass spectrometry proteomics data have been deposited to the ProteomeXchange Consortium via the PRIDE partner repository [101] with dataset identifier PXD033224.

Acknowledgments

A.G. is supported by the International Max-Planck-Research School (Max-Planck Institute for Chemical Ecology). We also thank Claudia Röppischer and Sarah Mußbach for excellent technical assistance. Special thanks to the greenhouse team at Max Planck Institute for Chemical Ecology for taking care of the A. thaliana transformants.

Conflicts of Interest

The authors declare no conflicts of interest.

References

  1. Wolf, S. Cell Wall Signaling in Plant Development and Defense. Annu. Rev. Plant Biol. 2022, 73, 323–353. [Google Scholar] [CrossRef] [PubMed]
  2. Wan, J.; He, M.; Hou, Q.; Zou, L.; Yang, Y.; Wei, Y.; Chen, X. Cell wall associated immunity in plants. Stress Biol. 2021, 1, 3. [Google Scholar] [CrossRef] [PubMed]
  3. Underwood, W. The plant cell wall: A dynamic barrier against pathogen invasion. Front. Plant Sci. 2012, 3, 85. [Google Scholar] [CrossRef] [PubMed]
  4. Kohorn, B.D. Cell wall-associated kinases and pectin perception. J. Exp. Bot. 2016, 67, 489–494. [Google Scholar] [CrossRef] [PubMed]
  5. Tseng, Y.-H.; Scholz, S.S.; Fliegmann, J.; Krüger, T.; Gandhi, A.; Furch, A.C.; Kniemeyer, O.; Brakhage, A.A.; Oelmüller, R. CORK1, A LRR-Malectin Receptor Kinase, Is Required for Cellooligomer-Induced Responses in Arabidopsis thaliana. Cells 2022, 11, 2960. [Google Scholar] [CrossRef] [PubMed]
  6. Martín-Dacal, M.; Fernández-Calvo, P.; Jiménez-Sandoval, P.; Lopez, G.; Garrido-Arandía, M.; Rebaque, D.; Del Hierro, I.; Berlanga, D.J.; Torres, M.A.; Kumar, V. Arabidopsis immune responses triggered by cellulose-and mixed-linked glucan-derived oligosaccharides require a group of leucine-rich repeat malectin receptor kinases. Plant J. 2023, 113, 833–850. [Google Scholar] [CrossRef] [PubMed]
  7. Rebaque, D.; Del Hierro, I.; López, G.; Bacete, L.; Vilaplana, F.; Dallabernardina, P.; Pfrengle, F.; Jordá, L.; Sánchez-Vallet, A.; Pérez, R. Cell wall-derived mixed-linked β-1, 3/1, 4-glucans trigger immune responses and disease resistance in plants. Plant J. 2021, 106, 601–615. [Google Scholar] [CrossRef] [PubMed]
  8. Yang, C.; Liu, R.; Pang, J.; Ren, B.; Zhou, H.; Wang, G.; Wang, E.; Liu, J. Poaceae-specific cell wall-derived oligosaccharides activate plant immunity via OsCERK1 during Magnaporthe oryzae infection in rice. Nat. Commun. 2021, 12, 2178. [Google Scholar] [CrossRef]
  9. Liu, M.; Hu, J.; Zhang, A.; Dai, Y.; Chen, W.; He, Y.; Zhang, H.; Zheng, X.; Zhang, Z. Auxilin-like protein MoSwa2 promotes effector secretion and virulence as a clathrin uncoating factor in the rice blast fungus Magnaporthe oryzae. New Phytol. 2021, 230, 720–736. [Google Scholar] [CrossRef]
  10. Oelmüller, R.; Tseng, Y.-H.; Gandhi, A. Signals and Their Perception for Remodelling, Adjustment and Repair of the Plant Cell Wall. Int. J. Mol. Sci. 2023, 24, 7417. [Google Scholar] [CrossRef]
  11. Baez, L.A.; Tichá, T.; Hamann, T. Cell wall integrity regulation across plant species. Plant Mol. Biol. 2022, 109, 483–504. [Google Scholar] [CrossRef] [PubMed]
  12. Kong, F.; You, H.; Zheng, K.; Tang, R.; Zheng, C. The crosstalk between pattern-recognition receptor signaling and calcium signaling. Int. J. Biol. Macromol. 2021, 192, 745–756. [Google Scholar] [CrossRef] [PubMed]
  13. Chen, J.; Sun, M.; Xiao, G.; Shi, R.; Zhao, C.; Zhang, Q.; Yang, S.; Xuan, Y. Starving the enemy: How plant and microbe compete for sugar on the border. Front. Plant Sci. 2023, 14, 1230254. [Google Scholar] [CrossRef] [PubMed]
  14. Johnson, J.M.; Thürich, J.; Petutschnig, E.K.; Altschmied, L.; Meichsner, D.; Sherameti, I.; Dindas, J.; Mrozinska, A.; Paetz, C.; Scholz, S.S. A poly (A) ribonuclease controls the cellotriose-based interaction between Piriformospora indica and its host Arabidopsis. Plant Physiol. 2018, 176, 2496–2514. [Google Scholar] [CrossRef] [PubMed]
  15. Gandhi, A.; Tseng, Y.-H.; Oelmüller, R. The damage-associated molecular pattern cellotriose alters the phosphorylation pattern of proteins involved in cellulose synthesis and trans-Golgi trafficking in Arabidopsis thaliana. Plant Signal. Behav. 2023, 18, 2184352. [Google Scholar] [CrossRef] [PubMed]
  16. Li, J.; Wen, J.; Lease, K.A.; Doke, J.T.; Tax, F.E.; Walker, J.C. BAK1, an Arabidopsis LRR receptor-like protein kinase, interacts with BRI1 and modulates brassinosteroid signaling. Cell 2002, 110, 213–222. [Google Scholar] [CrossRef] [PubMed]
  17. Nam, K.H.; Li, J. BRI1/BAK1, a receptor kinase pair mediating brassinosteroid signaling. Cell 2002, 110, 203–212. [Google Scholar] [CrossRef]
  18. Chinchilla, D.; Zipfel, C.; Robatzek, S.; Kemmerling, B.; Nürnberger, T.; Jones, J.D.; Felix, G.; Boller, T. A flagellin-induced complex of the receptor FLS2 and BAK1 initiates plant defence. Nature 2007, 448, 497–500. [Google Scholar] [CrossRef]
  19. Heese, A.; Hann, D.R.; Gimenez-Ibanez, S.; Jones, A.M.; He, K.; Li, J.; Schroeder, J.I.; Peck, S.C.; Rathjen, J.P. The receptor-like kinase SERK3/BAK1 is a central regulator of innate immunity in plants. Proc. Natl. Acad. Sci. USA 2007, 104, 12217–12222. [Google Scholar] [CrossRef]
  20. Ma, X.; Xu, G.; He, P.; Shan, L. SERKing coreceptors for receptors. Trends Plant Sci. 2016, 21, 1017–1033. [Google Scholar] [CrossRef]
  21. Fontes, E.P. SERKs and NIKs: Coreceptors or signaling hubs in a complex crosstalk between growth and defense? Curr. Opin. Plant Biol. 2023, 77, 102447. [Google Scholar] [CrossRef] [PubMed]
  22. Antolín-Llovera, M.; Ried, M.K.; Binder, A.; Parniske, M. Receptor kinase signaling pathways in plant-microbe interactions. Annu. Rev. Phytopathol. 2012, 50, 451–473. [Google Scholar] [CrossRef] [PubMed]
  23. Böhm, H.; Albert, I.; Fan, L.; Reinhard, A.; Nürnberger, T. Immune receptor complexes at the plant cell surface. Curr. Opin. Plant Biol. 2014, 20, 47–54. [Google Scholar] [CrossRef] [PubMed]
  24. Roux, M.; Schwessinger, B.; Albrecht, C.; Chinchilla, D.; Jones, A.; Holton, N.; Malinovsky, F.G.; Tör, M.; de Vries, S.; Zipfel, C. The Arabidopsis leucine-rich repeat receptor—Like kinases BAK1/SERK3 and BKK1/SERK4 are required for innate immunity to hemibiotrophic and biotrophic pathogens. Plant Cell 2011, 23, 2440–2455. [Google Scholar] [CrossRef]
  25. Schulze, B.; Mentzel, T.; Jehle, A.K.; Mueller, K.; Beeler, S.; Boller, T.; Felix, G.; Chinchilla, D. Rapid heteromerization and phosphorylation of ligand-activated plant transmembrane receptors and their associated kinase BAK1. J. Biol. Chem. 2010, 285, 9444–9451. [Google Scholar] [CrossRef]
  26. Lee, J.S.; Kuroha, T.; Hnilova, M.; Khatayevich, D.; Kanaoka, M.M.; McAbee, J.M.; Sarikaya, M.; Tamerler, C.; Torii, K.U. Direct interaction of ligand–receptor pairs specifying stomatal patterning. Genes Dev. 2012, 26, 126–136. [Google Scholar] [CrossRef]
  27. Ou, Y.; Lu, X.; Zi, Q.; Xun, Q.; Zhang, J.; Wu, Y.; Shi, H.; Wei, Z.; Zhao, B.; Zhang, X. RGF1 INSENSITIVE 1 to 5, a group of LRR receptor-like kinases, are essential for the perception of root meristem growth factor 1 in Arabidopsis thaliana. Cell Res. 2016, 26, 686–698. [Google Scholar] [CrossRef]
  28. Shinohara, H.; Mori, A.; Yasue, N.; Sumida, K.; Matsubayashi, Y. Identification of three LRR-RKs involved in perception of root meristem growth factor in Arabidopsis. Proc. Natl. Acad. Sci. USA 2016, 113, 3897–3902. [Google Scholar] [CrossRef]
  29. Wang, P.; Clark, N.M.; Nolan, T.M.; Song, G.; Bartz, P.M.; Liao, C.-Y.; Montes-Serey, C.; Katz, E.; Polko, J.K.; Kieber, J.J. Integrated omics reveal novel functions and underlying mechanisms of the receptor kinase FERONIA in Arabidopsis thaliana. Plant Cell 2022, 34, 2594–2614. [Google Scholar] [CrossRef]
  30. Tang, J.; Wu, D.; Li, X.; Wang, L.; Xu, L.; Zhang, Y.; Xu, F.; Liu, H.; Xie, Q.; Dai, S. Plant immunity suppression via PHR1-RALF-FERONIA shapes the root microbiome to alleviate phosphate starvation. EMBO J. 2022, 41, e109102. [Google Scholar] [CrossRef]
  31. Yuan, M.; Ngou, B.P.M.; Ding, P.; Xin, X.-F. PTI-ETI crosstalk: An integrative view of plant immunity. Curr. Opin. Plant Biol. 2021, 62, 102030. [Google Scholar] [CrossRef] [PubMed]
  32. Ngou, B.P.M.; Jones, J.D.; Ding, P. Plant immune networks. Trends Plant Sci. 2022, 27, 255–273. [Google Scholar] [CrossRef] [PubMed]
  33. Barnes, W.J.; Anderson, C.T. Release, recycle, rebuild: Cell-wall remodeling, autodegradation, and sugar salvage for new wall biosynthesis during plant development. Mol. Plant 2018, 11, 31–46. [Google Scholar] [CrossRef] [PubMed]
  34. Doidy, J.; Grace, E.; Kühn, C.; Simon-Plas, F.; Casieri, L.; Wipf, D. Sugar transporters in plants and in their interactions with fungi. Trends Plant Sci. 2012, 17, 413–422. [Google Scholar] [CrossRef] [PubMed]
  35. Bezrutczyk, M.; Yang, J.; Eom, J.S.; Prior, M.; Sosso, D.; Hartwig, T.; Szurek, B.; Oliva, R.; Vera-Cruz, C.; White, F.F. Sugar flux and signaling in plant–microbe interactions. Plant J. 2018, 93, 675–685. [Google Scholar] [CrossRef] [PubMed]
  36. Bavnhøj, L.; Paulsen, P.A.; Flores-Canales, J.C.; Schiøtt, B.; Pedersen, B.P. Molecular mechanism of sugar transport in plants unveiled by structures of glucose/H+ symporter STP10. Nat. Plants 2021, 7, 1409–1419. [Google Scholar] [CrossRef] [PubMed]
  37. Lee, H.G.; Seo, P.J. Transcriptional activation of SUGAR TRANSPORT PROTEIN 13 mediates biotic and abiotic stress signaling. Plant Signal. Behav. 2021, 16, 1920759. [Google Scholar] [CrossRef] [PubMed]
  38. Lemonnier, P.; Gaillard, C.; Veillet, F.; Verbeke, J.; Lemoine, R.; Coutos-Thévenot, P.; La Camera, S. Expression of Arabidopsis sugar transport protein STP13 differentially affects glucose transport activity and basal resistance to Botrytis cinerea. Plant Mol. Biol. 2014, 85, 473–484. [Google Scholar] [CrossRef]
  39. Gupta, M.; Dubey, S.; Jain, D.; Chandran, D. The Medicago truncatula sugar transport protein 13 and its Lr67res-like variant confer powdery mildew resistance in legumes via defense modulation. Plant Cell Physiol. 2021, 62, 650–667. [Google Scholar] [CrossRef]
  40. Wang, X.; Du, Y.; Yu, D. Trehalose phosphate synthase 5-dependent trehalose metabolism modulates basal defense responses in Arabidopsis thaliana. J. Integr. Plant Biol. 2019, 61, 509–527. [Google Scholar] [CrossRef]
  41. Djonović, S.; Urbach, J.M.; Drenkard, E.; Bush, J.; Feinbaum, R.; Ausubel, J.L.; Traficante, D.; Risech, M.; Kocks, C.; Fischbach, M.A. Trehalose biosynthesis promotes Pseudomonas aeruginosa pathogenicity in plants. PLoS Pathog. 2013, 9, e1003217. [Google Scholar] [CrossRef] [PubMed]
  42. Singh, V.; Louis, J.; Ayre, B.G.; Reese, J.C.; Shah, J. TREHALOSE PHOSPHATE SYNTHASE11-dependent trehalose metabolism promotes Arabidopsis thaliana defense against the phloem-feeding insect Myzus persicae. Plant J. 2011, 67, 94–104. [Google Scholar] [CrossRef] [PubMed]
  43. Wang, X.-Y.; Li, D.-Z.; Li, Q.; Ma, Y.-Q.; Yao, J.-W.; Huang, X.; Xu, Z.-Q. Metabolomic analysis reveals the relationship between AZI1 and sugar signaling in systemic acquired resistance of Arabidopsis. Plant Physiol. Biochem. 2016, 107, 273–287. [Google Scholar] [CrossRef] [PubMed]
  44. Mandal, M.K.; Chanda, B.; Xia, Y.; Yu, K.; Sekine, K.; Gao, Q.-m.; Selote, D.; Kachroo, A.; Kachroo, P. Glycerol-3-phosphate and systemic immunity. Plant Signal. Behav. 2011, 6, 1871–1874. [Google Scholar] [CrossRef] [PubMed]
  45. Kohorn, B.D.; Kobayashi, M.; Johansen, S.; Riese, J.; Huang, L.F.; Koch, K.; Fu, S.; Dotson, A.; Byers, N. An Arabidopsis cell wall-associated kinase required for invertase activity and cell growth. Plant J. 2006, 46, 307–316. [Google Scholar] [CrossRef] [PubMed]
  46. He, J.; Kong, M.; Qian, Y.; Gong, M.; Lv, G.; Song, J. Cellobiose elicits immunity in lettuce conferring resistance to Botrytis cinerea. J. Exp. Bot. 2023, 74, 1022–1038. [Google Scholar] [CrossRef] [PubMed]
  47. Salam, U.; Ullah, S.; Tang, Z.-H.; Elateeq, A.A.; Khan, Y.; Khan, J.; Khan, A.; Ali, S. Plant metabolomics: An overview of the role of primary and secondary metabolites against different environmental stress factors. Life 2023, 13, 706. [Google Scholar] [CrossRef]
  48. Zeier, J. New insights into the regulation of plant immunity by amino acid metabolic pathways. Plant Cell Environ. 2013, 36, 2085–2103. [Google Scholar] [CrossRef]
  49. Cai, J.; Aharoni, A. Amino acids and their derivatives mediating defense priming and growth tradeoff. Curr. Opin. Plant Biol. 2022, 69, 102288. [Google Scholar] [CrossRef]
  50. Mutwil, M.; Debolt, S.; Persson, S. Cellulose synthesis: A complex complex. Curr. Opin. Plant Biol. 2008, 11, 252–257. [Google Scholar] [CrossRef]
  51. Souza, C.d.A.; Li, S.; Lin, A.Z.; Boutrot, F.; Grossmann, G.; Zipfel, C.; Somerville, S.C. Cellulose-derived oligomers act as damage-associated molecular patterns and trigger defense-like responses. Plant Physiol. 2017, 173, 2383–2398. [Google Scholar] [CrossRef] [PubMed]
  52. Schallus, T.; Jaeckh, C.; Fehér, K.; Palma, A.S.; Liu, Y.; Simpson, J.C.; Mackeen, M.; Stier, G.; Gibson, T.J.; Feizi, T. Malectin: A novel carbohydrate-binding protein of the endoplasmic reticulum and a candidate player in the early steps of protein N-glycosylation. Mol. Biol. Cell 2008, 19, 3404–3414. [Google Scholar] [CrossRef]
  53. Johnson, J.M.; Sherameti, I.; Nongbri, P.L.; Oelmüller, R. Standardized conditions to study beneficial and nonbeneficial traits in the Piriformospora indica/Arabidopsis thaliana interaction. In Piriformospora Indica: Sebacinales and Their Biotechnological Applications; Springer: Berlin/Heidelberg, Germany, 2013; pp. 325–343. [Google Scholar]
  54. Yeh, Y.-H.; Panzeri, D.; Kadota, Y.; Huang, Y.-C.; Huang, P.-Y.; Tao, C.-N.; Roux, M.; Chien, H.-C.; Chin, T.-C.; Chu, P.-W. The Arabidopsis malectin-like/LRR-RLK IOS1 is critical for BAK1-dependent and BAK1-independent pattern-triggered immunity. Plant Cell 2016, 28, 1701–1721. [Google Scholar] [CrossRef] [PubMed]
  55. Chen, J.; Zhu, S.; Ming, Z.; Liu, X.; Yu, F. FERONIA cytoplasmic domain: Node of varied signal outputs. Abiotech 2020, 1, 135–146. [Google Scholar] [CrossRef] [PubMed]
  56. Xie, Y.; Sun, P.; Li, Z.; Zhang, F.; You, C.; Zhang, Z. FERONIA receptor kinase integrates with hormone signaling to regulate plant growth, development, and responses to environmental stimuli. Int. J. Mol. Sci. 2022, 23, 3730. [Google Scholar] [CrossRef]
  57. Zhang, X.; Yang, Z.; Wu, D.; Yu, F. RALF–FERONIA signaling: Linking plant immune response with cell growth. Plant Commun. 2020, 1, 100084. [Google Scholar] [CrossRef]
  58. Franck, C.M.; Westermann, J.; Boisson-Dernier, A. Plant malectin-like receptor kinases: From cell wall integrity to immunity and beyond. Annu. Rev. Plant Biol. 2018, 69, 301–328. [Google Scholar] [CrossRef] [PubMed]
  59. Liao, H.; Tang, R.; Zhang, X.; Luan, S.; Yu, F. FERONIA receptor kinase at the crossroads of hormone signaling and stress responses. Plant Cell Physiol. 2017, 58, 1143–1150. [Google Scholar] [CrossRef]
  60. Yang, T.; Wang, L.; Li, C.; Liu, Y.; Zhu, S.; Qi, Y.; Liu, X.; Lin, Q.; Luan, S.; Yu, F. Receptor protein kinase FERONIA controls leaf starch accumulation by interacting with glyceraldehyde-3-phosphate dehydrogenase. Biochem. Biophys. Res. Commun. 2015, 465, 77–82. [Google Scholar] [CrossRef]
  61. Yeats, T.H.; Sorek, H.; Wemmer, D.E.; Somerville, C.R. Cellulose deficiency is enhanced on hyper accumulation of sucrose by a H+-coupled sucrose symporter. Plant Physiol. 2016, 171, 110–124. [Google Scholar] [CrossRef]
  62. Xu, G.; Chen, W.; Song, L.; Chen, Q.; Zhang, H.; Liao, H.; Zhao, G.; Lin, F.; Zhou, H.; Yu, F. FERONIA phosphorylates E3 ubiquitin ligase ATL6 to modulate the stability of 14-3-3 proteins in response to the carbon/nitrogen ratio. J. Exp. Bot. 2019, 70, 6375–6388. [Google Scholar] [CrossRef] [PubMed]
  63. Feng, W.; Kita, D.; Peaucelle, A.; Cartwright, H.N.; Doan, V.; Duan, Q.; Liu, M.-C.; Maman, J.; Steinhorst, L.; Schmitz-Thom, I. The FERONIA receptor kinase maintains cell-wall integrity during salt stress through Ca2+ signaling. Curr. Biol. 2018, 28, 666–675.e665. [Google Scholar] [CrossRef] [PubMed]
  64. Stegmann, M.; Monaghan, J.; Smakowska-Luzan, E.; Rovenich, H.; Lehner, A.; Holton, N.; Belkhadir, Y.; Zipfel, C. The receptor kinase FER is a RALF-regulated scaffold controlling plant immune signaling. Science 2017, 355, 287–289. [Google Scholar] [CrossRef] [PubMed]
  65. Pascual-Morales, E.; Jiménez-Chávez, P.; Olivares-Grajales, J.E.; Sarmiento-López, L.; García-Niño, W.R.; López-López, A.; Goodwin, P.H.; Palacios-Martínez, J.; Chávez-Martínez, A.I.; Cárdenas, L. Role of a LORELEI-like gene from Phaseolus vulgaris during a mutualistic interaction with Rhizobium tropici. PLoS ONE 2023, 18, e0294334. [Google Scholar] [CrossRef] [PubMed]
  66. Gronnier, J.; Franck, C.M.; Stegmann, M.; DeFalco, T.A.; Abarca, A.; Von Arx, M.; Dünser, K.; Lin, W.; Yang, Z.; Kleine-Vehn, J. Regulation of immune receptor kinase plasma membrane nanoscale organization by a plant peptide hormone and its receptors. eLife 2022, 11, e74162. [Google Scholar] [CrossRef] [PubMed]
  67. Zarattini, M.; Corso, M.; Kadowaki, M.A.; Monclaro, A.; Magri, S.; Milanese, I.; Jolivet, S.; de Godoy, M.O.; Hermans, C.; Fagard, M. LPMO-oxidized cellulose oligosaccharides evoke immunity in Arabidopsis conferring resistance towards necrotrophic fungus B. cinerea. Commun. Biol. 2021, 4, 727. [Google Scholar] [CrossRef] [PubMed]
  68. Segonzac, C.; Feike, D.; Gimenez-Ibanez, S.; Hann, D.R.; Zipfel, C.; Rathjen, J.P. Hierarchy and roles of pathogen-associated molecular pattern-induced responses in Nicotiana benthamiana. Plant Physiol. 2011, 156, 687–699. [Google Scholar] [CrossRef] [PubMed]
  69. Castro, B.; Citterico, M.; Kimura, S.; Stevens, D.M.; Wrzaczek, M.; Coaker, G. Stress-induced reactive oxygen species compartmentalization, perception and signalling. Nat. Plants 2021, 7, 403–412. [Google Scholar] [CrossRef]
  70. Zhang, Y.; Zhu, H.; Zhang, Q.; Li, M.; Yan, M.; Wang, R.; Wang, L.; Welti, R.; Zhang, W.; Wang, X. Phospholipase Dα1 and phosphatidic acid regulate NADPH oxidase activity and production of reactive oxygen species in ABA-mediated stomatal closure in Arabidopsis. Plant Cell 2009, 21, 2357–2377. [Google Scholar] [CrossRef]
  71. Yun, B.-W.; Feechan, A.; Yin, M.; Saidi, N.B.; Le Bihan, T.; Yu, M.; Moore, J.W.; Kang, J.-G.; Kwon, E.; Spoel, S.H. S-nitrosylation of NADPH oxidase regulates cell death in plant immunity. Nature 2011, 478, 264–268. [Google Scholar] [CrossRef]
  72. Rouina, H.; Tseng, Y.-H.; Nataraja, K.N.; Uma Shaanker, R.; Oelmüller, R. Arabidopsis Restricts Sugar Loss to a Colonizing Trichoderma harzianum Strain by Downregulating SWEET11 and-12 and Upregulation of SUC1 and SWEET2 in the Roots. Microorganisms 2021, 9, 1246. [Google Scholar] [CrossRef]
  73. Durand, M.; Mainson, D.; Porcheron, B.; Maurousset, L.; Lemoine, R.; Pourtau, N. Carbon source–sink relationship in Arabidopsis thaliana: The role of sucrose transporters. Planta 2018, 247, 587–611. [Google Scholar] [CrossRef] [PubMed]
  74. Wu, L.B.; Eom, J.S.; Isoda, R.; Li, C.; Char, S.N.; Luo, D.; Schepler-Luu, V.; Nakamura, M.; Yang, B.; Frommer, W.B. OsSWEET11b, a potential sixth leaf blight susceptibility gene involved in sugar transport-dependent male fertility. New Phytol. 2022, 234, 975–989. [Google Scholar] [CrossRef] [PubMed]
  75. Zhang, W.; Wang, S.; Yu, F.; Tang, J.; Shan, X.; Bao, K.; Yu, L.; Wang, H.; Fei, Z.; Li, J. Genome-wide characterization and expression profiling of SWEET genes in cabbage (Brassica oleracea var. capitata L.) reveal their roles in chilling and clubroot disease responses. BMC Genom. 2019, 20, 93. [Google Scholar] [CrossRef] [PubMed]
  76. Janse van Rensburg, H.C.; Takács, Z.; Freynschlag, F.; Toksoy Öner, E.; Jonak, C.; Van den Ende, W. Fructans prime ROS dynamics and Botrytis cinerea resistance in Arabidopsis. Antioxidants 2020, 9, 805. [Google Scholar] [CrossRef]
  77. Nunes-Nesi, A.; Fernie, A.R.; Stitt, M. Metabolic and signaling aspects underpinning the regulation of plant carbon nitrogen interactions. Mol. Plant 2010, 3, 973–996. [Google Scholar] [CrossRef] [PubMed]
  78. Lee, K.-T.; Liao, H.-S.; Hsieh, M.-H. Glutamine metabolism, sensing, and signaling in plants. Plant Cell Physiol. 2023, 64, 1466–1481. [Google Scholar] [CrossRef]
  79. Goto, Y.; Maki, N.; Ichihashi, Y.; Kitazawa, D.; Igarashi, D.; Kadota, Y.; Shirasu, K. Exogenous treatment with glutamate induces immune responses in Arabidopsis. Mol. Plant-Microbe Interact. 2020, 33, 474–487. [Google Scholar] [CrossRef]
  80. Hildebrandt, T.M. Synthesis versus degradation: Directions of amino acid metabolism during Arabidopsis abiotic stress response. Plant Mol. Biol. 2018, 98, 121–135. [Google Scholar] [CrossRef]
  81. Maaroufi-Dguimi, H.; Debouba, M.; Gaufichon, L.; Clément, G.; Gouia, H.; Hajjaji, A.; Suzuki, A. An Arabidopsis mutant disrupted in ASN2 encoding asparagine synthetase 2 exhibits low salt stress tolerance. Plant Physiol. Biochem. 2011, 49, 623–628. [Google Scholar] [CrossRef]
  82. Fonseca, J.P.; Oh, S.; Boschiero, C.; Watson, B.; Huhman, D.; Mysore, K.S. The Arabidopsis iron-sulfur (Fe-S) cluster gene MFDX1 plays a role in host and nonhost disease resistance by accumulation of defense-related metabolites. Int. J. Mol. Sci. 2021, 22, 7147. [Google Scholar] [CrossRef] [PubMed]
  83. Curtis, T.Y.; Bo, V.; Tucker, A.; Halford, N.G. Construction of a network describing asparagine metabolism in plants and its application to the identification of genes affecting asparagine metabolism in wheat under drought and nutritional stress. Food Energy Secur. 2018, 7, e00126. [Google Scholar] [CrossRef] [PubMed]
  84. Jiao, Y.; Lei, W.; Xu, W.; Chen, W.-L. Glucose signaling, AtRGS1 and plant autophagy. Plant Signal. Behav. 2019, 14, 1607465. [Google Scholar] [CrossRef]
  85. Dong, T.; Park, Y.; Hwang, I. Abscisic acid: Biosynthesis, inactivation, homoeostasis and signalling. Essays Biochem. 2015, 58, 29–48. [Google Scholar] [PubMed]
  86. Kliebenstein, D.J.; Kroymann, J.; Brown, P.; Figuth, A.; Pedersen, D.; Gershenzon, J.; Mitchell-Olds, T. Genetic control of natural variation in Arabidopsis glucosinolate accumulation. Plant Physiol. 2001, 126, 811–825. [Google Scholar] [CrossRef] [PubMed]
  87. Murashige, T.; Skoog, F. A revised medium for rapid growth and bio assays with tobacco tissue cultures. Physiol. Plant. 1962, 15, 473–497. [Google Scholar] [CrossRef]
  88. Michal Johnson, J.; Reichelt, M.; Vadassery, J.; Gershenzon, J.; Oelmüller, R. An Arabidopsis mutant impaired in intracellular calcium elevation is sensitive to biotic and abiotic stress. BMC Plant Biol. 2014, 14, 162. [Google Scholar] [CrossRef]
  89. Deslauriers, S.D.; Larsen, P.B. FERONIA is a key modulator of brassinosteroid and ethylene responsiveness in Arabidopsis hypocotyls. Mol. Plant 2010, 3, 626–640. [Google Scholar] [CrossRef] [PubMed]
  90. Knight, H.; Trewavas, A.J.; Knight, M.R. Cold calcium signaling in Arabidopsis involves two cellular pools and a change in calcium signature after acclimation. Plant Cell 1996, 8, 489–503. [Google Scholar]
  91. Vadassery, J.; Ranf, S.; Drzewiecki, C.; Mithöfer, A.; Mazars, C.; Scheel, D.; Lee, J.; Oelmüller, R. A cell wall extract from the endophytic fungus Piriformospora indica promotes growth of Arabidopsis seedlings and induces intracellular calcium elevation in roots. Plant J. 2009, 59, 193–206. [Google Scholar] [CrossRef]
  92. Rentel, M.C.; Knight, M.R. Oxidative stress-induced calcium signaling in Arabidopsis. Plant Physiol. 2004, 135, 1471–1479. [Google Scholar] [CrossRef]
  93. Pfaffl, M.W. A new mathematical model for relative quantification in real-time RT–PCR. Nucleic Acids Res. 2001, 29, e45. [Google Scholar] [CrossRef]
  94. Doyle, J.J. Isolation of plant DNA from faesh tissue. Focus 1990, 12, 13–15. [Google Scholar]
  95. Clough, S.J.; Bent, A.F. Floral dip: A simplified method for Agrobacterium-mediated transformation of Arabidopsis thaliana. Plant J. 1998, 16, 735–743. [Google Scholar] [CrossRef]
  96. Heyer, M.; Reichelt, M.; Mithöfer, A. A holistic approach to analyze systemic jasmonate accumulation in individual leaves of Arabidopsis rosettes upon wounding. Front. Plant Sci. 2018, 9, 1569. [Google Scholar] [CrossRef]
  97. Madsen, S.R.; Kunert, G.; Reichelt, M.; Gershenzon, J.; Halkier, B.A. Feeding on leaves of the glucosinolate transporter mutant gtr1gtr2 reduces fitness of Myzus persicae. J. Chem. Ecol. 2015, 41, 975–984. [Google Scholar] [CrossRef]
  98. Burow, M.; Müller, R.; Gershenzon, J.; Wittstock, U. Altered glucosinolate hydrolysis in genetically engineered Arabidopsis thaliana and its influence on the larval development of Spodoptera littoralis. J. Chem. Ecol. 2006, 32, 2333–2349. [Google Scholar] [CrossRef]
  99. Brown, P.D.; Tokuhisa, J.G.; Reichelt, M.; Gershenzon, J. Variation of glucosinolate accumulation among different organs and developmental stages of Arabidopsis thaliana. Phytochemistry 2003, 62, 471–481. [Google Scholar] [CrossRef]
  100. Crocoll, C.; Mirza, N.; Reichelt, M.; Gershenzon, J.; Halkier, B.A. Optimization of engineered production of the glucoraphanin precursor dihomomethionine in Nicotiana benthamiana. Front. Bioeng. Biotechnol. 2016, 4, 14. [Google Scholar] [CrossRef]
  101. Perez-Riverol, Y.; Bai, J.; Bandla, C.; García-Seisdedos, D.; Hewapathirana, S.; Kamatchinathan, S.; Kundu, D.J.; Prakash, A.; Frericks-Zipper, A.; Eisenacher, M. The PRIDE database resources in 2022: A hub for mass spectrometry-based proteomics evidences. Nucleic Acids Res. 2022, 50, D543–D552. [Google Scholar] [CrossRef]
Figure 1. (A) The cartoon depicts root developmental regions and, in parallel, representative fluorescence images from pCORK1::GFP expression in 14-day-old transgenic Arabidopsis seedlings, in comparison to the wild-type (control) seedlings. The promoter activity was not detectable in the aerial parts of the plant (i). The roots exhibit tissue-specific CORK1 expression patterns. A high GFP fluorescence is observed in the lateral roots (ii), root stele (iii), and cortical tissue while barely any fluorescence can be detected in the rhizodermal cells layer (iv). No fluorescence was found in the meristematic zone and root tip (v). (B) Confocal microscopy of 14-day-old transgenic Arabidopsis seedlings illustrates GFP fluorescence driven by the CORK1 promoter in the early root differentiation zone. (C,D) These panels show the subcellular location of the GFP fluorescence in the cytoplasm. Representative results were observed for six plants from three independent transformants.
Ijms 25 03472 g001
Figure 2. Expression of receptor kinase genes in 14-day-old Col-0 plants determined by qRT-PCR after application of 0.6 µM ISX to the roots. Shoots (A,B) and roots (C,D) were separately harvested 6 h (A,C) or 9 h (B,D) after ISX application. FRK1 (encoding FLG22-INDUCED RECEPTOR-LIKE KINASE1, At2g19190) and CYP81F2 (encoding a P450 enzyme involved in glucosinolate metabolism, At5g57220) are immune marker genes and were used as controls. Depicted is the fold change in expression relative to the DMSO control without ISX. Error bars represent the standard error of three biological replicates. Asterisks indicate a statistically significant difference relative to the control as determined by one-way ANOVA followed by a Holm–Sidak post-hoc test (* p ≤ 0.05; ** p ≤ 0.01).
Ijms 25 03472 g002
Figure 3. [Ca2+]cyt elevation in the roots of 14-day-old segregating wild-type (SWT) (A) and cork1 (B) seedlings expressing aequorin after application of different sugars. [Ca2+]cyt elevation was observed after application of CT (10 µM), CB (1 mM), and trehalose or lactose (25 mM each) in the SWT but not in the cork1 and cycam (C) mutants. Chitin (10 µM) was used as a control and the cork1 and cycam mutations did not affect its response. (D) Comparison of the total [Ca2+]cyt levels (area under the curve) upon chitin application to the roots of SWT, cork1, and cycam seedlings. Total [Ca2+]cyt levels were significantly higher in cork1 compared to SWT and cycam. Error bars represent the standard error from eight seedlings. Data are based on three independent experiments. Statistical significance at the peak value was determined by Tukey’s HSD test (* p ≤0.05; *** p ≤ 0.001). Asterisks indicate significant differences compared to the water treatment (AC).
Ijms 25 03472 g003
Figure 4. The cork1 and cycam mutants failed to induce ROS production after the application of different sugars. CT (10 µM), CB (1 mM), or trehalose (25 mM) trigger ROS production in the root tissue of the segregating wild-type (SWT) (A) but not in the cork1 (B) and cycam (C) seedlings. ROS production after the application of chitin was not affected by the mutations. (D) Comparison of the maximum ROS production in response to chitin application at the peak time in the roots of SWT, cork1, and cycam seedlings. ROS production was significantly higher in cycam roots compared to SWT and cork1 roots. Error bars represent SE from eight seedlings for each treatment. Statistically significant differences between CT, CB, trehalose, and chitin versus water treatment at the peak value were determined by Tukey’s HSD (* p ≤ 0.05; *** p < 0.001). The experiment was repeated three times with similar results.
Ijms 25 03472 g004
Figure 5. Upregulation of (A) WRKY30 and (B) WRKY40 mRNA levels in the roots was impaired in cork1 and cycam mutants upon treatment with either 10 μM CT or 1 mM CB for one hour, but not in the segregating wild-type. The expression of WRKY30 was not affected by these mutations upon application of 10 µM chitin. Values were normalized to water treatment on the same genotype. Error bars represent SE from three independent biological replicates, each with twenty seedlings. Statistical significance between water and other treatments within the same genotype was accessed by one-way ANOVA and Tukey’s HSD. Asterisks indicate statistically significant differences between water treatment and treatment with the indicated chemical within the same genotype (* p ≤ 0.05; ** p ≤ 0.01; *** p ≤ 0.001).
Ijms 25 03472 g005
Figure 6. BAK1 inhibits CT-induced ROS production but not CT-induced [Ca2+]cyt elevation in Arabidopsis roots. [Ca2+]cyt elevation in roots of the aequorin wild-type, aequorin bak1, and aequorin cerk1 seedlings after application of 10 μM CT (A) or 10 μM chitin (B). Total ROS production over a period of 40 min represented as relative light units (RLUs) in the roots of the same wild-type, bak1, and cerk1 seedlings after elicitation with 10 μM CT (C) or 10 μM chitin (D). ROS production is significantly higher in fer-2 (E) and fer-4 (F) mutants compared to wild-type (Col-0) seedlings after the application of 10 μM CT or 10 μM chitin. Error bars represent SE from eight seedlings for each treatment. Asterisks indicate statistically significant differences at the peak value compared to the Col-0 or aequorin wild-type control as determined by one-way ANOVA coupled to Tukey’s HSD (** p ≤ 0.01; *** p ≤ 0.001). The experiment was repeated three times with similar results.
Ijms 25 03472 g006
Figure 7. Sucrose (A), but not glucose (B), stimulates the expression of the sugar transporter genes SUC1, SWEET 11, and SWEET 12 in the roots of the segregating wild-type seedlings, but not in the cork1 mutant seedlings, 1 h after sugar application. Values were normalized to water treatment on the same genotype. Error bars represent SE from at least three independent biological replicates, each with twenty seedlings. Statistical significance was determined by a two-tailed Student’s t-test (n.s., no significant differences, * p ≤ 0.05; ** p ≤ 0.01). Regulation of SUC1 by glucose was omitted because SUC1 transports only sucrose.
Ijms 25 03472 g007
Figure 8. SUC1, SWEET11, and SWEET12 control CT responses in Arabidopsis roots. (AE) ROS production in the roots of the 14-day-old (A) segregating wild-type (SWT), (B) suc1, (C) sweet11, (D) sweet12, (E) and sweet11;12 double mutants (F) upon application of 10 μM CT. ROS generation was significantly reduced in the sweet11;12 double mutant as compared to the SWT, as indicated by asterisks. Error bars represent SEM from eight seedlings for each treatment. One-way ANOVA and Tukey’s HSD were used to compare differences between the SWT and the other genotypes within each treatment (*** p ≤ 0.001; n.s., not significant). The experiment was repeated three times with similar results. (FI) Eleven-day-old seedlings were treated with either 10 μM CT or chitin for 1 h, and the expression of WRKY30 and WRKY40 was determined by qRT-PCR. The graphs show the average data of three biological replicates. Expression of WRKY30 (F) and WRKY40 (G) was significantly reduced in cork1, suc1 (only for WRKY30), sweet11, sweet12, and sweet11;12 mutants upon CT application. (H,I) No significant regulation of the two genes was detected in response to chitin application in comparison to the SWT. Error bars indicate SEM and statistical comparisons were made using one-way ANOVA with Holm–Sidak post hoc analysis (* p ≤ 0.05; ** p ≤ 0.01; *** p ≤ 0.001).
Ijms 25 03472 g008aIjms 25 03472 g008b
Figure 9. Effect of CB treatment (for 6 h) on amino acid levels (nmol/g FW) in the roots of segregating wild-type (SWT)and cork1 seedlings. The heatmap displays a quantitative analysis of amino acids in the roots of SWT (A) and cork1 (B) seedlings with or without CB. The SWT and cork1 plants were pre-grown on half Murashige and Skoog media and then transferred to plant nutrient media (PNM) with different treatments (no treatment as control; 10 mM CB; 100 mM CB; 15 mM PEG 6000) for 6 h. PEG was used to eliminate the effect of osmotic shock. Amino acids were measured in 14-day-old plants (FW, fresh weight). The content of glutamic acid (C), glutamine (D), and asparagine (E) in the roots of the SWT and cork1 after exposing them to 10 or 100 mM of CB for 6 h, is shown. Statistical significance was tested with two-way ANOVA using Tukey’s multiple comparison test (* p < 0.05; ** p < 0.01; *** p < 0.001; **** p < 0.0001; n.s., not significant). The data show the means from five independent experiments (n = 48–60 plants per treatment). Error bars represent SEM.
Ijms 25 03472 g009
Figure 10. Accumulation of total glucosinolates and total soluble sugars in the roots of the 14-day-old segregating wild-type (SWT) and cork1 plants 6 h after CB treatment. The SWT and cork1 plants were pre-grown on half Murashige and Skoog media and then transferred to plant nutrient media (PNM) with different treatments (no treatment as control; 10 mM CB; 100 mM CB; 15 mM PEG 6000). PEG was used to eliminate the effect of osmotic shock. (A) Total glucosinolate content (µmol/g FW) in the SWT roots was significantly reduced upon exposure to media with 10 or 100 mM CB, while it was not affected by CB application in the roots of cork1 (FW, fresh weight). The cork1 control plants have significantly lower glucosinolate levels as compared to the SWT plants. (B) The glucose content (µg/mg FW) was significantly increased in the SWT roots but not in the cork1 roots upon 100 mM CB treatment. (C) Fructose (µg/mg FW) and (D) sucrose (µg/mg FW) levels showed no significant differences between the SWT and cork1 roots. The data correspond to means (±SEM) of five independent replicates (n = 48–60 plants per treatment). Asterisks represent significant differences between treatments according to two-way ANOVA with Tukey’s multiple comparison test (data were transformed when needed; * p < 0.05; ** p < 0.01; *** p < 0.001).
Ijms 25 03472 g010
Figure 11. Phytohormone levels (ng/g FW) in the segregating wild-type (SWT) and cork1 roots 6 h after treatment with 10 or 100 mM CB. The amounts of (A) JA, (B) ABA, (C) SA (salicylic acid), (D) IAA (indole-acetic acid), (E) the JA bioactive form JA-lle (JA-isoleucine), and (F) the JA precursor, cis-OPDA (cis-(+)-12-oxo-phytodienoic acid), were measured in the roots of 14-day-old Arabidopsis plants (FW, fresh weight). The SWT and cork1 plants were pre-grown on half Murashige and Skoog media and then transferred to plant nutrient media (PNM) for 6 h with different treatments (no treatment as control; 10 mM CB; 100 mM CB; 15 mM PEG 6000). PEG was used to eliminate the effect of osmotic shock. Asterisks represent significant differences between treatments according to two-way ANOVA with Tukey’s multiple comparison test (* p < 0.05; ** p < 0.01; *** p < 0.001). The data show the means (±SE) of five replicates, each of which consisted of 48–60 seedlings.
Ijms 25 03472 g011
Figure 12. A model describing cellooligomer (CO)/CORK1-controlled responses, and the crosstalk with other receptor kinases (yellow boxes) and sugar metabolism/transport (orange boxes). Readouts include [Ca2+]cyt elevation, ROS production, and WRKY30/40 expression, while glucose, JA, ABA, and glucosinolate levels were assayed by metabolomics.
Ijms 25 03472 g012
Disclaimer/Publisher’s Note: The statements, opinions and data contained in all publications are solely those of the individual author(s) and contributor(s) and not of MDPI and/or the editor(s). MDPI and/or the editor(s) disclaim responsibility for any injury to people or property resulting from any ideas, methods, instructions or products referred to in the content.

