Article

Whole-Genome Survey Analyses of Five Goby Species Provide Insights into Their Genetic Evolution and Invasion-Related Genes

Key Laboratory of Mariculture, Ocean University of China, Ministry of Education, Qingdao 266003, China
*
Author to whom correspondence should be addressed.
Int. J. Mol. Sci. 2024, 25(6), 3293; https://doi.org/10.3390/ijms25063293
Submission received: 19 January 2024 / Revised: 3 March 2024 / Accepted: 8 March 2024 / Published: 14 March 2024
(This article belongs to the Section Molecular Genetics and Genomics)

Abstract

:
As one of the most abundant groups in marine fish families, Gobiidae fish are important fishery resources in China, and some are also invasive species in certain regions worldwide. However, the phylogenetic relationships of Gobiidae fish remain ambiguous, and the study of their invasion-related genes is still scarce. This study used high-throughput sequencing technology to conduct a whole-genome survey of five Gobiidae fish species: Acanthogobius flavimanus, Acanthogobius stigmothonus, Favonigobius gymnauchen, Ctenotrypauchen microcephalus, and Tridentiger barbatus. De novo assembly of five fish genomes was performed, and genomic traits were compared through K-mer analysis. Among the five Gobiidae fish genomes, F. gymnauchen had the largest genome size (1601.98 Mb) and the highest heterozygosity (1.56%) and repeat rates (59.83%). Phylogenetic studies showed that A. flavimanus was most closely linked to A. stigmothonus, while Apogonidae and Gobiidae were closely related families. PSMC analysis revealed that C. microcephalus experienced a notable population expansion than the other four fish species in the Early Holocene. By using the KOG, GO, and KEGG databases to annotate single-copy genes, the annotated genes of the five fish were mainly classified as “signal transduction mechanisms”, “cellular process”, “cellular anatomical entity”, and “translation”. Acanthogobius flavimanus, A. stigmothonus, and T. barbatus had more genes classified as “response to stimulus” and “localization”, which may have played an important role in their invasive processes. Our study also provides valuable material about Gobiidae fish genomics and genetic evolution.

1. Introduction

The family Gobiidae belongs to Perciformes, Gobioidei, and includes 242 genera and over 2000 species [1]. Gobiidae fish are the most abundant group of marine fishes and are extensively distributed in seawater and freshwater, including marine waters, intertidal mudflats, deltas, and rivulets [2,3]. Gobiidae fish are not only predators of benthos but also the main sustenance source for high trophic-level fishes, and some species are commercial fishing targets [4]. Because of the few distinguishable morphological characteristics and the small size of most Gobiidae species, their phylogenetic analysis and morphology identification are still a great challenge [1,5]. Additionally, they generally have significant colonial potential due to rapid reproduction and strong adaptability [6]. Some members of Gobiidae are considered invasive organisms and have a significant effect on native species. For instance, Rhinogobius giurinus and Rhinogobius cliffordpopei have invaded the Nine Plateau Lakes in Yunnan, China, which has led to the extinction of numerous indigenous fish species [7]. Acanthogobius flavimanus and Tridentiger bifasciatus have expanded throughout parts of Australia, Europe, and the western coast of the United States [8,9]. In the San Francisco Estuary, Tridentiger barbatus has been identified as an invasive species [5]. These invasive Gobiidae species have established populations in non-native habitats by ballast water discharge or accidental releases [8]. These results suggested that these species may have regulatory mechanisms for environmental adaptability. However, the genes related to environmental adaptability in Gobiidae fish are still unexplored.
The genome is vital for studying biological mysteries as it contains all genetic information [5]. Bioinformatics can better quantify and define the genomes of organisms by analyzing and comparing genomic sequences. It can also elucidate the relationships between various organisms [10]. At present, a large amount of morphological data has been accumulated on Gobiidae species [11]. There have also been molecular biology studies of evolutionary and genetic relationships in Gobiidae. For example, the microsatellite characteristics of 19 Gobiidae fish provided powerful support for microsatellite development in Gobiidae [12]. Complete mitogenome assembly in three Gobiidae fish demonstrated that the evolution of mitochondrial genome protein-coding genes (mtDNA PCGs) was crucial to Gobiidae adaptability [13]. Although the Gobiidae family contains more than 2000 species [1], only 18 species’ genomes have been published (https://www.ncbi.nlm.nih.gov/genome/?term=Gobiidae, accessed on 7 March 2024). Genomic information about Gobiidae fish is still limited, which presents significant challenges to exploring the evolutionary processes, genetic diversity, and gene function of Gobiidae fish.
In recent years, next-generation sequencing (NGS) has provided convenient, elaborate, cheap, and full-scale methods for genetic research [14]. High-throughput sequencing is considered a cost-effective technology for obtaining prior knowledge of genomic information [15,16]. Whole-genome survey analysis, based on high-throughput sequencing data, could calculate genome size, repeat ratio, heterozygosity ratio, and GC content [17,18]. Furthermore, NGS technology may help the identification of microsatellites (SSRs), the extraction of mitochondrial genomes and single-copy homologous genes, and the prediction of historical demographic dynamics [19,20]. High-throughput sequencing is considered a time-saving and accessible way to generate genome sequences. With the advancement of sequencing technology, phylogenetic analysis based on mitochondrial genes and single-copy homologous genes has become more accessible. The phylogenetic trees constructed using mitochondrial genomes have shown complex relationships and divergence times among Gadidae species [21]. Using single-copy genes from the whole genome of 10 Gobiidae species for phylogenetic analysis has indicated that evolutionary relationships may be efficiently analyzed [22]. In summary, genome data acquired by NGS have grown to be a valuable method for clarifying the genetic relationships among multiple species. Moreover, compared with conventional methods, NGS is a cheaper and more convenient technology for screening high-polymorphism primers of microsatellites [23]. Thus, there has been increasing attention to developing high-polymorphism microsatellite markers by using NGS data.
To supplement Gobiidae fish genomics information, clarify the genetic evolutionary relationships, and focus on invasion-related genes, we obtained the genomic draft of five Gobiidae fish (A. flavimanus, Acanthogobius stigmothonus, Favonigobius gymnauchen, Ctenotrypauchen microcephalus, and T. barbatus). Among them, the phylogenetic relationship between Acanthogobius and Favonigobius has been disputed, and A. stigmothonus is usually misclassified as A. flavimanus due to their similar morphological characteristics [24]. Moreover, A. flavimanus and T. barbatus were considered invasive species [5,6,7,8]. This study not only provides new perspectives on classification and evolutionary biology but also furthers genomics research into Gobiidae fish.

2. Results

2.1. Whole-Genome Sequencing
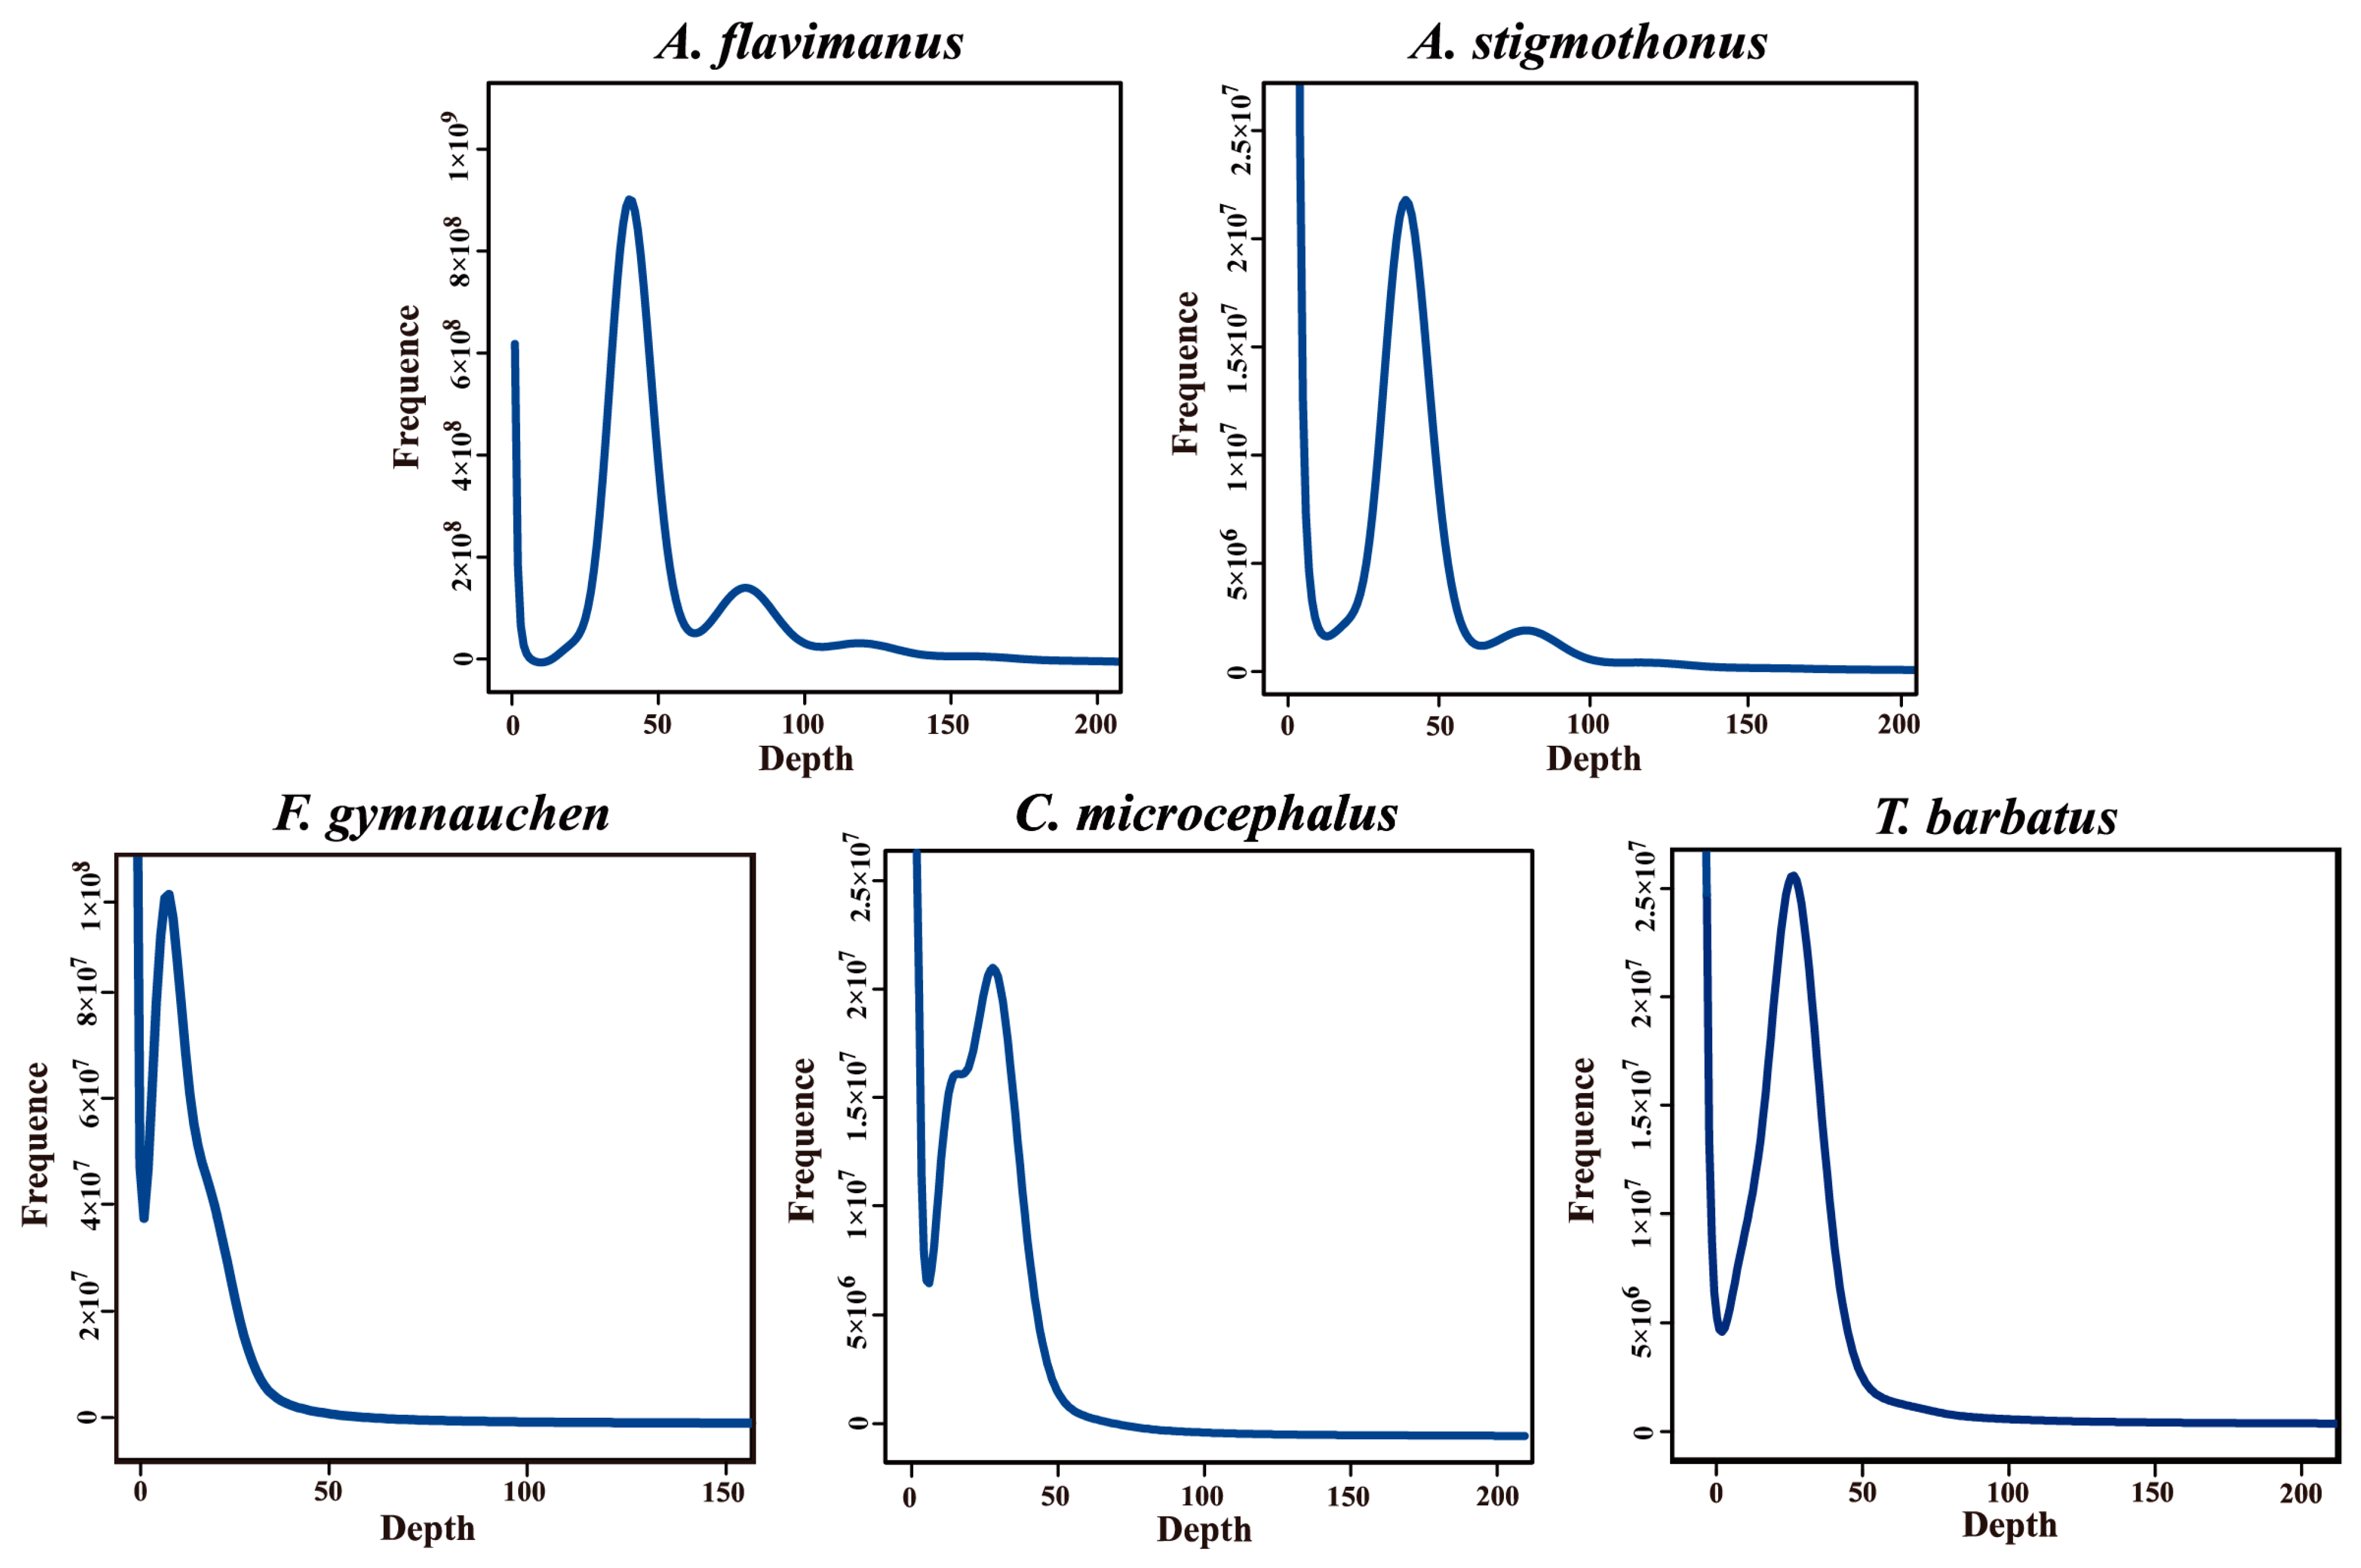
The raw data generated for A. flavimanus, A. stigmothonus, F. gymnauchen, C. microcephalus, and T. barbatus amounted to 52.48 Gb, 54.54 Gb, 53.77 Gb, 53.55 Gb, and 52.22 Gb, respectively, through NGS sequencing. Table 1 illustrates the quality statistics of raw data, including the effective rate, error rate, Q20, Q30, and GC content. The sequencing data exhibited an error rate below 1%, and all the Q20 and Q30 values surpassed 95% and 91%, respectively, which affirms the reliability of the sequencing data.

2.2. K-mer Analysis

K-mer analyses revealed that the K-mer depth of five species was 39, 39, 11, 34, and 39, respectively, as illustrated in Figure 1. Genome sizes could be calculated by K-mer number and depth. Among the five Gobiidae species, T. barbatus exhibited the smallest genome size (808.55 Mb), and F. gymnauchen had the largest genome size (1601.98 Mb), as indicated in Table 2. Favonigobius gymnauchen displayed higher heterozygosity (1.56%) and repeat rate (59.83%) compared to the other four fish. The heterozygosity rates for the remaining four Gobiidae fish ranged from 0.21% to 0.64%, and repeat rates ranged from 46.90% to 52.89%.

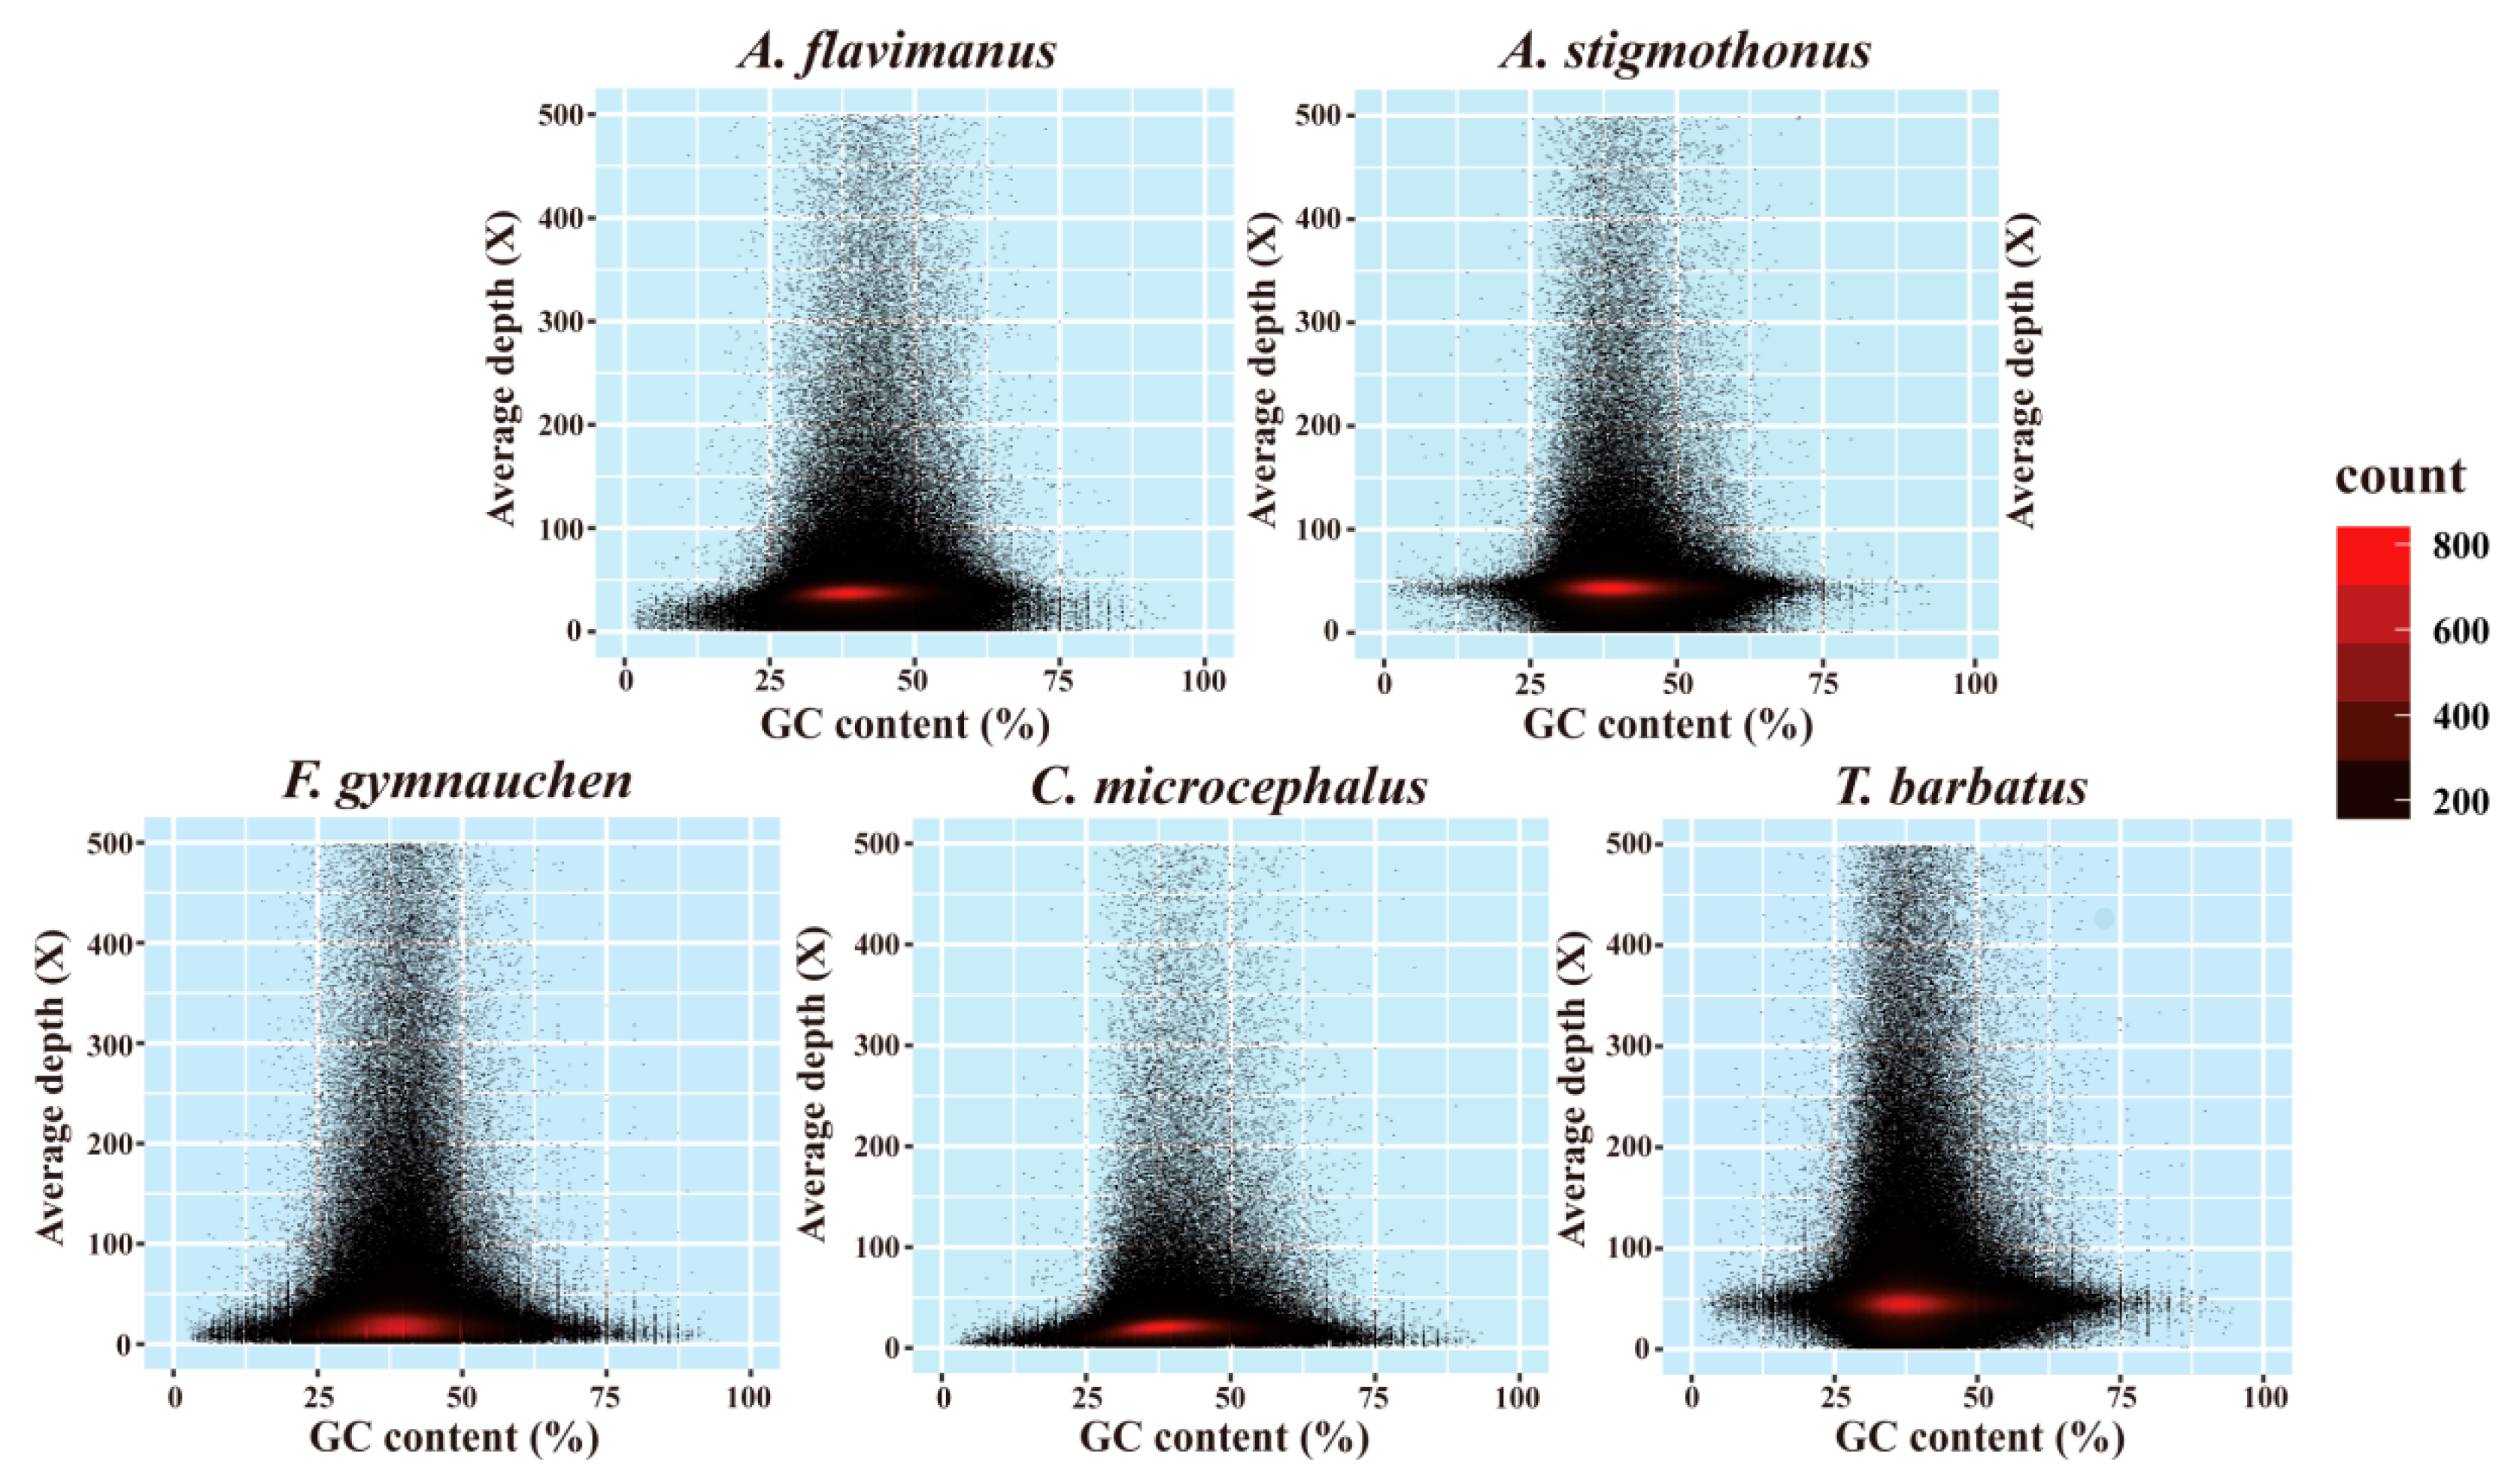
2.3. Genome Assembly and GC Content

The filtered clean data were employed for de novo assembly. The contig and scaffold assembled information of the draft genome was presented in Table 3. Among five Gobiidae fish, the total length and total number of F. gymnauchen genomes were larger than others, while the N90 length was the shortest. The GC content of A. flavimanus, A. stigmothonus, F. gymnauchen, C. microcephalus, and T. barbatus were 41.04%, 40.80%, 40.05%, 41.69%, and 39.91%, respectively (Figure 2).

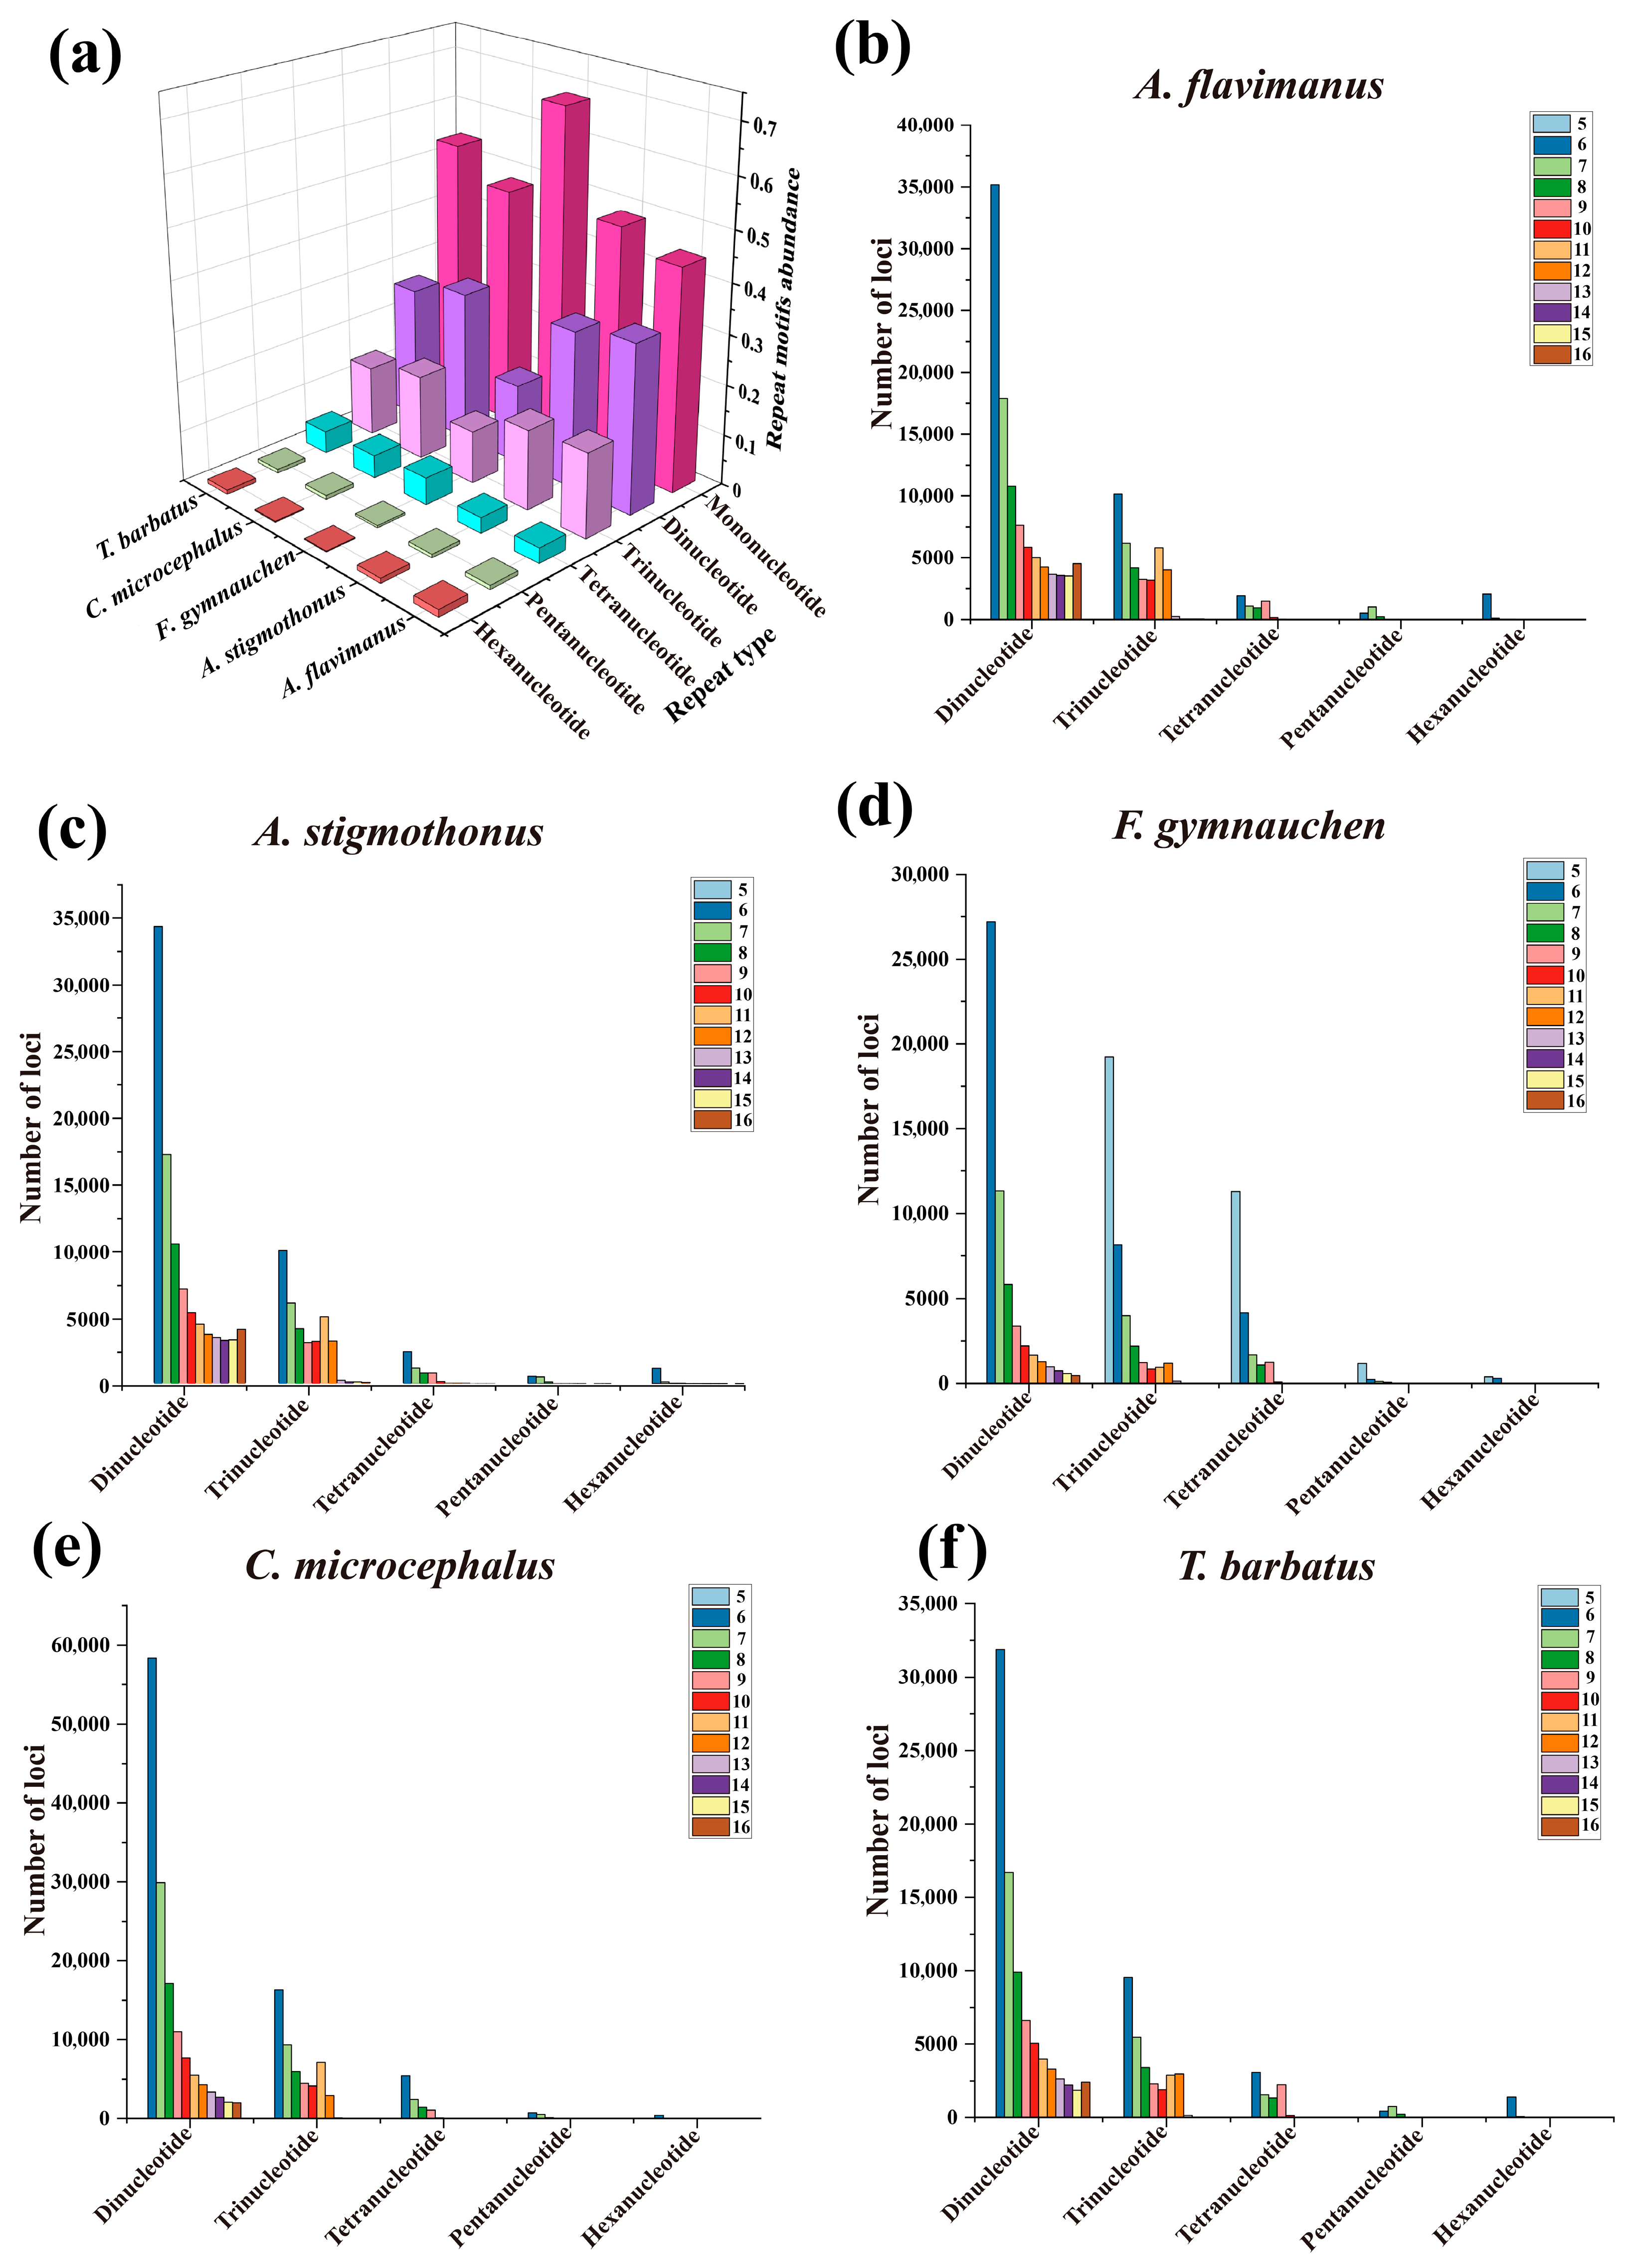
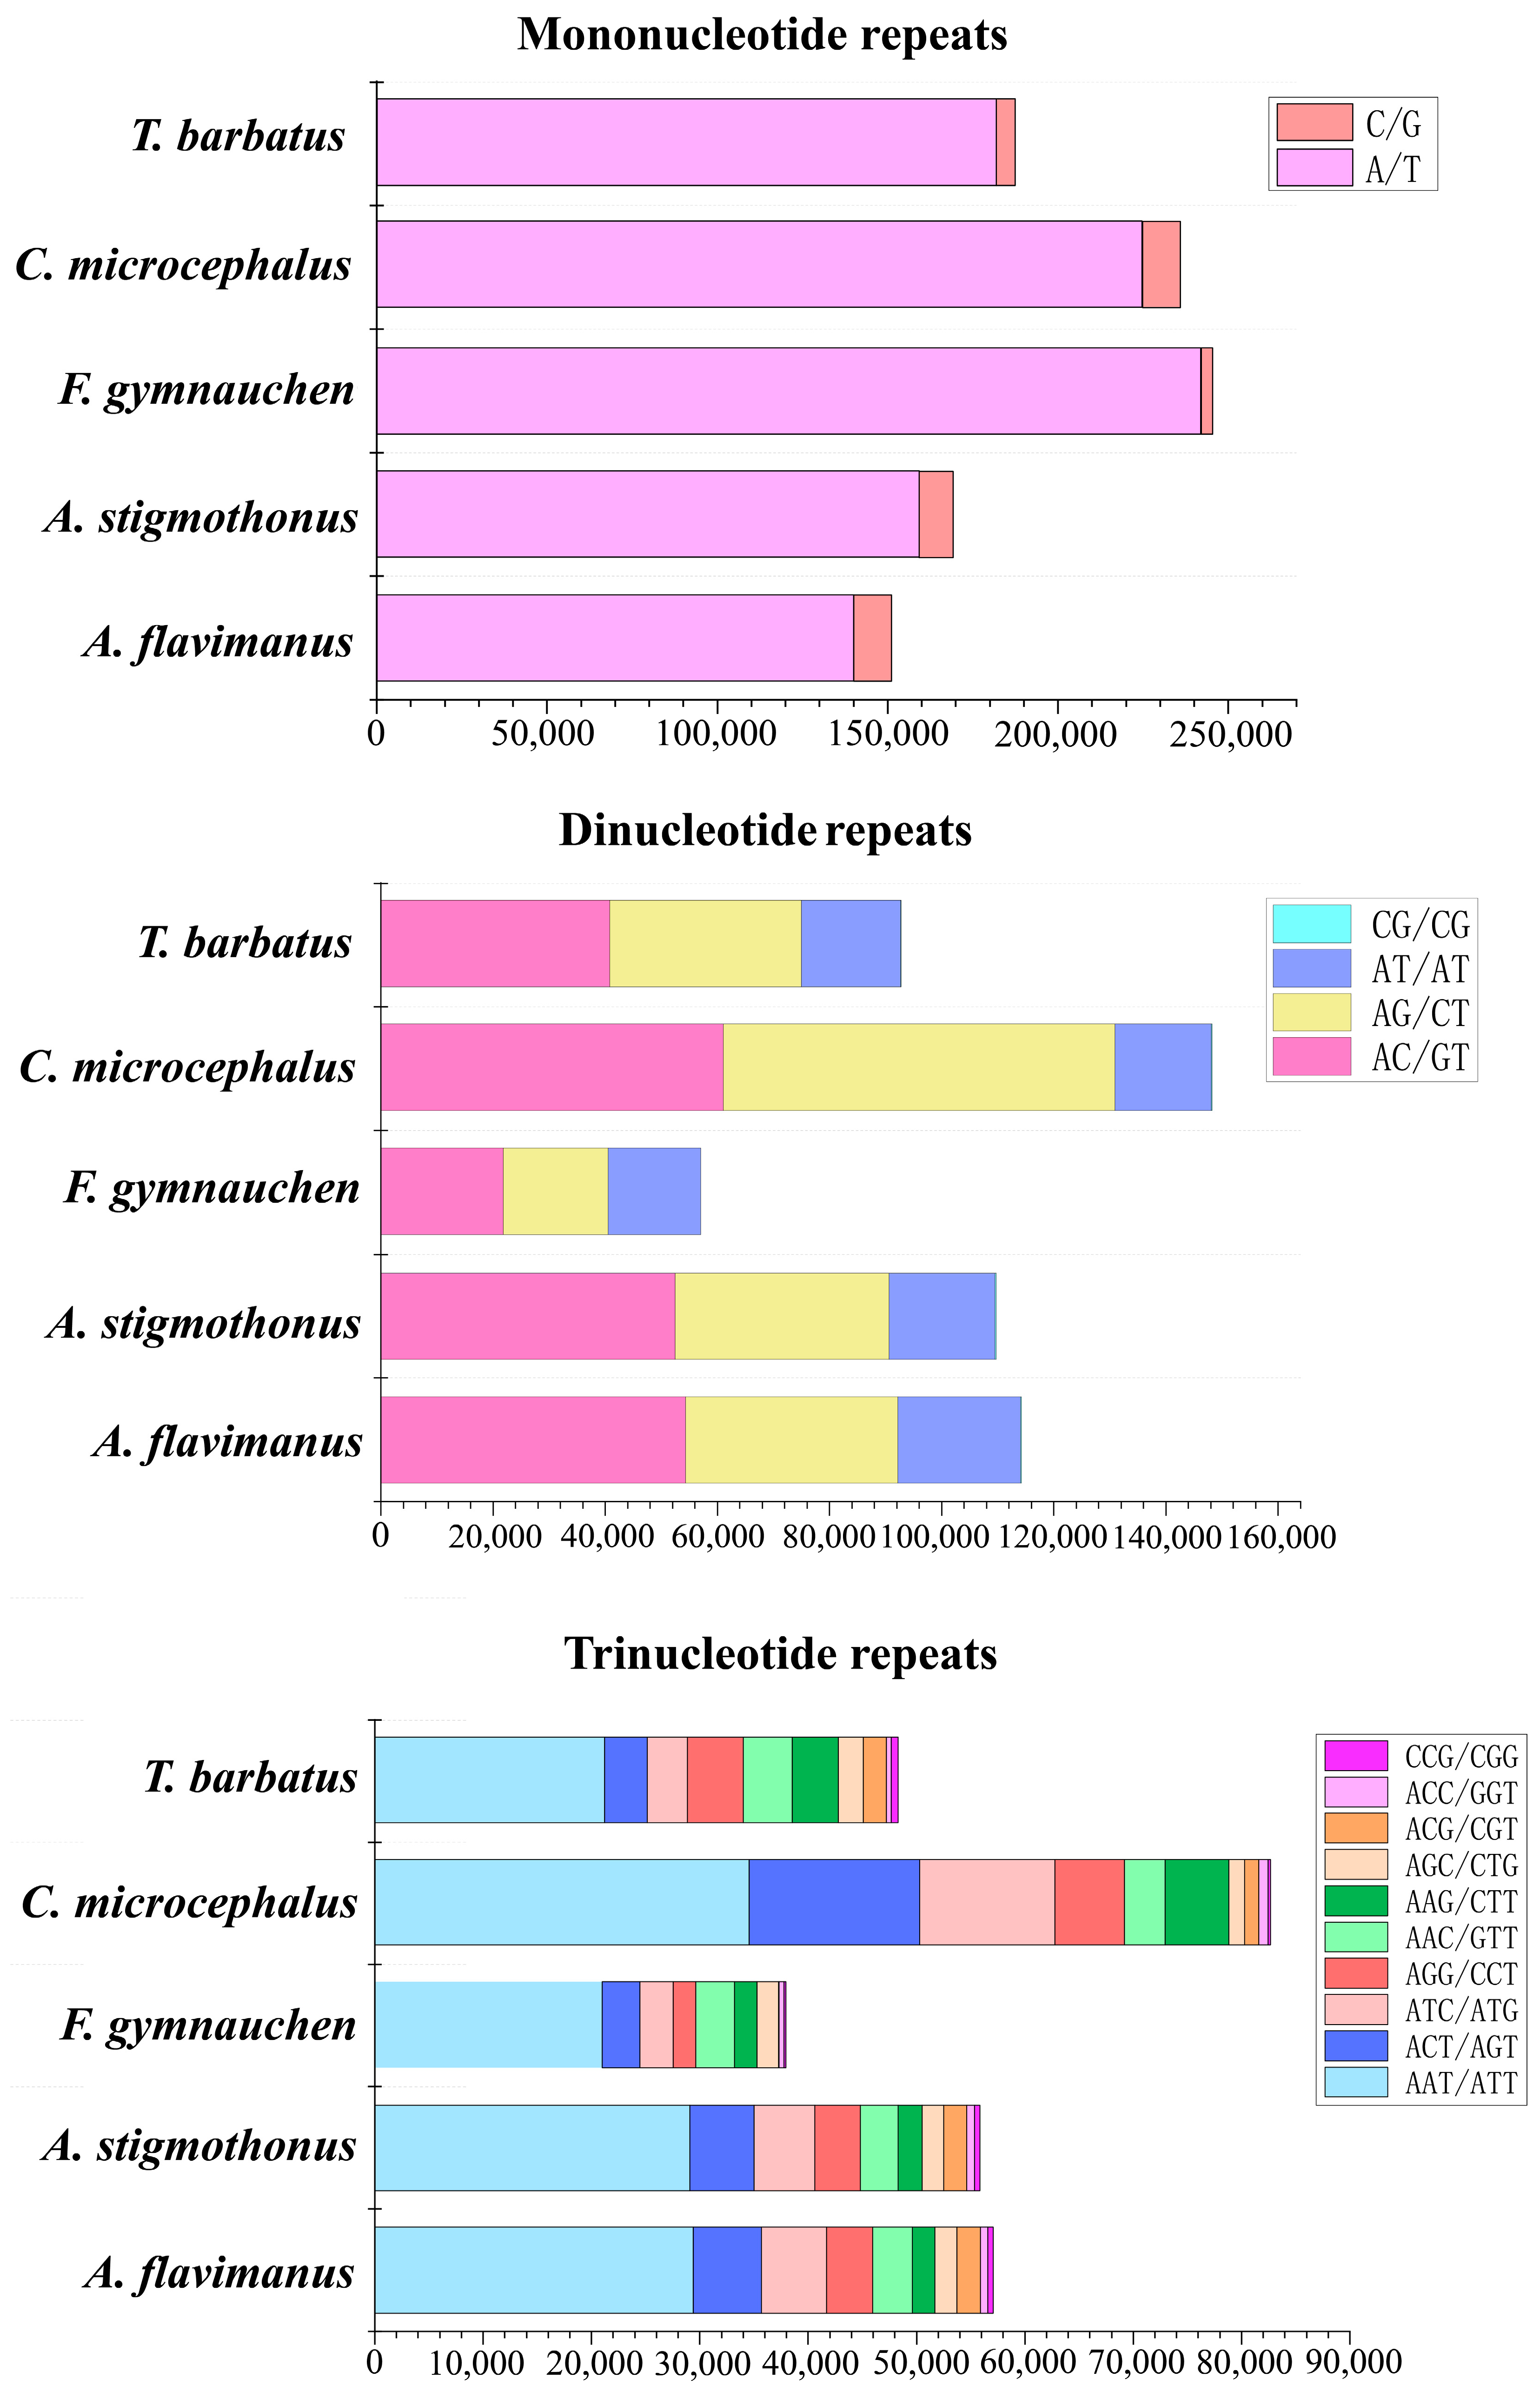
2.4. Microsatellite Profile of Five Gobiidae Fish Genomes

Through a de novo search for microsatellites, a total of 340,592, 351,606, 362,191, 494,515, and 349,412 microsatellite motifs were identified in the genomes of five Gobiidae fish. Detailed statistics of microsatellites are shown in Table 4. The distribution of microsatellites in F. gymnauchen and C. microcephalus genomes followed the order of mononucleotide (mono, 47.70–67.76%) > dinucleotide (di, 15.74–29.97%) > trinucleotide (tri, 10.47–16.71%) > tetranucleotide (tetra, 4.62–5.39%) > pentanucleotide (penta, 0.44–0.79%) > hexanucleotide (hexa, 0.19–0.21%). On the other hand, A. flavimanus, A. stigmothonus, and T. barbatus genomes exhibited a distribution mode of mono- (44.37–53.60%) > di- (26.56–33.53%) > tri- (13.82–16.76%) > tetra- (3.07–4.42%) > hexa- (0.70–0.82%) > penta- (0.85–1.44%) (Figure 3a). The number of microsatellite repetitions primarily varied from 5 to 16, with a decline in the number of microsatellites observed as the repeat numbers increased (Figure 3b). Among the motif types of microsatellite repeats in the genomes of five Gobiidae fish, A/T and AAT/ATT were the dominant repeats among the mononucleotide and trinucleotide repeat motifs (Figure 4). Regarding the dinucleotide repeat motif, AC/GT was the most abundant repeat in A. flavimanus, A. stigmothonus, F. gymnauchen and T. barbatus, while AG/CT was the most abundant in C. microcephalus. Moreover, tetranucleotide, pentanucleotide and hexanucleotide repeats had the fewest motifs in the genomes of five fish, with the repeats having A + T > 50% being the most abundant (Table S1).

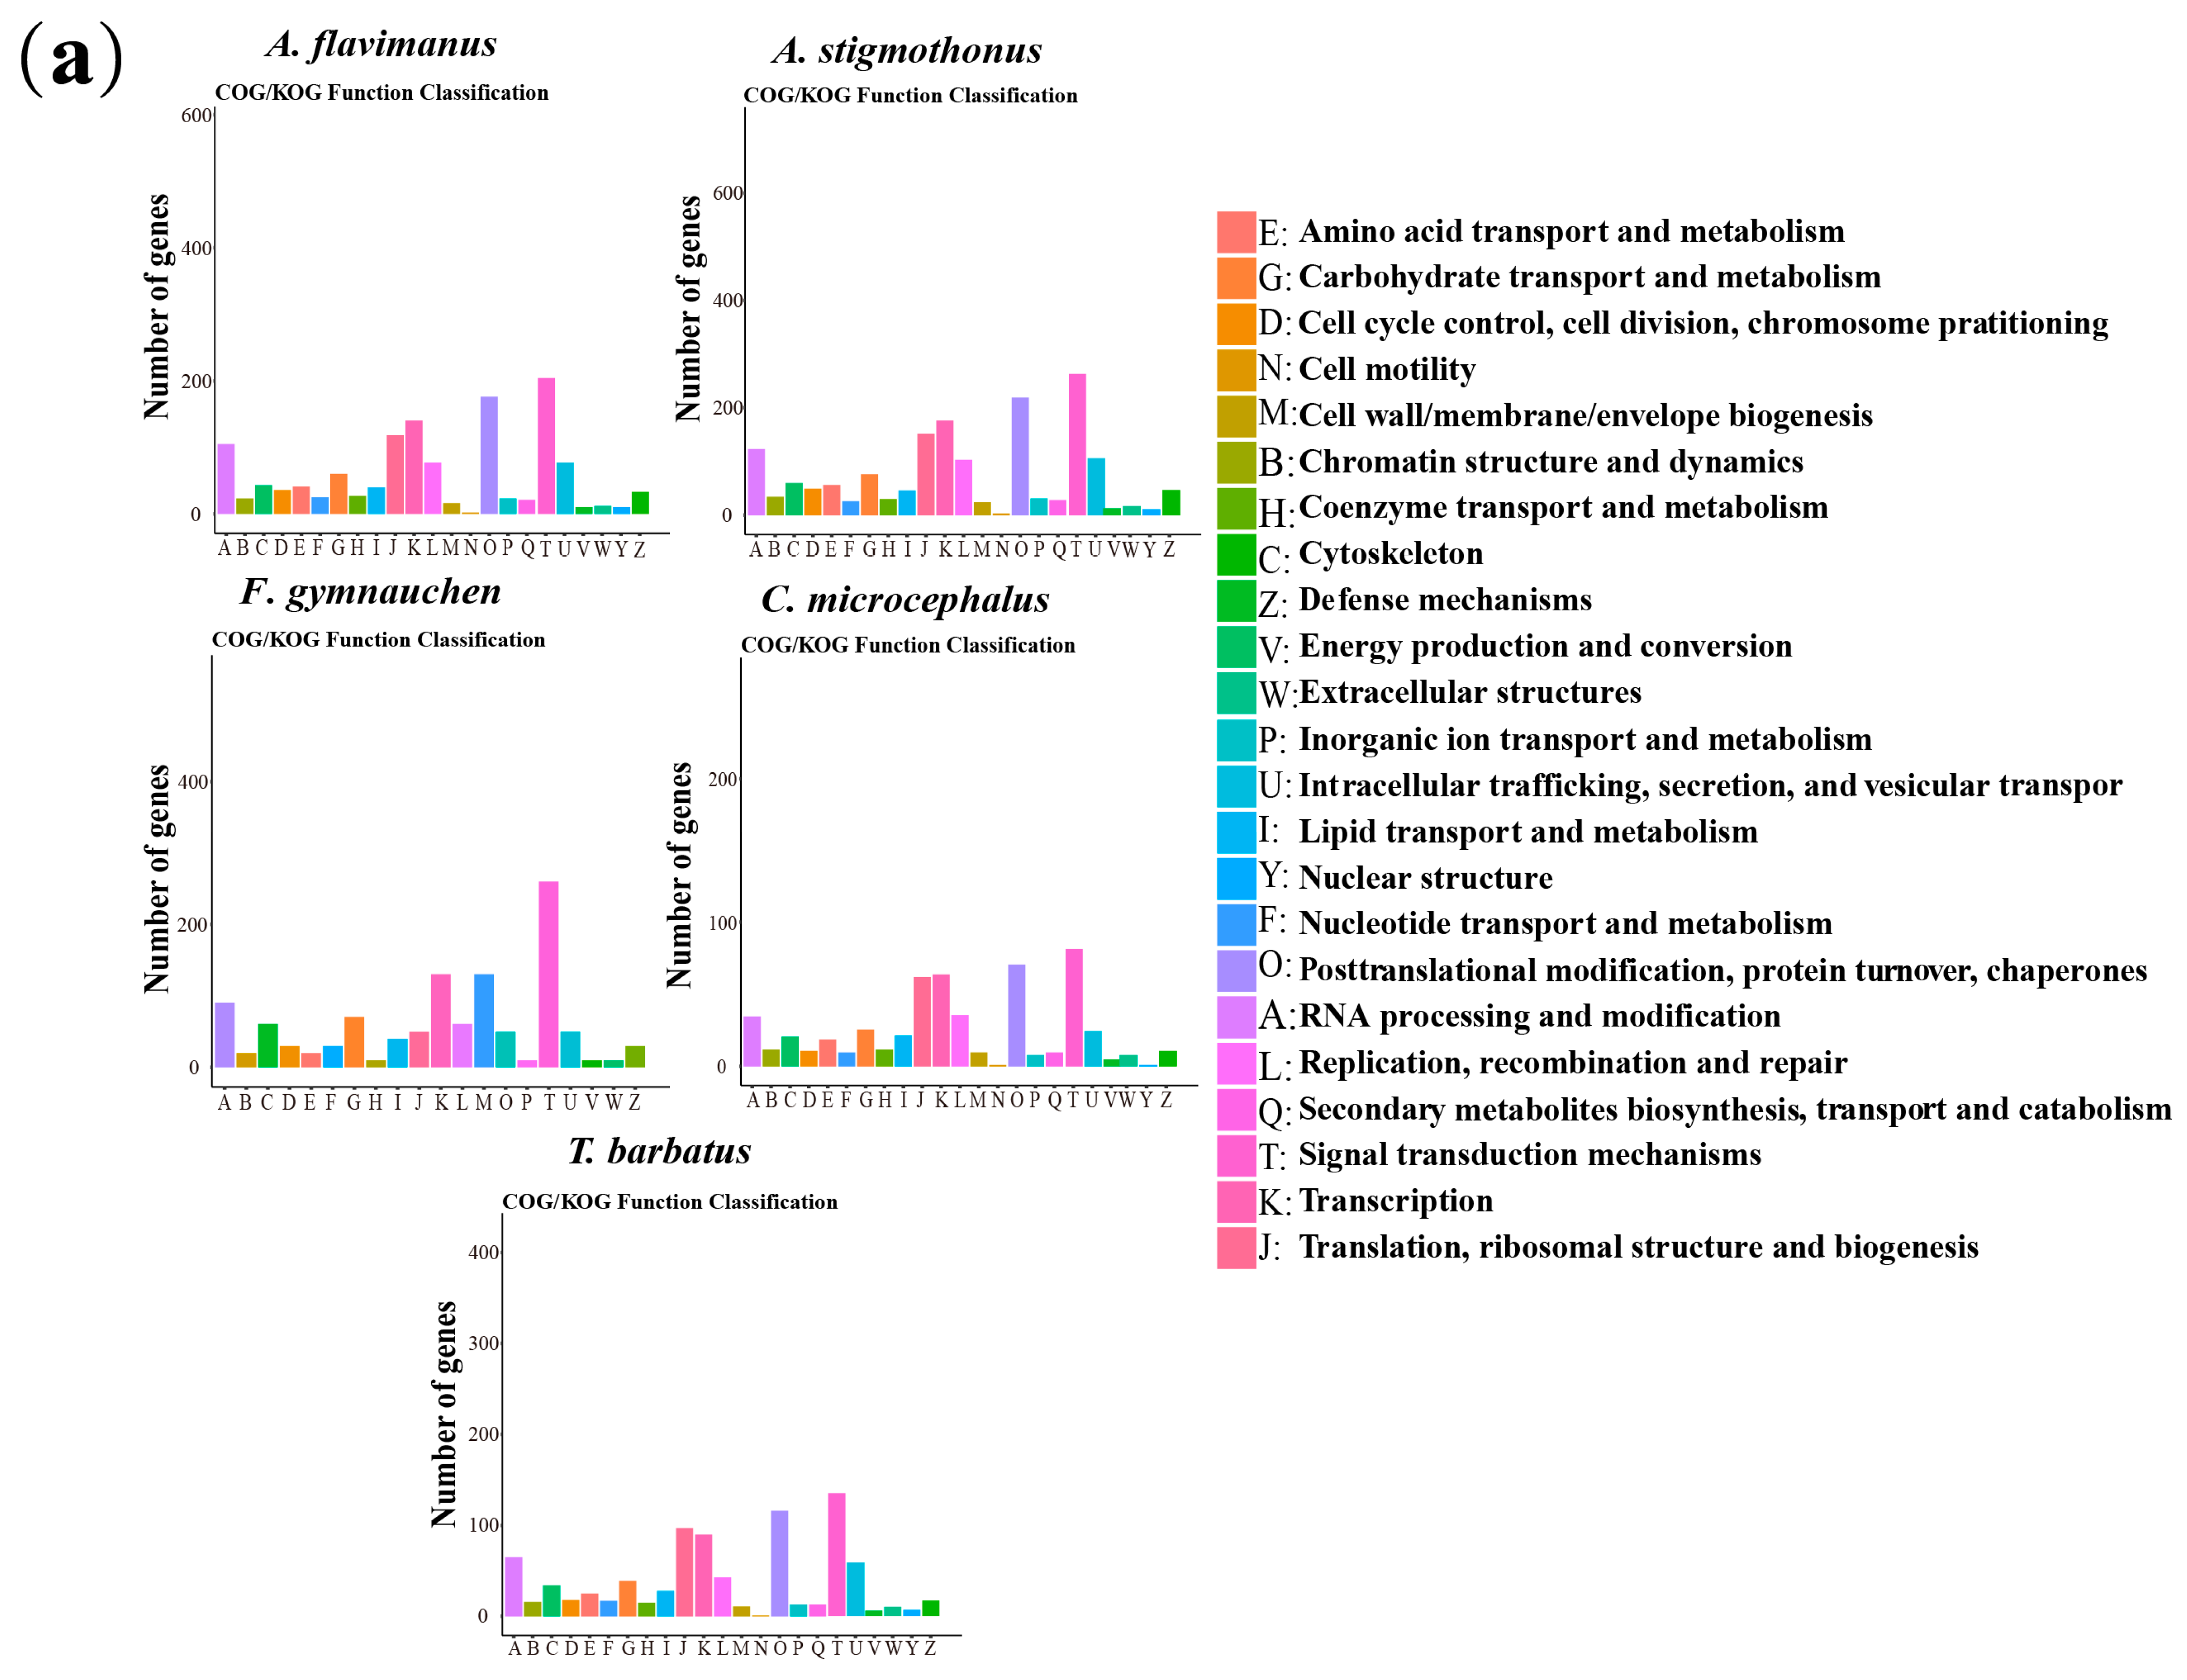
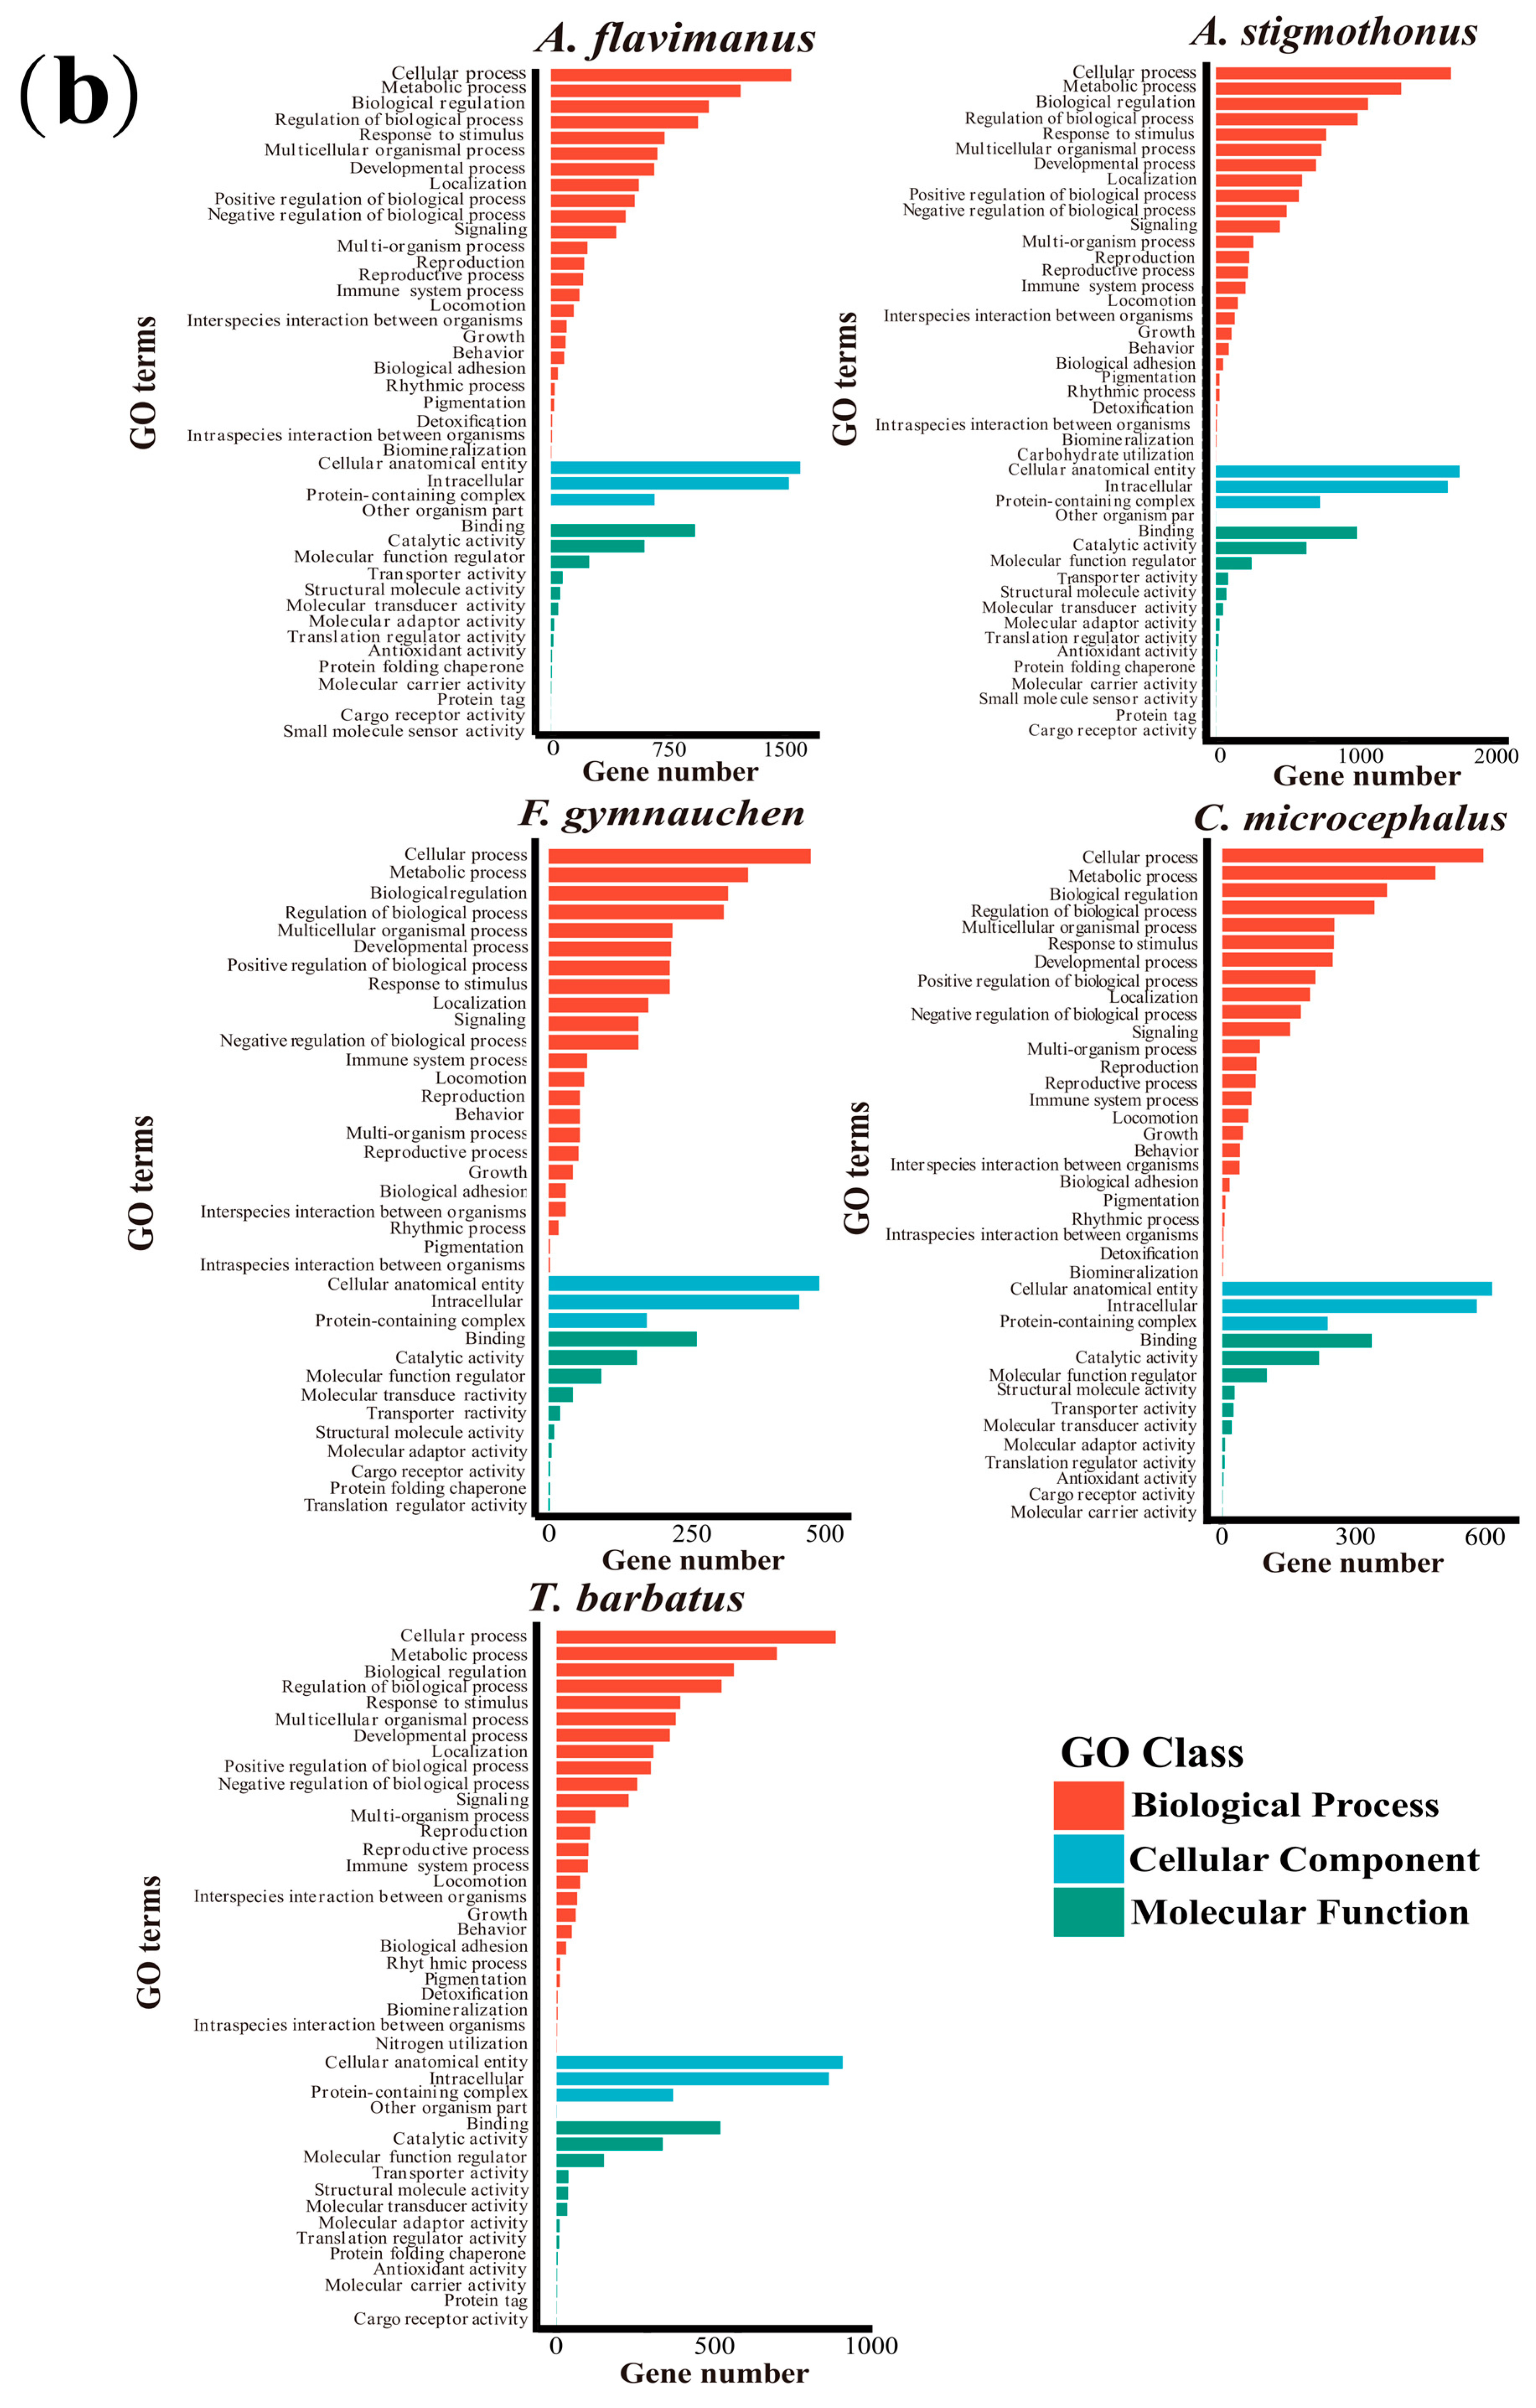
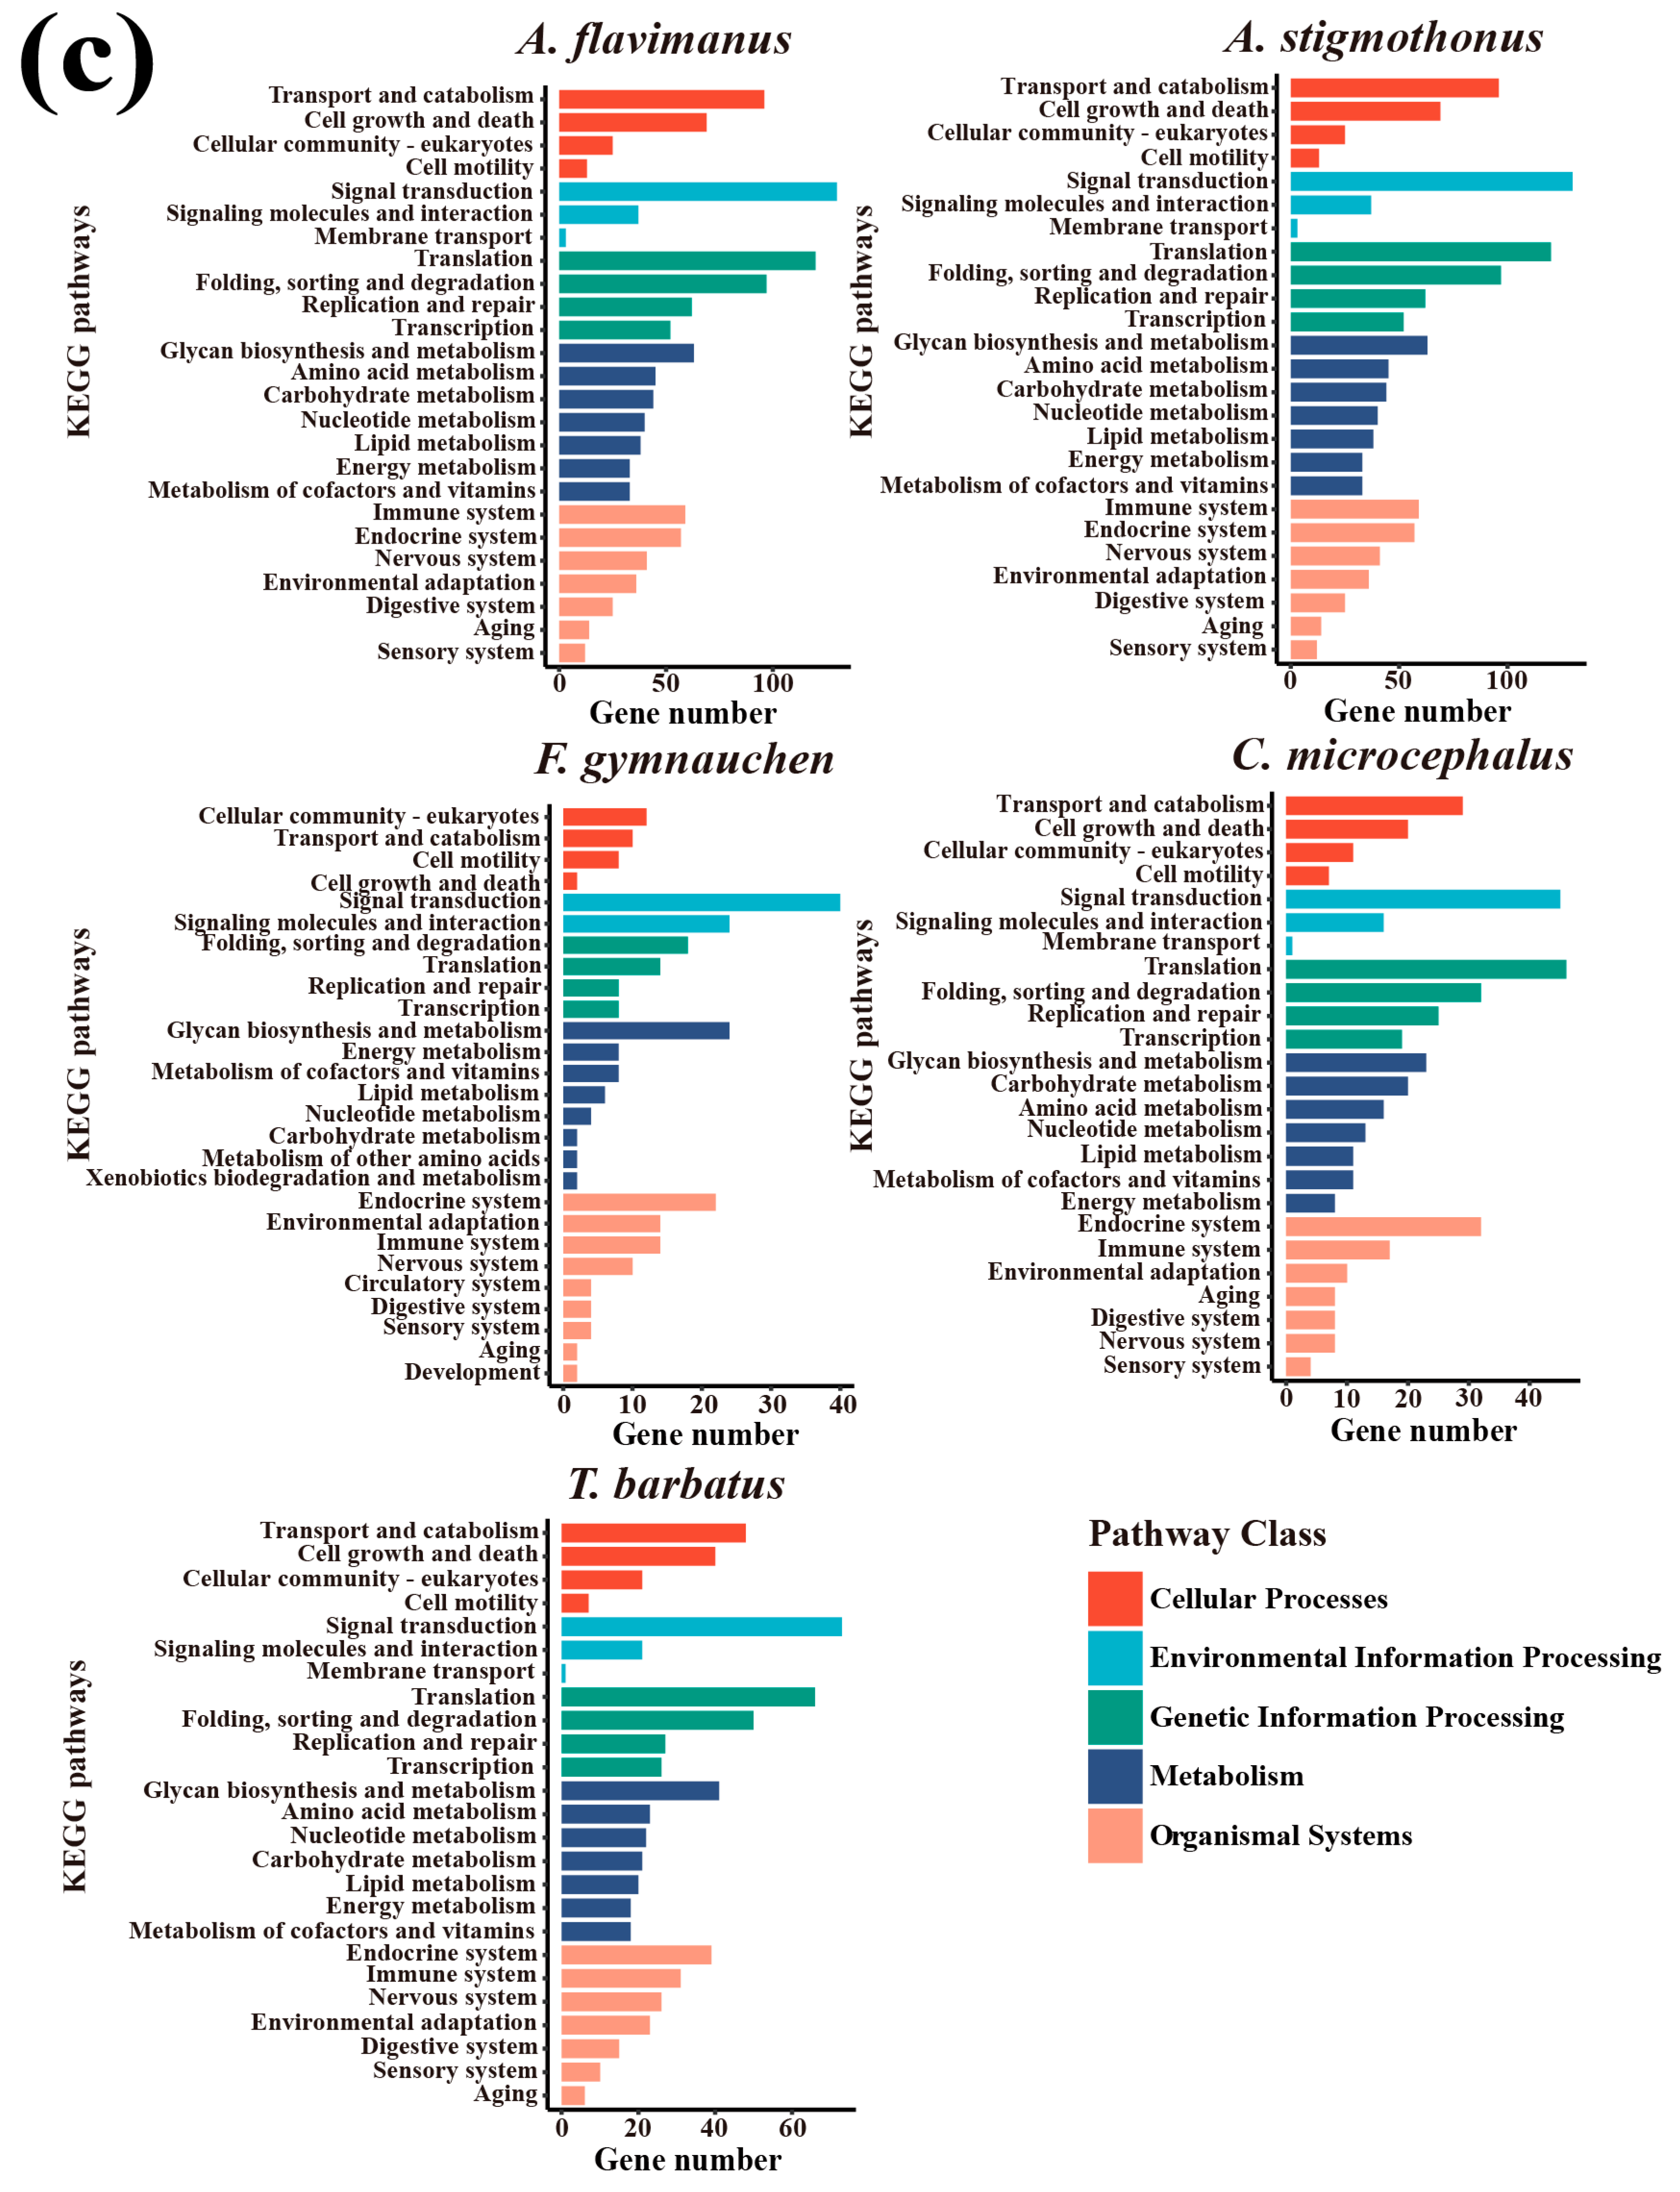
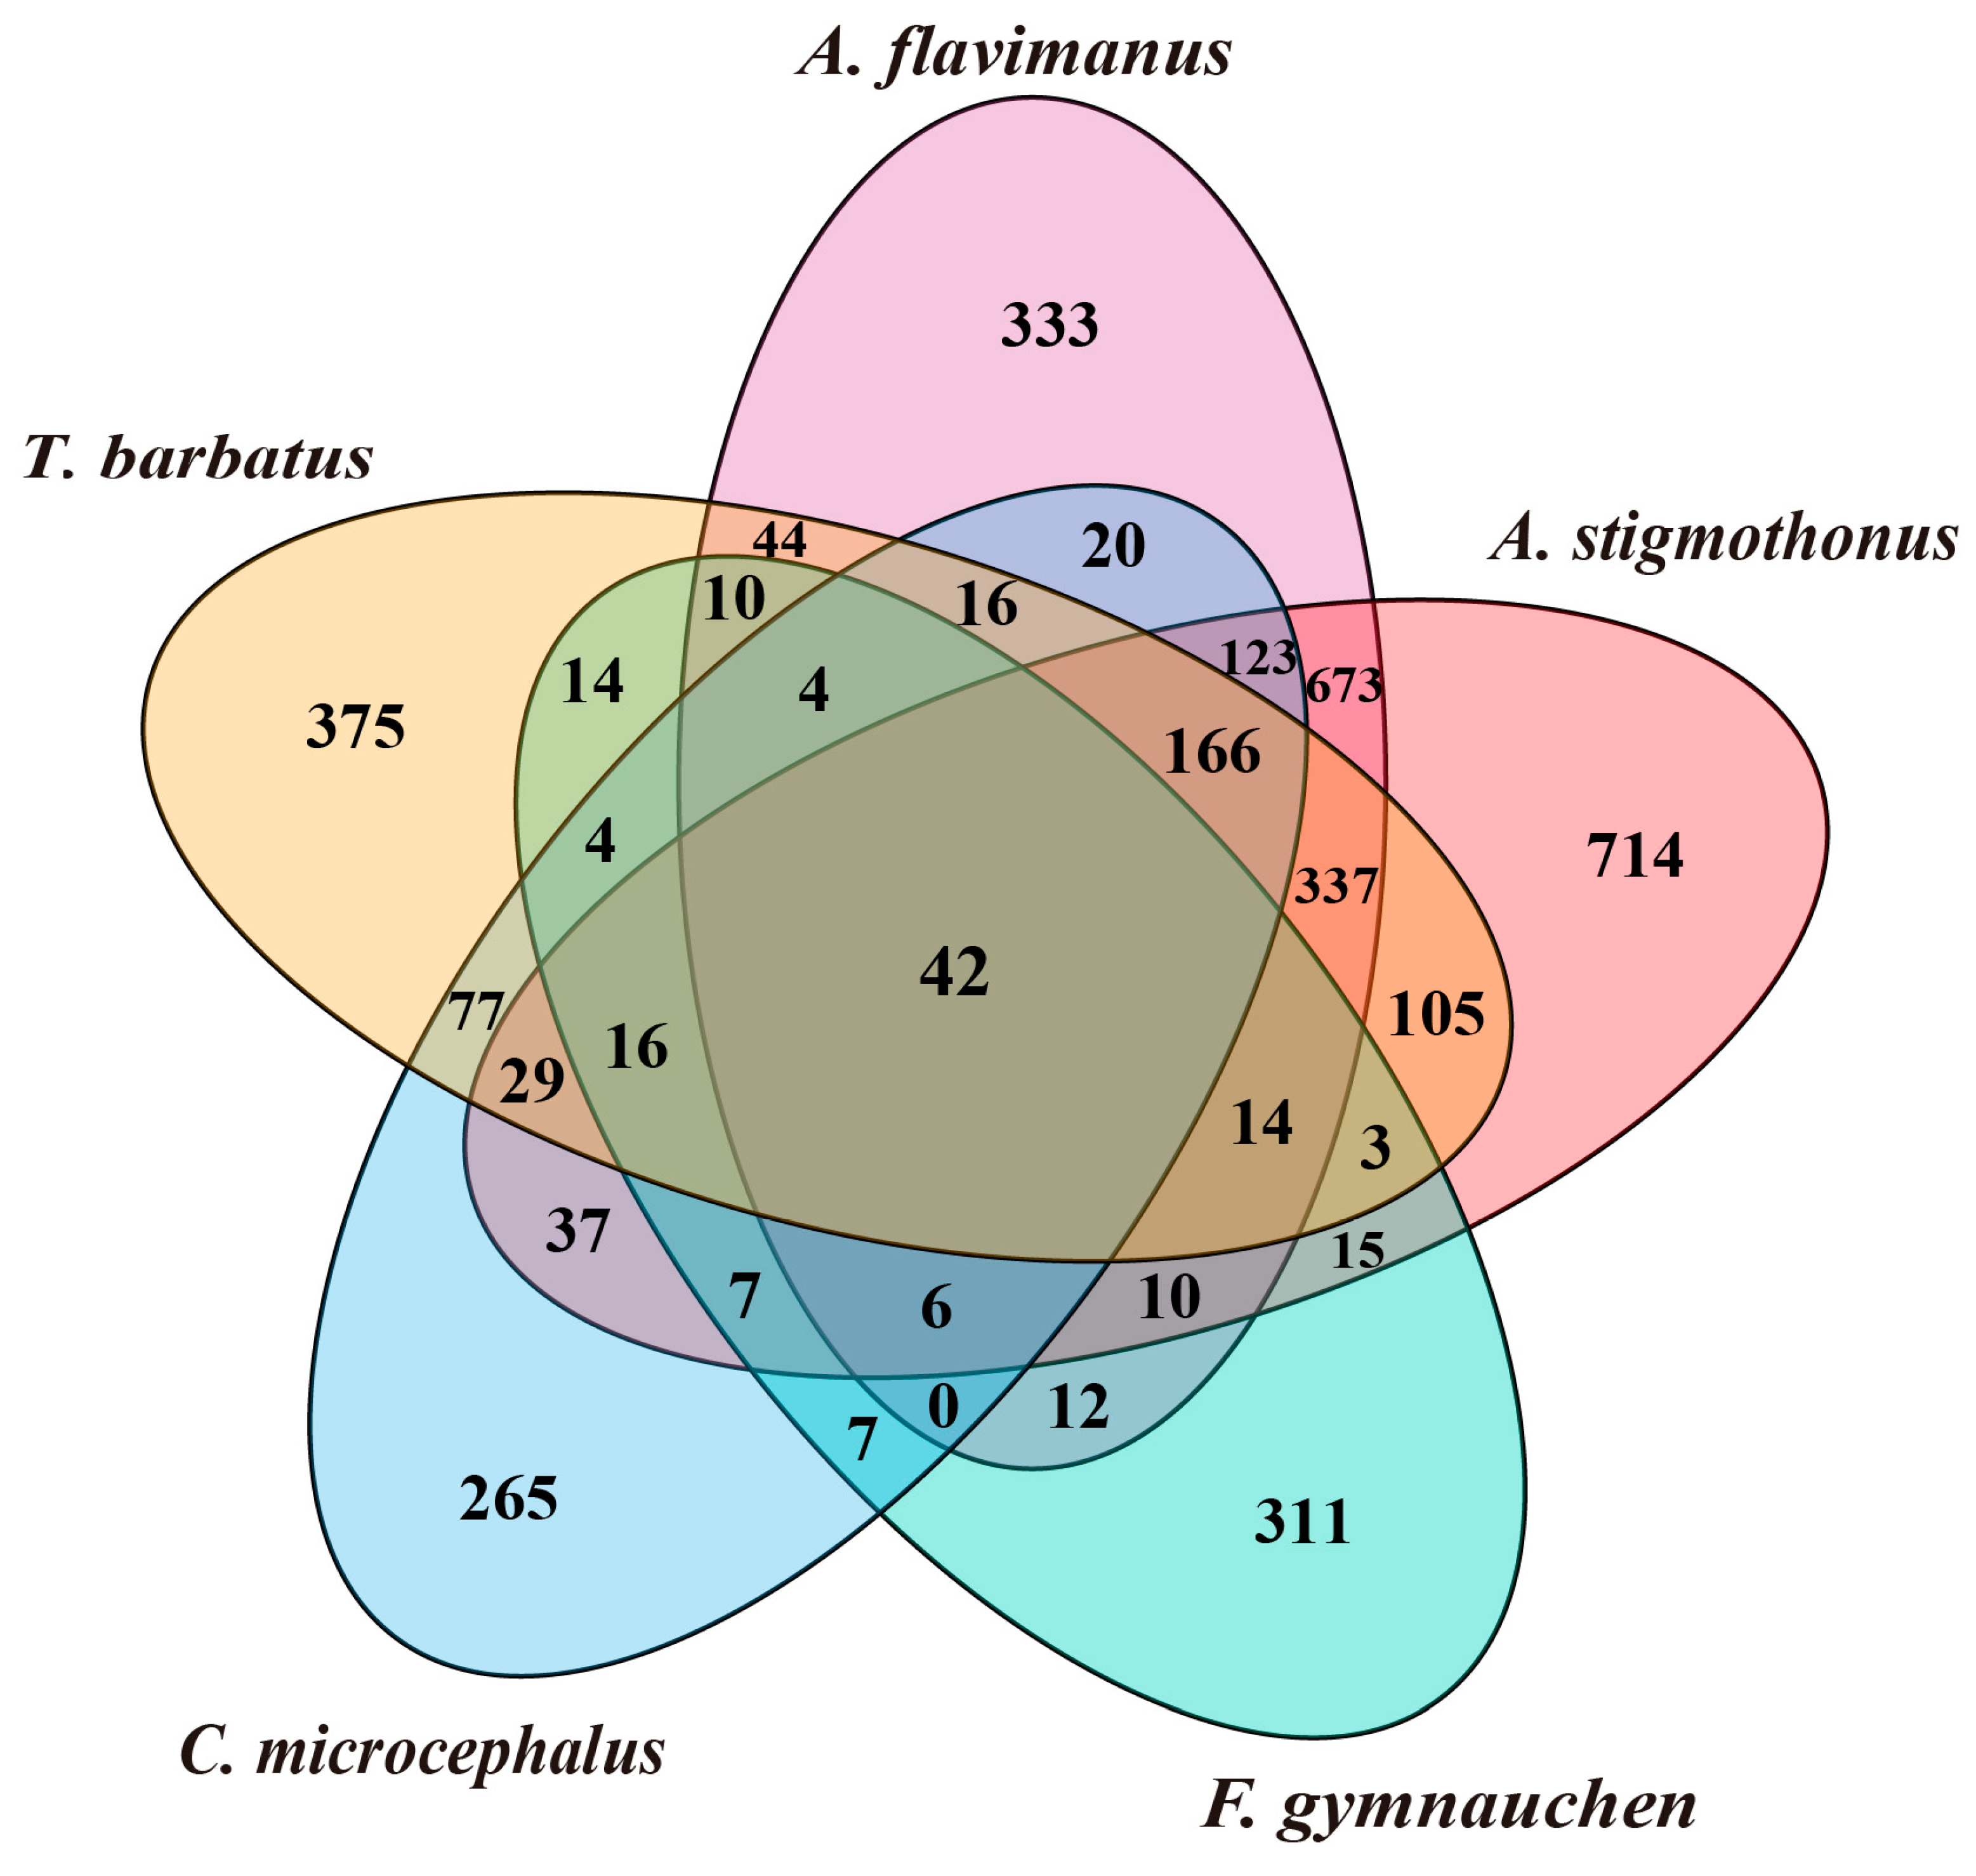
2.5. Genome Annotation

A total of 1780, 2250, 663, 794, and 1219 single-copy genes from A. flavimanus, A. stigmothonus, F. gymnauchen, C. microcephalus and T. barbatus were annotated in the KOG database. The statistical map of KOG annotations revealed that the top four annotated genes in the genomes of five Gobiidae fish were classified as “signal transduction mechanisms” “transcription” “translation, ribosomal structure, and biogenesis” and “RNA processing and modification” (Figure 5a). GO functions were classified into three categories, and the GO annotated genes in the genomes of five fish were mainly classified as “cellular process”, “cellular anatomical entity” and “binding”. Additionally, A. flavimanus, A. stigmothonus and T. barbatus had more genes classified as “response to stimulus” and “localization” compared to the other two Gobiidae fish (Figure 5b). KEGG annotation results demonstrated that the genomes of five fish had more genes classified as “signal transduction”, “translation”, “transport and catabolism”, “endocrine system” and “glycan biosynthesis and metabolism” (Figure 5c). Among the annotated genes, 42 overlaps were found to be common among five fish, with A. flavimanus and A. stigmothonus having the highest number of overlapping genes (673 genes) (Figure 6).

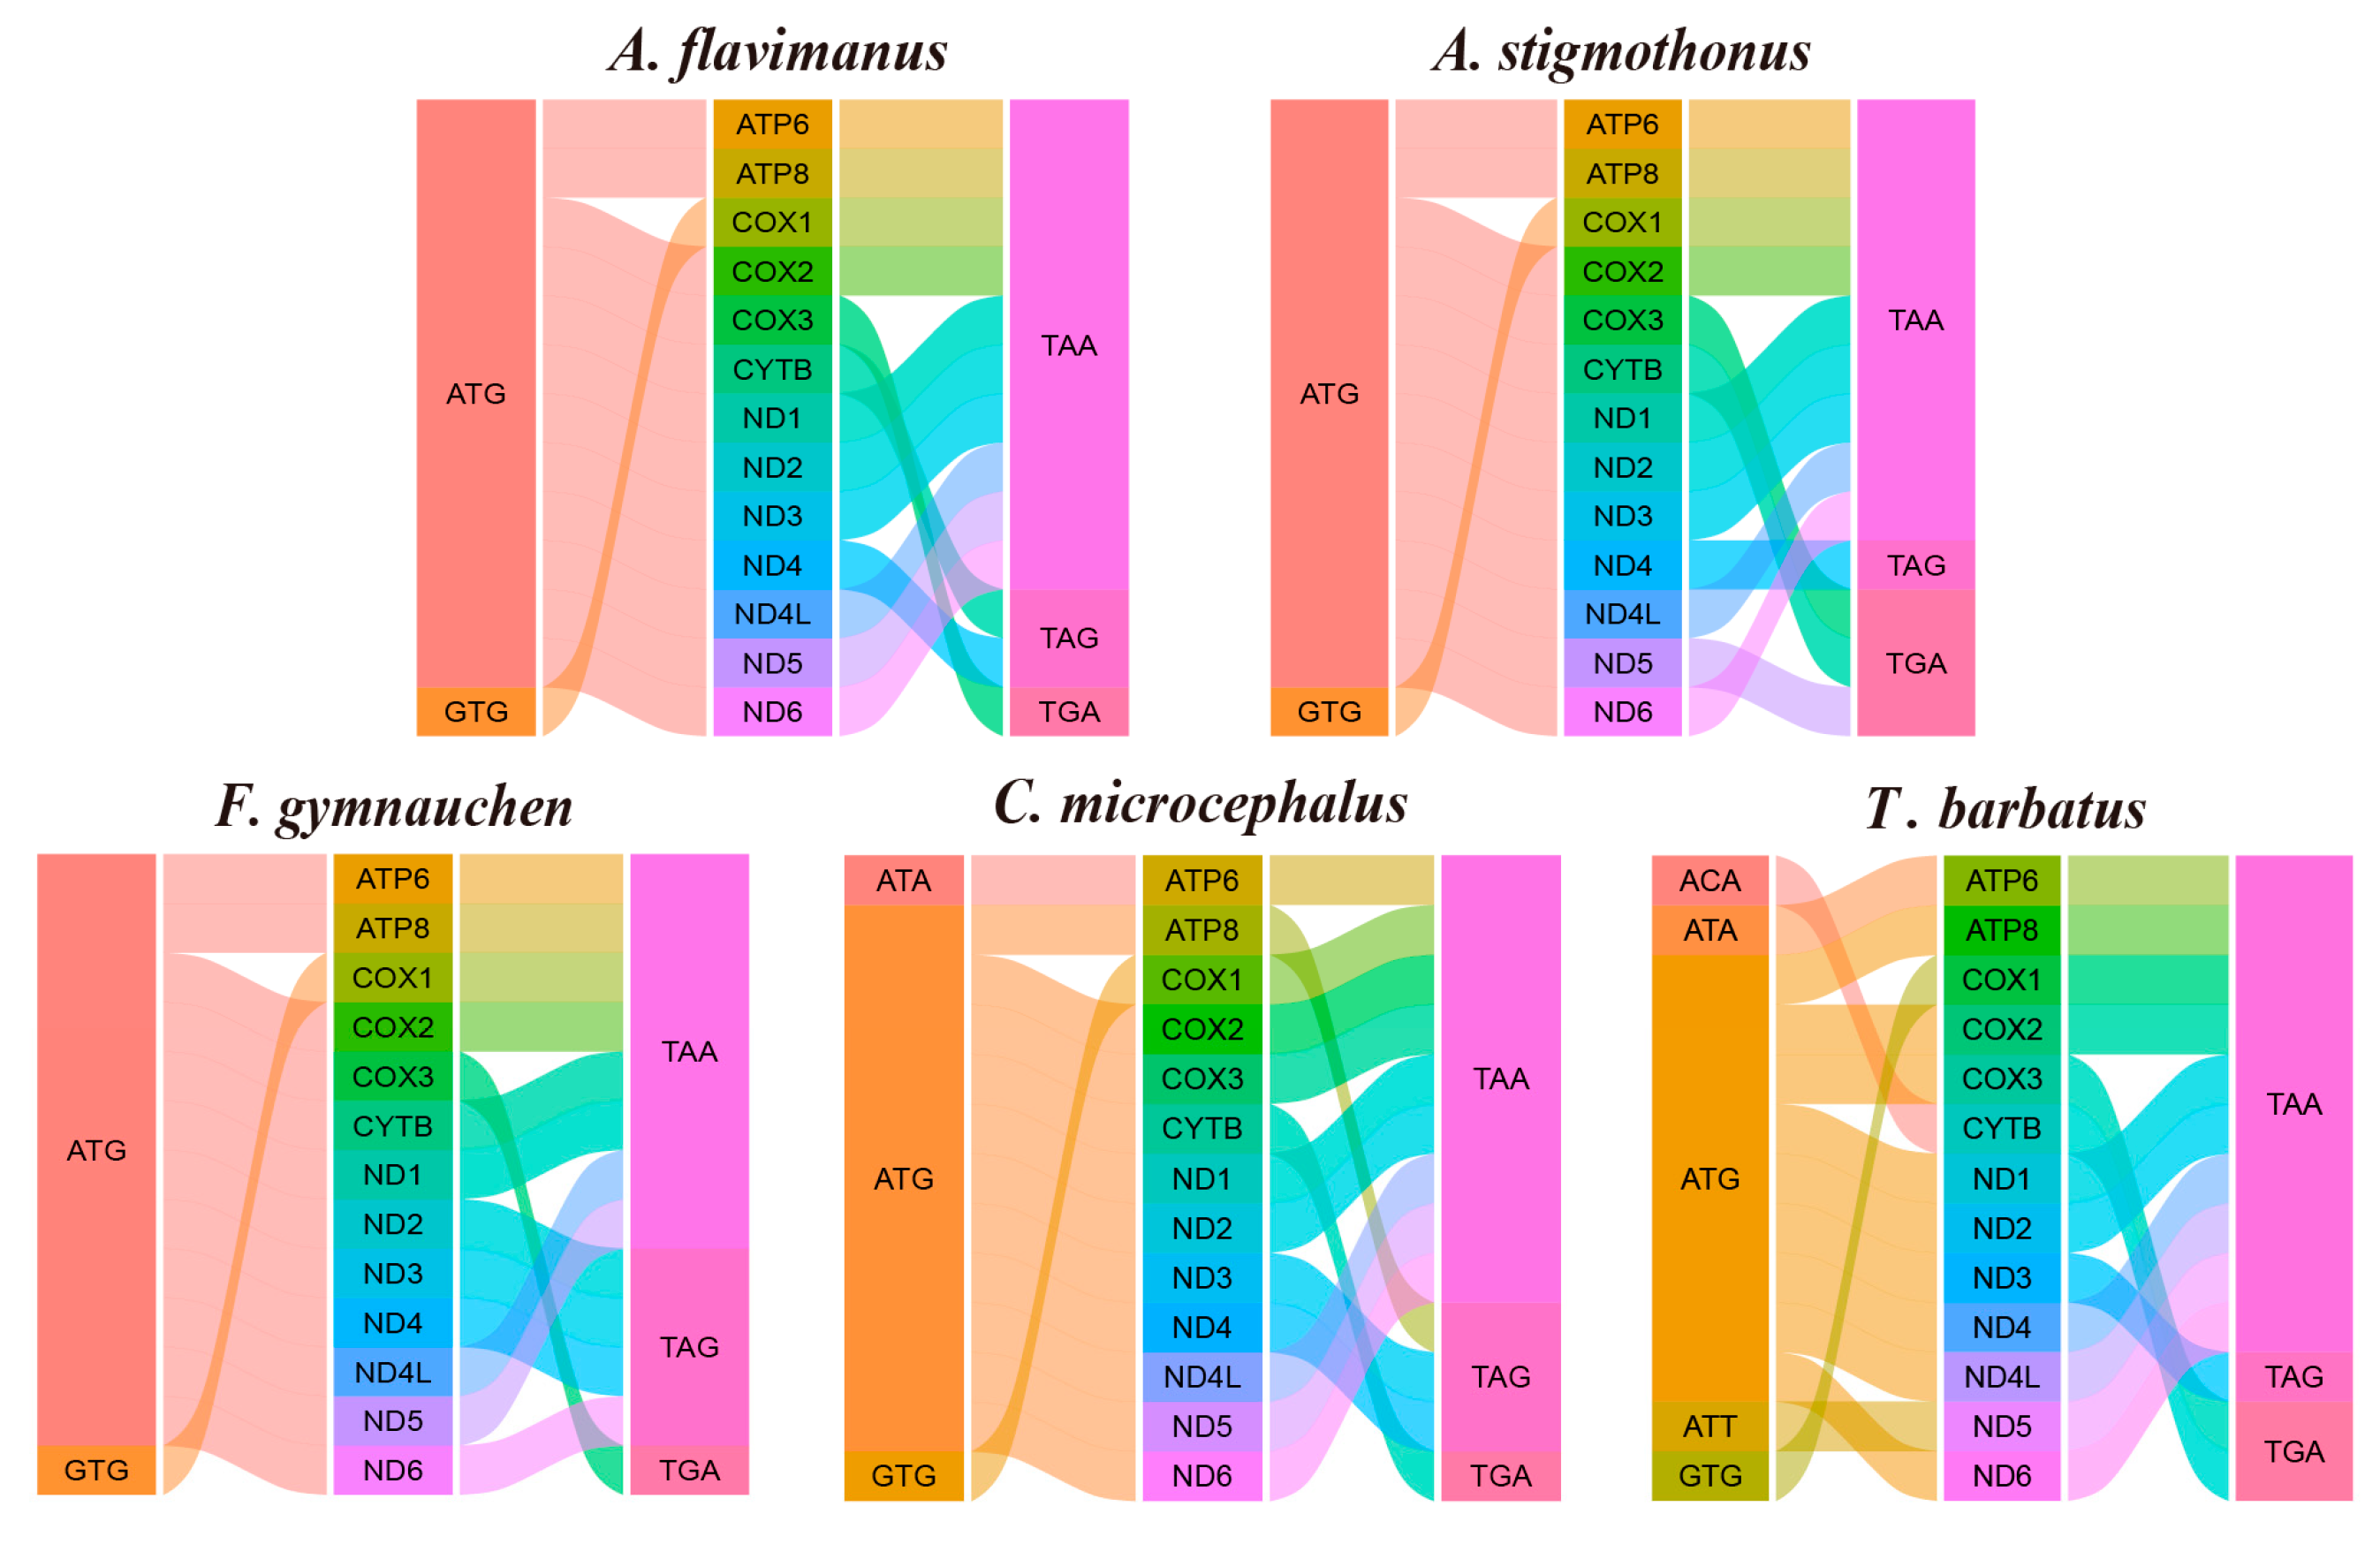
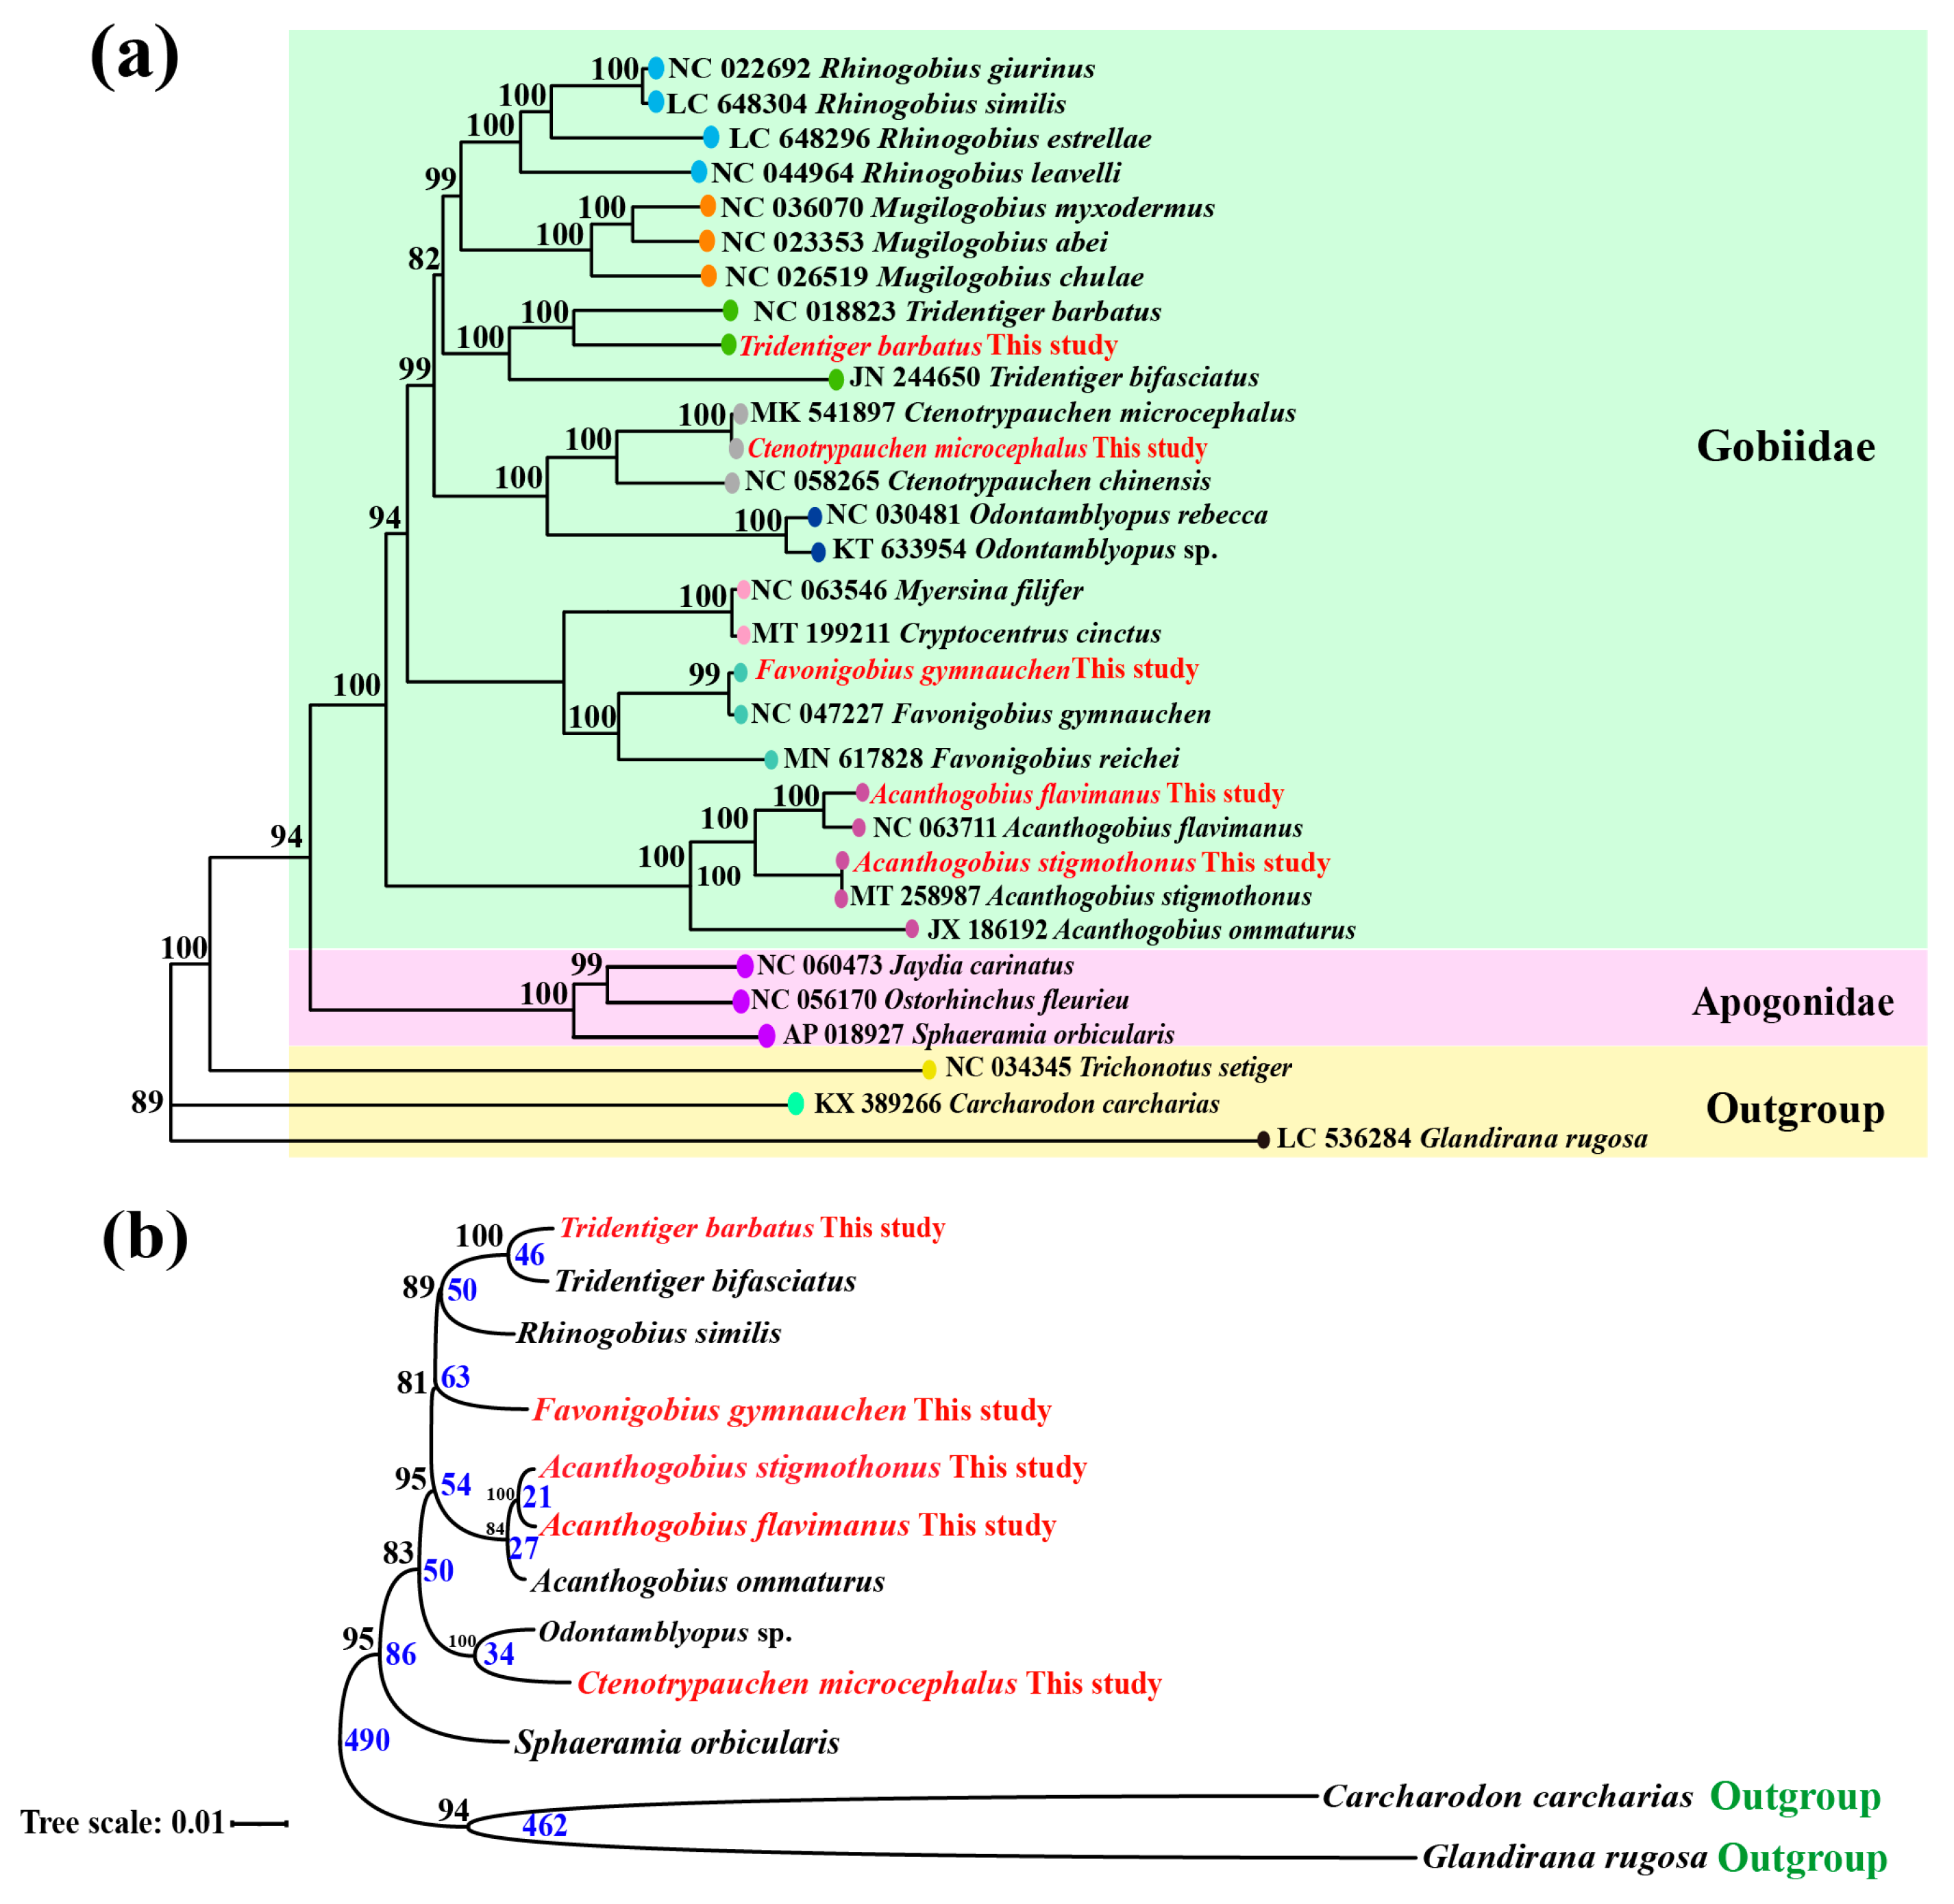
2.6. Mitochondrial Genome Assembly and Phylogenetic Analysis

Mitochondrial genomes of five Gobiidae fish were formed into closed circular molecules. The total length of A. flavimanus, A. stigmothonus, F. gymnauchen, C. microcephalus and T. barbatus mitogenome was 16,779 bp, 16,796 bp, 16,621 bp, 16,650 bp and 16,504 bp, respectively. Mitochondrial genomes all included typical 37 genes (13 protein-coding genes, 22 tRNAs, and 2 rRNAs) and 1 control region (Figure S1). ND6 and eight tRNA genes are distributed on the light chain, and the remaining genes are distributed on the heavy chain. Among the 13 protein-coding genes (PCGs), the start codon of five fish has five types, including ATG, GTG, ATA, ACA, and ATT. The termination codon was TAA, TAG, and TGA (Figure 7). Furthermore, we estimated the ratio of nonsynonymous (Ka) and synonymous (Ks) substitutions among the 13 protein-coding genes. The Ka/Ks ratio of each pair and the average Ka/Ks ratio (0.0851) were less than one (Table S2). This indicated that purifying selection acted against changes, resulting in low levels of purifying selection rates.
To better acquire the phylogenetic relationship, we used the 13 protein-coding genes from 26 species to construct maximum likelihood phylogenetic (Figure 8a). Our study showed that five Gobiidae species were clustered into four clades with high bootstrap values, and the closest kinship is A. flavimanus and A. stigmothonus which were consistent with traditional morphological classifications. Following fossil calibrations, the divergence time between A. flavimanus and A. stigmothonus was estimated at 21 million years ago (mya), while the divergence time from A. ommaturus was about 27 mya. Furthermore, we found that Apogonidae species had close relationships with Gobiidae species, and their divergence time was estimated at 86 million years ago (mya). The phylogenetic tree constructed using single-copy genes supported the clustering kinship by mitochondrial gene analysis (Figure 8b).

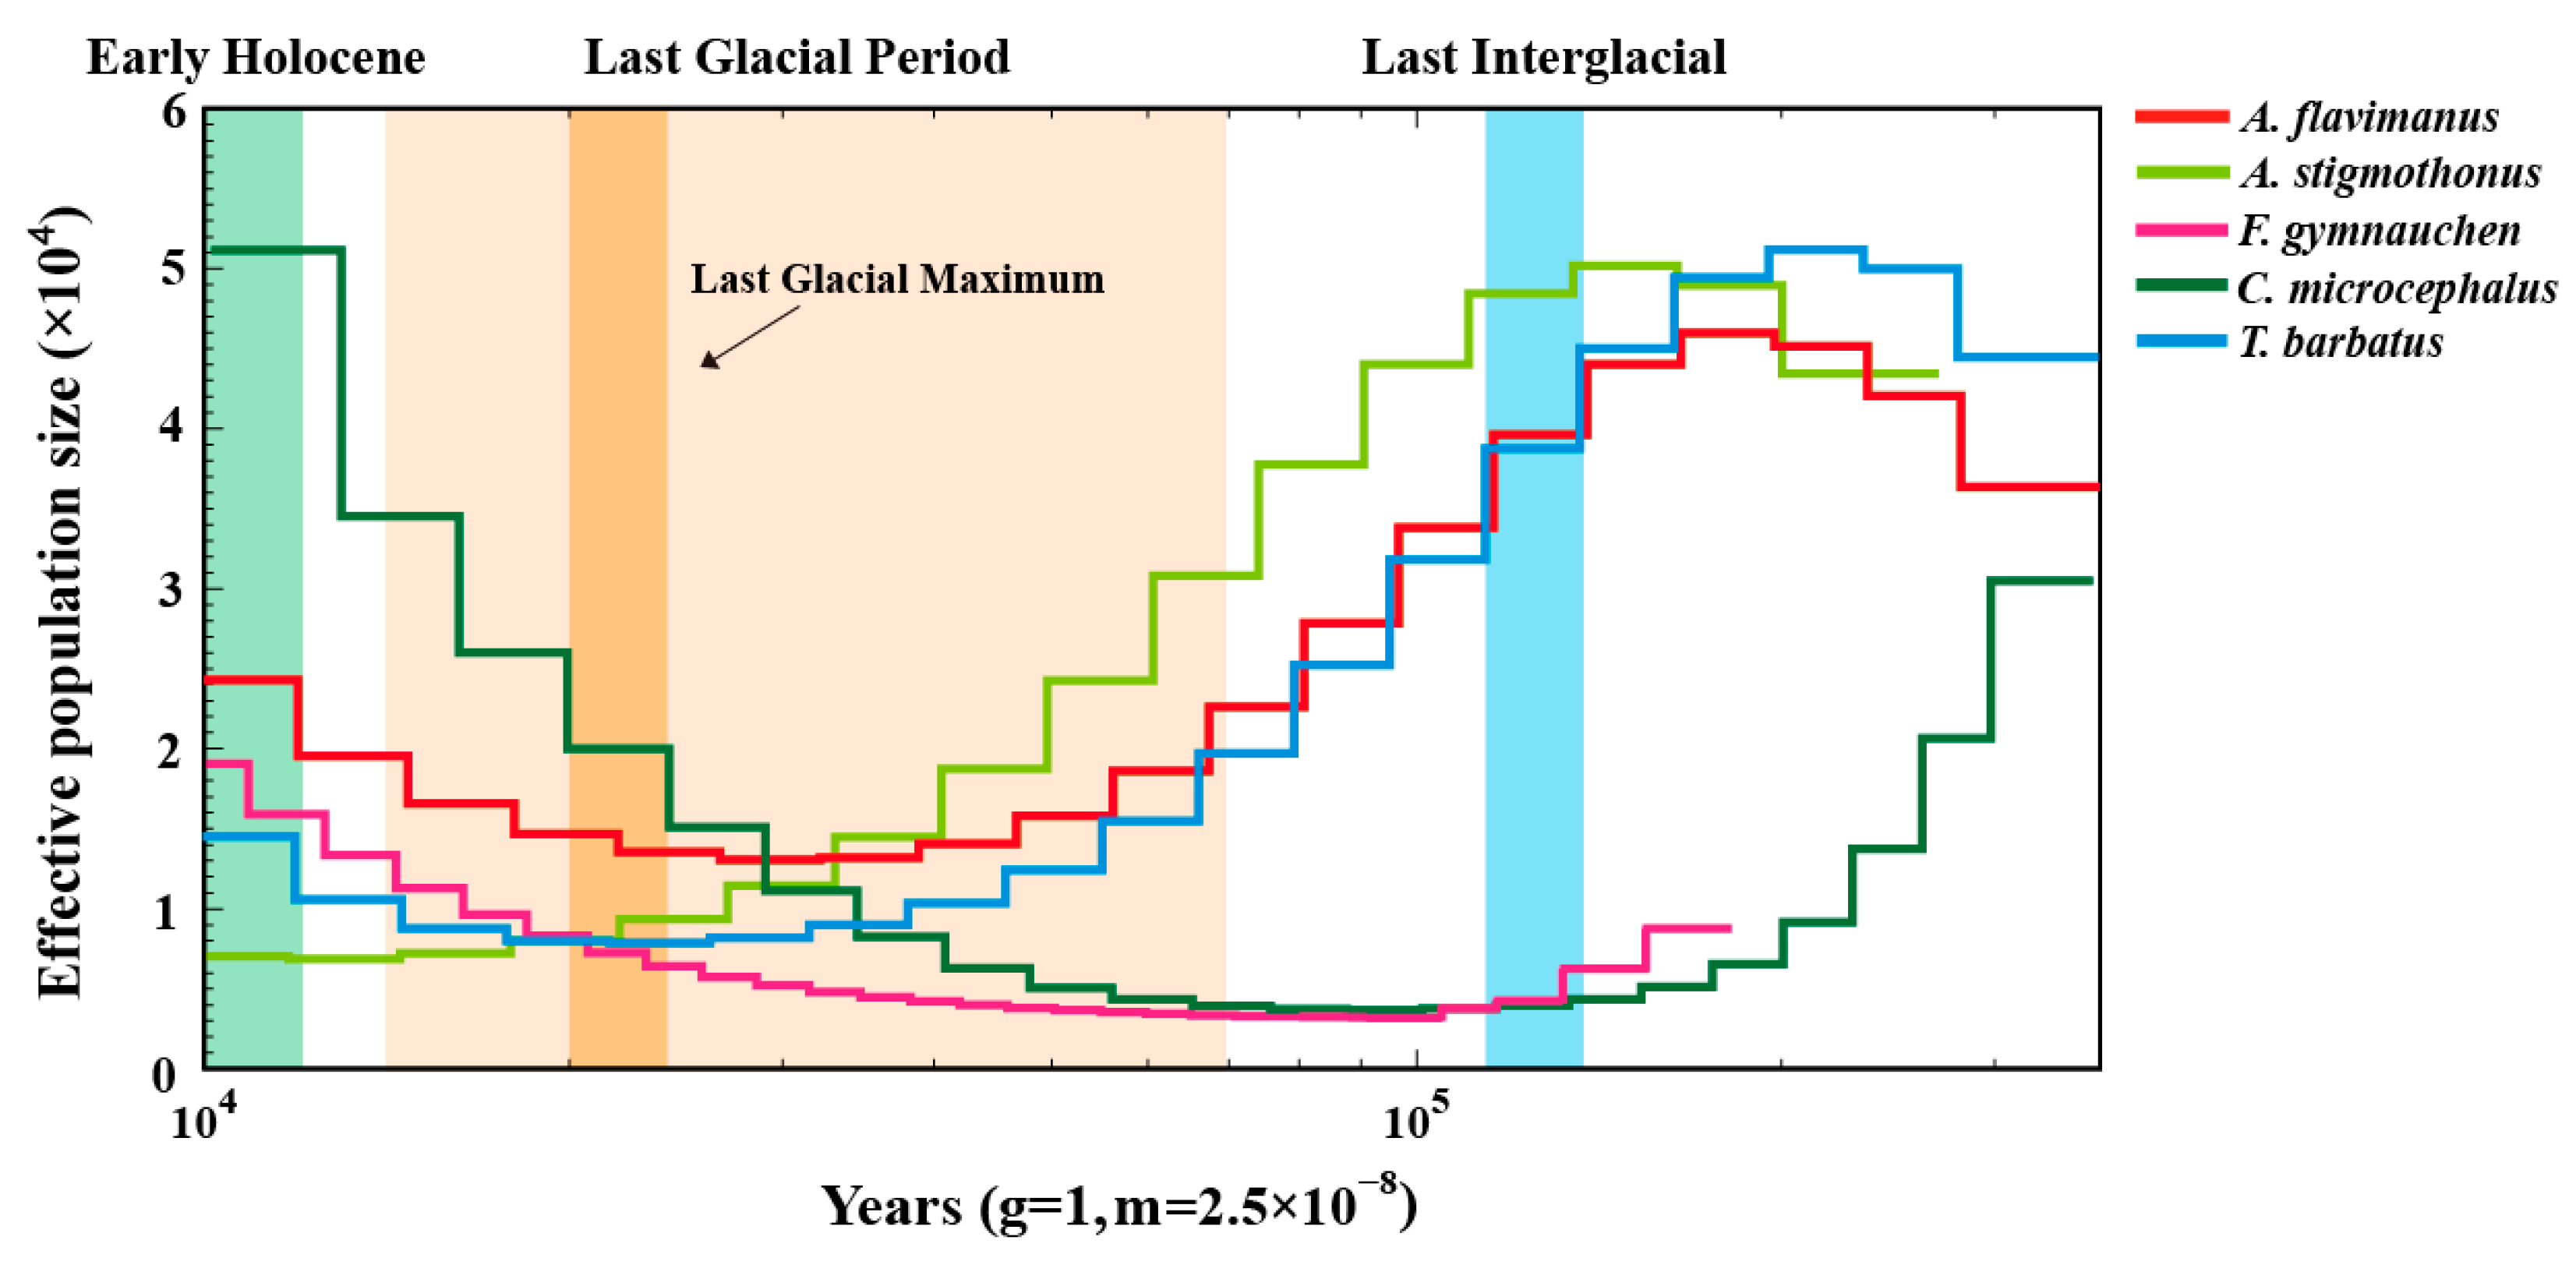
2.7. Demographic History

The PSMC model was employed to analyze the historical demographic dynamics of five Gobiidae fish over the period of 10–200 ka. As depicted in Figure 9, the effective population size (Ne) of all five fish exhibited a continuous decline during the Last Interglacial period. At the beginning of the last glacial period, F. gymnauchen and C. microcephalus experienced a notable population expansion. The effective population sizes (Ne) of A. flavimanus, A. stigmothonus and T. barbatus were similar during 10–100 ka, with all of them undergoing bottleneck periods in the last glacial period. Ne of A. flavimanus and T. barbatus began to gradually increase during the last glacial maximum period. Among five Gobiidae fish, C. microcephalus demonstrated a significantly larger population size in the Early Holocene.

3. Discussion

Gobiidae fish represent the most diversified group among marine fish families, with certain species exhibiting remarkable colonization potential [5,7,8,9]. In this study, the genomes of five Gobiidae fish were investigated using next-generation sequencing technology. The genomic data obtained were then employed to delve into genome characteristics, evolutionary relationships, gene functions, and the dynamic history of populations in these five Gobiidae fish.

3.1. Genome Sequencing and Characteristics

The characteristics of the raw data indicated that the effective rate, Q20, and Q30 in all five species exceeded 91%, demonstrating high-quality raw data. Genome size represents the amount of DNA within the gamete genome [25]. K-mer analysis revealed the genome sizes of five Gobiidae fish: 978.96 Mb for A. flavimanus, 998.27 Mb for A. stigmothonus, 1601.98 Mb for F. gymnauchen, 812.88 Mb for C. microcephalus, and 808.55 Mb for T. barbatus. The genome size of most Osteichthyes fish ranged from 300 Mb to 1 Gb, generally smaller than that of cartilaginous fish genomes [26,27,28]. The reported genome sizes of Gobiidae fish ranged from 679.76 Mb (Periophthalmus magnuspinnatus) to 1003.74 Mb (Neogobius melanostomus). The genome sizes of two Acanthogobius species were relatively large and comparable to A. ommaturus (921.49 Mb) [26]. Notably, the genome of F. gymnauchen was large, possibly due to a higher repetitive sequence content. The repeat ratio of the genome affects not only genome size and recombination but also the chromosome’s structure [29,30]. If genomic heterozygosity is exorbitant, genome assembly will be difficult [16]. In this study, F. gymnauchen exhibited a high heterozygous ratio (1.56%, >1%), which may impact the actual genome assembly. Future studies may benefit from combining second and third-generation sequencing techniques. Moreover, the GC content of five species ranged from 39.91% to 41.69% in our study, within the normal range and suitable for subsequent analysis [31].

3.2. Profile of Repeat Sequences in 5 Gobiidae Fish

Genomic SSR markers serve as effective genetic markers and have the advantages of easy detection, multiple allelic polymorphism, and codominant inheritance, which are common markers employed in many studies [32]. Previous research indicated that microsatellite markers also can be used to infer invasion history [33]. However, traditional methods for screening microsatellites are time-consuming and inefficient, while whole-genome survey sequencing presents a promising and cost-effective approach for identifying highly polymorphic microsatellite primer sequences [14,34]. There is limited availability of microsatellite markers in Gobiidae fish, and the existing primers are not universally applicable among species [35]. Until now, there has been no development of microsatellite markers for five Gobiidae fish. In the present study, plenty of candidate microsatellite loci were identified, and the distribution characteristics were described. Mononucleotide repeats were the most common microsatellite loci for five Gobiidae fish, and the number of repeats decreased with the length of the repeat motifs increased. C. microcephalus and F. gymnauchen exhibited the greatest number of SSRs, which could be attributed to their higher genomic heterozygosity [36]. Despite C. microcephalus having a relatively small genome size, it had the highest number of SSRs. This suggested that the number of SSRs is independent of genome size. These findings provide powerful support for further development of microsatellites in Gobiidae fish, and facilitate following studies on species invasion, population genetics, and genetic diversity [37].

3.3. Genome Annotation

Single-copy genes, known for their conservation during speciation, play a vital role in regulating diverse life activities and constitute a significant part of functional genomics [38,39]. In this study, we searched single-copy genes within the scaffold draft genomes of five Gobiidae species and mapped them to KOG, GO, and KEGG databases. The results of annotated genes were mainly classified as “signal transduction mechanisms”, “cellular process”, “cellular anatomical entity” and “translation”. It is noteworthy that A. flavimanus, A. stigmothonus and T. barbatus had more genes classified as “response to stimulus” and “localization”. These genes are pivotal in responding to stress, biological stress, and endogenous and extracellular stimuli. They facilitate rapid physiological or behavioral responses to stimuli such as alterations in temperature, light exposure, or biotic interactions [40,41]. Previous research has emphasized the importance of organisms’ responses to environmental stimuli in the context of invasive processes [42]. We speculated that these genes may be a factor in A. flavimanus and T. barbatus invasion, which promote rapid and appropriate responses to environmental stimuli and could provide a competitive advantage in new habitats [5,8]. Further evidence and research are needed to support this conjecture. Previous studies have demonstrated that the interaction of genes and environmental factors may promote species invasion [43]. Therefore, it is critical to comprehend these genes in organisms’ responses to environmental stress, as well as internal and external stimuli. Furthermore, investigating the expression patterns of these genes can provide valuable insights into their dynamic regulatory mechanisms across various environments [44]. Future research can delve into the intricate functions, regulatory networks, and interactions of these genes, which will enrich our understanding of species’ survival and reproductive strategies.

3.4. Overview of Mitochondrial Genome and Phylogenetic Relationship

Mitochondrial genomes were assembled from the scaffold graft genome for five Gobiidae fish. The mitogenomes of C. microcephalus and T. barbatus were similar to previously reported sequences (No MK_541897, 16,652 bp; No NC_018823, 16,522 bp). However, the mitochondrial length of A. flavimanus in this study was longer than the reported sequences (No NC_063711, 16,673 bp), which was attributed to the longer displacement loop (D-loop). It has been reported that D-loops may have mutational changes during evolution, leading to variations in sequence length [45]. We attempted to extract the mitochondrial sequences of A. stigmothonus and F. gymnauchen using MitoFinder v2 and MitoZ v2.4 software [46,47]. The sequences were longer than previously published sequences (No MT_258987, 16,666 bp; No NC_047227, 16,480 bp), mainly due to the extended length of the 16S rRNA genes. Because of the resilience of 16S rRNA genes to mutation, we speculated that erroneous fragments might have been added into 16S rRNA during high-throughput sequencing and assembly. With the rapid advancement of NGS technology, mitochondrial genome sequences have become more accessible. Currently, in the literature about extracting the complete mitochondrial genome, NGS technology has gradually replaced the conventional method (https://www.tandfonline.com/loi/tmdn20, accessed on 20 February 2024). NGS technology has emerged as a powerful tool for studying evolutionary biology and phylogenetics.
The phylogenetic analysis using 13 protein-coding genes revealed that five fish were clustered into four clades with high bootstrap values. Ctenotrypauchen and Odontamblyopus were clustered into one clade within Amblyopinae, characterized by a continuous dorsal fin [48,49]. A. stigmothonus and A. flavimanus were identified as the two most recently diverged species in Gobiidae, and they had the closest relationship, which was aligned with morphological classification results [24,50]. It supported that their divergence did not occur simultaneously, despite their sequences being extremely similar and often misidentified. Furthermore, Favonigobius and Acanthogobius were divided into two branches, which was inconsistent with the results of 12S rRNA sequences [51]. We speculated that the limitations imposed by the 12S rRNA of mitochondrion on exploring evolutionary relationships among species. This phylogenetic tree also supported the conclusion that Apogonidae species had close relationships with Gobiidae species [48,52]. The divergence time between Apogonidae and Gobiidae species was estimated to be 86 mya, which consistently aligned with previous studies utilizing time plots [53]. Furthermore, single-copy genes exhibited high conservation during evolution and could provide more accurate phylogenetic relationships [24,54]. The phylogenetic tree constructed by them also confirmed the precision of 13 protein-coding genes.

3.5. Demographic Analysis

Historical demographic dynamics can explore the impact of external factors on species distribution [55]. In this study, PSMC analyses of five Gobiidae species showed that their effective population size had a continuous decline during the last interglacial period. This was a relatively warm geological period compared to preceding glacial periods, and some populations may migrate to more suitable habitats [56]. During the Pleistocene Glacial Epoch, A. flavimanus and T. barbatus experienced a bottleneck period and occurred a gradual recovery after the last glacial maximum. This finding was aligned with T. bifasciatus [22]. In contrast, the population size of F. gymnauchen and C. microcephalus exhibited a continuing population expansion, while A. stigmothonus experienced a continuing decrease. During the Pleistocene Glacial Epoch, the sea level decreased by approximately 100 meters, destroying coastal fish habitats. However, the persistence of water sources unaffected by glaciers may have facilitated population increases. In summary, the combined effects of changes in sea area and climate change during this period may have a profound impact on the abundance and distribution of marine life [57,58]. It is noteworthy that the population size of C. microcephalus was significantly larger than the other four fish during the Early Holocene, suggesting a potential increase in genetic diversity. Genetic diversity plays a crucial role in influencing the abundance and distribution of species, and the higher genetic diversity of C. microcephalus may be related to its abundance of resources, which can be found in the reports of dominant species [4,59,60].

4. Materials and Methods

4.1. Ethics Statement

This study was conducted strictly with Chinese Animal Management Regulations and animal care quality management requirements of the Ocean University of China.

4.2. Sample Preparation and Genome Sequencing

Gobiidae fish samples were collected from the coastal seas of China (Table 5). After morphologically identifying, the muscle tissue of five fish was extracted and preserved in 95% alcohol. The remaining tissue samples were rapidly refrigerated at −80 °C. We extracted DNA from one sample of each species. The phenol-chloroform approach was employed to extract genomic DNA. This method combined cell lysate with phenol, and then separated the aqueous and organic phases. DNA remained in the aqueous phase, while proteins and lipids partitioned into the organic phase. After using chloroform for further purification, DNA was precipitated in ethanol and the ethanol was decanted. Subsequently, the DNA-containing pellet was air-dried and then mixed with 50 μL nuclease-free water. The DNA content was measured with a NanoDrop 2000 Spectrophotometer (Waltham, MA, USA). Then, DNA barcoding technology (Cytochrome Oxidase Subunit I gene and 12S ribosomal RNA gene) was employed for species identification.
The random DNA fragments were obtained using a Covaris ultrasonic crusher (Covaris, Woburn, MA, USA). The construction of the whole library entailed several sequential steps to prepare the DNA fragments for sequencing. Initially, the DNA fragments underwent end repair, trimming any damaged or overhanging ends. Subsequently, adapter molecules were ligated to the repaired DNA fragments’ ends. Following adapter ligation, the library was purified to eliminate any unligated adapters or other contaminants. Finally, Polymerase Chain Reaction (PCR) amplification was conducted to amplify the DNA fragments, enriching the library for sequencing. The prepared library was sequenced using the Illumina HiSeq2500 platform (San Diego, CA, USA), employing synthetic sequencing (SBS) technology. Novogene Co., Ltd. (Beijing, China) constructed the library and performed sequencing.

4.3. Analysis of K-mer and GC Content

The impact of bias in GC content and sequencing errors was reduced by Fastp v0.20.1 and 50X sequencing depth [61]. A total of 10,000 filtered readings were selected for comparison with NCBI’s nucleotide (NT) database, which could find the related species. K-mer analysis was performed using Jellyfish v2.0 and GenomeScope v2.0 software to collect information about genome length, heterozygosity, repeat content and genome size [62,63]. Meanwhile, clean reads were assembled into contigs and scaffolds with SOAPdenovo v2.01 software [31]. Scaffold sequences were constructed using paired-end information from contigs, and assembly quality was assessed using Busco v5 software [64]. Furthermore, the sequencing depth and GC content of five fish were evaluated to identify the sequencing bias. The average depth of GC sequencing was calculated using 10 kb non-overlapping sliding windows across the assembled sequences [18]. General graphing and statistics were drafted by R-Studio v4.0 [65].

4.4. Microsatellite Identification

The MIcroSAtellite (MISA) v2.1.0 software was employed to identify microsatellite motifs in the whole genome [66]. The size of microsatellite motifs ranged from one to six nucleotides, and criteria were set at 10, 6, 5, 5, 5, and 5, respectively. Subsequently, graphs were generated using Origin 2021 (https://www.originlab.com/2021, accessed on 20 October 2023).

4.5. Search of Single-Copy Homologous Genes and Functional Annotation

The single-copy homologous genes of five Gobiidae fish were identified using Busco v5 software [64]. Moreover, the whole gnomes of seven other fish species (Tridentiger bifasciatus: PRJNA825009; Rhinogobius similis: GCA_019453435.1; Acanthogobius ommaturus: SRR1749713; Odontamblyopus sp.: PRJNA834853; Sphaeramia orbicularis: GCA_902148855.1; Carcharodon carcharias: GCA_017639455.1; Glandirana rugosa: GCA_018402905.1) were downloaded from the NCBI (http://www.ncbi.nlm.nih.gov/genome/, accessed on 10 November 2023) database, and used for multiple sequence alignment to construct a phylogenetic tree by OrthoFinder v2.5.2 software [67]. Divergence time was calculated and calibrated based on MCMCTree v4.9 software and the TreeTime database [68,69]. Then, all identified single-copy genes in five Gobiidae fish were annotated using eggNOG-mapper v2.1.5 software [70]. Gene annotation of the Eukaryotic Orthologous Group (KOG), Gene Ontology (GO) and Kyoto Encyclopedia of Genes and Genomes (KEGG) was performed using the eggnog database. The results of gene annotation were visualized using HIPLOT PRO (https://hiplot.com.cn/cloud-tool/drawing-tool/list, accessed on 17 November 2023). A Venn diagram was generated using TBtools v1.098 software (https://github.com/CJ-Chen/TBtools, accessed on 19 November 2023).

4.6. Mitochondrial DNA Assembly and Phylogenetic Research

The filtered clean data were assembled to generate complete mitogenome sequences by MitoFinder v2 software [47]. The mitochondrial reference file was downloaded from NCBI with the ID JX186196.1. The assembled sequences were annotated using the mitofish website (http://mitofish.aori.u-tokyo.ac.jp/, accessed on 25 November 2023) to create a circular diagram of the mitochondrial genome.
To analyze the phylogenetic relationship among five Gobiidae fish, the 13 protein-coding sequences in mitochondrion genes of 26 species were collected from the NCBI database (Table S3). The combined sequences were aligned using the Muscle technique in MEGA version X software [71]. The evolutionary relationship was generated using the maximum likelihood (ML) algorithm, providing an accurate analysis of kinship. Additionally, the Ka/Ks ratio (nonsynonymous substitutions/synonymous substitutions) of 13 protein-coding genes in five fish was calculated using MEGAX software [71]. Ultimately, the tree was visualized using the Interactive Tree of Life (iTOL) website, available at https://itol.embl.de/, accessed on 13 December 2023 [72].

4.7. Demography History Analysis

The PSMC was employed to estimate the historical demographic dynamics of five fish species across time [73]. The PSMC input file was generated with a quality threshold of 20 (-q) using fq2psmcfa. PSMC analysis used default parameters (-N25-t15-r5-p “4 + 25 × 2 + 4 + 6”) to deduce variations in effective population size (Ne) over time [73]. Results were plotted on different scales of the x-axis with one-year generation time. The mutation rate per generation was set at 2.5 × 10⁻⁸ using the calculated annual mutation rate per site. Subsequently, PSMC trajectories of five species were plotted together.

5. Conclusions

In the present study, the phylogenetic tree revealed that A. flavimanus and A. stigmothonus have the closest kinship, and F. gymnauchen does not belong to Acanthogobius contrary to previous reports. Furthermore, we found that Apogonidae species had close relationships with Gobiidae species. The divergence time between Apogonidae and Gobiidae species was estimated to be 86 mya. A. flavimanus and T. barbatus had more genes classified as “response to stimulus” and “localization”, suggesting their potential importance in invasion biology. PSMC analyses of five Gobiidae species showed that their effective population size had a continuous decline during the last interglacial period. Additionally, plenty of candidate microsatellite loci were identified and provided powerful support for further development of microsatellites in Gobiidae fish. Overall, this paper not only further studies population genetics but also serves as a valuable reference for future studies on gene function and evolution within Gobiidae species.

Supplementary Materials

The following supporting information can be downloaded at: https://www.mdpi.com/article/10.3390/ijms25063293/s1.

Author Contributions

Conceptualization and methodology, N.S.; Software, X.Z.; data curation, X.Z. and S.M.; writing—original draft preparation, S.M.; writing—review and editing, N.S., S.M. and X.Z.; visualization, S.M.; Supervision, N.S.; funding acquisition, N.S. All authors have read and agreed to the published version of the manuscript.

Funding

This work was supported by the National Key R&D Program of China (2019YFD0901301) and the Observation and Research Station of Bohai Strait Eco-Corridor, MNR (BH202203).

Institutional Review Board Statement

All animal experiments were conducted according to the rules of the relevant Animal Research and Ethics Committees at the Ocean University of China (Approval code: OUC-AE-2024-154 Approval date: 5 March 2024).

Informed Consent Statement

Not applicable.

Data Availability Statement

The whole-genome sequencing data has been uploaded to the NCBI with No. PRJNA1037321; PRJNA1037349; PRJNA1040458; PRJNA1041613; PRJNA1041612.

Acknowledgments

We thank Chi Zhang and Fangrui Lou for collecting samples. We are also grateful to Yaxian Liu and Yu Pan’s guidance on data analysis and chart visualization.

Conflicts of Interest

The authors declare no conflicts of interest.

References

  1. Agorreta, A.; Mauro, D.S.; Schliewen, U.; Van Tassell, J.L.; Kovačić, M.; Zardoya, R.; Rüber, L. Molecular phylogenetics of Gobioidei and phylogenetic placement of European gobies. Mol. Phylogenet. Evol. 2013, 69, 619–633. [Google Scholar] [CrossRef]
  2. Winterbottom, R.; Emery, A.R. A new genus and two new species of gobiid fishes (Perciformes) from the Chagos Archipelago, Central Indian Ocean. Environ. Biol. Fishes 1981, 6, 139–149. [Google Scholar] [CrossRef]
  3. Froese, R. FishBase. World Wide Web Electronic Publication. 2005. Available online: http://www.fishbase.org (accessed on 2 January 2024).
  4. Han, D.; Xue, Y.; Ji, Y.; Xu, B.; Liu, H.; Ma, Q. Trophic and spatial niche of five gobiid fishes in Jiaozhou Bay. J. Fish. Sci. China 2013, 20, 148–156. [Google Scholar] [CrossRef]
  5. Koonin, E.V.; Wolf, Y.I. Constraints and plasticity in genome and molecular-phenome evolution. Nat. Rev. Genet. 2010, 11, 487–498. [Google Scholar] [CrossRef] [PubMed]
  6. Roche, K.; Janáč, M.; Šlapanský, L.; Mikl, L.; Kopeček, L.; Jurajda, P. A newly established round goby (Neogobius melanostomus) population in the upper stretch of the river Elbe. Knowl. Manag. Aquat. Ecosyst. 2015, 416, 33. [Google Scholar] [CrossRef]
  7. Zhou, W. A preliminary study on endangerment mechanism of freshwater fish species in wetland ecosystem of Yunnan. Biodivers. Sci. 2000, 8, 163. [Google Scholar] [CrossRef]
  8. Aguilar-Medrano, R.; Durand, J.R.; Cruz-Escalona, V.H.; Moyle, P.B. Fish functional groups in the San Francisco Estuary: Understanding new fish assemblages in a highly altered estuarine ecosystem. Estuar. Coast. Shelf Sci. 2019, 227, 106331. [Google Scholar] [CrossRef]
  9. O’grady, K.; Cowx, I. Nonindigenous fishes introduced into inland waters of the United States. Fish. Manag. Ecol. 2000, 2, 172–175. [Google Scholar] [CrossRef]
  10. Liu, J.; Du, J.C. Progress on the Application of Bioinformatics in Digital Agriculture. Chin. Agric. Sci. Bull. 2014, 30, 279–284. [Google Scholar]
  11. Van Tassell, J.L.; Kovacic, M. The Biology of Gobies; Patzner, R.A., Kapoor, B.G., Eds.; Science Publishers: Enfield, UK, 2011; pp. 3–138. [Google Scholar]
  12. Bai, C.; Liu, S.; Zhuang, C. Distribution characteristics of microsatellite DNA in the genome of Gobiidae. Prog. Fish. Sci. 2016, 5, 9–15. [Google Scholar]
  13. Shang, Y.; Wang, X.; Liu, G.; Wu, X.; Wei, Q.; Sun, G.; Mei, X.; Dong, Y.; Sha, W.; Zhang, H. Adaptability and Evolution of Gobiidae: A Genetic Exploration. Animals 2022, 12, 1741. [Google Scholar] [CrossRef]
  14. Aird, D.; Ross, M.G.; Chen, W.S.; Danielsson, M.; Fennell, T.; Russ, C.; Jaffe, D.B.; Nusbaum, C.; Gnirke, A. Analyzing and minimizing PCR amplification bias in Illumina sequencing libraries. Genome Biol. 2011, 12, R18. [Google Scholar] [CrossRef]
  15. Lu, M.; An, H.; Li, L. Genome Survey Sequencing for the Characterization of the Genetic Background of Rosa roxburghii Tratt and Leaf Ascorbate Metabolism Genes. PLoS ONE 2016, 11, e0147530. [Google Scholar] [CrossRef]
  16. Sarropoulou, E.; Sundaram, M.Y.A.; Kaitetzidou, E.; Kotoulas, G.; Gilfillan, D.G.; Papandroulakis, N.; Mylonas, C.C.; Magoulas, A. Full genome survey and dynamics of gene expression in the greater amberjack Seriola dumerili. Gigascience 2017, 6, 12. [Google Scholar] [CrossRef]
  17. Shi, L.; Yi, S.; Li, Y. Genome survey sequencing of red swamp crayfish Procambarus clarkii. Mol. Biol. Rep. 2018, 45, 799–806. [Google Scholar] [CrossRef]
  18. Song, H.; Zhang, Y.; Yang, M.; Sun, J.; Zhang, T.; Wang, H. Genome survey on invasive veined rapa whelk (Rapana venosa) and development of microsatellite loci on large scale. J. Genet. 2018, 97, 79–86. [Google Scholar] [CrossRef]
  19. Gilbert, P.S.; Chang, J.; Pan, C.; Sobel, E.M.; Sinsheimer, J.S.; Faircloth, B.C.; Alfaro, M.E. Genome-wide ultraconserved elements exhibit higher phylogenetic informativeness than traditional gene markers in percomorph fishes. Mol. Phylogenet. Evol. 2015, 92, 140–146. [Google Scholar] [CrossRef]
  20. Koprek, T.; Rangel, S.; McElroy, D.; Louwerse, J.D.; Williams-Carrier, R.E.; Lemaux, P.G. Transposon-Mediated Single-Copy Gene Delivery Leads to Increased Transgene Expression Stability in Barley. Plant Physiol. 2001, 125, 1354–1362. [Google Scholar] [CrossRef]
  21. Ma, Y.; Lou, F.; Yin, X.; Cong, B.; Liu, S.; Zhao, L.; Zheng, L. Whole-genome survey and phylogenetic analysis of Gadus macrocephalus. Biosci. Rep. 2022, 42, 7. [Google Scholar] [CrossRef]
  22. Zhao, X.; Liu, Y.; Du, X.; Ma, S.; Song, N.; Zhao, L. Whole-Genome Survey Analyses Provide a New Perspective for the Evolutionary Biology of Shimofuri Goby, Tridentiger bifasciatus. Animals 2022, 12, 1914. [Google Scholar] [CrossRef]
  23. Baeza, J.A.; Molina-Quirós, J.L.; Hernández-Muñoz, S. Genome survey sequencing of an iconic ‘Trophy’sportfish, the Roosterfish Nematistius pectoralis: Genome size, repetitive elements, nuclear RNA gene operon, and microsatellite discovery. Genes 2021, 12, 1710. [Google Scholar] [CrossRef]
  24. Shibukawa, K.; Iwata, A. Review of the East Asian Gobiid genus Chaeturichthys (Teleostei: Perciformes: Gobioidei), with description of a new species. Bull. Natl. Mus. Nat. Sci. 2013, 4, 31–51. [Google Scholar]
  25. Das, S.; Hirano, M. Editorial [Hot Topic: Comparative Genomics and Genome Evolution (Guest Editors: Sabyasachi Das and Masayuki Hirano)]. Curr. Genom. 2012, 13, 85. [Google Scholar] [CrossRef]
  26. Pan, Y.; Sun, Z.; Gao, T.; Zhao, L.; Song, N. Chromosome-level genome assembly of Acanthogobius ommaturus provides insights into evolution and lipid metabolism. Front. Mar. Sci. 2022, 9, 894821. [Google Scholar] [CrossRef]
  27. Adrian-Kalchhauser, I.; Blomberg, A.; Larsson, T.; Musilova, Z.; Peart, C.R.; Pippel, M.; Solbakken, M.H.; Suurväli, J.; Walser, J.-C.; Wilson, J.Y.; et al. The round goby genome provides insights into mechanisms that may facilitate biological invasions. BMC Biol. 2020, 18, 11. [Google Scholar] [CrossRef]
  28. Qiu, B.; Fang, S.; Ikhwanuddin, M.; Wong, L.; Ma, H. Genome survey and development of polymorphic microsatellite loci for Sillago sihama based on Illumina sequencing technology. Mol. Biol. Rep. 2020, 47, 3011–3017. [Google Scholar] [CrossRef]
  29. Cao, S.; Yang, Y.; Bi, G.; Nelson, D.; Hu, S.; Makunga, N.P.; Yu, B.; Liu, X.; Li, X.; Hu, X. Genomic and Transcriptomic Insight of Giant Sclerotium Formation of Wood-Decay Fungi. Front. Microbiol. 2021, 12, 746121. [Google Scholar] [CrossRef]
  30. Shapiro, A.J.; Sternberg, R. Why repetitive DNA is essential to genome function. Biol. Rev. Camb. Philos. Soc. 2005, 80, 227–250. [Google Scholar] [CrossRef]
  31. Xu, S.; Song, N.; Xiao, S.; Gao, T. Whole genome survey analysis and microsatellite motif identification of Sebastiscus marmoratus. Biosci. Rep. 2020, 40, 2. [Google Scholar] [CrossRef]
  32. Lei, Y.; Zhou, Y.; Price, M.; Song, Z. Genome-wide characterization of microsatellite DNA in fishes: Survey and analysis of their abundance and frequency in genome-specific regions. BMC Genom. 2021, 22, 421. [Google Scholar] [CrossRef]
  33. Fraimout, A.; Loiseau, A.; Price, D.K.; Xuéreb, A.; Jean-François, M.; Vitalis, R.; Fellous, S.; Debat, V.; Estoup, A. New set of microsatellite markers for the spotted-wing Drosophila suzukii (Diptera: Drosophilidae): A promising molecular tool for inferring the invasion history of this major insect pest. Eur. J. Entomol. 2015, 112, 855. [Google Scholar] [CrossRef]
  34. Huang, X.; Jiang, Y.; Jiang, X.; Yang, T. Analysis of Microsatellite Markers in Harpadon Nehereus Based on Transcriptome Sequencing Illumina Hiseq tm 2500. J. Zhejiang Ocean. Univ. Nat. Sci. 2021, 40, 189–197. [Google Scholar]
  35. Selkoe, K.A.; Toonen, R.J. Microsatellites for ecologists: A practical guide to using and evaluating microsatellite markers. Ecol. Lett. 2006, 9, 615–629. [Google Scholar] [CrossRef]
  36. Yang, J.; Zhang, J.; Han, R.; Zhang, F.; Mao, A.; Luo, J.; Dong, B.; Liu, H.; Tang, H.; Zhang, J.; et al. Target SSR-Seq: A novel SSR genotyping technology associate with perfect SSRs in genetic analysis of cucumber varieties. Front. Plant Sci. 2019, 10, 531. [Google Scholar] [CrossRef]
  37. Song, N.; Zhao, X.; Cai, C.; Gao, T. Profile of the genomic characteristics and comparative studies of five Trichiuridae species by genome survey sequencing. Front. Microbiol. 2022, 9, 962307. [Google Scholar] [CrossRef]
  38. Fitch, M.W. Distinguishing homologous from analogous proteins. Syst. Zool. 1970, 19, 99–113. [Google Scholar] [CrossRef]
  39. Huang, Y.; Feulner, P.G.; Eizaguirre, C.; Lenz, T.L.; Bornberg-Bauer, E.; Milinski, M.; Reusch, H.B.T.; Chain, J.J.F. Genome-wide genotype-expression relationships reveal both copy number and single nucleotide differentiation contribute to differential gene expression between stickleback ecotypes. Genome Biol. Evol. 2019, 11, 2344–2359. [Google Scholar] [CrossRef]
  40. Ištvánek, J.; Dluhošová, J.; Dluhoš, P.; Pátková, L.; Nedělník, J.; Řepková, J. Classification and Mining of Molecular Markers Useful in Red Clover (Trifolium pratense) Breeding. Front. Plant Sci. 2017, 8, 367. [Google Scholar] [CrossRef]
  41. Borgonove, C.M.; Cavallari, C.B.; Santos, M.H.; Rossetti, R.; Hartfelder, K.; Manfrin, M.H. Identification of differentially expressed genes in female Drosophila antonietae and Drosophila meridionalis in response to host cactus odor. BMC Evol. Biol. 2014, 14, 191. [Google Scholar] [CrossRef]
  42. Moran, E.V.; Alexander, J.M. Evolutionary responses to global change: Lessons from invasive species. Ecol. Lett. 2014, 17, 637–649. [Google Scholar] [CrossRef]
  43. Carroll, S.P. Natives adapting to invasive species: Ecology, genes, and the sustainability of conservation. Ecol. Res. 2007, 22, 892–901. [Google Scholar] [CrossRef]
  44. Ahmar, S.; Gruszka, D. In-silico study of brassinosteroid signaling genes in rice provides insight into mechanisms which regulate their expression. Front. Genet. 2022, 13, 953458. [Google Scholar] [CrossRef] [PubMed]
  45. Barthélémy, C.; de Baulny, H.; Lombès, A. D-loop mutations in mitochondrial DNA: Link with mitochondrial DNA depletion? Hum. Genet. 2002, 110, 479–487. [Google Scholar] [CrossRef]
  46. Allio, R.; Schomaker-Bastos, A.; Romiguier, J.; Prosdocimi, F.; Nabholz, B.; Delsuc, F. MitoFinder: Efficient automated large-scale extraction of mitogenomic data in target enrichment phylogenomics. Mol. Ecol. Resour. 2020, 20, 892–905. [Google Scholar] [CrossRef]
  47. Meng, G.; Li, Y.; Yang, C.; Liu, S. MitoZ: A toolkit for animal mitochondrial genome assembly, annotation and visualization. NAR 2019, 47, e63. [Google Scholar] [CrossRef]
  48. Thacker, E.C.; Roje, M.D. Phylogeny of cardinalfishes (Teleostei: Gobiiformes: Apogonidae) and the evolution of visceral bioluminescence. Mol. Phylogenet. Evol. 2009, 52, 735–745. [Google Scholar] [CrossRef] [PubMed]
  49. Nelson, J.S. Fish of the World; John Wiley Sons: New York, NY, USA, 2006; Volume 4, p. 601. [Google Scholar]
  50. Zheng, J.; Gao, W.; Sun, Z.; Gao, T.; Song, N. The complete mitochondrial genome of Acanthogobius stigmothonus (Perciformes, Gobiidae). Mitochondrial DNA Part B 2020, 5, 2888–2889. [Google Scholar] [CrossRef] [PubMed]
  51. Jeon, H.B.; Jun, J.; Choi, S.H.; Suk, H.Y. Diversification and colonization processes in Gobioidei predicted based on mitochondrial 12S rRNA with focusing on Oxudercidae. Mitochondrial DNA Part B 2021, 6, 1166–1172. [Google Scholar] [CrossRef]
  52. Thacker, C. Phylogeny of Gobioidei and Placement within Acanthomorpha, with a New Classification and Investigation of Diversification and Character Evolution. Copeia 2009, 2009, 93–104. [Google Scholar] [CrossRef]
  53. Cowman, P.F.; Bellwood, D.R. Coral reefs as drivers of cladogenesis: Expanding coral reefs, cryptic extinction events, and the development of biodiversity hotspots. J. Evol. Biol. 2011, 24, 2543–2562. [Google Scholar] [CrossRef]
  54. Chamala, S.; Feng, G.; Chavarro, C.; Barbazuk, W.B. Genome-wide identification of evolutionarily conserved alternative splicing events in flowering plants. Front. Bioeng. Biotechnol. 2015, 3, 33. [Google Scholar] [CrossRef] [PubMed]
  55. Karamanlidis, A.A.; Skrbinšek, T.; Amato, G.; Dendrinos, P.; Gaughran, S.; Kasapidis, P.; Kopatz, A.; Stronen, V.A. Genetic and demographic history define a conservation strategy for earth’s most endangered pinniped, the Mediterranean monk seal Monachus Monachus. Sci. Rep. 2021, 11, 373. [Google Scholar] [CrossRef]
  56. Otto-Bliesner, B.L.; Marshall, S.J.; Overpeck, J.T.; Miller, G.H.; Hu, A. CAPE Last Interglacial Project members. Simulating Arctic climate warmth and icefield retreat in the last interglaciation. Science 2006, 311, 1751–1753. [Google Scholar] [CrossRef]
  57. Abbott, R.J.; Brochmann, C. History and evolution of the arctic flora: In the footsteps of Eric Hultén. Mol. Ecol. 2003, 12, 299–313. [Google Scholar] [CrossRef] [PubMed]
  58. Liu, J.X.; Gao, T.X.; Wu, S.F.; Zhang, Y.P. Pleistocene isolation in the Northwestern Pacific marginal seas and limited dispersal in a marine fish, Chelon haematocheilus (Temminck & Schlegel, 1845). Mol. Ecol. 2007, 16, 275–288. [Google Scholar] [CrossRef]
  59. Wu, H.; Zhong, J. Osteichthys, Perciformes, Gobioidei. In Fauna Sinica, 1st ed.; Science Press: Beijing, China, 2008; Volume 5, pp. 211–215. [Google Scholar]
  60. Delrieu-Trottin, E.; Maynard, J.; Planes, S. Endemic and widespread coral reef fishes have similar mitochondrial genetic diversity. Proc. Biol. Sci. 2014, 281, 1797. [Google Scholar] [CrossRef] [PubMed]
  61. Chen, S.; Zhou, Y.; Chen, Y.; Gu, J. fastp: An ultra-fast all-in-one FASTQ preprocessor. Bioinformatics 2018, 34, i884–i890. [Google Scholar] [CrossRef]
  62. Marçais, G.; Kingsford, C. A fast, lock-free approach for efficient parallel counting of occurrences of k-mers. Bioinformatics 2011, 27, 764–770. [Google Scholar] [CrossRef]
  63. Varshney, R.K.; Chen, W.; Li, Y.; Bharti, A.K.; Saxena, R.K.; Schlueter, J.A.; Donoghue, M.T.A.; Azam, S.; Fan, G.; Whaley, A.M.; et al. Draft genome sequence of pigeonpea (Cajanus cajan), an orphan legume crop of resource-poor farmers. Nat. Biotechnol. 2012, 30, 83–89. [Google Scholar] [CrossRef]
  64. Simão, F.A.; Waterhouse, R.M.; Ioannidis, P.; Kriventseva, E.V.; Zdobnov, E.M. BUSCO: Assessing genome assembly and annotation completeness with single-copy orthologs. Bioinformatics 2015, 31, 3210–3212. [Google Scholar] [CrossRef]
  65. Baldwin, R.M.; Owzar, K.; Zembutsu, H.; Chhibber, A.; Kubo, M.; Jiang, C.; Watson, D.; Eclov, R.J.; Mefford, J.; McLeod, H.L.; et al. A Genome-Wide Association Study Identifies Novel Loci for Paclitaxel-Induced Sensory Peripheral Neuropathy in CALGB 40101. Clin. Cancer Res. 2012, 18, 5099–5109. [Google Scholar] [CrossRef]
  66. Beier, S.; Thiel, T.; Münch, T.; Scholz, U.; Mascher, M. MISA-web: A web server for microsatellite prediction. Bioinformatics 2017, 33, 2583–2585. [Google Scholar] [CrossRef]
  67. Emms, M.D.; Kelly, S. OrthoFinder: Phylogenetic orthology inference for comparative genomics. Genome Biol. 2019, 20, 1–14. [Google Scholar] [CrossRef]
  68. Xu, B.; Yang, Z. PAMLX: A graphical user interface for PAML. Mol. Biol. Evol. 2013, 30, 2723–2724. [Google Scholar] [CrossRef]
  69. Kumar, S.; Stecher, G.; Suleski, M.; Hedges, S.B. TimeTree: A Resource for Timelines, Timetrees, and Divergence Times. Mol. Biol. Evol. 2017, 34, 1812–1819. [Google Scholar] [CrossRef]
  70. Cantalapiedra, P.C.; Hernández-Plaza, A.; Letunic, I.; Bork, P.; Huerta-Cepas, J. eggNOG-mapper v2: Functional Annotation, Orthology Assignments, and Domain Prediction at the Metagenomic Scale. Mol. Biol. Evol. 2021, 38, 5825–5829. [Google Scholar] [CrossRef]
  71. Stecher, G.; Tamura, K.; Kumar, S. Molecular Evolutionary Genetics Analysis (MEGA) for macOS. Mol. Biol. Evol. 2020, 37, 1237–1239. [Google Scholar] [CrossRef]
  72. Letunic, I.; Bork, P. Interactive Tree Of Life (iTOL) v5: An online tool for phylogenetic tree display and annotation. Nucleic Acids Res. 2021, 49, W293–W296. [Google Scholar] [CrossRef]
  73. Li, H.; Durbin, R. Inference of human population history from individual whole-genome sequences. Nature 2011, 475, 493–496. [Google Scholar] [CrossRef]
Figure 1. K-mer analysis of five Gobiidae species.
Ijms 25 03293 g001
Figure 2. GC content and depth correlation evaluation of five Gobiidae fish.
Ijms 25 03293 g002
Figure 3. The distribution and abundance of different SSR motifs. (a) Percentage distribution of various repeat types. (b) The number of SSR motifs in A. flavimanus. (c) The number of SSR motifs in A. stigmothonus. (d) The number of SSR motifs in F. gymnauchen. (e) The number of SSR motifs in C. microcephalus. (f) The number of SSR motifs in T. barbatus.
Ijms 25 03293 g003
Figure 4. Frequency of mononucleotide, dinucleotide and trinucleotide repeats for five Gobiidae fish.
Ijms 25 03293 g004
Figure 5. All predicted single-copy genes were aligned by BLAST to three information systems: (a) KOG annotation of predicted single-copy genes. (b) GO annotation of predicted single-copy genes. (c) KEGG annotation of predicted single-copy genes.
Ijms 25 03293 g005aIjms 25 03293 g005bIjms 25 03293 g005c
Figure 6. Venn diagram of annotated genes of five Gobiidae fish. Numbers represent the count of overlapping annotated genes.
Ijms 25 03293 g006
Figure 7. Start and stop codons used in mitochondrial genomes of five Gobiidae fish. Different colors indicate different genes and codons.
Ijms 25 03293 g007
Figure 8. The phylogenetic tree inferred the kinship of 26 species. (a) The phylogenetic relationship was constructed using 13 protein-coding genes from 26 species. Species from the same genus are represented by the same background colors. (b) Phylogenetic tree of 12 species using single-copy genes. The red lettering means the species in this study. The blue words indicate estimated divergence time of species (million years ago).
Ijms 25 03293 g008
Figure 9. Historical demographic dynamics of five Gobiidae fish.
Ijms 25 03293 g009
Table 1. Sampling details for five Gobiidae fish.
SpeciesRaw Base (Gb)Effective Rate (%)Error Rate (%)Q20 (%)Q30 (%)GC Content (%)
A. flavimanus52.4899.510.0496.3191.1841.04
A. stigmothonus54.5499.540.0496.7892.2240.80
F. gymnauchen53.7799.180.0596.8391.1940.05
C. microcephalus53.5596.870.0396.4391.4241.69
T. barbatus52.2298.520.0396.5891.6139.91
Table 2. Data statistics and analysis of K-mer for five Gobiidae species.
SpeciesK-mer NumberGenome Size (Mb)Heterozygous
Ratio (%)
Repeat Ratio (%)
A. flavimanus38,806,743,595978.960.2150.94
A. stigmothonus39,715,938,956998.270.2450.52
F. gymnauchen44,941,714,4261601.981.5659.83
C. microcephalus47,124,301,675812.880.6452.89
T. barbatus45,948,893,647808.550.5646.90
Table 3. Statistics on assembled genomes of five Gobiidae fish.
SpeciesAssembly LevelTotal Length (bp)Total NumberMax Length (bp)N50 Length (bp)N90 Length (bp)
A. flavimanusContig750,612,336766,61572,8303318382
Scaffold764,365,216612,51978,7984596542
A. stigmothonusContig801,994,264783,027142,6026066301
Scaffold817,012,736631,430230,93312,605508
F. gymnauchenContig1,538,128,2717,370,45775,2102120122
Scaffold1,558,061,1546,001,13590,3103120129
C. microcephalusContig789,064,4952,896,03322,9674431150
Scaffold782,790,7752,117,91024,1268719335
T. barbatusContig811,858,7181,790,89935,2672116245
Scaffold805,390,9511,216,19235,2672990307
Table 4. Statistics of microsatellite motifs for five Gobiidae fish.
A. flavimanusA. stigmothonusF. gymnauchenC. microcephalusT. barbatus
Total amount of sequences assessed612,519631,4306,510,5102,117,9101,216,192
Total size of assessed sequences (bp)764,365,216817,012,7361,653,145,701806,337,820817,882,156
Total identified SSRs340,592351,606362,191494,515349,412
Number of sequences containing SSRs163,241106,981337,951371,928226,596
Number of sequences with multiple SSRs72,80955,92621,99981,26672,335
Number of SSRs involved in compound synthesis57,55062,28915,21773,84641,068
Table 5. Sampling information of five species in Gobiidae fish.
GenusSpeciesSampling TimeSampling SiteSample Quantity ObtainedSample Quantity Used
AcanthogobiusAcanthogobius flavimanus26 November 2018Qingdao, Yellow Sea of China241
Acanthogobius stigmothonus2 September 2020Beihai, South China Sea181
FavonigobiusFavonigobius gymnauchen20 November 2019Qingdao, Yellow Sea of China11
CtenotrypauchenCtenotrypauchen microcephalus12 April 2022Rizhao, Yellow Sea of China121
TridentigerTridentiger barbatus20 November 2021Yantai, Bohai Sea of China201
Disclaimer/Publisher’s Note: The statements, opinions and data contained in all publications are solely those of the individual author(s) and contributor(s) and not of MDPI and/or the editor(s). MDPI and/or the editor(s) disclaim responsibility for any injury to people or property resulting from any ideas, methods, instructions or products referred to in the content.

