
Anti-Inflammatory Action of Resveratrol in the Central Nervous System in Relation to Glucose Concentration—An In Vitro Study on a Blood–Brain Barrier Model
 , and
, and 
Abstract
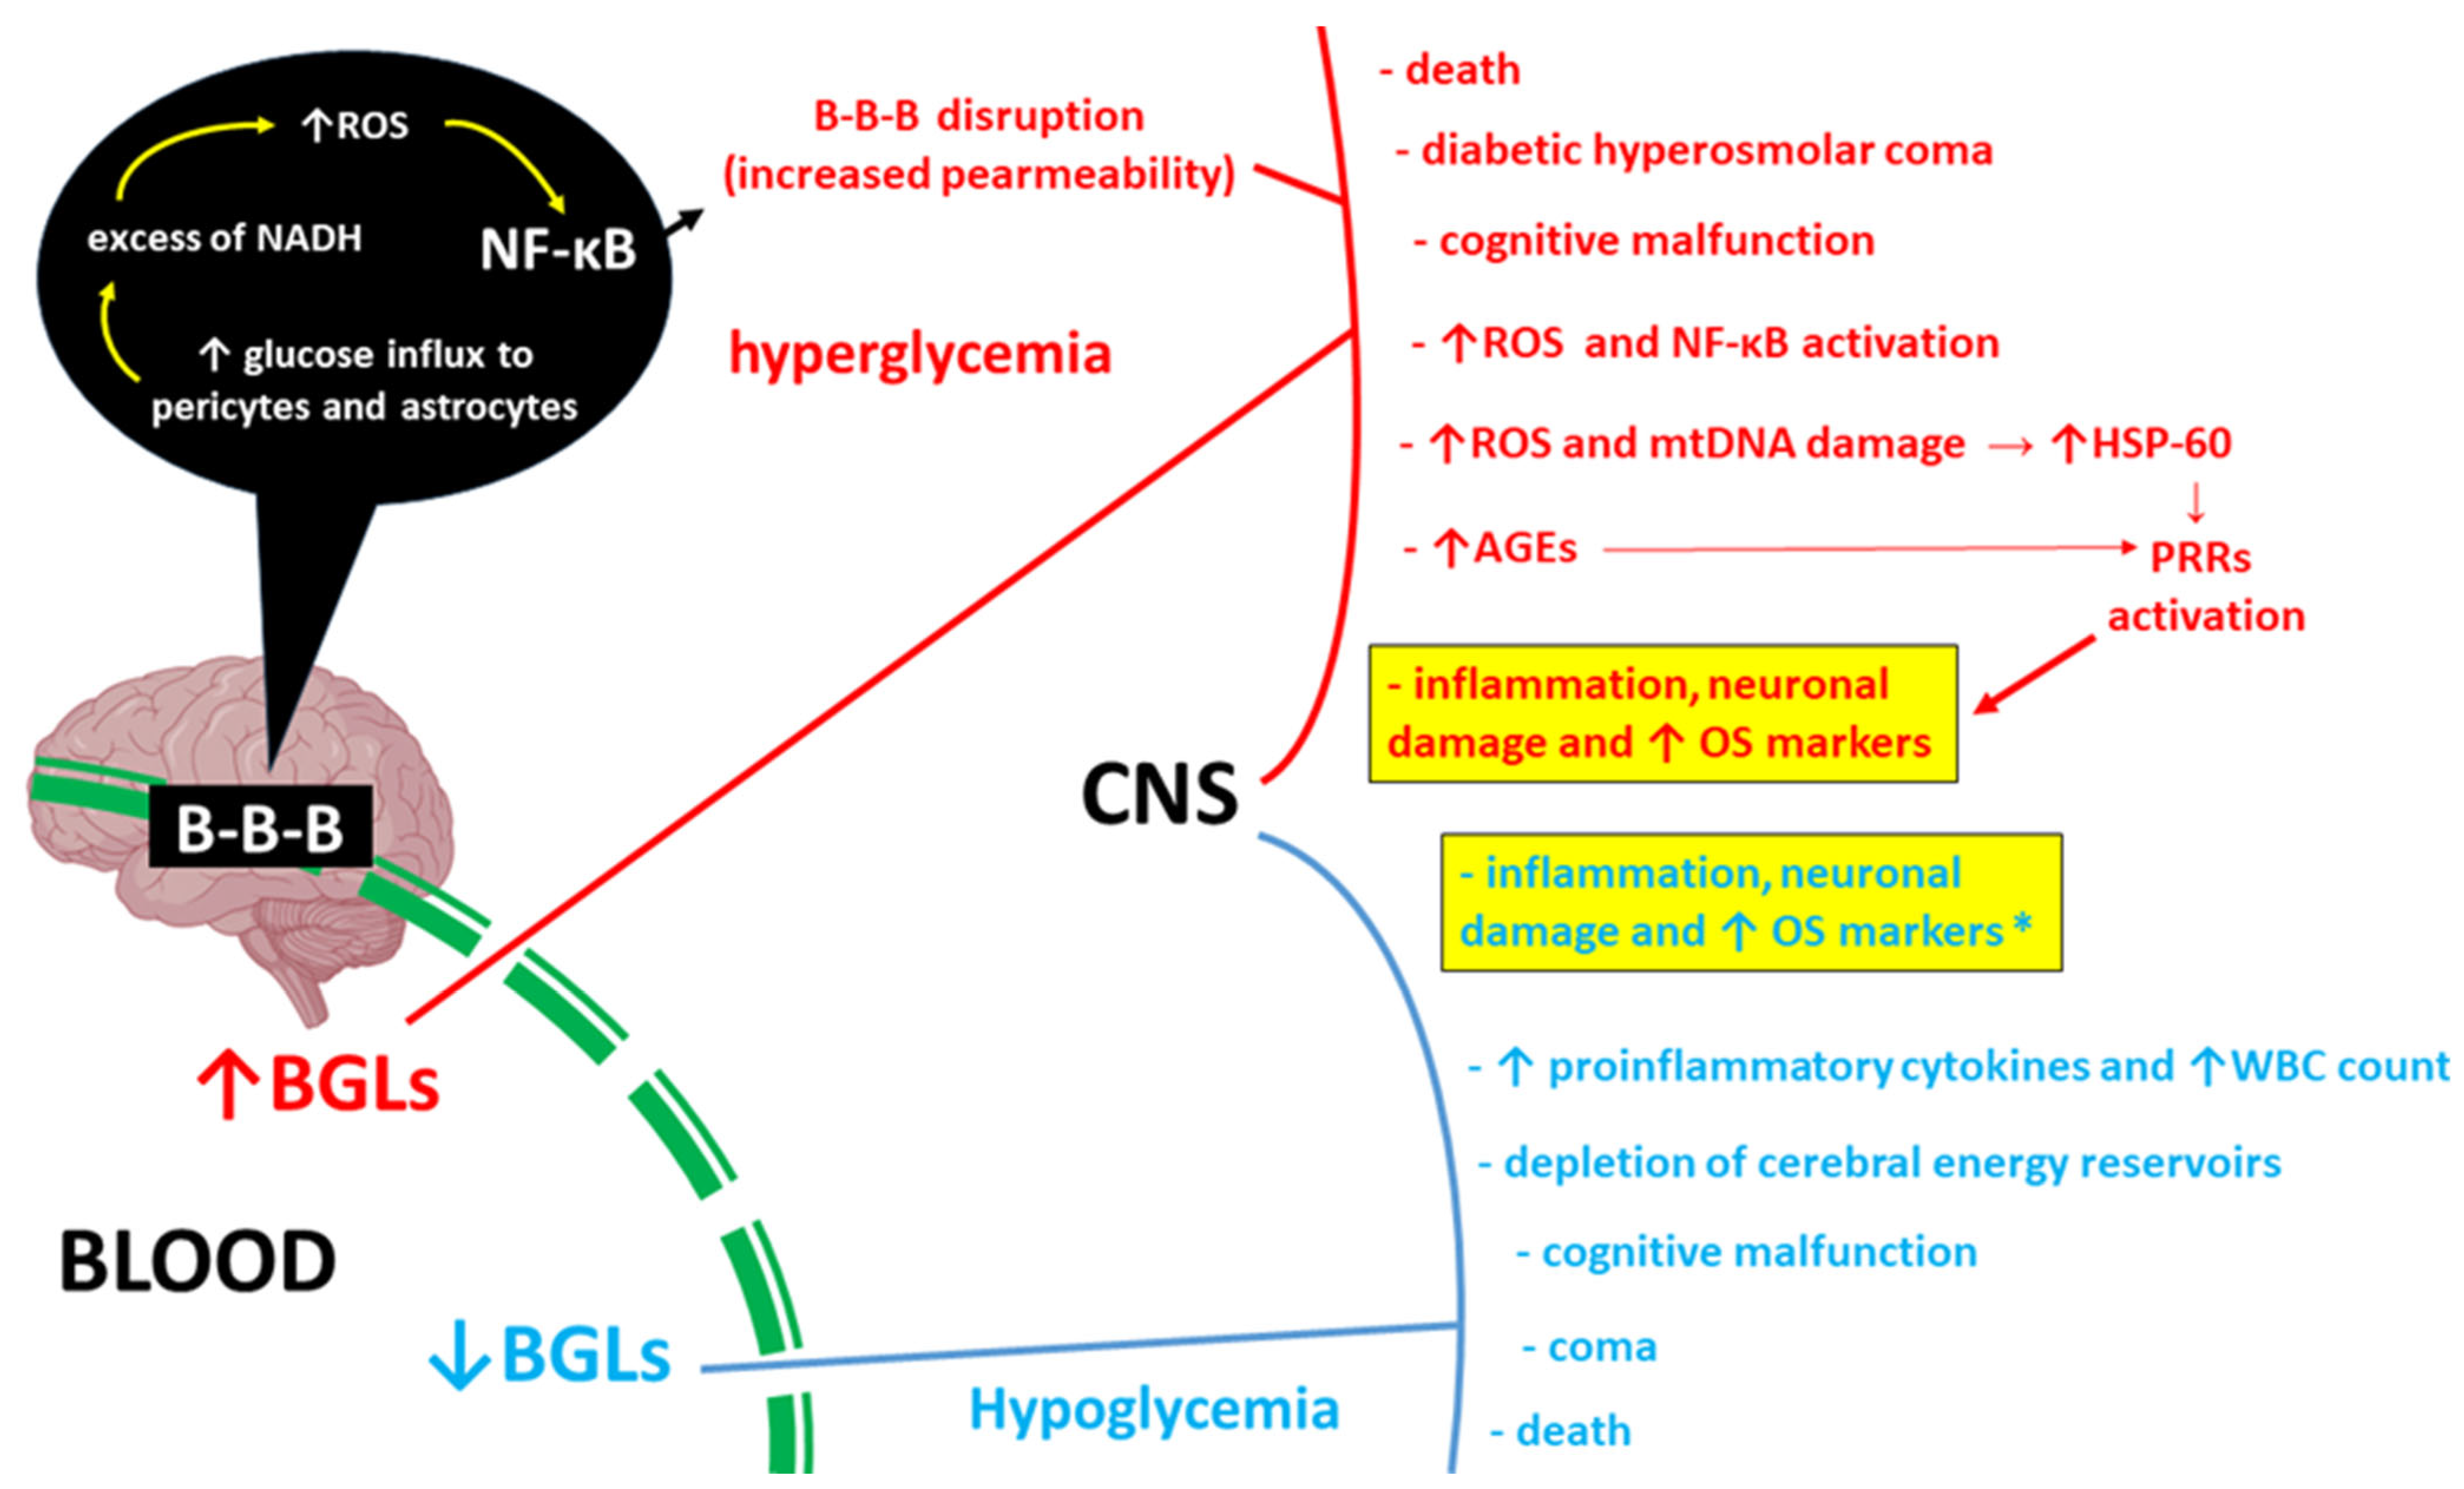
1. Introduction
2. Results
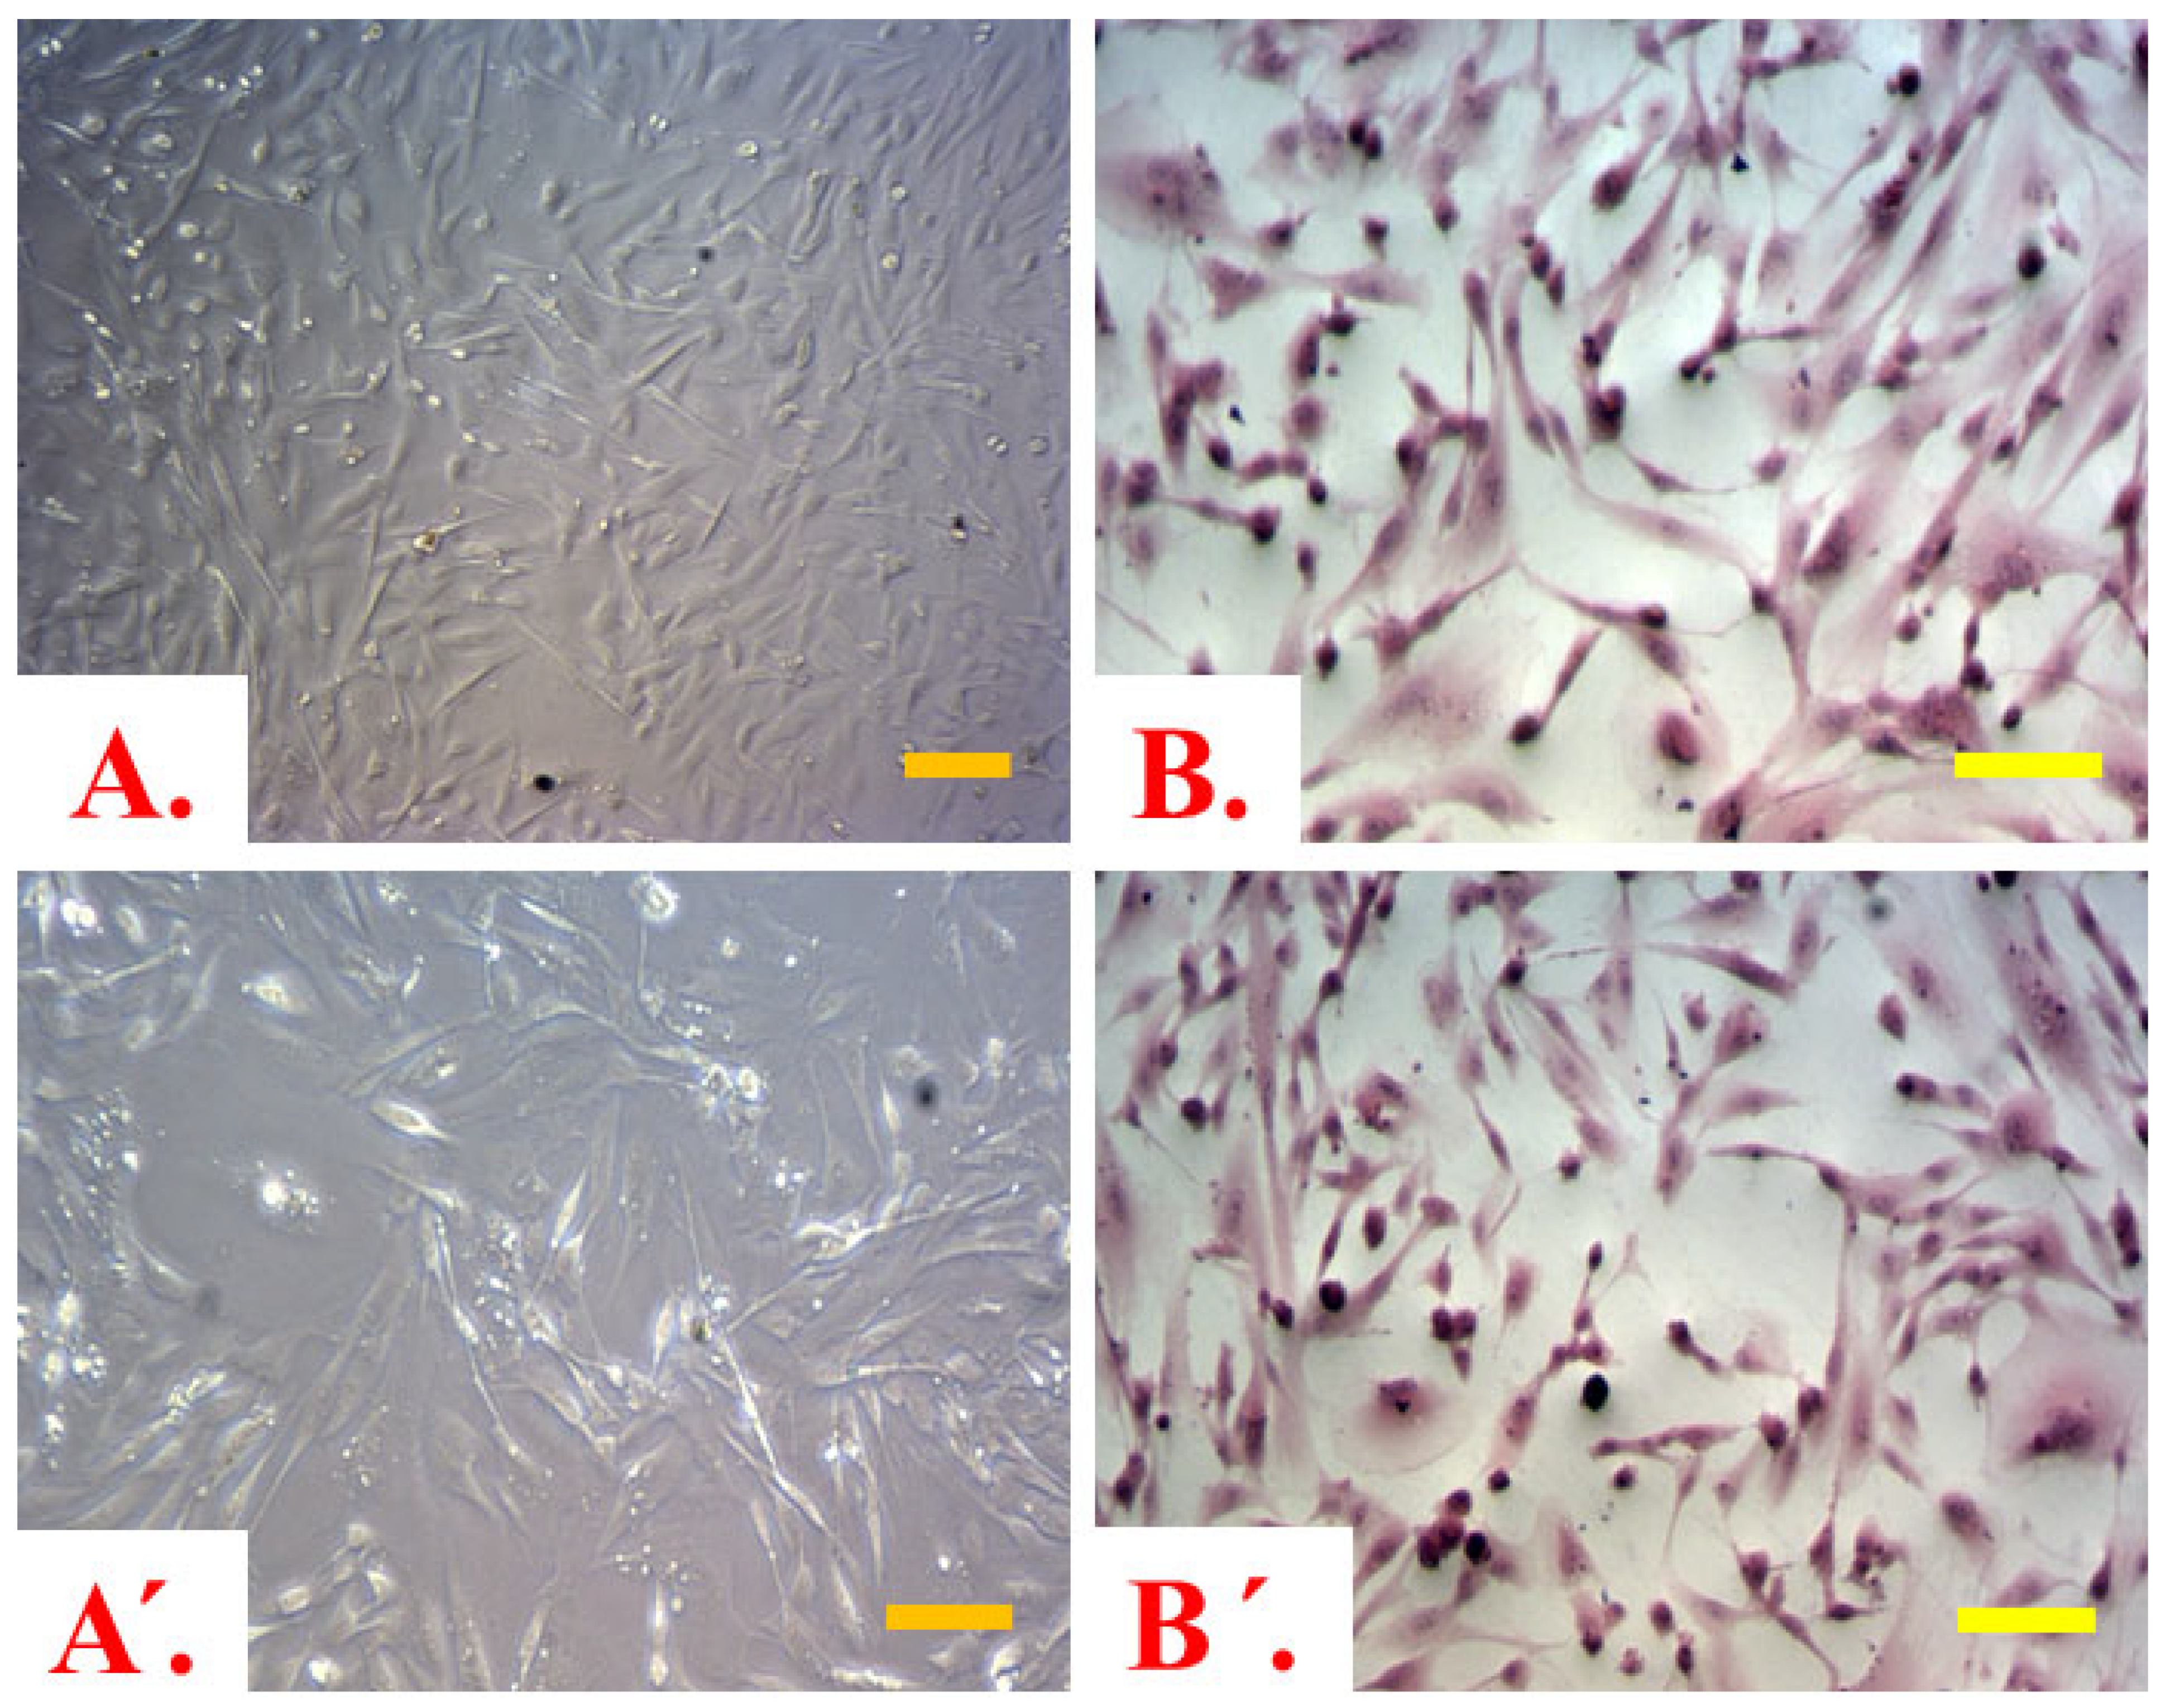
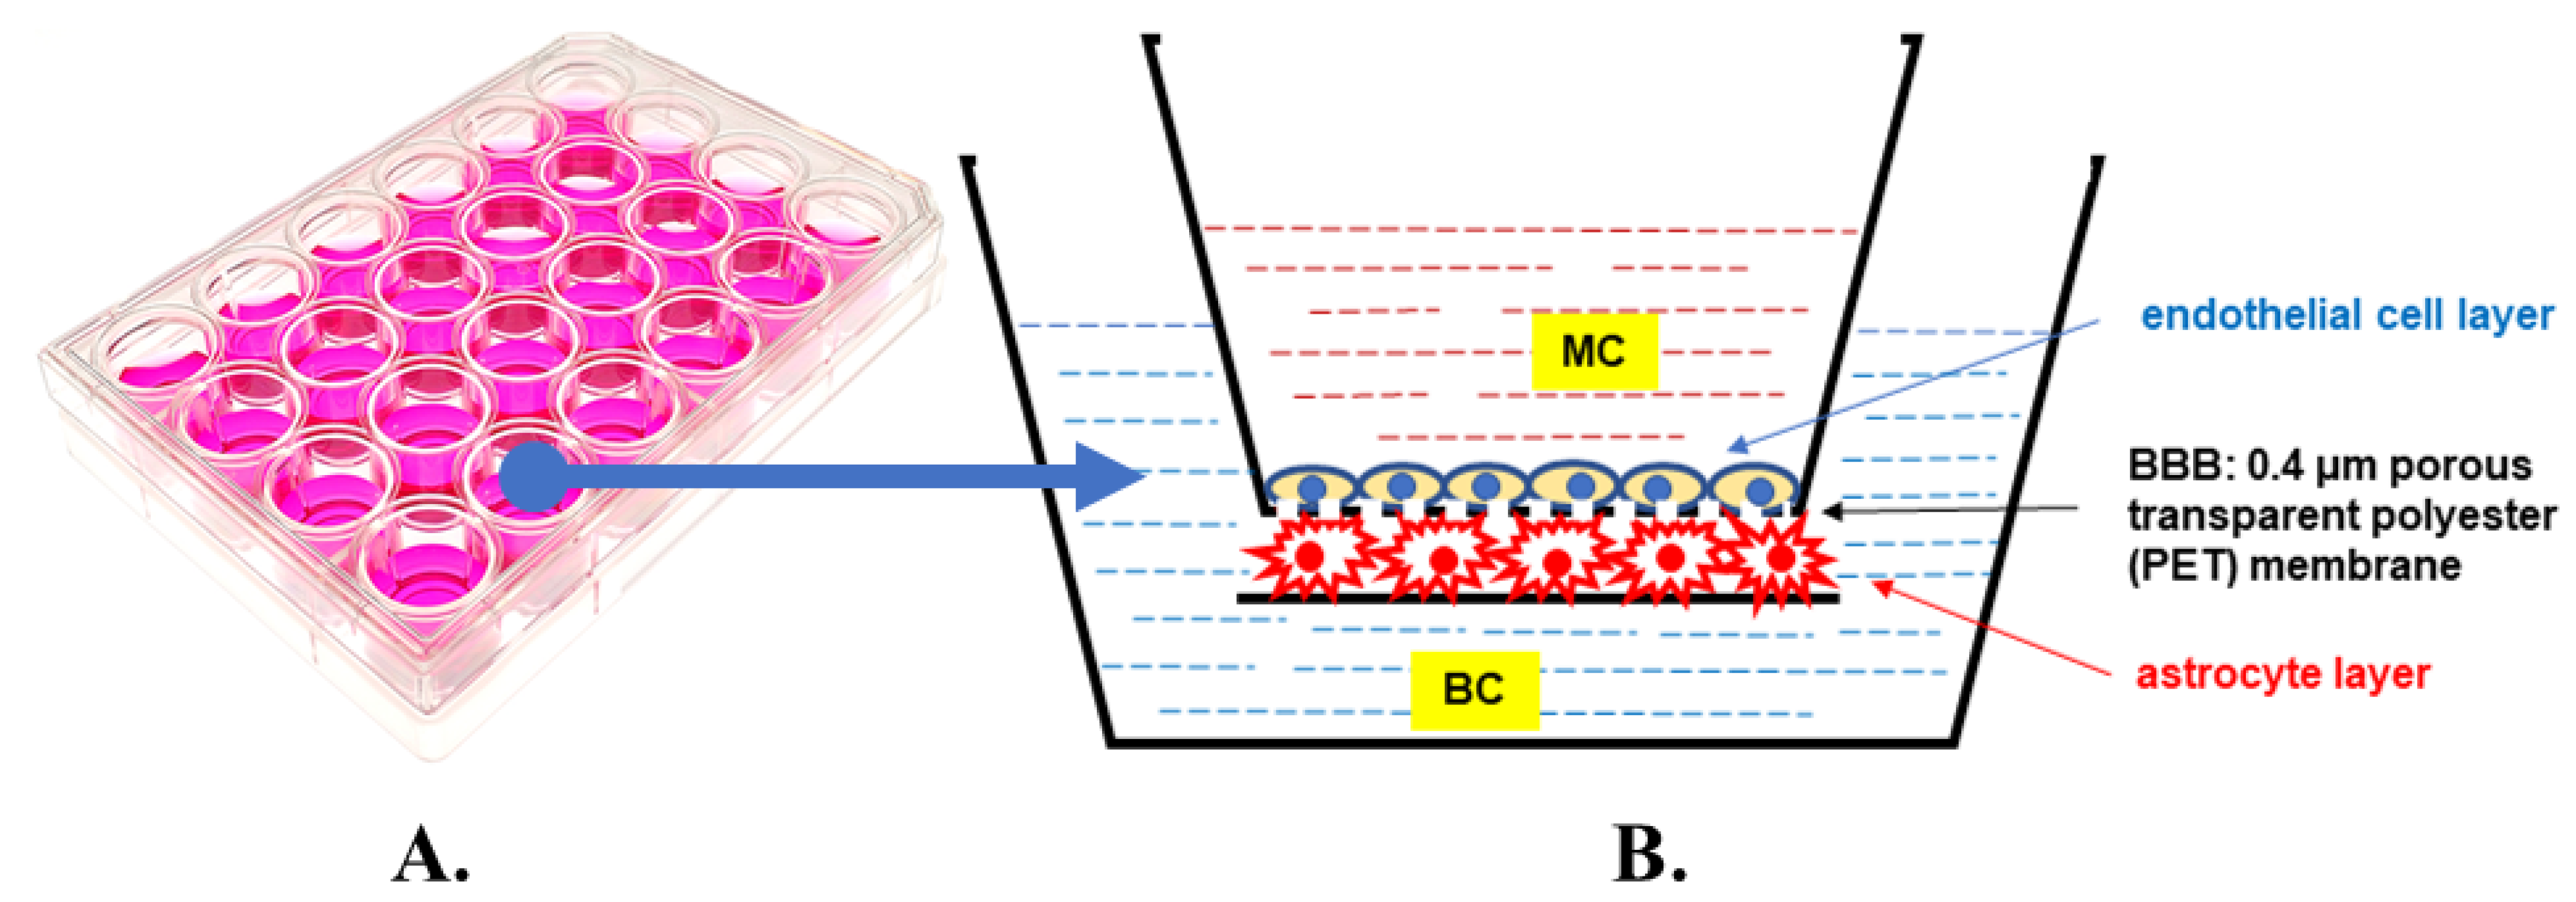
2.1. Co-Cultured Cells Viability and Morphology
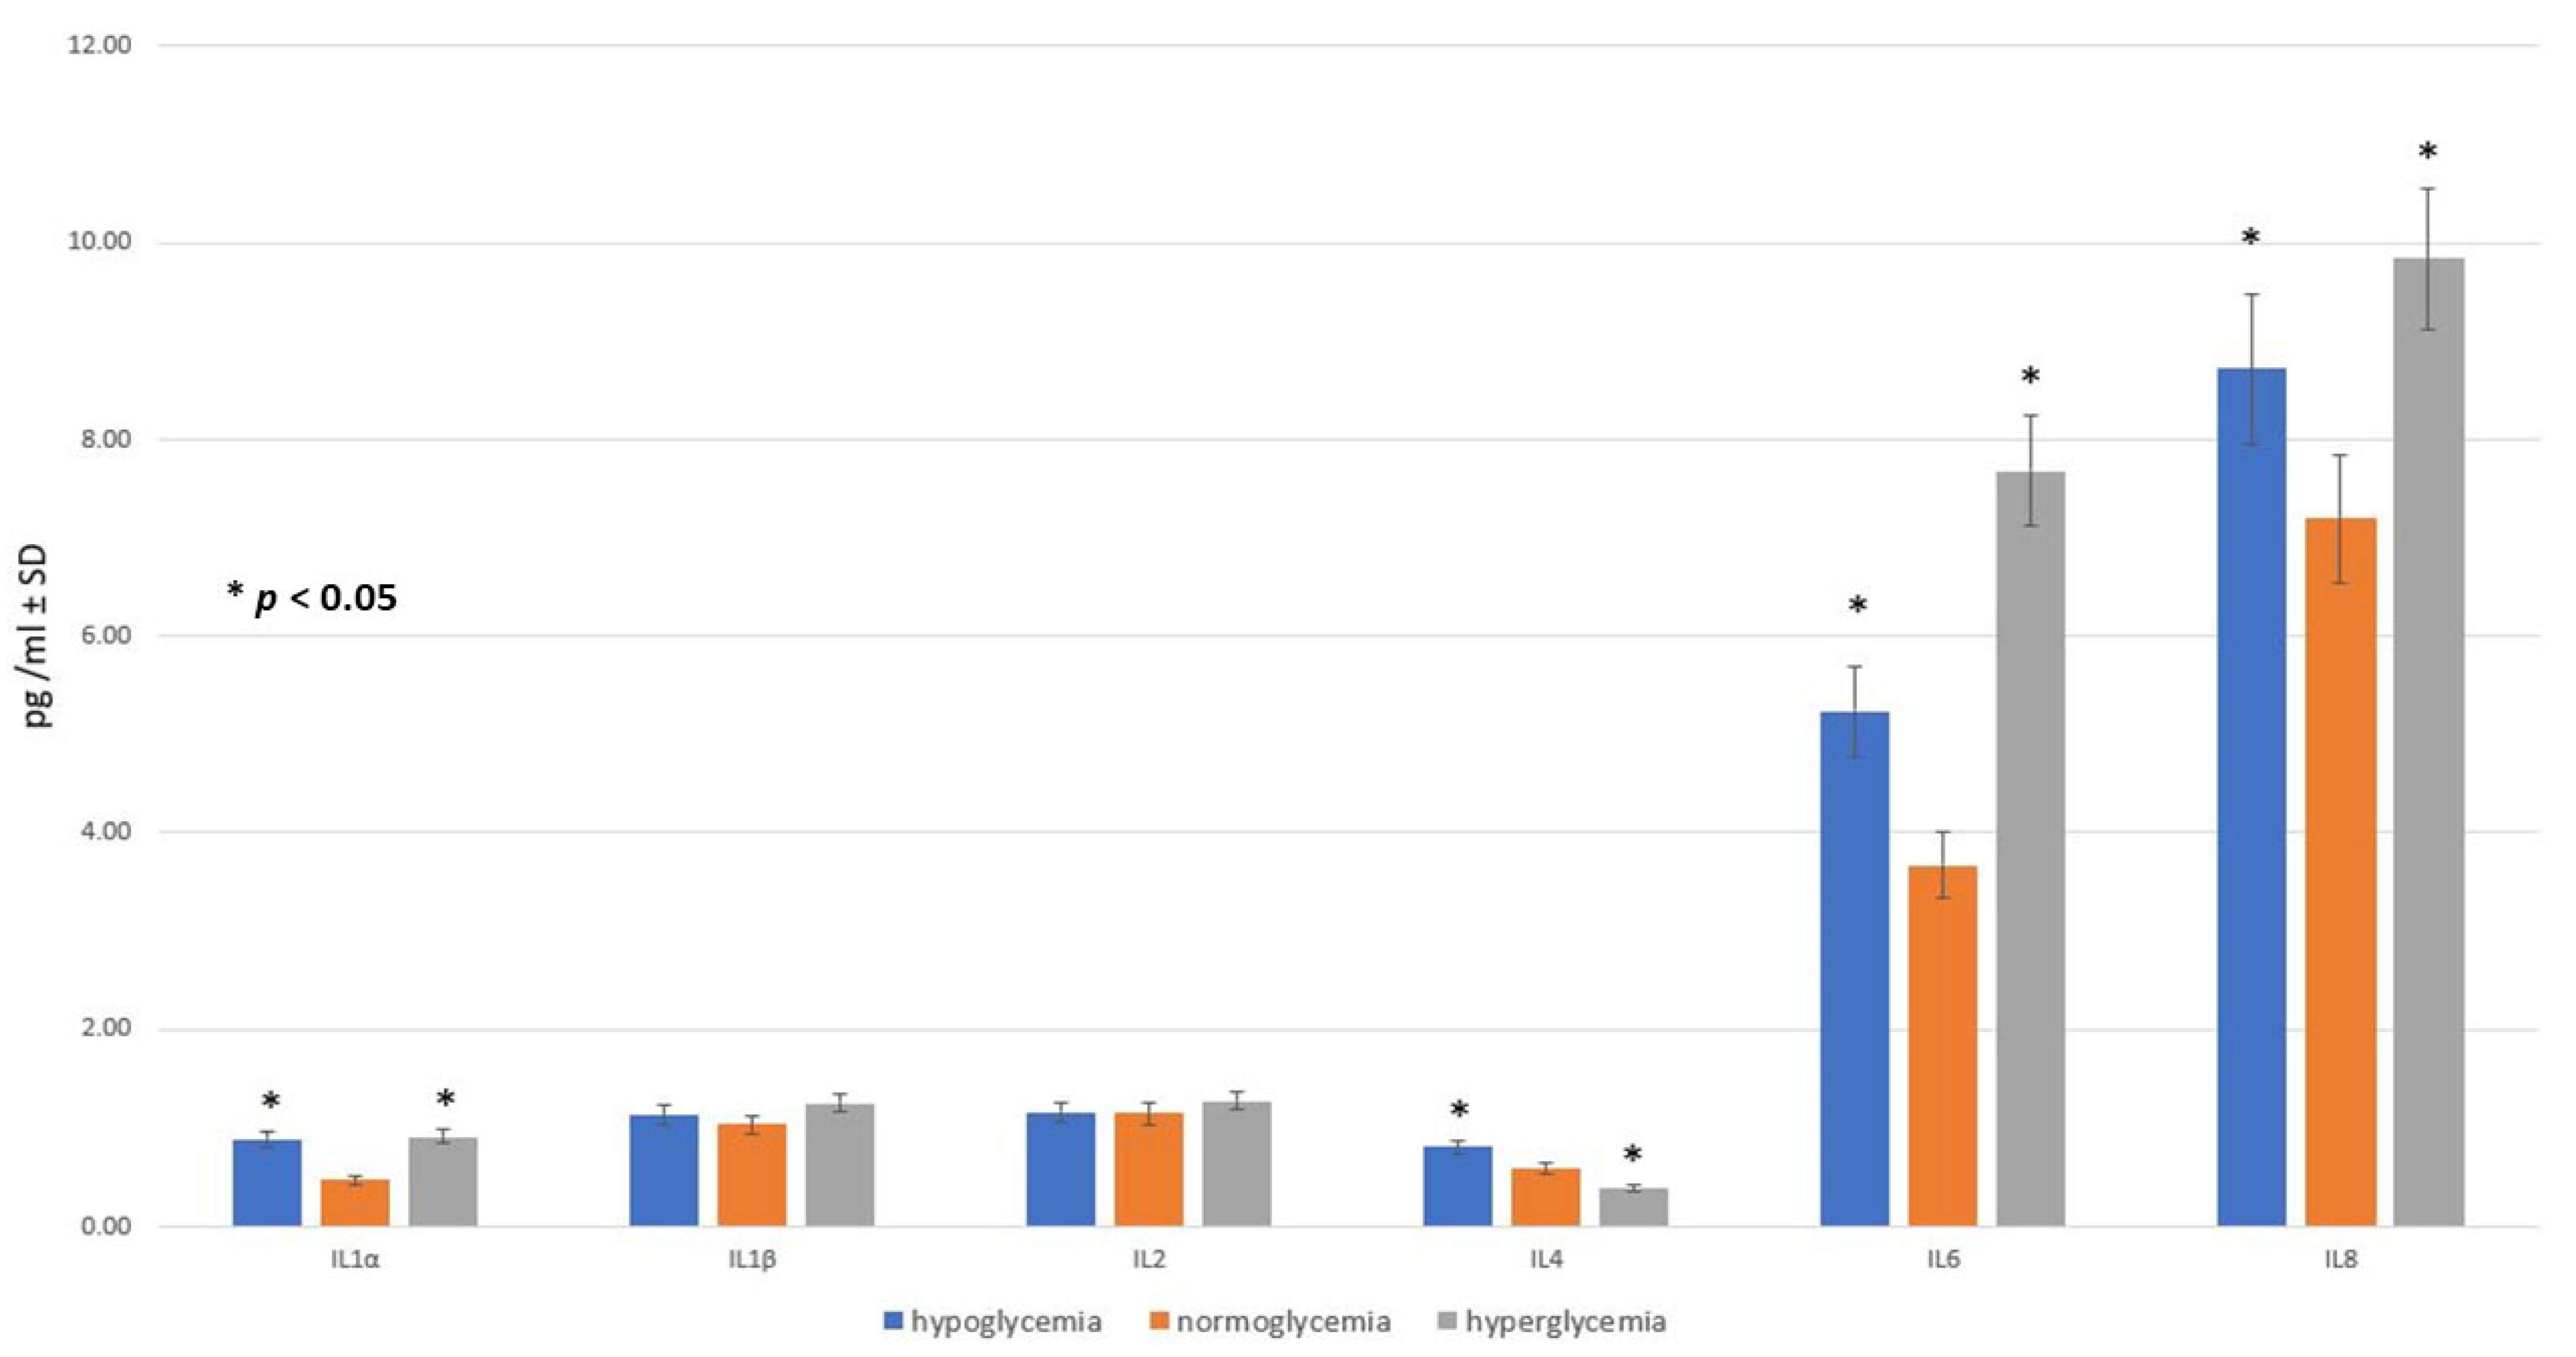
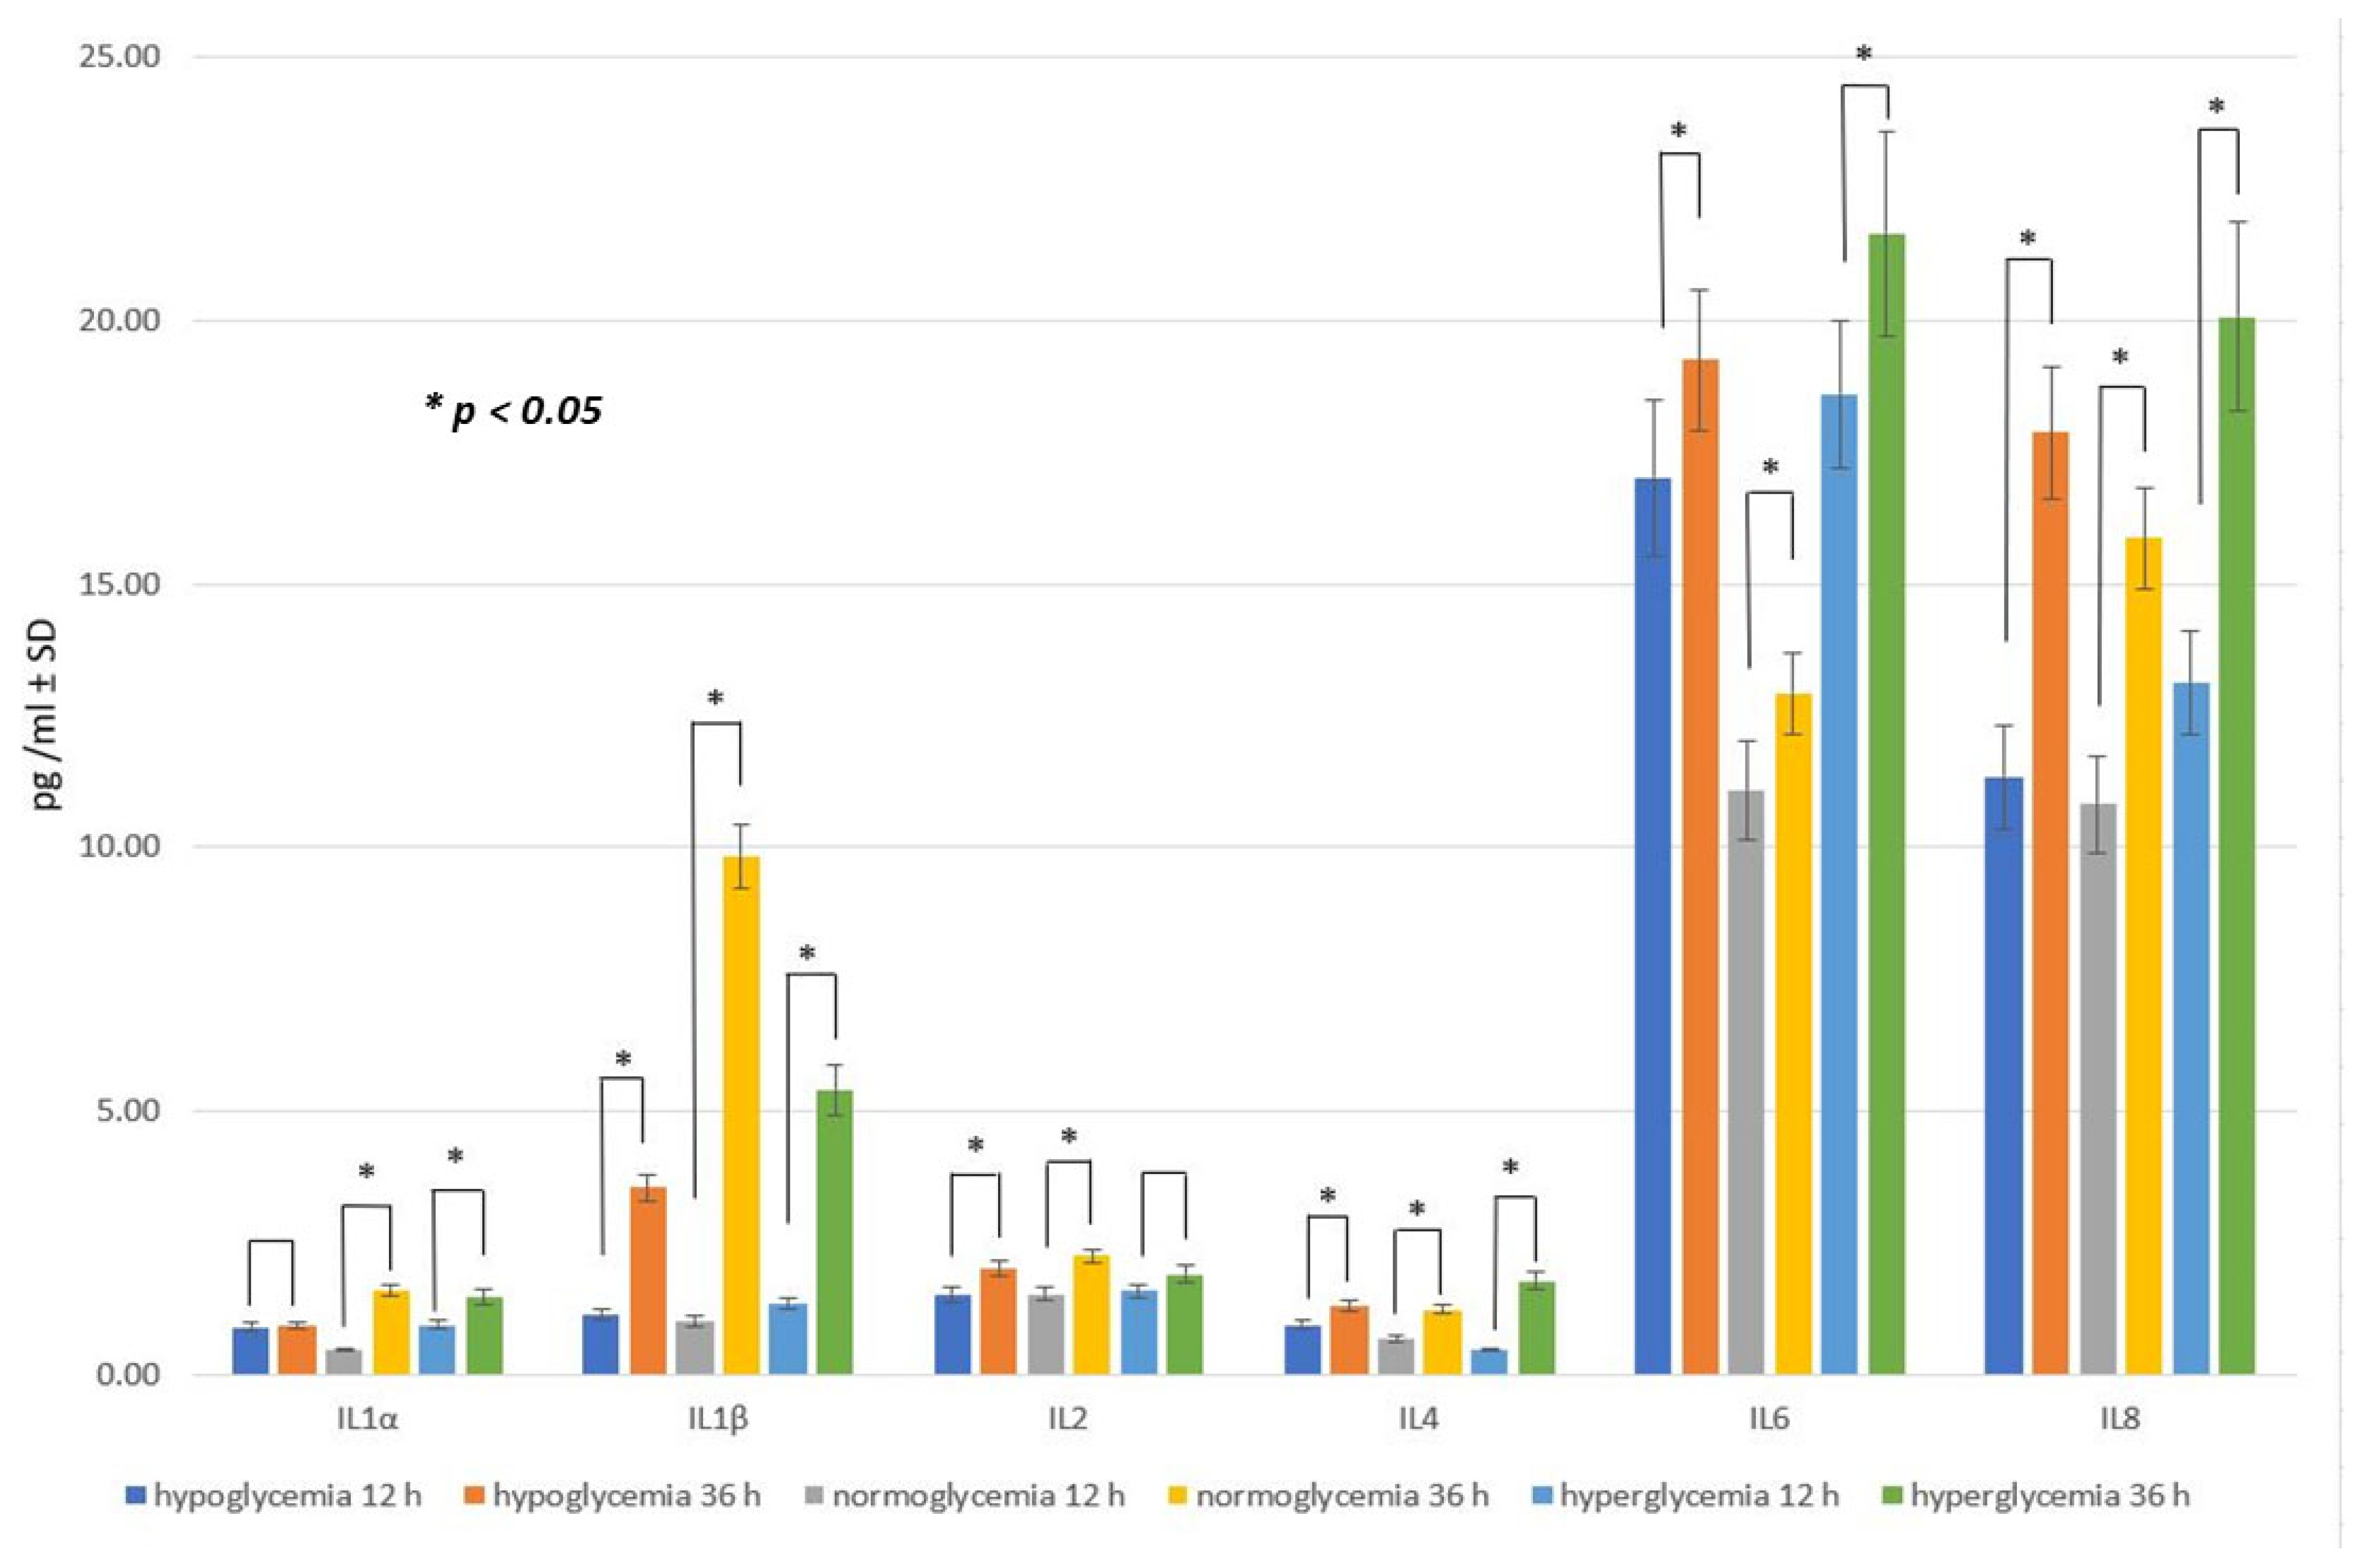
2.2. Effect of Glucose Concentration in MC on Inflammatory Response within BC
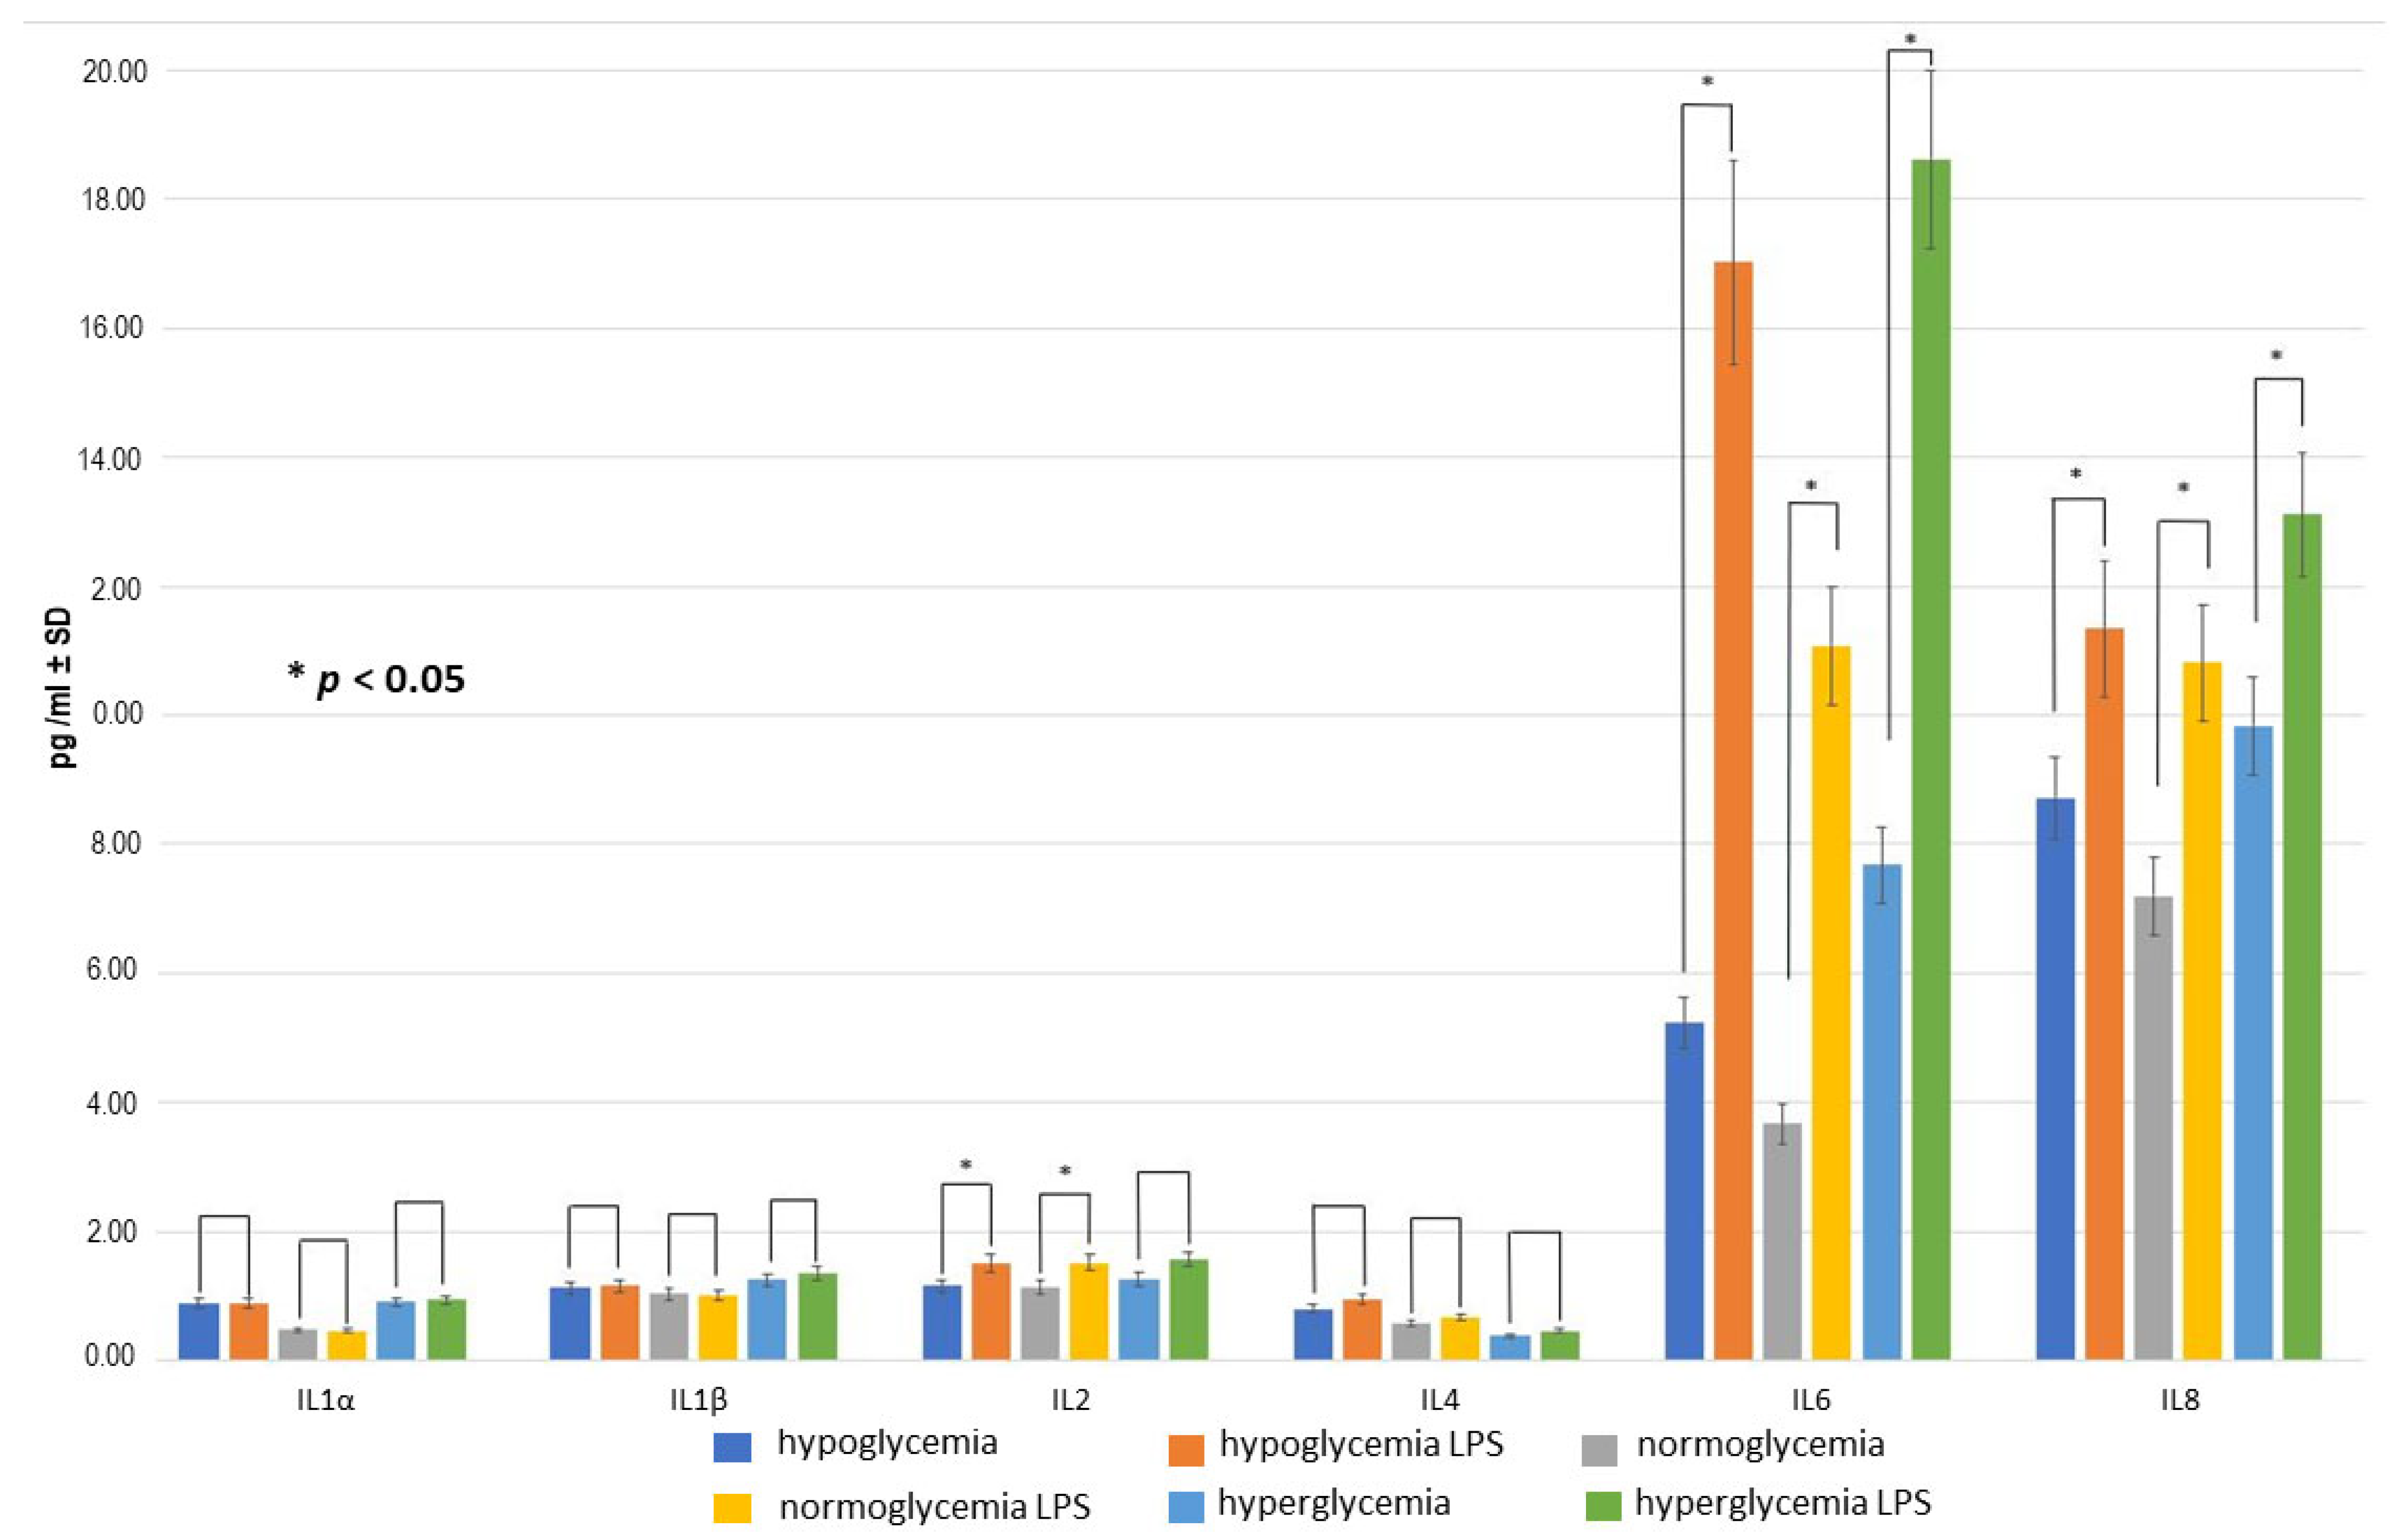
2.3. Effect of LPS Concentration on Inflammatory Response within BC
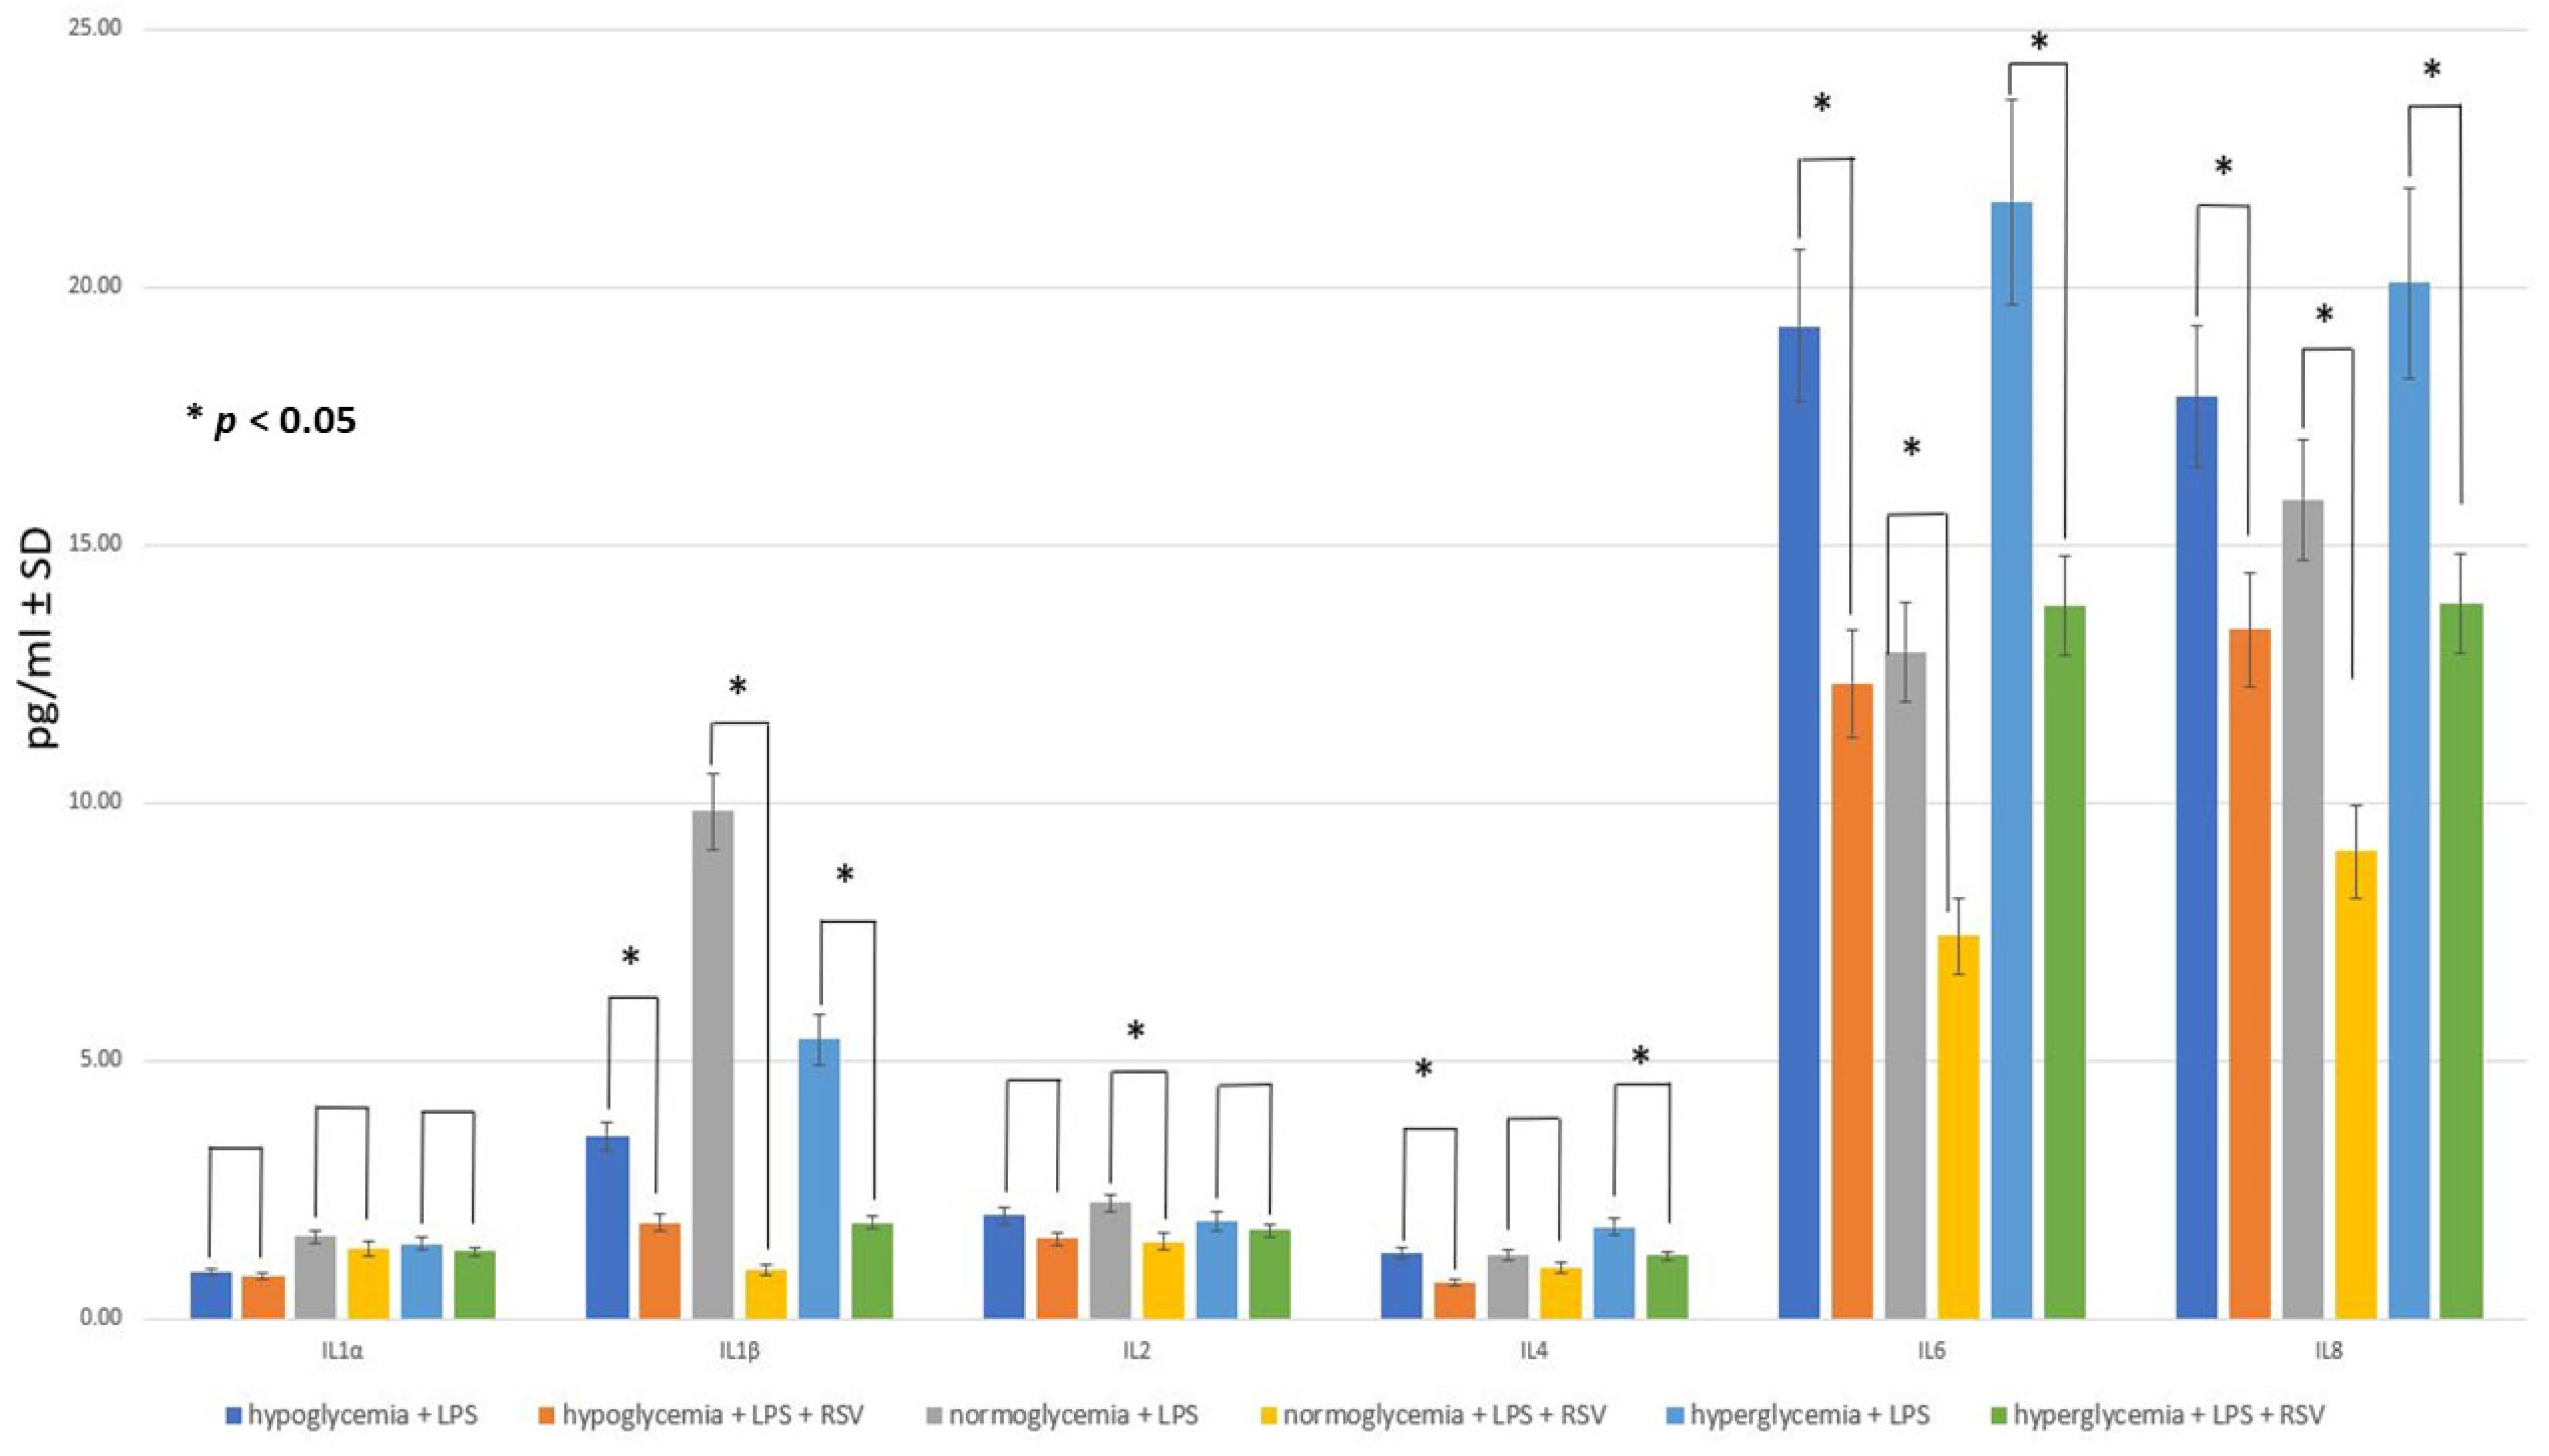
2.4. Effect of RSV Administration to MC on Inflammatory Response within BC
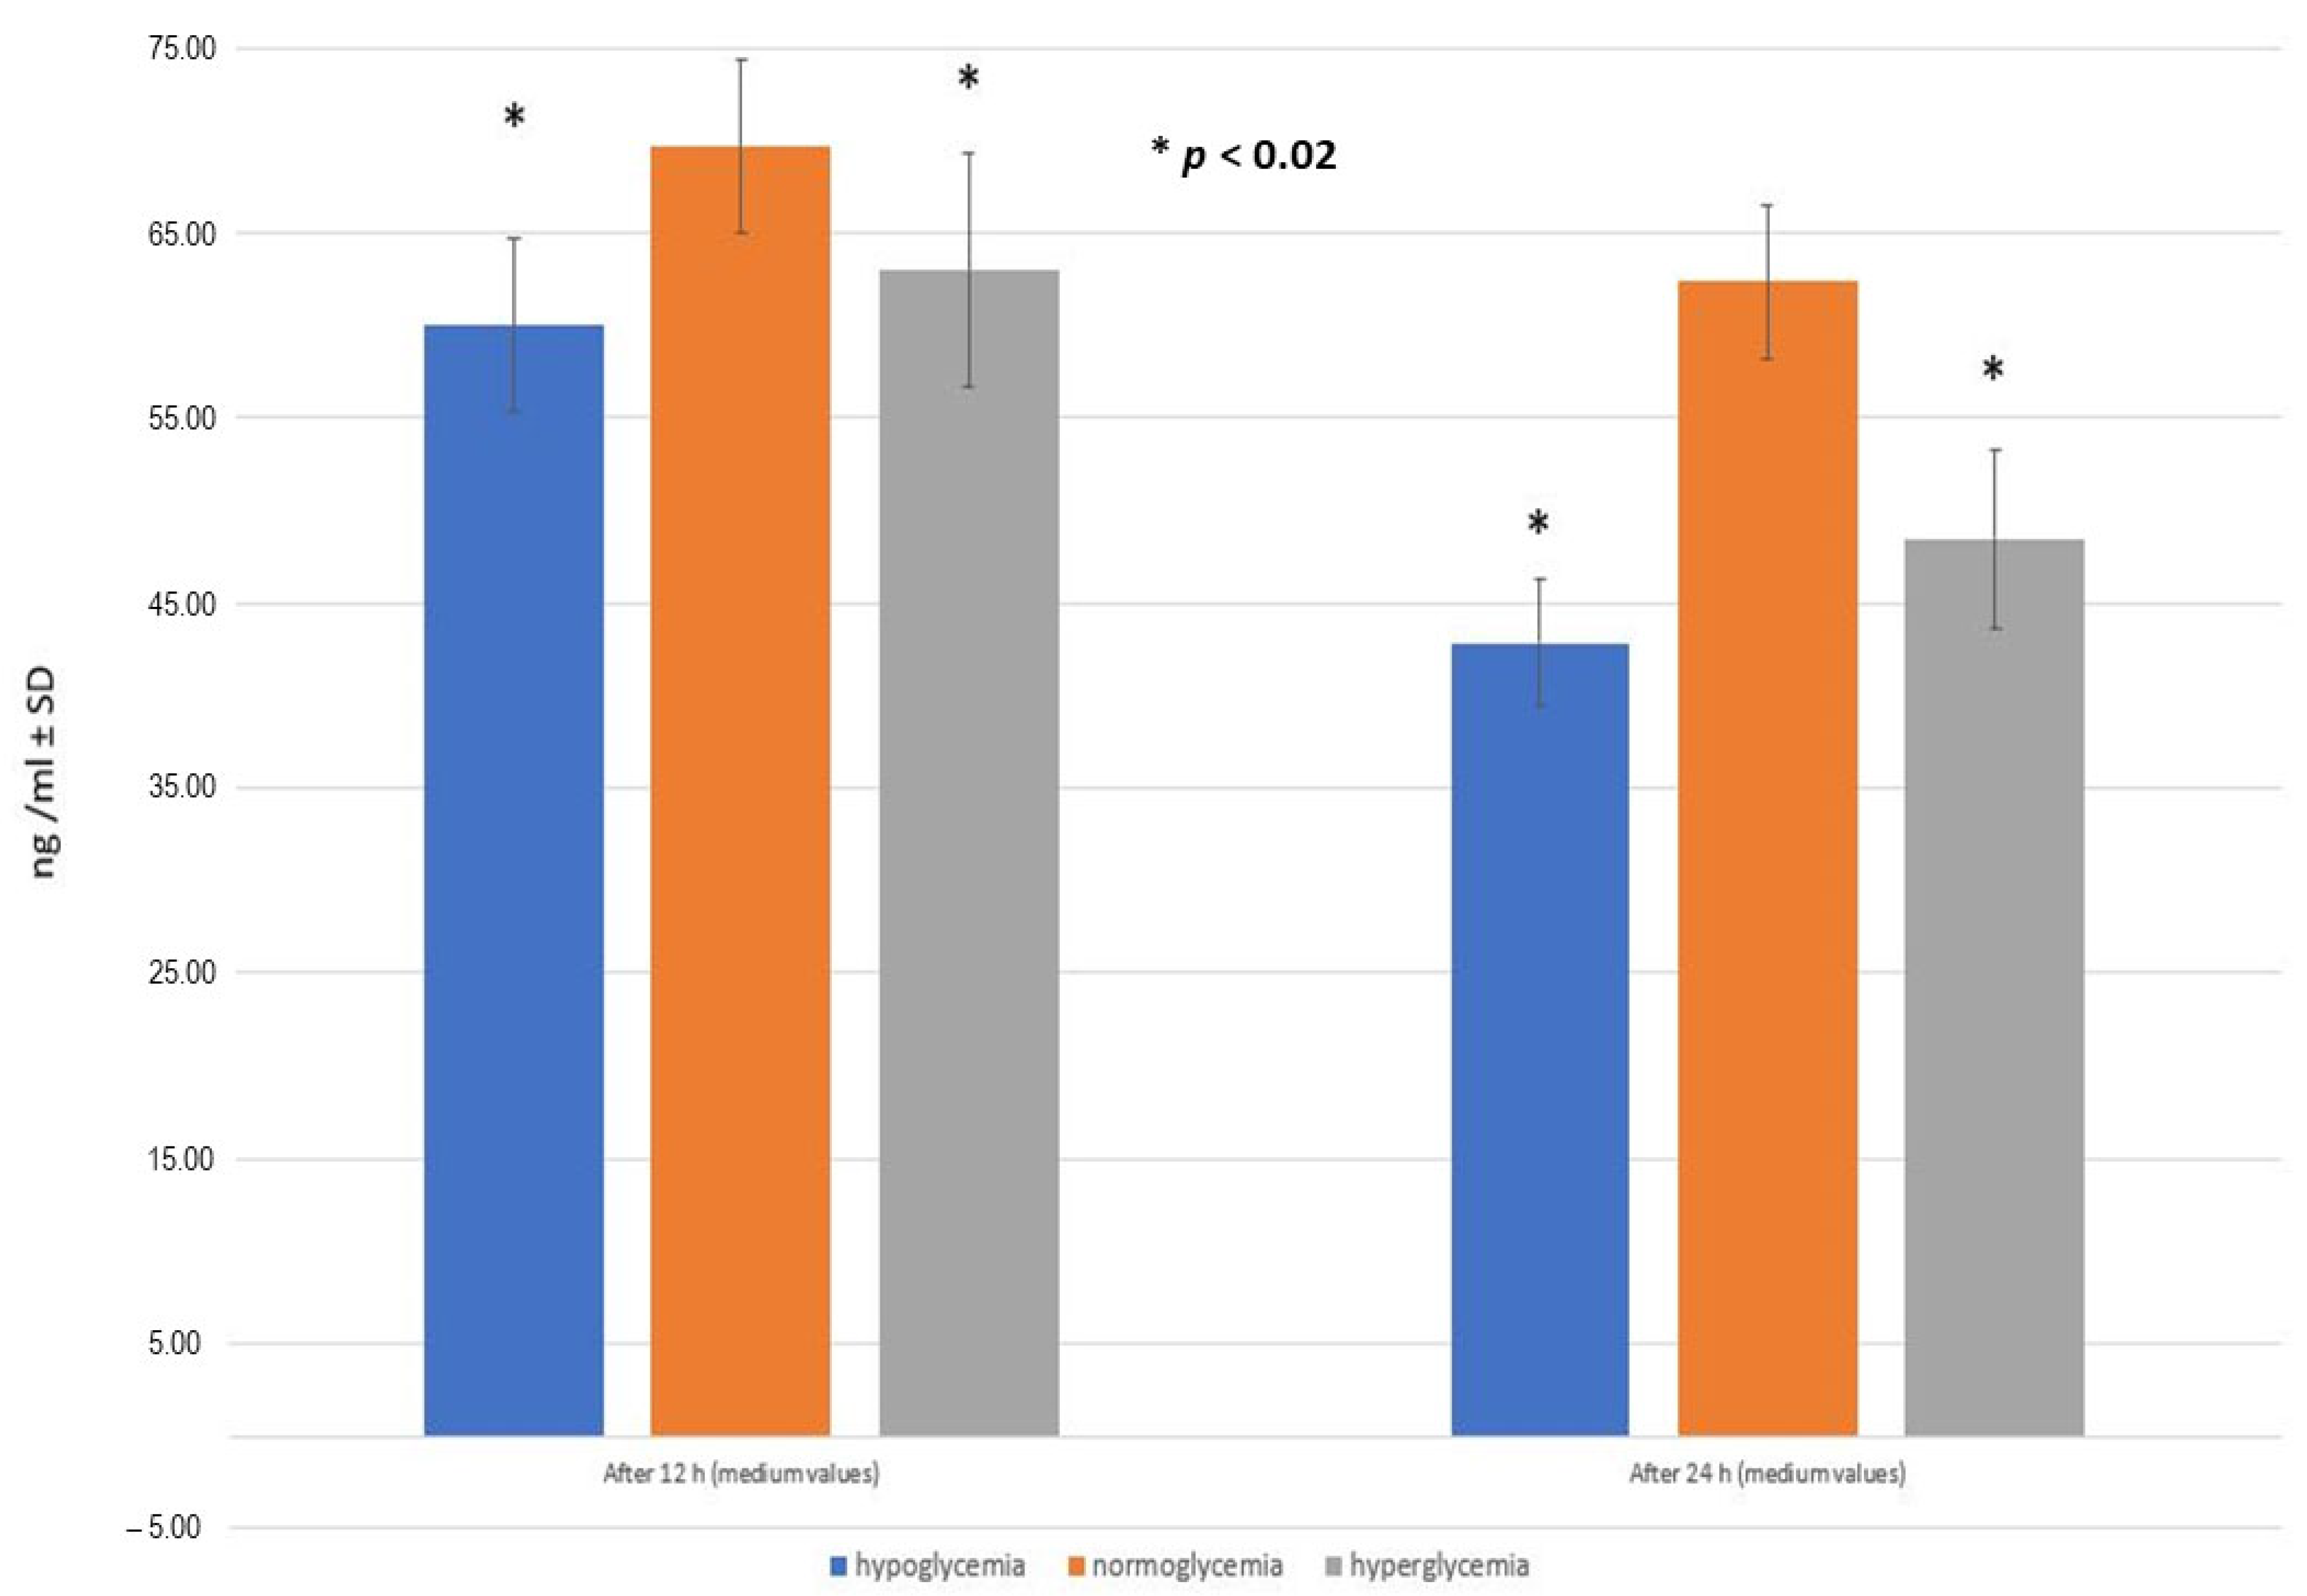
2.5. RSV Penetration through the BBB Model Applied
3. Discussion
4. Materials and Methods
5. Conclusions
Author Contributions
Funding
Institutional Review Board Statement
Informed Consent Statement
Data Availability Statement
Conflicts of Interest
Abbreviations
| AGEs | advanced end glycation products |
| ALP | alkaline phosphatase |
| AMPK | AMP-activated protein kinase |
| BBB | blood–brain barrier |
| BC | brain compartment |
| CNS | central nervous system |
| CSF | cerebrospinal fluid |
| ELISA | Enzyme-Linked Immunosorbent Assay |
| ERK1/2 | extracellular signal-regulated kinase ½ |
| ETC | electron transport chain |
| FBS | fetal bovine serum |
| GFAP | glial fibrillary acidic protein |
| GM-CSF | granulocyte-macrophage colony-stimulating factor |
| H&E | hematoxylin and eosin |
| IFN-γ | interferon gamma |
| IGT | impaired glucose tolerance |
| ILs | interleukins, including IL-1α, IL-1β, IL-2, IL-4, IL-6, IL-8, IL-10, IL-12, and IL-17A |
| LPS | lipopolysaccharide |
| MAPK | mitogen-activated protein kinases |
| MC | microvascular compartment |
| NAD | nicotinamide adenine dinucleotide |
| NAD+ | oxidized form of NAD |
| NAMPT (or NAmPRTase) | nicotinamide phosphoribosyl transferase |
| NF-κB | nuclear factor kappa-light-chain-enhancer of activated B cells |
| OD | optical density |
| P38-MAPK | mitogen-p38-activated protein kinases |
| PBS | phosphate-buffered saline |
| PET | polyester |
| PFA | paraformaldehyde |
| PGC-1α | peroxisome proliferator-activated receptor-gamma coactivator 1α |
| PI3K/Akt | phosphoinositide 3-kinase/protein kinase B |
| PRR | pattern recognizing receptor |
| PTS | protein transport system |
| ROS | reactive oxygen species |
| RSV | resveratrol |
| SIRT, SIRT1 | sirtuin, sirtuin 1 |
| T2D | type 2 diabetes |
| TEER | transendothelial electrical resistance |
| TNF-α | tumor necrosis factor alpha |
| γ-GTP | gamma-glutamyltranspeptidase |
References
- Mergenthaler, P.; Lindauer, U.; Dienel, G.A.; Meisel, A. Sugar for the brain: The role of glucose in physiological and pathological brain function. Trends Neurosci. 2013, 36, 587–597. [Google Scholar] [CrossRef]
- Rao, J.; Oz, G.; Seaquist, E.R. Regulation of cerebral glucose metabolism. Minerva Endocrinol. 2006, 31, 149–158. [Google Scholar]
- Wątroba, M.; Grabowska, A.D.; Szukiewicz, D. Effects of Diabetes Mellitus-Related Dysglycemia on the Functions of Blood-Brain Barrier and the Risk of Dementia. Int. J. Mol. Sci. 2023, 24, 10069. [Google Scholar] [CrossRef]
- Pajares, M.; IRojo, A.; Manda, G.; Boscá, L.; Cuadrado, A. Inflammation in Parkinson’s Disease: Mechanisms and Therapeutic Implications. Cells 2020, 9, 1687. [Google Scholar] [CrossRef] [PubMed]
- Heneka, M.T.; Carson, M.J.; El Khoury, J.; Landreth, G.E.; Brosseron, F.; Feinstein, D.L.; Jacobs, A.H.; Wyss-Coray, T.; Vitorica, J.; Ransohoff, R.M.; et al. Neuroinflammation in Alzheimer’s disease. Lancet Neurol. 2015, 14, 388–405. [Google Scholar] [CrossRef] [PubMed]
- Tohidpour, A.; Morgun, A.V.; Boitsova, E.B.; Malinovskaya, N.A.; Martynova, G.P.; Khilazheva, E.D.; Kopylevich, N.V.; Gertsog, G.E.; Salmina, A.B. Neuroinflammation and Infection: Molecular Mechanisms Associated with Dysfunction of Neurovascular Unit. Front. Cell. Infect. Microbiol. 2017, 7, 276. [Google Scholar] [CrossRef] [PubMed]
- Pirau, L.; Lui, F. Neurosarcoidosis. In StatPearls; StatPearls Publishing: Treasure Island, FL, USA, 2021. [Google Scholar]
- Tsalamandris, S.; Antonopoulos, A.S.; Oikonomou, E.; Papamikroulis, G.A.; Vogiatzi, G.; Papaioannou, S.; Deftereos, S.; Tousoulis, D. The Role of Inflammation in Diabetes: Current Concepts and Future Perspectives. Eur. Cardiol. 2019, 14, 50–59. [Google Scholar] [CrossRef] [PubMed]
- Rom, S.; Zuluaga-Ramirez, V.; Gajghate, S.; Seliga, A.; Winfield, M.; Heldt, N.A.; Kolpakov, M.A.; Bashkirova, Y.V.; Sabri, A.K.; Persidsky, Y. Hyperglycemia-Driven Neuroinflammation Compromises BBB Leading to Memory Loss in Both Diabetes Mellitus (DM) Type 1 and Type 2 Mouse Models. Mol. Neurobiol. 2019, 56, 1883–1896. [Google Scholar] [CrossRef] [PubMed]
- Ratter, J.M.; Rooijackers, H.M.; Tack, C.J.; Hijmans, A.G.; Netea, M.G.; de Galan, B.E.; Stienstra, R. Proinflammatory Effects of Hypoglycemia in Humans With or Without Diabetes. Diabetes 2017, 66, 1052–1061. [Google Scholar] [CrossRef] [PubMed]
- Auge, I. Intracellular events in diabetes mellitus—Behind the scenes. Acta Physiol. 2020, 229, e13468. [Google Scholar] [CrossRef] [PubMed]
- Yan, L.J. Pathogenesis of chronic hyperglycemia: From reductive stress to oxidative stress. J. Diabetes Res. 2014, 2014, 137919. [Google Scholar] [CrossRef]
- González, P.; Lozano, P.; Ros, G.; Solano, F. Hyperglycemia and Oxidative Stress: An Integral, Updated and Critical Overview of Their Metabolic Interconnections. Int. J. Mol. Sci. 2023, 24, 9352. [Google Scholar] [CrossRef]
- Ahmad, W.; Ijaz, B.; Shabbiri, K.; Ahmed, F.; Rehman, S. Oxidative toxicity in diabetes and Alzheimer’s disease: Mechanisms behind ROS/RNS generation. J. Biomed. Sci. 2017, 24, 76. [Google Scholar] [CrossRef] [PubMed]
- Xiao, W.; Wang, R.S.; Handy, D.E.; Loscalzo, J. NAD(H) and NADP(H) Redox Couples and Cellular Energy Metabolism. Antioxid. Redox Signal. 2018, 28, 251–272. [Google Scholar] [CrossRef] [PubMed]
- Raza, H.; John, A.; Howarth, F.C. Increased oxidative stress and mitochondrial dysfunction in zucker diabetic rat liver and brain. Cell. Physiol. Biochem. 2015, 35, 1241–1251. [Google Scholar] [CrossRef] [PubMed]
- Ceriello, A.; Motz, E. Is oxidative stress the pathogenic mechanism underlying insulin resistance, diabetes, and cardiovascular disease? The common soil hypothesis revisited. Arterioscler. Thromb. Vasc. Biol. 2004, 24, 816–823. [Google Scholar] [CrossRef] [PubMed]
- Lingappan, K. NF-κB in Oxidative Stress. Curr. Opin. Toxicol. 2018, 7, 81–86. [Google Scholar] [CrossRef]
- Zhu, G.; Wang, X.; Chen, L.; Lenahan, C.; Fu, Z.; Fang, Y.; Yu, W. Crosstalk Between the Oxidative Stress and Glia Cells After Stroke: From Mechanism to Therapies. Front. Immunol. 2022, 13, 852416. [Google Scholar] [CrossRef] [PubMed]
- Banks, W.A. The Blood-Brain Barrier Interface in Diabetes Mellitus: Dysfunctions, Mechanisms and Approaches to Treatment. Curr. Pharm. Des. 2020, 26, 1438–1447. [Google Scholar] [CrossRef]
- Maciejczyk, M.; Żebrowska, E.; Chabowski, A. Insulin Resistance and Oxidative Stress in the Brain: What’s New? Int. J. Mol. Sci. 2019, 20, 874. [Google Scholar] [CrossRef]
- Bahr, T.; Katuri, J.; Liang, T.; Bai, Y. Mitochondrial chaperones in human health and disease. Free Radic. Biol. Med. 2022, 179, 363–374. [Google Scholar] [CrossRef] [PubMed]
- Helms, H.C.; Abbott, N.J.; Burek, M.; Cecchelli, R.; Couraud, P.O.; Deli, M.A.; Förster, C.; Galla, H.J.; Romero, I.A.; Shusta, E.V.; et al. In vitro models of the blood-brain barrier: An overview of commonly used brain endothelial cell culture models and guidelines for their use. J. Cereb. Blood Flow Metab. 2016, 36, 862–890. [Google Scholar] [CrossRef] [PubMed]
- Briceno Noriega, D.; Zenker, H.E.; Croes, C.A.; Ewaz, A.; Ruinemans-Koerts, J.; Savelkoul, H.F.J.; van Neerven, R.J.J.; Teodorowicz, M. Receptor Mediated Effects of Advanced Glycation End Products (AGEs) on Innate and Adaptative Immunity: Relevance for Food Allergy. Nutrients 2022, 14, 371. [Google Scholar] [CrossRef] [PubMed]
- Cryer, P.E. Hypoglycemia, functional brain failure, and brain death. J. Clin. Investig. 2007, 117, 868–870. [Google Scholar] [CrossRef]
- Rehni, A.K.; Dave, K.R. Impact of Hypoglycemia on Brain Metabolism During Diabetes. Mol Neurobiol. 2018, 55, 9075–9088. [Google Scholar] [CrossRef]
- Kalra, S.; Mukherjee, J.J.; Venkataraman, S.; Bantwal, G.; Shaikh, S.; Saboo, B.; Das, A.K.; Ramachandran, A. Hypoglycemia: The ne-glected complication. Indian J. Endocrinol. Metab. 2013, 17, 819–834. [Google Scholar] [CrossRef]
- Razavi Nematollahi, L.; Kitabchi, A.E.; Stentz, F.B.; Wan, J.Y.; Larijani, B.A.; Tehrani, M.M.; Gozashti, M.H.; Omidfar, K.; Taheri, E. Proinflammatory cytokines in response to insulin-induced hypoglycemic stress in healthy subjects. Metabolism 2009, 58, 443–448, Erratum in Metabolism 2009, 58, 1046. [Google Scholar] [CrossRef]
- Joy, N.G.; Tate, D.B.; Younk, L.M.; Davis, S.N. Effects of Acute and Antecedent Hypoglycemia on Endothelial Function and Markers of Atherothrombotic Balance in Healthy Humans. Diabetes 2015, 64, 2571–2580. [Google Scholar] [CrossRef]
- Kahal, H.; Halama, A.; Aburima, A.; Bhagwat, A.M.; Butler, A.E.; Graumann, J.; Suhre, K.; Sathyapalan, T.; Atkin, S.L. Effect of induced hypoglycemia on inflammation and oxidative stress in type 2 diabetes and control subjects. Sci. Rep. 2020, 10, 4750, Erratum in Sci. Rep. 2020, 10, 10233. [Google Scholar] [CrossRef]
- Zgutka, K.; Tkacz, M.; Tomasiak, P.; Tarnowski, M. A Role for Advanced Glycation End Products in Molecular Ageing. Int. J. Mol. Sci. 2023, 24, 9881. [Google Scholar] [CrossRef] [PubMed]
- Segura-Collar, B.; Mata-Martínez, P.; Hernández-Laín, A.; Sánchez-Gómez, P.; Gargini, R. Blood-Brain Barrier Disruption: A Common Driver of Central Nervous System Diseases. Neuroscientist 2022, 28, 222–237. [Google Scholar] [CrossRef] [PubMed]
- Farhan, M.; Rizvi, A. The Pharmacological Properties of Red Grape Polyphenol Resveratrol: Clinical Trials and Obstacles in Drug Development. Nutrients 2023, 15, 4486. [Google Scholar] [CrossRef] [PubMed]
- Akgun-Unal, N.; Ozyildirim, S.; Unal, O.; Baltaci, S.B.; Mogulkoc, R.; Baltaci, A.K. The effects of resveratrol and melatonin on cardiac dysfunction in diabetic elderly female rats. Physiol. Res. 2023, 72, 187–198. [Google Scholar] [CrossRef] [PubMed]
- Akgun-Unal, N.; Ozyildirim, S.; Unal, O.; Gulbahce-Mutlu, E.; Mogulkoc, R.; Baltaci, A.K. The effects of resveratrol and melatonin on biochemical and molecular parameters in diabetic old female rat hearts. Exp. Gerontol. 2023, 172, 112043. [Google Scholar] [CrossRef] [PubMed]
- Wiciński, M.; Erdmann, J.; Nowacka, A.; Kuźmiński, O.; Michalak, K.; Janowski, K.; Ohla, J.; Biernaciak, A.; Szambelan, M.; Zabrzyński, J. Natural Phytochemicals as SIRT Activators-Focus on Potential Biochemical Mechanisms. Nutrients 2023, 15, 3578. [Google Scholar] [CrossRef] [PubMed]
- Chung, S.; Yao, H.; Caito, S.; Hwang, J.W.; Arunachalam, G.; Rahman, I. Regulation of SIRT1 in cellular functions: Role of polyphenols. Arch. Biochem. Biophys. 2010, 501, 79–90. [Google Scholar] [CrossRef] [PubMed]
- Um, J.H.; Park, S.J.; Kang, H.; Yang, S.; Foretz, M.; McBurney, M.W.; Kim, M.K.; Viollet, B.; Chung, J.H. AMP-activated protein kinase-deficient mice are resistant to the metabolic effects of resveratrol. Diabetes 2010, 59, 554–563. [Google Scholar] [CrossRef] [PubMed]
- Fiod Riccio, B.V.; Fonseca-Santos, B.; Colerato Ferrari, P.; Chorilli, M. Characteristics, Biological Properties and Analytical Methods of Trans-Resveratrol: A Review. Crit. Rev. Anal. Chem. 2020, 50, 339–358. [Google Scholar] [CrossRef]
- Gambini, J.; Inglés, M.; Olaso, G.; Lopez-Grueso, R.; Bonet-Costa, V.; Gimeno-Mallench, L.; Mas-Bargues, C.; Abdelaziz, K.M.; Gomez-Cabrera, M.C.; Vina, J.; et al. Properties of Resveratrol: In Vitro and In Vivo Studies about Metabolism, Bioavailability, and Biological Effects in Animal Models and Humans. Oxid. Med. Cell. Longev. 2015, 2015, 837042. [Google Scholar] [CrossRef]
- Gomes, B.A.Q.; Silva, J.P.B.; Romeiro, C.F.R.; Dos Santos, S.M.; Rodrigues, C.A.; Gonçalves, P.R.; Sakai, J.T.; Mendes, P.F.S.; Varela, E.L.P.; Monteiro, M.C. Neuroprotective Mechanisms of Resveratrol in Alzheimer’s Disease: Role of SIRT1. Oxid. Med. Cell. Longev. 2018, 2018, 8152373. [Google Scholar] [CrossRef]
- Khan, H.; Tiwari, P.; Kaur, A.; Singh, T.G. Sirtuin Acetylation and Deacetylation: A Complex Paradigm in Neurodegenerative Disease. Mol. Neurobiol. 2021, 58, 3903–3917. [Google Scholar] [CrossRef] [PubMed]
- Rahman, M.H.; Akter, R.; Bhattacharya, T.; Abdel-Daim, M.M.; Alkahtani, S.; Arafah, M.W.; Al-Johani, N.S.; Alhoshani, N.M.; Alkeraishan, N.; Alhenaky, A.; et al. Resveratrol and Neuroprotection: Impact and Its Therapeutic Potential in Alzheimer’s Disease. Front. Pharmacol. 2020, 11, 619024. [Google Scholar] [CrossRef]
- Huhn, S.; Beyer, F.; Zhang, R.; Lampe, L.; Grothe, J.; Kratzsch, J.; Willenberg, A.; Breitfeld, J.; Kovacs, P.; Stumvoll, M.; et al. Effects of resveratrol on memory performance, hippocampus connectivity and microstructure in older adults—A randomized controlled trial. Neuroimage 2018, 174, 177–190. [Google Scholar] [CrossRef] [PubMed]
- Koju, N.; Qin, Z.H.; Sheng, R. Reduced nicotinamide adenine dinucleotide phosphate in redox balance and diseases: A friend or foe? Acta Pharmacol. Sin. 2022, 43, 1889–1904. [Google Scholar] [CrossRef]
- Peng, X.; Wang, J.; Peng, J.; Jiang, H.; Le, K. Resveratrol Improves Synaptic Plasticity in Hypoxic-Ischemic Brain Injury in Neonatal Mice via Alleviating SIRT1/NF-κB Signaling-Mediated Neuroinflammation. J. Mol. Neurosci. 2022, 72, 113–125. [Google Scholar] [CrossRef] [PubMed]
- Wei, Y.D.; Chen, X.X.; Yang, L.J.; Gao, X.R.; Xia, Q.R.; Qi, C.C.; Ge, J.F. Resveratrol ameliorates learning and memory impairments induced by bilateral hippocampal injection of streptozotocin in mice. Neurochem. Int. 2022, 159, 105385. [Google Scholar] [CrossRef] [PubMed]
- Bernacki, J.; Dobrowolska, A.; Nierwińska, K.; Małecki, A. Physiology and pharmacological role of the blood-brain barrier. Pharmacol. Rep. 2008, 60, 600–622. [Google Scholar]
- Kadry, H.; Noorani, B.; Cucullo, L. A blood-brain barrier overview on structure, function, impairment, and biomarkers of integrity. Fluids Barriers CNS 2020, 17, 69. [Google Scholar] [CrossRef]
- Jain, K.K. Nanobiotechnology-based strategies for crossing the blood-brain barrier. Nanomedicine 2012, 7, 1225–1233. [Google Scholar] [CrossRef]
- Barar, J.; Rafi, M.A.; Pourseif, M.M.; Omidi, Y. Blood-brain barrier transport machineries and targeted therapy of brain diseases. Bioimpacts 2016, 6, 225–248. [Google Scholar] [CrossRef]
- Banks, W.A. Characteristics of compounds that cross the blood-brain barrier. BMC Neurol. 2009, 9 (Suppl. 1), S3. [Google Scholar] [CrossRef]
- Ding, S.; Khan, A.I.; Cai, X.; Song, Y.; Lyu, Z.; Du, D.; Dutta, P.; Lin, Y. Overcoming blood-brain barrier transport: Advances in nanoparticle-based drug delivery strategies. Mater Today 2020, 37, 112–125. [Google Scholar] [CrossRef]
- Burek, M.; Förster, C.Y. Culturing of Rodent Brain Microvascular Endothelial Cells for In Vitro Modeling of the Blood-Brain Barrier. In Blood-Brain Barrier, Neuromethods; Barichello, T., Ed.; Humana Press: New York, NY, USA, 2019; Volume 142. [Google Scholar] [CrossRef]
- Amri, A.; Chaumeil, J.C.; Sfar, S.; Charrueau, C. Administration of resveratrol: What formulation solutions to bioavailability limitations? J. Control. Release 2012, 158, 182–193. [Google Scholar] [CrossRef] [PubMed]
- Sun, Y.; Winters, A.; Wang, L.; Chaudhari, K.; Berry, R.; Tang, C.; Liu, R.; Yang, S. Metabolic Heterogeneity of Cerebral Cortical and Cerebellar Astrocytes. Life 2023, 13, 184. [Google Scholar] [CrossRef]
- Gradisnik, L.; Velnar, T. Astrocytes in the central nervous system and their functions in health and disease: A review. World J. Clin. Cases 2023, 11, 3385–3394. [Google Scholar] [CrossRef]
- Kim, Y.; Park, J.; Choi, Y.K. The Role of Astrocytes in the Central Nervous System Focused on BK Channel and Heme Oxygenase Metabolites: A Review. Antioxidants 2019, 8, 121. [Google Scholar] [CrossRef] [PubMed]
- Morita, M.; Ikeshima-Kataoka, H.; Kreft, M.; Vardjan, N.; Zorec, R.; Noda, M. Metabolic Plasticity of Astrocytes and Aging of the Brain. Int. J. Mol. Sci. 2019, 20, 941. [Google Scholar] [CrossRef] [PubMed]
- Weber, B.; Barros, L.F. The Astrocyte: Powerhouse and Recycling Center. Cold Spring Harb. Perspect. Biol. 2015, 7, a020396. [Google Scholar] [CrossRef] [PubMed]
- Meyer, J.; Rauh, J.; Galla, H.J. The susceptibility of cerebral endothelial cells to astroglial induction of blood-brain barrier enzymes depends on their proliferative state. J. Neurochem. 1991, 57, 1971–1977. [Google Scholar] [CrossRef]
- Komorowska, J.; Wątroba, M.; Bednarzak, M.; Grabowska, A.D.; Szukiewicz, D. The Role of Glucose Concentration and Resveratrol in Modulating Neuroinflammatory Cytokines: Insights from an In Vitro Blood–Brain Barrier Model. Med. Sci. Monit. 2023, in press. [Google Scholar] [CrossRef]
- Liu, X.; Quan, N. Microglia and CNS Interleukin-1: Beyond Immunological Concepts. Front. Neurol. 2018, 9, 8. [Google Scholar] [CrossRef]
- Kossmann, T.; Stahel, P.F.; Lenzlinger, P.M.; Redl, H.; Dubs, R.W.; Trentz, O.; Schlag, G.; Morganti-Kossmann, M.C. Interleukin-8 released into the cerebrospinal fluid after brain injury is associated with blood-brain barrier dysfunction and nerve growth factor production. J. Cereb. Blood Flow Metab. 1997, 17, 280–289. [Google Scholar] [CrossRef]
- Park, S.Y.; Kang, M.J.; Han, J.S. Interleukin-1 beta promotes neuronal differentiation through the Wnt5a/RhoA/JNK pathway in cortical neural precursor cells. Mol. Brain 2018, 11, 39. [Google Scholar] [CrossRef]
- Hewett, S.J.; Jackman, N.A.; Claycomb, R.J. Interleukin-1β in Central Nervous System Injury and Repair. Eur. J. Neurodegener. Dis. 2012, 1, 195–211. [Google Scholar]
- Hanisch, U.K.; Quirion, R. Interleukin-2 as a neuroregulatory cytokine. Brain Res. Brain Res. Rev. 1995, 21, 246–284. [Google Scholar] [CrossRef] [PubMed]
- Yshii, L.; Pasciuto, E.; Bielefeld, P.; Mascali, L.; Lemaitre, P.; Marino, M.; Dooley, J.; Kouser, L.; Verschoren, S.; Lagou, V.; et al. Astrocyte-targeted gene delivery of interleukin 2 specifically increases brain-resident regulatory T cell numbers and protects against pathological neuroinflammation. Nat. Immunol. 2022, 23, 878–891. [Google Scholar] [CrossRef]
- Daines, J.M.; Schellhardt, L.; Wood, M.D. The Role of the IL-4 Signaling Pathway in Traumatic Nerve Injuries. Neurorehabil. Neural Repair 2021, 35, 431–443. [Google Scholar] [CrossRef] [PubMed]
- Chen, X.; Zhang, J.; Song, Y.; Yang, P.; Yang, Y.; Huang, Z.; Wang, K. Deficiency of anti-inflammatory cytokine IL-4 leads to neural hyperexcitability and aggravates cerebral ischemia-reperfusion injury. Acta Pharm. Sin. B 2020, 10, 1634–1645. [Google Scholar] [CrossRef] [PubMed]
- Erta, M.; Quintana, A.; Hidalgo, J. Interleukin-6, a major cytokine in the central nervous system. Int. J. Biol. Sci. 2012, 8, 1254–1266. [Google Scholar] [CrossRef]
- Kashiwagi, Y.; Takedachi, M.; Mori, K.; Kubota, M.; Yamada, S.; Kitamura, M.; Murakami, S. High glucose-induced oxidative stress increases IL-8 production in human gingival epithelial cells. Oral Dis. 2016, 22, 578–584. [Google Scholar] [CrossRef]
- Lan, C.C.; Wu, C.S.; Huang, S.M.; Wu, I.H.; Chen, G.S. High-glucose environment enhanced oxidative stress and increased interleukin-8 secretion from keratinocytes: New insights into impaired diabetic wound healing. Diabetes 2013, 62, 2530–2538. [Google Scholar] [CrossRef]
- Wang, X.L.; Li, T.; Li, J.H.; Miao, S.Y.; Xiao, X.Z. The Effects of Resveratrol on Inflammation and Oxidative Stress in a Rat Model of Chronic Obstructive Pulmonary Disease. Molecules 2017, 22, 1529. [Google Scholar] [CrossRef]
- Kolahdouz-Mohammadi, R.; Shidfar, F.; Khodaverdi, S.; Arablou, T.; Heidari, S.; Rashidi, N.; Delbandi, A.A. Resveratrol treatment reduces expression of MCP-1, IL-6, IL-8 and RANTES in endometriotic stromal cells. J. Cell. Mol. Med. 2020, 25, 1116–1127. [Google Scholar] [CrossRef] [PubMed]
- Ferraresi, A.; Phadngam, S.; Morani, F.; Galetto, A.; Alabiso, O.; Chiorino, G.; Isidoro, C. Resveratrol inhibits IL-6-induced ovarian cancer cell migration through epigenetic up-regulation of autophagy. Mol. Carcinog. 2017, 56, 1164–1181. [Google Scholar] [CrossRef]
- Sivandzade, F.; Cucullo, L. In-vitro blood-brain barrier modeling: A review of modern and fast-advancing technologies. J. Cereb. Blood Flow Metab. 2018, 38, 1667–1681. [Google Scholar] [CrossRef]
- Rahman, N.A.; Rasil, A.N.H.M.; Meyding-Lamade, U.; Craemer, E.M.; Diah, S.; Tuah, A.A.; Muharram, S.H. Immortalized endothelial cell lines for in vitro blood-brain barrier models: A systematic review. Brain Res. 2016, 1642, 532–545. [Google Scholar] [CrossRef]
- Gosselet, F. Modélisation in vitro de la barrière hémato-encéphalique [Modelling of the blood-brain barrier]. Med. Sci. 2017, 33, 423–431. (In French) [Google Scholar] [CrossRef][Green Version]
- Bagchi, S.; Chhibber, T.; Lahooti, B.; Verma, A.; Borse, V.; Jayant, R.D. In-vitro blood-brain barrier models for drug screening and permeation studies: An overview. Drug Des. Devel. Ther. 2019, 13, 3591–3605. [Google Scholar] [CrossRef] [PubMed]
- Christou, M.A.; Christou, P.A.; Kyriakopoulos, C.; Christou, G.A.; Tigas, S. Effects of Hypoglycemia on Cardiovascular Function in Patients with Diabetes. Int. J. Mol. Sci. 2023, 24, 9357. [Google Scholar] [CrossRef] [PubMed]
- Chang, S.C.; Yang, W.V. Hyperglycemia, tumorigenesis, and chronic inflammation. Crit. Rev. Oncol. Hematol. 2016, 108, 146–153. [Google Scholar] [CrossRef]
- Babu, P.B.; Chidekel, A.; Shaffer, T.H. Association of interleukin-8 with inflammatory and innate immune components in bronchoalveolar lavage of children with chronic respiratory diseases. Clin. Chim. Acta 2004, 350, 195–200. [Google Scholar] [CrossRef]
- Scheller, J.; Chalaris, A.; Schmidt-Arras, D.; Rose-John, S. The pro- and anti-inflammatory properties of the cytokine interleukin-6. Biochim. Biophys. Acta 2011, 1813, 878–888. [Google Scholar] [CrossRef] [PubMed]
- Van Wagoner, N.J.; Oh, J.W.; Repovic, P.; Benveniste, E.N. Interleukin-6 (IL-6) production by astrocytes: Autocrine regulation by IL-6 and the soluble IL-6 receptor. J. Neurosci. 1999, 19, 5236–5244. [Google Scholar] [CrossRef]
- Wang, J.; Li, G.; Wang, Z.; Zhang, X.; Yao, L.; Wang, F.; Liu, S.; Yin, J.; Ling, E.A.; Wang, L.; et al. High glucose-induced expression of inflammatory cytokines and reactive oxygen species in cultured astrocytes. Neuroscience 2012, 202, 58–68. [Google Scholar] [CrossRef] [PubMed]
- Salti, T.; Khazim, K.; Haddad, R.; Campisi-Pinto, S.; Bar-Sela, G.; Cohen, I. Glucose Induces IL-1α-Dependent Inflammation and Extracellular Matrix Proteins Expression and Deposition in Renal Tubular Epithelial Cells in Diabetic Kidney Disease. Front. Immunol. 2020, 11, 1270. [Google Scholar] [CrossRef] [PubMed]
- Hu, R.; Xia, C.Q.; Butfiloski, E.; Clare-Salzler, M. Effect of high glucose on cytokine production by human peripheral blood immune cells and type I interferon signaling in monocytes: Implications for the role of hyperglycemia in the diabetes inflammatory process and host defense against infection. Clin. Immunol. 2018, 195, 139–148. [Google Scholar] [CrossRef] [PubMed]
- Devaraj, S.; Venugopal, S.K.; Singh, U.; Jialal, I. Hyperglycemia induces monocytic release of interleukin-6 via induction of protein kinase c-{alpha} and -{beta}. Diabetes 2005, 54, 85–91. [Google Scholar] [CrossRef] [PubMed]
- Koenen, T.B.; Stienstra, R.; van Tits, L.J.; de Graaf, J.; Stalenhoef, A.F.; Joosten, L.A.; Tack, C.J.; Netea, M.G. Hyperglycemia activates caspase-1 and TXNIP-mediated IL-1beta transcription in human adipose tissue. Diabetes 2011, 60, 517–524. [Google Scholar] [CrossRef] [PubMed]
- Satoh, T.; Otsuka, A.; Contassot, E.; French, L.E. The inflammasome and IL-1β: Implications for the treatment of inflammatory diseases. Immunotherapy 2015, 7, 243–254. [Google Scholar] [CrossRef]
- Shaftel, S.S.; Griffin, W.S.; O’Banion, M.K. The role of interleukin-1 in neuroinflammation and Alz-heimer disease: An evolving perspective. J. Neuroinflamm. 2008, 5, 7. [Google Scholar] [CrossRef]
- Huang, X.L.; Wang, Y.J.; Yan, J.W.; Wan, Y.N.; Chen, B.; Li, B.Z.; Yang, G.J.; Wang, J. Role of anti-inflammatory cytokines IL-4 and IL-13 in systemic sclerosis. Inflamm. Res. 2015, 64, 151–159. [Google Scholar] [CrossRef] [PubMed]
- Gadani, S.P.; Cronk, J.C.; Norris, G.T.; Kipnis, J. IL-4 in the brain: A cytokine to remember. J. Immunol. 2012, 189, 4213–4219. [Google Scholar] [CrossRef]
- McCarron, E.P.; Williams, D.P.; Antoine, D.J.; Kipar, A.; Lemm, J.; Stehr, S.; Welters, I.D. Exploring the translational disconnect between the murine and human inflammatory response: Analysis of LPS dose-response relationship in murine versus human cell lines and implications for translation into murine models of sepsis. J. Inflamm. Res. 2015, 8, 201–209. [Google Scholar] [CrossRef] [PubMed]
- Liu, X.; Yin, S.; Chen, Y.; Wu, Y.; Zheng, W.; Dong, H.; Bai, Y.; Qin, Y.; Li, J.; Feng, S.; et al. LPS-induced proinflammatory cytokine expression in human airway epithelial cells and macrophages via NF-κB, STAT3 or AP-1 activation. Mol. Med. Rep. 2018, 17, 5484–5491. [Google Scholar] [CrossRef] [PubMed]
- Frost, R.A.; Nystrom, G.J.; Lang, C.H. Lipopolysaccharide and proinflammatory cytokines stimulate interleukin-6 expression in C2C12 myoblasts: Role of the Jun NH2-terminal kinase. Am. J. Physiol. Regul. Integr. Comp. Physiol. 2003, 285, R1153–R1164. [Google Scholar] [CrossRef]
- Wang, J.; Yan, X.; Nesengani, L.T.; Ding, H.; Yang, L.; Lu, W. LPS-induces IL-6 and IL-8 gene expression in bovine endometrial cells “through DNA methylation”. Gene 2018, 677, 266–272. [Google Scholar] [CrossRef]
- Cho, J.S.; Kang, J.H.; Um, J.Y.; Han, I.H.; Park, I.H.; Lee, H.M. Lipopolysaccharide induces pro-inflammatory cytokines and MMP production via TLR4 in nasal polyp-derived fibroblast and organ culture. PLoS ONE 2014, 9, e90683. [Google Scholar] [CrossRef]
- Chi, L.; Li, Y.; Stehno-Bittel, L.; Gao, J.; Morrison, D.C.; Stechschulte, D.J.; Dileepan, K.N. Interleukin-6 production by endothelial cells via stimulation of protease-activated receptors is amplified by endotoxin and tumor necrosis factor-alpha. J. Interferon Cytokine Res. 2001, 21, 231–240. [Google Scholar] [CrossRef]
- Pardridge, W.M. The blood-brain barrier: Bottleneck in brain drug development. NeuroRx 2005, 2, 3–14. [Google Scholar] [CrossRef]
- Wang, Y.; Gallagher, E.; Jorgensen, C.; Troendle, E.P.; Hu, D.; Searson, P.C.; Ulmschneider, M.B. An experimentally validated approach to calculate the blood-brain barrier permeability of small molecules. Sci. Rep. 2019, 9, 6117. [Google Scholar] [CrossRef]
- Bastianetto, S.; Ménard, C.; Quirion, R. Neuroprotective action of resveratrol. Biochim. Biophys. Acta 2015, 1852, 1195–1201. [Google Scholar] [CrossRef]
- Sinha, K.; Chaudhary, G.; Gupta, Y.K. Protective effect of resveratrol against oxidative stress in middle cerebral artery occlusion model of stroke in rats. Life Sci. 2002, 71, 655–665. [Google Scholar] [CrossRef]
- Turner, R.S.; Thomas, R.G.; Craft, S.; van Dyck, C.H.; Mintzer, J.; Reynolds, B.A.; Brewer, J.B.; Rissman, R.A.; Raman, R.; Aisen, P.S.; et al. A randomized, double-blind, placebo-controlled trial of resveratrol for Alzheimer disease. Neurology 2015, 85, 1383–1891. [Google Scholar] [CrossRef]
- Smoliga, J.M.; Blanchard, O. Enhancing the delivery of resveratrol in humans: If low bioavailability is the problem, what is the solution? Molecules 2014, 19, 17154–17172. [Google Scholar] [CrossRef]
- Galiniak, S.; Aebisher, D.; Bartusik-Aebisher, D. Health benefits of resveratrol administration. Acta Biochim. Pol. 2019, 66, 13–21. [Google Scholar] [CrossRef] [PubMed]
- Robertson, I.; Wai Hau, T.; Sami, F.; Sajid Ali, M.; Badgujar, V.; Murtuja, S.; Saquib Hasnain, M.; Khan, A.; Majeed, S.; Tahir Ansari, M. The science of resveratrol, formulation, pharmacokinetic barriers and its chemotherapeutic potential. Int. J. Pharm. 2022, 618, 121605. [Google Scholar] [CrossRef]
- Pecyna, P.; Wargula, J.; Murias, M.; Kucinska, M. More Than Resveratrol: New Insights into Stilbene-Based Compounds. Biomolecules 2020, 10, 1111. [Google Scholar] [CrossRef] [PubMed]
- Walle, T. Bioavailability of resveratrol. Ann. N. Y. Acad. Sci. 2011, 1215, 9–15. [Google Scholar] [CrossRef] [PubMed]
- Andrade, S.; Ramalho, M.J.; Pereira, M.D.C.; Loureiro, J.A. Resveratrol Brain Delivery for Neurological Disorders Prevention and Treatment. Front. Pharmacol. 2018, 9, 1261. [Google Scholar] [CrossRef]
- Shu, X.H.; Wang, L.L.; Li, H.; Song, X.; Shi, S.; Gu, J.Y.; Wu, M.L.; Chen, X.Y.; Kong, Q.Y.; Liu, J. Diffusion Efficiency and Bioavailability of Resveratrol Administered to Rat Brain by Different Routes: Therapeutic Implications. Neurotherapeutics 2015, 12, 491–501. [Google Scholar] [CrossRef]
- Becher, B.; Spath, S.; Goverman, J. Cytokine networks in neuroinflammation. Nat. Rev. Immunol. 2017, 17, 49–59. [Google Scholar] [CrossRef] [PubMed]
- Martínez de Toda, I.; González-Sánchez, M.; Díaz-Del Cerro, E.; Valera, G.; Carracedo, J.; Guerra-Pérez, N. Sex differences in markers of oxidation and inflammation. Implications for ageing. Mech. Ageing Dev. 2023, 211, 111797. [Google Scholar] [CrossRef] [PubMed]
- Trabace, L.; Roviezzo, F.; Rossi, A. Editorial: Sex Differences in Inflammatory Diseases. Front. Pharmacol. 2022, 13, 962869. [Google Scholar] [CrossRef] [PubMed]
- Pannu, N.; Bhatnagar, A. Resveratrol: From enhanced biosynthesis and bioavailability to multitargeting chronic diseases. Biomed. Pharmacother. 2019, 109, 2237–2251. [Google Scholar] [CrossRef]
- Grabowska, A.D.; Wątroba, M.; Witkowska, J.; Mikulska, A.; Sepúlveda, N.; Szukiewicz, D. Interplay between Systemic Glycemia and Neuroprotective Activity of Resveratrol in Modulating Astrocyte SIRT1 Response to Neuroinflammation. Int. J. Mol. Sci. 2023, 24, 11640. [Google Scholar] [CrossRef]


| Control Groups | Basal Medium | Glucose Medium | LPS Solution | RSV Solution |
|---|---|---|---|---|
| 1st stage of the study | + | − | − | − |
| 2nd stage of the study | + | − | + | − |
| 3rd stage of the study | + | − | + | + |
Disclaimer/Publisher’s Note: The statements, opinions and data contained in all publications are solely those of the individual author(s) and contributor(s) and not of MDPI and/or the editor(s). MDPI and/or the editor(s) disclaim responsibility for any injury to people or property resulting from any ideas, methods, instructions or products referred to in the content. |
© 2024 by the authors. Licensee MDPI, Basel, Switzerland. This article is an open access article distributed under the terms and conditions of the Creative Commons Attribution (CC BY) license (https://creativecommons.org/licenses/by/4.0/).
Share and Cite
Komorowska, J.; Wątroba, M.; Bednarzak, M.; Grabowska, A.D.; Szukiewicz, D. Anti-Inflammatory Action of Resveratrol in the Central Nervous System in Relation to Glucose Concentration—An In Vitro Study on a Blood–Brain Barrier Model. Int. J. Mol. Sci. 2024, 25, 3110. https://doi.org/10.3390/ijms25063110
Komorowska J, Wątroba M, Bednarzak M, Grabowska AD, Szukiewicz D. Anti-Inflammatory Action of Resveratrol in the Central Nervous System in Relation to Glucose Concentration—An In Vitro Study on a Blood–Brain Barrier Model. International Journal of Molecular Sciences. 2024; 25(6):3110. https://doi.org/10.3390/ijms25063110
Chicago/Turabian StyleKomorowska, Justyna, Mateusz Wątroba, Małgorzata Bednarzak, Anna D. Grabowska, and Dariusz Szukiewicz. 2024. "Anti-Inflammatory Action of Resveratrol in the Central Nervous System in Relation to Glucose Concentration—An In Vitro Study on a Blood–Brain Barrier Model" International Journal of Molecular Sciences 25, no. 6: 3110. https://doi.org/10.3390/ijms25063110
APA StyleKomorowska, J., Wątroba, M., Bednarzak, M., Grabowska, A. D., & Szukiewicz, D. (2024). Anti-Inflammatory Action of Resveratrol in the Central Nervous System in Relation to Glucose Concentration—An In Vitro Study on a Blood–Brain Barrier Model. International Journal of Molecular Sciences, 25(6), 3110. https://doi.org/10.3390/ijms25063110