
Identification and Validation of Key Genes Related to Preferred Flavour Profiles in Australian Commercial Papaya (Carica papaya L.)


Abstract
1. Introduction
2. Results
2.1. RNA-Sequencing Assembly
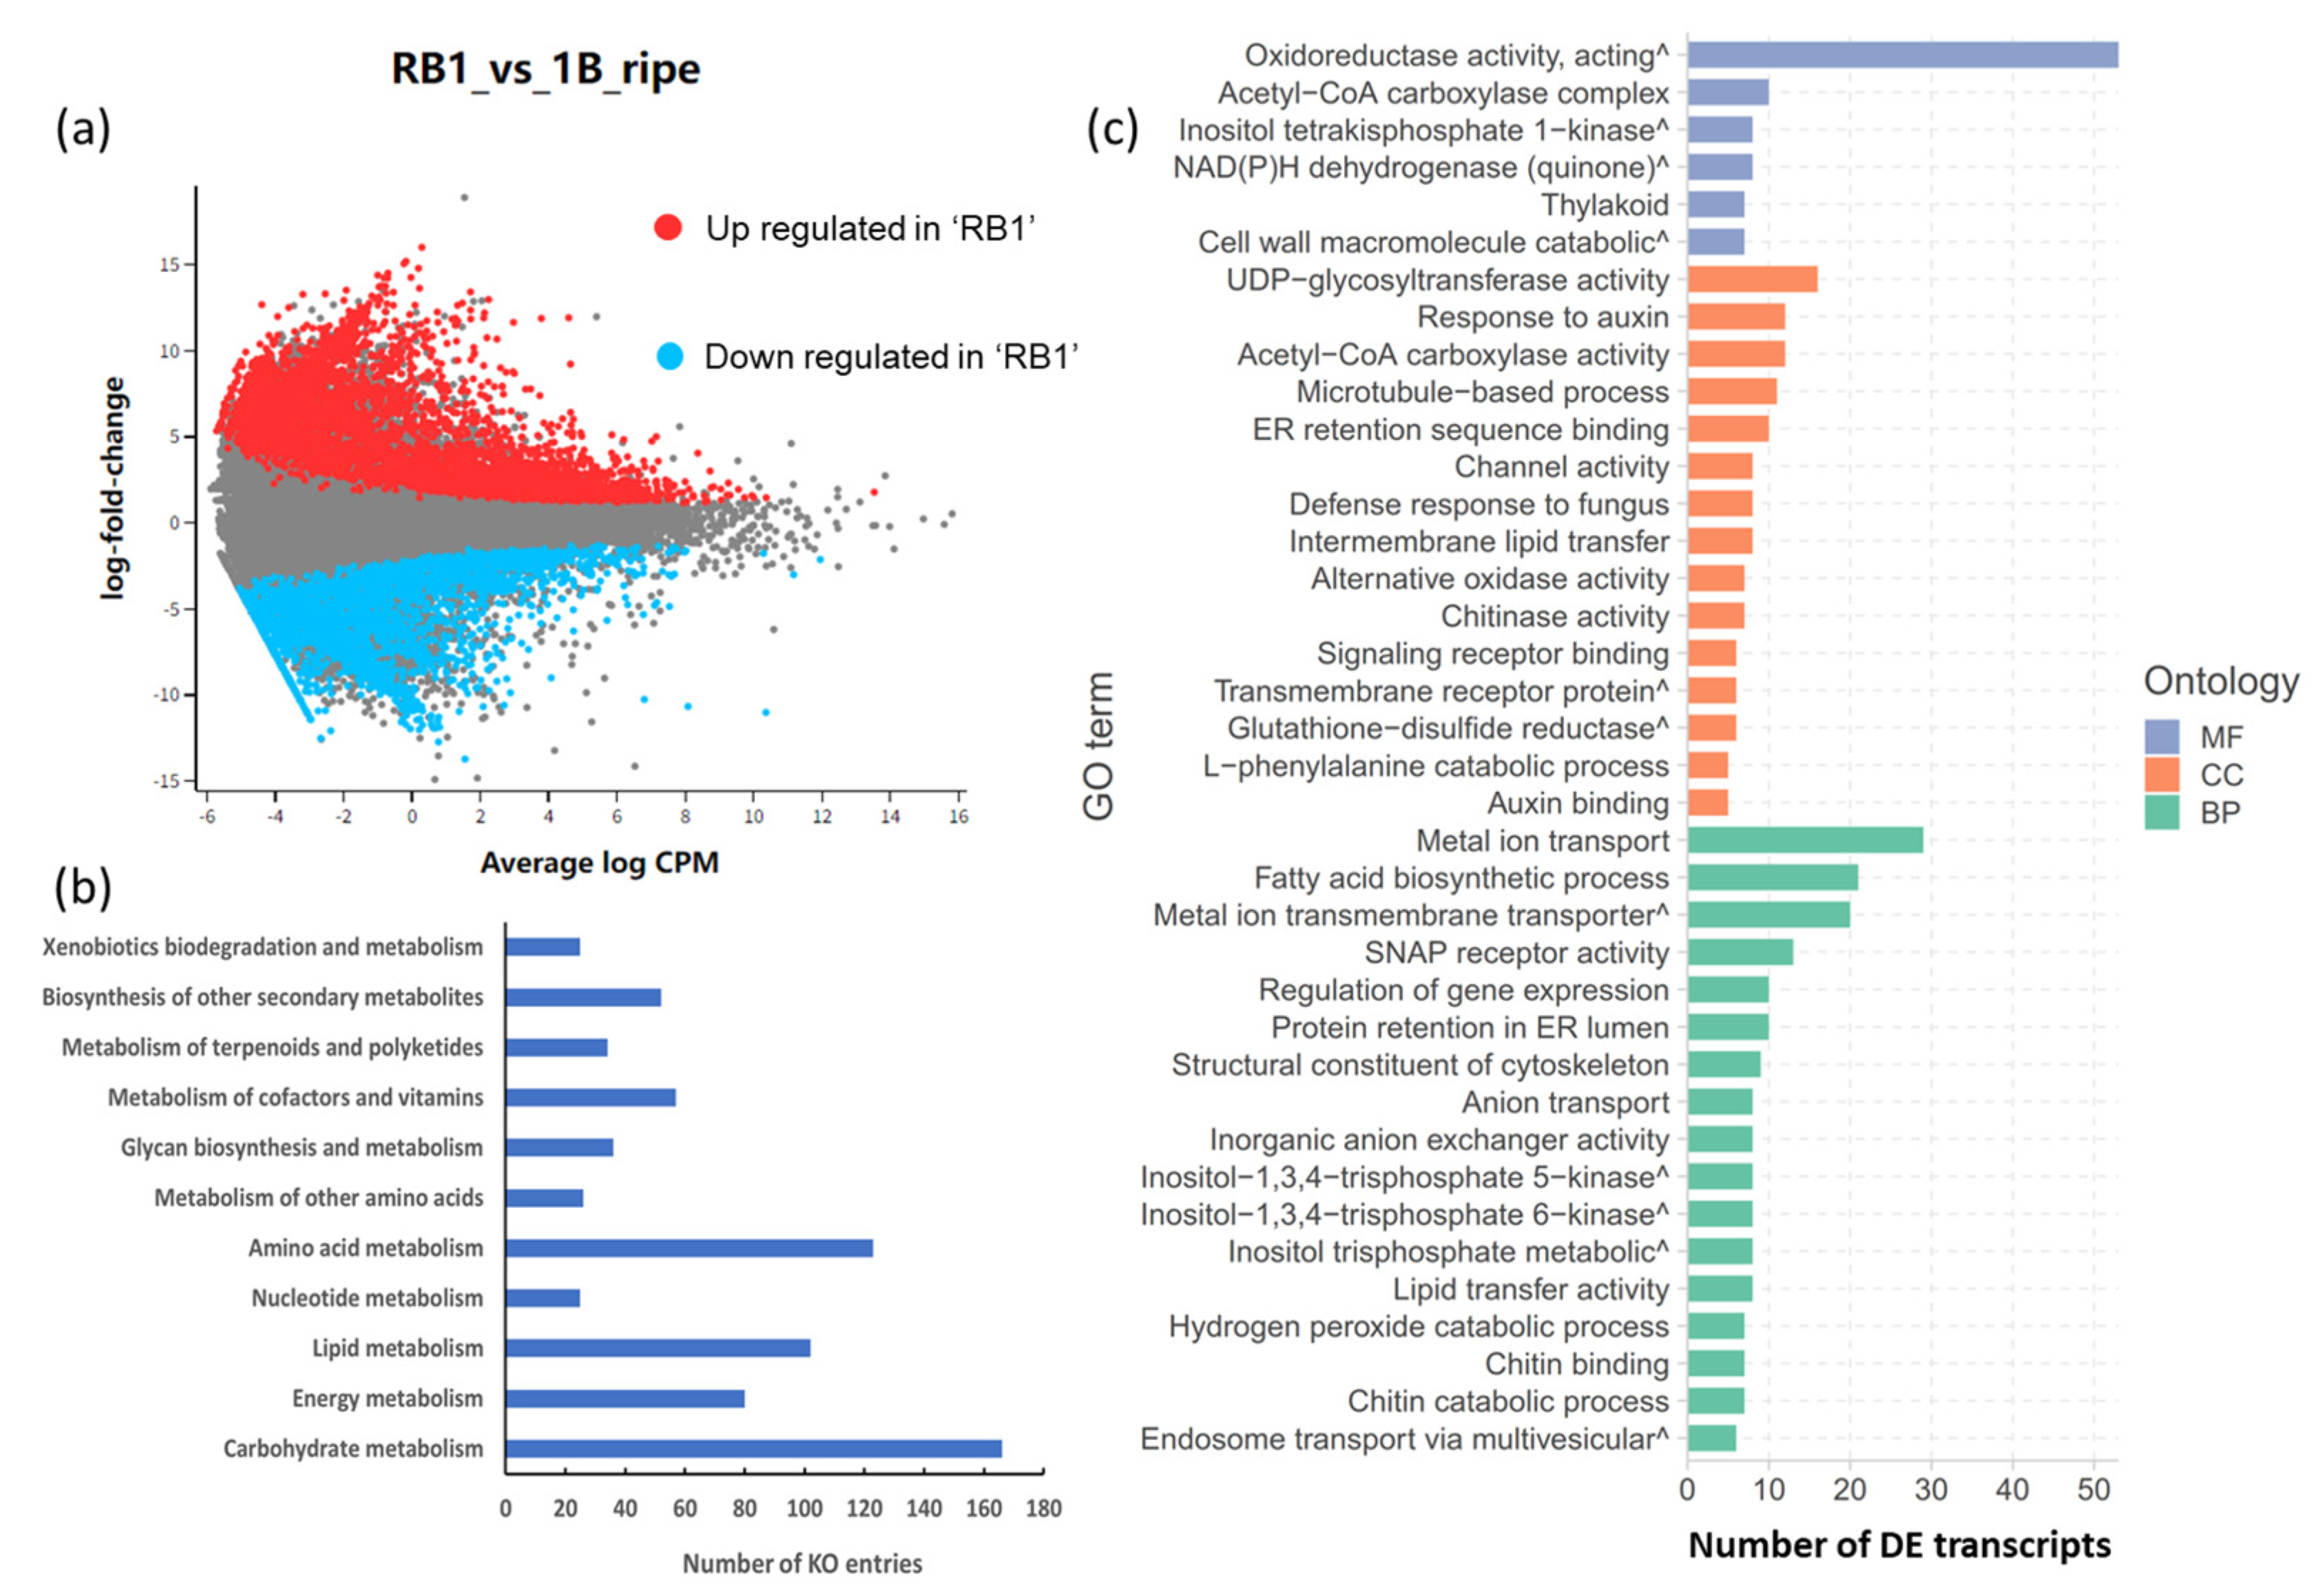
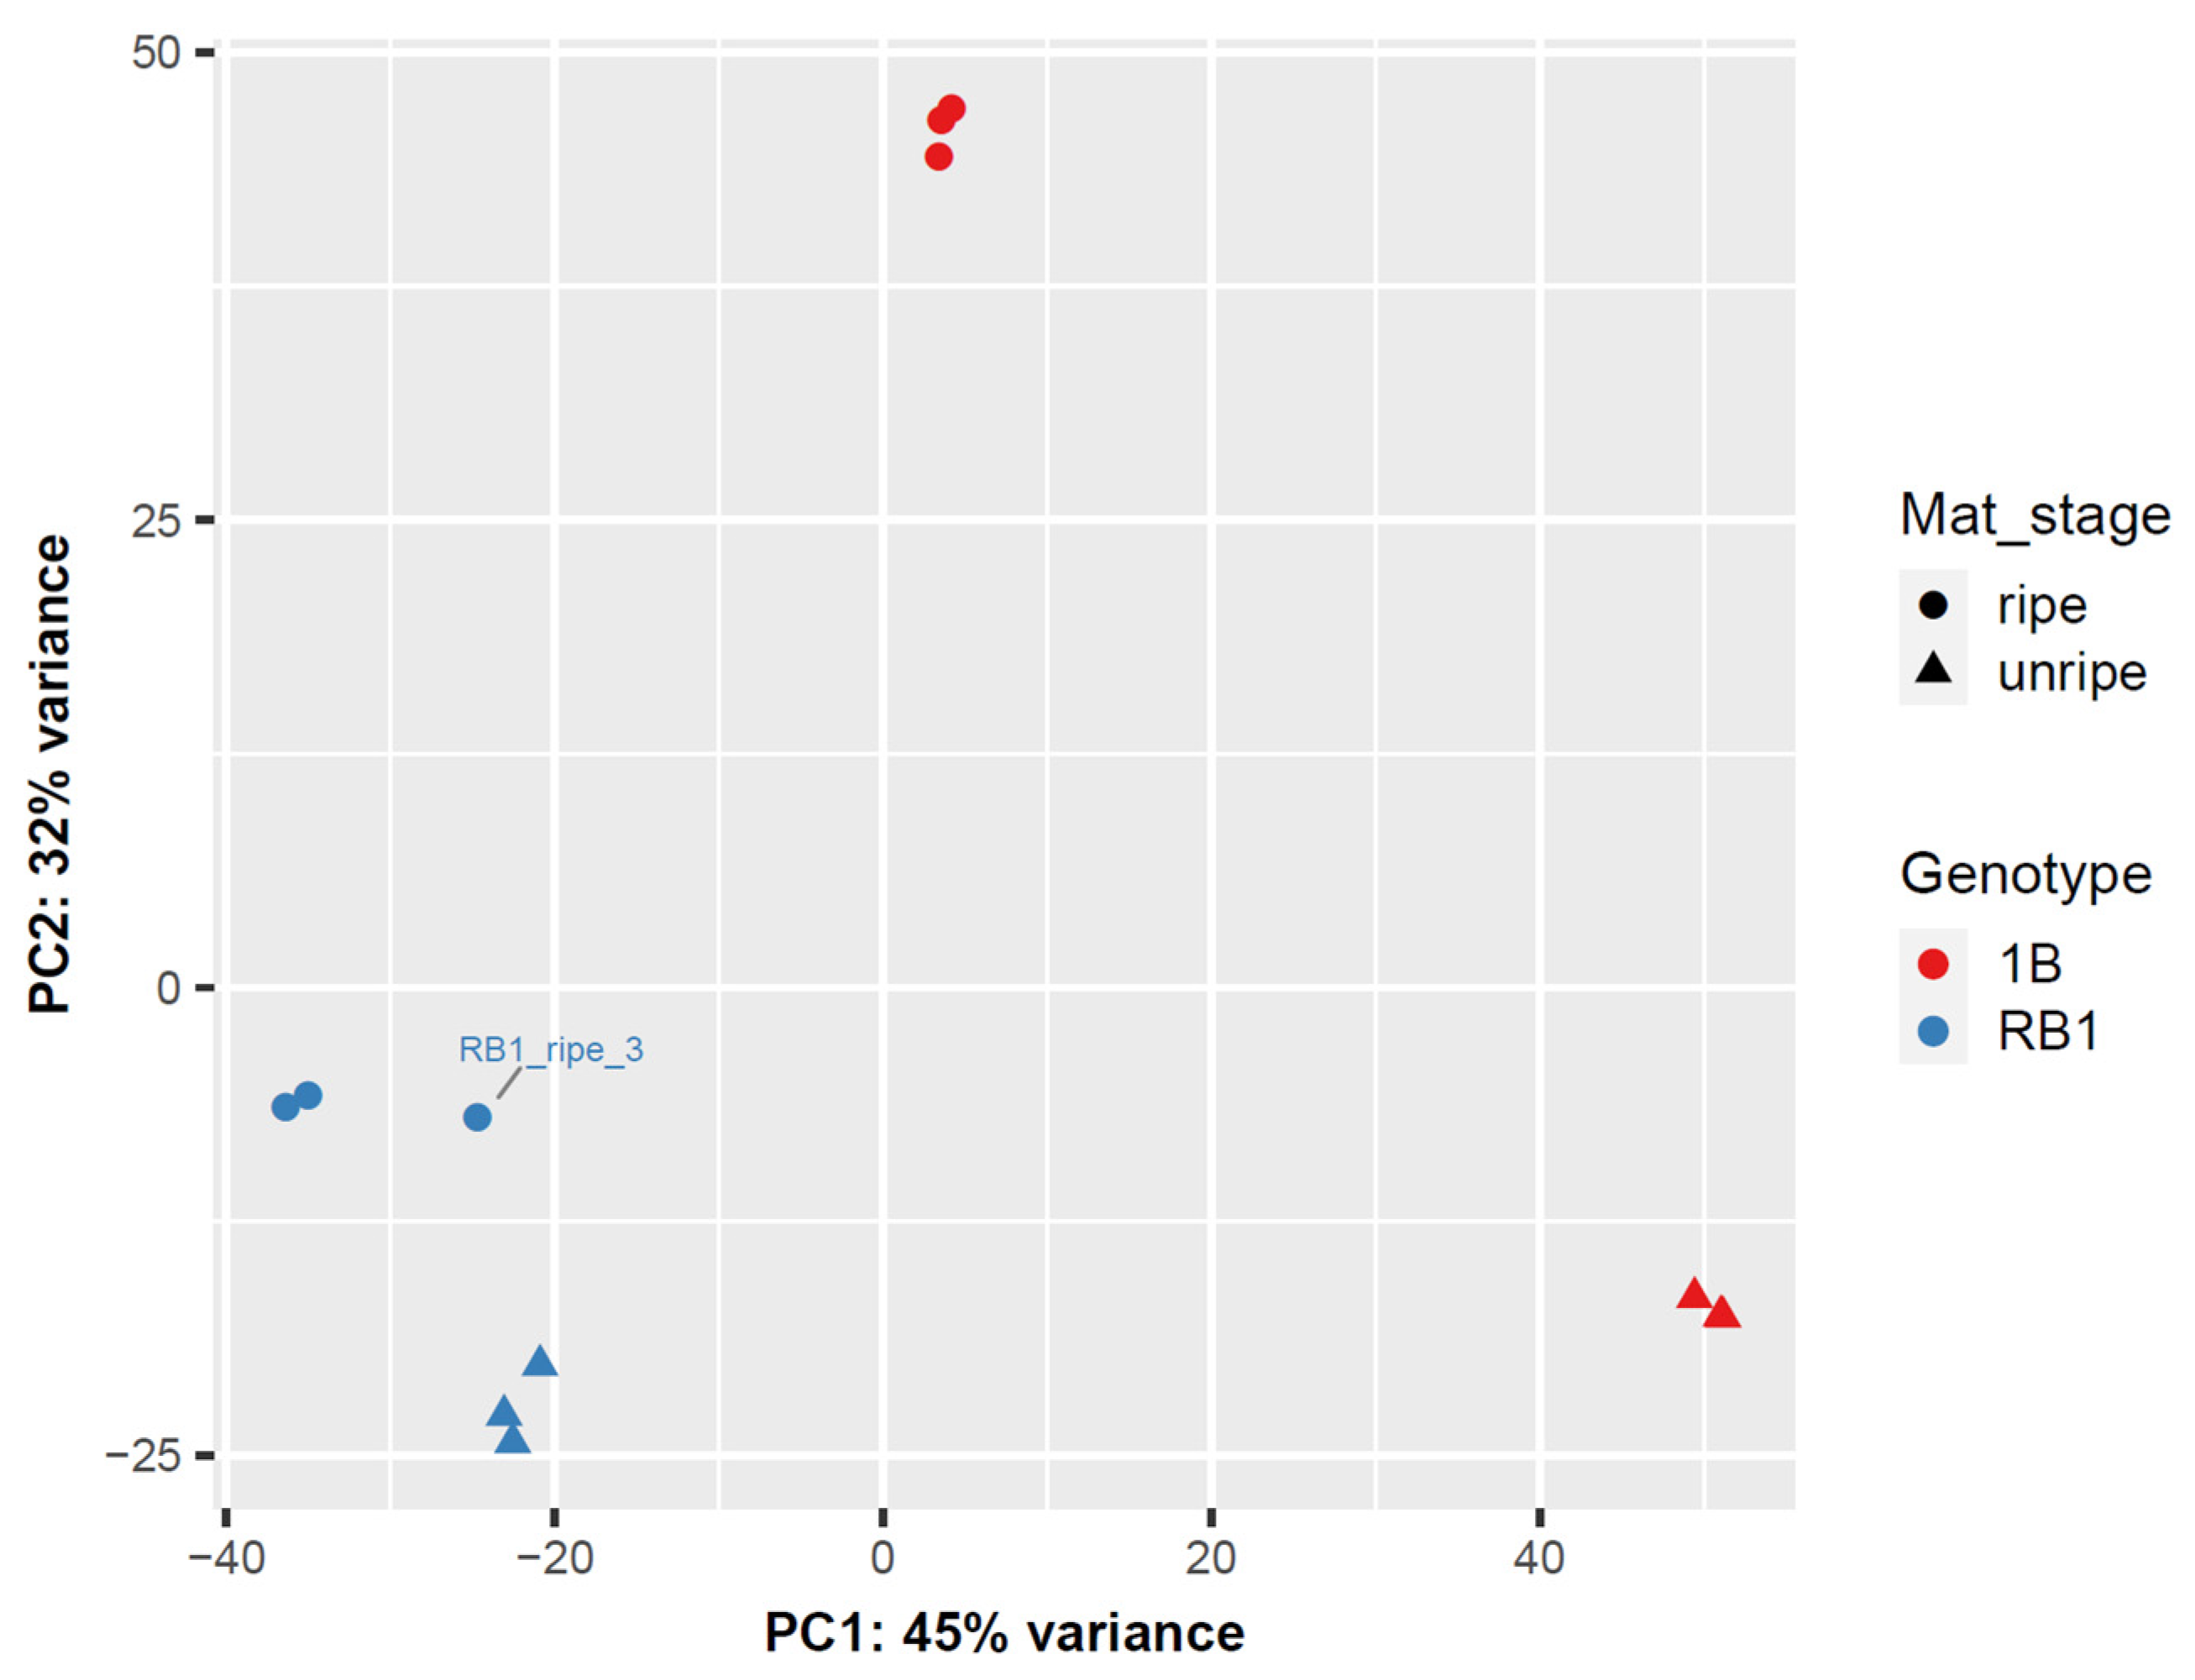
2.2. Differential Expression of Transcripts from RNA-Seq Data
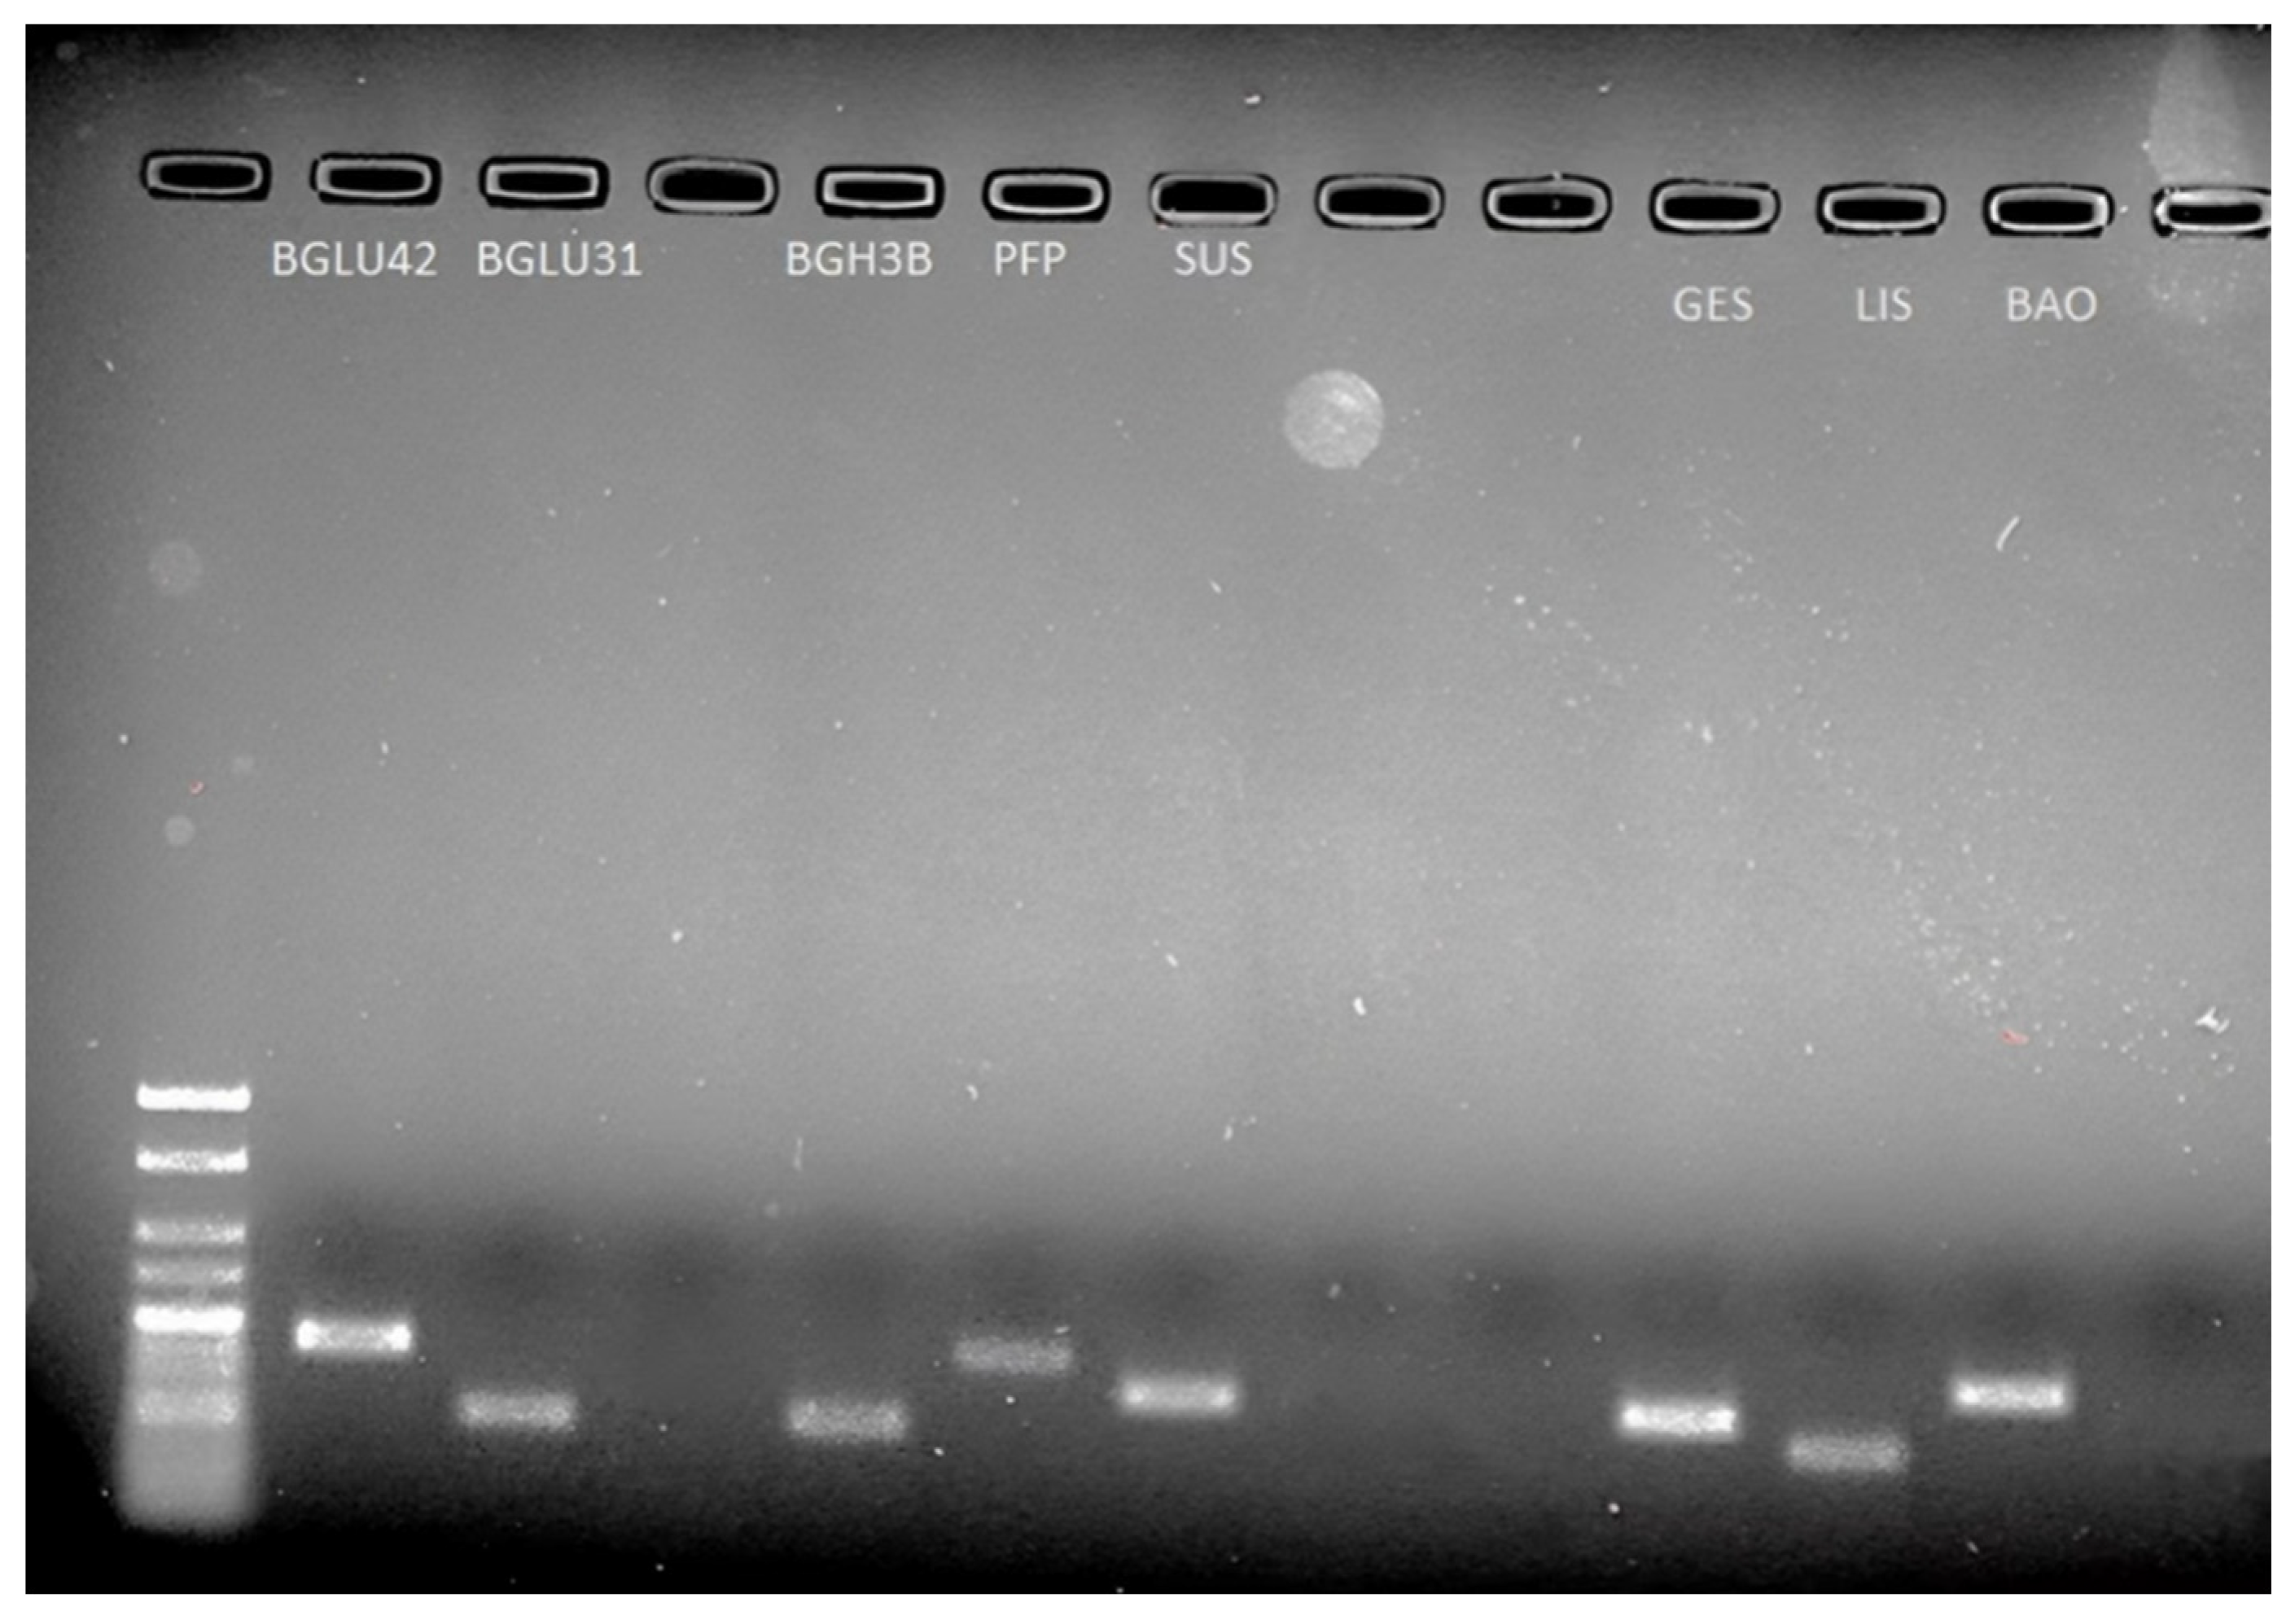
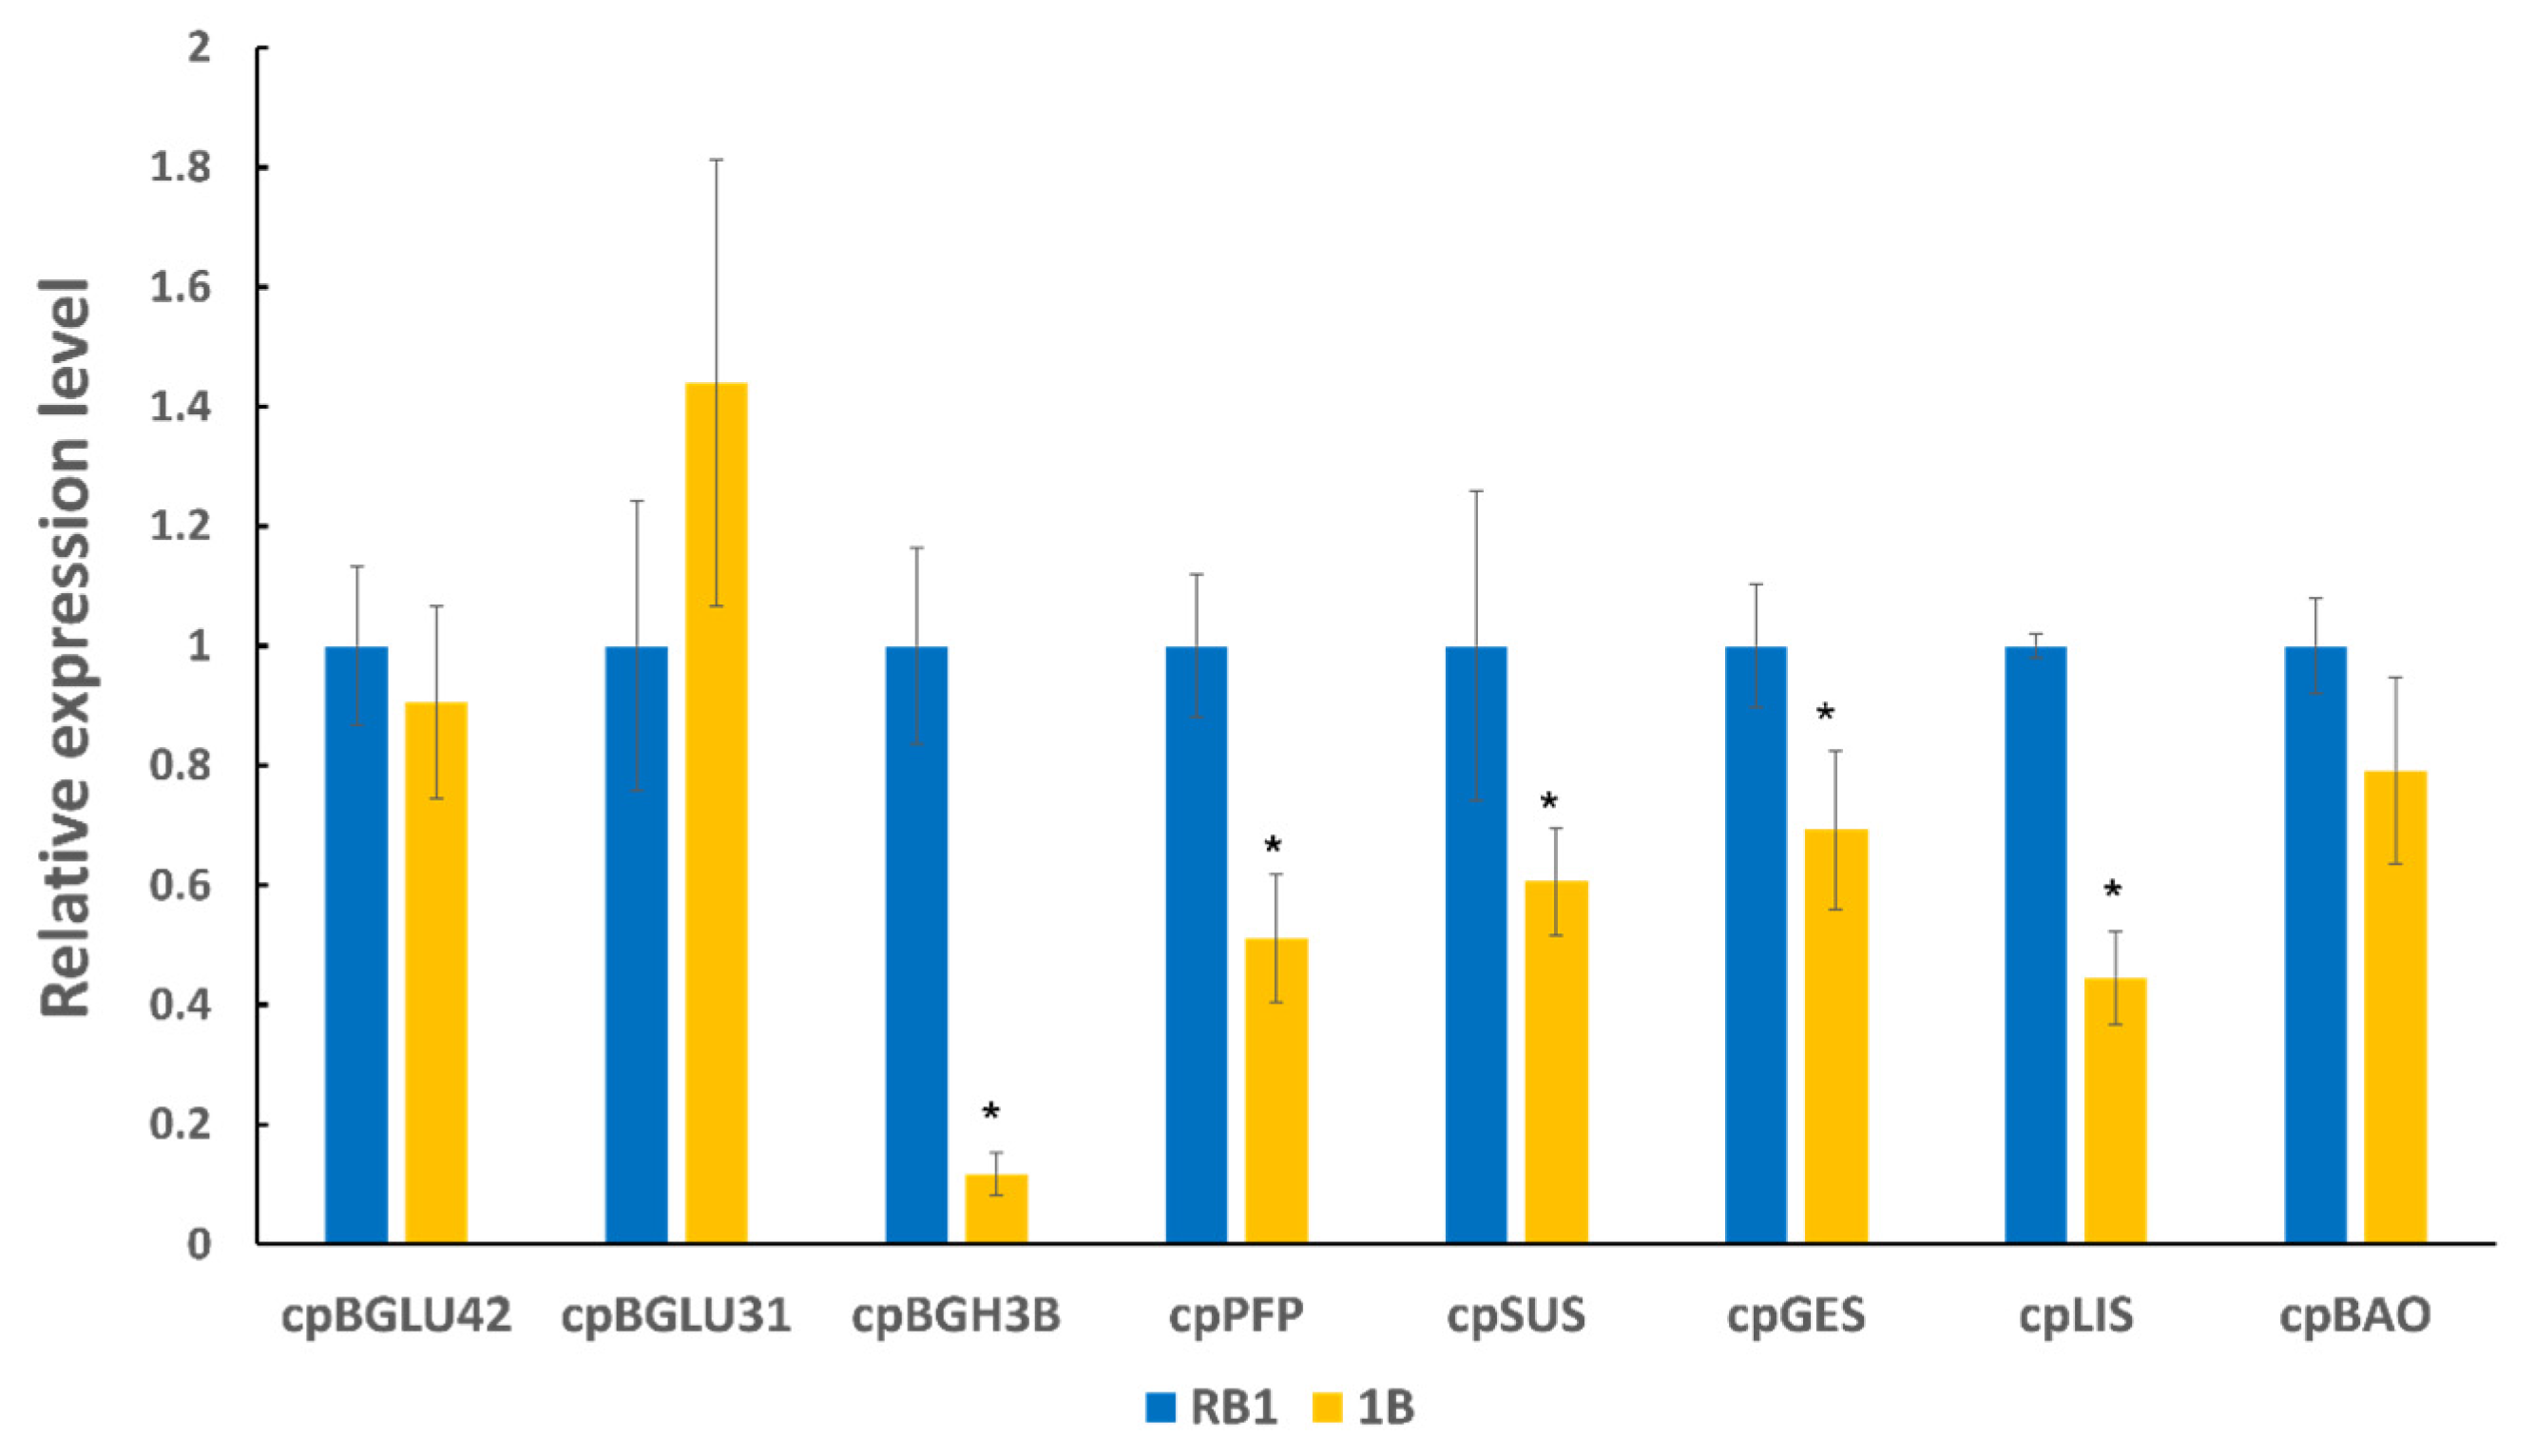
2.3. Validation of Functional Genes Related to Flavour Using RT-qPCR between ‘RB1’ and ‘1B’ Papaya
3. Discussion
4. Materials and Methods
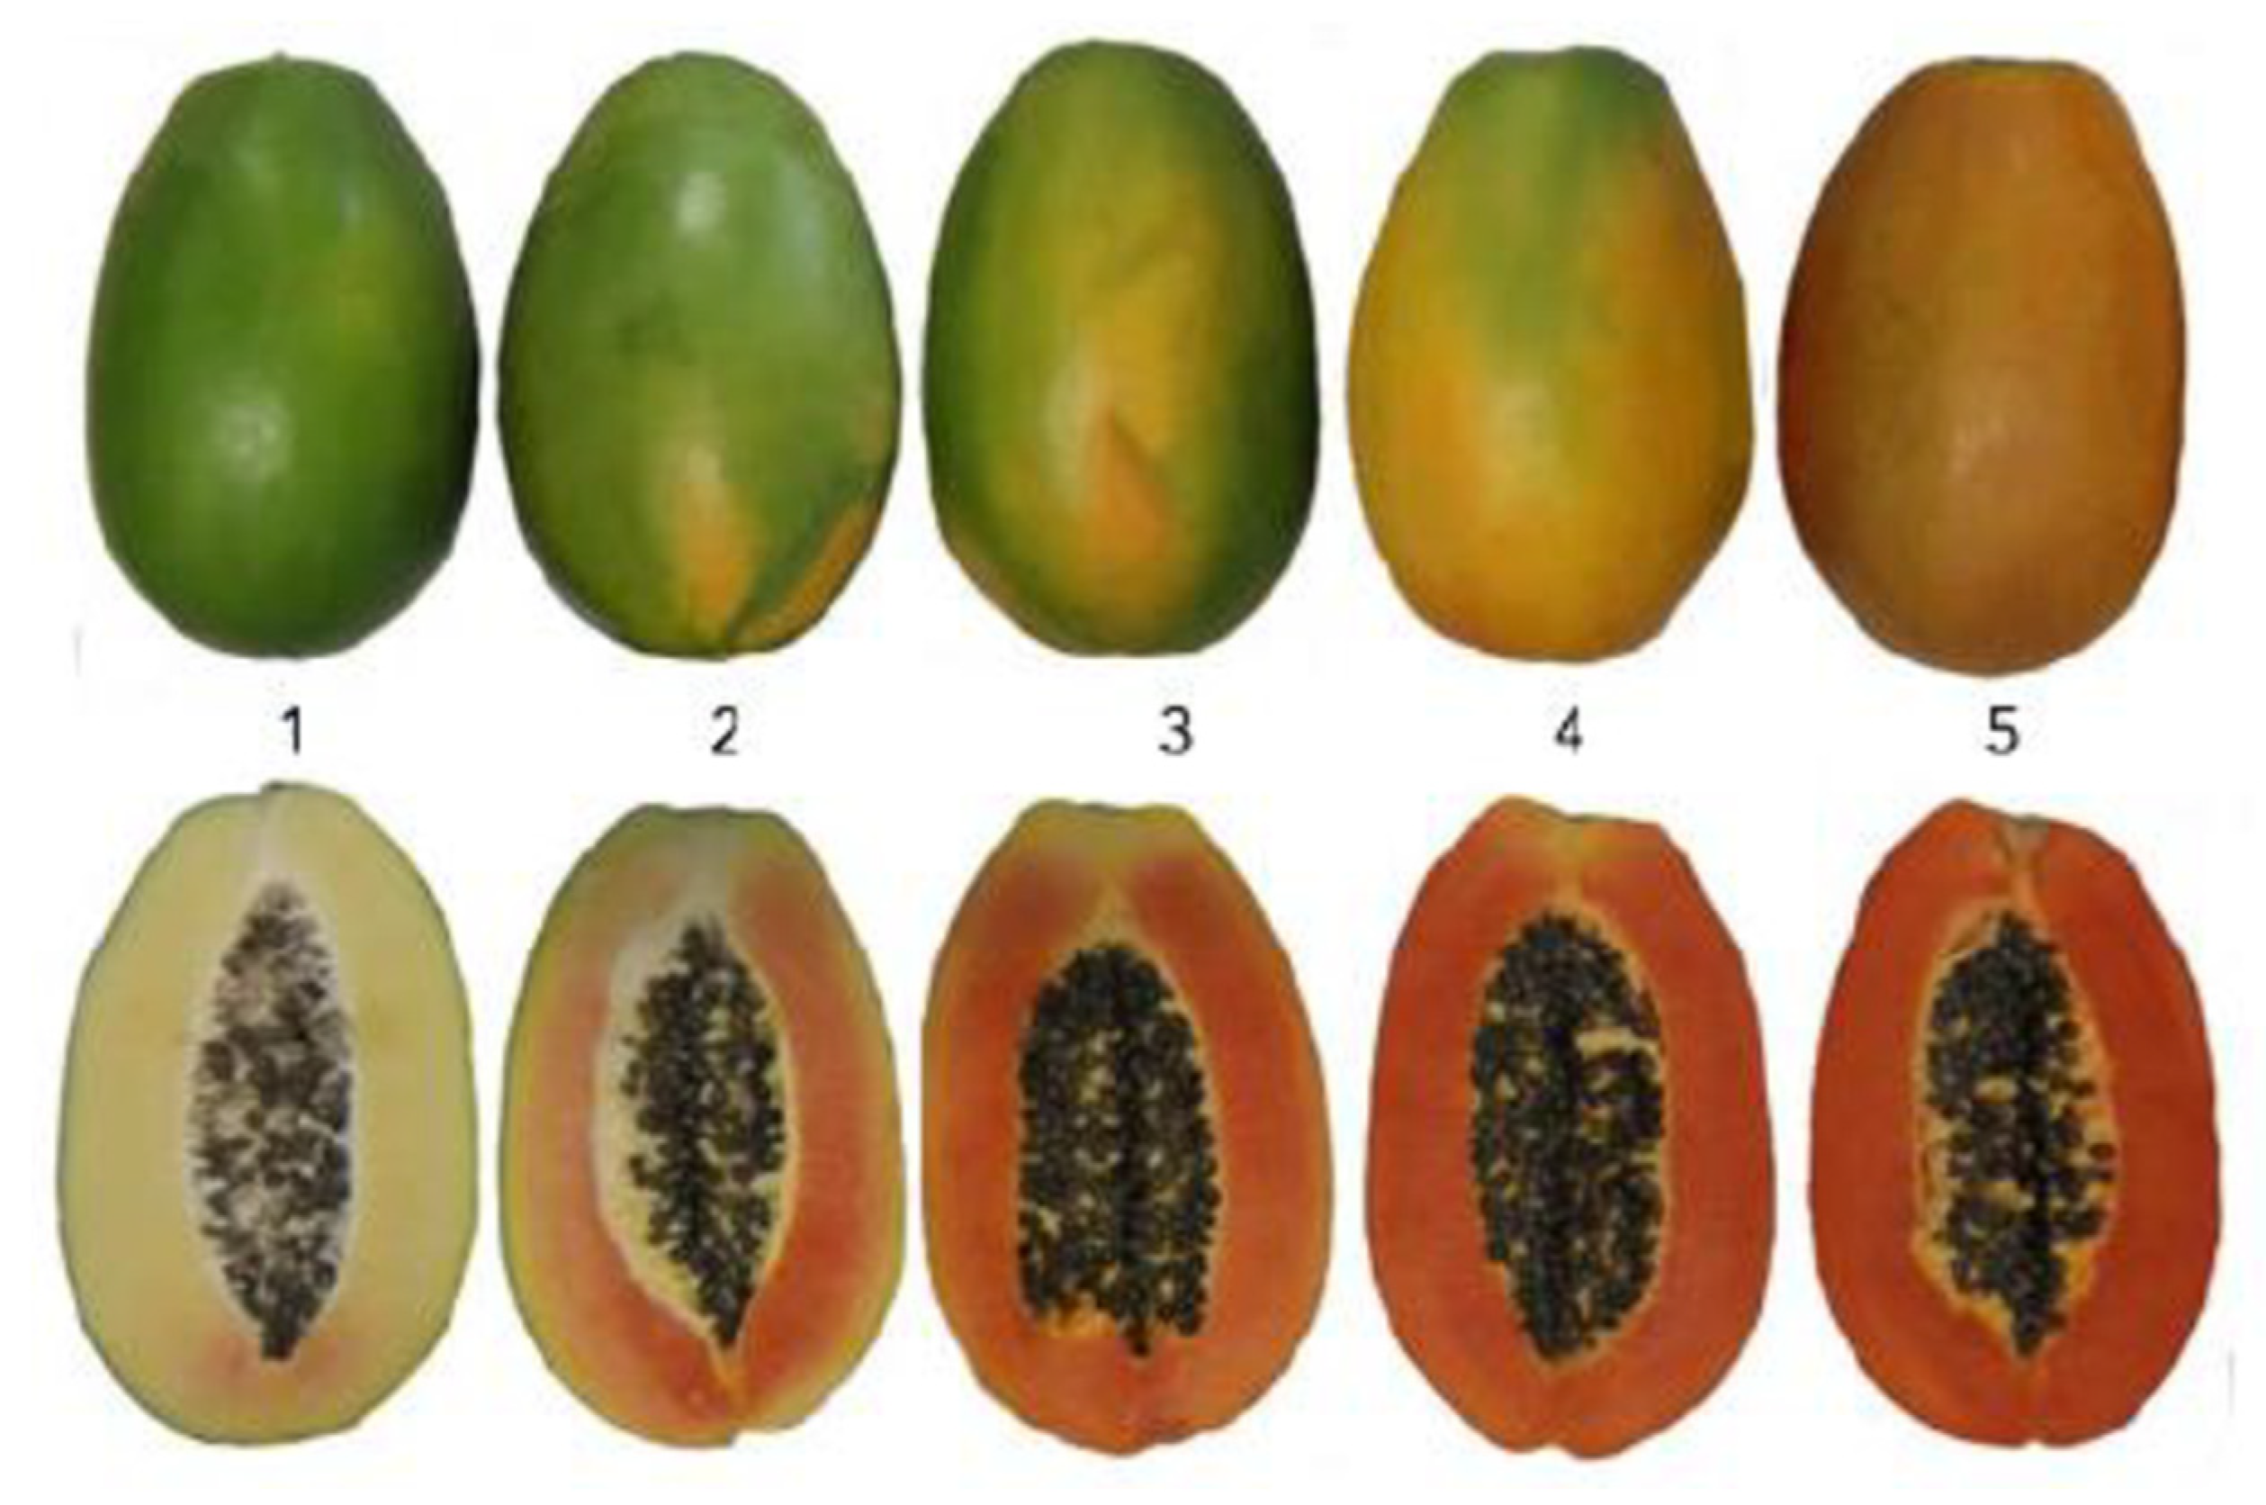
4.1. Plant Materials
4.2. RNA Extraction from ‘RB1’ and ‘1B’
4.3. Transcriptome Profiling of the ‘RB1’ and ‘1B’ Genomes
4.3.1. De Novo Assembly of the Transcriptome
4.3.2. Gene and Protein Annotations
4.4. Differential Expression (DE) Analysis
4.5. Validation of Gene Expression Using Reverse Transcription Quantitative Real-Time PCR (RT-qPCR)
4.6. RT-qPCR Data Analysis
5. Conclusions
Supplementary Materials
Author Contributions
Funding
Institutional Review Board Statement
Informed Consent Statement
Data Availability Statement
Conflicts of Interest
References
- Food and Agriculture Organization of the United States (FAO). FAOSTAT: Food Balances (2010). 2021. Available online: http://www.fao.org/faostat/en/#data/FBS (accessed on 20 October 2023).
- Innovation, H. Australian Horticulture Statistics Handbook 2022/23. Available online: https://www.horticulture.com.au/growers/help-your-business-grow/research-reports-publications-fact-sheets-and-more/grower-resources/ha18002-assets/australian-horticulture-statistics-handbook/ (accessed on 9 August 2022).
- Zhou, Z.; Bar, I.; Ford, R.; Smyth, H.; Kanchana-Udomkan, C. Biochemical, Sensory, and Molecular Evaluation of Flavour and Consumer Acceptability in Australian Papaya (Carica papaya L.) Varieties. Int. J. Mol. Sci. 2022, 23, 6313. [Google Scholar] [CrossRef]
- Gomez, M.; Lajolo, F.; Cordenunsi, B. Evolution of Soluble Sugars During Ripening of Papaya Fruit and its Relation to Sweet Taste. J. Food Sci. 2002, 67, 442–447. [Google Scholar] [CrossRef]
- Patrick, J.W.; Botha, F.C.; Birch, R.G. Metabolic engineering of sugars and simple sugar derivatives in plants. Plant Biotechnol. J. 2012, 11, 142–156. [Google Scholar] [CrossRef]
- Yamaki, S. Metabolism and Accumulation of Sugars Translocated to Fruit and Their Regulation. J. Jpn. Soc. Hortic. Sci. 2010, 79, 1–15. [Google Scholar] [CrossRef]
- Devitt, L.C.; Sawbridge, T.; Holton, T.A.; Mitchelson, K.; Dietzgen, R.G. Discovery of genes associated with fruit ripening in Carica papaya using expressed sequence tags. Plant Sci. 2006, 170, 356–363. [Google Scholar] [CrossRef]
- Yue, J.; VanBuren, R.; Liu, J.; Fang, J.; Zhang, X.; Liao, Z.; Wai, C.M.; Xu, X.; Chen, S.; Zhang, S.; et al. SunUp and Sunset genomes revealed impact of particle bombardment mediated transformation and domestication history in papaya. Nat. Genet. 2022, 54, 715–724. [Google Scholar] [CrossRef]
- Imşek, Ö.; Dönmez, D.; Aka Kacar, Y. RNA-Seq Analysis in Fruit Science: A Review. Am. J. Plant Biol. Spec. Issue Plant Mol. Biol. Biotechnol. 2017, 2, 1–7. [Google Scholar] [CrossRef]
- Sánchez-Sevilla, J.F.; Cruz-Rus, E.; Valpuesta, V.; Botella, M.A.; Amaya, I. Deciphering gamma-decalactone biosynthesis in strawberry fruit using a combination of genetic mapping, RNA-Seq and eQTL analyses. BMC Genom. 2014, 15, 218. [Google Scholar] [CrossRef]
- Kanchana-udomkan, C.; Nantawan, U.; Ford, R. New Genetic Targets to Improve Quality in Papaya (PP15000); Hort Innovation: Sydney, NSW, Australia, 2018; p. 53. [Google Scholar]
- Wei, F.; Wing, R.A. A fruitful outcome to the papaya genome project. Genome Biol. 2008, 9, 227. [Google Scholar] [CrossRef]
- Gramss, G.; Rudeschko, O. Activities of oxidoreductase enzymes in tissue extracts and sterile root exudates of three crop plants, and some properties of the peroxidase component. New Phytol. 1998, 138, 401–409. [Google Scholar] [CrossRef]
- Pino, J.A.; Almora, K.; Marbot, R. Volatile components of papaya (Carica papaya L., Maradol variety) fruit. Flavour Fragr. J. 2003, 18, 492–496. [Google Scholar] [CrossRef]
- Kanehisa, M.; Sato, Y.; Kawashima, M. KEGG mapping tools for uncovering hidden features in biological data. Protein Sci. 2021, 31, 47–53. [Google Scholar] [CrossRef]
- Zhou, L.; Paull, R.E. Sucrose Metabolism during Papaya (Carica papaya) Fruit Growth and Ripening. J. Am. Soc. Hortic. Sci. 2001, 126, 351–357. [Google Scholar] [CrossRef]
- Singh, G.; Verma, A.K.; Kumar, V. Catalytic properties, functional attributes and industrial applications of β-glucosidases. 3 Biotech 2015, 6, 3. [Google Scholar] [CrossRef]
- Wijaya, C.H.; Chen, F. Flavour of Papaya (Carica papaya L.) fruit. BIOTROPIA Southeast Asian J. Trop. Biol. 2013, 20, 1. [Google Scholar] [CrossRef]
- Barleben, L.; Ma, X.; Koepke, J.; Peng, G.; Michel, H.; Stöckigt, J. Expression, purification, crystallization and preliminary X-ray analysis of strictosidine glucosidase, an enzyme initiating biosynthetic pathways to a unique diversity of indole alkaloid skeletons. Biochim. Biophys. Acta (BBA) Proteins Proteom. 2004, 1747, 89–92. [Google Scholar] [CrossRef]
- Larsbrink, J.; Rogers, T.E.; Hemsworth, G.R.; McKee, L.S.; Tauzin, A.S.; Spadiut, O.; Klinter, S.; Pudlo, N.A.; Urs, K.; Koropatkin, N.M.; et al. A discrete genetic locus confers xyloglucan metabolism in select human gut Bacteroidetes. Nature 2014, 506, 498–502. [Google Scholar] [CrossRef]
- Kanehisa, M.; Goto, S. KEGG: Kyoto Encyclopedia of Genes and Genomes. Nucleic Acids Res. 2000, 28, 27–30. [Google Scholar] [CrossRef]
- Abdallah, I.I.; Quax, W.J. A Glimpse into the Biosynthesis of Terpenoids. KnE Life Sci. 2017, 3, 81–98. [Google Scholar] [CrossRef]
- Loza-Tavera, H. Monoterpenes in Essential Oils: Biosynthesis and Properties. In Chemicals via Higher Plant Bioengineering; Springer: Boston, MA, USA, 1999; Volume 464, pp. 49–62. [Google Scholar] [CrossRef]
- Yang, D.; Du, X.; Liang, X.; Han, R.; Liang, Z.; Liu, Y.; Liu, F.; Zhao, J. Different Roles of the Mevalonate and Methylerythritol Phosphate Pathways in Cell Growth and Tanshinone Production of Salvia miltiorrhiza Hairy Roots. PLoS ONE 2012, 7, e46797. [Google Scholar] [CrossRef]
- Hampel, D.; Mosandl, A.; Wüst, M. Biosynthesis of mono- and sesquiterpenes in carrot roots and leaves (Daucus carota L.): Metabolic cross talk of cytosolic mevalonate and plastidial methylerythritol phosphate pathways. Phytochemistry 2005, 66, 305–311. [Google Scholar] [CrossRef]
- Battilana, J.; Emanuelli, F.; Gambino, G.; Gribaudo, I.; Gasperi, F.; Boss, P.K.; Grando, M.S. Functional effect of grapevine 1-deoxy-D-xylulose 5-phosphate synthase substitution K284N on Muscat flavour formation. J. Exp. Bot. 2011, 62, 5497–5508. [Google Scholar] [CrossRef]
- Yang, X.; Guo, Y.; Zhu, J.; Shi, G.; Niu, Z.; Liu, Z.; Li, K.; Guo, X. Associations between the 1-deoxy-D-xylulose-5-phosphate synthase gene and aroma in different grapevine varieties. Genes Genom. 2017, 39, 1059–1067. [Google Scholar] [CrossRef]
- Duan, E.; Wang, Y.; Liu, L.; Zhu, J.; Zhong, M.; Zhang, H.; Li, S.; Ding, B.; Zhang, X.; Guo, X.; et al. Pyrophosphate: Fructose-6-phosphate 1-phosphotransferase (PFP) regulates carbon metabolism during grain filling in rice. Plant Cell Rep. 2016, 35, 1321–1331. [Google Scholar] [CrossRef]
- Groenewald, J.-H.; Botha, F.C. Molecular and kinetic characterisation of sugarcane pyrophosphate: Fructose-6-phosphate 1-phosphotransferase and its possible role in the sucrose accumulation phenotype. Funct. Plant Biol. 2007, 34, 517–525. [Google Scholar] [CrossRef]
- Hubbard, N.L.; Pharr, D.M.; Huber, S.C. Sucrose phosphate synthase and other sucrose metabolizing enzymes in fruits of various species. Physiol. Plant. 1991, 82, 191–196. [Google Scholar] [CrossRef]
- Tholl, D.; Sohrabi, R.; Huh, J.-H.; Lee, S. The biochemistry of homoterpenes—Common constituents of floral and herbivore-induced plant volatile bouquets. Phytochemistry 2011, 72, 1635–1646. [Google Scholar] [CrossRef]
- Herde, M.; Gartner, K.; Kollner, T.G.; Fode, B.; Boland, W.; Gershenzon, J.; Gatz, C.; Tholl, D. Identification and Regulation of TPS04/GES, an Arabidopsis Geranyllinalool Synthase Catalyzing the First Step in the Formation of the Insect-Induced Volatile C16-Homoterpene TMTT. Plant Cell 2008, 20, 1152–1168. [Google Scholar] [CrossRef]
- Pichersky, E.; Lewinsohn, E.; Croteau, R. Purification and Characterization of S-Linalool Synthase, an Enzyme Involved in the Production of Floral Scent in Clarkia breweri. Arch. Biochem. Biophys. 1995, 316, 803–807. [Google Scholar] [CrossRef]
- Freedman, A.; Weeks, N. Best Practices for De Novo Transcriptome Assembly with Trinity; FAS Informatics: Cambridge, MA, USA, 2020. [Google Scholar]
- Bolger, A.M.; Lohse, M.; Usadel, B. Trimmomatic: A Flexible Trimmer for Illumina Sequence Data. Bioinformatics 2014, 30, 2114–2120. [Google Scholar] [CrossRef]
- Haas, B.J.; Papanicolaou, A.; Yassour, M.; Grabherr, M.; Blood, P.D.; Bowden, J.; Couger, M.B.; Eccles, D.; Li, B.; Lieber, M.; et al. De novo transcript sequence reconstruction from RNA-seq using the Trinity platform for reference generation and analysis. Nat. Protoc. 2013, 8, 1494–1512. [Google Scholar] [CrossRef] [PubMed]
- Camacho, C.; Coulouris, G.; Avagyan, V.; Ma, N.; Papadopoulos, J.; Bealer, K.; Madden, T.L. BLAST+: Architecture and applications. BMC Bioinform. 2009, 10, 421. [Google Scholar] [CrossRef] [PubMed]
- Jones, P.; Binns, D.; Chang, H.-Y.; Fraser, M.; Li, W.; McAnulla, C.; McWilliam, H.; Maslen, J.; Mitchell, A.; Nuka, G.; et al. InterProScan 5: Genome-scale protein function classification. Bioinformatics 2014, 30, 1236–1240. [Google Scholar] [CrossRef] [PubMed]
- Law, C.W.; Alhamdoosh, M.; Su, S.; Dong, X.; Tian, L.; Smyth, G.K.; Ritchie, M.E. RNA-seq analysis is easy as 1-2-3 with limma, Glimma and edgeR. F1000Research 2018, 5, 1408. [Google Scholar] [CrossRef]
- Love, M.I.; Huber, W.; Anders, S. Moderated estimation of fold change and dispersion for RNA-seq data with DESeq2. Genome Biol. 2014, 15, 550. [Google Scholar] [CrossRef] [PubMed]
- Benjamini, Y.; Hochberg, Y. Controlling the False Discovery Rate: A Practical and Powerful Approach to Multiple Testing. J. R. Stat. Soc. Ser. B Methodol. 1995, 57, 289–300. [Google Scholar] [CrossRef]
- Yu, G.; Wang, L.-G.; Han, Y.; He, Q.-Y. clusterProfiler: An R Package for Comparing Biological Themes Among Gene Clusters. Omics J. Integr. Biol. 2012, 16, 284–287. [Google Scholar] [CrossRef]
- Zhu, X.; Li, X.; Chen, W.; Chen, J.; Lu, W.; Chen, L.; Fu, D. Evaluation of New Reference Genes in Papaya for Accurate Transcript Normalization under Different Experimental Conditions. PLoS ONE 2012, 7, e44405. [Google Scholar] [CrossRef]
- Ruijter, J.M.; Villalba, A.R.; Hellemans, J.; Untergasser, A.; Hoff, M.J.v.D. Removal of between-run variation in a multi-plate qPCR experiment. Biomol. Detect. Quantif. 2015, 5, 10–14. [Google Scholar] [CrossRef]
- Pfaffl, M.W. A new mathematical model for relative quantification in real-time RT-PCR. Nucleic Acids Res. 2001, 29, e45. [Google Scholar] [CrossRef]


| Feature | Value |
|---|---|
| Mean sequence quality (phred score) | 36 |
| Total assembled bases (n) | 3.67 × 10⁸ |
| Total assembled contigs (n) | 180,368 |
| Average contig length (bp) | 2033.27 |
| Median contig length (bp) | 1345 |
| Longest contig length (bp) | 26,587 |
| Contig N50 (bp) | 3555 |
| Contig N75 (bp) | 2083 |
| Contig Ex90N50 (bp) | 2450 |
| Assembly GC content (%) | 47.04 |
| Mean alignment rate to de novo assembled genome | 98.18% |
| Mean alignment rate to the non-GMO ‘sunset’ genome | 81.17% |
| Candidate Genes | Corresponding Pathway | Potential Functions |
|---|---|---|
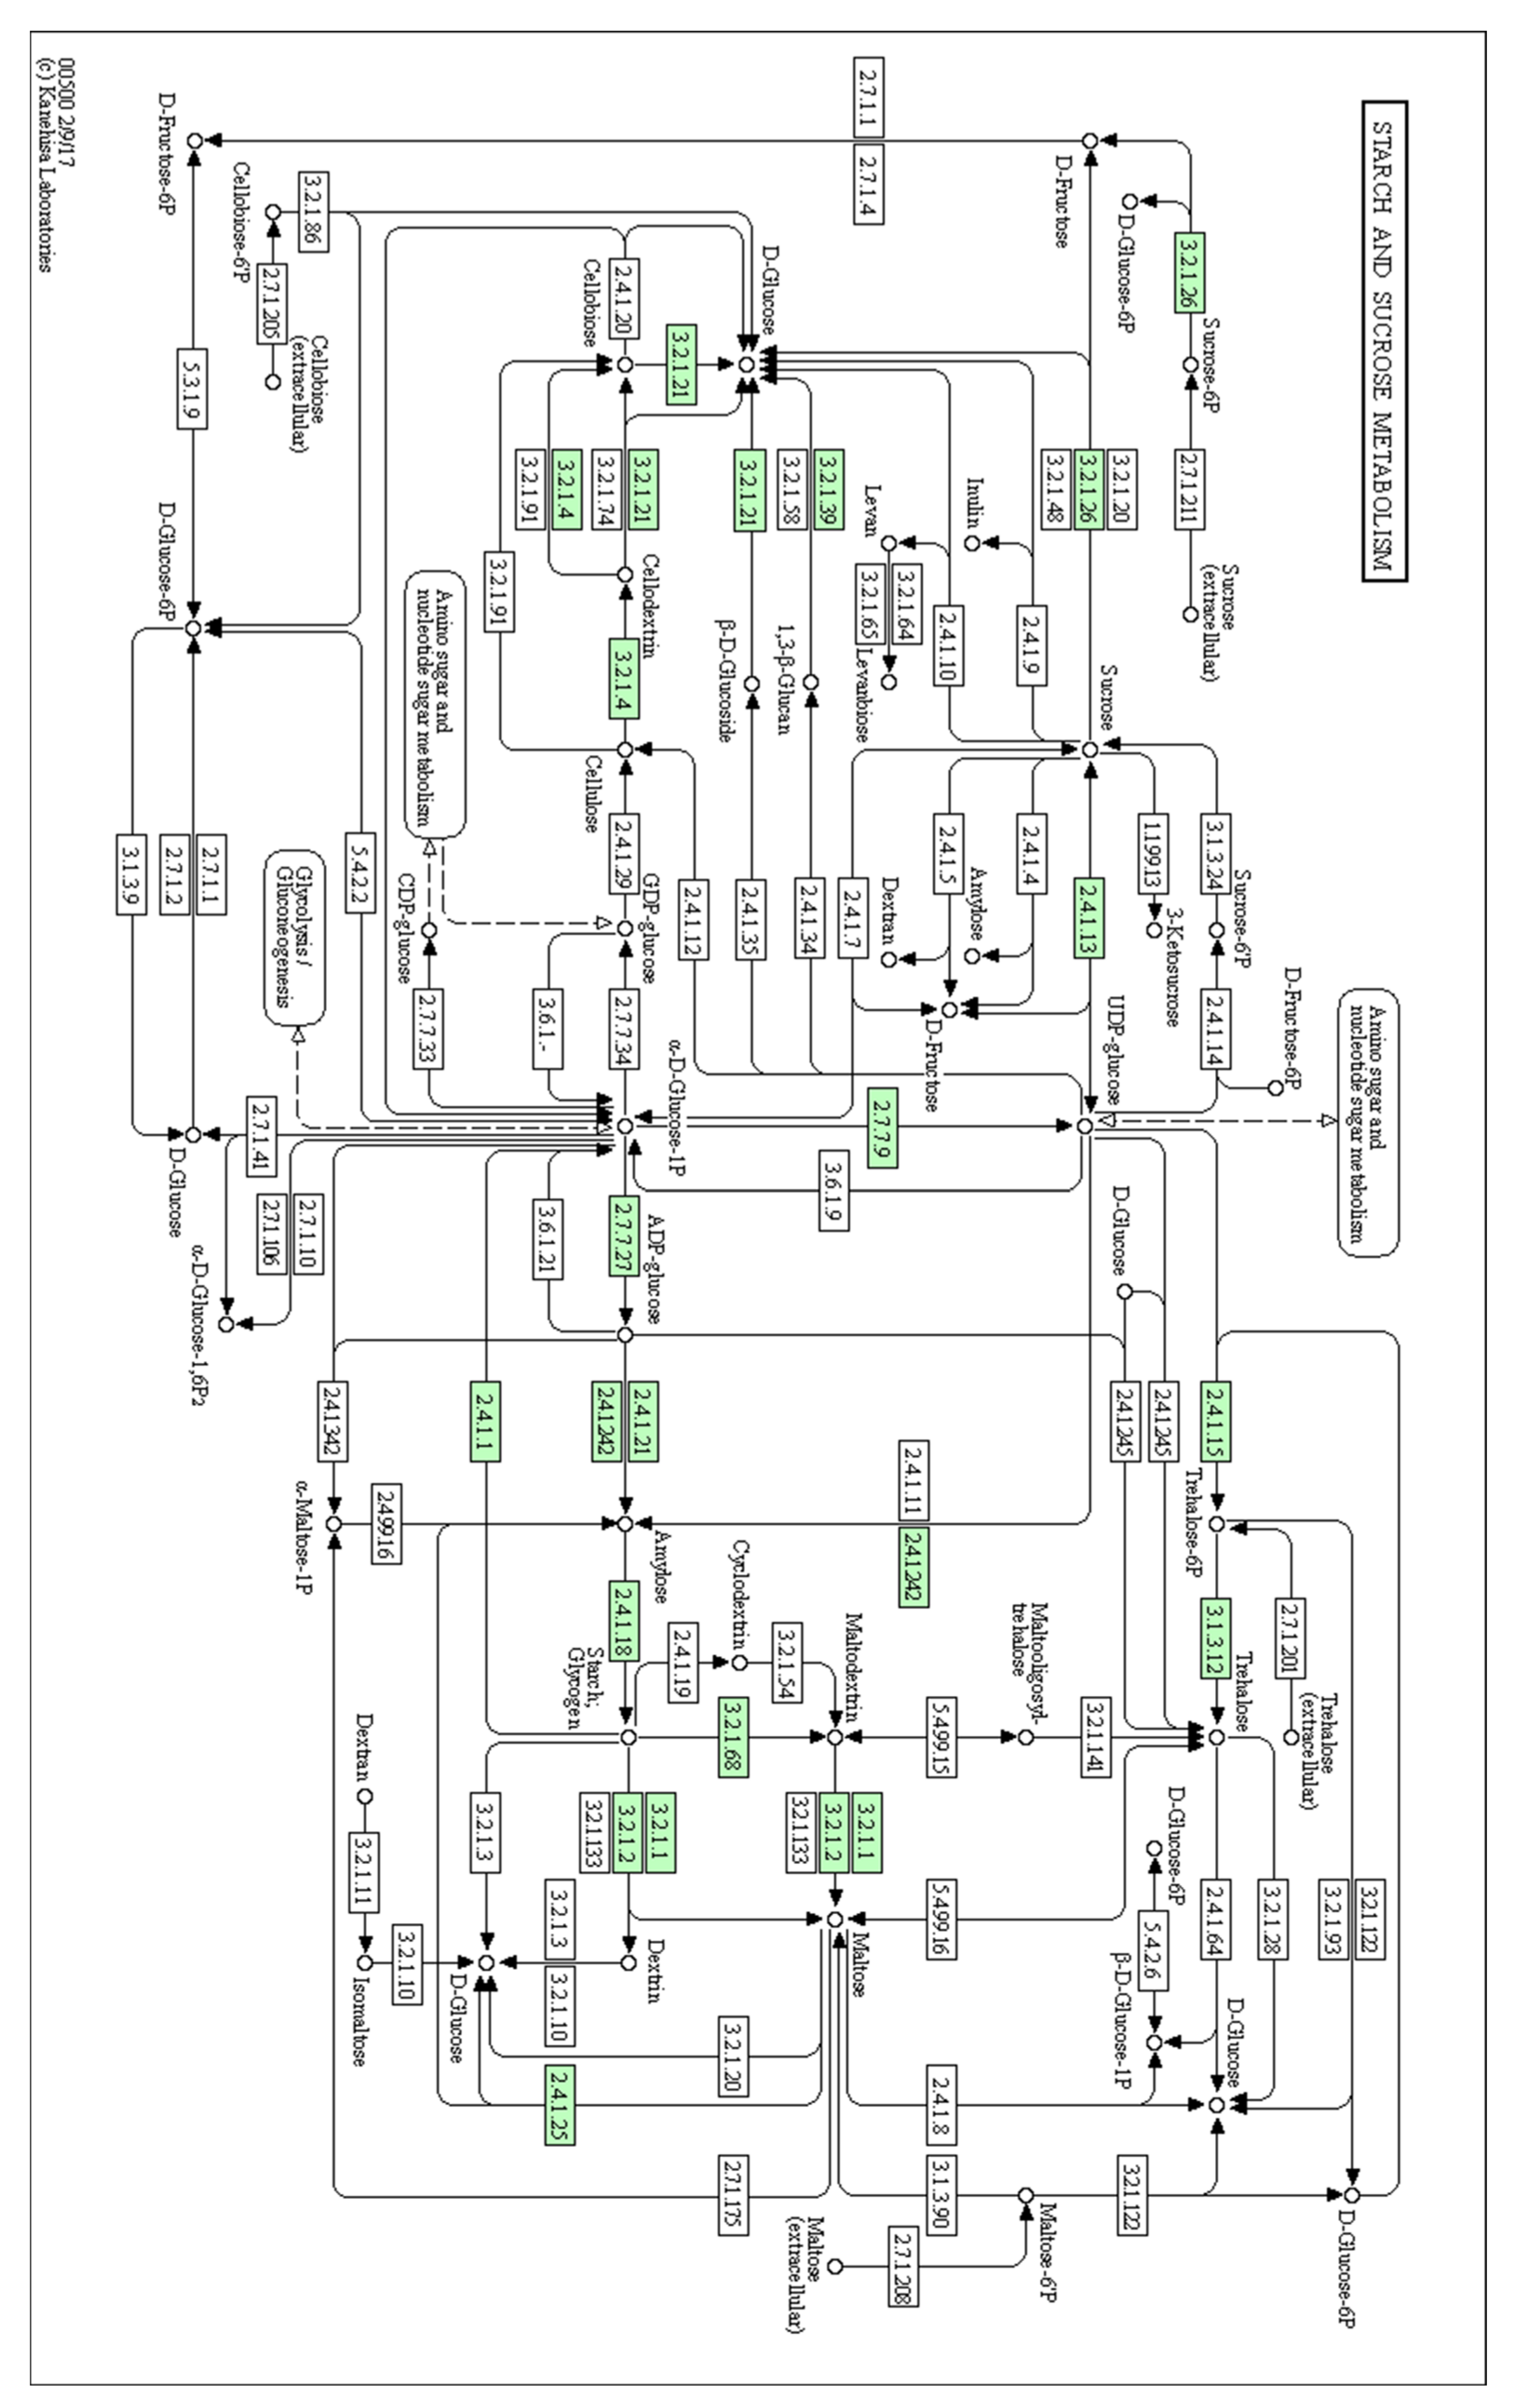
| cpBGH3B | Starch and sucrose metabolism pathway | Involved in the degradation of cellulose to glucose |
| cpPFP | Fructose and mannose metabolism | Catalyses reversible interconversion between fructose-6-phosphate and fructose-1,6-bisphosphate |
| cpSUS | Starch and sucrose metabolism pathway | Catalyses the reversible cleavage of sucrose into fructose |
| cpGES | Diterpenoid biosynthesis pathway | A precursor to the volatile compound TMTT, which has a floral odour |
| cpLIS | Monoterpenoid biosynthesis pathway | A precursor of (3S)-linalool, which has a floral scent |
Disclaimer/Publisher’s Note: The statements, opinions and data contained in all publications are solely those of the individual author(s) and contributor(s) and not of MDPI and/or the editor(s). MDPI and/or the editor(s) disclaim responsibility for any injury to people or property resulting from any ideas, methods, instructions or products referred to in the content. |
© 2024 by the authors. Licensee MDPI, Basel, Switzerland. This article is an open access article distributed under the terms and conditions of the Creative Commons Attribution (CC BY) license (https://creativecommons.org/licenses/by/4.0/).
Share and Cite
Zhou, Z.; Kanchana-udomkan, C.; Ford, R.; Bar, I. Identification and Validation of Key Genes Related to Preferred Flavour Profiles in Australian Commercial Papaya (Carica papaya L.). Int. J. Mol. Sci. 2024, 25, 3046. https://doi.org/10.3390/ijms25053046
Zhou Z, Kanchana-udomkan C, Ford R, Bar I. Identification and Validation of Key Genes Related to Preferred Flavour Profiles in Australian Commercial Papaya (Carica papaya L.). International Journal of Molecular Sciences. 2024; 25(5):3046. https://doi.org/10.3390/ijms25053046
Chicago/Turabian StyleZhou, Ziwei, Chutchamas Kanchana-udomkan, Rebecca Ford, and Ido Bar. 2024. "Identification and Validation of Key Genes Related to Preferred Flavour Profiles in Australian Commercial Papaya (Carica papaya L.)" International Journal of Molecular Sciences 25, no. 5: 3046. https://doi.org/10.3390/ijms25053046
APA StyleZhou, Z., Kanchana-udomkan, C., Ford, R., & Bar, I. (2024). Identification and Validation of Key Genes Related to Preferred Flavour Profiles in Australian Commercial Papaya (Carica papaya L.). International Journal of Molecular Sciences, 25(5), 3046. https://doi.org/10.3390/ijms25053046