Article

A Zebrafish-Based Platform for High-Throughput Epilepsy Modeling and Drug Screening in F0

by
Sílvia Locubiche
1,2,
Víctor Ordóñez
1,
Elena Abad
1,
Michele Scotto di Mase
1,
Vincenzo Di Donato
1,* and
Flavia De Santis
1,*
1
ZeClinics S.L., Carrer de Laureà Miró, 408-410, 08980 Sant Feliu de Llobregat, Spain
2
Faculty of Medicine and Health Sciences, Institute of Neurosciences, University of Barcelona, 08036 Barcelona, Spain
*
Authors to whom correspondence should be addressed.
Int. J. Mol. Sci. 2024, 25(5), 2991; https://doi.org/10.3390/ijms25052991
Submission received: 20 November 2023 / Revised: 22 February 2024 / Accepted: 29 February 2024 / Published: 4 March 2024
(This article belongs to the Special Issue Zebrafish as a Model in Human Disease 2.0)

Abstract

:
The zebrafish model has emerged as a reference tool for phenotypic drug screening. An increasing number of molecules have been brought from bench to bedside thanks to zebrafish-based assays over the last decade. The high homology between the zebrafish and the human genomes facilitates the generation of zebrafish lines carrying loss-of-function mutations in disease-relevant genes; nonetheless, even using this alternative model, the establishment of isogenic mutant lines requires a long generation time and an elevated number of animals. In this study, we developed a zebrafish-based high-throughput platform for the generation of F0 knock-out (KO) models and the screening of neuroactive compounds. We show that the simultaneous inactivation of a reporter gene (tyrosinase) and a second gene of interest allows the phenotypic selection of F0 somatic mutants (crispants) carrying the highest rates of mutations in both loci. As a proof of principle, we targeted genes associated with neurodevelopmental disorders and we efficiently generated de facto F0 mutants in seven genes involved in childhood epilepsy. We employed a high-throughput multiparametric behavioral analysis to characterize the response of these KO models to an epileptogenic stimulus, making it possible to employ kinematic parameters to identify seizure-like events. The combination of these co-injection, screening and phenotyping methods allowed us to generate crispants recapitulating epilepsy features and to test the efficacy of compounds already during the first days post fertilization. Since the strategy can be applied to a wide range of indications, this study paves the ground for high-throughput drug discovery and promotes the use of zebrafish in personalized medicine and neurotoxicity assessment.

1. Introduction

The zebrafish model has established itself as a reference tool for phenotypic drug screening. Over the last decade, an increasing number of molecules have reached clinical practice upon validation through zebrafish-based assays [1]. To date, several compounds screened through zebrafish-based platforms have been in different phases of clinical trials for a wide array of indications, including cancer, neurological disorders and cardiovascular pathologies [1,2]. The combination of disease modeling through the CRISPR/Cas9 system with different high-throughput phenotyping platforms have greatly contributed to shortening the time of preclinical compound testing in zebrafish larvae [3]. So far, most of the zebrafish-based drug discovery pipelines have been based on the use of isogenic lines carrying a mutation in the zebrafish orthologue of a human disease-associated gene [4,5].
Nevertheless, isogenic lines require a long generation time while, to date, novel genetic targets have been identified at a fast pace thanks to large-scale patient DNA sequencing studies [6]. Thus, high-throughput methods for the rapid generation of animal disease models are required in order to obtain, in a timely manner, preliminary data on the efficacy of compounds modulating the novel targets. Indeed, several strategies have been optimized to shorten the time required to (i) generate zebrafish genetic models, (ii) characterize their loss-of-function phenotype and (iii) perform target validation or drug screenings. The refinement of high-throughput genotyping approaches combined with the development of multiplex gene targeting in zebrafish embryos allow the assessment of the effect of a gene loss of function as early as in the F0 generation [7,8,9].The achievement of high rates of CRISPR/Cas9-mediated double-strand breaks in micro-injected zebrafish embryos promotes biallelic gene inactivation and, as a consequence, the generation of de facto mutants (defined as crispants) [8]. In fact, recent reports have validated the use of crispants in target prioritization and disease modeling in cardiovascular indications [10]. The crispants carrying the highest rate of loss-of-function mutations will behave as homozygous mutants, allowing the direct identification and analysis of mutant phenotypes, thus reducing the time and costs required to reach homozygous in the F2 generation [11]. Importantly, it has been also shown that continuous traits, with phenotypes varying within a continuous range, can be assessed in crispants, despite the diversity of null alleles in the F0 generation, and that multiple genes can be targeted at the same time in the same individual [12].
Nonetheless, although this kind of approach greatly reduces the time needed for functional genomic studies, it is still associated with a very high intra- and inter-individual variability. For this reason, to establish causality between the induced mutation and the observed phenotype, time-consuming individual genotyping has to be performed after injected larvae are analyzed.
The study of neurodevelopmental disorders (NDDs) is one of the research fields that might benefit more from the establishment of a robust pipeline allowing the assessment of gene function in F0 larvae. It has been estimated that NDDs affect up to 15% of children and adolescents worldwide and cause deficits in mental performance, adaptive behavior and motor skills [13]. The genetic causes underlying these disorders are extremely complex, since, although common molecular players have been identified [14], the nature of the disease-causing mutations is heterogeneous, resulting in variable clinical outcomes [15].
This is particularly true for epilepsy, which is regarded as an NDD due to the contribution of multiple developmental variables, including congenital brain abnormalities and aberrant neuronal signaling throughout embryonic life [16]. Epilepsy is one of the most common neurological disorders, with over 70 million people diagnosed worldwide [17,18]. This disorder is characterized by the appearance of seizures, a consequence of an imbalance between excitatory and inhibitory circuits, causing both cognitive and psychological impairment and increasing the risk of early death [18]. The etiology underlying this disease is variable, genetic mutations being one of the most important causes, resulting in defects in ion channels located in the neuronal membrane or alterations in other neuronal mechanisms [19]. Many pediatric epilepsy patients present frequent seizures, events that damage and alter their quality of life. Seizures can be provoked by various sensory inputs and when they are produced in response to light, color, or patterns, it is considered photosensitive epilepsy. Photosensitivity occurs in several epileptic syndromes, being particularly prevalent in genetic generalized epilepsies [20]. Moreover, several epilepsies are resistant to the treatments currently available, demonstrating the ongoing need to test novel anti-seizure medications (ASM). In the search for potentially effective ASM, several in vitro assays, involving cell culture, brain slice culture, organoids, or primary cultures of neurons, have been developed [21]. These approaches can be used for a detailed analysis of the effect of a given ASM at the cellular level. However, the use of these models makes it challenging to evaluate the toxicity and efficacy of compounds, since mechanisms such as drug metabolism or penetration through the blood–brain barrier cannot be readily assessed, thus limiting the obtained information. These considerations highlight the need to complement data obtained in vitro with in vivo models to perform a comprehensive evaluation of novel potentially therapeutic drugs under conditions closer to a whole-organism scenario. As such, in vivo evaluation systems have been extensively described, including the zebrafish [22].
Different structures of the central nervous system (CNS) of zebrafish, such as the telencephalon, the cerebellum, the spinal cord and the medulla oblongata are homologous to those in mammalian brains. In addition, the properties of neurons and neural circuits are conserved between zebrafish and mammals [23]. There are several reports on the use of zebrafish in epilepsy research based on drug-induced and genetically-induced seizures [24]. The gold standard pharmacological model relies on the administration of pentylenetetrazole (PTZ), a typical convulsant [25,26], determining an increase in locomotor activity and the appearance of a characteristic circular swimming pattern. Of all animal models for seizure and epilepsy, pentylenetetrazole-induced seizures are classified as a model for generalized seizures, as opposed to partial or focal seizures. As for the genetic model, the most widespread is a mutant of the scn1lab gene characterized by spontaneous seizures and altered behavior in zebrafish larvae that can be recorded by electrophysiology and are comparable to epilepsy in humans. These models have proven valuable for the validation of commonly used ASMs and the repurposing of novel compounds [4,27,28].
Taking into account the advantages that the zebrafish model provides and given the necessity of expanding the toolbox for modeling epilepsy, in order to streamline the discovery of novel ASMs, in this study we aimed for the establishment of a workflow allowing scientists to use somatic knock-out larvae to analyze the function of genes involved in the pathogenesis of childhood NDD. Our objective is to develop a zebrafish-based comprehensive platform enabling the functional validation of common and de novo rare loss-of-function mutations in a high-throughput fashion. To this end, we propose a strategy based on the generation of crispants, co-targeting the gene of interest with a reporter gene whose loss of function is associated with an easily detectable phenotype, the tyrosinase gene. Moreover, we coupled highly efficient gene inactivation with the automated analysis of the morphological developmental defects potentially induced by the gene inactivation and with a complex multiparametric behavioral analysis to describe seizure-like events. As proof of principle, we knocked out a group of six genes associated with childhood epilepsy, characterized their loss-of-function phenotype and proved their response to a selection of ASMs.

2. Results

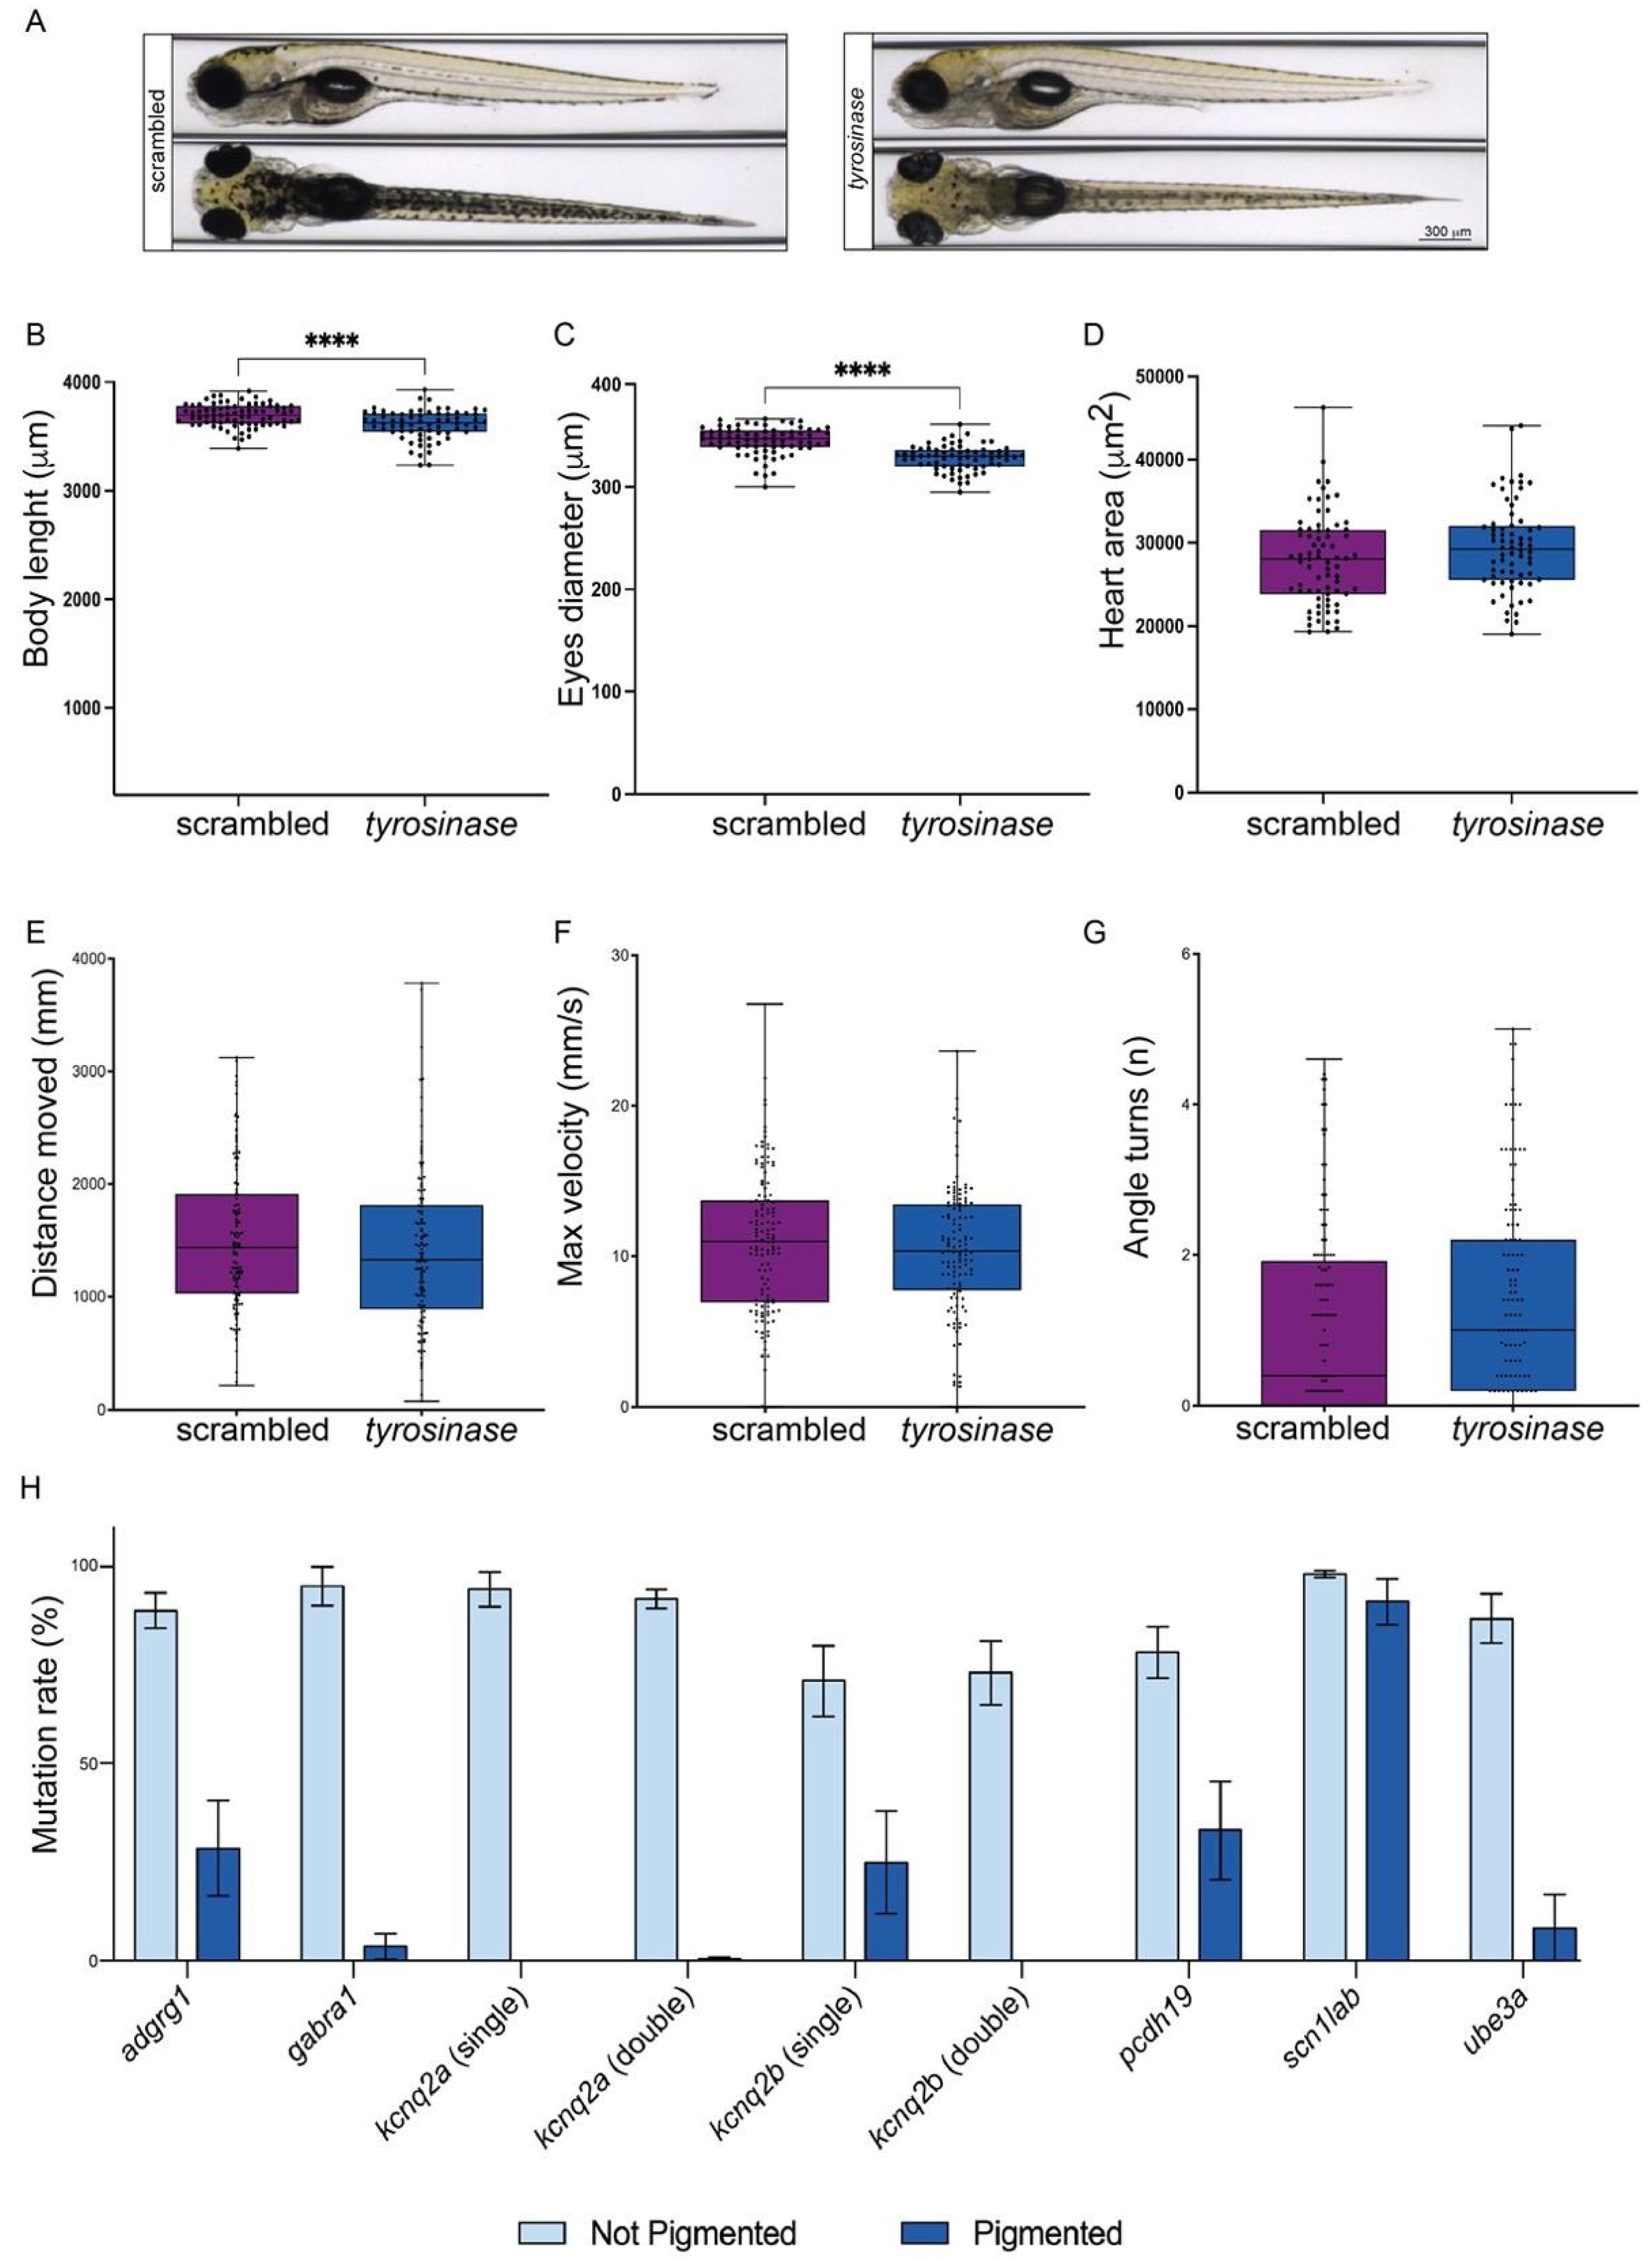
2.1. Tyrosinase Loss of Function Allows the Selection of Crispants Carrying High Rate of Mutations in Targeted Genes

To reduce variability and maximize the utility of an F0 knock-out approach, it is necessary to cluster together genetically homogeneous populations. To this end, distinguishing between larvae carrying high and low rates of mutations is needed. To be able to perform such selection, we hypothesized that, if two genes are targeted simultaneously, their sequences will undergo a comparable mutagenesis process and, as a consequence, the presence of a phenotype associated with the loss of function of one gene could be employed as a reporter for the efficient inactivation of the second gene. The rationale is that the efficiency of double-strand breaks (DSB) is largely related to the injection procedure and timing. As such, the embryo stage at the time of the injection as well as injection accuracy are critical to achieving high DSB rates. Therefore, a complete loss of function of the reporter gene might suggest correct injection timing and high injection accuracy. To this end, we thought to target, together with the candidate gene of interest, the tyrosinase (tyr) locus. The tyr gene encodes a protein involved in melanin production and its disruption results in the absence of pigmentation, an easily identifiable phenotype that could be employed to select larvae in which the CRISPR/Cas9 system has efficiently disrupted the target genomic sequences [29].
First, we wanted to prove that tyr inactivation does not cause side developmental phenotypes other than the expected pigmentation deficiency in zebrafish larvae. To exclude the occurrence of morphological developmental defects in tyr crispants, wild-type one-cell stage embryos were injected with a mix containing Cas9/scrambled-sgRNA or Cas9/tyr-sgRNA. As expected, starting from 48 hpf, embryos carrying biallelic mutations in the tyr gene could be identified by the absence of pigmentation. This difference became particularly clear at 120 hpf (Figure 1A). At this stage, we performed a comprehensive characterization of a panel of 9 qualitative (Table 1) and 3 quantitative (body length, eye diameter and heart area) phenotypes [30]. Importantly, we did not detect any significant morphological differences between scrambled and tyr crispants for qualitative phenotypes. A very mild but significant alteration was observed in the body length and eye diameter of tyrosinase crispants (mean ± SEM: Body length: scrambled = 3693 μm ± 12.1, n = 75; tyr = 3608 μm ± 16.51, n = 68. Eyes diameter: scrambled = 345 μm ± 1.6, n = 75; tyr = 328 μm ± 1.5, n = 68). In contrast, no differences were observed in the area of the heart chamber (mean ± SEM: scrambled = 27,880 μm2 ± 640.4, n = 75; tyr = 29,436 μm2 ± 645.7, n = 68) (Figure 1A–D, Table 1).
Having assessed the general morphology, we verified that larval locomotion and behavior were not affected by tyr loss of function. To this end, we analyzed the motor activity of crispants in response to different stimuli. We re-injected both scrambled and tyr-specific sgRNAs to track 120 hpf control and tyr crispants while they were exposed to different stimuli. In the first phase of the trial, larvae were exposed to alternating dark/light cycles. It has been observed that zebrafish have a stereotyped behavior in which they tend to increase their locomotion during the dark phases and rest during the light period [31,32]. Therefore, this step of the trial allowed us to evaluate larval locomotion (total distance moved (mm)), spotting potential motor defects. The second half of the trial was focused on identifying light-induced seizures. Flashlight stimulus has been previously described as a seizure-inducing stimulus, showing an improvement in the detection of convulsant behaviors when compared with other paradigms [24]. The manifestation of convulsive seizures is evaluated as the happening of erratic movement and quantified by an increased swimming velocity and a heightened number of changes in the trajectory. In both parts of the test, tyr crispants did not show any significant difference when compared to control crispants (mean ± SEM: Total distance moved: scrambled = 1511 mm ± 57.30, n = 126; tyr = 1399 mm ± 63.75, n = 122. Maximum velocity: scrambled = 10.83 mm/s ± 0.42, n = 127; tyr = 10.29 mm/s ± 0.4, n = 121. Number of turns: scrambled = 1.1 ± 0.12, n= 117; tyr = 1.4 ± 0.13, n = 120) (Figure 1E–G). Therefore, our data confirm that tyr loss of function does not cause motor defects and does not induce epileptic seizures.
Having verified that tyr disruption does not affect larval morphology or behavior, we wanted to prove that the loss of pigmentation could be employed as a reporter for the efficient disruption of the coding sequence (CDS) of a second gene. We tested our approach on the zebrafish orthologues of six genes whose loss of function had been associated with different kinds of genetic epilepsy (Table 2). One of the epilepsy-associated genes (KCNQ2) has two orthologues in zebrafish (kcnq2a and kcnq2b). In this case, we generated three types of crispants: two single crispants where only one of the two paralogues was targeted (single crispants) and a double crispant in which both paralogues were simultaneously targeted.
To confirm our hypothesis, we injected one-cell stage wild-type embryos with a mix containing the Cas9 protein together with three sgRNAs (one targeting the tyr and two targeting one of the selected target genes). To verify that the mutation rates of the two targeted genes correlated, we extracted the genomic DNA from individual pigmented and unpigmented larvae and sequenced the second locus targeted (Supplementary Figure S1). As expected, un-pigmented larvae displayed a higher mutagenesis rate than the one observed in their pigmented siblings (mean ± SEM: adgrg1 not pigmented = 88.85 ± 4.4, n = 20; adgrg1 pigmented = 28.6 ± 12.14, n = 12; gabra1 not pigmented = 95 ± 5, n = 20; gabra1 pigmented = 3.7 ± 3.2, n = 12; kcnq2a (single crispants) not pigmented = 94.24 ± 4.5, n = 21; kcnq2a (single crispants) pigmented = 0 ± 0, n = 12; kcnq2a (double crispants) not pigmented = 91.74 ± 2.38, n = 21; kcnq2a (double crispants) pigmented = 0.538 ± 0.4, n = 13; kcnq2b (single crispants) not pigmented = 71.05 ± 8.93, n = 20; kcnq2b (single crispants) pigmented = 25 ± 13.056, n = 12; kcnq2b (double crispants) not pigmented = 73.11 ± 8.05, n = 19; kcnq2b (double crispants) pigmented = 0 ± 0, n = 12; pcdh19 not pigmented = 78.25 ± 6.5, n = 20; pcdh19 pigmented = 33.15 ± 12.5, n = 13; scn1lab not pigmented = 98.17 ± 0.9, n = 29; scn1lab pigmented = 91 ± 5.7, n = 11; ube3a not pigmented = 86.8 ± 6.18, n = 20; ube3a pigmented = 8.3 ± 8.3, n = 12) (Figure 1H). As previously described [29], the efficiency of the CRISPR/Cas9 machinery is locus-dependent, and we observed that different loci had a different susceptibility to the Cas9 endonuclease activity. Nevertheless, in all genes analyzed, more than 60% of unpigmented larvae displayed a mutation rate higher than 75% (Supplementary Figure S2), leading us to the conclusion that it is possible to use tyr loss of function as a reliable reporter for Cas9 cutting efficiency.

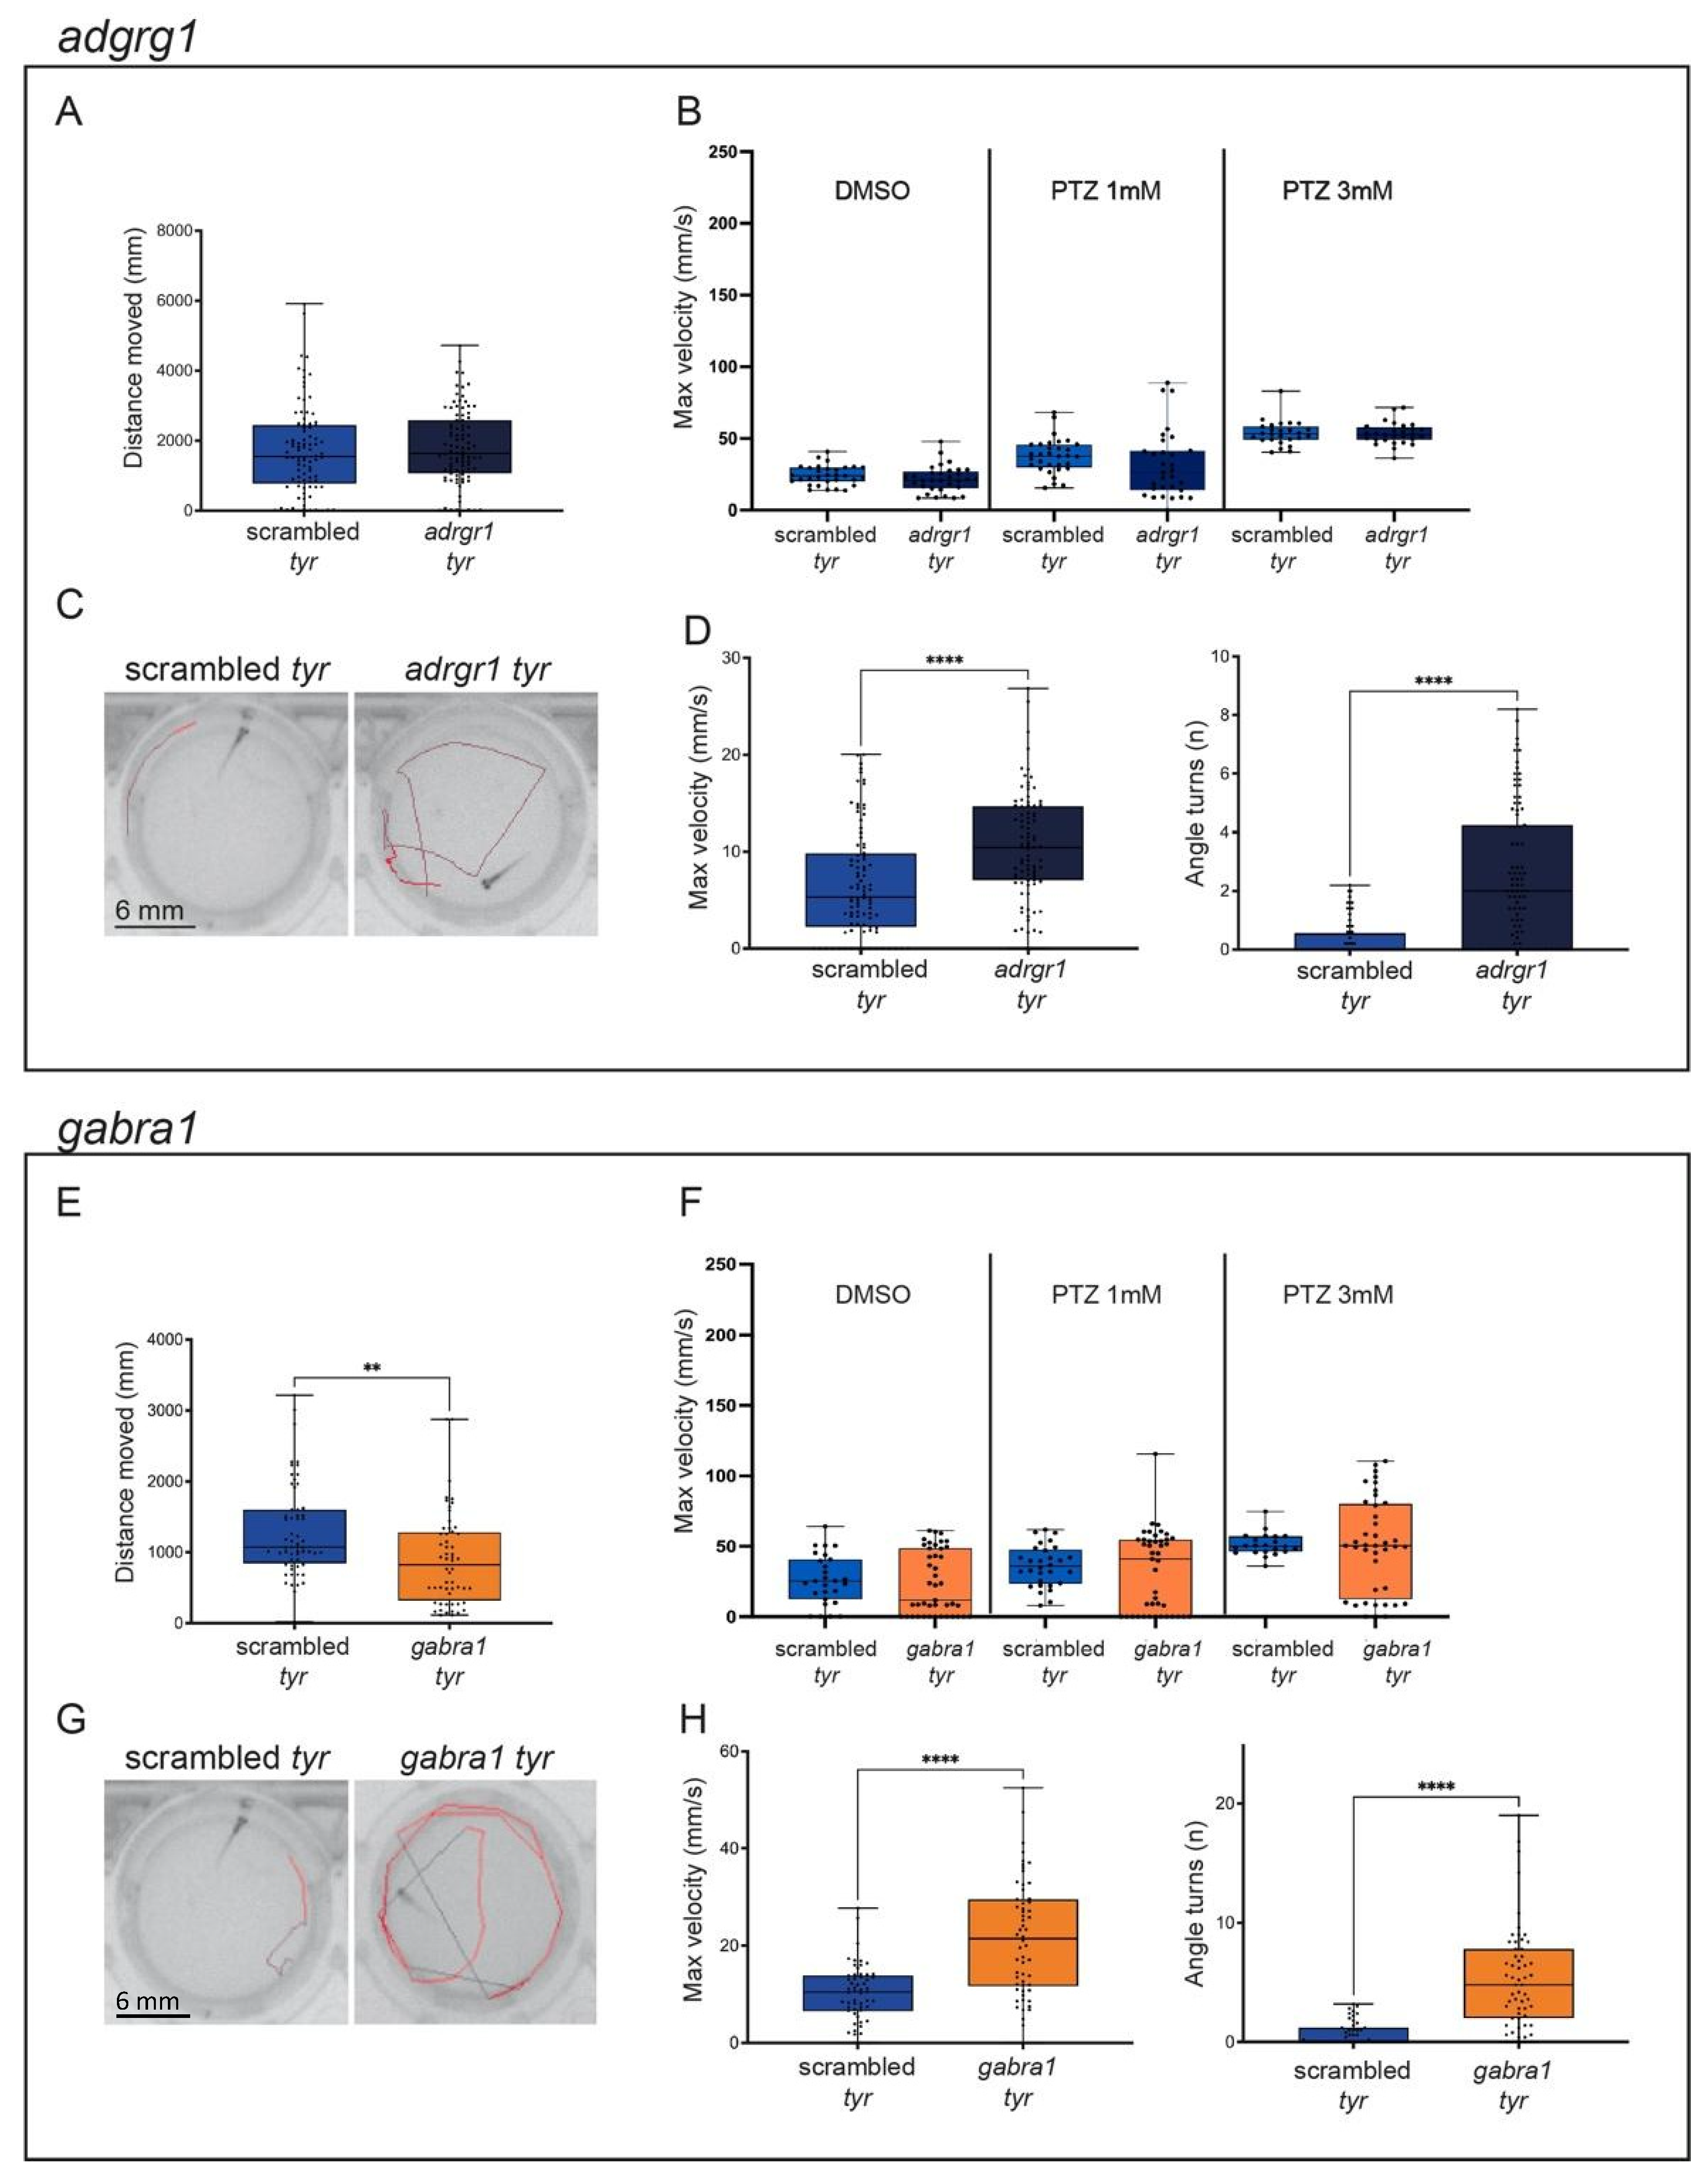
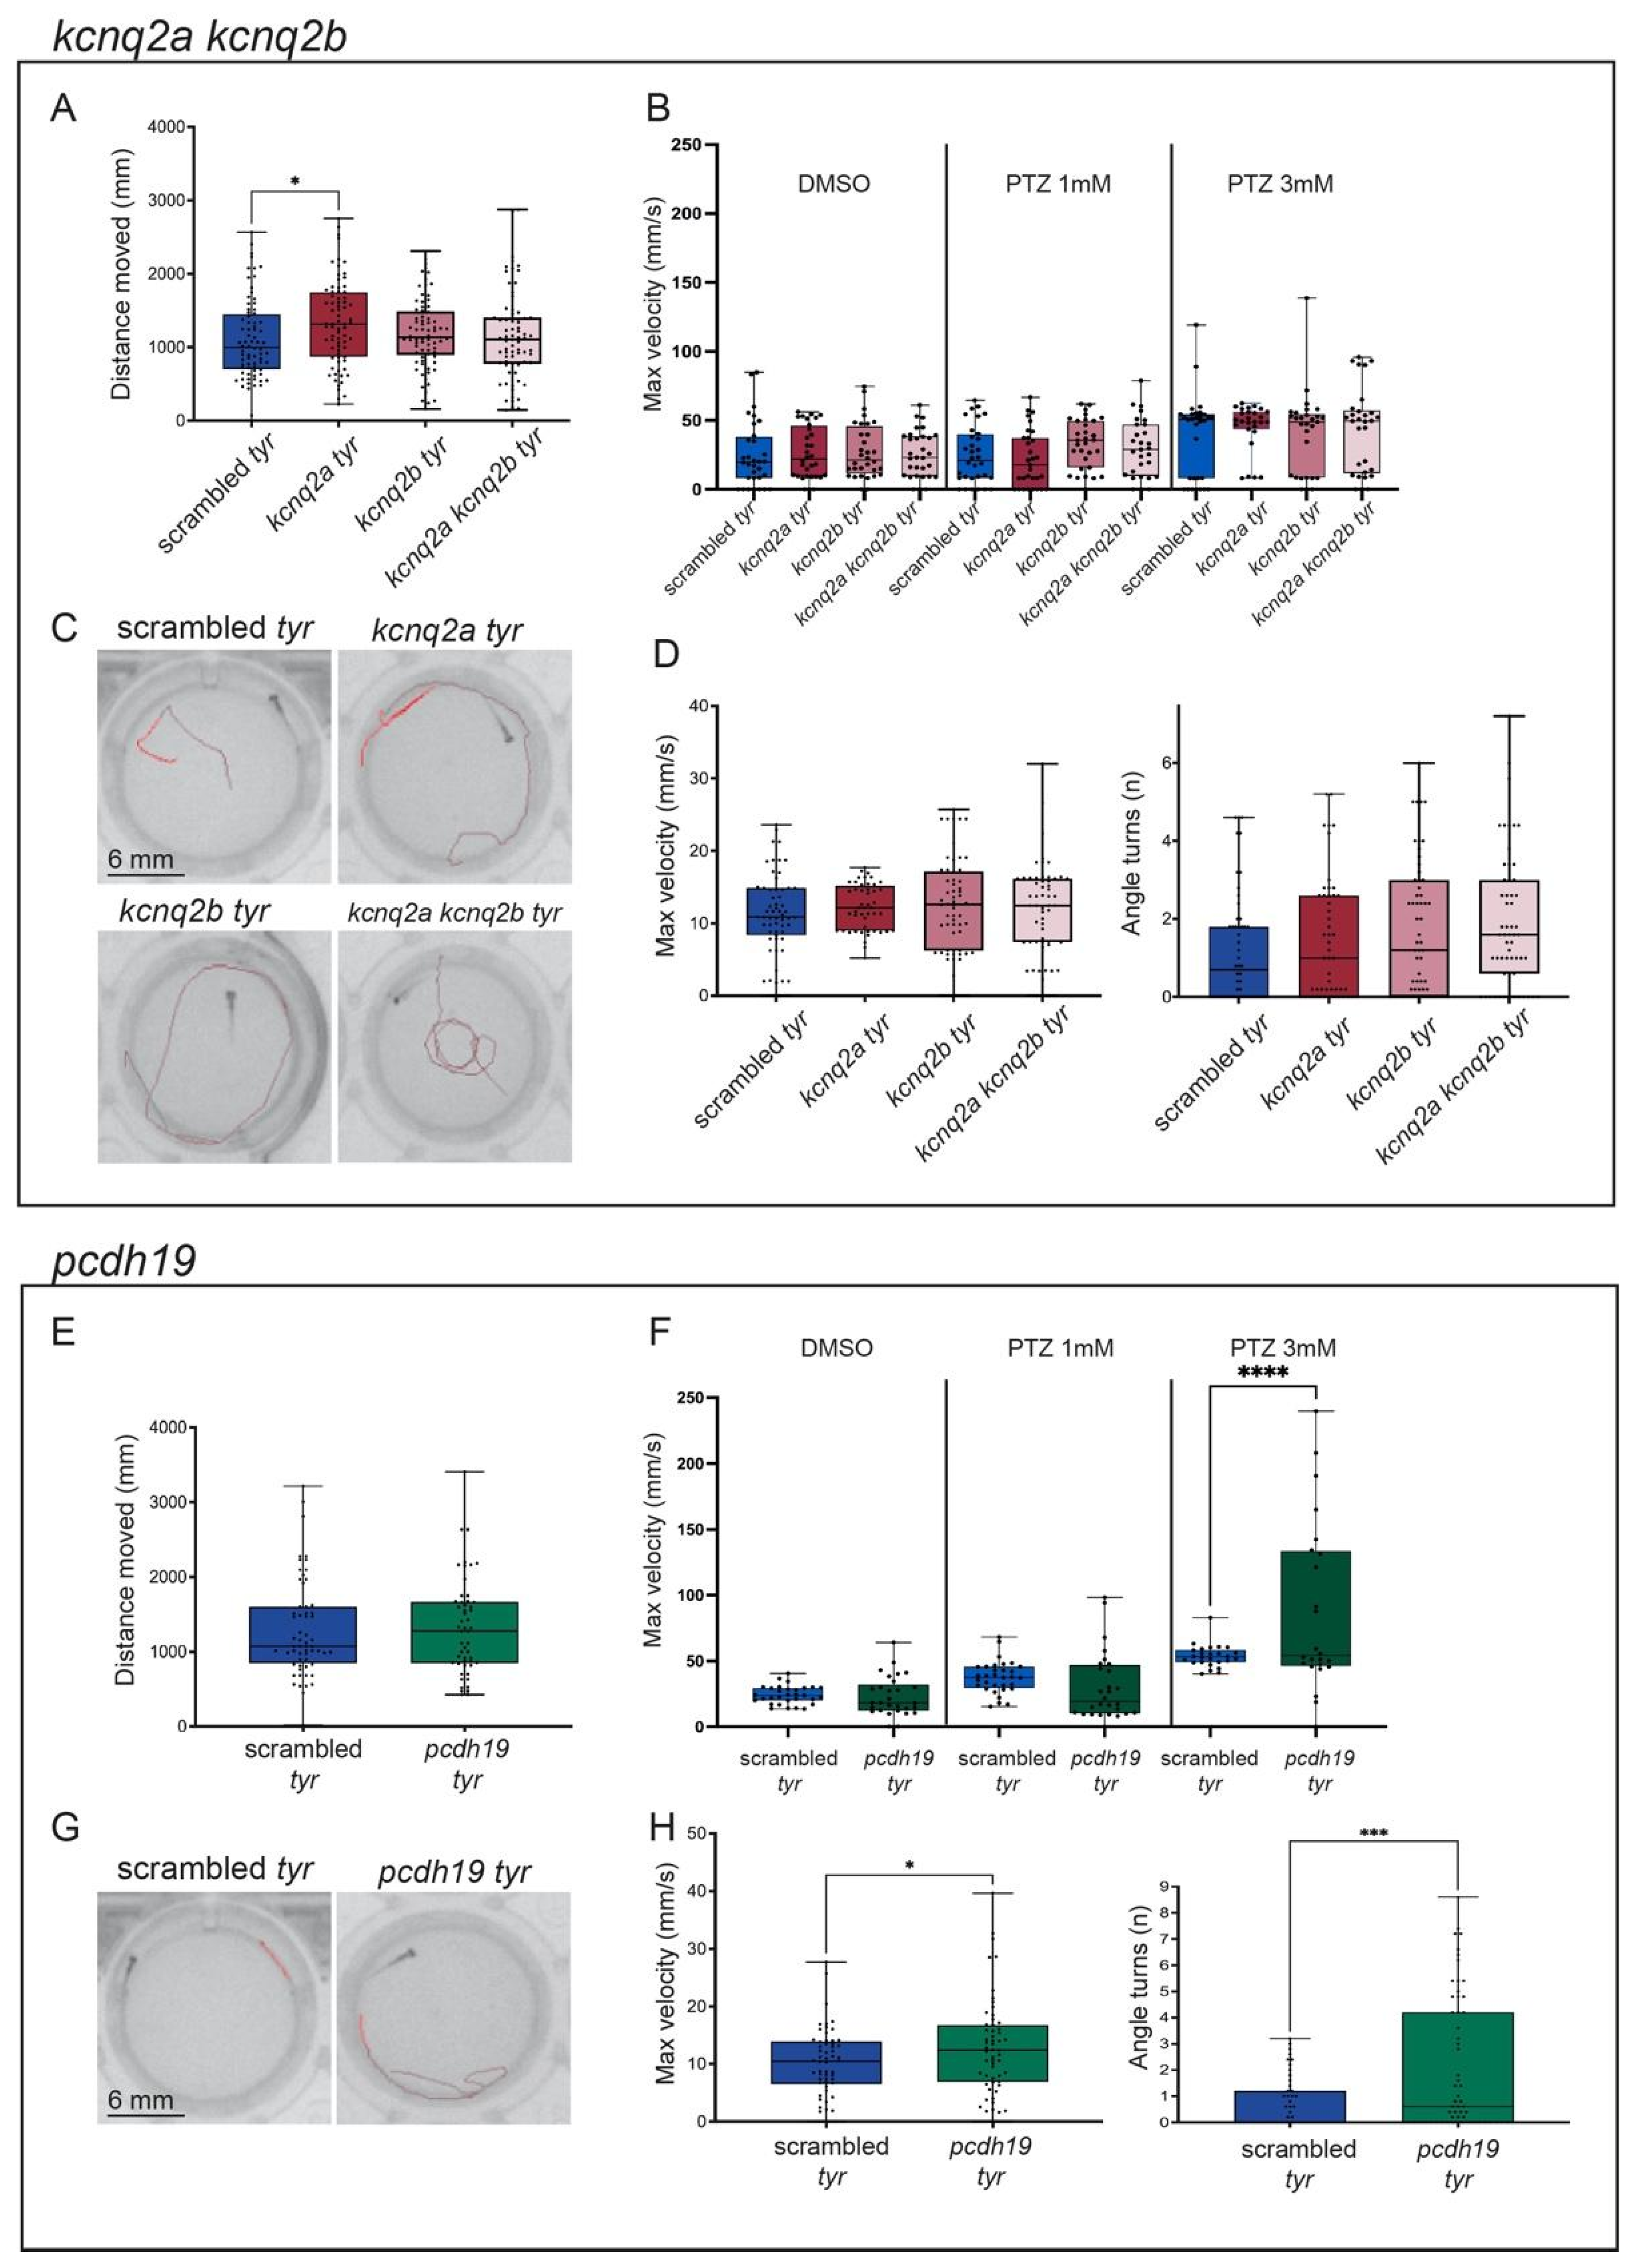
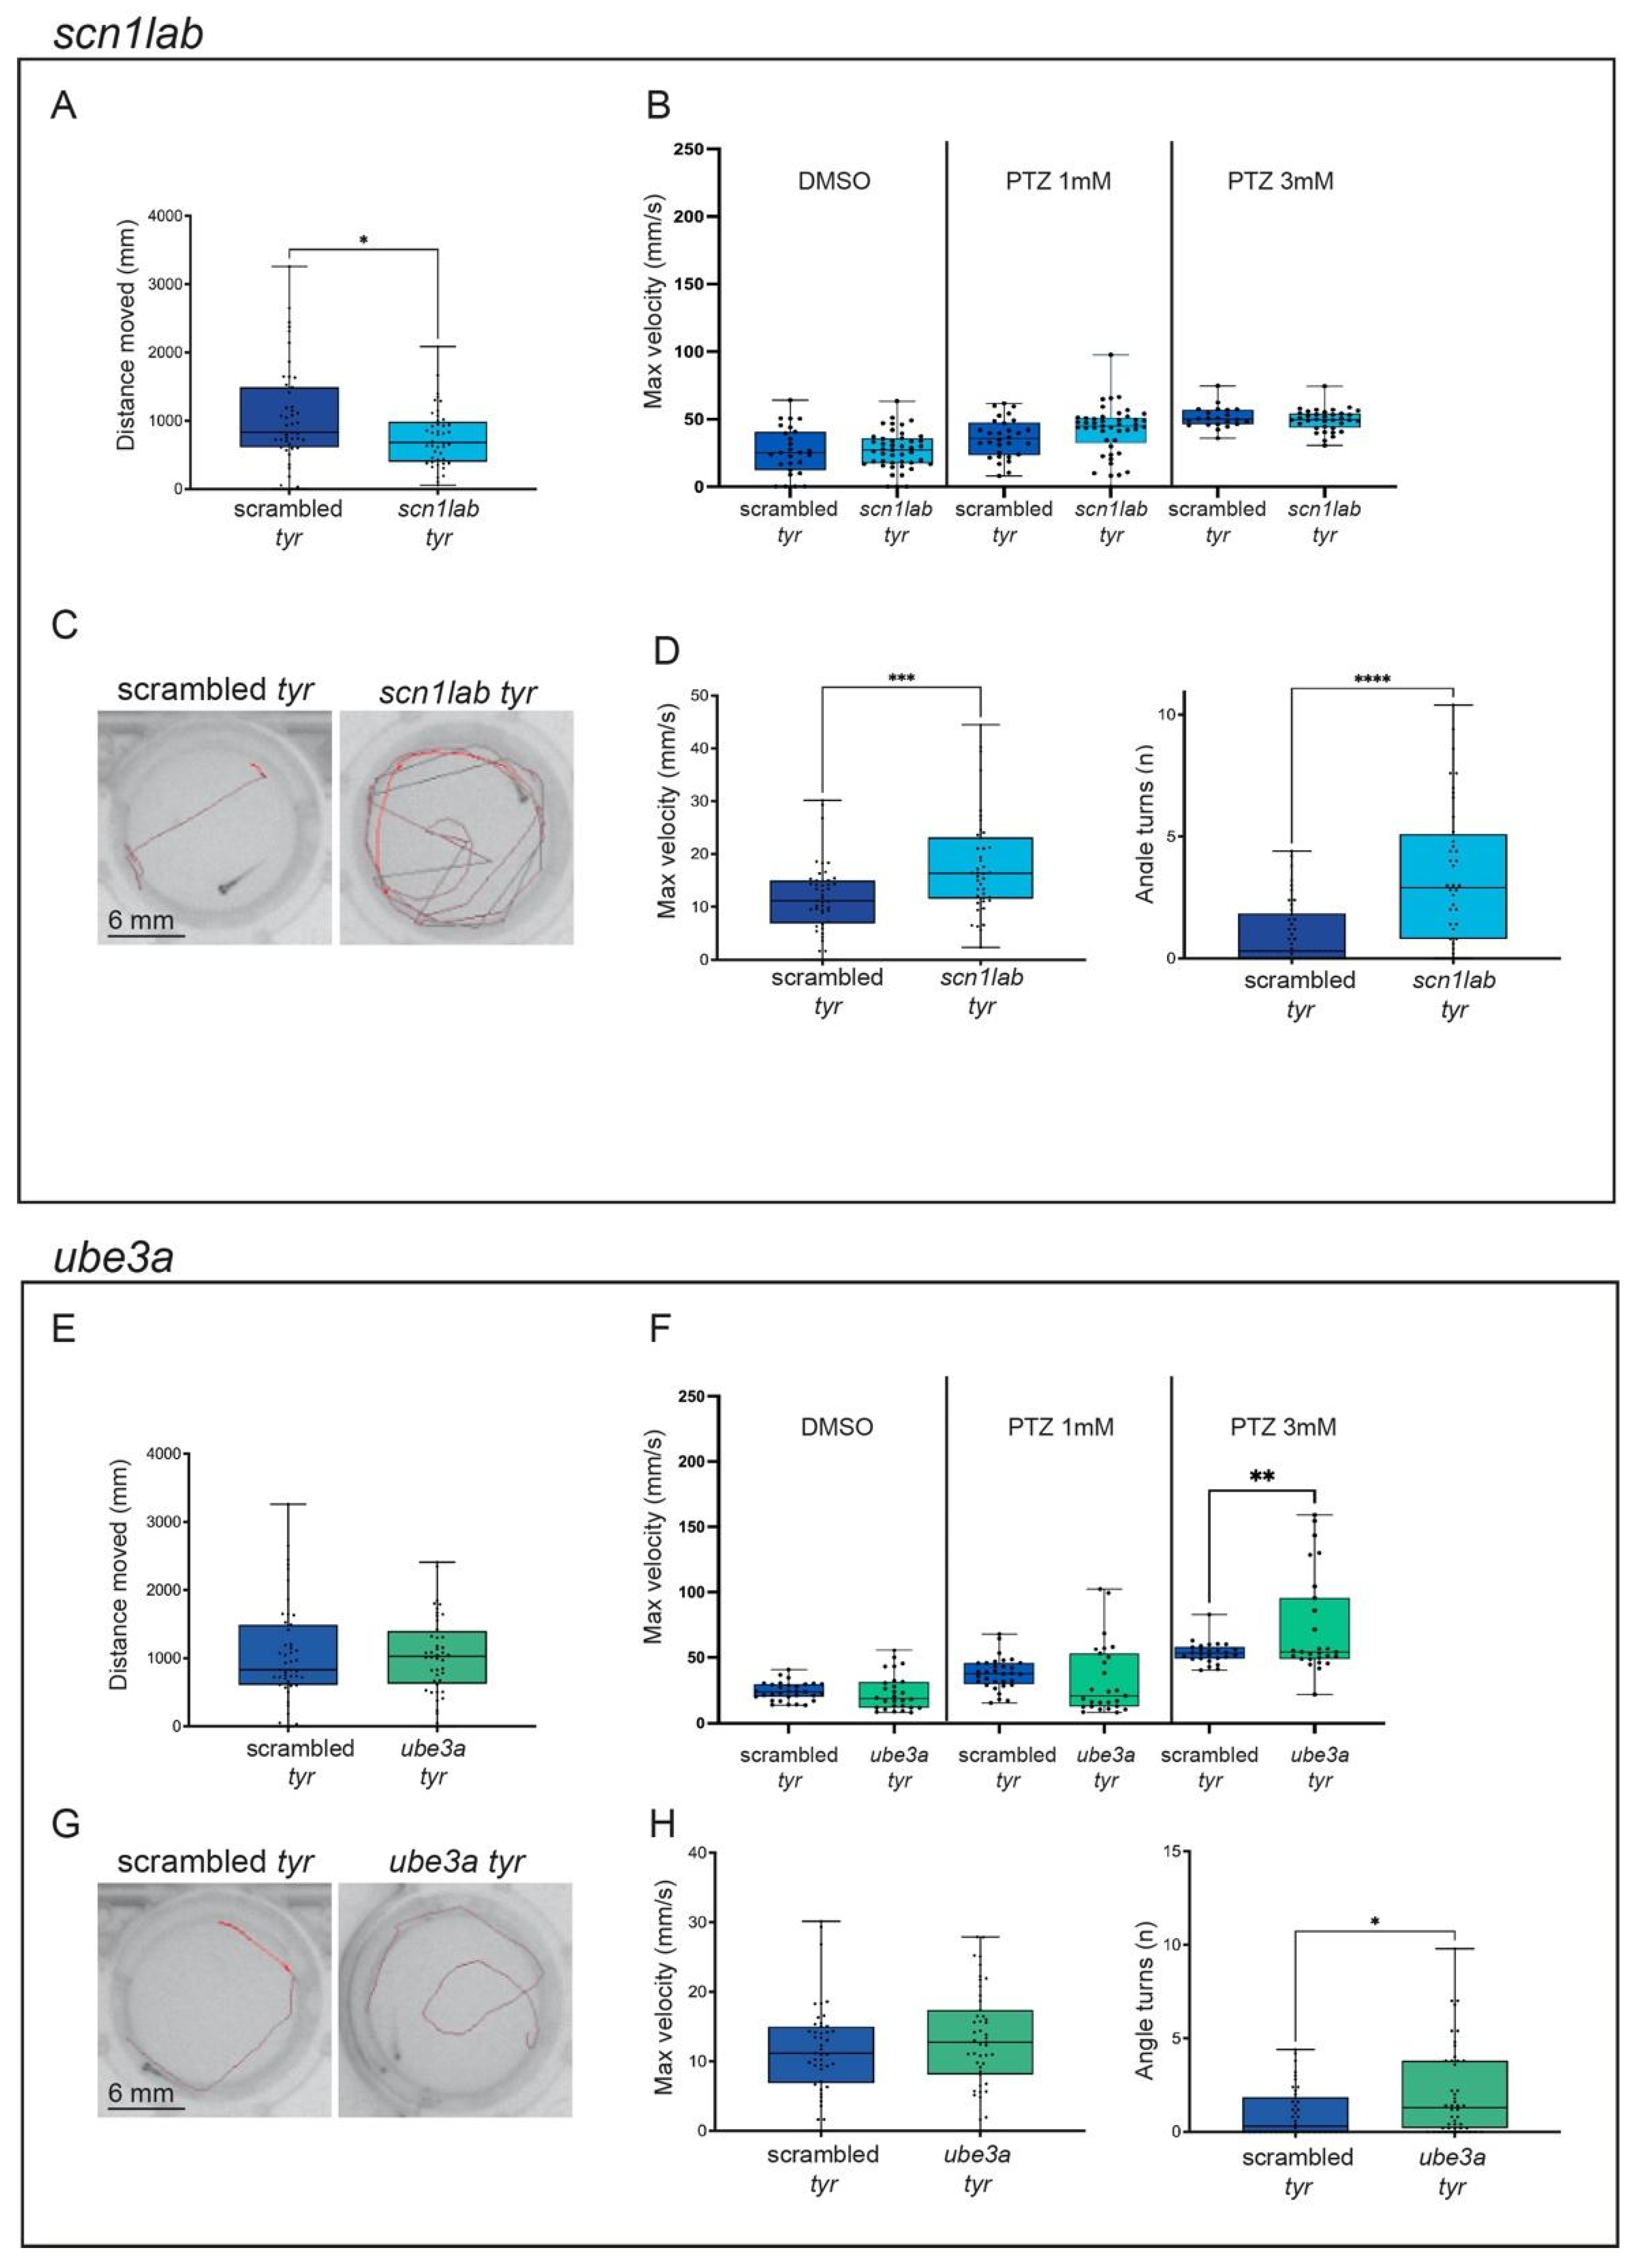
2.2. adgrg1, gabra1, pcdh19, scn1lab and ube3a Crispants Show Epilepsy-like Behavior

Having confirmed that the loss of pigmentation represents a powerful screening method to identify gene-specific crispants that carry a high rate of mutations, we used this approach in the following experiments. For the study of the phenotype induced by the loss of function of the different candidate epilepsy genes, we injected one-cell stage wild-type embryos with Cas9/sgRNA complexes, one sgRNA targeting the tyr locus and two sgRNA targeting the epilepsy gene of interest. For the negative control, we co-injected the tyr sgRNA and a scrambled sgRNA. We selected the unpigmented larvae for the experiments.
To evaluate the effects of the loss of function of the selected genes, we first looked for the presence of morphological alterations in the different gene-specific crispants. We observed that adgrg1 crispants displayed significant morphological phenotypes (reduced size and presence of body curvature) (Supplementary Figure S3 and Supplementary Table S1), possibly due to a developmental delay or to hypotonia and muscular defects related to the generated loss of function. The inactivation of other epilepsy-associated genes did not result in significant morphological deficiencies, with the exception of gabra1 and pcdh19 crispants (minor but significant decrease in body length) and kcnq2a and kcnq2b crispants (minor but significant increase in body length and eye diameter) (Supplementary Figure S3 and Supplementary Table S2).
We next analyzed the presence of locomotion alterations or the occurrence of epileptic-like phenotypes.
First, we analyzed the locomotion activity of control and gene-specific crispants in response to alternating dark/light cycles. Interestingly, most crispants did not show differences in their motor behavior in response to the dark/light changes (total distance moved, mean ± SEM: adgrg1: scrambled = 1728 mm ± 135.2, n = 90; crispants = 1810 mm ± 110.2, n = 93. kcnq2ab: scrambled = 1106.31 mm ± 63.03, n = 76; kcnq2a crispants = 1328.29 mm ± 66.85, n = 75; kcnq2b crispants = 1184.28 mm ± 54.86, n = 77; kcnq2ab crispants = 1143.86 mm ± 69.67, n = 73. pcdh19: scrambled = 1299.51 mm ± 84.04, n = 60; crispants = 1319.76 mm ± 88.47, n = 53. ube3a: scrambled = 1062.03 mm ± 106.53, n = 47; crispants = 1041.61 mm ± 85.23, n = 44), (Figure 2A, Figure 3A,E and Figure 4E)). In contrast, scn1lab and gabra1 crispants showed reduced locomotion in comparison to scrambled crispants (total distance moved, mean ± SEM: scn1lab: scrambled = 1062.03 mm ± 106.53, n = 47; crispants = 750.73 mm ± 64.19, n = 44; gabra1: scrambled = 1299.51 mm ± 84.04, n = 60; crispants = 894.33 mm ± 86.63, n = 56), while kcnq2a displayed a moderate but significantly increased movement (total distance moved, mean ± SEM: scrambled = 1106.31 mm ± 63.03, n = 76; kcnq2a crispants = 1328.29 mm ± 66.85, n = 75)) (Figure 2E and Figure 4A).
It has been previously demonstrated that the incubation of zebrafish larvae with PTZ causes seizures associated with a strong behavioral response that can be quantified by analyzing kinematic parameters such as the total distance moved or the maximum velocity [17]. In our experiment, crispants were exposed to two sub-optimal concentrations of PTZ (1 and 3 mM) [25,42], and their locomotion activity was monitored for a sustained light period (15 min). The presence of locomotion alterations and spontaneous convulsions was evaluated by analyzing the maximum velocity (mm/s) reached by each larva during the trial.
Interestingly, we found that pcdh19 and ube3a had an increased sensitivity to PTZ. Indeed, if the two genes were inactivated, the behavioral response of larvae treated with PTZ 3 mM was significantly stronger than the one observed in scrambled controls exposed to the same concentration of the compound (Maximum velocity: mean ± SEM: scrambled = 53.71 mm/s ± 1.68, n = 26; pcdh19: crispants = 87.78 mm/s ± 13.09, n = 24; ube3a: crispants = 72.50 mm/s ± 7.39, n = 27. Figure 3F and Figure 4F). In both cases, the incubation with a lower concentration of PTZ (1 mM) was not sufficient to induce seizure-like activity (Maximum velocity: mean ± SEM: scrambled = 37.76 mm/s ± 2.14, n = 32; pcdh19: crispants = 30.84 mm/s ± 4.71, n = 29; ube3a: crispants = 33.21 mm/s ± 5.17, n = 27). Differently, the KO of the other epilepsy-associated genes did not increase the susceptibility of crispants to PTZ (Figure 2B,F, Figure 3B and Figure 4B) (PTZ 1 mM: Maximum velocity: mean ± SEM: adgrg1: scrambled = 37.77 mm/s ± 2.14, n = 32; crispants = 31.64 mm/s ± 4.19, n = 31. gabra1: scrambled = 35.95 mm/s ± 2.63, n = 30; crispants = 32.56 mm/s ± 4.37, n = 43; kcnq2a: scrambled = 24.59 mm/s ± 3.62 n = 32; crispants = 22.23 mm/s ± 3.71, n = 31. kcnq2b: scrambled = 24.59 mm/s ± 3.62, n = 32; crispants = 33.49 mm/s ± 3.19, n = 31. kcnq2ab: scrambled = 24.59 mm/s ± 3.62, n = 32; crispants = 30.59 mm/s ± 3.81, n = 30. scn1lab: scrambled = 35.95 mm/s ± 2.63, n = 30; crispants = 41.84 mm/s ± 2.73, n = 45; PTZ 3 mM: Maximum velocity: mean ± SEM: adgrg1: scrambled = 53.71 mm/s ± 1.67, n = 26; crispants = 53.38 mm/s ± 1.43, n = 28. gabra1: scrambled = 51.24 mm/s ± 1.69, n = 22; crispants = 50.62 mm/s ± 5.33, n = 40; kcnq2a: scrambled = 38.01 mm/s ± 5.37, n = 31; crispants = 45.44 mm/s ± 3.25, n = 27. kcnq2b: scrambled = 38.01 mm/s ± 5.37, n = 31; crispants = 40.83 mm/s ± 5.48, n = 29. kcnq2ab: scrambled = 38.01 mm/s ± 5.37, n = 31; crispants = 43.39 mm/s ± 5.56, n = 30. scn1lab: scrambled = 51.24 mm/s ± 1.69, n = 22; crispants = 49.40 mm/s ± 1.35, n = 36).
When exposed to intermittent light as an epileptogenic stimulus, different crispants showed a different response. In particular, the disruption of one or both paralogues of the kcnq2 gene did not cause photosensitive seizures, as confirmed by the absence of a significant increase of the motor activity in response to the light stimuli (maximum velocity, mean ± SEM: scrambled = 11.29 mm/s ± 0.73, n = 59; kcnq2a = 12.71 mm/s ± 0.67, n = 49; kcnq2b = 12.74 mm/s ± 0.82, n = 58; kcnq2ab = 11.87 mm/s ± 0.85, n = 57; number of turns, mean ± SEM: scrambled = 1.21 ± 0.20, n = 52; kcnq2a = 1.47 ± 0.22, n = 50; kcnq2b = 1.71 ± 0.22, n = 59; kcnq2ab = 1.89 ± 0.22, n = 57) (Figure 3C,D). Similarly, the inactivation of ube3a only caused a moderate increase in the number of turns performed by crispants exposed to light flashes (maximum velocity, mean ± SEM: scrambled: 11.72 mm/s ± 1, n = 45; ube3a = 13.16 mm/s ± 1.05, n = 47; number of turns, mean ± SEM: scrambled = 1.02 ± 0.20, n = 42; ube3a = 2.08 ± 0.36, n = 46) (Figure 4G,H). In contrast, the exposure to quick and repeated light flashes had a strong impact on the behavior of adgrg1, gabra1, pcdh19 and scn1lab crispants. The presence of seizure-like behaviors could be visually detected by analyzing the trajectory followed by each larva in the two seconds after the exposure to the light stimulus. While crispants injected with scrambled sgRNAs followed a linear trajectory along the wall of the well, adgrg1, gabra1, pcdh19 and scn1lab crispants moved along an erratic trajectory in which they crossed the well and changed direction multiple times (Figure 2C,G, Figure 3G and Figure 4C). The analysis of two kinematic parameters (the maximum velocity reached in the two seconds following the exposure to the flash and the number of turns realized in the same time frame) confirmed this observation (Figure 2D,H, Figure 3H and Figure 4C). Both parameters are significantly increased if compared to scrambled control (Maximum velocity: mean ± SEM: scn1lab: scrambled = 11.73 mm/s ± 0.99, n = 45; crispants = 17.95 mm/s ± 1.47, n = 42. pcdh19: scrambled = 10.09 mm/s ± 0.79, n = 58; crispants = 12.91 mm/s ± 1.10, n = 57. gabra1: scrambled = 10.09 mm/s ± 0.79, n = 58; crispants = 21.56 mm/s ± 1.55, n = 58. adgrg1: scrambled = 6.74 mm/s ± 0.59, n = 91; crispants = 10.6 mm/s ± 0.59, n = 87. Number of turns: mean ± SEM. scn1lab: scrambled = 1.02 ± 0.20, n = 42; crispants = 3.38 ± 0.46, n = 40; pcdh19: scrambled = 0.69 ± 0.14, n = 51; crispants = 2.09 ± 0.34, n = 59; gabra1: scrambled = 0.69 ± 0.14, n = 51; crispants = 5.21 ± 0.56, n = 59; adgrg1: scrambled = 0.34 ± 0.07, n = 72; crispants = 2.46 ± 0.24, n = 91), suggesting that the mutation of adgrg1, gabra1, pcdh19 and scn1lab CDS increases the susceptibility to light-induced seizures.

2.3. Multiparametric Analysis of Behavioral Response to Light Flashes Allows Fine Characterization of Photosensitive Epilepsy

To detect spontaneous seizures (e.g., in response to incubation with PTZ), the behavior of larvae has to be recorded for a relatively long time window. Indeed, it is not possible to predict when the epileptic event is going to occur, and, to increase the probability of tracking a seizure, it is necessary to monitor the locomotion activity of larvae for a long period of time. In contrast, the use of flashes of light as a causative convulsive stimulus allows to temporally control the manifestation of seizure-like events, making it possible to assess and characterize behavioral alterations in a time-convenient manner.
Bearing in mind these considerations, we decided to focus on light-induced seizures in the following part of this study.
Epilepsy is characterized by a high heterogeneity including differences in severity, symptoms and causes, with structural, genetic, metabolic, autoimmune and infection-related causes. There are different manifestations of epilepsy, leading to a complex classification of the seizures (e.g., focal or generalized and motor or non-motor) [43,44]. Moreover, comorbidities are very relevant and conditions such as depression, anxiety and dementia are more common in people with epilepsy [45]. Therefore, to better evaluate epilepsy in whole organisms and characterize the possible effects of different therapies, a comprehensive phenotype evaluation is required.
Taking this information into account, we decided to perform a more detailed analysis of the behavioral response of zebrafish larvae to an epileptogenic stimulus in order to better classify the observed epileptic-like responses.
To extract the most possible information from our dataset, we built a principal component analysis (PCA), considering those kinematic variables having the greatest relation and relevance in the study of epileptic seizures. To perform such analysis, we focused on parameters associated with a modification of the larval position or orientation in the space (Maximum velocity (mm/s), number of angle turns, maximum acceleration (mm/s2), angular velocity (deg/s)) and variables reflecting a movement alteration (e.g., tremors or freezing behaviors) that do not cause a change in the position or orientation of larvae (mobility in the arena (%) and cumulative duration (s) of three different mobility states, immobile, mobile and highly mobile) (Figure 5A and Supplementary Table S3).
Data from all replicates and all different crispants were pooled in this multivariate analysis. Interestingly, we noticed that the samples were distributed in the PCA plot along different levels of overall “activity”. Indeed, variables associated with increased motor activity (e.g., maximum velocity, maximum acceleration, highly mobile state) pointed toward a similar direction, one opposed to that of variables reflecting low motor activity (e.g., immobile state) (Figure 5A). To our surprise, we did not observe a clear clusterization of crispants versus scrambled controls but a dispersed sample distribution in which most observations localized in the center of the plot.
Nonetheless, we noticed that a number of samples showed a highly aberrant behavior, with higher values in different kinematic parameters (Figure 5B). We reasoned that analyzed larvae could be classified in different groups depending on their activity level and we speculated that the crispants of genes having a positive association with photosensitive epilepsy would have an increased representation in the more active group.
To explore this possibility, we decided to measure the Mahalanobis distance (MD) of all the observations in order to evaluate how each flash response differs from the average of the entire population. We speculated that this analysis would allow us to define the behavioral fingerprint of each larva and to classify their response to epileptogenic flashes of light based on the intensity of the observed motor activity.
Indeed, we distinguished and classified two regions of activity in our population: a region of low activity (MD < 2.5 and p value > 0.1) and a region of high activity (MD > 2.5 and p value < 0.1) (Figure 5C,D). This observation suggests that larvae with increased photosensitivity are prone to display a highly aberrant behavior in response to exposure to flashes of light, constituting a population of outliers distinguished by their higher motor activity. We assume that these extreme behaviors correspond to epileptic-like seizures characterized by aberrant and excessive movements.
For each experimental group, we calculated the proportion of larvae whose level of activity was statistically classified as “low” or “high” (Table 3).
Interestingly, we observed that four crispants (adgrg1, gabra1, pcdh19 and scn1lab) displayed an increased proportion of seizure-like responses when compared to control larvae. Among these, the crispants with the highest proportion of “highly active” responses were gabra1, accounting for a percentage of hyperactive responses double the one observed in scrambled controls, and scn1lab, showing four times more “active responses” than scrambled controls (Figure 5E), suggesting that the inactivation of these genes had the strongest association with photosensitivity and, as a consequence, promoted the manifestation of seizure-like events in response to flashes of light.

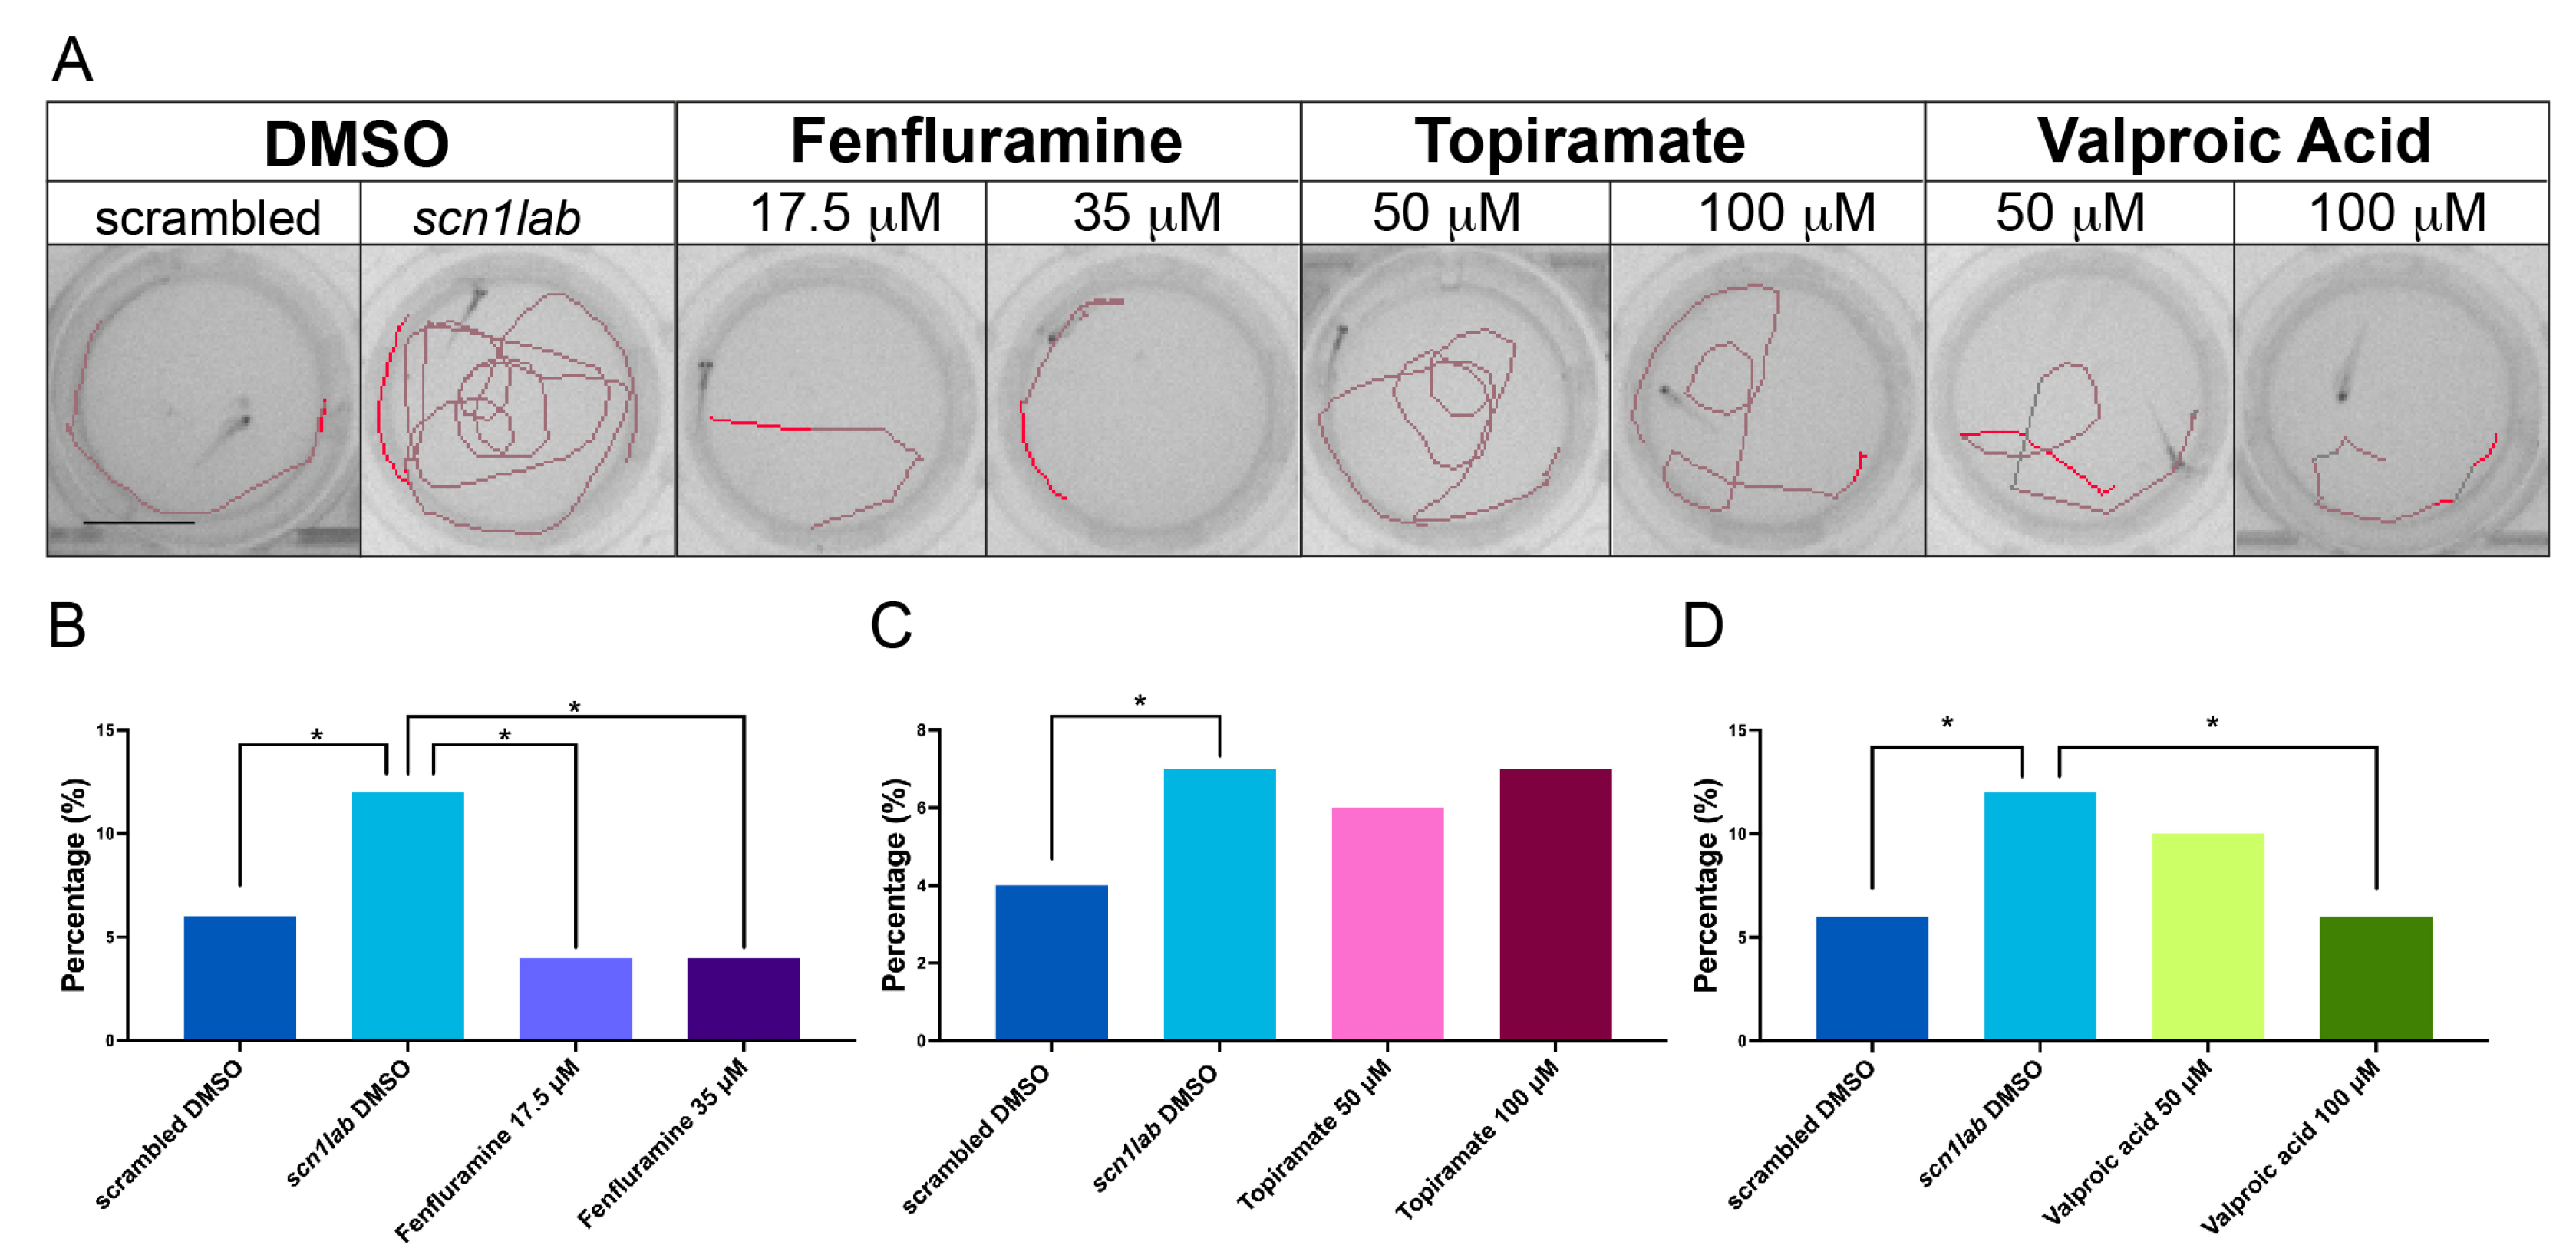
2.4. The Incubation of scn1lab Crispants with Antiepileptic Compounds Protects against Seizure-like Events

Having proved that scn1lab crispants display the highest susceptibility to light-induced seizures, we wanted to evaluate the effect of antiepileptic compounds on the behavioral phenotype described above.
Epilepsies, and especially childhood epilepsies, are known to present pharmaco-resistant seizures, highlighting the need of designing targeted therapeutic strategies. With the objective of evaluating different known antiepileptic drugs, three different compounds were selected: valproic acid, which enhances the inhibitory neurotransmission through GABA potentiation and sodium and calcium voltage-gated channels modulation, overall decreasing neuronal excitability and firing rate [46,47,48]; topiramate, whose mechanism of action is the increase of GABA activity and inhibition of glutamatergic activity (NMDAR antagonism) through GABA potentiation and sodium and calcium channels modulation [49]; and fenfluramine, which acts as an agonist of the serotonin 5-HT2 receptors and σ1 receptor positive modulator [50,51,52]. We speculated that the treatment of photosensitive crispants with effective antiepileptic drugs would reduce the number of seizure-like events, resulting in a reduced presence of treated crispants in the region of “high activity”. To test this hypothesis, we incubated scn1lab crispants with two concentrations of the aforementioned drugs.
Upon incubation with the test compounds, control and gene-specific crispants were exposed to flashes of light to induce a convulsive behavior. First, we evaluated the efficacy of the tested ASMs from a qualitative point of view, examining the trajectory followed by larvae in response to the flashes of light. As expected, the trajectory of DMSO-treated scn1lab crispants appeared more complex and fragmented than that of DMSO-treated scrambled control (Figure 6A). In contrast, treated larvae followed a less complex trajectory, even if we observed differences among different drugs (Figure 6A). Indeed, scn1lab crispants treated with the two selected concentrations (17.5 µM and 35 µM) of fenfluramine and with the highest concentration of valproic acid (100 µM) followed a linear trajectory comparable to that of control individuals. In contrast, larvae treated with the lowest concentration of valproic acid (50 µM) and with the two chosen concentrations of topiramate (50 µM and 100 µM) displayed a twistier trajectory (less complex than the one followed by DMSO-treated scn1lab crispants but more complex than the one described in scrambled control crispants).
Then, the kinematic parameters of each larva were extracted and analyzed, and the response of each sample was classified into the “low” (normal behavior) or “high” active region (epileptic-like behavior).
As expected, for each of the treatments, the most represented group in the “high” active region was that of DMSO-treated crispants (Figure 6B–D). These data confirm that scn1lab inactivation triggers an increased susceptibility to epileptic seizures. In contrast, DMSO-treated scrambles constituted only a minority of the observations in the higher active regions (Figure 6B–D). Statistically, the proportions of scn1lab crispants in the “active” region were significantly different compared to scrambled larvae (binomial test with p-value < 0.05) in each of the three drug experiments. Most importantly, the treatment with both concentrations of fenfluramine appeared to protect against the manifestation of aberrant light-induced behavior (Percentage of highly active flash responses: scrambled DMSO = 5.7%, n = 401 responses; scn1lab DMSO = 12.2%, n = 491 responses; fenfluramine 17.5 µM = 3.7%, n = 54 responses; fenfluramine 35 µM = 4.1, n = 49 responses). The treatment with topiramate did not show a protective effect (Percentage of highly active flash responses: scrambled DMSO = 3.7%, n = 402 responses; scn1lab DMSO = 7.1%, n = 493 responses; topiramate 50 µM = 5.5%, n = 109 responses; topiramate 100 µM = 7.3, n = 124 responses). In the case of valproic acid, the lowest concentration did not protect against epileptic-like behaviors while the highest concentration efficiently protected against light-induced aberrant movement (Percentage of highly active flash responses: scrambled DMSO = 5.8%, n = 400 responses; scn1lab DMSO = 12.2%, n = 490 responses; valproic acid 50 µM = 9.6%, n = 178 responses; valproic acid 100 µM = 6, n = 182 responses).
Taken together, our data demonstrate that F0 scn1lab mutants can be employed as a useful tool in the screening of anti-epileptic compounds.

3. Discussion

3.1. An Optimized Workflow for Genetic Target Validation in Zebrafish F0 Larvae

In this study, we successfully developed an effective procedure to maximize the accuracy and the translatability of crispants-based target validation approaches for NDD preclinical studies. NDDs are a group of extremely diverse disorders with a complex etiology and a broad symptomatic spectrum, often caused by the inheritance of genetic risk factors [53]. In the past years, a number of point mutations, deletions or chromosomal alterations have been confirmed to be causative of different forms of genetic epilepsy, an NDD in which frequent seizures strongly impair the quality of life of affected patients [54].
As sequencing technologies have continued to advance over the past few years, an increasing number of new variants have been found by multinational collaborations that analyzed large cohorts of epilepsy patients [55,56]. Global efforts such as the Epi25 collaborative or the International League Against Epilepsy (ILAE) Consortium on Complex Epilepsies are generating and analyzing sequences of patient cohorts at a much faster pace than the aforementioned methods allow to test for causality and screen for novel ASM. This is also the case for other NDDs [15].
Taking these considerations into account, it is essential to have a tool that allows testing the new variants in a timely and sustainable manner. So far, the use of zebrafish F0 mutants has allowed scientists to mimic human genetic diseases in a fast, cost-effective and ethically sound manner, offering great opportunities in preclinical research [3,57]. Nonetheless, this experimental approach is associated with a relatively high variability of mutation rates and, to strictly correlate the inactivation of a candidate gene with an observed phenotype, it is necessary to analyze the percentage of mutations carried by each screened larva. Given the fast integration of the CRISPR/Cas9 system into zebrafish laboratories over the last years and the common opinion that high efficiency of double-strand breaks is often obtained, this genotype/phenotype correlation is not routinely performed. To overcome this limitation, we have demonstrated that it is possible to visually identify crispants carrying the highest rate of mutations in a gene of interest by co-targeting the tyr CDS. Indeed, tyr disruption induces pigmentations defects, a phenotype that can be employed as a reporter of Cas9 activity. We have shown that a simple protocol optimization—the addition of a sgRNA targeting a “reporter” gene—allows to enhance robustness and reduce the time required to carry on F0-based approaches. Our strategy allows the preselection of de facto mutant larvae before performing phenotypic characterization, thus enabling the study of less genetically heterogeneous populations for inferring gene function. We hypothesize that a similar result can be obtained by targeting other sequences whose inactivation results in a visually detectable phenotype (e.g., the GFP CDS in a transgenic reporter line), making this approach extremely flexible and versatile.
Although through this approach the genetic heterogeneity of the larvae is reduced before functional characterization, there are two limitations that need to be acknowledged. The first is that some larvae of the selected unpigmented pools might carry a low rate of mutations, thus not displaying a loss-of-function phenotype. We have shown that the percentage of these larvae is usually low (Supplementary Figure S2) and thus it should not lead to the appearance of false negatives in the analysis. Additionally, the mutations that are induced by the CRISPR/Cas9 system are random and not all of them disrupt the gene open reading frame; thus, a variable number of cells would not be knocked out for the gene of interest. In this case, we suggest a deletion strategy that maximizes the possibilities of inducing loss of function, either by removing the translational start site from the coding region or by targeting entire exon sequences that encode essential functional protein domains.
Another limitation of the strategy is that only loss-of-function mutations can be induced. Nevertheless, the advent and implementation of new techniques such as base editing [58] and prime editing [59] allow the introduction of patient-specific mutations into the zebrafish genome, opening the possibility of high-throughput personalized screenings. Along this line, Rossello et al. have recently shown high efficiency in F0 disease modeling with base editing co-targeting genes of interest and tyr loci [60].

3.2. Addressing the Phenotypic Heterogeneity of Epilepsy Combining Morphological and Behavioral Assays

A characteristic of NDD is the high phenotypic heterogeneity detected in human patients. For example, in the case of epilepsy, there is a broad spectrum of phenotypes, with many different seizure types and leading to various conditions such as epileptic encephalopathies, in which epileptiform abnormalities contribute to progressive brain dysfunction; this disorder can be associated with different comorbidities, including mental retardation and developmental delays [61,62], making it challenging to cover these variable phenotypes with a defined experimental assay. Taking into account this phenotypic heterogeneity, we combined the analysis of the morphological and behavioral phenotypes induced by the loss of function of six genes associated with different forms of childhood genetic epilepsy.
The fine-tuned morphological evaluation performed in this study allowed us to observe developmental defects (reduced size and body curvature) in adgrg1 crispants. These features mirror the developmental delay and muscular weakness observed in some patients affected by polymicrogyria, the pathological condition caused by ADGRG1 mutations in humans [33].
To investigate the presence of neurodevelopmental defects and to verify the occurrence of epileptic-like seizures, we have used behavioral phenotyping of zebrafish larvae to describe larval basal locomotion and to model seizure-induced changes in larval movement.
Our analysis revealed that the basal locomotion of gabra1 and scn1lab crispants is reduced compared to that of the control scrambled. These data suggest that these crispants might be affected by a neurodevelopmental delay that impairs motor coordination. Interestingly, motor deficits have been described in scn1lab stable mutants [63] and are observed in Dravet syndrome patients, suggesting that our genetic manipulation correctly mimics human disease [64].
In order to account for the phenotypic variability of epilepsy, we have employed two epileptogenic stimuli: PTZ as a chemical inductor of seizures and flashes of light to detect photosensitive epilepsy.
Interestingly, we found that the inactivation of most target genes caused an increased susceptibility to one or both triggers. The loss of function of adgrg1, gabra1 and scn1lab resulted in increased photosensitivity but did not enhance the epileptogenic activity of PTZ. The photosensitivity induced by the loss of function of scn1lab [65] and gabra1 [66] has been already described, confirming that our somatic KO approach consistently replicates phenotypes already observed in stable mutant lines. Most importantly, the increased sensitivity of adgrg1 to flashing lights represents a novelty described in this work for the first time.
The inactivation of pcdh19 and ube3a increased the sensitivity to PTZ. Pcdh19 crispants also showed an increased response to flashing light while ube3a inactivation only had a minor impact on light-induced seizures. Interestingly, pcdh19 has been previously associated with neuronal hyperactivity in zebrafish [67], but, to our knowledge, this study demonstrated for the first time its association with seizure-like behavior.
The targeting of the two orthologues of KCNQ2 did not cause PTZ- or light-induced seizures. As mentioned above, epileptic disorders have different symptomatic manifestations and epileptic seizures can be triggered by different stimuli (e.g., fever) or be characterized by an increase in neural circuit excitation that does not converge in the occurrence of aberrant movement. Our current analysis is based on the relatively straightforward automated tracking of zebrafish larvae in response to the given stimuli. The flexibility of the behavioral setup employed in this study enabled us to test different triggers to induce epilepsy (e.g., increased temperature) or to evaluate spontaneous seizures over a longer observation time, allowing us to potentially cover a broader spectrum of epileptic disorders.

3.3. The Characterization of Photosensitive Epilepsy with In-Depth Analysis of Larval Behavior

To better characterize photosensitive seizures and rank the genes that are associated with the strongest light sensitivity, we have performed a multiparametric analysis that took into account seven key variables related to light-induced fish movement. Our approach allowed us to segregate crispants for the genes of interest and their scrambled counterparts in activity zones associated with low or high motor behavior. We speculate that the most extreme behaviors observed in our assay represented aberrant body movement corresponding to motor manifestations of light-induced seizures (e.g., muscular spasms). Importantly, not all crispants for a given gene displayed a strong hyperactive response to the light stimuli, while few control crispants showed a hyperactive behavior in response to the flashes of light. We believe that our analysis provides a meaningful representation of the complex etiology and manifestation of epilepsy in the population. On the one hand, mutations in epilepsy-associated genes might have a variable expressivity and an incomplete penetrance [68], making the severity of the resulting phenotypes extremely variable, as observed in our experiment. On the other hand, control crispants showing a strong light-induced motor response might be representative of cases of idiopathic photosensitivity [69]. Differently from the analysis of discrete phenotypes as the total distance moved or the maximum velocity of the larvae during the assay, we believe that our PCA and behavioral differentiation based on Mahalanobis distance allows a finer characterization of the mutant genotype/phenotype fingerprint and enables to better infer phenotype severity based on gene impairment. In our view, this represents a step towards better translatability of the results obtained with zebrafish larvae to human scenarios. Along these lines, among the genes tested, GABRA1 and SCN1A have the strongest association with photosensitivity in humans. Indeed, patients carrying mutations in one of these genes often experience seizures triggered by flashing or flickering lights [34,64]. Interestingly, the two zebrafish orthologues of these genes were identified as the highest risk factors for photosensitive seizures in our multiparametric analysis.

3.4. A High-Throughput Platform for ASM Drug Screening

To date, no cure has been identified for epilepsy, and the majority of medication-based approaches focus more on managing seizures or other symptoms than on reversing the underlying condition. The challenge of finding novel ASMs relies in part on the fact that an elevated percentage of patients with various kinds of epilepsy develop resistance to the treatments. Additionally, significant problems slowing down the development of novel ASMs are (1) the translatability of results obtained in studies with rodent or alternative models (human-derived iPS cells, organoids, zebrafish embryos); (2) the long time required to perform individualized compound screenings targeted at patients carrying a different mutation at the same locus or mutations in different loci.
In this study, we demonstrated that scn1lab crispants display a reproducible and clearly detectable epileptic phenotype, a feature that makes these models an ideal substrate for the screening of ASMs. Indeed, the possibility of relying on a behavioral readout to test for the presence of epileptic-like seizures makes it possible to test ASMs, potentially reversing the mutation-induced hyperactivity with a minimally invasive procedure. The fact that multiple larvae (up to 96) can be exposed to the epileptogenic stimulus simultaneously ensures the possibility of testing a panel of multiple ASMs in the same assay. Similarly, different concentrations of the same ASMs or different combinations of ASMs can be evaluated in a single experiment. Moreover, multiple behavioral recordings can be performed in a single experimental day, increasing further the throughput of crispants-based screenings of ASMs.
In this report, we proved that the acute incubation of scn1lab crispants with previously described ASMs (valproic acid and fenfluramine) is sufficient to prevent light-induced epileptic events. We believe that the chronic exposure of scn1lab F0 mutants to neuroactive compounds can be employed to screen for neuroprotective molecules potentially acting on the molecular mechanisms at the basis of the neural circuits’ dysfunction causing the manifestation of epilepsy. Thus, zebrafish larvae could be employed to identify novel therapeutic agents acting on the cause of the disorder and not only on its symptoms.
This strategy is not only interesting for testing novel ASMs or performing drug repurposing but also for studying the contribution of genetic modifiers, which are mutated genes that interact with the primary mutations and are able to modulate the resulting phenotypes. This is the case for the cholesterol 24-hydroxylase (CH24H) gene, which, when pharmacologically inhibited, ameliorates the phenotype and reduces the occurrence of seizures in Scn1a Dravet mouse models [70]. Since the scn1lab mutant is the gold standard epilepsy model in the zebrafish community, and scn1lab has shown a strong epileptic phenotype in our study, genetic modifiers could be identified and tested through our approach in this background, advancing the discovery of potential therapeutic targets.
Taken together, the strategy proposed here offers a high-throughput platform for drug screenings, repurposing of ASMs or tests of genetic modifiers. We demonstrate that the behavioral multiparametric analysis proposed in this study enables the evaluation of molecule efficacy, making it possible to identify compounds that inhibit the manifestation of seizures.

3.5. Concluding Remarks

In this report, we have developed a strategy to expand the utility of screenings based on zebrafish F0 knock-out larvae to partially overcome the time and throughput issues in NDD functional genomics and drug testing.
Our approach allowed us to investigate the morphological and behavioral alterations induced by the loss of function of genes associated with NDDs, with a special focus on genes involved in the pathogenesis of childhood epilepsy. Moreover, we established a novel approach to employ kinematic parameters to define and identify larvae affected by light-induced seizures. This strategy allowed us to rank different candidate genes according to the severity of their phenotype and, even, to test the efficacy of different anti-epileptic compounds in F0 larvae.
All in all, we believe that the in vivo combination of F0 gene targeting and phenotypic fingerprinting of zebrafish larvae represents a powerful tool for functional genomics, drug screening and personalized medicine development that can be scalable from epilepsy to other neurodevelopmental disorders and, in principle, to a vast array of indications.

4. Materials and Methods

4.1. Zebrafish Husbandry and Breeding

Adult wild-type AB strain zebrafish were maintained at 28.5 ± 1 °C in a 14 h light/10 h dark cycle in a closed recirculating tank system, according to standard protocols [71]. Zebrafish embryos were obtained by mating wild-type adult zebrafish through standard methods. All the experiments were performed on 120 h-post-fertilization (hpf) larvae.

4.2. Generation of Crispants

For the generation of crispants, zebrafish embryos were injected at the one-cell stage with the corresponding CRISPR/Cas9 machinery mix. For each target gene, 2 sgRNAs were employed in order to maximize the mutagenesis rate (Table 4). As a negative control for the experiments, commercial scrambled sgRNA (5′-G*C*A*CUACCAGAGCUAACUCA-3′) was also injected in one-cell-stage embryos at the same time as the other crispants. The scrambled sgRNA binds the Cas9 but it does not target any sequence of the zebrafish genome, simulating the injection conditions in the embryo but not generating any indel in its DNA. When stated, tyrosinase sgRNA (5′-GGACTGGAGGACTTCTGGGG-3′) was co-injected with the sgRNAs for each target gene.

4.3. The Rate of Mutations Analysis

For the evaluation of the mutagenesis ratio for each childhood epileptic crispant and to assess the efficacy of co-injecting sgRNAs for our target genes and tyr sgRNA, 5 dpf pigmented (low tyrosinase efficacy) and non-pigmented (high tyrosinase efficacy) larvae were selected and individualized; their genomic DNA was extracted and the locus targeted by the sgRNAs of our target genes was Sanger-sequenced. With the obtained individualized sequences, the mutation ratio was quantified using the Synthego ICE analysis tool.

4.4. Morphological Analysis

To assess any morphological alterations in the different crispants studied, vertebrate automated screening technology (VAST Biometrica System) was used. Each larva was analyzed at 120 hpf for different morphological parameters, such as body deformity, heart edema, yolk edema, scoliosis, heart area, eye diameter, lateral and dorsal length and absence of the fin. Phenotypes were assessed using an ad hoc ImageJ/FIJI plug-in for the analysis of the morphological alteration [30]. The experimental design used a 96-well plate (131012C, Clearline) with one larva per well; a negative control group (injected with a scramble sequence) was included for each plate imaged with the VAST. Plate design for the different childhood epilepsy crispants was as follows:
  • Plate A: scrambled, scn1lab and ube3a
  • Plate B: scrambled, pcdh19 and gabra1
  • Plate C: scrambled, kcnq2a, kcnq2b and kcnq2ab
  • Plate D: scrambled and adgrg1
Each plate contained a scrambled control from the same batch of embryos, injected and manipulated together with the studied childhood epilepsy mutants to minimize the possible batch effect. Statistical analysis was performed using one-way ANOVA, whereas multiple comparison analysis was performed using Dunnett’s test. The significance was considered at p-value < 0.05.

4.5. Behavioral Experiments

The behavior was analyzed using a series of different standardized paradigms. The performance of the injected larvae was recorded at 120 hpf using the EthoVision XT 12.0.30 software along with the DanioVision chamber (Noldus Information Technologies, Wageningen, The Netherlands). This system consists of a closed circulating water system maintained at 28 °C with a temperature sensor. The chamber has a camera placed above, allowing the recording of the zebrafish larvae. Adapting to the zebrafish cycle, experiments were always performed between 12.00 h and 16.00 h [72]. As stated with the morphological analysis, different distributions for the plates were used in the different behavioral analyses of the epilepsy-associated genes, always with a scrambled control in each plate to minimize the batch effect and to always be compared with.
A polarized corrector lens was used to adjust and normalize the image of the plate, allowing the recording of the whole plate equally. The threshold detection settings were optimized for each experiment to identify the larvae correctly.

4.5.1. Locomotion Activity Assessment

To evaluate possible locomotion alteration in the generated crispants, the standardized 25 min dark/light cycles paradigm (5 min darkness—5 min light up to 25 min) was used. The total distance moved (mm) was analyzed. For these experiments, 48-well plates (Nunc 055431/150687, Thermo Scientific, Waltham, MA, USA) were used and placed in the chamber in line with the camera (one larva per well). To allow the habituation of the larvae to the plate, they were plated at least 3 h before the behavioral recording and all the tests had a 10 min light acclimatation phase inside the recording chamber. As aforementioned, different plate distributions were used, allowing to always have a scrambled control on each plate.
  • Plate A: scrambled, scn1lab and ube3a
  • Plate B: scrambled, pcdh19 and gabra1
  • Plate C: scrambled, kcnq2a, kcnq2b and kcnq2ab
  • Plate D: scrambled and adgrg1

4.5.2. Light-Induced Epilepsy Behavior

The paradigm used in this set of experiments constituted a set of 5 flashes (1 s of light flash—49 s of darkness, repeated 5 times), performed in order to trigger epileptic behavior. For these experiments, 48-well plates (Nunc 055431/150687, Thermo Scientific, Waltham, MA, USA) were also used and placed in the chamber in line with the camera (one larva per well). To allow the habituation of the larvae to the plate, they were plated at least 3 h before the behavioral recording and all the tests had a 10 min light acclimatation phase inside the recording chamber. The same plate distributions as in the locomotion activity assay of the selected mutants were used.
  • Plate A: scrambled, scn1lab and ube3a
  • Plate B: scrambled, pcdh19 and gabra1
  • Plate C: scrambled, kcnq2a, kcnq2b and kcnq2ab
  • Plate D: scrambled and adgrg1

4.5.3. Pharmacological-Induced Epilepsy Behavior

To perform the experiments, PTZ (Cas#: 54-95-5, Sigma Aldrich—Merck, St. Louis, MO, USA) was dissolved in DMSO (dimethylsulfoxide, Cas#: 67-68-5, MRI Global, Kansas City, MO, USA) to 1 M stock solutions and stored at −20 °C until needed; treatment solutions were freshly prepared before each experiment.
Given PTZ characteristics [25,28,39,40,41], the exposure time should be limited to avoid toxicity and larvae mortality. For this reason, the larvae were exposed to an acute treatment of 180′ before the behavioral assay in all the experiments. Two different concentrations, 1 mM as a sub-optimal non-epileptic concentration and 3 mM as a pro-convulsant concentration [25,42], were used in order to evaluate the sensitivity of the different studied crispants to their effects. The experiments were performed using 96-square-well plates (7701-1651, Cytiva, Washington D.C., USA). The paradigm used in this set of experiments constituted one approach to evaluate locomotor alterations and spontaneous seizures during a continuous light period. The approach consisted of 15 min of continuous light. To allow the habituation of the larvae to the plate, they were plated at least 3 h before the behavioral recording and all the tests had a 10 min dark acclimatation phase inside the recording chamber.
Analogously with the previous behavioral experiments, three different distributions of the plates were used in the behavioral analysis of the epilepsy-associated genes.
  • Plate A: scrambled, adgrg1, pcdh19 and ube3a
  • Plate B: scrambled, scn1lab and gabra1
  • Plate C: scrambled, kcnq2a, kcnq2b and kcnq2ab

4.6. Behavioral Analysis

For the statistical analysis, one-way ANOVA was used to compare each crispant with the negative control on their respective plates.
In light-induced behavior experiments, locomotion during the dark and light periods was evaluated, and the total distance moved (mm), both cumulative along the experiment and per minute, was analyzed. To describe the presence of an epileptic crisis, the maximum speed (mm/s) reached by the larvae and the number of turns performed in the 2 s following a light flash were analyzed. In order to obtain a complete picture of the behavior of the studied crispants, five different light flashes were performed, distanced one minute from each other, to perform five different triggers (or replicates) per experiment. For the final analysis, the mean of the responses of the five different flashes were evaluated.
In pharmacological epilepsy behavior experiments, the maximum speed (mm/s) reached by the larvae during the experiment was evaluated, analyzing the presence of spontaneous epileptic events along the recorded time.
Statistical significance was evaluated using one-way ANOVA comparing the different crispants with the negative control on their plate, or a t-test if the comparisons were only between two conditions. The significance was considered at p-value < 0.05.

4.7. Principal Component Analysis and Mahalanobis Distance Calculations

Multivariate data analysis (principal component analysis, PCA-2D) was used to assess differences in behavioral analysis among all observations. Kinematic variables were collected from the performed behavioral experiments, after the flash-light induction, flash variables such as maximum acceleration, maximum velocity, highly mobile, mobile, mobility body percentage, turn angle number and immobile values for each larva were analyzed. PCA shows linear combinations of the variables that maximally explain the total variance of the dataset. Only variables with a contribution above a certain threshold (squared distance of the observation to the origin, cos2 > 0.75) were considered. For comparison purposes, quantile transformation was applied to filter observations below a kinematic threshold (‘colMoving’). Batch effect was tested for experiment date, replicates, flash number and other technical differences, showing no significant differences.
To measure differences in flash behavior activity, we applied a statistical test of variance called Mahalanobis distance (MD) on the PC plot. MD measures how distant a point is from the center of a multivariate normal distribution. Mahalanobis distances can be converted into probabilities using a chi-squared distribution and a significance level might be specified [73]. It is commonly applied in multivariate anomaly detection by defining two parameters, a distance magnitude (MD) and a p-value as a statistical measure to validate a hypothesis (outliers, p-value < 0.05). Using a histogram of the MD values (density plot) we detected a threshold defined between two distributions of main variances, with an MD > 2 and p value < 0.15 for the samples with the highest variance. A binomial test showed a high statistical difference between the number of crispants in the high variance region compared to scrambles (the proportion of crispants is 0.063 greater than expected for scrambles 0.04; p value < 0.001).
The R v4.2 software was used for statistical computing and graphics.

4.8. Pharmacology with Antiepileptic Compounds

The different compounds (topiramate (Cas#: 97240-79-4, Sigma Aldrich—Merck), valproic acid (Cas#: 1069-66-5, Sigma Aldrich—Merck) and fenfluramine (Cas#: 458-24-2, Cymit quimica, Barcelona, Spain)) were dissolved in DMSO (dimethylsulfoxide, Cas#:67-68-5, MRI Global) to 100 mM stock solutions and stored at −20 °C until used; treatment solutions were freshly prepared before each experiment.
Some of the tested drugs, such as topiramate and valproic acid, are known to have potential teratogenic and toxic effects [74,75,76], so the exposure time to these compounds should be limited. Different publications using the abovementioned compounds show different concentrations and incubation times [4,28,63,77,78]. The compounds were tested only in some of the epileptic childhood crispants that showed an epileptic phenotype.
The different doses and treatment times used were as shown below.
-
Topiramate: 50 µM and 100 µM, treatment 180′ before the behavioral assay.
-
Valproic acid: 50 µM and 100 µM, treatment 180′ before the behavioral assay.
-
Fenfluramine: 17.5 µM and 35 µM, treatment 24 h before the behavioral assay.

4.9. The Statistics of the Pharmacology

In order to compare light flash kinematics between crispants and treated-crispant larvae samples, binomial or Fisher’s exact (smallest sample sizes) tests for binary sampling statistics were applied. The highest variance compared to low variance sample proportions based on Mahalanobis metrics was assessed for each dose and treatment between treated crispants and crispants observations. Crispants were also tested against scrambled larvae as a reference.

Supplementary Materials

The following supporting information can be downloaded at https://www.mdpi.com/article/10.3390/ijms25052991/s1.

Author Contributions

Conceptualization: F.D.S., V.D.D. and S.L.; Methodology: V.O., M.S.d.M. and S.L.; Software: E.A.; Formal analysis: E.A., V.O., M.S.d.M., F.D.S. and S.L.; Investigation: F.D.S., V.D.D. and S.L.; Resources: V.D.D.; Data curation: F.D.S. and S.L.; Writing—original draft preparation: F.D.S., V.D.D. and S.L.; Writing—review and editing: F.D.S., V.D.D., S.L., V.O., M.S.d.M. and E.A.; Supervision: F.D.S. and V.D.D. All authors have read and agreed to the published version of the manuscript.

Funding

S.L.S. was funded by Ministerio de ciencia e innovacion de España, grant number DIN2018-010024.

Institutional Review Board Statement

For breeding of adult zebrafish, ethical approval was obtained from Generalitat de Catalunya “Direcció General de Polítiques Ambientals i Medi Natural” under referential procedure number 18-011-ISA- RESOLUCIO 9421: Breeding of zebrafish (Danio rerio) for the maintenance of lines and the creation of transgenics intended to study human diseases.

Informed Consent Statement

Not applicable.

Data Availability Statement

The data presented in this study are available on request from the corresponding author. The data are not publicly available due to internal policy of the company.

Acknowledgments

We acknowledge Javier Terriente and Gentzane Sánchez for valuable inputs on the manuscript, and Sylvia Dyballa for advice on multiparametrical analysis. We acknowledge the work of the Fish facility personnel (Marc Casanovas, Cristina Perez, Samuel Jimenez, Roger Franch, Genesis Rodríguez and Laia Mejias) for their support with the experiments.

Conflicts of Interest

F.D.S., V.D.D., S.L., V.O., E.A. and M.S.d.M. were all employed by ZeClinics SL, a contract research organization providing zebrafish-based services, at the moment of the manuscript preparation.

References

  1. Patton, E.E.; Zon, L.I.; Langenau, D.M. Zebrafish Disease Models in Drug Discovery: From Preclinical Modelling to Clinical Trials. Nat. Rev. Drug Discov. 2021, 20, 611–628. [Google Scholar] [CrossRef]
  2. Cully, M. Zebrafish Earn Their Drug Discovery Stripes. Nat. Rev. Drug Discov. 2019, 18, 811–813. [Google Scholar] [CrossRef]
  3. Rubbini, D.; Cornet, C.; Terriente, J.; Di Donato, V. CRISPR Meets Zebrafish: Accelerating the Discovery of New Therapeutic Targets. SLAS Discov. 2020, 25, 552–567. [Google Scholar] [CrossRef]
  4. Baraban, S.C.; Dinday, M.T.; Hortopan, G.A. Drug Screening in Scn1a Zebrafish Mutant Identifies Clemizole as a Potential Dravet Syndrome Treatment. Nat. Commun. 2013, 4, 2410. [Google Scholar] [CrossRef]
  5. Kawahara, G.; Karpf, J.A.; Myers, J.A.; Alexander, M.S.; Guyon, J.R.; Kunkel, L.M. Drug Screening in a Zebrafish Model of Duchenne Muscular Dystrophy. Proc. Natl. Acad. Sci. USA 2011, 108, 5331–5336. [Google Scholar] [CrossRef]
  6. Esplin, E.D.; Oei, L.; Snyder, M.P. Personalized Sequencing and the Future of Medicine: Discovery, Diagnosis and Defeat of Disease. Pharmacogenomics 2014, 15, 1771–1790. [Google Scholar] [CrossRef]
  7. Kotani, H.; Taimatsu, K.; Ohga, R.; Ota, S.; Kawahara, A. Efficient Multiple Genome Modifications Induced by the crRNAs, tracrRNA and Cas9 Protein Complex in Zebrafish. PLoS ONE 2015, 10, e0128319. [Google Scholar] [CrossRef]
  8. Burger, A.; Lindsay, H.; Felker, A.; Hess, C.; Anders, C.; Chiavacci, E.; Zaugg, J.; Weber, L.M.; Catena, R.; Jinek, M.; et al. Maximizing Mutagenesis with Solubilized CRISPR-Cas9 Ribonucleoprotein Complexes. Development 2016, 143, 2025–2037. [Google Scholar] [CrossRef]
  9. Shah, A.N.; Davey, C.F.; Whitebirch, A.C.; Miller, A.C.; Moens, C.B. Rapid Reverse Genetic Screening Using CRISPR in Zebrafish. Zebrafish 2016, 13, 152–153. [Google Scholar] [CrossRef]
  10. Winter, M.J.; Ono, Y.; Ball, J.S.; Walentinsson, A.; Michaelsson, E.; Tochwin, A.; Scholpp, S.; Tyler, C.R.; Rees, S.; Hetheridge, M.J.; et al. A Combined Human in Silico and CRISPR/Cas9-Mediated in Vivo Zebrafish Based Approach to Provide Phenotypic Data for Supporting Early Target Validation. Front. Pharmacol. 2022, 13, 827686. [Google Scholar] [CrossRef]
  11. Masselink, W. Crispants Take the Spotlight. Lab Anim. 2021, 50, 95–96. [Google Scholar] [CrossRef]
  12. Kroll, F.; Powell, G.T.; Ghosh, M.; Gestri, G.; Antinucci, P.; Hearn, T.J.; Tunbak, H.; Lim, S.; Dennis, H.W.; Fernandez, J.M.; et al. A Simple and Effective F0 Knockout Method for Rapid Screening of Behaviour and Other Complex Phenotypes. eLife 2021, 10, e59683. [Google Scholar] [CrossRef]
  13. Francés, L.; Quintero, J.; Fernández, A.; Ruiz, A.; Caules, J.; Fillon, G.; Hervás, A.; Soler, C.V. Current State of Knowledge on the Prevalence of Neurodevelopmental Disorders in Childhood According to the DSM-5: A Systematic Review in Accordance with the PRISMA Criteria. Child Adolesc. Psychiatry Ment. Health 2022, 16, 27. [Google Scholar] [CrossRef]
  14. Cristino, A.S.; Williams, S.M.; Hawi, Z.; An, J.-Y.; Bellgrove, M.A.; Schwartz, C.E.; Costa, L.D.F.; Claudianos, C. Neurodevelopmental and Neuropsychiatric Disorders Represent an Interconnected Molecular System. Mol. Psychiatry 2014, 19, 294–301. [Google Scholar] [CrossRef]
  15. Parenti, I.; Rabaneda, L.G.; Schoen, H.; Novarino, G. Neurodevelopmental Disorders: From Genetics to Functional Pathways. Trends Neurosci. 2020, 43, 608–621. [Google Scholar] [CrossRef]
  16. Bozzi, Y.; Casarosa, S.; Caleo, M. Epilepsy as a Neurodevelopmental Disorder. Front. Psychiatry 2012, 3, 19. [Google Scholar] [CrossRef]
  17. Turrini, L.; Sorelli, M.; De Vito, G.; Credi, C.; Tiso, N.; Vanzi, F.; Pavone, F.S. Multimodal Characterization of Seizures in Zebrafish Larvae. Biomedicines 2022, 10, 951. [Google Scholar] [CrossRef]
  18. Thijs, R.D.; Surges, R.; O’Brien, T.J.; Sander, J.W. Epilepsy in Adults. Lancet 2019, 393, 689–701. [Google Scholar] [CrossRef]
  19. Roberts, A.C.; Chornak, J.; Alzagatiti, J.B.; Ly, D.T.; Bill, B.R.; Trinkeller, J.; Pearce, K.C.; Choe, R.C.; Campbell, C.S.; Wong, D.; et al. Rapid Habituation of a Touch-Induced Escape Response in Zebrafish (Danio Rerio) Larvae. PLoS ONE 2019, 14, e0214374. [Google Scholar] [CrossRef]
  20. Fisher, R.S.; Acharya, J.N.; Baumer, F.M.; French, J.A.; Parisi, P.; Solodar, J.H.; Szaflarski, J.P.; Thio, L.L.; Tolchin, B.; Wilkins, A.J.; et al. Visually Sensitive Seizures: An Updated Review by the Epilepsy Foundation. Epilepsia 2022, 63, 739–768. [Google Scholar] [CrossRef]
  21. Miguel Sanz, C.; Martinez Navarro, M.; Caballero Diaz, D.; Sanchez-Elexpuru, G.; Di Donato, V. Toward the Use of Novel Alternative Methods in Epilepsy Modeling and Drug Discovery. Front. Neurol. 2023, 14, 1213969. [Google Scholar] [CrossRef]
  22. Wang, Y.; Wei, P.; Yan, F.; Luo, Y.; Zhao, G. Animal Models of Epilepsy: A Phenotype-Oriented Review. Aging Dis. 2022, 13, 215. [Google Scholar] [CrossRef]
  23. Guo, S. Using Zebrafish to Assess the Impact of Drugs on Neural Development and Function. Expert Opin. Drug Discov. 2009, 4, 715–726. [Google Scholar] [CrossRef]
  24. Koseki, N.; Deguchi, J.; Yamashita, A.; Miyawaki, I.; Funabashi, H. Establishment of a Novel Experimental Protocol for Drug-Induced Seizure Liability Screening Based on a Locomotor Activity Assay in Zebrafish. J. Toxicol. Sci. 2014, 39, 579–600. [Google Scholar] [CrossRef]
  25. Baraban, S.C.; Taylor, M.R.; Castro, P.A.; Baier, H. Pentylenetetrazole Induced Changes in Zebrafish Behavior, Neural Activity and c-Fos Expression. Neuroscience 2005, 131, 759–768. [Google Scholar] [CrossRef]
  26. Wong, K.; Stewart, A.; Gilder, T.; Wu, N.; Frank, K.; Gaikwad, S.; Suciu, C.; DiLeo, J.; Utterback, E.; Chang, K.; et al. Modeling Seizure-Related Behavioral and Endocrine Phenotypes in Adult Zebrafish. Brain Res. 2010, 1348, 209–215. [Google Scholar] [CrossRef]
  27. Gupta, P.; Khobragade, S.B.; Shingatgeri, V.M. Effect of Various Antiepileptic Drugs in Zebrafish PTZ- Seizure Model. Indian J. Pharm. Sci. 2014, 76, 157–163. [Google Scholar]
  28. Dinday, M.T.; Baraban, S.C. Large-Scale Phenotype-Based Antiepileptic Drug Screening in a Zebrafish Model of Dravet Syndrome. Eneuro 2015, 2, ENEURO.0068-15.2015. [Google Scholar] [CrossRef]
  29. Jao, L.-E.; Wente, S.R.; Chen, W. Efficient Multiplex Biallelic Zebrafish Genome Editing Using a CRISPR Nuclease System. Proc. Natl. Acad. Sci. USA 2013, 110, 13904–13909. [Google Scholar] [CrossRef]
  30. Jarque, S.; Rubio-Brotons, M.; Ibarra, J.; Ordoñez, V.; Dyballa, S.; Miñana, R.; Terriente, J. Morphometric Analysis of Developing Zebrafish Embryos Allows Predicting Teratogenicity Modes of Action in Higher Vertebrates. Reprod. Toxicol. 2020, 96, 337–348. [Google Scholar] [CrossRef]
  31. Haigis, A.-C.; Ottermanns, R.; Schiwy, A.; Hollert, H.; Legradi, J. Getting More out of the Zebrafish Light Dark Transition Test. Chemosphere 2022, 295, 133863. [Google Scholar] [CrossRef]
  32. MacPhail, R.C.; Brooks, J.; Hunter, D.L.; Padnos, B.; Irons, T.D.; Padilla, S. Locomotion in Larval Zebrafish: Influence of Time of Day, Lighting and Ethanol. Neurotoxicology 2009, 30, 52–58. [Google Scholar] [CrossRef]
  33. Bahi-Buisson, N.; Poirier, K.; Boddaert, N.; Fallet-Bianco, C.; Specchio, N.; Bertini, E.; Caglayan, O.; Lascelles, K.; Elie, C.; Rambaud, J.; et al. GPR56-Related Bilateral Frontoparietal Polymicrogyria: Further Evidence for an Overlap with the Cobblestone Complex. Brain 2010, 133, 3194–3209. [Google Scholar] [CrossRef]
  34. Johannesen, K.; Marini, C.; Pfeffer, S.; Møller, R.S.; Dorn, T.; Niturad, C.E.; Gardella, E.; Weber, Y.; Søndergård, M.; Hjalgrim, H.; et al. Phenotypic Spectrum of GABRA1: From Generalized Epilepsies to Severe Epileptic Encephalopathies. Neurology 2016, 87, 1140–1151. [Google Scholar] [CrossRef]
  35. Castaldo, P.; Del Giudice, E.M.; Coppola, G.; Pascotto, A.; Annunziato, L.; Taglialatela, M. Benign Familial Neonatal Convulsions Caused by Altered Gating of KCNQ2/KCNQ3 Potassium Channels. J. Neurosci. 2002, 22, RC199. [Google Scholar] [CrossRef]
  36. Samanta, D. PCDH19-Related Epilepsy Syndrome: A Comprehensive Clinical Review. Pediatr. Neurol. 2020, 105, 3–9. [Google Scholar] [CrossRef]
  37. Depienne, C.; Trouillard, O.; Saint-Martin, C.; Gourfinkel-An, I.; Bouteiller, D.; Carpentier, W.; Keren, B.; Abert, B.; Gautier, A.; Baulac, S.; et al. Spectrum of SCN1A Gene Mutations Associated with Dravet Syndrome: Analysis of 333 Patients. J. Med. Genet. 2008, 46, 183–191. [Google Scholar] [CrossRef]
  38. Fang, P. The Spectrum of Mutations in UBE3A Causing Angelman Syndrome. Hum. Mol. Genet. 1999, 8, 129–135. [Google Scholar] [CrossRef]
  39. Tiedeken, J.A.; Ramsdell, J.S. Embryonic Exposure to Domoic Acid Increases the Susceptibility of Zebrafish Larvae to the Chemical Convulsant Pentylenetetrazole. Environ. Health Perspect. 2007, 115, 1547–1552. [Google Scholar] [CrossRef]
  40. Ellis, L.D.; Seibert, J.; Soanes, K.H. Distinct Models of Induced Hyperactivity in Zebrafish Larvae. Brain Res. 2012, 1449, 46–59. [Google Scholar] [CrossRef]
  41. Griffin, A.; Carpenter, C.; Liu, J.; Paterno, R.; Grone, B.; Hamling, K.; Moog, M.; Dinday, M.T.; Figueroa, F.; Anvar, M.; et al. Phenotypic Analysis of Catastrophic Childhood Epilepsy Genes. Commun. Biol. 2021, 4, 680. [Google Scholar] [CrossRef]
  42. Yang, X.; Lin, J.; Peng, X.; Zhang, Q.; Zhang, Y.; Guo, N.; Zhou, S.; Li, Q. Effects of Picrotoxin on Zebrafish Larvae Behaviors: A Comparison Study with PTZ. Epilepsy Behav. 2017, 70, 224–231. [Google Scholar] [CrossRef]
  43. Devinsky, O.; Vezzani, A.; O’Brien, T.J.; Jette, N.; Scheffer, I.E.; De Curtis, M.; Perucca, P. Epilepsy. Nat. Rev. Dis. Primers 2018, 4, 18024. [Google Scholar] [CrossRef]
  44. Fisher, R.S.; Cross, H.; D’Souza, C.; French, J.A.; Haut, S.; Higurashi, N.; Hirsch, E.; Jansen, F.E.; Peltola, J.; Moshé, S.L.; et al. 2017 International League Against Epilepsy Classifications of Seizures and Epilepsy Are Steps in the Right Direction. Epilepsia 2019, 60, 1040–1044. [Google Scholar] [CrossRef]
  45. Keezer, M.R.; Sisodiya, S.M.; Sander, J.W. Comorbidities of Epilepsy: Current Concepts and Future Perspectives. Lancet Neurol. 2016, 15, 106–115. [Google Scholar] [CrossRef]
  46. Owens, M.J.; Nemeroff, C.B. Pharmacology of Valproate. Psychopharmacol. Bull. 2003, 37, 17–24. [Google Scholar]
  47. Löscher, W. Basic Pharmacology of Valproate: A Review after 35 Years of Clinical Use for the Treatment of Epilepsy. CNS Drugs 2002, 16, 669–694. [Google Scholar] [CrossRef]
  48. Rosenberg, G. The Mechanisms of Action of Valproate in Neuropsychiatric Disorders: Can We See the Forest for the Trees? Cell Mol. Life Sci. 2007, 64, 2090–2103. [Google Scholar] [CrossRef]
  49. Mula, M.; Cavanna, A.E.; Monaco, F. Psychopharmacology of Topiramate: From Epilepsy to Bipolar Disorder. Neuropsychiatr. Dis. Treat. 2006, 2, 475–488. [Google Scholar] [CrossRef]
  50. Sourbron, J.; Lagae, L. Fenfluramine: A Plethora of Mechanisms? Front. Pharmacol. 2023, 14, >1192022. [Google Scholar] [CrossRef]
  51. Samanta, D. Fenfluramine: A Review of Pharmacology, Clinical Efficacy, and Safety in Epilepsy. Children 2022, 9, 1159. [Google Scholar] [CrossRef]
  52. Gogou, M.; Cross, J.H. Fenfluramine as Antiseizure Medication for Epilepsy. Dev. Med. Child Neurol. 2021, 63, 899–907. [Google Scholar] [CrossRef]
  53. Martens, G.; Van Loo, K. Genetic and Environmental Factors in Complex Neurodevelopmental Disorders. Curr. Genom. 2007, 8, 429–444. [Google Scholar] [CrossRef]
  54. Wang, J.; Lin, Z.-J.; Liu, L.; Xu, H.-Q.; Shi, Y.-W.; Yi, Y.-H.; He, N.; Liao, W.-P. Epilepsy-Associated Genes. Seizure 2017, 44, 11–20. [Google Scholar] [CrossRef]
  55. Consortium, E. A Roadmap for Precision Medicine in the Epilepsies. Lancet Neurol. 2015, 14, 1219–1228. [Google Scholar] [CrossRef]
  56. Consortium, E. De Novo Mutations in SLC1A2 and CACNA1A Are Important Causes of Epileptic Encephalopathies. Am. J. Hum. Genet. 2016, 99, 287–298. [Google Scholar] [CrossRef]
  57. Cornet, C.; Di Donato, V.; Terriente, J. Combining Zebrafish and CRISPR/Cas9: Toward a More Efficient Drug Discovery Pipeline. Front. Pharmacol. 2018, 9, 703. [Google Scholar] [CrossRef]
  58. Porto, E.M.; Komor, A.C.; Slaymaker, I.M.; Yeo, G.W. Base Editing: Advances and Therapeutic Opportunities. Nat. Rev. Drug Discov. 2020, 19, 839–859. [Google Scholar] [CrossRef]
  59. Anzalone, A.V.; Randolph, P.B.; Davis, J.R.; Sousa, A.A.; Koblan, L.W.; Levy, J.M.; Chen, P.J.; Wilson, C.; Newby, G.A.; Raguram, A.; et al. Search-and-Replace Genome Editing without Double-Strand Breaks or Donor DNA. Nature 2019, 576, 149–157. [Google Scholar] [CrossRef]
  60. Dauncey, M.; Ingram, D. Effect of Propranolol on the Metabolism of Thyroid Hormones. Horm. Metab. Res. 1987, 19, 93–95. [Google Scholar] [CrossRef]
  61. Marini, C.; Porro, A.; Rastetter, A.; Dalle, C.; Rivolta, I.; Bauer, D.; Oegema, R.; Nava, C.; Parrini, E.; Mei, D.; et al. HCN1 Mutation Spectrum: From Neonatal Epileptic Encephalopathy to Benign Generalized Epilepsy and Beyond. Brain 2018, 141, 3160–3178. [Google Scholar] [CrossRef]
  62. Hewson, S.; Puka, K.; Mercimek-Mahmutoglu, S. Variable Expressivity of a Likely Pathogenic Variant in KCNQ2 in a Three-generation Pedigree Presenting with Intellectual Disability with Childhood Onset Seizures. Am. J. Med. Genet. A 2017, 173, 2226–2230. [Google Scholar] [CrossRef]
  63. Grone, B.P.; Qu, T.; Baraban, S.C. Behavioral Comorbidities and Drug Treatments in a Zebrafish Scn1lab Model of Dravet Syndrome. Eneuro 2017, 4, ENEURO.0066-17.2017. [Google Scholar] [CrossRef]
  64. Ding, J.; Li, X.; Tian, H.; Wang, L.; Guo, B.; Wang, Y.; Li, W.; Wang, F.; Sun, T. SCN1A Mutation—Beyond Dravet Syndrome: A Systematic Review and Narrative Synthesis. Front. Neurol. 2021, 12, 743726. [Google Scholar] [CrossRef]
  65. Eimon, P.M.; Ghannad-Rezaie, M.; De Rienzo, G.; Allalou, A.; Wu, Y.; Gao, M.; Roy, A.; Skolnick, J.; Yanik, M.F. Brain Activity Patterns in High-Throughput Electrophysiology Screen Predict Both Drug Efficacies and Side Effects. Nat. Commun. 2018, 9, 219. [Google Scholar] [CrossRef]
  66. Samarut, É.; Swaminathan, A.; Riché, R.; Liao, M.; Hassan-Abdi, R.; Renault, S.; Allard, M.; Dufour, L.; Cossette, P.; Soussi-Yanicostas, N.; et al. γ-Aminobutyric Acid Receptor Alpha 1 Subunit Loss of Function Causes Genetic Generalized Epilepsy by Impairing Inhibitory Network Neurodevelopment. Epilepsia 2018, 59, 2061–2074. [Google Scholar] [CrossRef]
  67. Robens, B.K.; Yang, X.; McGraw, C.M.; Turner, L.H.; Robens, C.; Thyme, S.; Rotenberg, A.; Poduri, A. Mosaic and Non-Mosaic Protocadherin 19 Mutation Leads to Neuronal Hyperexcitability in Zebrafish. Neurobiol. Dis. 2022, 169, 105738. [Google Scholar] [CrossRef]
  68. Helbig, I.; Abou Tayoun, A.N. Understanding Genotypes and Phenotypes in Epileptic Encephalopathies. Mol. Syndromol. 2016, 7, 172–181. [Google Scholar] [CrossRef]
  69. Covanis, A. Photosensitivity in Idiopathic Generalized Epilepsies. Epilepsia 2005, 46, 67–72. [Google Scholar] [CrossRef]
  70. Hawkins, N.A.; Jurado, M.; Thaxton, T.T.; Duarte, S.E.; Barse, L.; Tatsukawa, T.; Yamakawa, K.; Nishi, T.; Kondo, S.; Miyamoto, M.; et al. Soticlestat, a Novel Cholesterol 24-hydroxylase Inhibitor, Reduces Seizures and Premature Death in Dravet Syndrome Mice. Epilepsia 2021, 62, 2845–2857. [Google Scholar] [CrossRef]
  71. Westerfield, M. The Zebrafish Book, A Guide for the Laboratory Use of Zebrafish (Danio rerio), 4th ed.; University of Oregon: Eugene, OR, USA, 2000. [Google Scholar]
  72. Padilla, S.; Hunter, D.L.; Padnos, B.; Frady, S.; MacPhail, R.C. Assessing Locomotor Activity in Larval Zebrafish: Influence of Extrinsic and Intrinsic Variables. Neurotoxicol. Teratol. 2011, 33, 624–630. [Google Scholar] [CrossRef]
  73. Aggarwal, C.C. Outlier Analysis, 2nd ed.; Springer: Cham, Switzerland, 2017; ISBN 978-3-319-47577-6. [Google Scholar]
  74. DeOliveira-Mello, L.; Baronio, D.; Panula, P. Zebrafish Embryonically Exposed to Valproic Acid Present Impaired Retinal Development and Sleep Behavior. Autism Res. 2023, 16, 1877–1890. [Google Scholar] [CrossRef]
  75. Rajesh, V.; Deepan, N.; Anitha, V.; Kalaiselvan, D.; Jayaseelan, S.; Sivakumar, P.; Ganesan, V. Heart Malformation Is an Early Response to Valproic Acid in Developing Zebrafish. Naunyn-Schmiedebergs Arch. Pharmacol. 2020, 393, 2387–2409. [Google Scholar] [CrossRef]
  76. Lai, Y.-H.; Ding, Y.-J.; Moses, D.; Chen, Y.-H. Teratogenic Effects of Topiramate in a Zebrafish Model. Int. J. Mol. Sci. 2017, 18, 1721. [Google Scholar] [CrossRef]
  77. Moog, M.; Baraban, S.C. Clemizole and Trazodone Are Effective Antiseizure Treatments in a Zebrafish Model of STXBP1 Disorder. Epilepsia Open 2022, 7, 504–511. [Google Scholar] [CrossRef]
  78. Zhang, Y.; Kecskés, A.; Copmans, D.; Langlois, M.; Crawford, A.D.; Ceulemans, B.; Lagae, L.; De Witte, P.A.M.; Esguerra, C.V. Pharmacological Characterization of an Antisense Knockdown Zebrafish Model of Dravet Syndrome: Inhibition of Epileptic Seizures by the Serotonin Agonist Fenfluramine. PLoS ONE 2015, 10, e0125898. [Google Scholar] [CrossRef]
Figure 1. Tyr loss of function enables the selection of crispants with the highest mutation rate while keeping other behavioral and developmental parameters unchanged. (A): Dorsal (lower panels) and lateral (upper panels) images of scrambled (left panels) and tyrosinase crispants (right panels), with a reduction in pigmentation in the latest. (BD): Analysis and comparison of different relevant morphological phenotypes in both crispants (scrambled are represented in purple; tyrosinase crispants are represented in blue. The error bar represents the minimum to maximum values): body length (µm) (B), the diameter of the eyes (µm) (C) and heart area (µm2) (D). (EG): Analysis and comparison of the most relevant parameters related to epilepsy in both crispants (scrambled are represented in purple; tyrosinase crispants are represented in blue. Error bar represents the minimum to maximum values): distance moved (mm) during the dark/light cycles phase (E), maximum velocity achieved after the light flashes (mm/s) (F) and the number of angle turns after the light flashes (G). (H): Bar plot showing the mutagenesis efficiency observed in the targeted loci in pigmented larvae (dark blue) and unpigmented larvae (light blue). From left to right: mutation rate observed in the adrgr1 CDS in adrgr1 crispants; mutation rate observed in the gabra1 CDS in gabra1 crispants; mutation rate observed in the kcnq2a CDS in kcnq2a single crispants; mutation rate observed in the kcnq2a CDS in kcnq2a-kcnq2b double crispants; mutation rate observed in the kcnq2b CDS in kcnq2b single crispants; mutation rate observed in the kcnq2b CDS in kcnq2a-kcnq2b double crispants; mutation rate observed in the pcdh19 CDS in pcdh19 crispants; mutation rate observed in the scn1lab CDS in scn1lab crispants; mutation rate observed in the ube3a CDS in ube3a crispants. Error bars represent the standard error of the mean (SEM), **** p < 0.001 (t-test).
Ijms 25 02991 g001
Figure 2. Characterization of adgrg1 and gabra1 crispants. (AD). Representation of adgrg1 measurements in behavioral studies: distance moved (mm) during the dark/light cycles (A), the maximum velocity (mm/s) during the light phase in response to different PTZ concentrations (DMSO, PTZ 1 mM and PTZ 3 mM) (B), representative tracking images of scrambled (left) and adgrg1 crispants (right) after the light stimuli to induce convulsions (C) and the maximum speed (mm/s) and angle turns measures after the light stimuli (D). (EH). Representation of gabra1 measurements in behavioral studies: distance moved (mm) during the dark/light cycles (E), the maximum velocity (mm/s) during the light phase in response to different PTZ concentrations (DMSO, PTZ 1 mM and PTZ 3 mM) (F), representative tracking images of scrambled (left) and gabra1 crispants (right) after the light stimuli to induce convulsions (G) and the maximum speed (mm/s) and angle turns measures after the light stimuli (H). Scrambled are represented in blue, adgrg1 crispants are represented in dark blue and gabra1 crispants are represented in orange. The error bar represents the minimum to maximum values. ** p < 0.01, **** p < 0.001 (t-test). Next, we decided to test the possibility of inducing epileptic-like behavior by exposing the crispants to different epileptogenic stimuli. In order to trigger seizures, we employed two kinds of stimuli, namely incubation with Pentylenetetrazole (PTZ) and exposure to intermittent flashes of light. PTZ is a pro-convulsant commonly used as a pharmacological epilepsy model [25,28,39,40,41] while flashing or flickering lights are known to cause photosensitive seizures in a large number of patients affected by epilepsy [20].
Ijms 25 02991 g002
Figure 3. Characterization of kcnq2a, kcnq2b, double kcnq2a/kcnq2b and pcdh19 crispants. (AD). Representation of kcnq2a, kcnq2b and double kcnq2a/kcnq2b measurements in behavioral studies: distance moved (mm) during the dark/light cycles (A), the maximum velocity (mm/s) during the light phase in response to different PTZ concentrations (DMSO, PTZ 1 mM and PTZ 3 mM) (B), representative tracking images of scrambled (top left), kcnq2a crispants (top right), kcnq2b crispants (bottom left) and double kcnq2a/kcnq2b crispants (bottom right) after the light stimuli to induce convulsions (C), and the maximum speed (mm/s) and angle turns measures after the light stimuli (D). (EH). Representation of pcdh19 measurements in behavioral studies: distance moved (mm) during the dark/light cycles (E), the maximum velocity (mm/s) during the light phase in response to different PTZ concentrations (DMSO, PTZ 1 mM and PTZ 3 mM) (F), representative tracking images of scrambled (left) and pcdh19 crispants (right) after the light stimuli to induce convulsions (G) and the maximum speed (mm/s) and angle turns measures after the light stimuli (H). Scrambled are represented in blue, kcnq2a crispants are represented in red, kcnq2b crispants are represented in pink, double kcnq2a/kcnq2b crispants are represented in light pink and pcdh19 crispants are represented in orange. The error bar represents the minimum to maximum values. * p < 0.05, *** p < 0.005, **** p < 0.001 (t-test).
Ijms 25 02991 g003
Figure 4. Characterization of scn1lab and ube3a crispants. (AD). Representation of scn1lab measurements in behavioral studies: distance moved (mm) during the dark/light cycles (A), the maximum velocity (mm/s) during the light phase in response to different PTZ concentrations (DMSO, PTZ 1 mM and PTZ 3 mM) (B), representative tracking images of scrambled (left) and scn1lab crispants (right) after the light stimuli to induce convulsions (C) and the maximum speed (mm/s) and angle turns measures after the light stimuli (D). (EH). Representation of ube3a measurements in behavioral studies: distance moved (mm) during the dark/light cycles (E), the maximum velocity (mm/s) during the light phase in response to different PTZ concentrations (DMSO, PTZ 1 mM and PTZ 3 mM) (F), representative tracking images of scrambled (left) and ube3a crispants (right) after the light stimuli to induce convulsions (G) and the maximum speed (mm/s) and angle turns measures after the light stimuli (H). Scrambled are represented in blue, scn1lab crispants are represented in light blue and ube3a crispants are represented in green. The error bar represents the minimum to maximum values. * p < 0.05, ** p < 0.01, *** p < 0.005, **** p < 0.001 (t-test).
Ijms 25 02991 g004
Figure 5. The identification of crispants with the greatest photosensitivity can be obtained through a multiparametric analysis of their reaction to light flashes. (A): Bidimensional plot of the different variables selected as more relevant to perform the principal component analysis (PCA), with a vectorial representation. The selected variables are maximum velocity (mm/s), the number of angle turns, maximum acceleration (mm/s2), angular velocity (deg/s), mobility in the arena (%) and the cumulative duration (s) of three different mobility states, immobile, mobile and highly mobile. (B): PCA biplot comparing two main groups, the scrambled (in black) and the different studied crispants related to childhood epileptic genes (in blue). (C): The definition of two different populations depending on their activity through the calculation of Mahalanobis distance. The low activity group (in green) represents the population of analyzed larvae with a non-epileptic behavior; the high activity group (in orange) represents the population of analyzed larvae with an epileptic-like behavior in response to light flashes. (D): PCA biplot comparing the two main groups described through the Mahalanobis distance analysis, considering the different PCA variables. (E): A representation of the percentage of larvae classified in the epileptic-like population of the scrambled and all the selected crispants.
Ijms 25 02991 g005
Figure 6. Incubating scn1lab and gabra1 crispants with antiepileptic compounds offers protection against seizure-like events. (A): Tracking plots of the different crispants 2 s after the light flashes. Scale bar = 6 mm. The different plots correspond (from left to right) to scrambled, scn1lab crispants treated with DMSO (vehicle), scn1lab crispants treated with two different concentrations of fenfluramine (17.5 µM and 35 µM), topiramate (50 µM and 100 µM) and valproic acid (50 µM and 100 µM). (BD): Representation of the percentage of larvae classified in the high-activity region. Scrambled treated with DMSO are represented in dark blue in all plots, scn1lab crispants treated with DMSO are represented in light blue in all plots. (B): scn1lab crispants treated with fenfluramine 17.5 µM are represented in light purple; scn1lab crispants treated with fenfluramine 25 µM are represented in dark purple. (C). scn1lab crispants treated with topiramate 50 µM are represented in light pink; scn1lab crispants treated with topiramate 100 µM are represented in dark pink. scn1lab crispants treated with valproic acid 50 µM are represented in light green; scn1lab crispants treated with valproic acid 100 µM are represented in dark green. In all bar graphs, * p < 0.05 (binomial test).
Ijms 25 02991 g006
Table 1. Qualitative phenotypes analyzed.
ScrambledTyrosinase
Number of
Positive
Total
Number
% of
Positive
Number of
Positive
Total
Number
% of
Positive
Body curvature07501680.01
Snout jaw defects2750.030680
Yolk edema2750.030680
Necrosis1750.012680.03
Tail bending07501680.01
Notochord defects07500680
Craniofacial edema2750.030680
Fin absence07500680
Scoliosis07500680
Table 2. Candidate epilepsy-associated genes analyzed in this study.
Human GeneDiseaseZebrafish Orthologue
ADGRG1Bilateral frontoparietal polymicrogyria [33]adgrg1
GABRA1Different epileptic disorders [34]gabra1
KCNQ2Benign familial neonatal seizures [35]kcnq2a; kcnq2b
PCDH19PCDH19 Epilepsy [36] pcdh19
SCN1ADravet syndrome [37]scn1lab
UBE3AAngelman syndrome [38]ube3a
Table 3. The proportion of active larvae in the different crispants.
Target GeneNumber of
Larvae
Number of
Flash Responses
Percentage of
High-Activity Responses
scrambled1166175.1%
adgrg1862828.9%
gabra15621210.2%
kcnq2a572196%
kcnq2b551813%
kcnq2a/kcnq2b532080.6%
pcdh19501578.5%
scn1lab4618321.6%
ube3a441506.1%
Table 4. Sequences of sgRNA and the corresponding primers for indels analysis and sequencing.
Zebrafish
Gene
PrimerssgRNAsTargeted
Exon
adgrg1FW—5′-GTCATTTCTGTGTGTTCTGGGAG-3′5′-CGGTGCAGCAGGTTCCTTGA-3′;Exon 2
RV—5′-GGTGATGTTGTGATGCATGGTA-3′5′-GTCAAAGGTGATATCATCAC-3′
gabra1FW—5′-TATTCCTTTGCACTGGCTGAGA-3′5′-CTGCCTGAAGAACACATCTA-3′Exon 5
RV—5′-CGAACACAGACACCAACGAAAT-3′5′-CCCGACACGTTCTTCCACAA-3′
kcnq2aFW—5′-CCGCCAACGGGGAAGTTTA-3′5′-GGTAAATGAACGCCCAGCCG-3′;Exon 1
RV—5′-AGTTTGAGCATTCTGGGCGG-3′5′-TCTGGAGCGACCCCGCGGCT-3′
kcnq2bFW—5′-CCAGAACAAGTTCTCCAGGGA-3′5′-TGCTCGCACCTGCTGTAGGG-3′;Exon 1
RV—5′-AATTCTGCAGGCGTCGGTAA-3′5′-TTTCTCGGCCTGCGGGGCGG-3′
pcdh19FW—5′-GGACTGGAGTCGATGCCG-3′5′-TAACCCGCAAATAAGGCTGT-3′;Exon 1
RV—5′-GTGTACCGAGACTGCGTTTCT-3′5′-CGGTACCAGATTTCCCCTAG-3′
scn1labFW—5′-CATCAGCTCCCAGAGTGACC-3′5′-TGCGATGCGTTGCTCGATAG-3′;Exon 1
RV—5′-CCTTCAGGTAGTCCTACAGCCT-3′5′-TCTCCGTAGATGAACGGCAG-3′
ube3aFW—5′-ATCACAATGTGTACGCCGCT-3′5′-GTTGTGGTCGCAGTACGGTG-3′;Exon 2
RV—5′-GATCCACTCGAGGGCCTTTT-3′5′-AGCTCGCTGGACTCAGGGAT-3′
Disclaimer/Publisher’s Note: The statements, opinions and data contained in all publications are solely those of the individual author(s) and contributor(s) and not of MDPI and/or the editor(s). MDPI and/or the editor(s) disclaim responsibility for any injury to people or property resulting from any ideas, methods, instructions or products referred to in the content.

