Article

Comparative Analysis of the Mitochondrial Genomes of Chloropidae and Their Implications for the Phylogeny of the Family

1
Hubei Insect Resources Utilization and Sustainable Pest Management Key Laboratory, College of Plant Science and Technology, Huazhong Agricultural University, Wuhan 430070, China
2
College of Plant Protection, China Agricultural University, Beijing 100193, China
*
Authors to whom correspondence should be addressed.
Int. J. Mol. Sci. 2024, 25(5), 2920; https://doi.org/10.3390/ijms25052920
Submission received: 9 January 2024 / Revised: 27 February 2024 / Accepted: 29 February 2024 / Published: 2 March 2024
(This article belongs to the Section Molecular Biology)

Abstract

:
Chloropidae, commonly known as grass flies, represent the most taxonomically diverse family of Diptera Carnoidea, comprising over 3000 described species worldwide. Previous phylogenetic studies of this family have predominantly relied on morphological characters, with mitochondrial genomes being reported in a few species. This study presents 11 newly sequenced mitochondrial genomes (10 Chloropidae and 1 Milichiidae) and provides the first comprehensive comparative analysis of mitochondrial genomes for Chloropidae. Apart from 37 standard genes and the control region, three conserved intergenic sequences across Diptera Cyclorrhapha were identified in all available chloropid mitochondrial genomes. Evolutionary rates within Chloropidae exhibit significant variation across subfamilies, with Chloropinae displaying higher rates than the other three subfamilies. Phylogenetic relationships based on mitochondrial genomes were inferred using maximum likelihood and Bayesian methods. The monophyly of Chloropidae and all four subfamilies is consistently strongly supported, while subfamily relationships within Chloropidae remain poorly resolved, possibly due to rapid evolution.

1. Introduction

Chloropidae, commonly known as grass flies, is the most taxonomically diverse family of Carnoidea. It currently comprises 203 described genera and over 3000 known extant species worldwide [1,2]. Their bodies are usually mostly black or primarily yellow with black to brown stripes, and they have diverse body shapes, from short and broad to greatly elongated, with their total lengths ranging from 1.0 to 9.5 mm in size [3,4]. The origins of this family coincide with the schizophoran radiation during the early Tertiary [5], and the reported fossils have provided a glimpse into their diversity in the Eocene and Oligocene [6].
Some chloropids are of agricultural or medical importance, including crop pests of grasses and cereals (Poaceae) (e.g., Chlorops spp., Dicraeus pennisetivora, Oscinella frit, Meromyza spp., etc.), potential biocontrol agents (e.g., Thaumatomyia spp.) [4], and vectors of the pathogens of conjunctivitis and Brazilian purpuric fever (e.g., Hippelates spp.) [7,8]. Some species are known pollinators of Genoplesium (Orchidaceae) [9], Aristolochia (Aristolochiaceae) [10], Phoradendron (Santalaceae) [11], and Ceropegia (Apocynaceae) [12]. Many chloropid species are saprophagous, meaning that they live in decaying plant tissues or animal carcasses [13], and they play an important role in the decomposition of vegetable matter [8].
The monophyly of Chloropidae is widely accepted [2,4,14,15], as it is strongly supported by several synapomorphic characters: reduced chaetotaxy, developed ocellar triangle, vertical propleural carina, the absence of basal medial crossvein (bm-m) and anterior cubital cell (cell cua), and the presence of flexure in the fourth medial vein (M4) [14,15]. The Milichiidae is recovered as the sister group of Chloropidae based on molecular and morphological data [5,14,16].
The subfamily-level classification of Chloropidae has been widely discussed over recent decades (Figure 1). Members of Chloropidae are currently assigned to three or four subfamilies. Andersson [17] established a classification into three subfamilies—Siphonellopsinae, Chloropinae, and Oscinellinae—and described the tribe Rhodesiellini in the Oscinellinae. This division was accepted by Kanmiya [3], Sabrosky [18], Wheeler [19], Ismay and Nartshuk [20], Mlynarek and Wheeler [21], and Ismay et al. [4]. Nartshuk [22,23] treated Rhodesiellinae as a subfamily, which was followed by Cherian [24], Nartshuk [1], Nartshuk and Andersson [15], and Riccardi and Amorim [2], resulting in the recognition of Chloropidae comprising four subfamilies. Andersson [12,25] initially intended to reconstruct the phylogeny of the family. Due to high diversification and relatively recent evolution of chloropids, Andersson identified a considerable challenge in conducting a cladistic analysis of the family based on morphology. In his study, Andersson [25] analyzed general phylogenetic relationships within the family based on morphological data and concluded that Siphonellopsinae is the ‘basal subfamily’ (Figure 1). This is supported by most studies based on morphological data [2,3,23,26]. The relationships between Chloropinae, Oscinellinae, and Rhodesiellinae are, however, confusing. Nartshuk and Andersson [15] suggested either Chloropinae + (Oscinellinae + Rhodesiellinae) or Oscinellinae + (Chloropinae + Rhodesiellinae). Bazyar [27] suggested Chloropinae as the sister group of Siphonellopsinae + (Oscinellinae + Rhodesiellinae) (Figure 1). However, the Rhodesiellinae is poorly defined in his study, and the set of genera included in Rhodesiellinae corresponds to an early branching group of genera at the base of the Oscinellinae [27].
The dipteran mitochondrial genomes are relatively conservative in size and structure and rarely occur in gene rearrangement. Dipterans follow similar codon usage and nucleotide biases which are possibly influenced by mutational and selection pressures [28]. The mitochondrial genome phylogeny can largely reduce random phylogenetic errors arising from short genes or the high or low conservatism of individual genes [29]. Mitochondrial genomes have been widely used for phylogenetic inference for various taxonomic lineages of dipterans [30,31,32] because of their typically uniparental inheritance, lack of introns, high copy numbers, relatively simple structure, conserved gene composition, and rapid evolutionary rate [30]. However, limited attention has been given to individual chloropid mitochondrial genomes, with studies focusing primarily on Anatrichus pygmaeus [33], Chlorops oryzae [34], and Dicraeus orientalis [35]. This lack of data hinders a comprehensive phylogenetic analysis of Chloropidae. To elucidate the relationships among chloropid subfamilies, it is crucial and pressing to generate more mitochondrial genomes across the family and undertake comparative and phylogenetic analyses.
In this study, the mitochondrial genomes of 10 Chloropidae that cover all four subfamilies were newly generated and annotated, along with one Milichiidae outgroup. We integrated previously reported chloropid mitochondrial genomes; analyzed their genomic structures, nucleotide compositions, and substitutional and evolutionary rates; and reconstructed the phylogeny of the family. We aimed to (1) assess the validity of Rhodesiellinae and (2) to elucidate the subfamily-level relationships within Chloropidae.

2. Results

2.1. General Features and Genome Organization

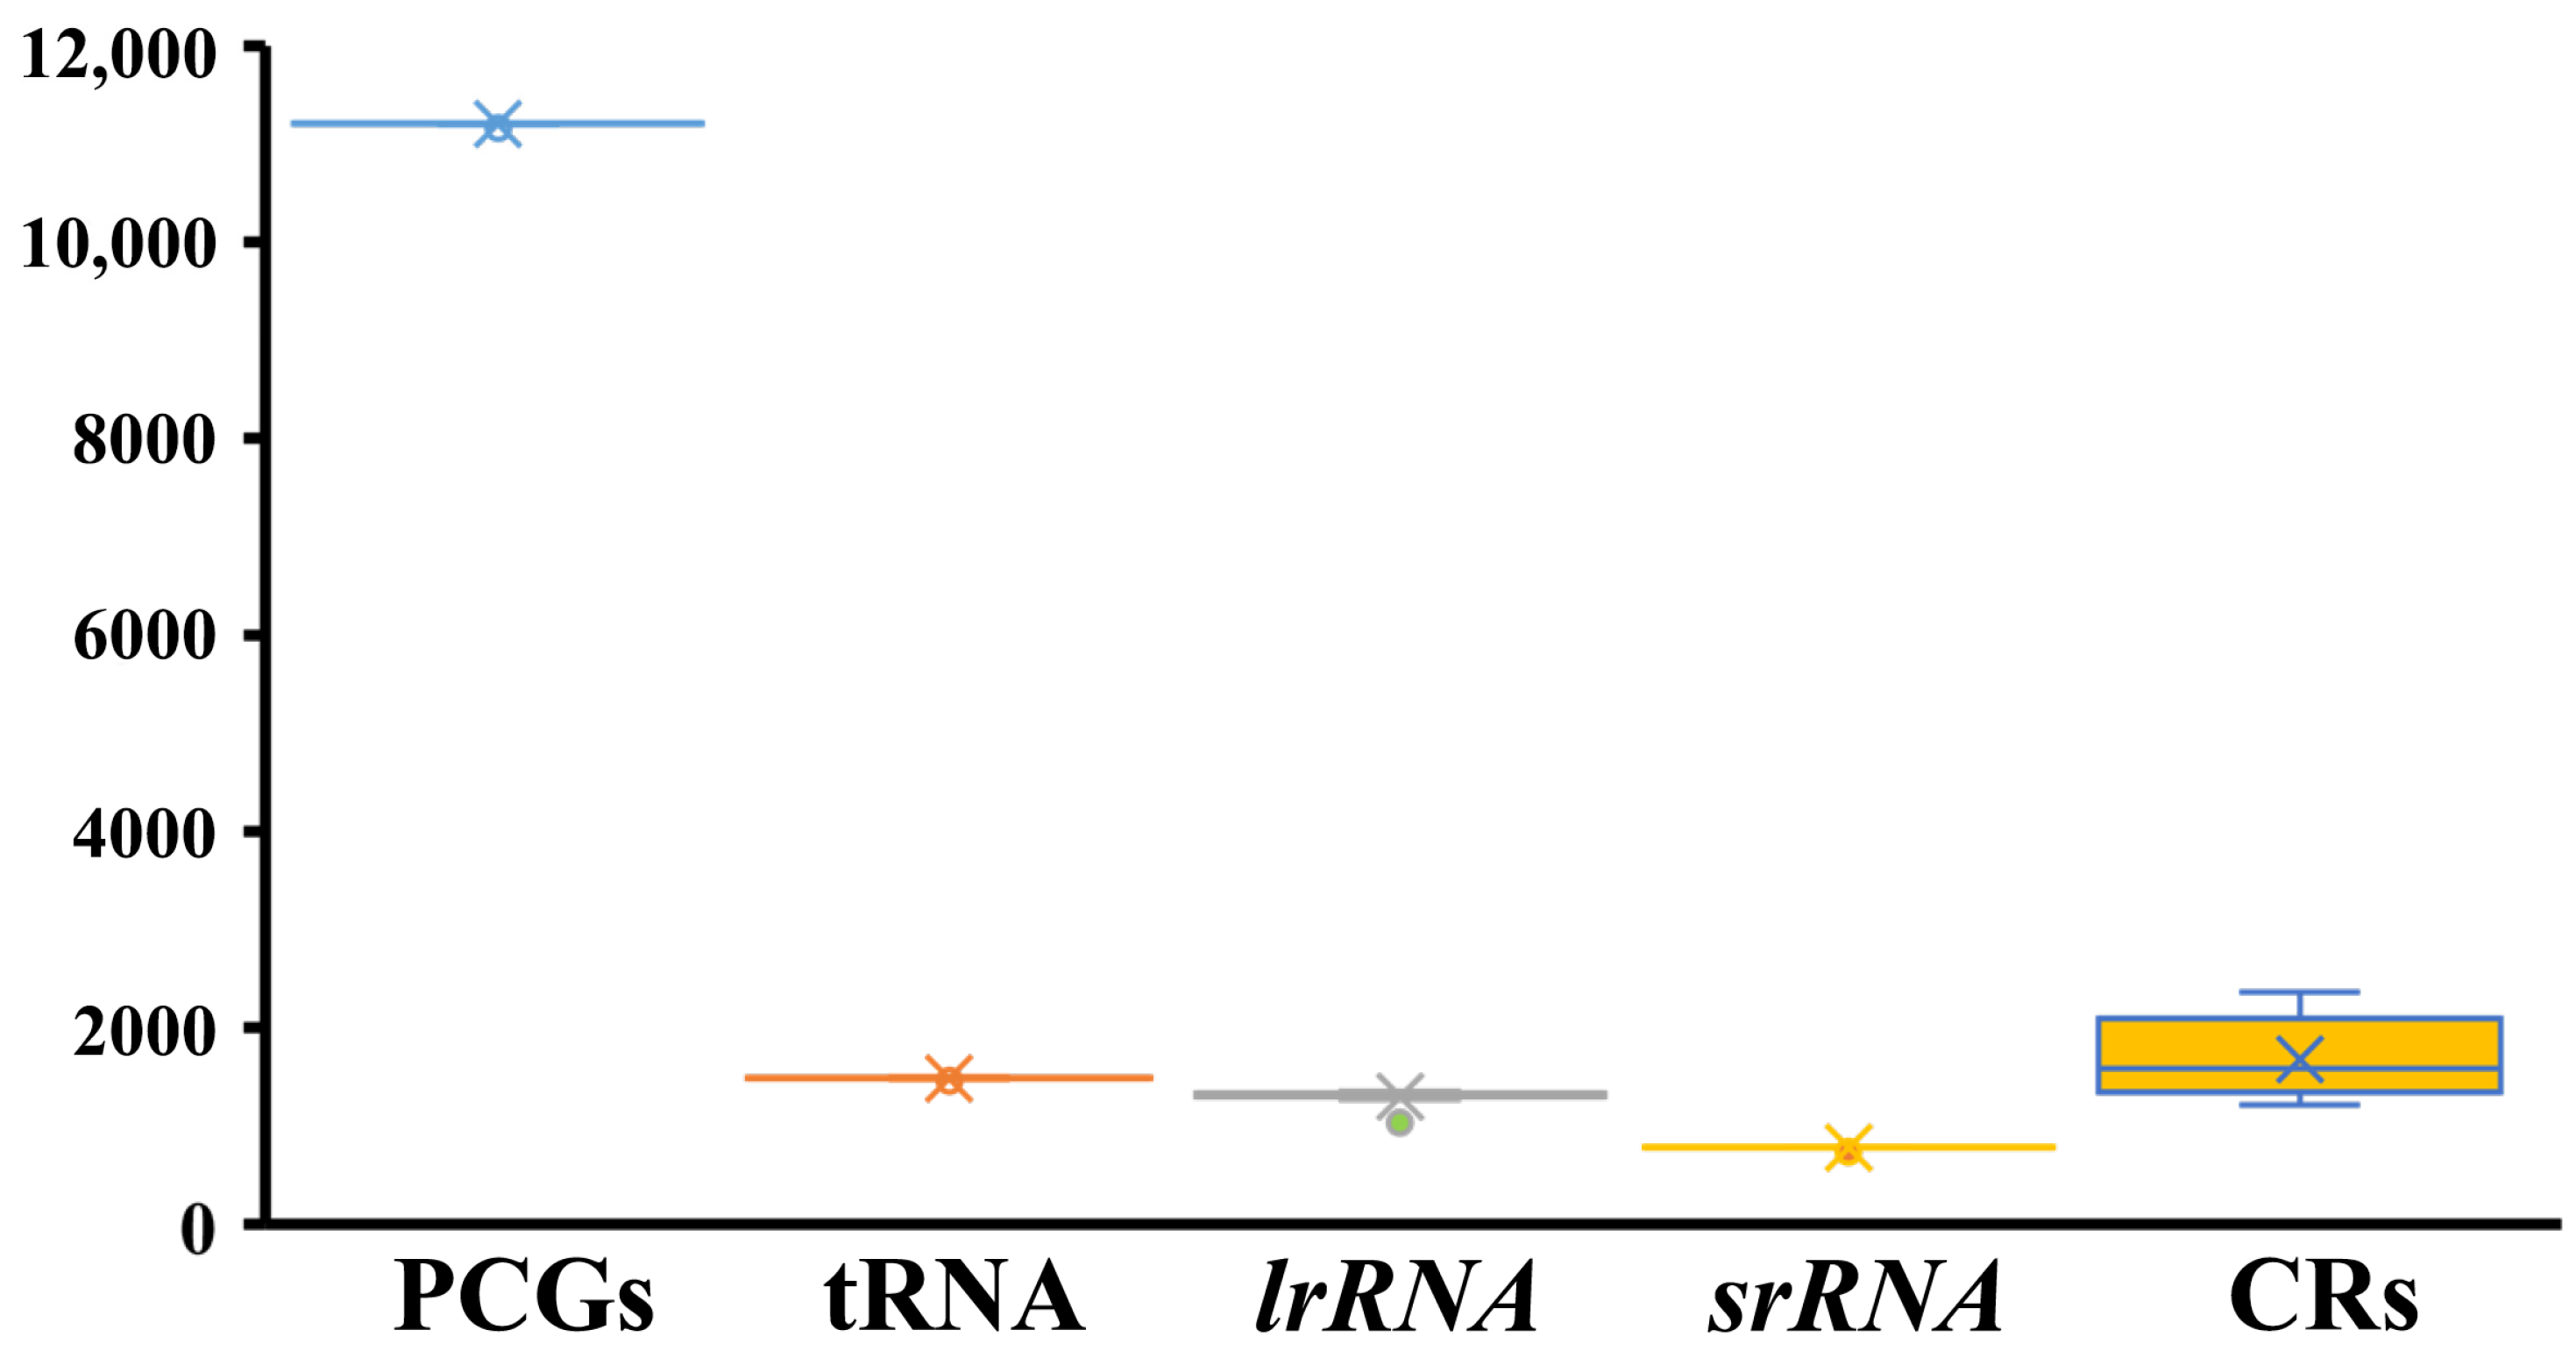
The mitochondrial genomes of ten chloropid species were successfully sequenced, resulting in five complete genomes: Apotropina sp.1, Elachiptera insignis, Rhodesiella sp., Rhodesiella elegantula, and Thaumatomyia glabra. These mitochondrial genomes are typically double-stranded circular molecules containing 37 genes (13 protein-coding genes, 2 rRNA genes, and 22 tRNA genes) and a control region (CR). Together with three previously available data, eight complete chloropid mitochondrial genomes were then utilized for our comparative analysis. The length of chloropid mitochondrial genomes ranged from 16,033 bp (Apotropina sp. 1) to 17,313 bp (Chlorops oryzae). The lengths of PCGs, tRNAs, and rRNAs for Chloropidae are nearly identical. However, significant size variation was observed in the control region (Figure 2). The majority strand (J-strand) encodes 23 genes, including 9 PCGs and 14 tRNAs, while the remaining 14 genes (4 PCGs, 8 tRNAs, and 2 rRNAs) are transcribed from the minority strand (N-strand). The gene order in chloropid mitochondrial genomes aligns with that of previously published mitochondrial genomes of Schizophora, demonstrating high conservation in Brachycera.

2.2. Base Composition

The Chloropidae mitochondrial genomes exhibit a noticeable A+T bias, ranging from 78.5% (Thaumatomyia glabra) to 80.9% (Elachiptera insignis). In the PCGs, the base composition of each codon shows that the third codon positions have much higher A + T content compared to the first and second codon positions. All Chloropidae mitochondrial genomes show a positive AT-Skew and a negative GC-Skew (Figure 3).

2.3. Protein-Coding Genes, Codon Usage, and Evolutionary Rate Analysis

The total length of the 13 PCGs in the 14 Chloropidae flies ranges from 11,170 bp (Dicraeus orientalis) to 11,252 bp (Pachylophus sp.). ATP8 is the shortest gene, while the largest gene is ND5. Most of the 13 PCGs start with the standard start codon ATN; however, in some cases, this pattern does not hold. For instance, COI of Cetema sp., Chlorops oryzae, and Meromyza saltatrix starts with ACG, and that of Anatrichus pygmaeus, Apotropina sp. 1, Apotropina sp. 2, Cadrema minor, Dicraeus orientalis, Elachiptera insignis, Oscinella pusilla, Rhodesiella sp., and Rhodesiella elegantula starts with TCG. Additionally, the COII of Rhodesiella sp. starts with GTG; the ND1 of Apotropina sp. 2, Cadrema minor, Elachiptera insignis, Meromyza saltatrix, Oscinella pusilla, Rhodesiella sp., Rhodesiella elegantula, and Thaumatomyia glabra starts with TTG; and the start codon for ND5 is GTT in Cetema sp. and CTC in Meromyza saltatrix. All PCGs end with TAA, TAG, or truncated termination codons such as TA or single T. The relative synonymous codon usage (RSCU) of mitogenomes across all subfamilies was calculated (Figure S1). Ser2 and Leu2 are the two most frequently utilized amino acids in Chloropidae.
To better comprehend the evolutionary rate of PCGs, we analyzed the mean ratios (ω) of non-synonymous to synonymous substitutions of the 13 PCGs to represent the selection pressures. Most of the ω values of PCGs are less than 1, except for the ATP8 of some species (Apotropina sp.2: 1.10, Cadrema minor: 1.11, Cetema sp.1: 1.46, and Pachylophus sp.1: 1.20), which may be due to its sequence being too short (Figure S2). This result suggested that these protein-coding genes are evolving under a purifying selection. Within these PCGs, on average, ATP8 (with ω = 0.89) demonstrates a relatively high value, suggesting it has undergone relaxed selection. By contrast, COI possesses the lowest Ka/Ks ratio (with ω = 0.07) and exhibits a strong purifying selection.
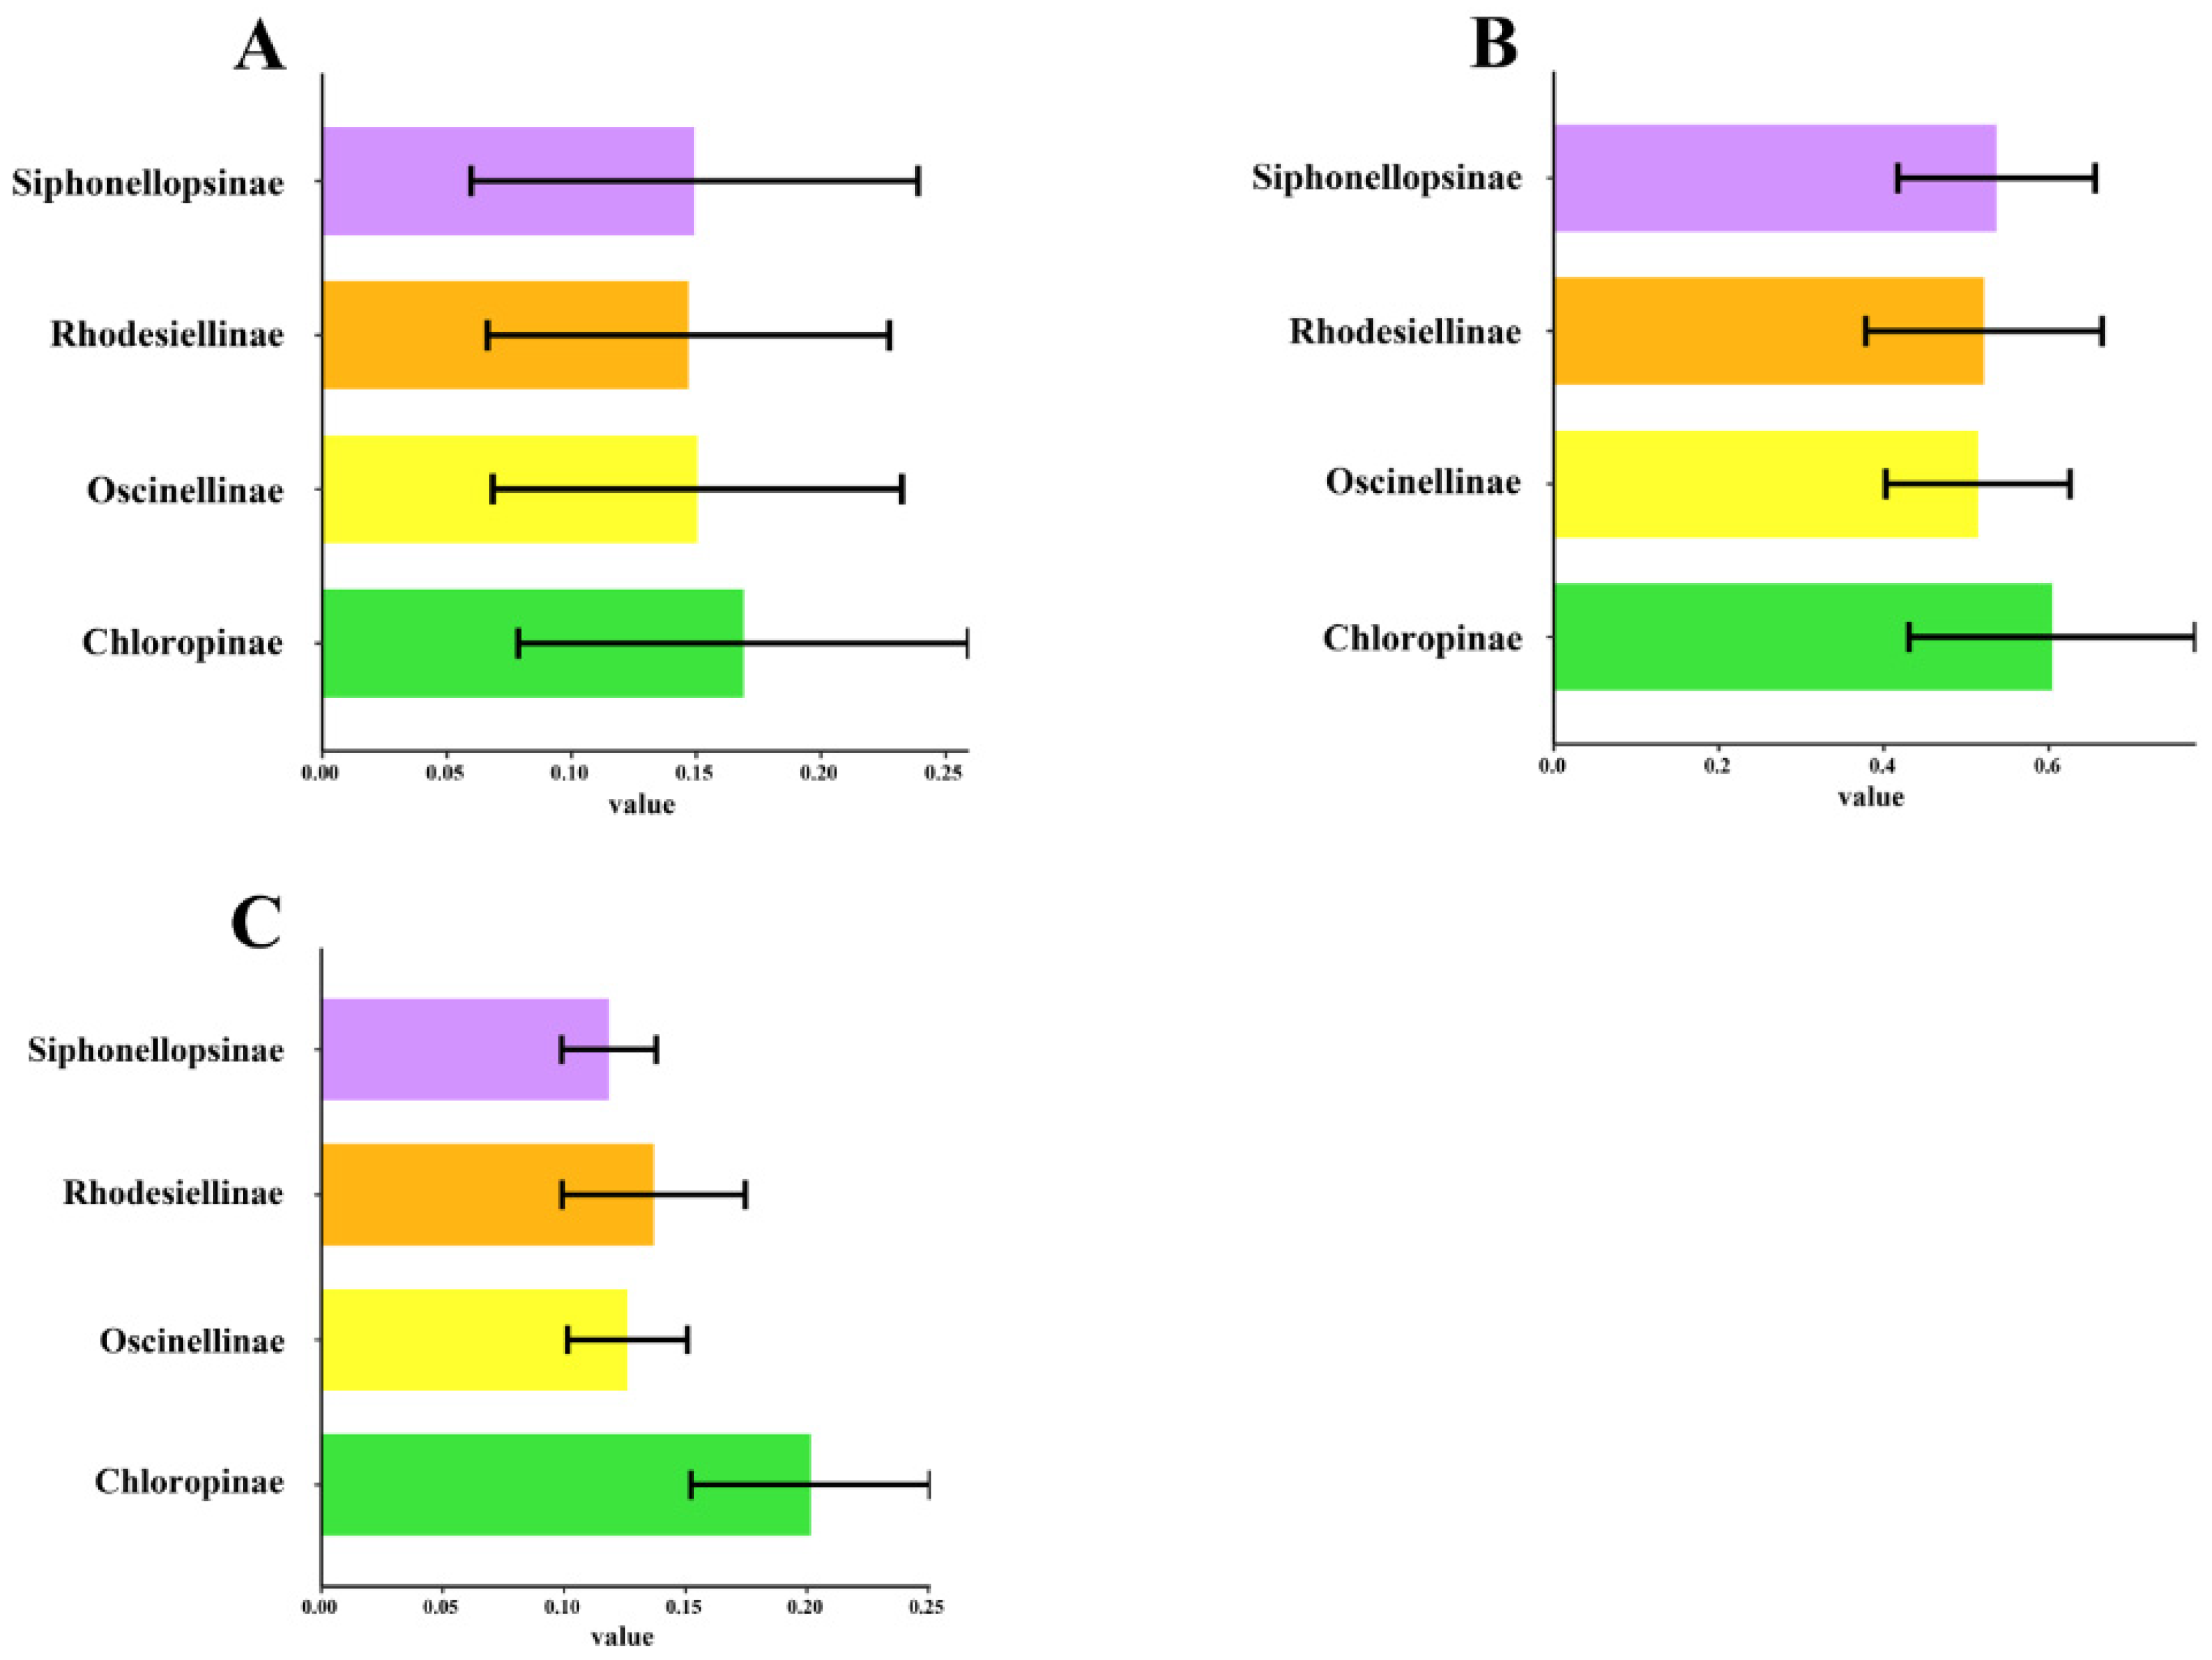
The subfamily Chloropinae exhibits a higher substitution value than Oscinellinae, Siphonellopsinae, and Rhodesiellinae (Figure 4). High substitution accumulation and faster changes in the genetic sequence suggest that the species has undergone significant genetic changes in a relatively short time, indicating potentially rapid diversification [36]. In contrast to the other three subfamilies, Chloropinae exhibits higher base substitution rates and genetic distances, implying that they may have undergone rapid evolution.

2.4. Intergenic Sequences

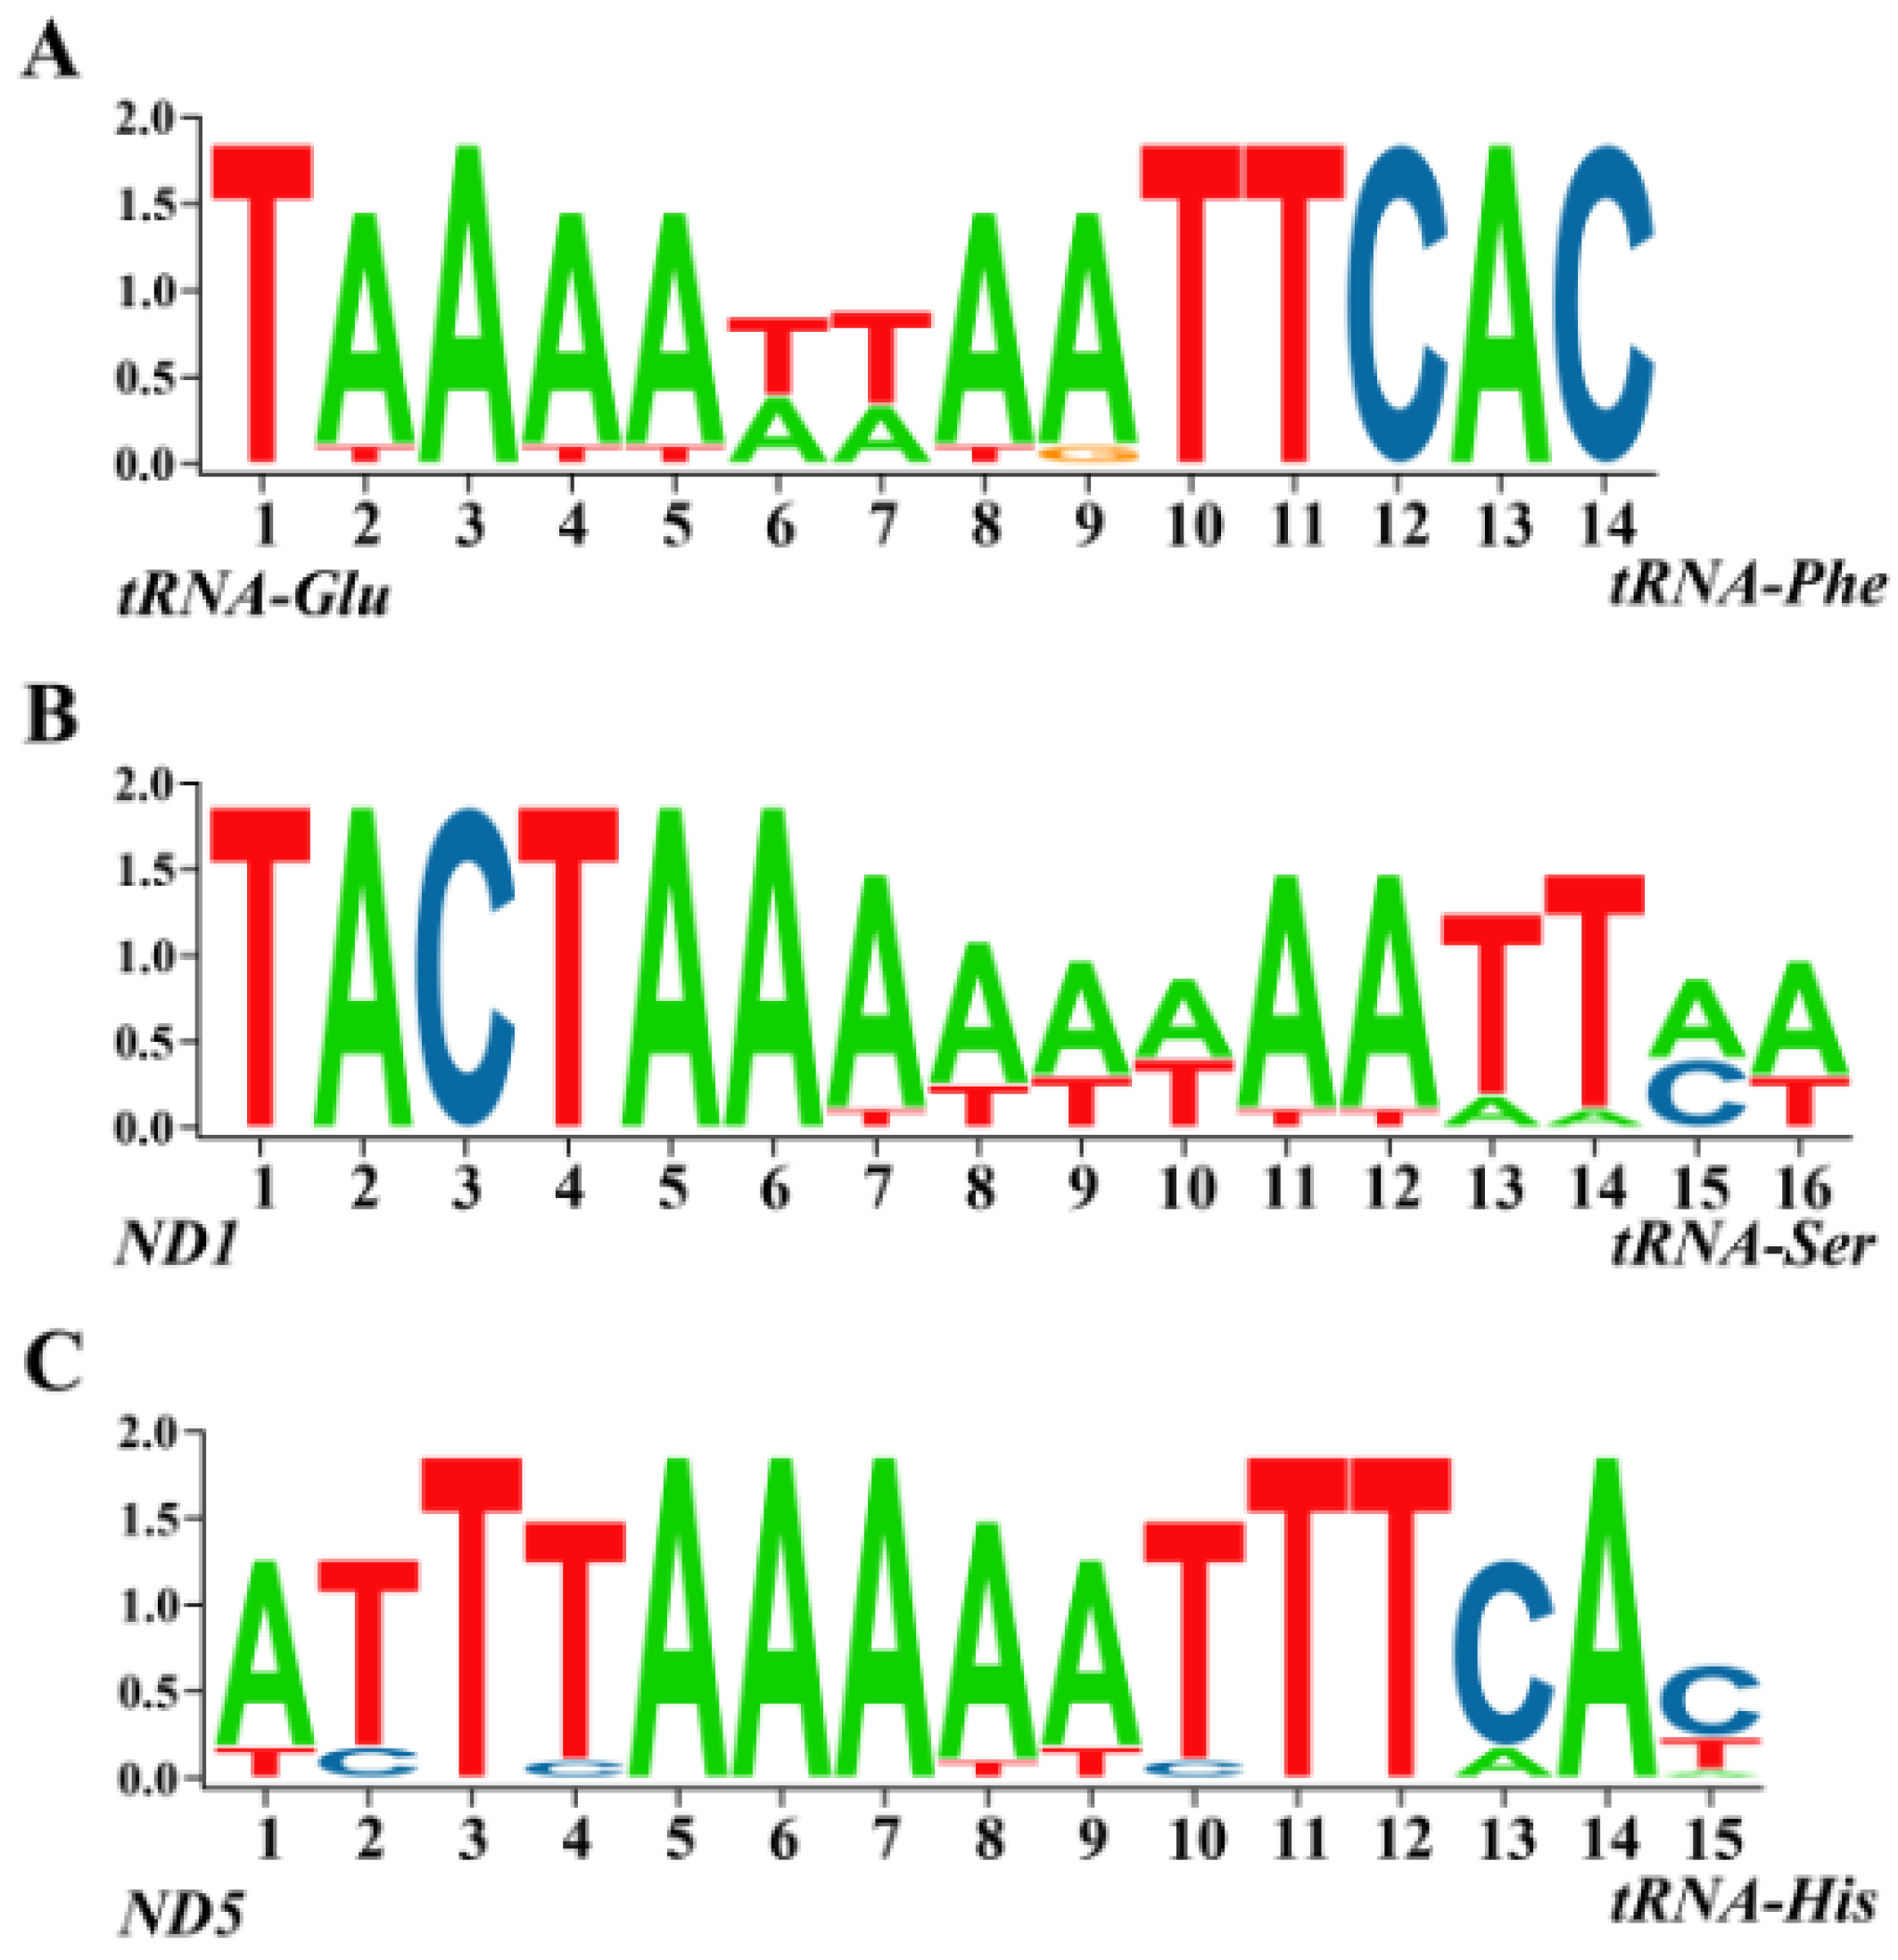
Previous studies on mitochondrial genomes of Cyclorrhapha have identified three conserved intergenic spacers: 18 bp between ND1 and tRNASer (UCN), 18 bp between tRNAGlu and tRNAPhe, and 15 bp between tRNAHis and ND5 [31,32]. All three of these conserved intergenic spacers were detected in chloropid mitochondrial genomes. Specifically, the spacer between tRNAGlu and tRNAPhe contains a 14 bp conserved sequence across all 14 examined chloropid flies; the spacer between ND1 and tRNASer (UCN) exhibits a 16 bp conserved sequence, and the spacer between ND5 and tRNAHis shows a 15 bp conserved sequence. Conserved intergenic sequence blocks are presented in Figure 5.

2.5. Phylogenetic Analyses

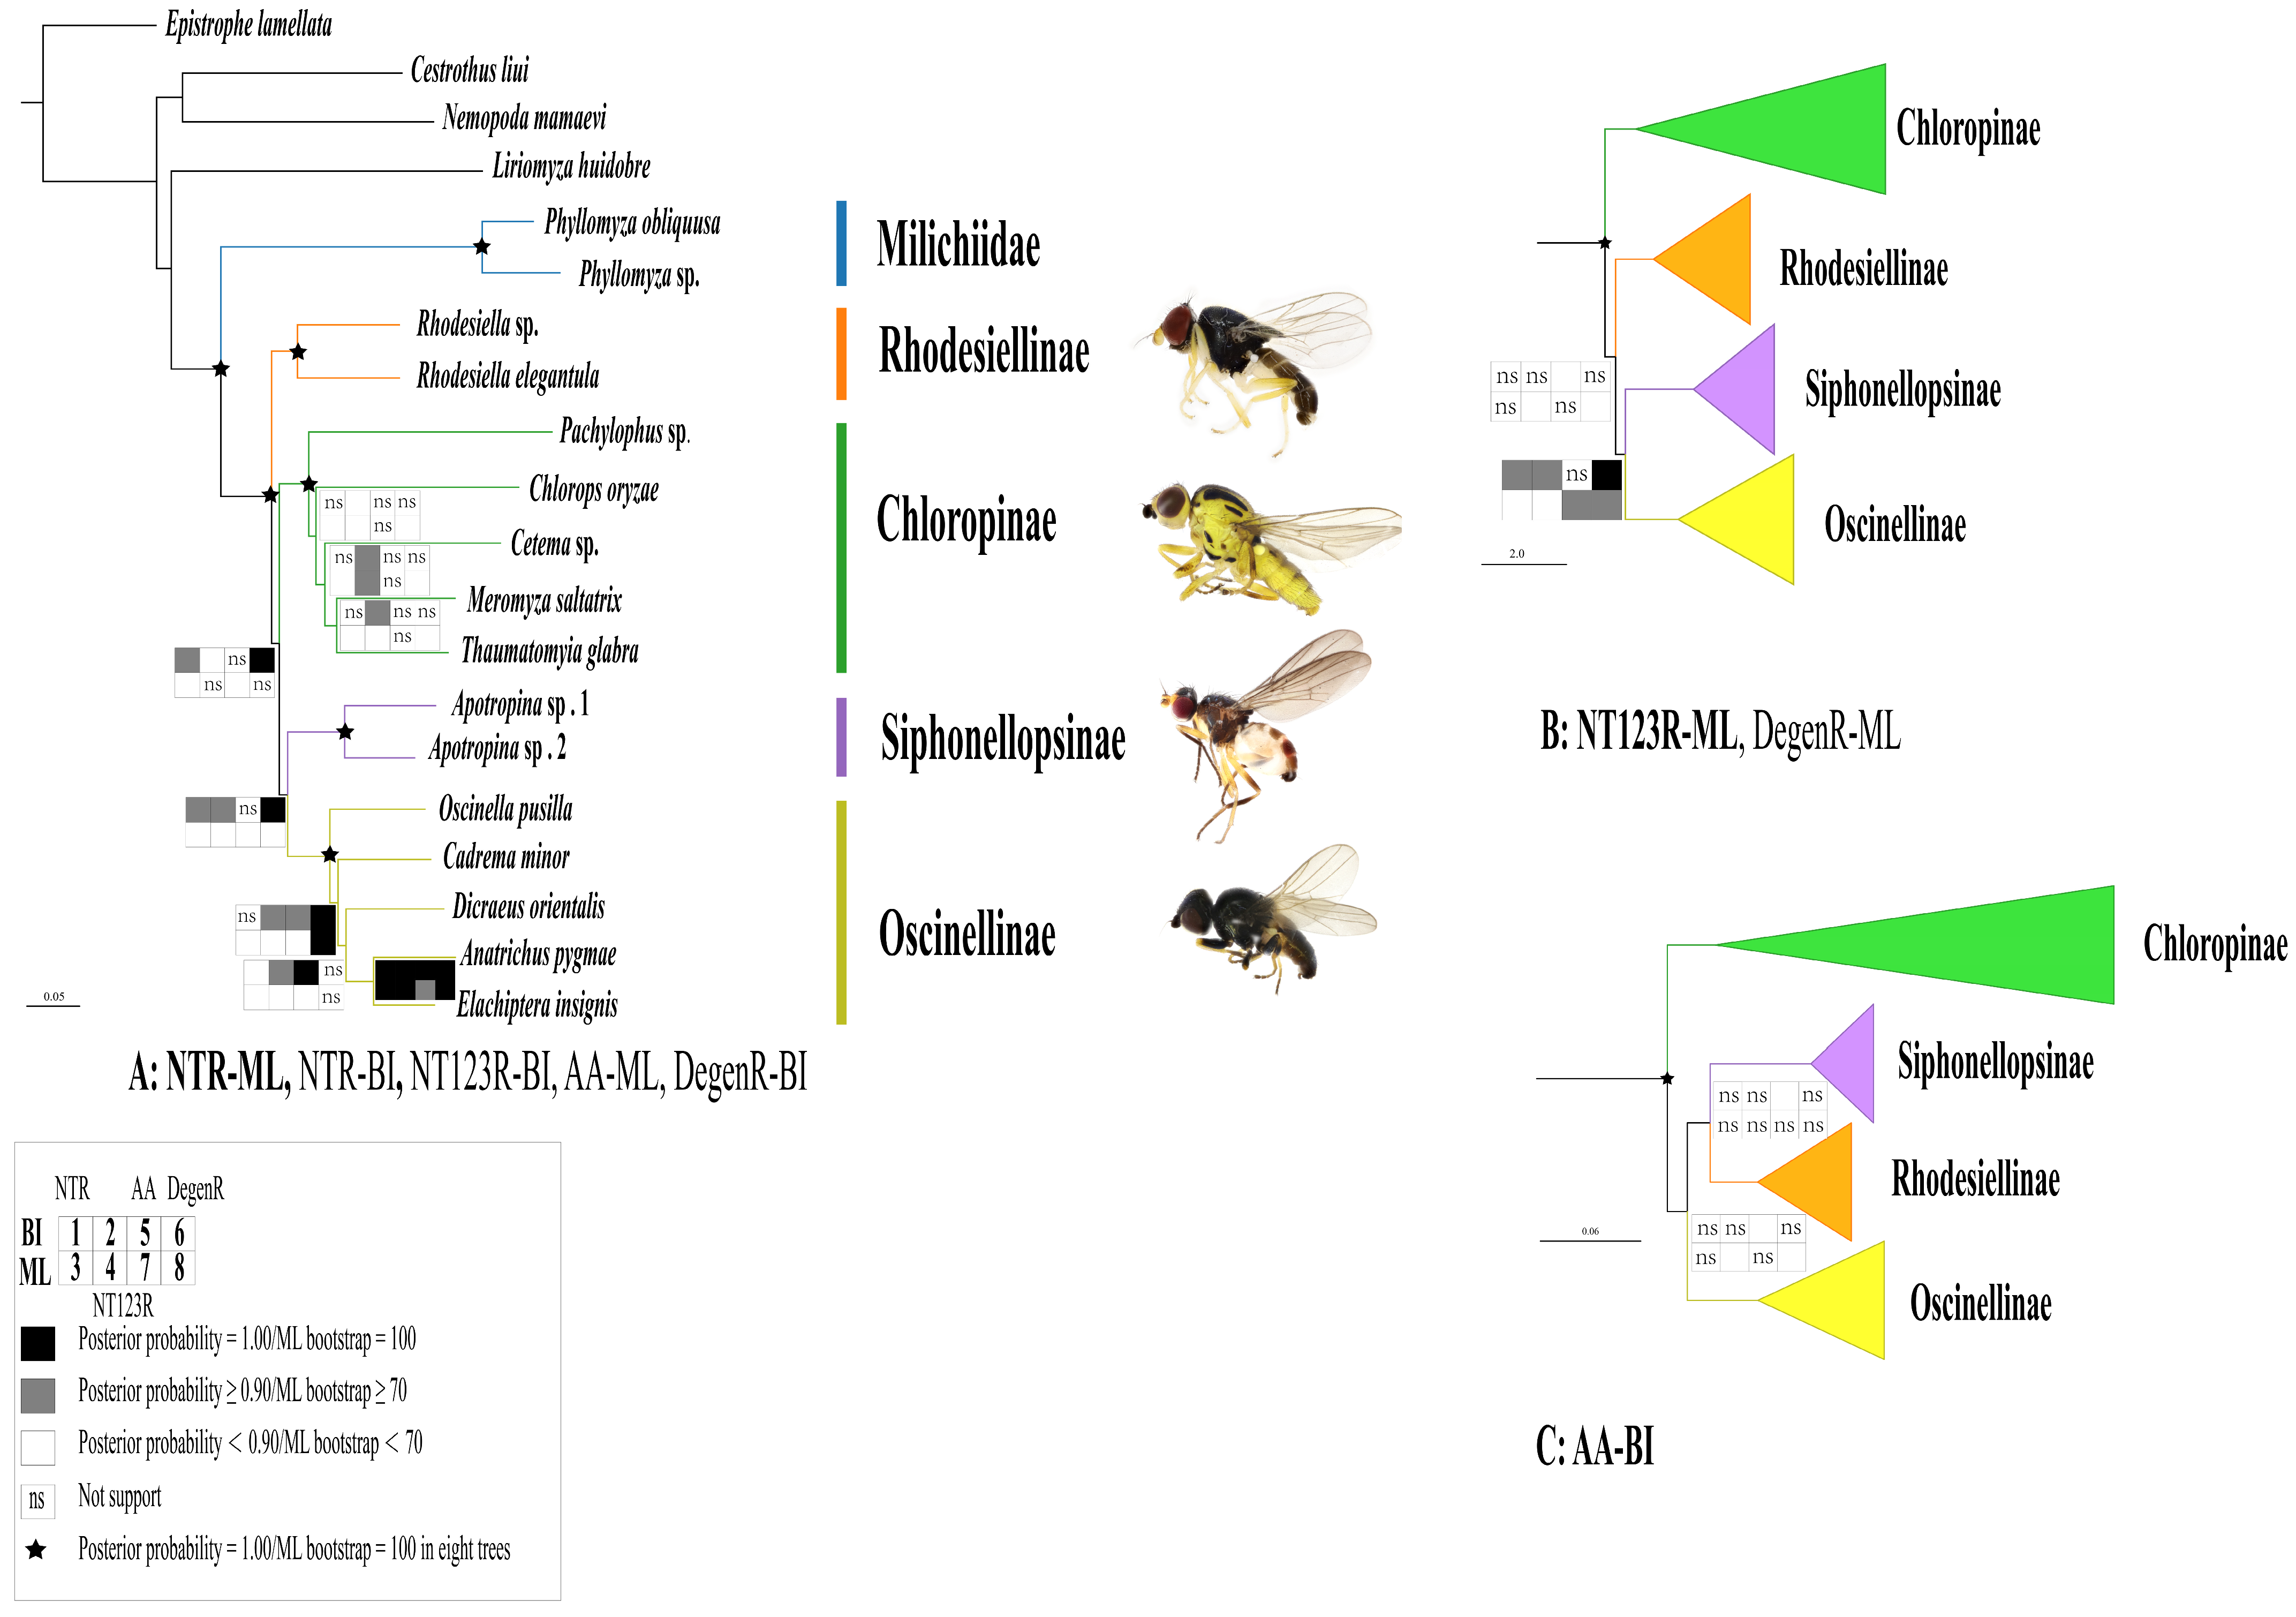
The phylogenetic tree obtained from Bayesian and maximum likelihood (ML) analyses yielded similar topological structures across all four datasets, and the majority of the nodes are robustly supported. The monophyly of the Chloropidae, Rhodesiellinae, Siphonellopsinae, and Oseinellinae was consistently fully supported by all analyses (posterior probability = 1.00 for all datasets; ML bootstrap = 100 for all datasets), similar to the sister group relationship between Chloropidae and Milichiidae (Figure 6). This is consistent with previous phylogenetic studies [5,16].
Relationships among four chloropid subfamilies were not robustly resolved, and three different topologies were generated based on eight phylogenetic estimations (Figure 6). Rhodesiellinae was weakly to fully supported as the sister group of remainders of the family by five analyses (NTR-ML, NTR-BI, NT123R-BI, AA-ML, and DegenR-BI) (Figure 6A). The remaining three analyses (NT123R-ML, DegenR-ML, and AA-BI) recovered Chloropinae as the earliest branching lineage of Chloropidae with fully supports (Figure 6B).
The monophyly of Siphonellopsinae + Oscinellinae was consistently supported in all analyses except AA-BI. This relationship was robustly supported by BI analyses with the degenerated nucleotide dataset and moderately supported by nucleotide datasets regardless of the partitioning schemes, whereas the ML method consistently provided weak supports (Figure 6A,B). The AA-BI analysis proposed Siphonellopsinae as the sister to Rhodesiellinae with weak supports (Figure 6C).

3. Discussion

In this study, we analyzed 14 chloropid mitochondrial genomes, including 10 newly sequenced genomes from four subfamilies. The nucleotide composition is highly biased towards A + T, ranging from 78.5% to 80.9%, which is similar to that of other dipteran flies [30,31]. Comparative analyses revealed that the chloropid mitogenomes are conserved in structure, which is consistent with all previously published mitochondrial genomes of Schizophora [31]. The 13 PCGs present multiple types of starting codons: the standard start codon (e.g., ATN) and no standard start codon (e.g., ACG, TCG, GTG, TTG, GTT, CTC). This result has also been found in previous studies [31]. The evolutionary rates of Chloropidae exhibit variation across subfamilies, with Chloropinae displaying a higher rate compared to the other three subfamilies, suggesting that Chloropinae may have undergone rapid evolution.
Three conserved intergenic sequences across Cyclorrhapha were found from all available chloropid mitochondrial genomes. Intergenic sequences serve multiple crucial roles in the genome. They contain regulatory elements such as promoters, enhancers, and transcription factor binding sites, which play a role in regulating gene expression [37]. The non-coding region situated between ND1 and tRNASer (UCN) serves as the binding site for MtTERM, a highly conserved 7 bp motif across insects [38]. MtTERM regulates the expression levels of the rRNA genes relative to the protein-coding genes [37,39]. Furthermore, intergenic sequences are also important resources for the study of species evolution and phylogeny [40].
The subfamily-level relationships of Chloropidae have long been a topic of significant controversy across different phylogenetic analyses [3,15,25,26,27]. In the present study, maximum likelihood and Bayesian inference conducted on four datasets (NTR, NTR123, AA, and DegenR) indicated the monophyly of Chloropidae and all four subfamilies, which supports the previous hypothesis of monophyly [22,23,27]. Initially proposed as a tribe of Oscinellinae [17], Rhodesiellinae was elevated to subfamily status by Nartshuk [22,23]. However, the validity of Rhodesiellinae as a subfamily was doubted, as it was demonstrated to be paraphyletic in relation to the Oscinellinae based on morphological characters [27]. Three analyses indicated Chloropinae as the earliest branching lineage of Chloropidae with strong supports, consistent with Bazya’s findings based on morphological characters [27]. Although some morphological studies also showed that Siphonellopsinae is a sister to the remaining Chloropidae [2,3,15], this relationship was never recovered in our analyses.
Our study provides the first comprehensive molecular-based subfamily-level phylogenetic estimates on Chloropidae. However, the subfamily relationships within Chloropidae remain unresolved. This could be due to our limited taxon sampling within the diverse group of Chloropidae and mitochondrial genomes may lack adequate phylogenetic signals for resolving these relationships. Future studies should consider incorporating a more comprehensive taxon and gene sampling to effectively address this issue.

4. Methods and Materials

4.1. Taxon Sampling and DNA Extraction

We newly sequenced mitochondrial genomes of 10 chloropid species representing all four subfamilies, as well as one Milichiidae outgroup (Table 1). Adult flies were collected by net-sweeping in the field and preserved in 100% ethanol at −20 °C before DNA extraction. Specimens were identified based on morphological characteristics by Xiaoyan Liu using keys in Kanmiya [3], Yang and Yang [41], and Nartshuk and Andersson [15]. The genomic DNA was extracted from the thoracic muscle tissues of one specimen for each species using the DNeasy DNA Extraction kit (QIAGEN, Hilden, Germany). The remaining body parts of the sampled specimens were preserved as vouchers and deposited in the Hubei Insect Resources Utilization and Sustainable Pest Management Key Laboratory at Huazhong Agricultural University, Wuhan, China. Specimen collection information and associated voucher numbers are listed in Table 1 and Table S1.

4.2. Mitochondrial Genome Sequencing and Assembly

DNA samples were pooled for next-generation sequencing library construction following Gillett et al. [42]. The library was sequenced on the Illumina NovaSeq 6000 platform, generating 150 bp paired-end reads, by Novogene CO., LTD. (Beijing China). The raw reads were filtered and trimmed using Fastp [43]. De novo assemblies of high-quality reads were conducted using IDBA-UD [44] with a similarity threshold of 98% and minimum and maximum k values of 40 and 140 bp, respectively. The bait sequence COI was amplified by standard PCR reactions using universal primers (LepF: ATTCAACCAATCATAAAGATATTGG, LepR: TAAACTTCTGGATGTCCAAAAAATCA) as in Hajibabaei et al. [45], and a BLAST search was carried out with BioEdit 7.0.5.3 to identify the best-fit mitochondrial contigs [46].

4.3. Bioinformatic Analysis

Gene sequences were initially annotated by the MITOS Web Server (http://mitos2.bioinf.uni-leipzig.de/index.py (accessed on 3 January 2022)) [47]. Subsequently, PCGs and rRNA genes were manually modified by aligning with Dicraeus orientalis in Geneious. The locations of tRNA genes were confirmed by ARWEN 1.2 (http://mbio-serv2.mbioekol.lu.se/ARWEN/ (accessed on 3 January 2022)) [48]. The nucleotide composition of mitochondrial genomes and relative synonymous codon usage (RSCU) values of each PCG were analyzed using PhyloSuite v1.2.3 [49]. Genomic DNA compositional differences between genes were measured using AT-skew [(A − T)/(A + T)] and GC-skew [(G − C)/(G + C)]. KaKs_Calculator 2.0 was utilized to calculate the non-synonymous (Ka) and synonymous (Ks) substitution rates of the PCGs [50].
Table 1. Information of samples for the phylogenetic analyses used in the study.
FamilySubfamilySpeciesAccession NumberReference
Outgroup
SyrphidaeSyrphinaeEpistrophe lamellataMZ398236[51]
SepsidaeSciomyzoideaNemopoda mamaeviKM605250[31]
Lauxaniidae Cestrotus liuiKX372559[32]
AgromyzidaePhytomyzinaeLiriomyza huidobrensisJN570505[52]
Milichiidae Phyllomyza sp.OP612805this study
Phyllomyza obliquusaMT462165[16]
Ingroup
SiphonellopsinaeApotropina sp.1OP612811this study
Apotropina sp.2OP612809this study
ChloropidaeChloropinaeCetema sp.OR522694this study
Chlorops oryzaeNC_059894[34]
Meromyza saltatrixNC_072204this study
Pachylophus sp.MT462163[16]
Thaumatomyia glabraNC_072209this study
RhodesiellinaeRhodesiella sp.OP612804this study
Rhodesiella elegantulaNC_072206this study
OscinellinaeAnatrichus pygmaeusNC_063616[33]
Cadrema minorNC_072207this study
Dicraeus orientalisNC_057210[35]
Elachiptera insignisNC_072208this study
Osciella pusillaNC_072205this study

4.4. Phylogenetic Analysis

Twenty mitochondrial genomes were employed for phylogenetic analysis. Ten newly sequenced and four GenBank-available chloropid mitochondrial genomes were used as ingroups, covering all four recognized subfamilies (Table 1). Sequences from Syrphidae, Sepsidae, Lauxaniidae, Agromyzidae, and Milichiidae were selected as outgroup taxa (Table 1).
PhyloSuite v1.2.3 was used from mitochondrial genome extraction to matrix preparation [49]. Each PCG and rRNA was aligned using the MAFFT module under the ‘--auto’ strategy [53]. All ambiguously aligned sites were removed using trimAl [54]. Alignments of individual genes were concatenated to build different datasets, and TreeSuite [55] was used to evaluate their saturations (Figures S3–S6). Four datasets and partitioning scheme combinations were prepared for phylogenetic analyses: (1) NTR, consisting of 13 PCGs and 2 rRNAs, partitioned by genes (15 partitions) consisting of 13,200 residues; (2) NT123R, consisting of 13 PCGs and 2 rRNAs, partitioned by genes and codon positions (41 partitions) consisting of 13,200 residues; (3) AA, consisting of amino acid sequences of 13 PCGs, partitioned by genes (13 partitions) consisting of 13,200 residues; (4) DegenR, consisting of ‘degenerated’ 13 PCGs and 2 rRNAs, partitioned by genes (15 partitions) consisting of 13,200 residues. The degenerated PCGs were generated using the Degen script [56,57], wherein all synonymous sites were reassigned according to the IUPAC ambiguity nomenclature.
Phylogenetic trees were constructed under maximum likelihood (ML) methods and Bayesian inference (BI). ML analyses were carried out using IQ-TREE v.2.1.3 [58]. Datasets were partitioned and model-tested in ModelFinder [59] as implemented in IQ-TREE. We found the best partition scheme after merging possible partitions (‘-MFP+MERGE’ command) and determining the best scheme under the Bayesian information criterion (BIC). The best-fitting models were used for phylogenetic reconstructions (‘-p’ command). An initial 1000 parsimony trees were generated in IQ-TREE with the command ‘-ninit 1000′, and the 100 trees with the fewest steps were used to initialize the candidate set (-ntop 100), considering all possible nearest neighbor interchanges (-allnni). These 100 trees were maintained in the candidate set during the ML tree search (-nbest 100), and unsuccessful runs were terminated after 1000 iterations (-nstop 1000). Perturbation strength was set to 0.2 (-pers 0.2), as recommended for datasets with many short sequences. We applied nearest-neighbor interchange (NNI) branch swapping to improve the tree search and limit overestimating branch supports due to severe model violations (‘-bnni’ command). Node supports were computed with 1000 UFBoot (‘-B’ command) replicates [60,61] and SH-aLRT (‘-alrt’ command) [62]. BI analysis was performed using MrBayes 3.2.7 [63]. PartitionFinder v2.1.1 was used to assess the optimal partitioning strategy and substitution model using the greedy algorithm and BIC criterion [64]. Two independent runs were executed for 1–2 million generations, with sampling occurring every 1000 generations. Additionally, four independent Markov Chain Monte Carlo (MCMC) chains were employed, consisting of three heated chains and a cold chain, and the initial 25% of samples were discarded as burn-in. When the average standard deviation of split frequencies fell below 0.01, we considered that stationarity had been reached. The phylogenetic trees generated in this study were visualized using Figtreev1.4.4 (http://tree.bio.ed.ac.uk/software/figtree/ (accessed on 25 November 2018)).
Branches were considered fully supported if SH-aLRT = 100 AND UFBoot = 100 for ML, pp = 1.0 for BI; robustly supported if SH-aLRT ≥ 80 AND UFBoot ≥ 95 for ML, pp ≥ 0.9 for BI; moderately supported if SH-aLRT ≥ 80 OR UFBoot ≥ 95 for ML, 0.9 ≥ pp ≥ 0.8 for BI; and weakly supported if SH-aLRT < 80 AND UFBoot < 95 for ML, pp < 0.8 for BI.

5. Conclusions

This study presents the first comprehensive comparative analysis of mitochondrial genomes for Chloropidae, providing valuable insights into the phylogeny and evolution of this family. The comparative analysis revealed that Chloropidae have a gene arrangement that is identical to other dipterans. Furthermore, three conserved intergenic sequence blocks were identified (ND1 and tRNASer (UCN), tRNAGlu and tRNAPhe, tRNAHis and ND5) in the mitochondrial genomes. Evolutionary rates within Chloropidae vary significantly across subfamilies, with Chloropinae exhibiting higher rates than the other three subfamilies. Moreover, the phylogenetic results supported the monophyly of Chloropidae but failed to construct a well-supported hypothesis regarding the phylogenetic relationships between four subfamilies, possibly due to rapid evolution in grass flies.

Supplementary Materials

The following supporting information can be downloaded at: https://www.mdpi.com/article/10.3390/ijms25052920/s1.

Author Contributions

Conceptualization, J.L., X.L. (Xuankun Li), and X.L. (Xiaoyan Liu); methodology, J.L. and X.L. (Xuankun Li); software, J.L.; formal analysis, J.L and J.C.; investigation, J.L.; resources, X.L. (Xiaoyan Liu); data curation, J.L.; writing—original draft preparation, J.L. and J.C.; writing—review and editing, X.C., D.Y., X.L. (Xiaoyan Liu), and X.L. (Xuankun Li); visualization, J.L.; supervision, X.L. (Xiaoyan Liu); project administration, X.L. (Xiaoyan Liu); funding acquisition, X.L. (Xiaoyan Liu). All authors have read and agreed to the published version of the manuscript.

Funding

This research was supported by the National Natural Science Foundation of China (32270482), Science & Technology Fundamental Resources Investigation Program (Grant No. 2022FY202100) and the 2115 Talent Development Program of China Agricultural University for Ding Yang and Xuankun Li.

Institutional Review Board Statement

Not applicable.

Informed Consent Statement

Not applicable.

Data Availability Statement

The mitochondrial genomes newly generated in this study have been deposited in GenBank (OP612804, OP612805, OP612809, OP612811, OR522694, NC072204-NC072209).

Acknowledgments

We are grateful to Qicheng Yang (Kunming University) and Liang Wang (Fairy Lake Botanical Garden, Chinese Academy of Sciences) for their assistance in the collection of specimens and discussion of the results. We express our thanks to the anonymous reviewers for their professional suggestions that improved the quality of this research paper. The computations in this paper were run on the bioinformatics computing platform of the National Key Laboratory of Crop Genetic Improvement, Huazhong Agricultural University.

Conflicts of Interest

The authors declare no conflicts of interest.

References

  1. Nartshuk, E.P. A check list of the world genera of the family Chloropidae (Diptera, Cyclorrhapha, Muscomorpha). Zootaxa 2012, 3267, 1–43. [Google Scholar] [CrossRef]
  2. Riccardi, P.R.; Amorim, D.D.S. Phylogenetic relationships and classification of the Chloropinae of the world (Diptera: Chloropidae). Zool. J. Linn. Soc. 2020, 190, 889–941. [Google Scholar] [CrossRef]
  3. Kanmiya, K. A systematic study of the Japanese Chloropidae (Diptera). Mem. Ent. Soc. Wash. 1983, 11, 1–370. [Google Scholar]
  4. Ismay, J.W.; Ismay, B.; Deeming, J.C. 96. Chloropidae. In Manual of Afrotropical Diptera. Volume 3. Brachycera-Cyclorrhapha, Excluding Calyptratae; Kirk-Spriggs, A.H., Sinclair, B.J., Eds.; Suricata 8; South African National Biodiversity Institute: Pretoria, South Africa, 2021; pp. 2035–2114. [Google Scholar]
  5. Wiegmann, B.M.; Trautwein, M.D.; Winkler, I.S.; Barr, N.B.; Kim, J.W.; Lambkin, C.; Bertone, M.A.; Cassel, B.K.; Bayless, K.M.; Heimberg, A.M.; et al. Episodic radiations in the fly tree of life. Proc. Natl. Acad. Sci. USA 2011, 108, 5690–5695. [Google Scholar] [CrossRef] [PubMed]
  6. Evenhuis, N.L. Catalog of the Fossil Flies of the World (Insecta: Diptera); Backhuis Publishers: Leiden, The Netherlands, 1994; pp. 1–600. [Google Scholar]
  7. Paganelli, C.H.M.; Sabrosky, C.W. Hippelates flies (Diptera: Chloropidae) possibly associated with Brazilian purpuric fever. P. Entomol. Soc. Wash. 1993, 95, 165–174. [Google Scholar]
  8. Nartshuk, E.P. Grass-fly larvae (Diptera, Chloropidae): Diversity, habitats, and feeding specializations. Entomol. Rev. 2014, 94, 514–525. [Google Scholar] [CrossRef]
  9. Bower, C.; Towle, B.; Bickel, D. Reproductive success and pollination of the Tuncurry midge orchid (Genoplesium littorale) (Orchidaceae) by chloropid flies. Telopea. 2015, 18, 43–55. [Google Scholar] [CrossRef]
  10. Oelschlägel, B.; Nuss, M.; von Tschirnhaus, M.; Pätzold, C.; Neinhuis, C.; Dötterl, S.; Wanke, S. The betrayed thief–the extraordinary strategy of Aristolochia rotunda to deceive its pollinators. New Phytol. 2015, 206, 342–351. [Google Scholar] [CrossRef]
  11. Wiesenborn, W.D. Conspecific pollen on insects visiting female flowers on the oak parasite Phoradendron coryae (Viscaceae). West. N. Am. Nat. 2016, 76, 265–274. [Google Scholar] [CrossRef]
  12. Kidyoo, A.; Kidyoo, M.; McKey, D.; Proffit, M.; Deconninck, G.; Wattana, P.; Uamjan, N.; Ekkaphan, P. Pollinator and floral odor specificity among four synchronopatric species of Ceropegia (Apocynaceae) suggests ethological isolation that prevents reproductive, Interference. Sci. Rep. 2022, 12, 13788. [Google Scholar] [CrossRef] [PubMed]
  13. Iwasa, M.; Oikawa, S.; Kanmiya, K. Siphunculina quinquangula (Loew) (Diptera, Chloropidae) new to Japan: Emergence from the remains stage of pig carcass, with the implications for forensic entomology. Med. Entomol. Zool. 2013, 64, 103–106. [Google Scholar] [CrossRef]
  14. Buck, M. A new family and genus of acalypterate flies from the Neotropical region, with a phylogenetic analysis of Carnoidea family relationships (Diptera, Schizophora). Syst. Entomol. 2006, 31, 377–404. [Google Scholar] [CrossRef]
  15. Nartshuk, E.P.; Andersson, H. The frit flies (Chloropidae, Diptera) of Fennoscandia and Denmark. Fauna. Ent. Scand. 2013, 43, 1–282. [Google Scholar]
  16. Song, N.; Xi, Y.Q.; Yin, X.M. Phylogenetic relationships of Brachycera (Insecta: Diptera) inferred from mitochondrial genome sequences. Zool. J. Linn. Soc. 2022, 196, 720–739. [Google Scholar] [CrossRef]
  17. Andersson, H. Taxonomic and phylogenetic studies on Chloropidae (Diptera) with special reference to Old World genera. Ent. Scand. Suppl. 1997, 8, 1–200. [Google Scholar]
  18. Sabrosky, C.W. An Annotated List of Genotypes of the Chloropidae of the World (Diptera). Ann. Entomol. Soc. Am. 1941, 34, 735–765. [Google Scholar] [CrossRef]
  19. Wheeler, T.A. 92. Chloropidae (frit flies, grass flies, eye gnats). In Manual of Central American Diptera; Brown, B.V., Borkent, A., Cumming, J.M., Wood, D.M., Woodley, N.E., Zumbadoeds, M.A., Eds.; NRC Research Press: Ottawa, Canada, 2010; Volume 2, pp. 1137–1153. [Google Scholar]
  20. Ismay, J.; Nartshuk, E.P. Family Chloropidae. In Contributions to a Manual of Palaearctic Diptera (with Special Reference to Flies of Economic Importance). Appendix volume; Papp, L., Darvas, B., Eds.; Science Herald: Budapest, Hungary, 2000; pp. 387–429. [Google Scholar]
  21. Mlynarek, J.J.; Wheeler, T.A. Phylogeny and revised classification of the tribe Elachipterini (Diptera: Chloropidae). Zootaxa 2018, 4471, 1–36. [Google Scholar] [CrossRef]
  22. Nartshuk, E.P. Classification of the superfamily Chloropoidea (Diptera, Cyclorrhapha). Entomol. Rev. 1984, 62, 180–193. [Google Scholar]
  23. Nartshuk, E.P. Chloropid flies (Diptera: Chloropoidea): Their system, evolution and association with plants. Trudy. Zool. Inst. 1987, 136, 1–268. (In Russian) [Google Scholar]
  24. Cherian, P.T. Chloropidae (Part 1). Siphonellopsinae and Rhodesiellinae. The Fauna of India and Adjacent Countries. Diptera Volume IX; Zoological Survey of India: Kolkata, India, 2002; pp. 1–368. [Google Scholar]
  25. Andersson, H. Problem vid kladistik analys av flugfamiljen Chloropidae. Ent. Tidskr. 1979, 100, 180–187. [Google Scholar]
  26. Brake, I. Phylogenetic systematics of the Milichiidae (Diptera, Schizophora). Entomol. Scand. 2000, 57, 1–120. [Google Scholar]
  27. Bazyar, Z.A. Comparative Morphology of Oscinellinae Genera (Diptera: Chloropidae). Ph.D. Thesis, Universidade de Sao Paulo, Sao Paulo, Brazil, 2019. [Google Scholar]
  28. Ramakodi, M.P.; Singh, B.; Wells, J.D.; Guerrero, F.; Ray, D.A. A 454 sequencing approach to dipteran mitochondrial genome research. Genomics 2015, 105, 53–60. [Google Scholar] [CrossRef]
  29. Holland, B.R.; Jermiin, L.S.; Moulton, V. Improved consensus network techniques for genome-scale phylogeny. Mol. Biol. Evol. 2005, 23, 848–855. [Google Scholar] [CrossRef]
  30. Zhang, X.; Kang, Z.H.; Ding, S.M.; Wang, Y.Y.; Borkent, C.; Saigusa, T.; Yang, D. Mitochondrial Genomes Provide Insights into the Phylogeny of Culicomorpha (Insecta: Diptera). Int. J. Mol. Sci. 2019, 20, 747. [Google Scholar] [CrossRef] [PubMed]
  31. Li, X.K.; Ding, S.M.; Cameron, S.L.; Kang, Z.H.; Wang, Y.Y.; Yang, D. The first mitochondrial genome of the sepsid fly Nemopoda mamaevi Ozerov, 1997 (Diptera: Sciomyzoidea: Sepsidae), with mitochondrial genome phylogeny of cyclorrhapha. PLoS ONE 2012, 10, e0123594. [Google Scholar] [CrossRef] [PubMed]
  32. Li, X.K.; Li, W.L.; Ding, S.M.; Cameron, S.L.; Mao, M.; Shi, L.; Yang, D. Mitochondrial Genomes Provide Insights into the Phylogeny of Lauxanioidea (Diptera: Cyclorrhapha). Int. J. Mol. Sci. 2017, 18, 773. [Google Scholar] [CrossRef] [PubMed]
  33. Cai, X.D.; Yang, D.; Liu, X.Y. The complete mitochondrial genome of Anatrichus pygmaeus Lamb, 1918 (Diptera, Chloropidae). Mitochondrial DNA B 2022, 7, 1285–1287. [Google Scholar] [CrossRef] [PubMed]
  34. Wang, J.; Li, X.Y.; Du, R.B.; Liu, Y.H. The complete mitogenome of Chlorops oryzae Matsumura (Diptera: Chloropidae). Mitochondrial DNA B 2021, 6, 1844–1846. [Google Scholar] [CrossRef] [PubMed]
  35. Liu, J.Z.; Li, X.; Cai, X.D.; Du, B.T.; Liu, X.Y.; Yang, D. The complete mitochondrial genome of Dicraeus orientalis Becker, 1911 (Diptera: Chloropidae). Mitochondrial DNA B 2021, 6, 951–952. [Google Scholar] [CrossRef] [PubMed]
  36. Yan, L.P.; Xu, W.T.; Zhang, D.; Li, J.Q. Comparative analysis of the mitochondrial genomes of flesh flies and their evolutionary implication. Int. J. Biol. Macromol. 2021, 174, 385–391. [Google Scholar] [CrossRef] [PubMed]
  37. Roberti, M.; Polosa, P.L.; Bruni, F.; Musicco, C.; Gadaleta, M.N.; Cantatore, P. DmTTF, a novel mitochondrial transcription termination factor that recognizes two sequences of Drosophila melanogaster mitochondrial DNA. Nucleic Acids Res. 2003, 31, 1597–1604. [Google Scholar] [CrossRef]
  38. Cameron, S.L.; Whiting, M.F. Mitochondrial genomic comparisons of the subterranean termites from the Genus Reticulitermes (Insecta: Isoptera: Rhinotermitidae). Genome 2007, 50, 188–202. [Google Scholar] [CrossRef]
  39. Taanman, J.W. The mitochondrial genome: Structure, transcription, translation and replication. Biochim. Biophys. Acta Bioenerg. 1999, 1410, 103–123. [Google Scholar] [CrossRef]
  40. Lee, C.; Wen, J. Phylogeny of Panax using chloroplast trnC-trnD intergenic region and the utility of trnC-trnD in interspecific studies of plants. Mol. Phylogenet. Evol. 2004, 31, 894–903. [Google Scholar] [CrossRef]
  41. Yang, D.; Yang, C.K. Chloropidae of China (Diptera). In Flies of China 1; Xue, W.Q., Chao, C.M., Eds.; Liaoning Science and Technology Press: Shenyang, China, 1998; pp. 547–573. [Google Scholar]
  42. Gillett, C.P.; Crampton-Platt, A.; Timmermans, M.J.; Jordal, B.H.; Emerson, B.C.; Vogler, A.P. Bulk de novo mitogenome assembly from pooled total DNA elucidates the phylogeny of weevils (Coleoptera: Curculionoidea). Mol. Biol. Evol. 2014, 31, 2223–2237. [Google Scholar] [CrossRef]
  43. Chen, S.F.; Zhou, Y.Q.; Chen, Y.; Gu, J. fastp: An ultra-fast all-in-one FASTQ preprocessor. Bioinformatics 2018, 34, 884–890. [Google Scholar] [CrossRef]
  44. Peng, Y.; Leung, H.C.M.; Yiu, S.M.; Chin, F.Y.L. IDBA-UD: A de novo assembler for single-cell and metagenomic sequencing data with highly uneven depth. Bioinformatics 2012, 28, 1420–1428. [Google Scholar] [CrossRef] [PubMed]
  45. Hajibabaei, M.; Janzen, D.H.; Burns, J.M.; Hallwachs, W.; Hebert, P.D. DNA barcodes distinguish species of tropical Lepidoptera. Proc. Natl. Acad. Sci. USA 2006, 103, 968–971. [Google Scholar] [CrossRef] [PubMed]
  46. Alzohairy, A.M. Bioedit: An important software for molecular biology. GERF Bull. Biosci. 2011, 2, 60–61. [Google Scholar]
  47. Donath, A.; Jühling, F.; Al-Arab, M.; Bernhart, S.H.; Reinhardt, F.; Stadler, P.F.; Middendorf, M.; Bernt, M. Improved annotation of protein-coding genes boundaries in metazoan mitochondrial genomes. Nucleic Acids Res. 2019, 47, 10543–10552. [Google Scholar] [CrossRef] [PubMed]
  48. Laslett, D.; Canback, B. ARWEN: A program to detect tRNA genes in metazoan mitochondrial nucleotide sequences. Bioinformatics 2008, 24, 172–175. [Google Scholar] [CrossRef] [PubMed]
  49. Zhang, D.; Gao, F.L.; Jakovlić, I.; Zou, H.; Zhang, J.; Li, W.X.; Wang, G.T. PhyloSuite: An integrated and scalable desktop platform for streamlined molecular sequence data management and evolutionary phylogenetics studies. Mol. Ecol. Resour. 2020, 20, 348–355. [Google Scholar] [CrossRef] [PubMed]
  50. Wang, D.; Zhang, Y.; Zhang, Z.; Zhu, J.; Yu, J. KaKs_Calculator 2.0: A toolkit incorporating gamma-series methods and sliding window strategies. Genom. Proteom. Bioinf. 2010, 8, 77–80. [Google Scholar] [CrossRef] [PubMed]
  51. Li, H.; Yan, Y.; Li, J. Eighteen mitochondrial genomes of Syrphidae (Insecta: Diptera: Brachycera) with a phylogenetic analysis of Muscomorpha. PLoS One 2023, 18, e0278032. [Google Scholar] [CrossRef] [PubMed]
  52. Wang, S.Y.; Lei, Z.R.; Wen, J.Z.; Wang, H.H.; Li, X.; Dong, B.X.; Ren, B.Z. The complete mitochondrial genome of Liriomyza huidobrensis and comparison with L. trifolii and L.sativae (Diptera: Agromyzidae). Mitochondrial DNA 2014, 25, 104–105. [Google Scholar] [PubMed]
  53. Katoh, K.; Standley, D.M. MAFFT multiple sequence alignment software version 7: Improvements in performance and usability. Mol. Biol. Evol. 2013, 30, 772–780. [Google Scholar] [CrossRef]
  54. Capella-Gutiérrez, S.; Silla-Martínez, J.M.; Gabaldón, T. trimAl: A tool for automated alignment trimming in large-scale phylogenetic analyses. Bioinformatics 2009, 25, 1972–1973. [Google Scholar] [CrossRef]
  55. Xiang, C.Y.; Gao, F.L.; Jakovlić, I.; Lei, H.P.; Hu, Y.; Zhang, H.; Zou, H. Using PhyloSuite for molecular phylogeny and tree-based analyses. iMeta 2023, 2, e87. [Google Scholar] [CrossRef]
  56. Regier, J.C.; Shultz, J.W.; Zwick, A.; Hussey, A.; Ball, B.; Wetzer, R.; Martin, J.W.; Cunningham, W.C. Arthropod relationships revealed by phylogenomic analysis of nuclear protein-coding sequences. Nature 2010, 463, 1079–1083. [Google Scholar] [CrossRef]
  57. Zwick, A.; Regier, J.C.; Zwickl, D.J. Resolving discrepancy between nucleotides and amino acids in deep-level arthropod phylogenomics: Differentiating serine codons in 21-amino-acid models. PLoS ONE 2012, 7, e47450. [Google Scholar] [CrossRef]
  58. Nguyen, L.T.; Schmidt, H.A.; von Haeseler, A.; Minh, B.Q. IQ-TREE: A fast and effective stochastic algorithm for estimating maximum-likelihood phylogenies. Mol. Biol. Evol. 2015, 32, 268–274. [Google Scholar] [CrossRef]
  59. Kalyaanamoorthy, S.; Minh, B.Q.; Wong, T.K.F.; von Haeseler, A.; Jermiin, L.S. ModelFinder: Fast model selection for accurate phylogenetic estimates. Nat. Methods 2017, 14, 587–589. [Google Scholar] [CrossRef]
  60. Minh, B.Q.; Nguyen, M.A.; von Haeseler, A. Ultrafast approximation for phylogenetic bootstrap. Mol. Biol. Evol. 2013, 30, 1188–1195. [Google Scholar] [CrossRef] [PubMed]
  61. Hoang, D.T.; Chernomor, O.; von Haeseler, A.; Minh, B.Q.; Vinh, L.S. UFBoot2: Improving the Ultrafast Bootstrap Approximation. Mol. Biol. Evol. 2018, 35, 518–522. [Google Scholar] [CrossRef] [PubMed]
  62. Guindon, S.; Dufayard, J.F.; Lefort, V.; Anisimova, M.; Hordijk, W.; Gascuel, O. New algorithms and methods to estimate maximum-likelihood phylogenies: Assessing the performance of PhyML 3.0. Syst. Biol. 2010, 59, 307–321. [Google Scholar] [CrossRef] [PubMed]
  63. Ronquist, F.; Teslenko, M.; van der Mark, P.; Ayres, D.L.; Darling, A.; Hohna, S.; Larget, B.; Liu, L.; Suchard, M.A.; Huelsenbeck, J.P. MrBayes 3.2: Efficient Bayesian phylogenetic inference and model choice across a large model space. Syst. Biol. 2012, 61, 539–542. [Google Scholar] [CrossRef] [PubMed]
  64. Lanfear, R.; Frandsen, P.B.; Wright, A.M.; Senfeld, T.; Calcott, B. PartitionFinder 2: New Methods for Selecting Partitioned Models of Evolution for Molecular and Morphological Phylogenetic Analyses. Mol. Biol. Evol. 2017, 34, 772–773. [Google Scholar] [CrossRef]
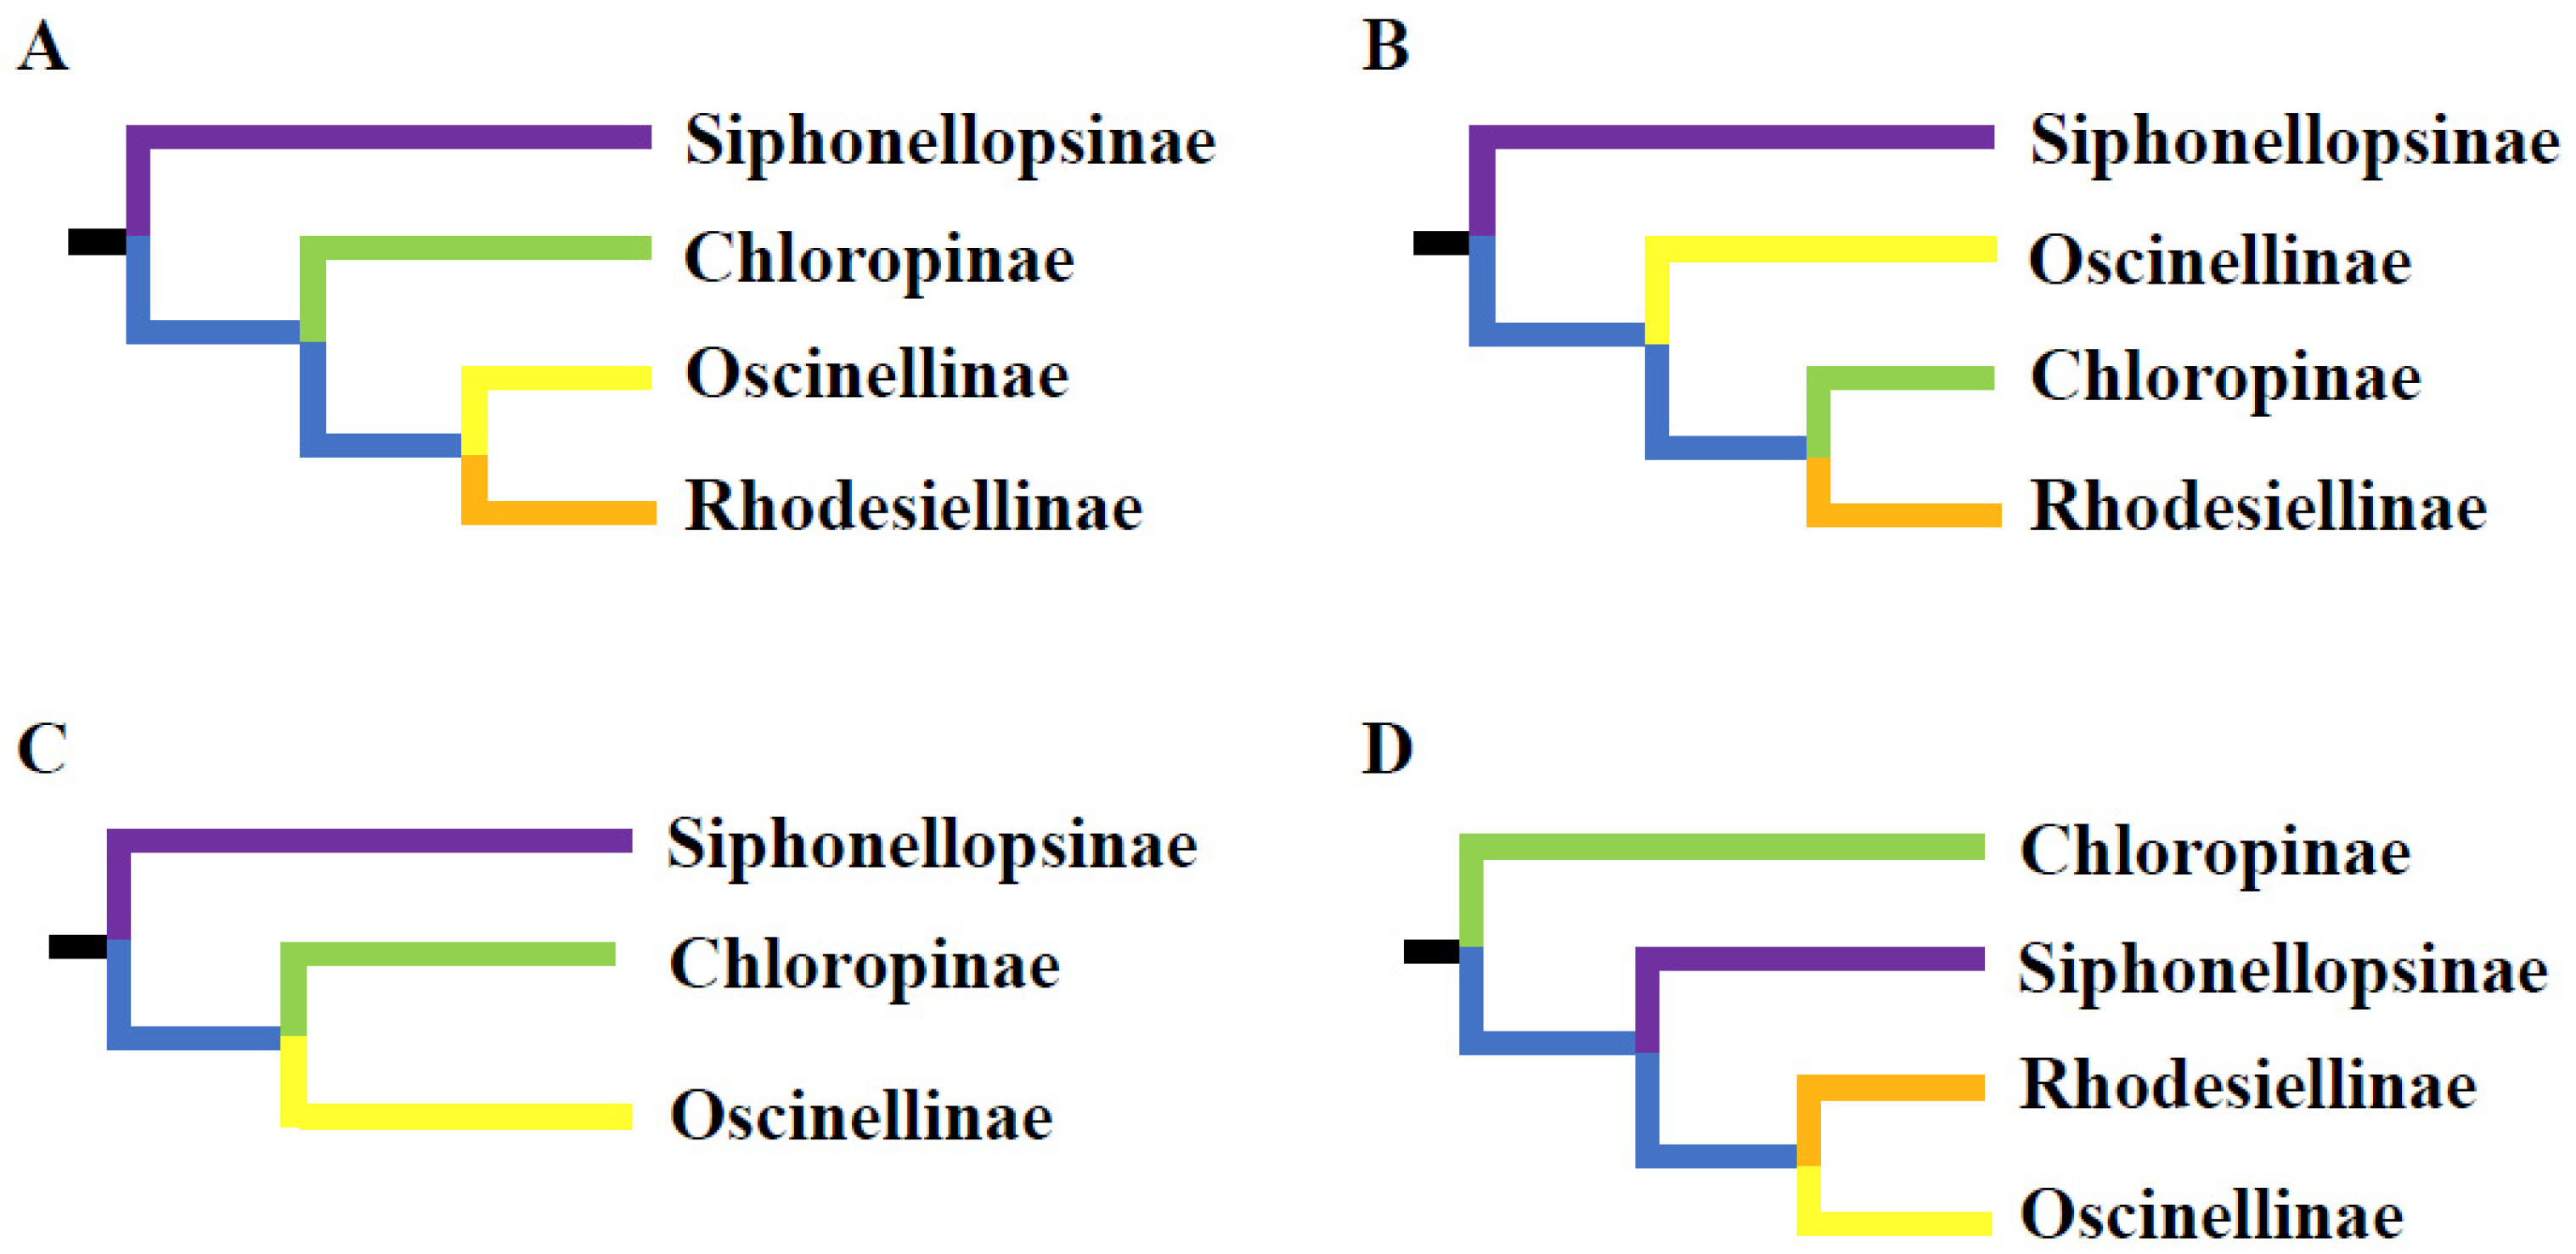
Figure 1. Phylogenetic relationships among subfamilies of the Chloropidae based on morphological data. (A,B). Nartshuk and Andersson, 2013 [15]; (C). Andersson, 1977 [25], Mlynarek and wheeler, 2018 [21]; (D). Bazya, 2019 [27].
Ijms 25 02920 g001
Figure 2. Sizes of the protein-encoding genes (PCGs), tRNAs, large ribosomal RNA (lrRNA), small ribosomal RNA (srRNA), and control region in chloropid mitochondrial genomes.
Ijms 25 02920 g002
Figure 3. AT content (%), AT-Skew, and CG-Skew of 13 chloropid mitochondrial genomes.
Ijms 25 02920 g003
Figure 4. Subfamily-specific substitutions of 13 mitochondrial protein-coding genes in Chloropidae. (A) Average non-synonymous substitution rates (Ka) ± s.d. among four subfamilies; (B) average synonymous substitution rates (Ks) ± s.d. among four subfamilies; (C) pairwise distances ± s.d. of all 13 PCGs within subfamilies.
Ijms 25 02920 g004
Figure 5. Nucleotide usage of three conserved intergenic sequences of 13 chloropid mitochondrial genomes. (A) Sequences between tRNAGlu and tRNAPhe (forward sequences); (B) sequences between ND1 and tRNASer (UCN) (reversed sequences); (C) sequences between ND5 and tRNAHis (reversed sequences).
Ijms 25 02920 g005
Figure 6. Phylogenetic trees of Chloropidae based on mitochondrial genome data. (A) Topology from ML inferences based on the NTR dataset showing relationships consistent with those recovered by NTR-BI, NT123R-BI, AA-ML, and DegenR-BI; (B) topology from ML inferences based on NT123R dataset showing relationships consistent with those recovered by DegenR-ML; (C) topology from BI based on the AA dataset. Squares at the nodes represent Bayesian posterior probabilities for 1, 2, 5, and 6 and ML bootstrap values for 3, 4, 7, and 8. The dataset of NTR corresponds to 1, 3 and 2, 4, AA to 5 and 7, DegenR to 6 and 8. A black square indicates posterior probabilities of 1.00 or an ML bootstrap of 100; a grey square indicates posterior probabilities between 0.90 and less than 1.00, or an ML bootstrap between 70 and less than 100; a white square indicates posterior probabilities less than 0.90, or an ML bootstrap less than 70; “ns” indicates a lack of support. Additionally, an asterisk is used to indicate posterior probabilities of 1.00 or ML bootstraps of 100 in all eight trees.
Ijms 25 02920 g006
Disclaimer/Publisher’s Note: The statements, opinions and data contained in all publications are solely those of the individual author(s) and contributor(s) and not of MDPI and/or the editor(s). MDPI and/or the editor(s) disclaim responsibility for any injury to people or property resulting from any ideas, methods, instructions or products referred to in the content.