Article

Orphan Nuclear Receptor Family 4A (NR4A) Members NR4A2 and NR4A3 Selectively Modulate Elements of the Monocyte Response to Buffered Hypercapnia

1
School of Medicine, University College Dublin, Dublin 4, Ireland
2
Conway Institute of Biomolecular and Biomedical Science, University College Dublin, Dublin 4, Ireland
3
Division of Thoracic Surgery, Northwestern University, Chicago, IL 60611, USA
4
Pulmonary and Critical Care Medicine, Feinberg School of Medicine, Northwestern University, Chicago, IL 60611, USA
5
School of Veterinary Medicine, University College Dublin, Dublin 4, Ireland
*
Author to whom correspondence should be addressed.
Int. J. Mol. Sci. 2024, 25(5), 2852; https://doi.org/10.3390/ijms25052852
Submission received: 12 January 2024 / Revised: 19 February 2024 / Accepted: 22 February 2024 / Published: 1 March 2024
(This article belongs to the Special Issue New Advances in Hypercapnia)

Abstract

:
Hypercapnia occurs when the partial pressure of carbon dioxide (CO2) in the blood exceeds 45 mmHg. Hypercapnia is associated with several lung pathologies and is transcriptionally linked to suppression of immune and inflammatory signalling through poorly understood mechanisms. Here we propose Orphan Nuclear Receptor Family 4A (NR4A) family members NR4A2 and NR4A3 as potential transcriptional regulators of the cellular response to hypercapnia in monocytes. Using a THP-1 monocyte model, we investigated the sensitivity of NR4A family members to CO2 and the impact of depleting NR4A2 and NR4A3 on the monocyte response to buffered hypercapnia (10% CO2) using RNA-sequencing. We observed that NR4A2 and NR4A3 are CO2-sensitive transcription factors and that depletion of NR4A2 and NR4A3 led to reduced CO2-sensitivity of mitochondrial and heat shock protein (Hsp)-related genes, respectively. Several CO2-sensitive genes were, however, refractory to depletion of NR4A2 and NR4A3, indicating that NR4As regulate certain elements of the cellular response to buffered hypercapnia but that other transcription factors also contribute. Bioinformatic analysis of conserved CO2-sensitive genes implicated several novel putative CO2-sensitive transcription factors, of which the ETS Proto-Oncogene 1 Transcription Factor (ETS-1) was validated to show increased nuclear expression in buffered hypercapnia. These data give significant insights into the understanding of immune responses in patients experiencing hypercapnia.

1. Introduction

The levels of carbon dioxide (CO2) in the blood are closely regulated in the body through acute chemosensory mechanisms that respond to changes in the levels of CO2 and adjust the rate and depth of breathing. In certain lung diseases, e.g., chronic obstructive pulmonary disease (COPD), the partial pressure of CO2 in the blood can accumulate to levels >45 mmHg, termed hypercapnia. Hypercapnia is known to suppress immune and inflammatory signalling and is a risk factor in several diseases, e.g., COPD [1]. Hypercapnia can elicit signalling acutely through modulation of chemosensory and neuronal signalling and more chronically via changes in gene expression [2]. The mechanisms through which CO2 affects transcriptional responses are not fully understood [3] and may involve different transcription factors in different contexts. Work from our group and others indicates that multiple signalling pathways are modulated by increased CO2. However, relatively few transcription factors have been tested in interventional (e.g., knockdown/knockout) studies, which is the approach we have taken here to provide mechanistic insight.
The Orphan Nuclear Receptor Family 4A family members (NR4As) (NR4A1-3) are early response genes that are activated in response to a variety of stimuli and stressors [4,5] and modulate the differentiation of monocytes: classical to non-classical monocytes (NR4A1) and to dendritic cells (NR4A3). NR4A expression is associated with several pathologies, including arthritis [6,7], atherosclerosis [8], and cancer [9,10]. Regulation of NR4A activity is primarily at the transcriptional level, with a correlation between mRNA levels and activity. In recent years, several NR4A modulators have been developed and have demonstrated efficacy in numerous models, supporting the idea that these receptors are feasible therapeutic targets [11,12]. The NR4As can also undergo post-translational modifications, specifically phosphorylation and SUMOylation, which can also affect their activity [11,13,14]. We have recently characterised the transcriptional roles of NR4A2 and NR4A3 in THP-1 monocytes, revealing significant overlap of transcriptional targets as well as more selective antigen presentation (NR4A2-dependent) and viral response (NR4A3-dependent) roles [15].
The NR4A family of transcription factors and their role in the response to elevated CO2 are the focus of this study for a number of reasons. Firstly, nuclear hormone receptors, of which NR4As are members, represent a class of genes that was initially identified as being CO2 sensitive in Caenorhabditis elegans (C. elegans) [16]. In this seminal model organism study, E3 ligases, which regulate protein degradation via the ubiquitin pathway, and genes associated with the innate immune response were key classes of genes implicated in the C. elegans response to CO2 elevation. Subsequent to this study in worms, several studies have corroborated the role of the ubiquitin pathway [17,18] and immune regulation [19,20] in the CO2 response in mammalian systems. Indeed, a recent study identified ubiquitin as a carbon-dioxide-binding protein [21]. Thus, we hypothesised that nuclear receptor family members (which were robustly CO2 sensitive in C. elegans) are worth pursuing further as potential conserved CO2-sensitive transcriptional regulators. Furthermore, we and others have demonstrated a role for altered /suppressed Nuclear Factor of Kappa Light Chain Gene Enhancer in B cells (NFκB)-dependent signalling in the cellular response to hypercapnia [21,22,23]. The NR4As are known to be both regulated by NFκB-dependent signalling and capable of regulating NFκB-dependent transcription [24,25]. Thus, the NR4A family members have the potential to act at the intersection of NFκB-dependent and CO2-dependent signalling. In this study, we employ a hypothesis-directed approach to investigate the role of the NR4A family members NR4A2 and NR4A3 in the cellular transcriptional response to buffered hypercapnia in monocytes. Through the transcriptomic analyses in our short-hairpin ribonucleic acid (shRNA) system, we also infer core gene signatures and transcription factors that respond to hypercapnia stress, independently of NR4A2/NR4A3 transcriptional effects.

2. Results

2.1. NR4A2 and NR4A3 Are CO2 Responsive in the Presence of LPS

To determine whether NR4A family members (1–3) are responsive to CO2, we exposed THP-1 monocytes to pre-equilibrated, buffered media in 5% or 10% CO2, for 8 h. For lipopolysaccharide (LPS)-treated cells, LPS was added 6, 4, 2, 1, or 0.5 h before the end of the experiment. Untreated cells were used as controls. All NR4A family members were temporarily induced by LPS. NR4A1 had the lowest fold change increase in response to LPS, while NR4A3 had the greatest inducibility. There were no statistically significant differences between 5% and 10% CO2 for NR4A1 at these time points. NR4A2 expression was significantly lower at 10% CO2 following 2 h and 4 h of LPS exposure. NR4A3 expression was significantly higher in 10% CO2 at 2 h of LPS exposure compared to 5% CO2 (Figure 1A–F). Taken together, these data indicate that elevated CO2 exposure shifts the temporal response of NR4A2 and NR4A3 to LPS stimulation. This effect is most evident at 2 h and 4 h of LPS treatment (Figure 1C,E). The CO2-dependent impact on LPS-induced NR4A expression was also evident, with decreased protein levels of NR4A2 in THP-1 cells exposed to buffered media in 5% or 10% CO2 +/− LPS (Supplementary Figure S1).

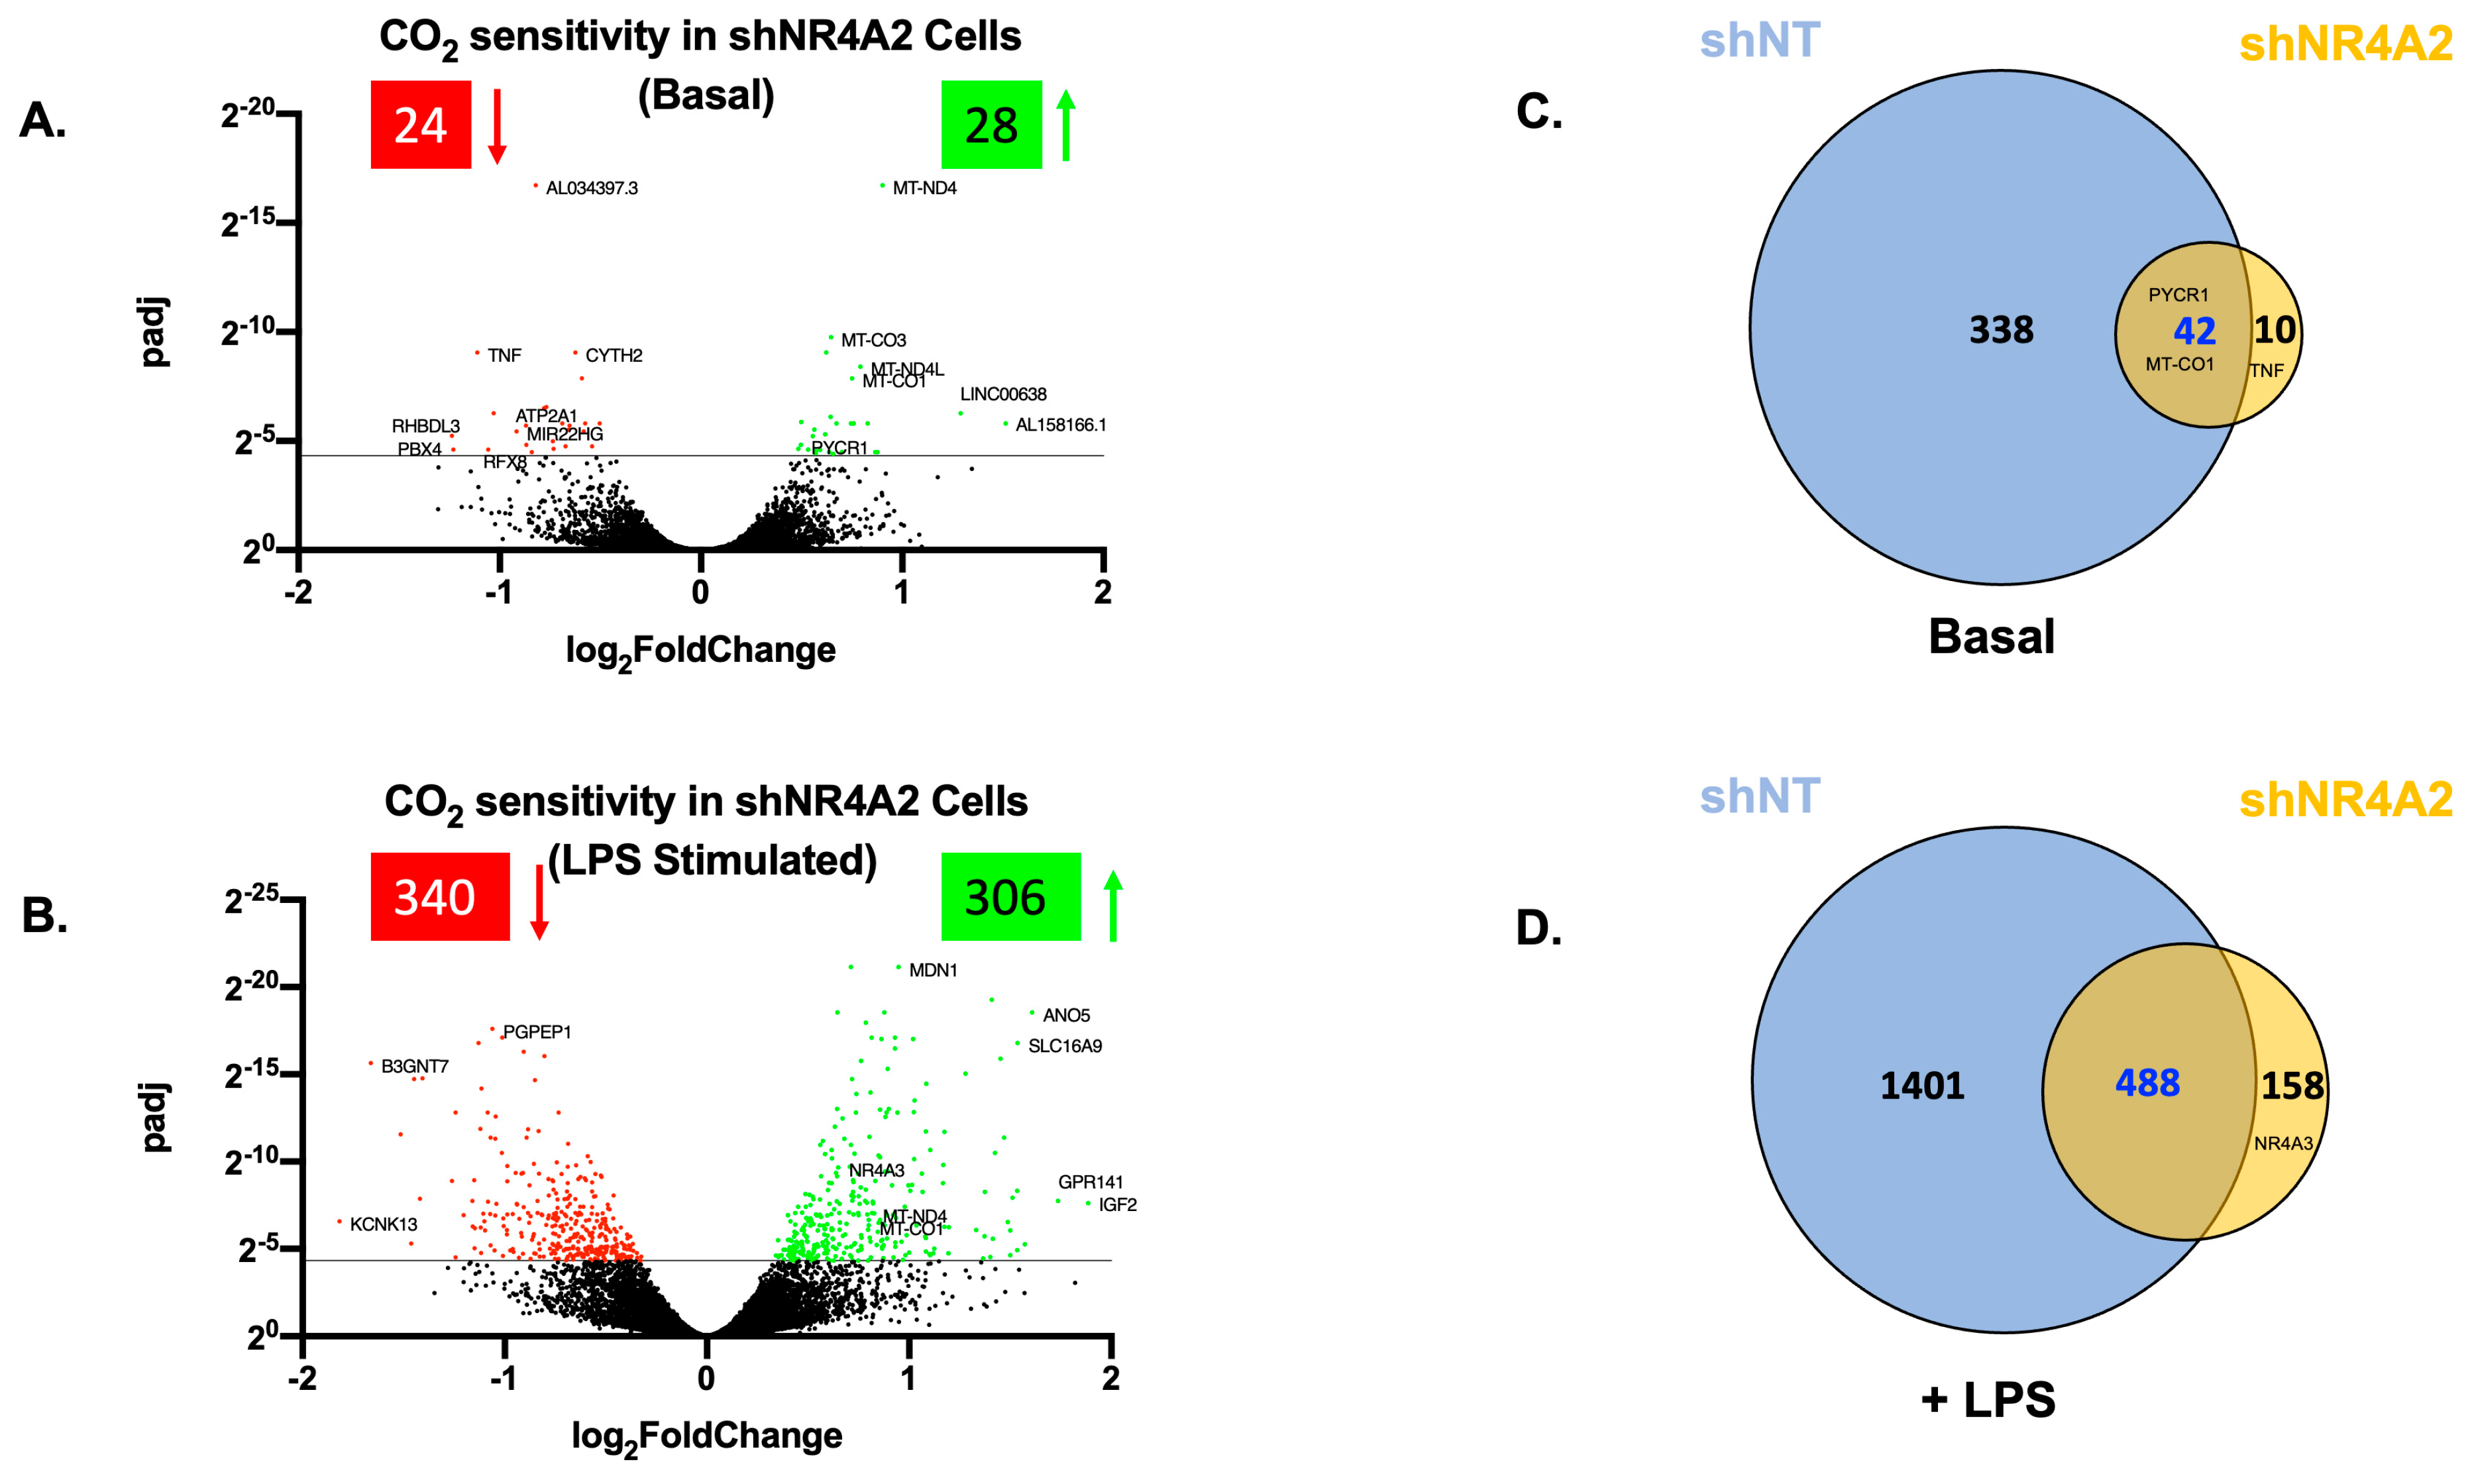
2.2. The Cellular Response to Elevated CO2 Is Modulated by shNR4A2

Given the evidence that elevated CO2 modulates the transcriptional kinetics of NR4A2 and NR4A3 against a background of inflammation, we hypothesised that NR4A2 and NR4A3 may play roles as master regulators of the monocyte response to hypercapnia. To test this, we took an interventional approach using cells that are stably depleted of NR4A2 and NR4A3 using targeted shRNAs. The consequences of shNR4A2 and shNR4A3 in normocapnic monocytes [15] have recently been published. Here we report for the first time on the transcriptional response to elevated CO2 in (short hairpin RNA targeting NR4A2) shNR4A2 and (short hairpin RNA targeting NR4A3) shNR4A3 cells, with comparisons to some of our previously published work. This approach is well suited to test our hypothesis that NR4A family members are regulated by hypercapnia and contribute to the cellular response to hypercapnia.
We first investigated the CO2-responsiveness of shNR4A2 cells, both in the basal and LPS-stimulated states. Buffered hypercapnia (10% CO2) for 4 h was a modest stimulus in these cells, with 52 transcripts differentially expressed in the basal state (Figure 2A, Supplementary Table S1) and 646 transcripts in the LPS-stimulated cells (Figure 2B, Supplementary Table S2). Interestingly, there were markedly fewer transcripts in shNR4A2 cells compared to non-target short hairpin RNA (sh)-controls ((380 genes (basal) and 1889 genes (LPS-stimulated)) [26], suggesting that the depletion of NR4A2 attenuated the cellular response to hypercapnia. Of the 52 genes affected by hypercapnia in the basal state, 42 (or 80%) were also affected by hypercapnia in sh-control cells (Figure 2C). Of the 646 genes affected by hypercapnia in the presence of LPS, 488 (or 75%) were also affected by hypercapnia in non-target control cells (Figure 2D). Taken together with the principal component analysis Supplementary Figure S2A,B, indicate that (i) buffered hypercapnia is a robust stimulus to change gene expression in shNR4A2 cells, (ii) that the cellular response to hypercapnia is enhanced in the presence of LPS, and (iii) that the total number of transcripts affected is fewer than those seen in non-target control cells in the presence or absence of LPS. The top ten transcripts most affected by 10% CO2 (up and downregulated, ranked by fold change) are included in Supplementary Figure S3.

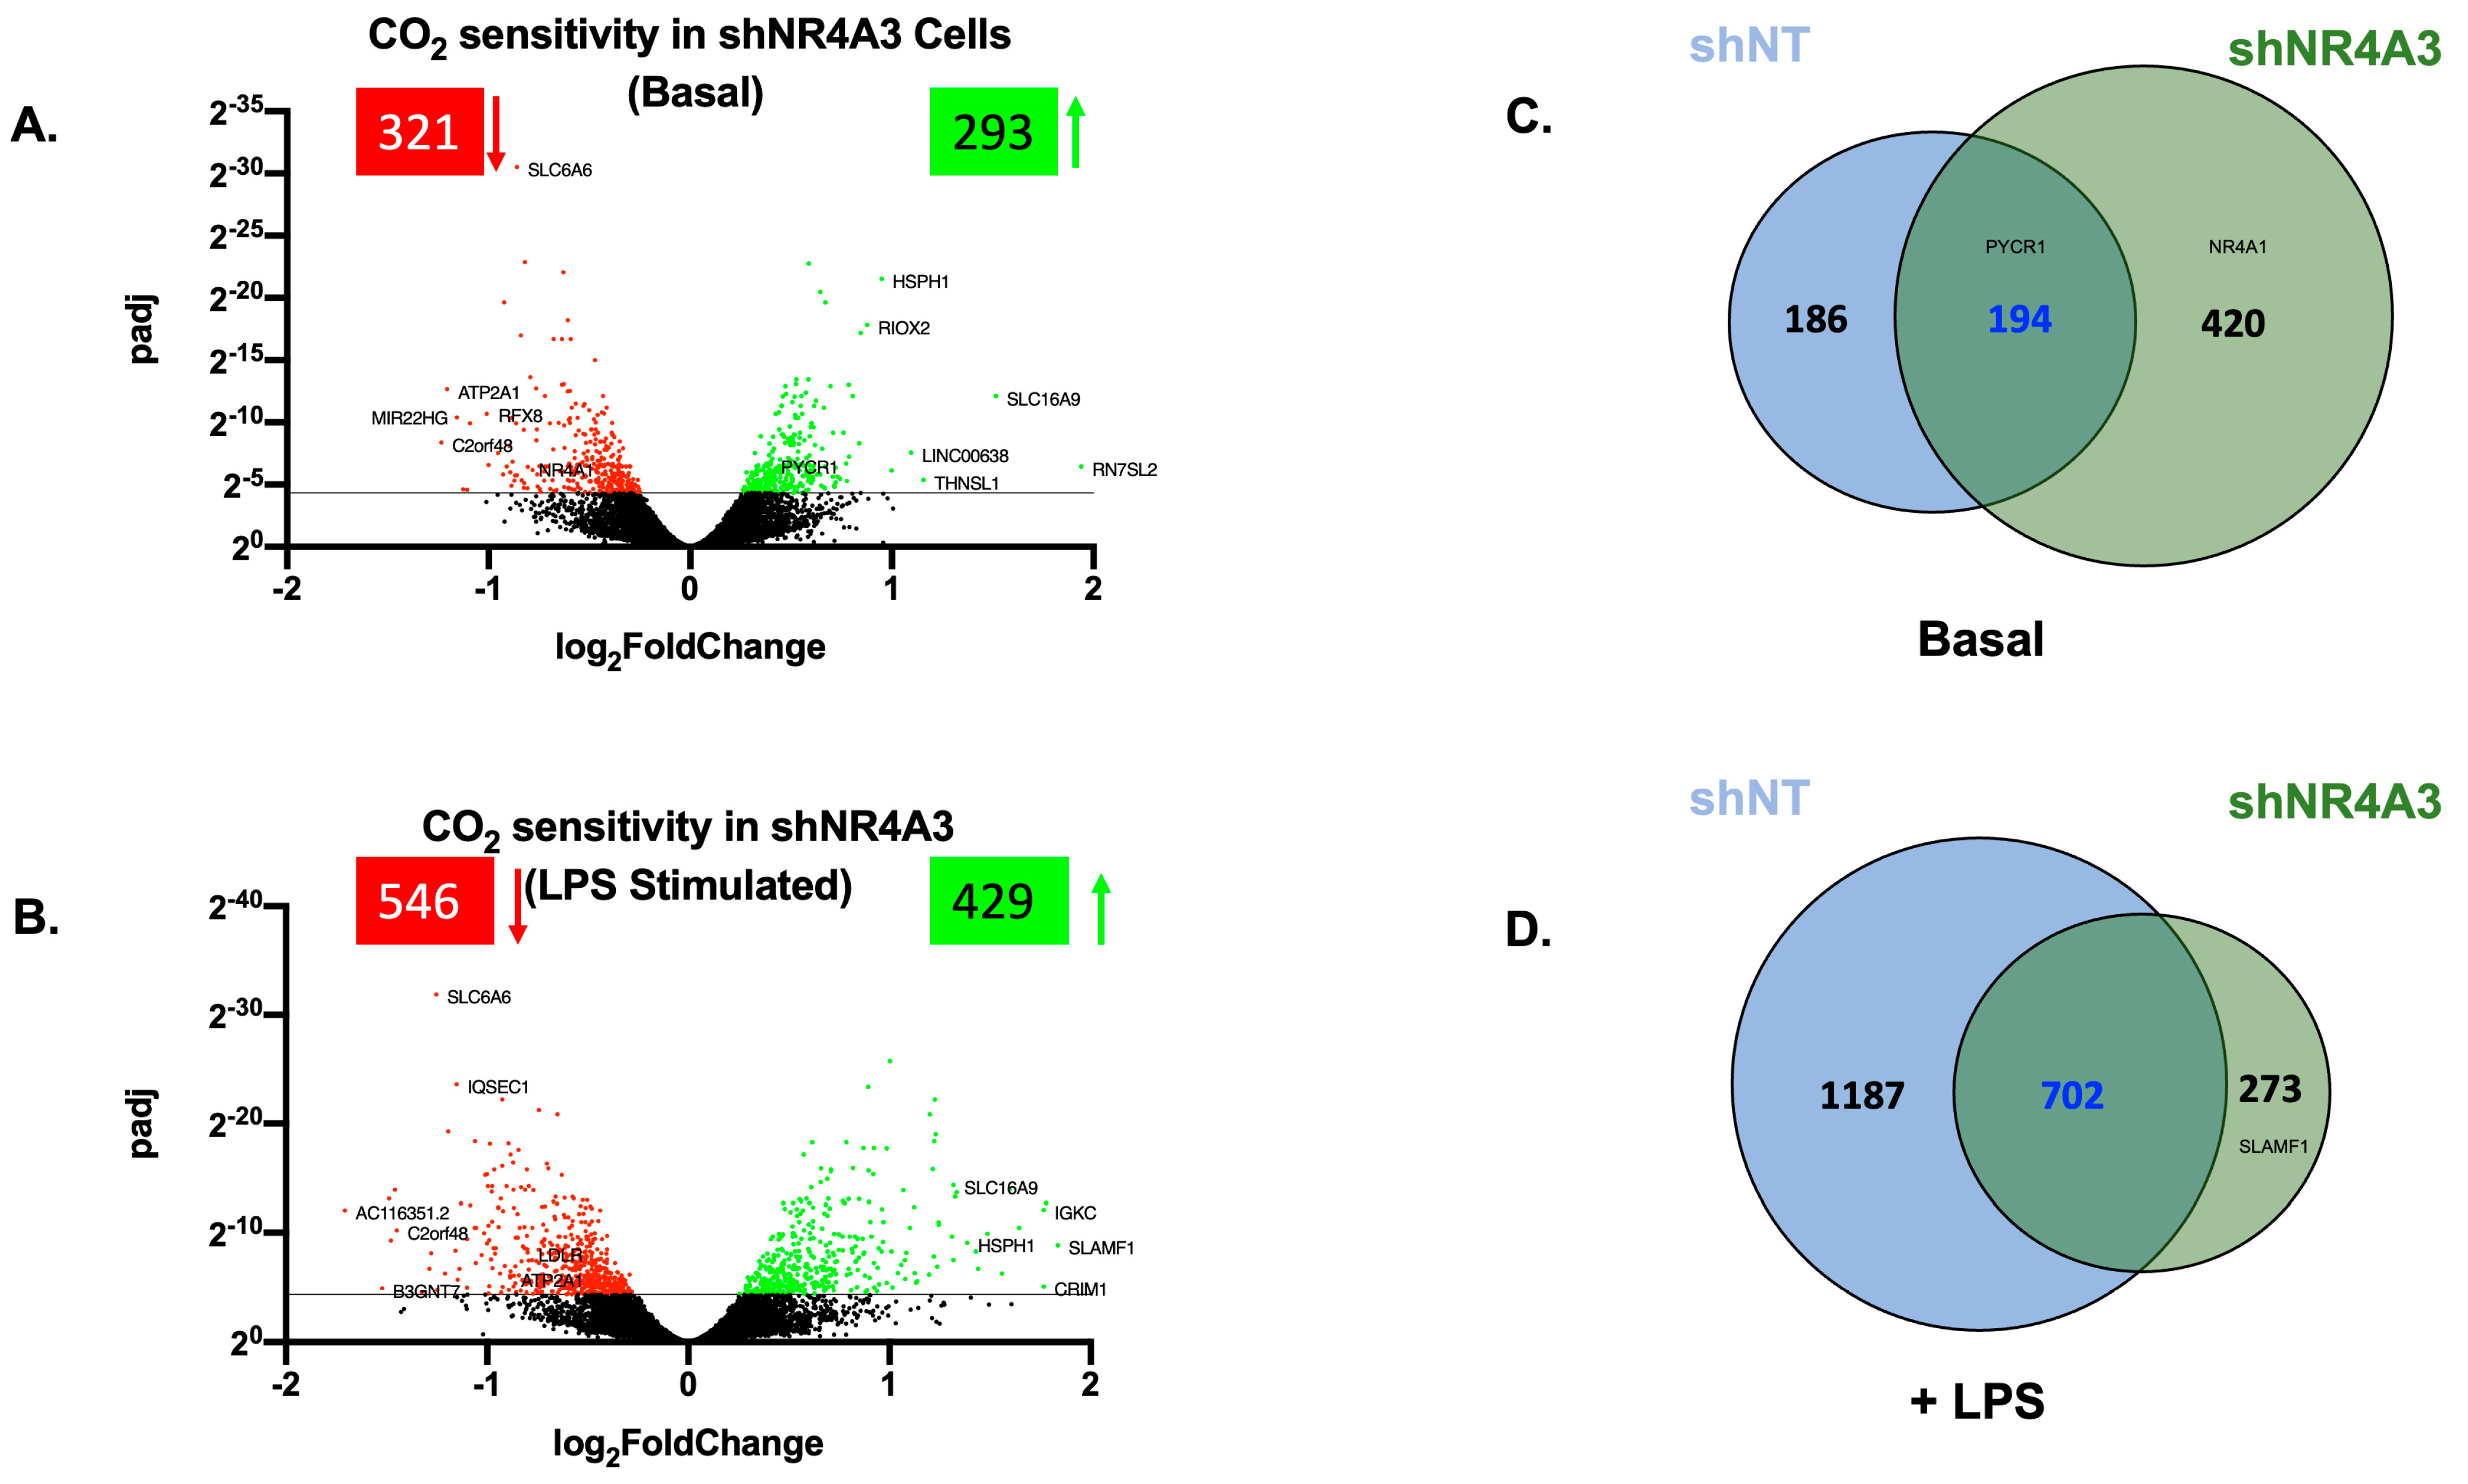
2.3. The Cellular Response to Elevated CO2 Is Modulated by shNR4A3

We next investigated the CO2-responsiveness of shNR4A3 cells, both in the basal and LPS-stimulated states. Buffered hypercapnia (10% CO2) for 4 h was a robust stimulus in these cells, with 614 transcripts differentially expressed in the basal state (Figure 3A, Supplementary Table S3) and 975 transcripts in the LPS-stimulated cells (Figure 3B, Supplementary Table S4). Interestingly, this was markedly more transcripts than in sh-control and shNR4A2 cells in the basal state, suggesting that the depletion of NR4A3 modulated the cellular response to hypercapnia somewhat differently than the depletion of NR4A2. Of the 614 genes affected by hypercapnia in the basal state, 194 (or 31%) were also affected by hypercapnia in non-target control cells (Figure 3C). Of the 975 genes affected by hypercapnia in the presence of LPS, 702 (or 72%) were also affected by hypercapnia in non-target control cells (Figure 3D). Taken together with the principal component analysis, Supplementary Figure S2C,D, indicate (i) that buffered hypercapnia is also a robust stimulus to change gene expression in shNR4A3 cells; (ii) that the cellular response to hypercapnia is enhanced in the presence of LPS; and (iii) that the total number of transcripts affected is greater than those seen in non-target control cells in the basal state and fewer in the presence of LPS under the same conditions. The top ten transcripts most affected by 10% CO2 (up and downregulated, ranked by fold change) are included in Supplementary Figure S4.

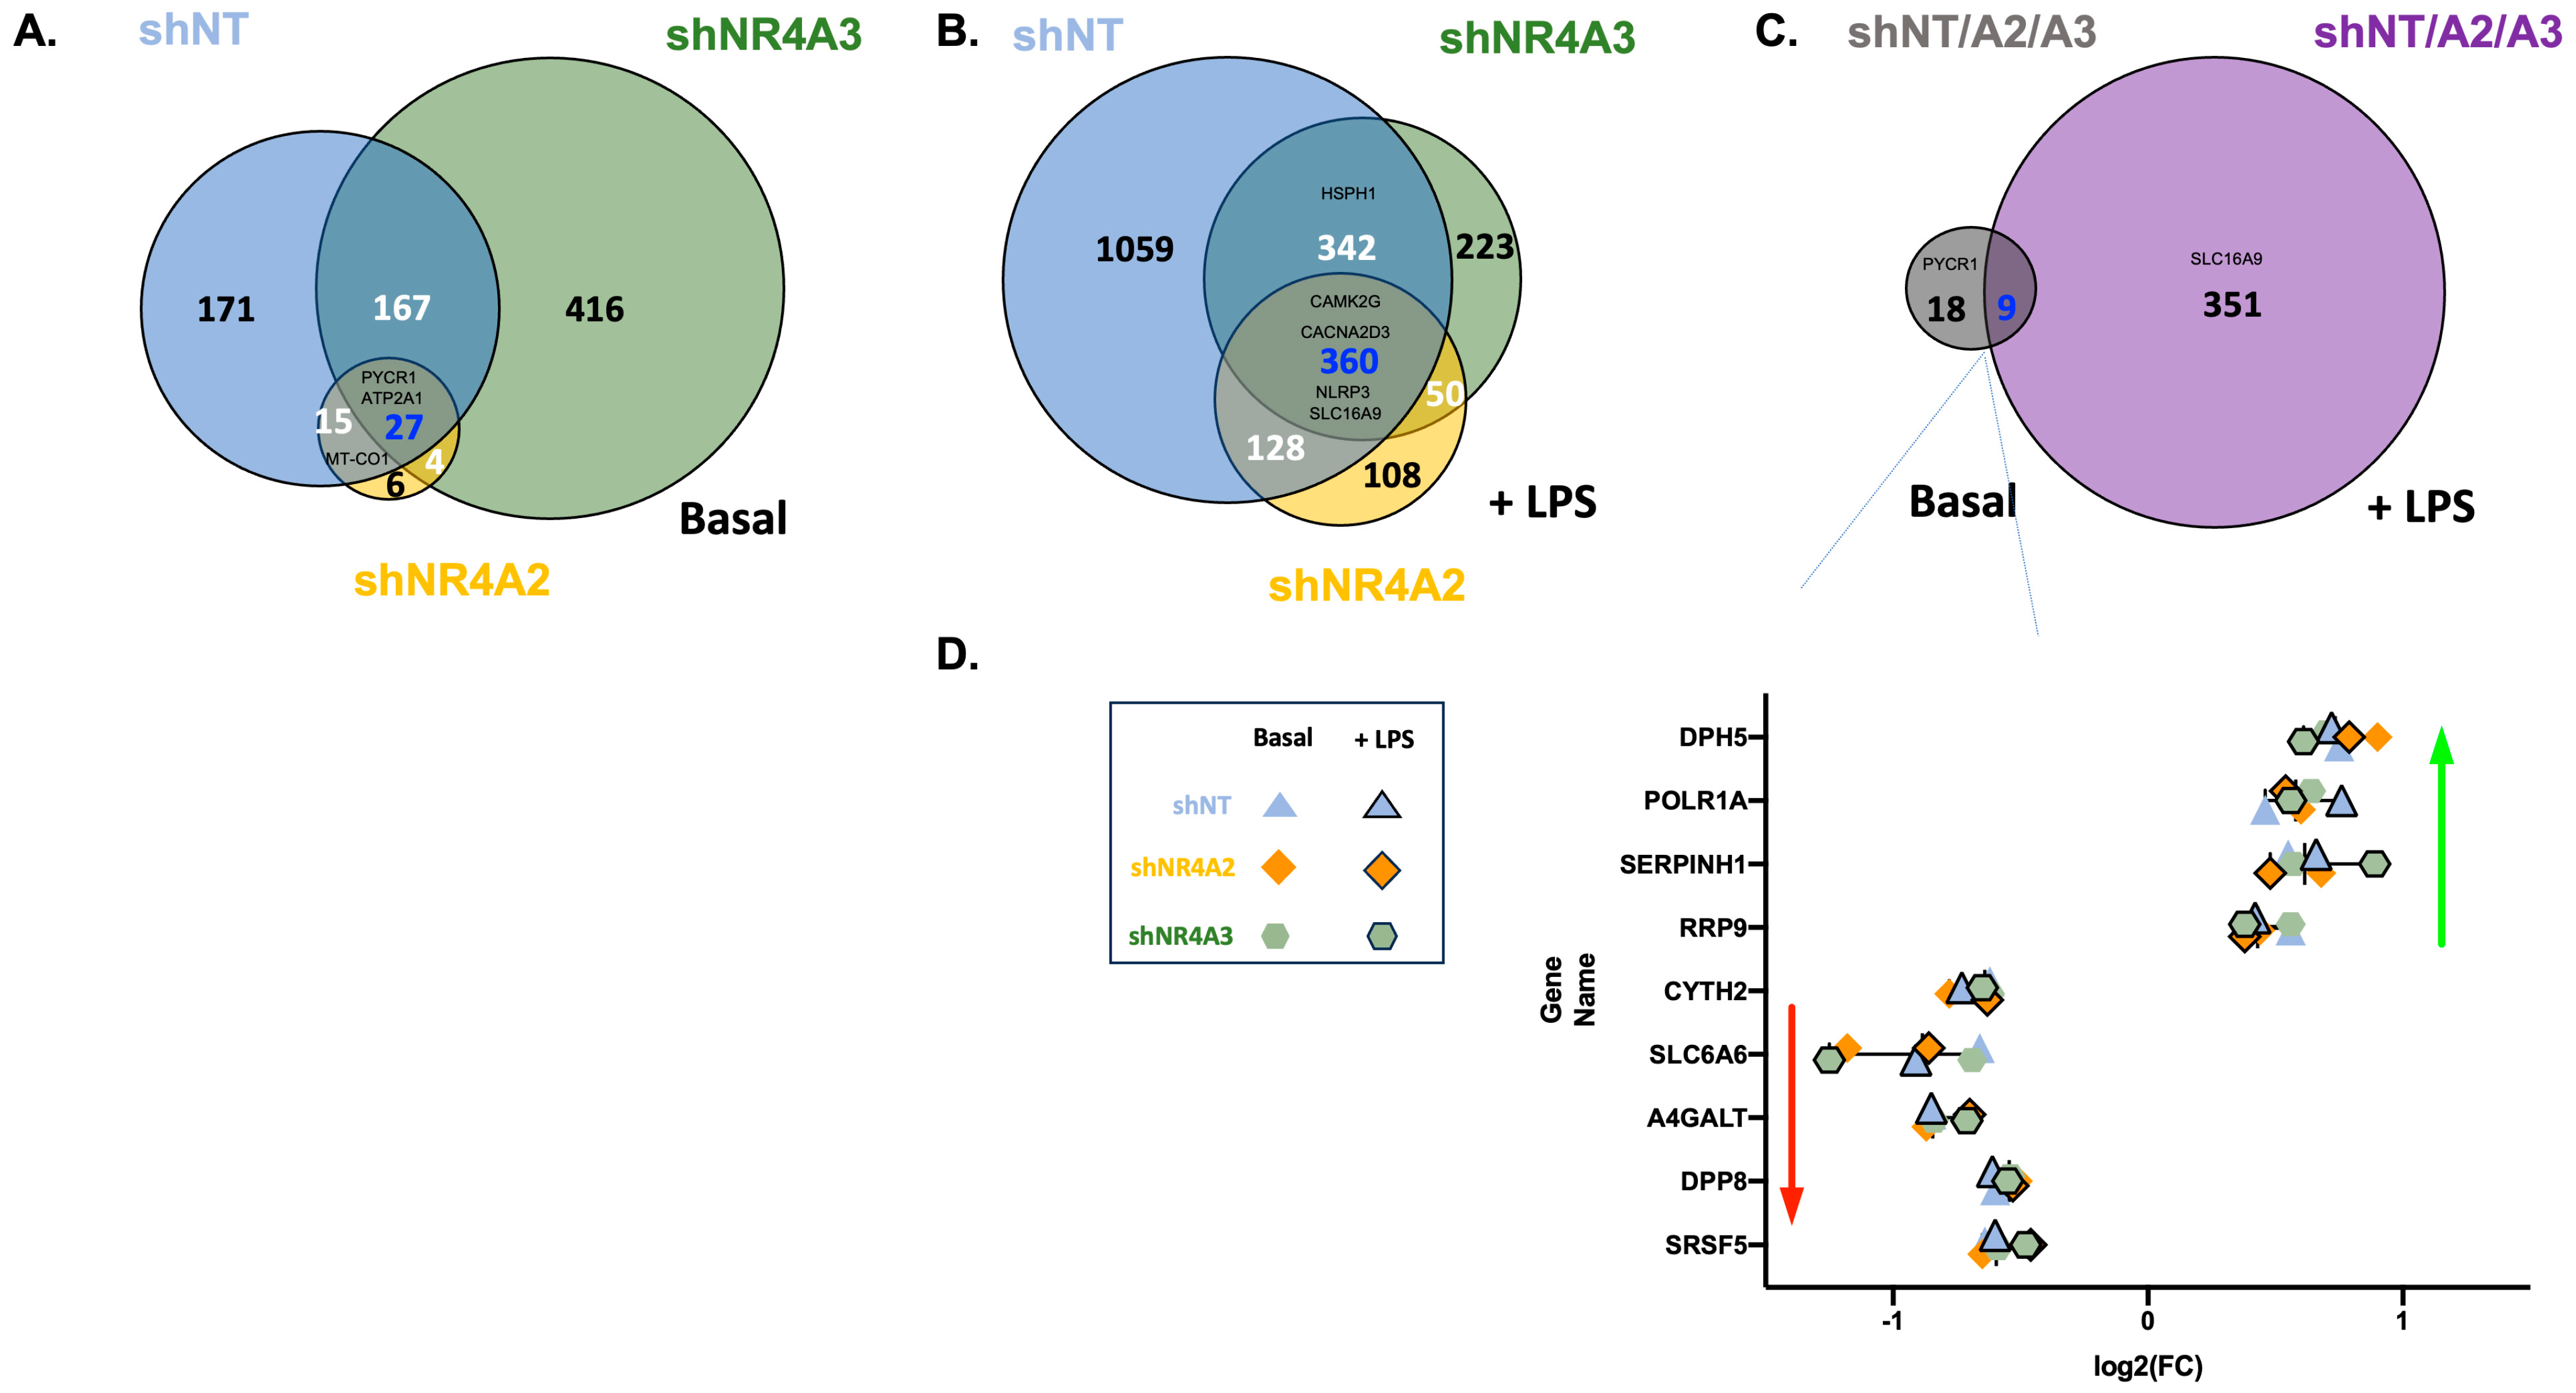
2.4. Comparison of CO2 Responsiveness in Cells Depleted of NR4A2 and NR4A3

The data from Figure 2 indicates a significant overlap in transcripts affected by elevated CO2 in both non-target cells and shNR4A2 cells. Commonly regulated genes include those associated with mitochondrial gene expression, e.g., Mitochondrially Encoded Cytochrome C Oxidase 1 (MT-CO1), Mitochondrially Encoded NADH: Ubiquinone Oxidoreductase Core Subunit 4 (MTND-4), Mitochondrially Encoded NADH: Ubiquinone Oxidoreductase Core Subunit 4L (MT-ND4L) (Supplementary Figure S6) and genes involved in cellular metabolism Pyrroline-5-Carboxylate Reductase 1 (PYCR1) (Figure 4A,C). Genes associated with immune signalling, e.g., Tumour Necrosis Factor (TNF) (Figure 2C and Supplementary Figure S7B) and NR4A3 (Figure 2D and Supplementary Figure S9C) were selectively CO2 sensitive in shNR4A2 cells. Similarly, the data from Figure 3 indicates a significant overlap of transcripts affected by CO2 in both non-target cells and shNR4A3 cells. Commonly regulated genes include those associated with cellular metabolism (PYCR1) (Figure 4A,C); however, the signature for mitochondrial and metabolism-associated genes is less striking in shNR4A3 cells (Supplementary Figure S8). Genes associated with immune signalling, e.g., NR4A1 (Figure 3C, Supplementary Figure S9A) and Signalling Lymphocytic Activation Molecule Family Member 1 (SLAMF1) (Figure 3D, Supplementary Figure S4B) were selectively CO2 sensitive in shNR4A3 cells.
From our comparisons of the CO2 sensitivity of shNR4A2 cells and shNR4A3 cells compared to shNT cells, we observed several genes whose response to hypercapnia was conserved in NR4A2 or NR4A3-deficient cells, as well as genes that were uniquely sensitive to CO2. Examination of RNA-sequencing (RNA-seq) transcript per million (TPM) data from the uniquely sensitive transcripts revealed that while some transcripts failed to reach the threshold for CO2 sensitivity, the mean trends were qualitatively similar to those observed in the other cell types, e.g., TNF is selectively decreased in response to CO2 in the basal state in shNR4A2 cells; however, a decrease is also observed in shNT cells and shNR4A3 cells (albeit non-significantly) (Supplementary Figure S7B). Similarly, there were transcripts that were clearly affected by shNR4A2 on a basal level, e.g., Wnt Family Member 7B (WNT7B), but retained an equivalent level of CO2 sensitivity (Supplementary Figure S7A). Thus, the data generated to date indicates that NR4A family members NR4A1-3 are CO2-sensitive transcripts in monocytes and selectively modulate elements of the monocyte response to buffered hypercapnia without being master regulators.

Many Genes Are Commonly Regulated by CO2 in shNT, shNR4A2, and shNR4A3 Cells

We next exploited the similarities in the responses of our three different cell lines to elevated CO2. We reasoned that transcripts that were consistently CO2 sensitive across three genetically modified THP-1 cell lines (with very different basal transcription of 100s of genes due to shNR4A2 or shNR4A3 [15]) represent particularly robustly CO2 responsive transcripts. These data relating to core CO2-responsive genes can enhance our understanding of the cellular response to hypercapnia in monocytes with and without LPS treatment.
In the basal state, 27 genes were commonly differentially expressed across all 3 groups (Figure 4A). These included genes involved in cellular metabolism (PYCR1, Aldehyde dehydrogenase 1 Family Member B1 (ALDH1B1)), regulation of calcium (Cluster of Differentiation 38 (CD38), Sarcoplasmic/Endoplasmic Reticulum Calcium ATPase1 (ATP2A1), and serpin peptidase inhibitors Serpin Family B Member 2 (SERPINB2) and Serpin Family H Member 1 (SERPINH1)). The mitochondrial oxidative phosphorylation (OXPHOS) genes (MT-CO1, MT-CO2, MT-CO3, MT-ND4, MT-ND4L, and MT-ND5) were significantly differentially expressed in hypercapnia in shNT and shNR4A2 cells, but not in shNR4A3 cells in the basal state.
In the presence of LPS, there were 360 common differentially expressed genes (DEGs) across all 3 groups (Figure 4B). This included genes involved in inflammation (Nucleotide-Binding Oligomerisation Domain, Leucine Rich Repeat and Pyrin Domain Containing 3 (NLRP3)), calcium signalling (Calcium/Calmodulin Dependent Protein Kinase II Gamma (CAMK2G), Calcium Voltage-Gated Channel Auxiliary Subunit Alpha-2/Delta-3 (CACNA2D3)) and solute carriers (e.g., Solute Carrier Family 6 (Neurotransmitter Transporter, Taurine), Member 6 (SLC6A6), Solute Carrier Family 16 (Monocarboxylic Acid Transporters), Member 9 (SLC16A9), Solute Carrier Family 17 (Acidic Sugar Transporter), Member 5 (SLC17A5), Solute Carrier Family 39 (Metal Ion Transporter), Member 8 (SLC39A8), Solute Carrier Family 39 (Metal Ion Transporter), Member 14 (SLC39A14)). While some of the chaperone proteins were common to all three groups (e.g., Heat Shock Protein 90 Alpha Family Class A Member 1 (HSP90AA1), Heat Shock Protein Family A (HSP70) Member 1A (HSPA1A) (Supplementary Figure S7C), DNAJ Heat Shock Protein Family (Hsp40) Member A1 (DNAJA1)), others were sensitive in shNT and shNR4A3 cells, but not shNR4A2 (e.g., Heat Shock Protein Family H (Hsp110) Member 1 (HSPH1) (Supplementary Figure S7D), Heat Shock Protein Family A(HSP70) Member 4 (HSPA4)).
Finally, we compared the 27 genes commonly differentially expressed in hypercapnia in the basal state with the 360 common DEGs in the presence of LPS. The resulting list had nine common genes. These genes followed strikingly similar patterns of differential expression in response to hypercapnia (Serine and Arginine Rich Splicing Factor 5 (SRSF5), Dipeptidyl Peptidase 8 (DPP8), Alpha 1,4,-Galactosyltransferase (A4GALT), SLC6A6, Cytohesin 2 (CYTH2) downregulated (Figure 4D, Supplementary Figure S10A–E), (Ribosomal RNA Processing 9, U3 Small Nucleolar RNA Binding Protein (RRP9), Serpin Family H Member 1 (SERPINH1), RNA Polymerase 1 Subunit A (POLR1A), Dipthamide Biosynthesis (DPH5) upregulated (Figure 4D, Supplementary Figure S10F–I), regardless of LPS or NR4A2/NR4A3 depletion, thus representing a cluster of fundamental gene signatures in response to elevated CO2.

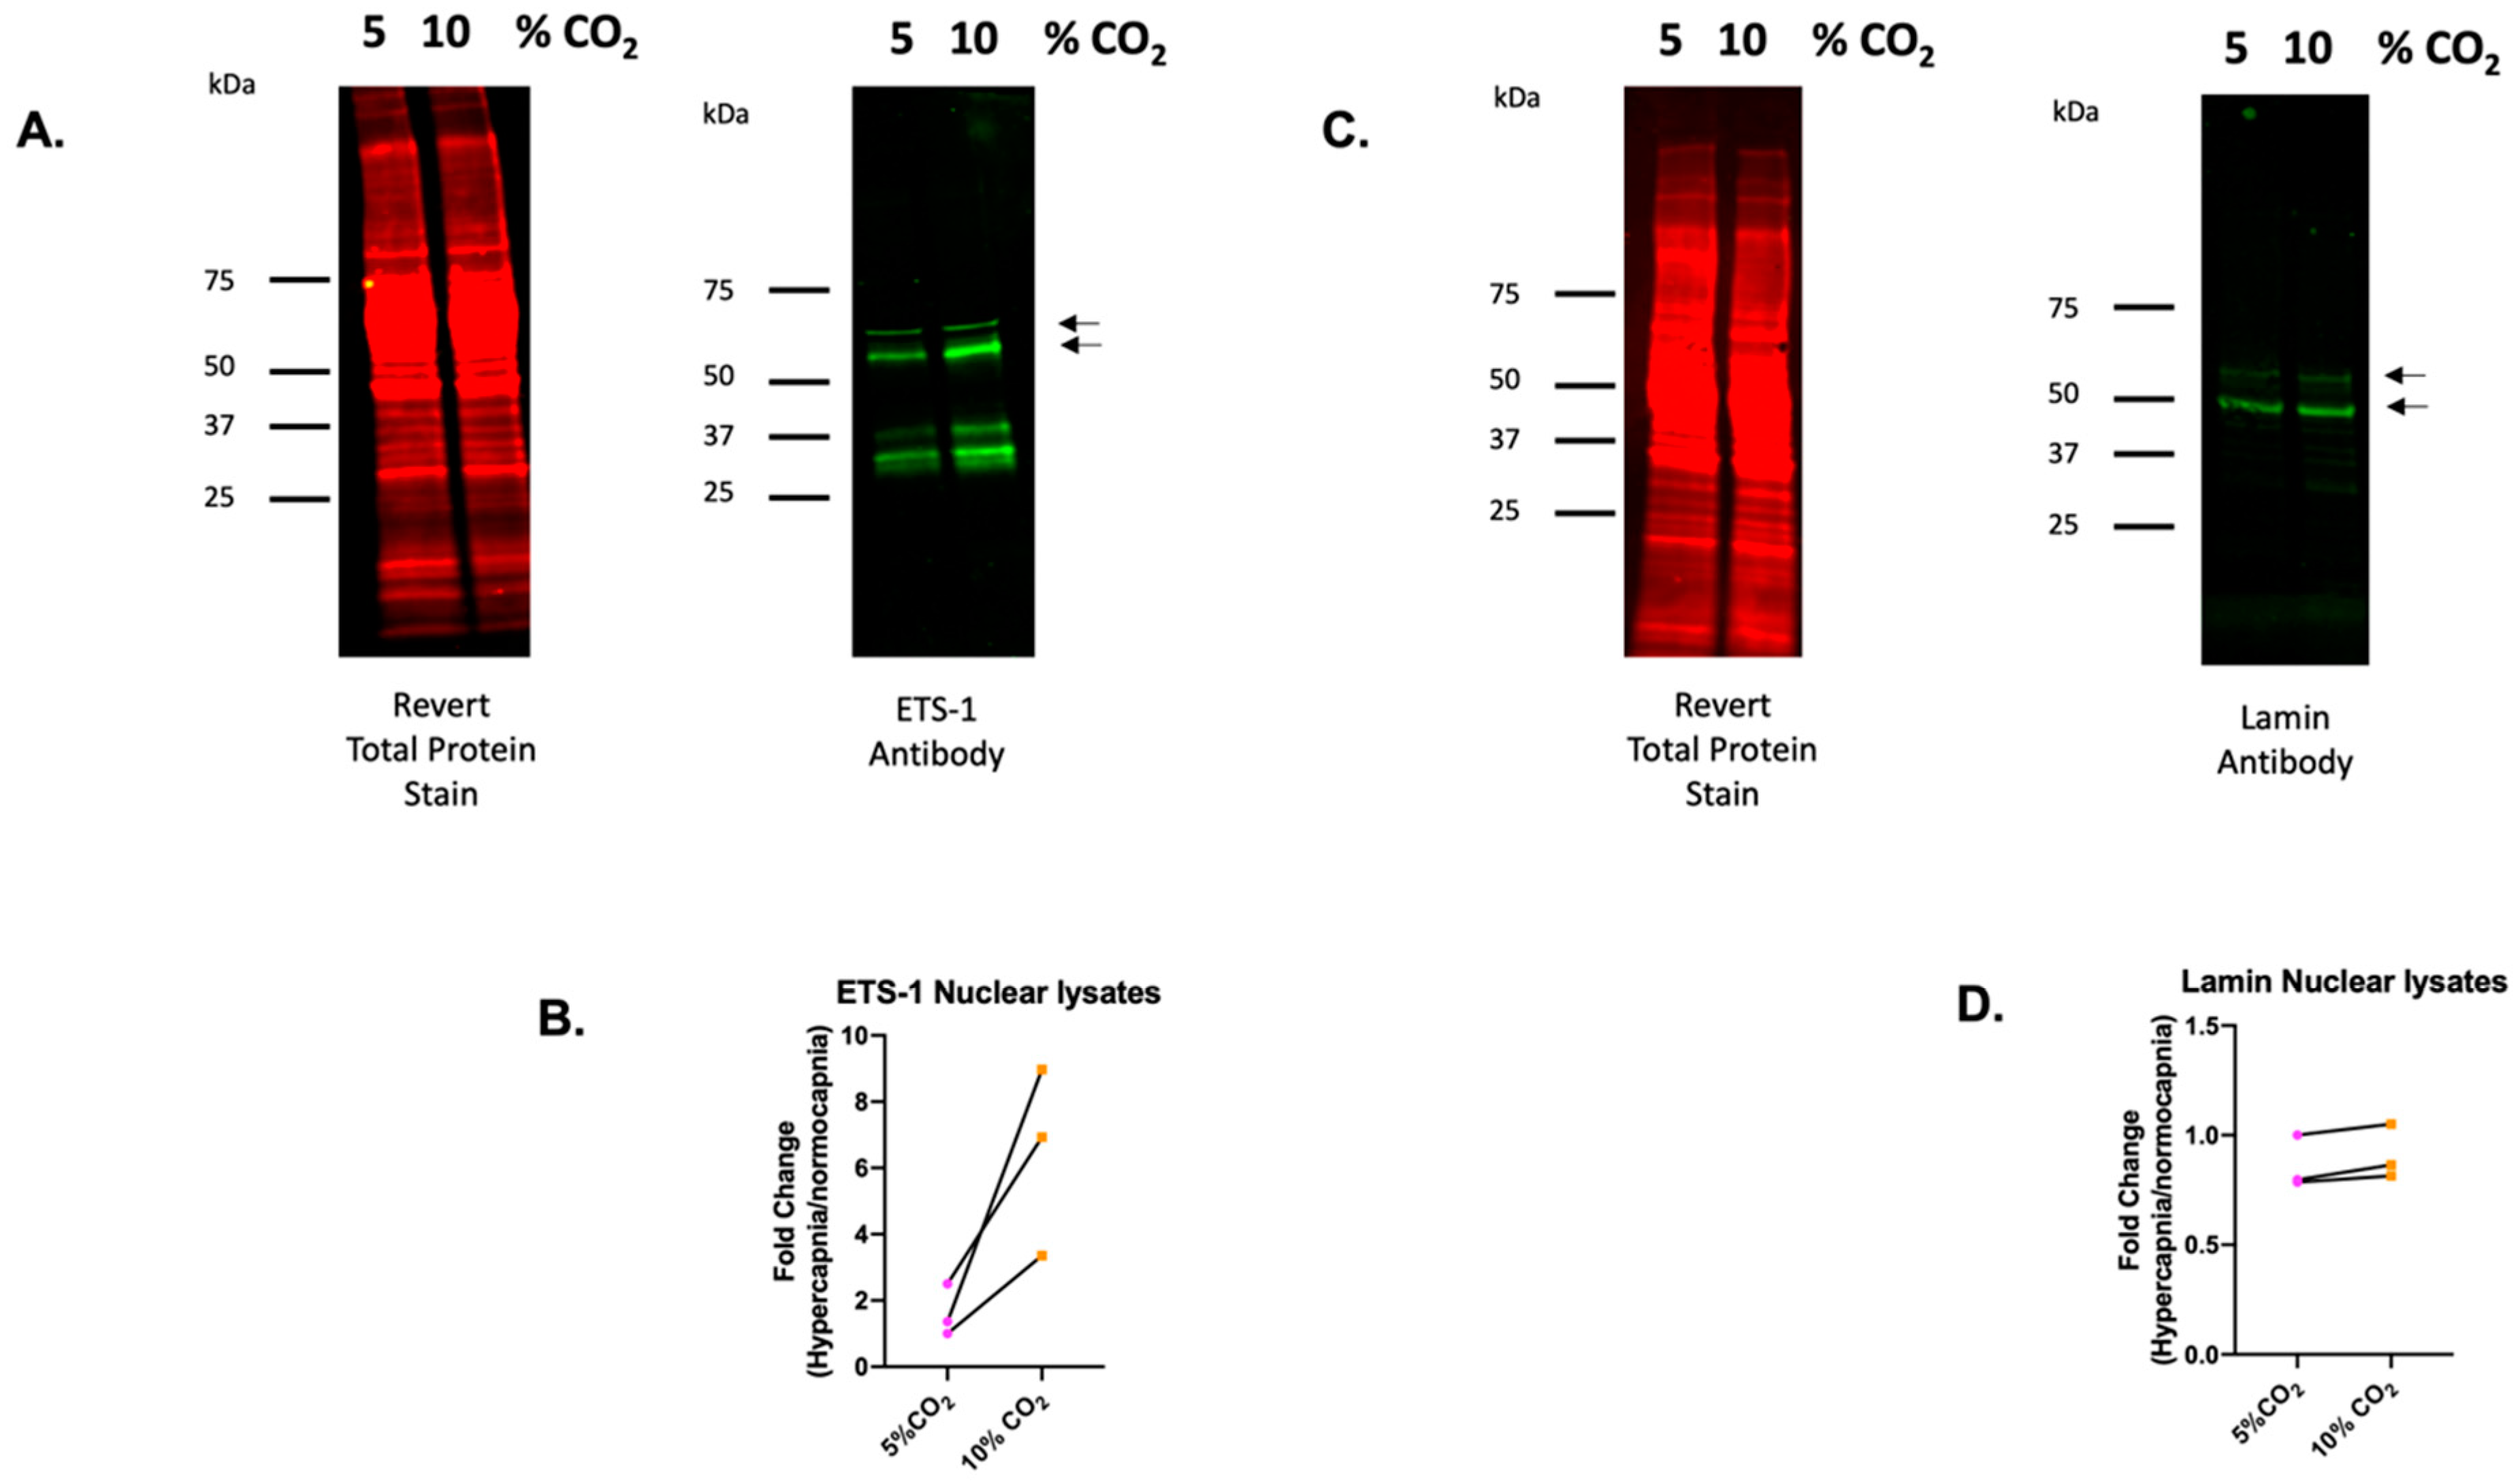
2.5. ETS-1 Is a CO2 Responsive Transcription Factor in Monocytes

To better understand the transcriptional regulation of transcripts in response to elevated CO2 in monocytes, we performed MetaCore Transcriptional Analysis to determine the most interacted transcription factors with CO2-dependent transcripts in shNT-, shNR4A2, and shNR4A3 cells + LPS. The most interacted transcription factors are ranked by z-score in Supplementary Table S5. The most consistently CO2 dependent interacted transcription factors with the highest z-scores were RUNX Family Transcription Factor 1 (AML1), SRY (Sex Determining Region Y)-Box 17 (SOX17), T-Cell Acute Lymphocytic Leukaemia Protein 1 (TAL1), ETS-1, and LIM Domain Only 2 (LMO2).
To narrow our search for associated transcription factors further, we next interrogated the EnCyclopedia of DNA Elements (ENCODE) project website (www.encodeproject.org) with nine fundamental gene signatures in response to CO2 (Figure 4D, Supplementary Figure S10), and investigated the evidence for regulation of these genes by our five highest scoring transcription factors. Interestingly, we identified ETS-1 as a putative transcriptional regulator of all nine CO2-sensitive genes in Figure 4D. For this reason, we next focused our attention on ETS-1. Given that ETS-1 is a nuclear transcription factor, we investigated the CO2-sensitivity of this protein in monocytes exposed to normocapnia or hypercapnia under pH-buffered conditions. Western blot analysis of nuclear lysates revealed a CO2-dependent increase in the nuclear expression of the ETS-1 protein, supporting the concept that this transcription factor is involved in CO2-dependent gene expression (Figure 5A,B). Lamin (acting as a control for nuclear protein expression) was not changed by the exposure to CO2 under the same conditions (Figure 5C,D). Taken together, these data further implicate ETS-1 as a novel CO2-responsive transcription factor in monocytes.

3. Discussion

The primary aim of this study was to investigate the role of NR4A2 and NR4A3 in CO2-dependent signalling in monocytes. As discussed in the introduction, we hypothesised that these members of the nuclear receptor family may represent master regulators of the cellular response to CO2. Our initial experiments demonstrated a temporal response of NR4A family members to LPS (Figure 1). All three NR4A family members were rapidly induced at the transcript level in response to LPS, with NR4A3 showing the highest level of induction relative to controls. The rapid induction of NR4A mRNA has previously been demonstrated in THP-1 monocytes, with similar observations regarding NR4A3 [27,28]. We noted various sensitivities of the different NR4A family members to CO2 concentrations in THP-1 cells. NR4A1 showed the least sensitivity. NR4A2 expression was reduced in hypercapnia, with lower expression at both 2 h and 4 h of LPS stimulation in 10% CO2 compared to 5% CO2. For NR4A3, the maximal increase in NR4A3 mRNA expression in response to LPS shifted from 4 h at 5% CO2 to 2 h at 10% CO2. Taken together, these data suggest a CO2-dependent shift in the temporal response of NR4A family members NR4A2 and NR4A3 to LPS (Figure 1). This is associated with a reduction in NR4A2 protein levels in hypercapnia (Supplementary Figure S1). Interestingly, microarray data from human macrophages stimulated with LPS found NR4A2 to be the most highly upregulated gene following a 90-minute exposure to hypercapnia-acidosis (20% CO2) [20]. While NR4A2 was not the focus of the Casalino-Matsuda study, it further supports the idea that environmental CO2 conditions shape the cellular response to inflammatory stimuli.
Given the CO2 sensitivity of NR4A2 and NR4A3 to CO2 in this model, we investigated the impact of depletion of these genes in our model of buffered hypercapnia. In the basal state, depletion of NR4A2 decreased the number of genes significantly differentially expressed in hypercapnia compared to shNT cells (Figure 2A,C), while depletion of NR4A3 increased this number in the basal state (Figure 3A,C). This could suggest that in the basal state, NR4A2 has a role in the regulation of CO2-sensitive genes, while NR4A3 may act to attenuate the effect of hypercapnia on gene expression. The difference in CO2 sensitivity seen in shNR4A2 and shNR4A3 cells in the absence of LPS is somewhat surprising, as the NR4As are expressed at low levels in the basal state. In the presence of LPS, both shNR4A2 and shNR4A3 cells had fewer significant DEGs in response to hypercapnia compared to shNT cells (Figure 2B,D and Figure 3B,D). It is possible that the different pattern of CO2 sensitivity observed between the basal and LPS states may be due to the nature of the knockdown. While NR4A2 and NR4A3 mRNA expression were clearly depleted in shNR4A2 and shNR4A3 cells, respectively, they were still capable of being increased by LPS exposure (Supplementary Figure S9). Taken together, these data indicate that the level of NR4A2 and NR4A3 in monocytes affects the cellular response to CO2. In the case of shNR4A2 cells in the basal state, it is interesting to note that TNF, a known CO2-sensitive transcript in lung cells [29], is only significantly affected in shNR4A2 cells. NR4A2 is known to act as a suppressor of NFκB and inflammatory signalling [25]. The change in the sensitivity of TNF under these particular conditions may reflect a more pro-inflammatory milieu in shNR4A2 cells. Thus, the cellular microenvironment, which can be influenced by inflammatory signalling and metabolic changes, is likely a key determinant in shaping the cellular response to CO2. This concept is further supported by our RNA-seq data indicating that (increased) NR4A3 is only sensitive to CO2 in shNR4A2 cells in response to LPS (Figure 2D, Supplementary Figure S9C) and that (decreased) NR4A1 is only sensitive to CO2 in shNR4A3 cells in the basal state (Figure 3C, Supplementary Figure S9A). Therefore, the summation of CO2 signalling, and the cellular microenvironment of inflammation/ metabolism ultimately dictate the transcriptional response.
We have previously published a strong signature for increased mitochondrial transcription in response to acute hypercapnia in monocytes [26]. When comparing the CO2 sensitivity of shNR4A2 cells to shNT cells, this mitochondrial signature was preserved, although there were much fewer DEGs identified. This mitochondrial signature is reflected both in the significant differential expression of mitochondrial OXPHOS genes, as well as in the GO terms associated with hypercapnia in shNR4A2 cells (Supplementary Figure S8). Interestingly, when analysing the CO2 sensitivity of shNR4A3 cells, the mitochondrial signature seems to be much reduced (Supplementary Figure S8). While there were more significantly differentially expressed genes in hypercapnia in shNR4A3 cells in the basal state, none of the mitochondrial genes reached the threshold for significance (Supplementary Figure S6). Furthermore, Mitochondrial Transcription Factor 1 (TFAM) interacted with shNT and shNR4A2 cells but not shNR4A3 cells in hypercapnia (+LPS) (Supplementary Table S5), further supporting the concept that the mitochondrial response to CO2 is blunted in shNR4A3 cells. The NR4As have been shown to regulate genes associated with fuel utilisation [5,30,31]. In addition, NR4A3 knockdown in C2C12 myotubes reduces mitochondrial health and mRNA levels of key mitochondrial genes, e.g., Peroxisome Proliferator-Activated Receptor Gamma Coactivator 1-Alpha (PGC1α) and TFAM, as well as the protein levels of mitochondrial complexes I–IV [32]. Thus, a specific role for NR4A3 in the regulation of mitochondrial and metabolic pathway genes may account for the lack of sensitivity of these pathways to hypercapnia in shNR4A3 monocytes.
shNR4A2 cells appear to differ in their response to hypercapnia with respect to heat shock proteins (Hsps). Hsps are induced in response to cellular stress and protect the cell through various functions, including maintaining proteostasis by chaperoning misfolded proteins and assisting with antigen presentation [33,34]. Hsp induction is highly conserved and is regulated by the transcription factor heat shock factor 1 (HSF1). Hypercapnia has previously been reported to alter the activity of HSF1 in immune cells, with increased HSF1 protein expression and nuclear localisation observed in murine alveolar macrophages after exposure to 15% CO2 for 16 h [35]. Furthermore, mass spectrometry has identified Hsp70 as a major NR4A-interacting protein in human embryonic kidney cells (HEK293) [36]. The loss of Hsp sensitivity to CO2 in NR4A2-depleted cells (Supplementary Figure S7D), as well as the loss of CO2-responsive GO terms associated with protein folding and ribosome biogenesis (Supplementary Figure S8), indicates that NR4A2 is responsible, at least in part, for the regulation of certain genes in hypercapnia.
Taken together, our data provide evidence of selective regulation of CO2-dependent transcripts in shNR4A2 and shNR4A3 cells with regard to mitochondrial genes and Hsp-related genes, respectively. In addition, our data provides evidence of many CO2-sensitive genes being relatively insensitive to depletion of NR4A2 and NR4A3, indicating that other conserved transcription factors are involved in the transcriptional response to buffered hypercapnia in this model. There is a known redundancy among NR4A family members [10], meaning it is possible that knockdown of one isoform can be compensated for by the remaining other isoforms.
To gain insight into other potential CO2-sensitive transcription factors involved in the transcriptional response to buffered hypercapnia, we next focused on transcriptional signatures that were common to shNT, shNR4A2, and shNR4A3 cells. We reasoned that transcripts that were consistently CO2-sensitive across the three different cell lines represent particularly robustly CO2 sensitive transcripts. Data in Figure 4 reveals a striking overlap of CO2-sensitive genes in cells that have quite different basal transcriptional profiles [15]. Indeed, nine genes were CO2-sensitive in all three cell lines, both with and without LPS stimulation. The consistency of the response is evident in Figure 4D and Supplementary Figure S10, with four transcripts consistently upregulated in hypercapnia (RRP9, DHP5, SERPINH1, and POLR1A) and five transcripts consistently downregulated (SRSF5, CYTH2, A4GALT, DPP8, and SLC6A6). These genes are associated with RNA metabolism (SRSF5, POLR1A), metabolite conversion (A4GALT), protein modification (DPP8), and protein-binding activity (SERPINH1, CYTH2), with no obvious initial common link apparent. Taken together, these data speak to the responsiveness of multiple important, diverse pathways to buffered hypercapnia.
In order to gain further insight into CO2-sensitive transcriptional regulators, we sought to exploit our knowledge regarding genes commonly regulated by CO2 across our three cell lines. Metacore transcription factor analysis revealed a notable conservation of interactions between several transcription factors, including AML1, SOX17, TAL1, ETS1, and LMO2 (Supplementary Table S5). Transcription factors previously linked with hypercapnia were also identified in our list but were not among the most prominent hits in our model, e.g., Transcription Factor P65 (RelA) [29], NFκB Subunit 2 (NFKB2) [22], Hypoxia Inducible Factor 1 Alpha (HIF1α) [37], Heat Shock Transcription Factor 1 (HSF1) [35], Cyclic AMP-Responsive Element-Binding Protein 1 (CREB) [38], Forkhead Box O3 (FOXO3a) [39], Early Growth Response 2 (EGR2) [40], Sterol Regulatory Element Binding Transcription Factor 2 (SREBP2) [41].
AML1 is a leukaemia-associated transcription factor linked with hematopoiesis [42]. It has been identified as an overexpressed gene in the lung of COPD patients [43]. SOX17 is a key transcription factor involved in development that affects the cardiovascular system and several endoderm-derived organs [44]. SOX17 deficiency is linked to pulmonary arterial hypertension (PAH) risk via interactions with Hypoxia Inducible Factor 2 Alpha (HIF-2α) [45]. TAL1 is also a leukaemia associated transcription factor associated with hematopoiesis [45], which can act in complex with LMO2, a LIM-domain protein [46]. ETS-1 is a transcription factor that recognises conserved ETS DNA-binding domains and contributes to cytokine and chemokine regulation. ETS transcription factors are associated with a number of cancers, including breast and leukaemia. ETS-1 is linked to liver fibrosis, where it is thought to be activated by Extracellular Signal-Regulated Kinases (ERK) signalling pathways, matrix remodelling, and cross talk with Transforming Growth Factor (TGF)-Suppressor of Mothers Against Decapentaplegic (SMAD) signalling [47]. Interestingly, there is evidence of significant cross-talk with regard to these transcription factors. For example, ETS-1 and AML-1 can mutually activate DNA binding through the intermolecular interaction of autoinhibitory domains [48], while TAL1 and LMO2 function as complexes, and TAL1, LMO2, and AML-1 (Runx1) are essential for the development of hematopoietic stem cells [49]. It is also notable that these transcription factors are associated with leukaemia and that our THP-1 model is of leukaemic origin. To our knowledge, this is the first evidence suggesting the involvement of any of these five transcription factors in the cellular response to hypercapnia. Of these transcription factors, we focused on ETS-1, based on its association with all nine genes in Figure 4D. We examined ETS-1 and Lamin in nuclear lysates derived from monocytes exposed to buffered hypercapnia for 24 h. Nuclear lamin levels were relatively unchanged in this model, but ETS-1 protein expression in the nucleus was enhanced in hypercapnia. ETS-1 has a predicted molecular weight (MW) of 52 kilodaltons (kD), which is the molecular weight at which we observe our most intense bands using Western blot. We also observe some lower molecular weight bands (with the same pattern of CO2-sensitivity), which may be ETS-1 splice variants. p42 and p27 variants of ETS-1 have been described previously [50] and correspond well with the observed molecular weights of the two lower MW bands observed by Western blot (Figure 5A).
In conclusion, our study indicates that NR4A2 and NR4A3 are CO2-responsive transcription factors, as the kinetics of their expression in response to LPS is clearly shifted by exposure to buffered hypercapnia. Furthermore, depletion of NR4A2 and NR4A3 led to reduced CO2-sensitivity of mitochondrial genes and Hsp-related genes, respectively. However, many other CO2-sensitive genes were refractory to depletion of NR4A2 and NR4A3, indicating that the NR4As regulate selective components of the cellular response to buffered hypercapnia but that other transcription factors also contribute. Bioinformatic analysis of conserved CO2-sensitive genes implicated several novel putative CO2-sensitive transcription factors (AML1, SOX17, TAL1, ETS1, and LMO2), of which ETS-1 was validated to show increased nuclear expression in buffered hypercapnia. Taken together, these data represent a significant resource relating to CO2-dependent transcriptional regulation in monocytes and give important insights into the understanding of immune responses in patients experiencing hypercapnia.

4. Materials and Methods

4.1. Cell Culture

4.1.1. THP-1 Monocytes

THP-1 monocytes were originally sourced from the American Type Culture Collection (ATCC TIB-202) and cultured as described previously [15,26]. Briefly, THP-1 cells were maintained in Roswell Park Memorial Institute (RPMI) 1640 medium supplemented with 10% Foetal Bovine Serum and 1% Penicillin-Streptomycin (ThermoFisher Scientific, Waltham, MA, USA). Cells were maintained at a density of 2 × 10⁵–1 × 10⁶ cells/mL and sub-cultured twice per week. All procedures and treatments prior to cell lysis were performed in a Class II biological safety cabinet or a CO2 chamber, as described below. Untransformed THP-1 monocytes were used in Figure 1, Figure 5 and Supplementary Figure S1. All other figures used shNT-THP1, shNR4A2-THP1, and shNR4A3-THP1 monocytes initially described and validated in [25]. Further, validation of knockdown of NR4A2 and NR4A3 has been previously described [15] and is also demonstrated in the presence of CO2 as part of Supplementary Figure S7.

4.1.2. Hypercapnic Exposures

Hypercapnia exposures were performed as described previously [26]. Briefly, hypercapnic exposures were performed in humidified environmental chambers (Coy Laboratories, Grass Lake, MI, USA) at 37 °C, at 5% or 10% CO2 in pH-buffered, pre-equilibrated Dulbecco’s Modified Eagle Medium (DMEM) media [22]. For most THP-1 experiments, cells were used at a density of 7.5 × 10⁵ cells/mL. The maintenance of intracellular and extracellular pH under these conditions has recently been described [26].

4.1.3. RNA-Seq

The RNA-seq protocol was performed as described previously [15,26]. Briefly, total RNA was extracted from cultured cells using the E.Z.N.A. Total RNA Kit I. RNA clean-up was performed (if required) using ethanol precipitation. Subsequent Qubit results determined a RNA integrity number (RIN) score > 9.5 for all samples. Complementary DNA (cDNA) library preparation was performed with polyA selection using Illumina HiSeq, 2 × 150 base pair (bp) configuration, single index, per lane. ~350M raw paired-end reads per lane. Library preparation and sequencing were performed by GeneWiz (Leipzig, Germany). Raw data quality was evaluated with FastQC. Sequence reads were trimmed using Trimmomatic v.0.36 and subsequently mapped to the Homo sapiens GRCh38 reference genome using the STAR aligner v.2.5.2b. Unique gene hit counts were calculated by using featureCounts from the Subread package v.1.5.2. Downstream differential expression analysis was performed using DESeq2 [51]. p-values and log2-fold changes were generated using the Wald test. Significant differentially expressed genes (DEGs) were called genes with an adjusted p-value (p-adj) < 0.05 (Supplementary Tables S1–S4). Initial stringent gene ontology (GO) analysis was performed using GeneSCF v1.1-p2 to generate GO graphs, where a Fisher Exact test was used to determine p-values (Supplementary Figure S5). Principal component analysis and read count distribution analysis were performed by GeneWiz (Supplementary Figure S2). Volcano plots of differentially expressed genes were generated using GraphPad Prism, with log2FC on the x-axis and an adjusted p-value on the y-axis (Figure 2 and Figure 3). Significant differentially expressed genes (DEGs) were determined as any genes from the DESeq2 workflow that had an adjusted p-value (p-adj) < 0.05. Nested comparisons for multiple groups were completed by cross-referencing lists of DEGs from pairwise comparisons to generate secondary lists of either common or specific DEGs. Raw data from the RNA-seq experiment is displayed as mean TPM (+/− SEM) to best visualise expression changes between several groups. Statistical comparisons between individual groups used DESeq2 analysis of normalised counts. The bulk RNA-seq data presented in this study are deposited in the Gene Expression Omnibus (GEO) repository, accession number GSE251925.

4.2. Quantitative Reverse Transcription Polymerase Chain Reaction (RT-qPCR)

RT-qPCR was performed as described recently [26]. Briefly, RNA was extracted using the EZNA total RNA Kit I (Omega Bio-tek, Norcross, GA, USA) according to the manufacturer’s instructions, and DNase I digestions were performed. cDNA was synthesised using Moloney Murine Leukaemia Virus (M-MLV) Reverse Transcriptase (Promega, Madison, WI, USA). Samples were incubated for 60 min at 37 °C for the cDNA synthesis reaction. cDNA samples were used immediately or stored at −20 °C. cDNA samples were diluted 1 in 4 in nuclease free water. For SYBR qPCR, master mixes for SYBR green reactions ((ThermoFisher Scientific, (Applied Biosystems) Waltham, MA, USA) were prepared using master mix solutions, forward and reverse primers, and nuclease-free water for 10 μL reactions in a 384-well plate. qPCR was performed on an Applied Biosystems RT-PCR machine with the appropriate Applied Biosystems Quant Studio 7 software. For SYBR Green primers, melt curves were generated for each sample for assessment of primer performance.
Primer details:
  • NR4A1 F: gttctctggaggtcatccgcaag R: gcagggaccttgagaaggcca
  • NR4A3 F: ccaagccttagcctgcctgtc R: agcctgtcccttactctggtgg
  • B-actin F: cgacaggatgcagaaggaga R:catctgctggaaggtggaca
For TaqMan qPCR, master mixes for TaqMan reactions ((ThermoFisher Scientific, (Applied Biosystems) Waltham, MA, USA) were prepared using master mix solutions, forward and reverse primers, and nuclease free water for 10 μL reactions in a 384-well plate. qPCR was performed on an Applied Biosystems RT-PCR machine with the appropriate Applied Biosystems Quant Studio 7 software.

4.3. TaqMan Primer Details

  • NR4A2: Applied Biosystems Hs01117527_g1 (4331182)
  • B-actin: Applied Biosystems (Code:4333762F)

4.4. Western Blot

Whole cell protein lysates, Supplementary Figure S1, were prepared using whole cell lysis buffer (150 mM NaCl, 25 mM Tris pH8, 1 mM EDTA, 1% Triton) supplemented with protease inhibitor cocktail (Merck, (Sigma-Aldrich) Darmstadt, Germany, P2714). Lysates were quantified using the DC Protein Assay kit before Sodium Dodecyl-Sulfate Polyacrylamine Gel Electrophoresis (SDS-PAGE) on the Biorad mini-protean system using polyacrylamide gels. Wet transfer was performed onto nitrocellulose membranes and reversibly stained with Ponceau S total protein stain. Immunoblotting was performed with NR4A2 (R&D Systems, Minneapolis MN, USA, PP-N1404-00) or β-actin (Merck, (Sigma-Aldrich) Darmstadt, Germany A5316) primary antibodies. Secondary antibody incubations were performed using Horseradish Peroxidase (HRP)-conjugated anti-mouse antibodies (Cell Signalling Technology, Danvers MA, USA, 7076S). Membranes were incubated with Enhanced Chemi Luminescent Solution (ThermoFisher Scientific, Waltham, MA, USA, 32106) and imaged in a dark room using X-ray film (Fuji Super RX-N, Tokyo, Japan).
Nuclear extracts, Figure 5, were prepared using Buffer A and Buffer C supplemented with protease inhibitor cocktail (Merck, (Sigma-Aldrich) Darmstadt, Germany, P2714) to generate cytoplasmic and nuclear extracts, respectively [29]. Nuclear lysates were quantified using the DC Protein Assay kit before SDS-PAGE on the Biorad (Hercules, CA, USA) mini-protean system using TGX pre-cast gels. Wet transfer was performed onto nitrocellulose membranes and reversibly stained with Revert 700 total protein stain (Li-Cor, Lincoln, NE, USA). Membranes were imaged at 700 nm, washed in Revert 700 wash solution (Li-Cor, Lincoln, NE, USA) and destained in Revert 700 destaining solution (Li-Cor, Lincoln, NE, USA) prior to immunoblotting with the ETS-1 antibody (Cell Signalling Technology, Danvers MA, USA #14069), or Lamin (Cell Signalling Technology, Danvers MA, USA, #4777) antibody. Fluorescent secondary goat anti-mouse or anti-rabbit antibody incubations were performed (DyLight TM 800, ThermoFisher Scientific (Invitrogen), Waltham, MA, USA) and imaged at 800 nm (1:2000 dilution). Membranes were imaged using a LiCor Odyssey Clx imager (Li-Cor, Lincoln, NE, USA) and analysed using EmperiaStudio image analysis software version 2.3.0.154.

4.5. Bioinformatic Analysis

Transcription factor interactome analysis was performed on the Metacore platform (MetaCore+MetaDrug® version 20.3 build 70200, Clarivate, London, UK) using the list of DEGs obtained by a fold change cutoff of 1.4 with a padj < 0.05. We have used this approach previously [15,52]. Transcription factors were not directly measured in our data but inferred from gene expression signatures based on an unbiased predictive analysis of known upstream regulators of DEGs. The transcriptional regulators of DEGs were ranked by a Z-score cut-off of 2.0 with a p-adj < 0.05. Comparisons were made between shNT 5% CO2 vs. shNT 10% CO2, shNT 5% CO2 +LPS vs. shNT 10% CO2 +LPS, shNR4A2 5% CO2 +LPS vs. shNR4A2 10% CO2 +LPS, shNR4A3 5% CO2+LPS vs. shNR4A3 10% CO2 +LPS. Supplementary Table S5.

4.6. Statistical Analysis

Statistical analysis was performed for the RNA-seq and targeted transcriptomic analysis as described above. ANOVA, or t-tests, were applied as indicated in the figure legends and figures prepared using GraphPad Prism (Boston, MA, USA) (version8).

Supplementary Materials

The following supporting information can be downloaded at: https://www.mdpi.com/article/10.3390/ijms25052852/s1.

Author Contributions

E.P.C. conceived and designed the overall study. D.E.P., B.R. and E.P.C. performed experiments associated with the study. M.S. and J.I.S. performed bioinformatic analysis associated with the study. D.E.P., D.C. and E.P.C. designed specific elements associated with the study. D.E.P., D.C., B.R. and E.P.C. analysed the data. D.E.P. and E.P.C. wrote the paper. All authors have read and agreed to the published version of the manuscript.

Funding

This work was supported by a Science Foundation Ireland (SFI) Career Development award to EPC (SFI 15/CDA/3490), which also supported DP. BR is supported by a UCD School of Medicine demonstratorship. MS and JIS are supported by the NIH grant: HL-147070.

Institutional Review Board Statement

Not applicable.

Informed Consent Statement

Not applicable.

Data Availability Statement

Bulk RNA-seq data relating to shNR4A2 and shNR4A3 cells in hypercapnia have been deposited in the GEO repository with accession number GSE251925. Some of the bulk RNA-seq data described in this manuscript has previously been deposited in the Gene Expression Omnibus (GEO) repository. Buffered hypercapnia alters the transcriptional profile in monocytes. Accession number GSE206333 (data relating to shNT cells only) Transcriptional profiling of monocytes deficient in Nuclear Orphan Receptors NR4A2 and NR4A3 reveals distinct signalling roles related to antigen presentation and viral response. Accession number GSE178391 (data relating to shNT, shNR4A2, and shNR4A3 cells in 5% CO2 only).

Acknowledgments

We acknowledge the support of the Conway Institute Genomics Core Facility (Catherine Moss). We acknowledge the contributions of Niall Clarke, Orla Dunne, Johnny Thornton and Sophie Hayes, who performed undergraduate projects related to this manuscript.

Conflicts of Interest

The authors declare that the research was conducted in the absence of any commercial or financial relationships that could be construed as a potential conflict of interest.

References

  1. Nin, N.; Muriel, A.; Penuelas, O.; Brochard, L.; Lorente, J.A.; Ferguson, N.D.; Raymondos, K.; Rios, F.; Violi, D.A.; Thille, A.W.; et al. Severe hypercapnia and outcome of mechanically ventilated patients with moderate or severe acute respiratory distress syndrome. Intensive Care Med. 2017, 43, 200–208. [Google Scholar] [CrossRef]
  2. Cummins, E.P.; Strowitzki, M.J.; Taylor, C.T. Mechanisms and Consequences of Oxygen and Carbon Dioxide Sensing in Mammals. Physiol. Rev. 2020, 100, 463–488. [Google Scholar] [CrossRef]
  3. Phelan, D.E.; Mota, C.; Lai, C.; Kierans, S.J.; Cummins, E.P. Carbon dioxide-dependent signal transduction in mammalian systems. Interface Focus. 2021, 11, 20200033. [Google Scholar] [CrossRef]
  4. Maxwell, M.A.; Muscat, G.E. The NR4A subgroup: Immediate early response genes with pleiotropic physiological roles. Nucl. Recept. Signal 2006, 4, e002. [Google Scholar] [CrossRef]
  5. Pearen, M.A.; Muscat, G.E. Minireview: Nuclear hormone receptor 4A signaling: Implications for metabolic disease. Mol. Endocrinol. 2010, 24, 1891–1903. [Google Scholar] [CrossRef]
  6. Aherne, C.M.; McMorrow, J.; Kane, D.; FitzGerald, O.; Mix, K.S.; Murphy, E.P. Identification of NR4A2 as a transcriptional activator of IL-8 expression in human inflammatory arthritis. Mol. Immunol. 2009, 46, 3345–3357. [Google Scholar] [CrossRef]
  7. Ralph, J.A.; Ahmed, A.U.; Santos, L.L.; Clark, A.R.; McMorrow, J.; Murphy, E.P.; Morand, E.F. Identification of NURR1 as a mediator of MIF signaling during chronic arthritis: Effects on glucocorticoid-induced MKP1. Am. J. Pathol. 2010, 177, 2366–2378. [Google Scholar] [CrossRef]
  8. Nus, M.; Basatemur, G.; Galan, M.; Cros-Brunso, L.; Zhao, T.X.; Masters, L.; Harrison, J.; Figg, N.; Tsiantoulas, D.; Geissmann, F.; et al. NR4A1 Deletion in Marginal Zone B Cells Exacerbates Atherosclerosis in Mice-Brief Report. Arter. Thromb. Vasc. Biol. 2020, 40, 2598–2604. [Google Scholar] [CrossRef]
  9. Wu, H.; Bi, J.; Peng, Y.; Huo, L.; Yu, X.; Yang, Z.; Zhou, Y.; Qin, L.; Xu, Y.; Liao, L.; et al. Nuclear receptor NR4A1 is a tumor suppressor down-regulated in triple-negative breast cancer. Oncotarget 2017, 8, 54364–54377. [Google Scholar] [CrossRef]
  10. Crean, D.; Murphy, E.P. Targeting NR4A Nuclear Receptors to Control Stromal Cell Inflammation, Metabolism, Angiogenesis, and Tumorigenesis. Front. Cell Dev. Biol. 2021, 9, 589770. [Google Scholar] [CrossRef]
  11. Safe, S.; Jin, U.H.; Morpurgo, B.; Abudayyeh, A.; Singh, M.; Tjalkens, R.B. Nuclear receptor 4A (NR4A) family—Orphans no more. J. Steroid Biochem. Mol. Biol. 2016, 157, 48–60. [Google Scholar] [CrossRef]
  12. Mohankumar, K.; Wright, G.; Kumaravel, S.; Shrestha, R.; Zhang, L.; Abdelrahim, M.; Chapkin, R.S.; Safe, S. Bis-indole-derived NR4A1 antagonists inhibit colon tumor and splenic growth and T-cell exhaustion. Cancer Immunol. Immunother. 2023, 72, 3985–3999. [Google Scholar] [CrossRef]
  13. Zhao, Y.; Bruemmer, D. NR4A orphan nuclear receptors: Transcriptional regulators of gene expression in metabolism and vascular biology. Arter. Thromb. Vasc. Biol. 2010, 30, 1535–1541. [Google Scholar] [CrossRef]
  14. Rodriguez-Calvo, R.; Tajes, M.; Vazquez-Carrera, M. The NR4A subfamily of nuclear receptors: Potential new therapeutic targets for the treatment of inflammatory diseases. Expert. Opin. Ther. Targets 2017, 21, 291–304. [Google Scholar] [CrossRef]
  15. Phelan, D.E.; Shigemura, M.; Aldhafiri, S.; Mota, C.; Hall, T.J.; Sznajder, J.I.; Murphy, E.P.; Crean, D.; Cummins, E.P. Transcriptional Profiling of Monocytes Deficient in Nuclear Orphan Receptors NR4A2 and NR4A3 Reveals Distinct Signalling Roles Related to Antigen Presentation and Viral Response. Front. Immunol. 2021, 12, 676644. [Google Scholar] [CrossRef]
  16. Sharabi, K.; Hurwitz, A.; Simon, A.J.; Beitel, G.J.; Morimoto, R.I.; Rechavi, G.; Sznajder, J.I.; Gruenbaum, Y. Elevated CO2 levels affect development, motility, and fertility and extend life span in Caenorhabditis elegans. Proc. Natl. Acad. Sci. USA 2009, 106, 4024–4029. [Google Scholar] [CrossRef]
  17. Gwozdzinska, P.; Buchbinder, B.A.; Mayer, K.; Herold, S.; Morty, R.E.; Seeger, W.; Vadasz, I. Hypercapnia Impairs ENaC Cell Surface Stability by Promoting Phosphorylation, Polyubiquitination and Endocytosis of beta-ENaC in a Human Alveolar Epithelial Cell Line. Front. Immunol. 2017, 8, 591. [Google Scholar] [CrossRef] [PubMed]
  18. Gabrielli, N.M.; Mazzocchi, L.C.; Kryvenko, V.; Tello, K.; Herold, S.; Morty, R.E.; Grimminger, F.; Dada, L.A.; Seeger, W.; Sznajder, J.I.; et al. TRAF2 Is a Novel Ubiquitin E3 Ligase for the Na,K-ATPase beta-Subunit That Drives Alveolar Epithelial Dysfunction in Hypercapnia. Front. Cell Dev. Biol. 2021, 9, 689983. [Google Scholar] [CrossRef] [PubMed]
  19. Casalino-Matsuda, S.M.; Nair, A.; Beitel, G.J.; Gates, K.L.; Sporn, P.H. Hypercapnia Inhibits Autophagy and Bacterial Killing in Human Macrophages by Increasing Expression of Bcl-2 and Bcl-xL. J. Immunol. 2015, 194, 5388–5396. [Google Scholar] [CrossRef] [PubMed]
  20. Casalino-Matsuda, S.M.; Berdnikovs, S.; Wang, N.; Nair, A.; Gates, K.L.; Beitel, G.J.; Sporn, P.H.S. Hypercapnia selectively modulates LPS-induced changes in innate immune and DNA replication-related gene transcription in the macrophage. Interface Focus. 2021, 11, 20200039. [Google Scholar] [CrossRef] [PubMed]
  21. Linthwaite, V.L.; Pawloski, W.; Pegg, H.B.; Townsend, P.D.; Thomas, M.J.; So, V.K.H.; Brown, A.P.; Hodgson, D.R.W.; Lorimer, G.H.; Fushman, D.; et al. Ubiquitin is a carbon dioxide-binding protein. Sci. Adv. 2021, 7, eabi5507. [Google Scholar] [CrossRef]
  22. Keogh, C.E.; Scholz, C.C.; Rodriguez, J.; Selfridge, A.C.; von Kriegsheim, A.; Cummins, E.P. Carbon dioxide-dependent regulation of NF-kB family members RelB and p100 gives molecular insight into CO2-dependent immune regulation. J. Biol. Chem. 2017, 292, 11561–11571. [Google Scholar] [CrossRef]
  23. Masterson, C.; O’Toole, D.; Leo, A.; McHale, P.; Horie, S.; Devaney, J.; Laffey, J.G. Effects and Mechanisms by Which Hypercapnic Acidosis Inhibits Sepsis-Induced Canonical Nuclear Factor-kappaB Signaling in the Lung. Crit. Care Med. 2016, 44, e207–e217. [Google Scholar] [CrossRef]
  24. Saijo, K.; Winner, B.; Carson, C.T.; Collier, J.G.; Boyer, L.; Rosenfeld, M.G.; Gage, F.H.; Glass, C.K. A Nurr1/CoREST pathway in microglia and astrocytes protects dopaminergic neurons from inflammation-induced death. Cell 2009, 137, 47–59. [Google Scholar] [CrossRef]
  25. Crean, D.; Cummins, E.P.; Bahar, B.; Mohan, H.; McMorrow, J.P.; Murphy, E.P. Adenosine Modulates NR4A Orphan Nuclear Receptors To Attenuate Hyperinflammatory Responses in Monocytic Cells. J. Immunol. 2015, 195, 1436–1448. [Google Scholar] [CrossRef]
  26. Phelan, D.E.; Mota, C.; Strowitzki, M.J.; Shigemura, M.; Sznajder, J.I.; Crowe, L.; Masterson, J.C.; Hayes, S.E.; Reddan, B.; Yin, X.; et al. Hypercapnia alters mitochondrial gene expression and acylcarnitine production in monocytes. Immunol. Cell Biol. 2023, 101, 556–577. [Google Scholar] [CrossRef]
  27. Pei, L.; Castrillo, A.; Chen, M.; Hoffmann, A.; Tontonoz, P. Induction of NR4A orphan nuclear receptor expression in macrophages in response to inflammatory stimuli. J. Biol. Chem. 2005, 280, 29256–29262. [Google Scholar] [CrossRef]
  28. McEvoy, C.; de Gaetano, M.; Giffney, H.E.; Bahar, B.; Cummins, E.P.; Brennan, E.P.; Barry, M.; Belton, O.; Godson, C.G.; Murphy, E.P.; et al. NR4A Receptors Differentially Regulate NF-kB Signaling in Myeloid Cells. Front. Immunol. 2017, 8, 7. [Google Scholar] [CrossRef]
  29. Oliver, K.M.; Lenihan, C.R.; Bruning, U.; Cheong, A.; Laffey, J.G.; McLoughlin, P.; Taylor, C.T.; Cummins, E.P. Hypercapnia induces cleavage and nuclear localization of RelB protein, giving insight into CO2 sensing and signaling. J. Biol. Chem. 2012, 287, 14004–14011. [Google Scholar] [CrossRef]
  30. Herring, J.A.; Elison, W.S.; Tessem, J.S. Function of Nr4a Orphan Nuclear Receptors in Proliferation, Apoptosis and Fuel Utilization Across Tissues. Cells 2019, 8, 1373. [Google Scholar] [CrossRef]
  31. Koenis, D.S.; Medzikovic, L.; van Loenen, P.B.; van Weeghel, M.; Huveneers, S.; Vos, M.; Evers-van Gogh, I.J.; Van den Bossche, J.; Speijer, D.; Kim, Y.; et al. Nuclear Receptor Nur77 Limits the Macrophage Inflammatory Response through Transcriptional Reprogramming of Mitochondrial Metabolism. Cell Rep. 2018, 24, 2127–2140.e7. [Google Scholar] [CrossRef] [PubMed]
  32. Paez, H.G.; Ferrandi, P.J.; Pitzer, C.R.; Mohamed, J.S.; Alway, S.E. Loss of NOR-1 represses muscle metabolism through mTORC1-mediated signaling and mitochondrial gene expression in C2C12 myotubes. FASEB J. 2023, 37, e23050. [Google Scholar] [CrossRef] [PubMed]
  33. Murshid, A.; Gong, J.; Calderwood, S.K. The role of heat shock proteins in antigen cross presentation. Front. Immunol. 2012, 3, 63. [Google Scholar] [CrossRef] [PubMed]
  34. Wan, Q.; Song, D.; Li, H.; He, M.L. Stress proteins: The biological functions in virus infection, present and challenges for target-based antiviral drug development. Signal Transduct. Target. Ther. 2020, 5, 125. [Google Scholar] [CrossRef]
  35. Lu, Z.; Casalino-Matsuda, S.M.; Nair, A.; Buchbinder, A.; Budinger, G.R.S.; Sporn, P.H.S.; Gates, K.L. A role for heat shock factor 1 in hypercapnia-induced inhibition of inflammatory cytokine expression. FASEB J. 2018, 32, 3614–3622. [Google Scholar] [CrossRef] [PubMed]
  36. Malewicz, M.; Kadkhodaei, B.; Kee, N.; Volakakis, N.; Hellman, U.; Viktorsson, K.; Leung, C.Y.; Chen, B.; Lewensohn, R.; van Gent, D.C.; et al. Essential role for DNA-PK-mediated phosphorylation of NR4A nuclear orphan receptors in DNA double-strand break repair. Genes Dev. 2011, 25, 2031–2040. [Google Scholar] [CrossRef] [PubMed]
  37. Selfridge, A.C.; Cavadas, M.A.; Scholz, C.C.; Campbell, E.L.; Welch, L.C.; Lecuona, E.; Colgan, S.P.; Barrett, K.E.; Sporn, P.H.; Sznajder, J.I.; et al. Hypercapnia Suppresses the HIF-dependent Adaptive Response to Hypoxia. J. Biol. Chem. 2016, 291, 11800–11808. [Google Scholar] [CrossRef]
  38. Townsend, P.; Holliday, P.; Fenyk, S.; Hess, K.; Gray, M.; Hodgson, D.; Cann, M. Stimulation of mammalian G-protein-responsive adenylyl cyclases by carbon dioxide. J. Biol. Chem. 2009, 284, 784–791. [Google Scholar] [CrossRef]
  39. Jaitovich, A.; Angulo, M.; Lecuona, E.; Dada, L.A.; Welch, L.C.; Cheng, Y.; Gusarova, G.; Ceco, E.; Liu, C.; Shigemura, M.; et al. High CO2 levels cause skeletal muscle atrophy via AMP-activated kinase (AMPK), FoxO3a protein, and muscle-specific Ring finger protein 1 (MuRF1). J. Biol. Chem. 2015, 290, 9183–9194. [Google Scholar] [CrossRef]
  40. Otulakowski, G.; Engelberts, D.; Arima, H.; Hirate, H.; Bayir, H.; Post, M.; Kavanagh, B.P. alpha-Tocopherol transfer protein mediates protective hypercapnia in murine ventilator-induced lung injury. Thorax 2017, 72, 538–549. [Google Scholar] [CrossRef]
  41. Bolshette, N.; Ezagouri, S.; Dandavate, V.; Karavaeva, I.; Golik, M.; Wang, H.; Espenshade, P.J.; Osborne, T.F.; Han, X.; Asher, G. Carbon dioxide regulates cholesterol levels through SREBP2. PLoS Biol. 2023, 21, e3002367. [Google Scholar] [CrossRef]
  42. Okuda, T.; Nishimura, M.; Nakao, M.; Fujita, Y. RUNX1/AML1: A central player in hematopoiesis. Int. J. Hematol. 2001, 74, 252–257. [Google Scholar] [CrossRef]
  43. Zhu, Y.; Zhou, A.; Li, Q. Whole transcriptome analyis of human lung tissue to identify COPD-associated genes. Genomics 2020, 112, 3135–3141. [Google Scholar] [CrossRef] [PubMed]
  44. Tan, D.S.; Holzner, M.; Weng, M.; Srivastava, Y.; Jauch, R. SOX17 in cellular reprogramming and cancer. Semin. Cancer Biol. 2020, 67 Pt 1, 65–73. [Google Scholar] [CrossRef] [PubMed]
  45. Sangam, S.; Sun, X.; Schwantes-An, T.H.; Yegambaram, M.; Lu, Q.; Shi, Y.; Cook, T.; Fisher, A.; Frump, A.L.; Coleman, A.; et al. SOX17 Deficiency Mediates Pulmonary Hypertension: At the Crossroads of Sex, Metabolism, and Genetics. Am. J. Respir. Crit. Care Med. 2023, 207, 1055–1069. [Google Scholar] [CrossRef]
  46. Stanulovic, V.S.; Cauchy, P.; Assi, S.A.; Hoogenkamp, M. LMO2 is required for TAL1 DNA binding activity and initiation of definitive haematopoiesis at the haemangioblast stage. Nucleic Acids Res. 2017, 45, 9874–9888. [Google Scholar] [CrossRef] [PubMed]
  47. Zhang, L.Y.; Tan, Y.; Luo, X.J.; Wu, J.F.; Ni, Y.R. The roles of ETS transcription factors in liver fibrosis. Hum. Cell 2023, 36, 528–539. [Google Scholar] [CrossRef] [PubMed]
  48. Kim, W.Y.; Sieweke, M.; Ogawa, E.; Wee, H.J.; Englmeier, U.; Graf, T.; Ito, Y. Mutual activation of Ets-1 and AML1 DNA binding by direct interaction of their autoinhibitory domains. EMBO J. 1999, 18, 1609–1620. [Google Scholar] [CrossRef] [PubMed]
  49. Landry, J.R.; Kinston, S.; Knezevic, K.; de Bruijn, M.F.; Wilson, N.; Nottingham, W.T.; Peitz, M.; Edenhofer, F.; Pimanda, J.E.; Ottersbach, K.; et al. Runx genes are direct targets of Scl/Tal1 in the yolk sac and fetal liver. Blood 2008, 111, 3005–3014. [Google Scholar] [CrossRef]
  50. Laitem, C.; Leprivier, G.; Choul-Li, S.; Begue, A.; Monte, D.; Larsimont, D.; Dumont, P.; Duterque-Coquillaud, M.; Aumercier, M. Ets-1 p27: A novel Ets-1 isoform with dominant-negative effects on the transcriptional properties and the subcellular localization of Ets-1 p51. Oncogene 2009, 28, 2087–2099. [Google Scholar] [CrossRef]
  51. Love, M.I.; Huber, W.; Anders, S. Moderated estimation of fold change and dispersion for RNA-seq data with DESeq2. Genome Biol. 2014, 15, 550. [Google Scholar] [CrossRef] [PubMed]
  52. Shigemura, M.; Lecuona, E.; Angulo, M.; Dada, L.A.; Edwards, M.B.; Welch, L.C.; Casalino-Matsuda, S.M.; Sporn, P.H.S.; Vadasz, I.; Helenius, I.T.; et al. Elevated CO2 regulates the Wnt signaling pathway in mammals, Drosophila melanogaster and Caenorhabditis elegans. Sci. Rep. 2019, 9, 18251. [Google Scholar] [CrossRef] [PubMed]
Figure 1. NR4A family members are sensitive to CO2 in THP-1 monocytes. Relative expression of NR4A1 (A,B), NR4A2 (C,D), and NR4A3 (E,F) in THP-1 cells exposed to 5% or 10% CO2 for 8 h +/− LPS (2.5 μg/mL) for up to 6 h. β-actin was used as a housekeeping gene, and samples were normalised to a 5% CO2 untreated control. Data are presented as mean +/− Standard Error of the Mean (SEM) and are representative of n = 3 individual experiments. (A,C,E) show bar graphs including statistically significant differences using two-way Analysis of Variance (ANOVA), followed by Sidak’s multiple comparisons test (p < 0.05 denoted by *, p < 0.01 denoted by **. ns denotes no statistically significant difference, p > 0.05)). (B,D,F) display the same data visualised as a line graph over time.
Ijms 25 02852 g001
Figure 2. Hypercapnia regulates gene expression in NR4A2-depleted monocytes in the presence and absence of LPS. Volcano plot of differential expression between 5% and 10% CO2 (4 h) in shNR4A2 THP-1 cells in the absence (A) and presence (B) of LPS (2.5 μg/mL for 2 h). The cut-off for significance (adjusted p-value (p-adj) < 0.05) is shown with a solid line on the y-axis. Significantly upregulated genes are shown in green, and downregulated genes are shown in red. Venn diagram representing the number of genes differentially expressed in hypercapnia (4 h) in shNT (blue) and shNR4A2 (orange) THP-1 cells in the absence (C) and presence (D) of LPS (2.5 μg/mL for 2 h). Data is representative of n = 3 individual experiments with examples included for each group.
Ijms 25 02852 g002
Figure 3. Hypercapnia regulates gene expression in NR4A3-depleted monocytes in the presence and absence of LPS. Volcano plot of differential expression between 5% and 10% CO2 (4 h) in shNR4A3 THP-1 cells in the absence (A) and presence (B) of LPS (2.5 μg/mL for 2 h). The cut-off for significance (p-adj < 0.05) is shown with a solid line on the y-axis. Significantly upregulated genes are shown in green, and downregulated genes are shown in red. Venn diagram representing the number of genes differentially expressed in hypercapnia (4 h) in shNT (blue) and shNR4A3 (green) THP-1 cells in the absence (C) and presence (D) of LPS (2.5 μg/mL for 2 h). Data is representative of n = 3 individual experiments with examples included for each group.
Ijms 25 02852 g003
Figure 4. Comparison of CO2-sensitive genes in shNT, shNR4A2, and shNR4A3 THP-1 monocytes. Venn diagram representing the number of genes differentially expressed in hypercapnia (4 h) in shNT (blue), shNR4A2 (orange), and shNR4A3 (green) THP-1 cells in the basal state. Representative examples are included for each group (A). Venn diagram representing the number of genes differentially expressed in hypercapnia (4 h) in shNT (blue), shNR4A2 (orange), and shNR4A3 (green) THP-1 cells in the presence of LPS (2.5 μg/mL for 2 h). Representative examples are included for each group (B). Venn diagram representing the number of genes differentially expressed in hypercapnia (4 h) in shNT/shNR4A2/shNR4A3 THP-1 cells in the basal (grey) and LPS stimulated (purple) (2.5 μg/mL for 2 h) states. Representative examples are included for each group (C). A forest plot represents the differential expression of 9 genes that were CO2 responsive regardless of NR4A expression and LPS stimulation (D). Data is representative of n = 3 individual experiments.
Ijms 25 02852 g004
Figure 5. ETS-1 nuclear expression is increased in hypercapnia. Western blot analysis of nuclear lysates from THP-1 monocytes exposed to 5% or 10% CO2 for 24 h. Lysates were probed using a revert total protein stain and imaged in the 700 nm (red) channel or incubated with an (A) ETS-1 or (C) Lamin primary antibody followed by a fluorescent secondary mouse antibody and imaged in the 700 nm (red) or 800 nm (green) channel on an Li-COR imaging system. The image is representative of 3 independent experiments. Protein quantification was performed using EmpiriaStudio and plotted as fold change (Hypercapnia/normocapnia) for protein expression of (B) ETS-1 and (D) Lamin normalised to total revert stain intensity. Arrows indicate the bands on the western blot that were quantified for protein expression.
Ijms 25 02852 g005
Disclaimer/Publisher’s Note: The statements, opinions and data contained in all publications are solely those of the individual author(s) and contributor(s) and not of MDPI and/or the editor(s). MDPI and/or the editor(s) disclaim responsibility for any injury to people or property resulting from any ideas, methods, instructions or products referred to in the content.

