
Metabolic Rewiring and Altered Glial Differentiation in an iPSC-Derived Astrocyte Model Derived from a Nonketotic Hyperglycinemia Patient

 , and
, and 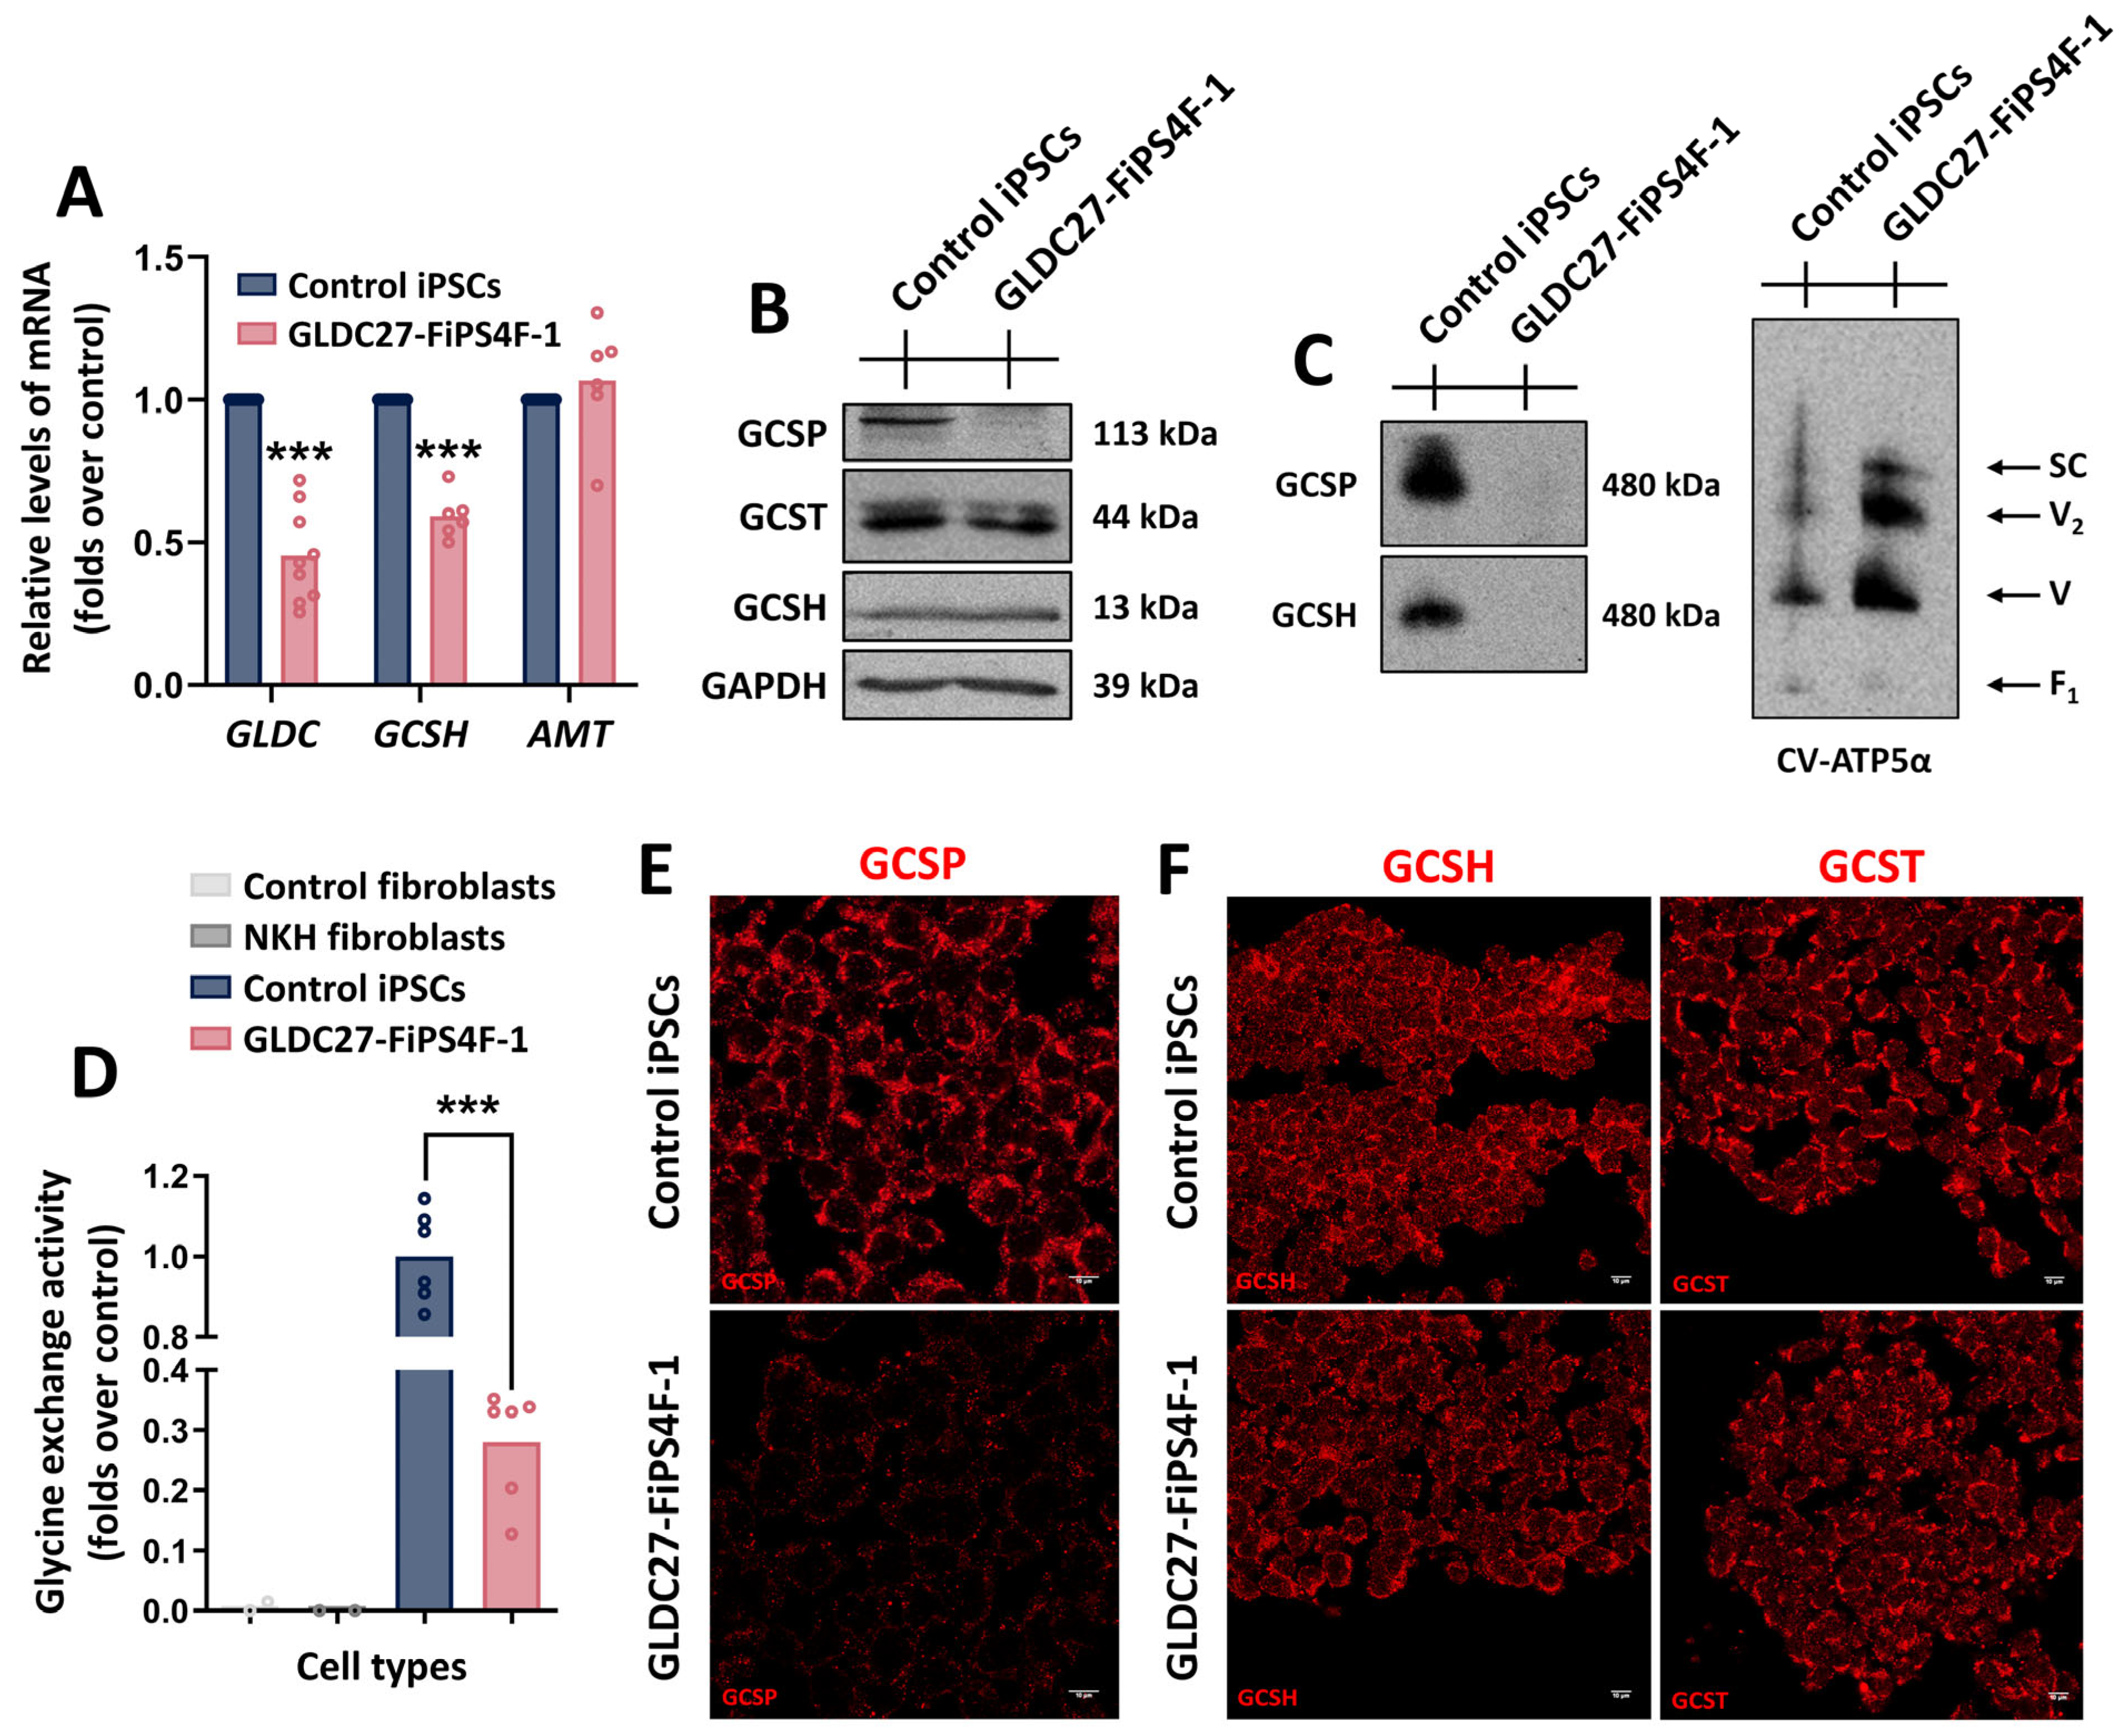
Abstract
1. Introduction
2. Results
2.1. The Human iPSC Model Recapitulates GLDC Deficiency
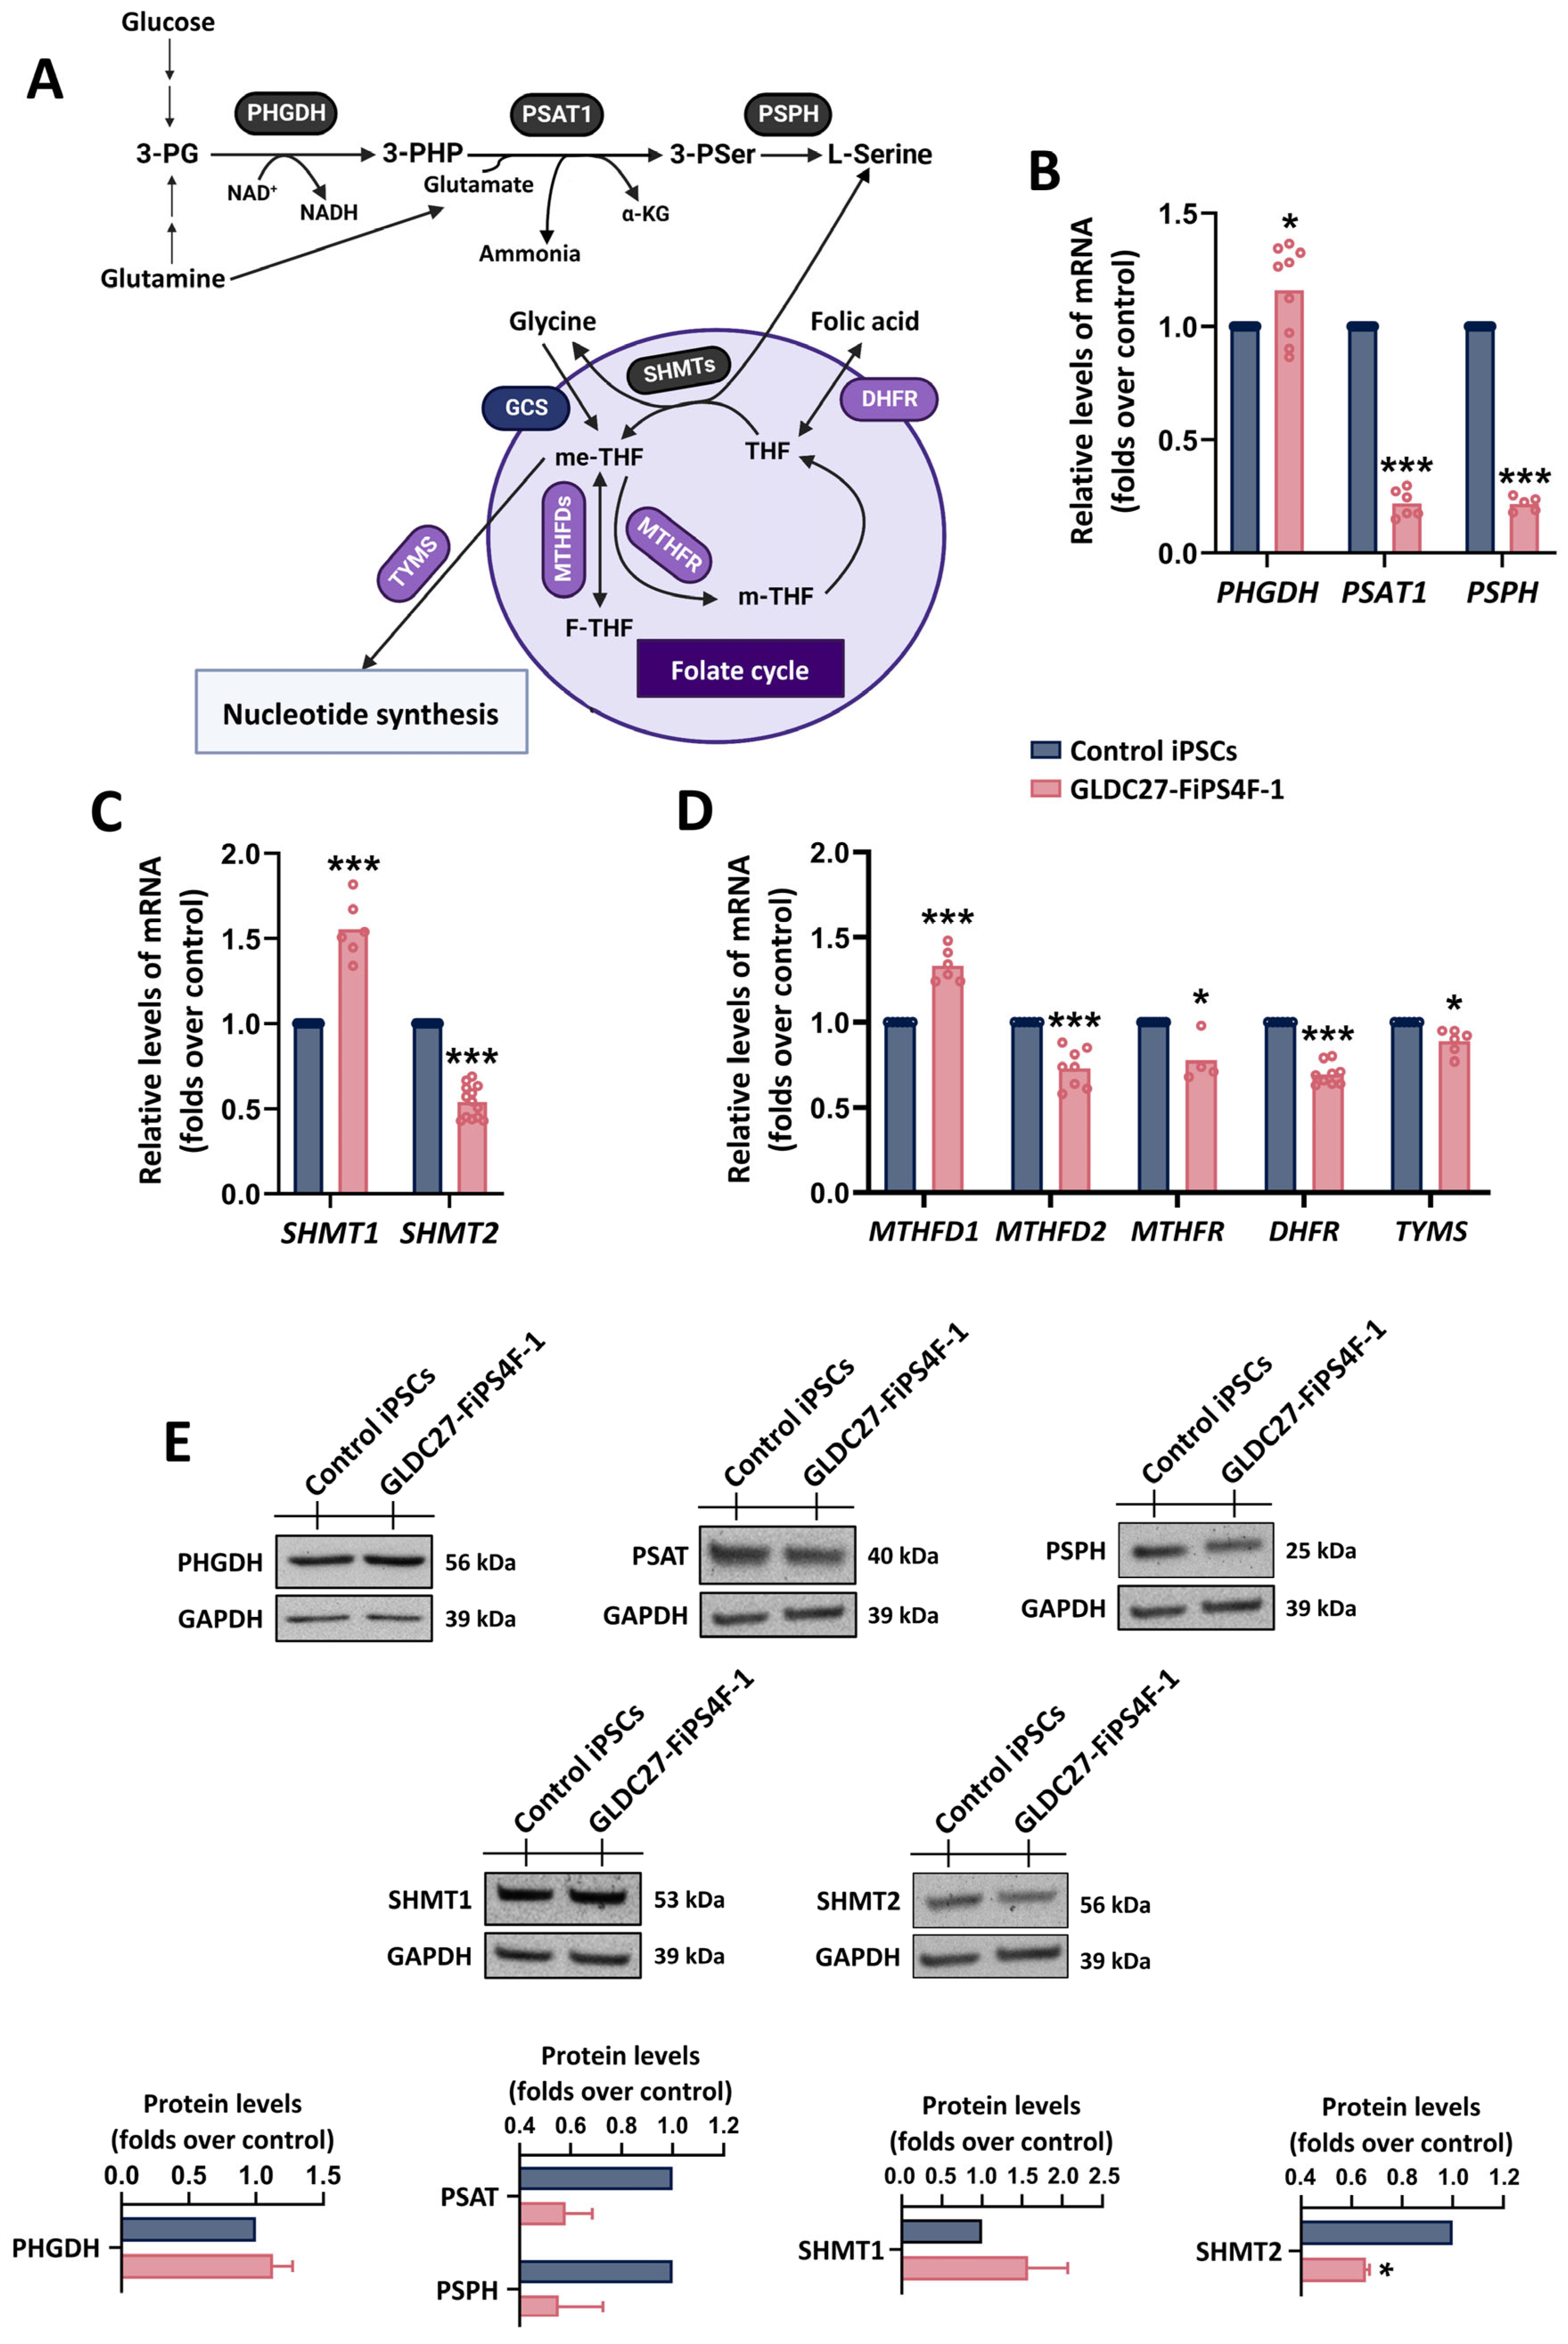
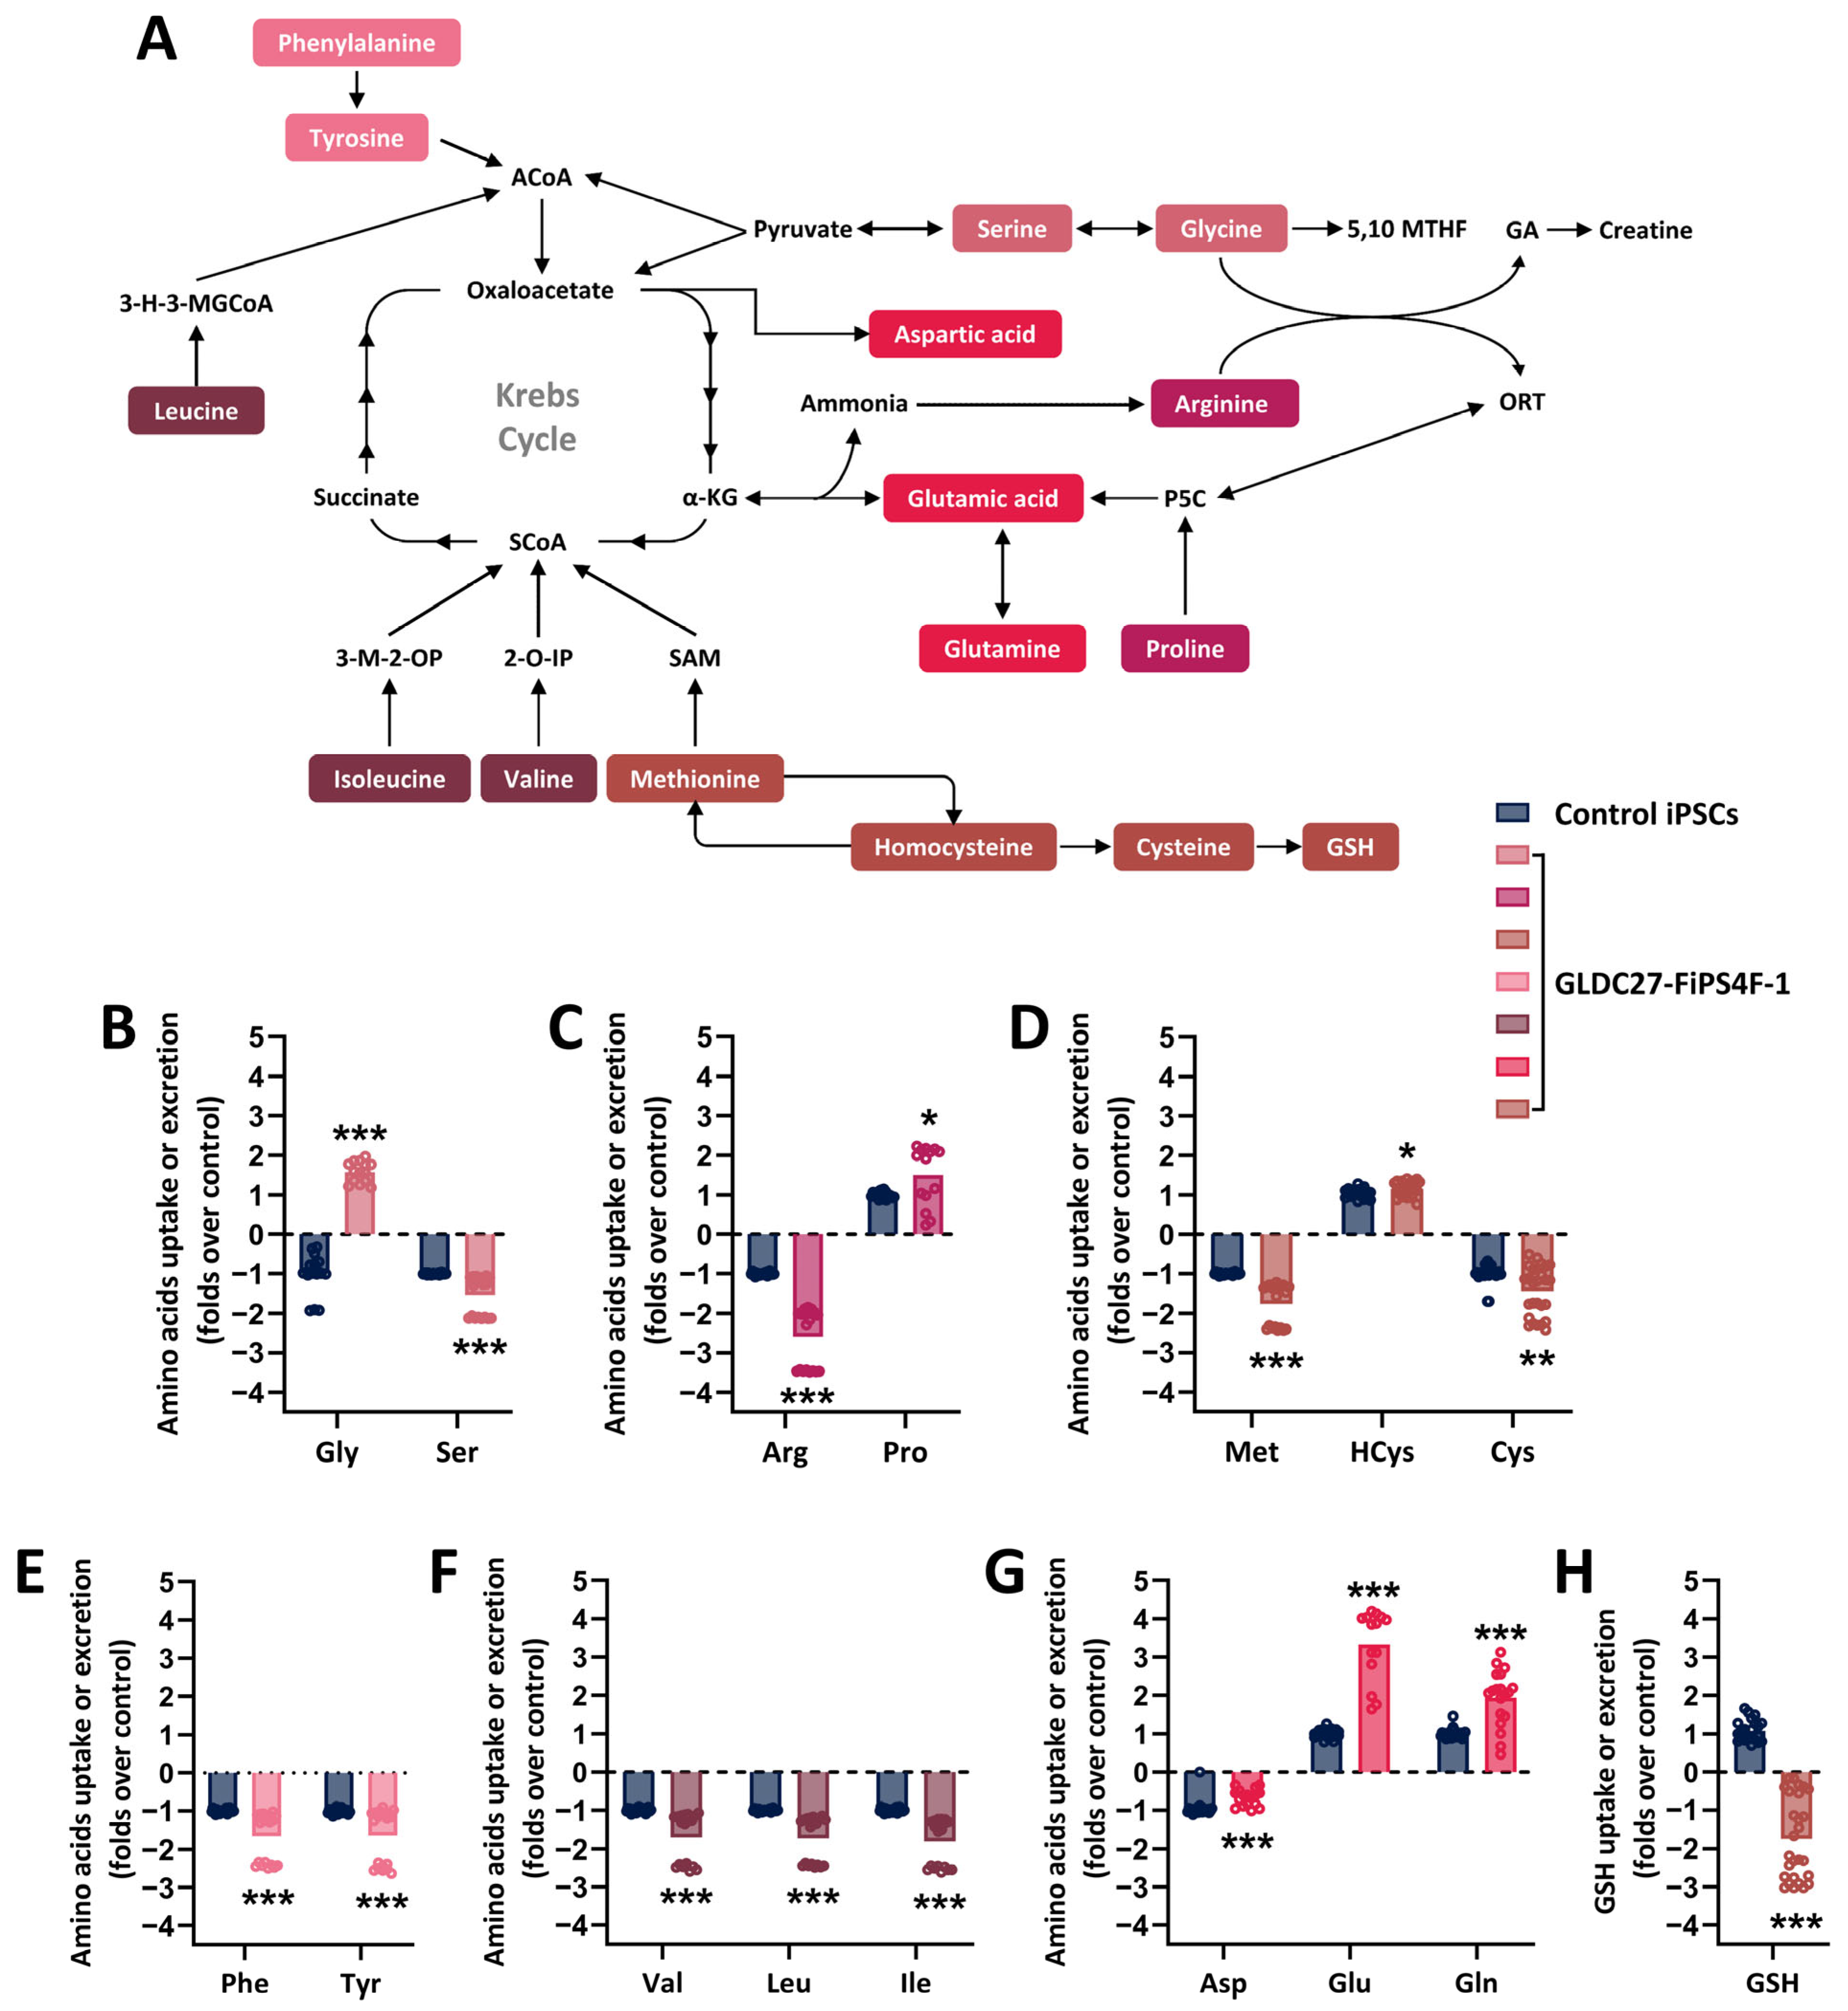
2.2. Coordinated Response of Serine–Glycine–One-Carbon Metabolism to GLDC Deficiency in iPSCs
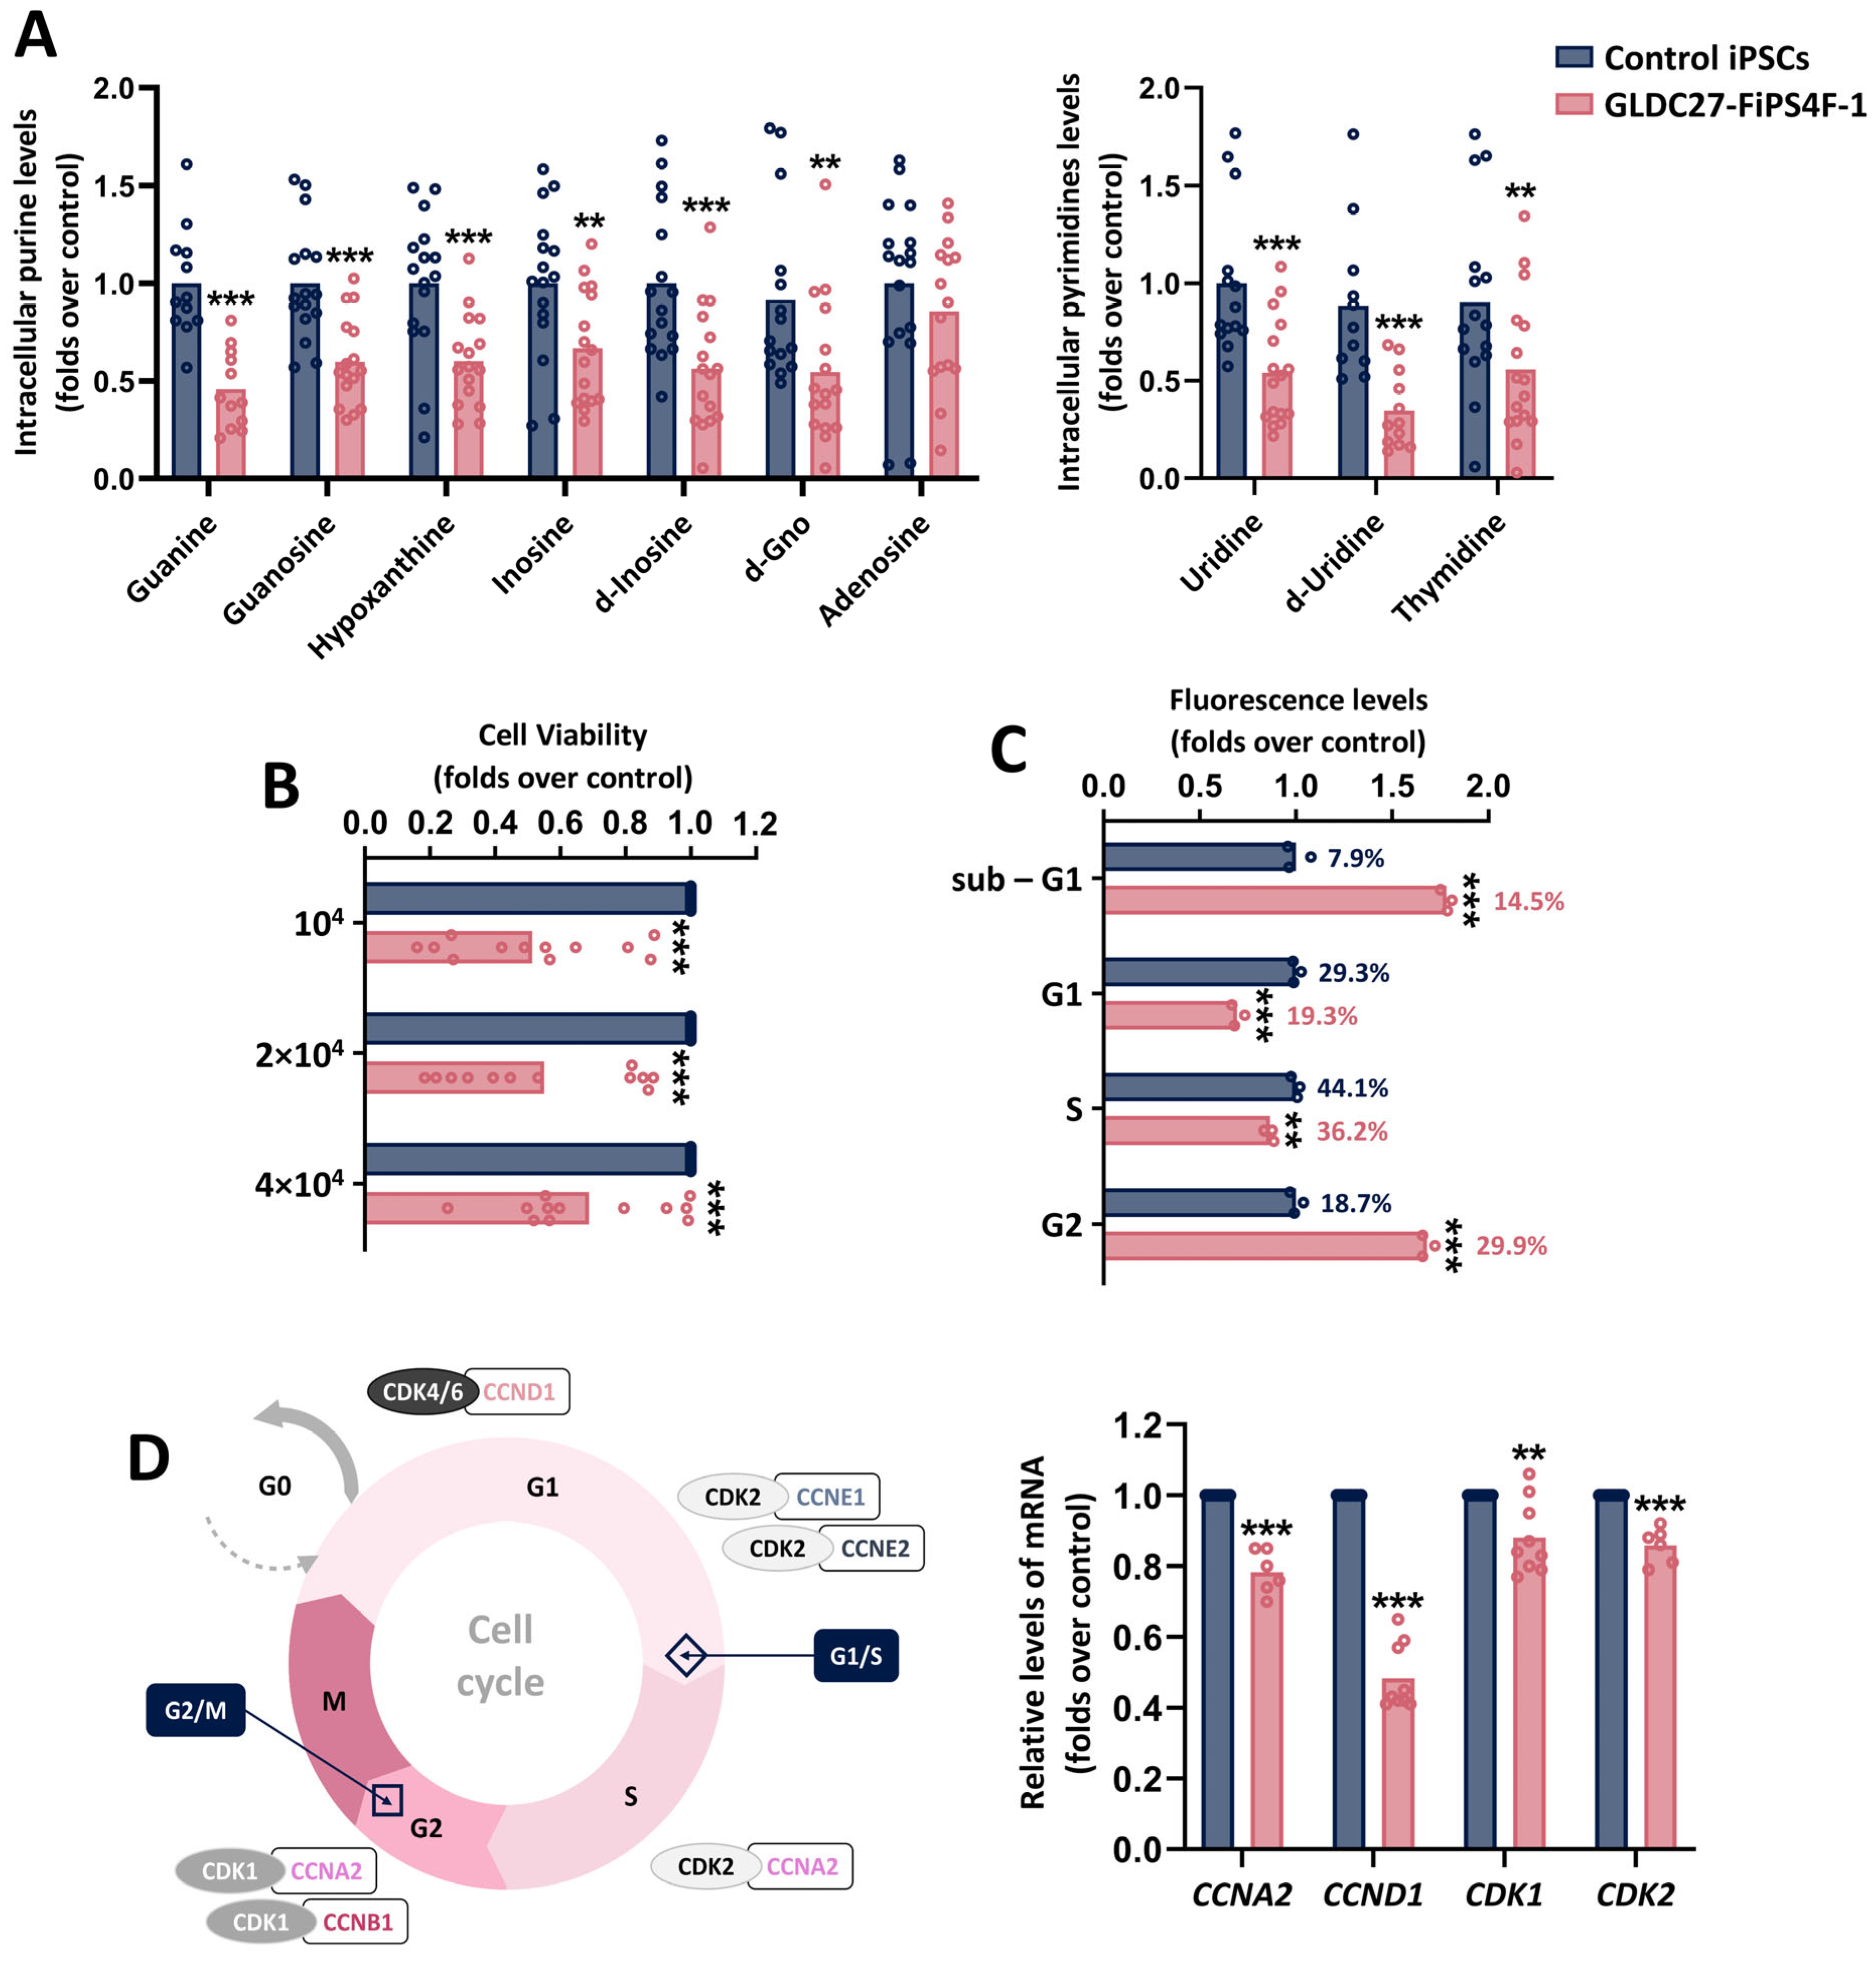
2.3. Metabolic Alterations in GLDC27-FiPS4F-1 Impact Cell Growth and Cell Cycle Progression
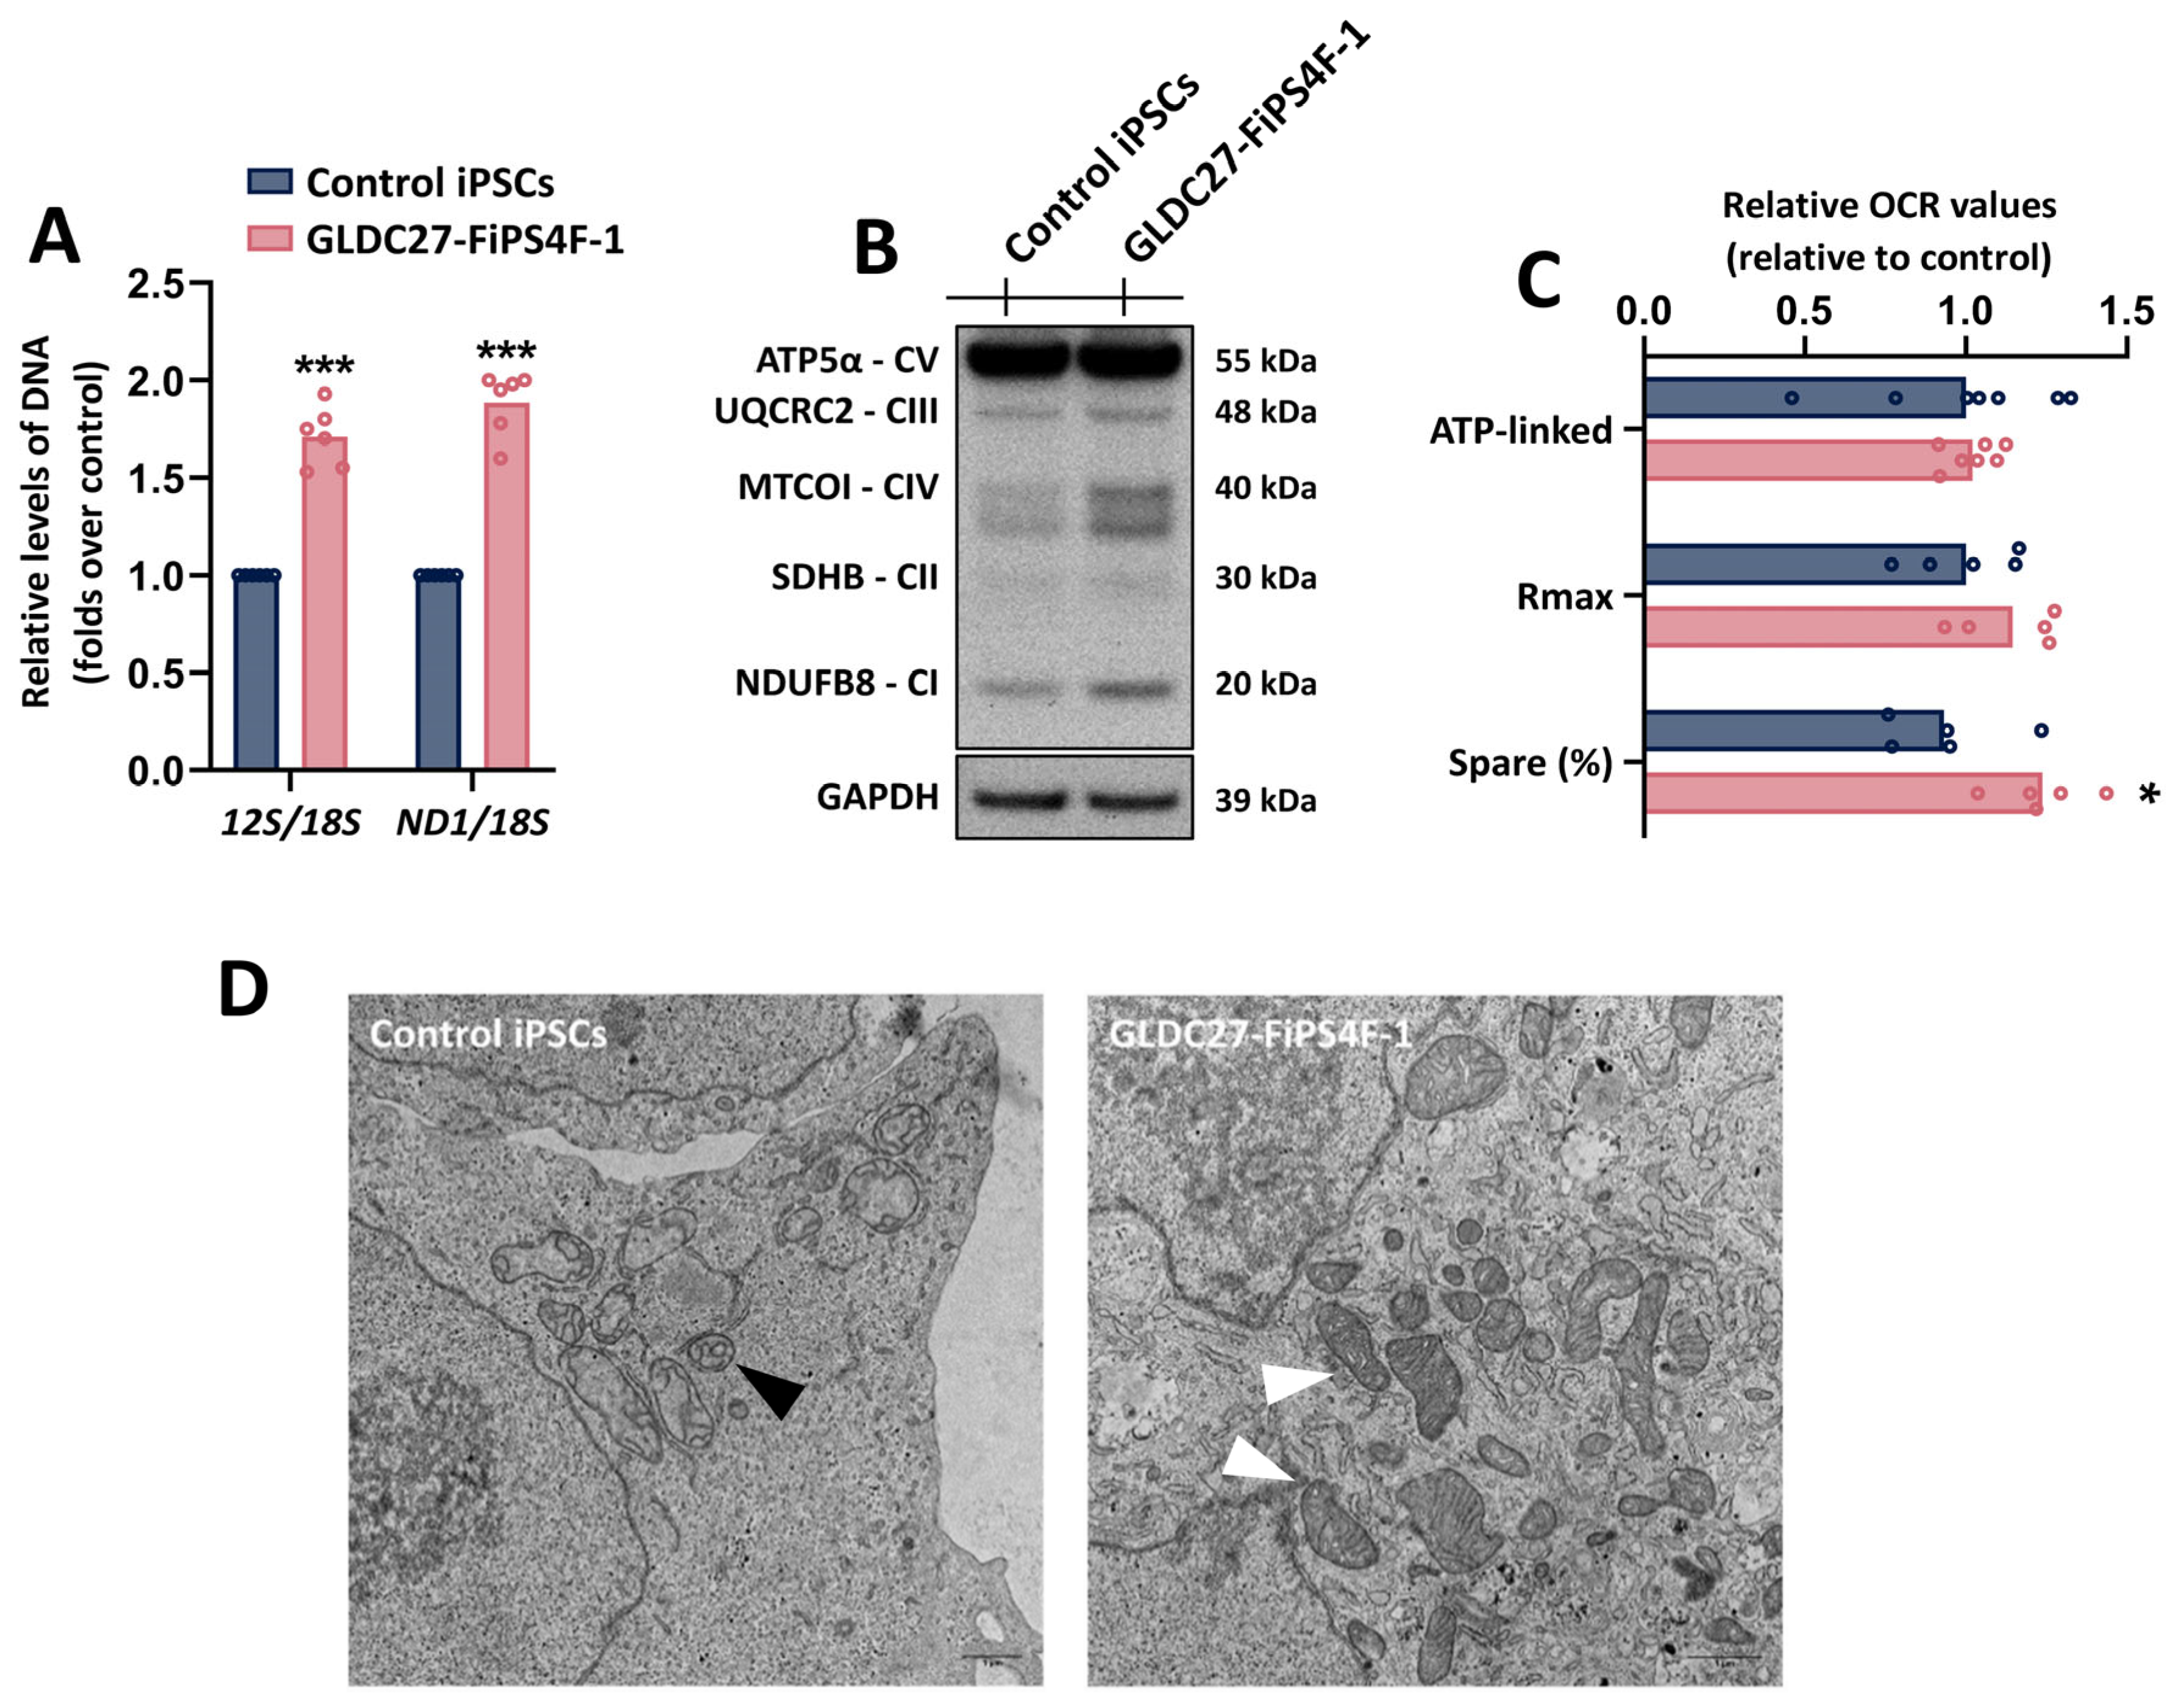
2.4. Mitochondria Function in GLDC27-FiPS4F-1
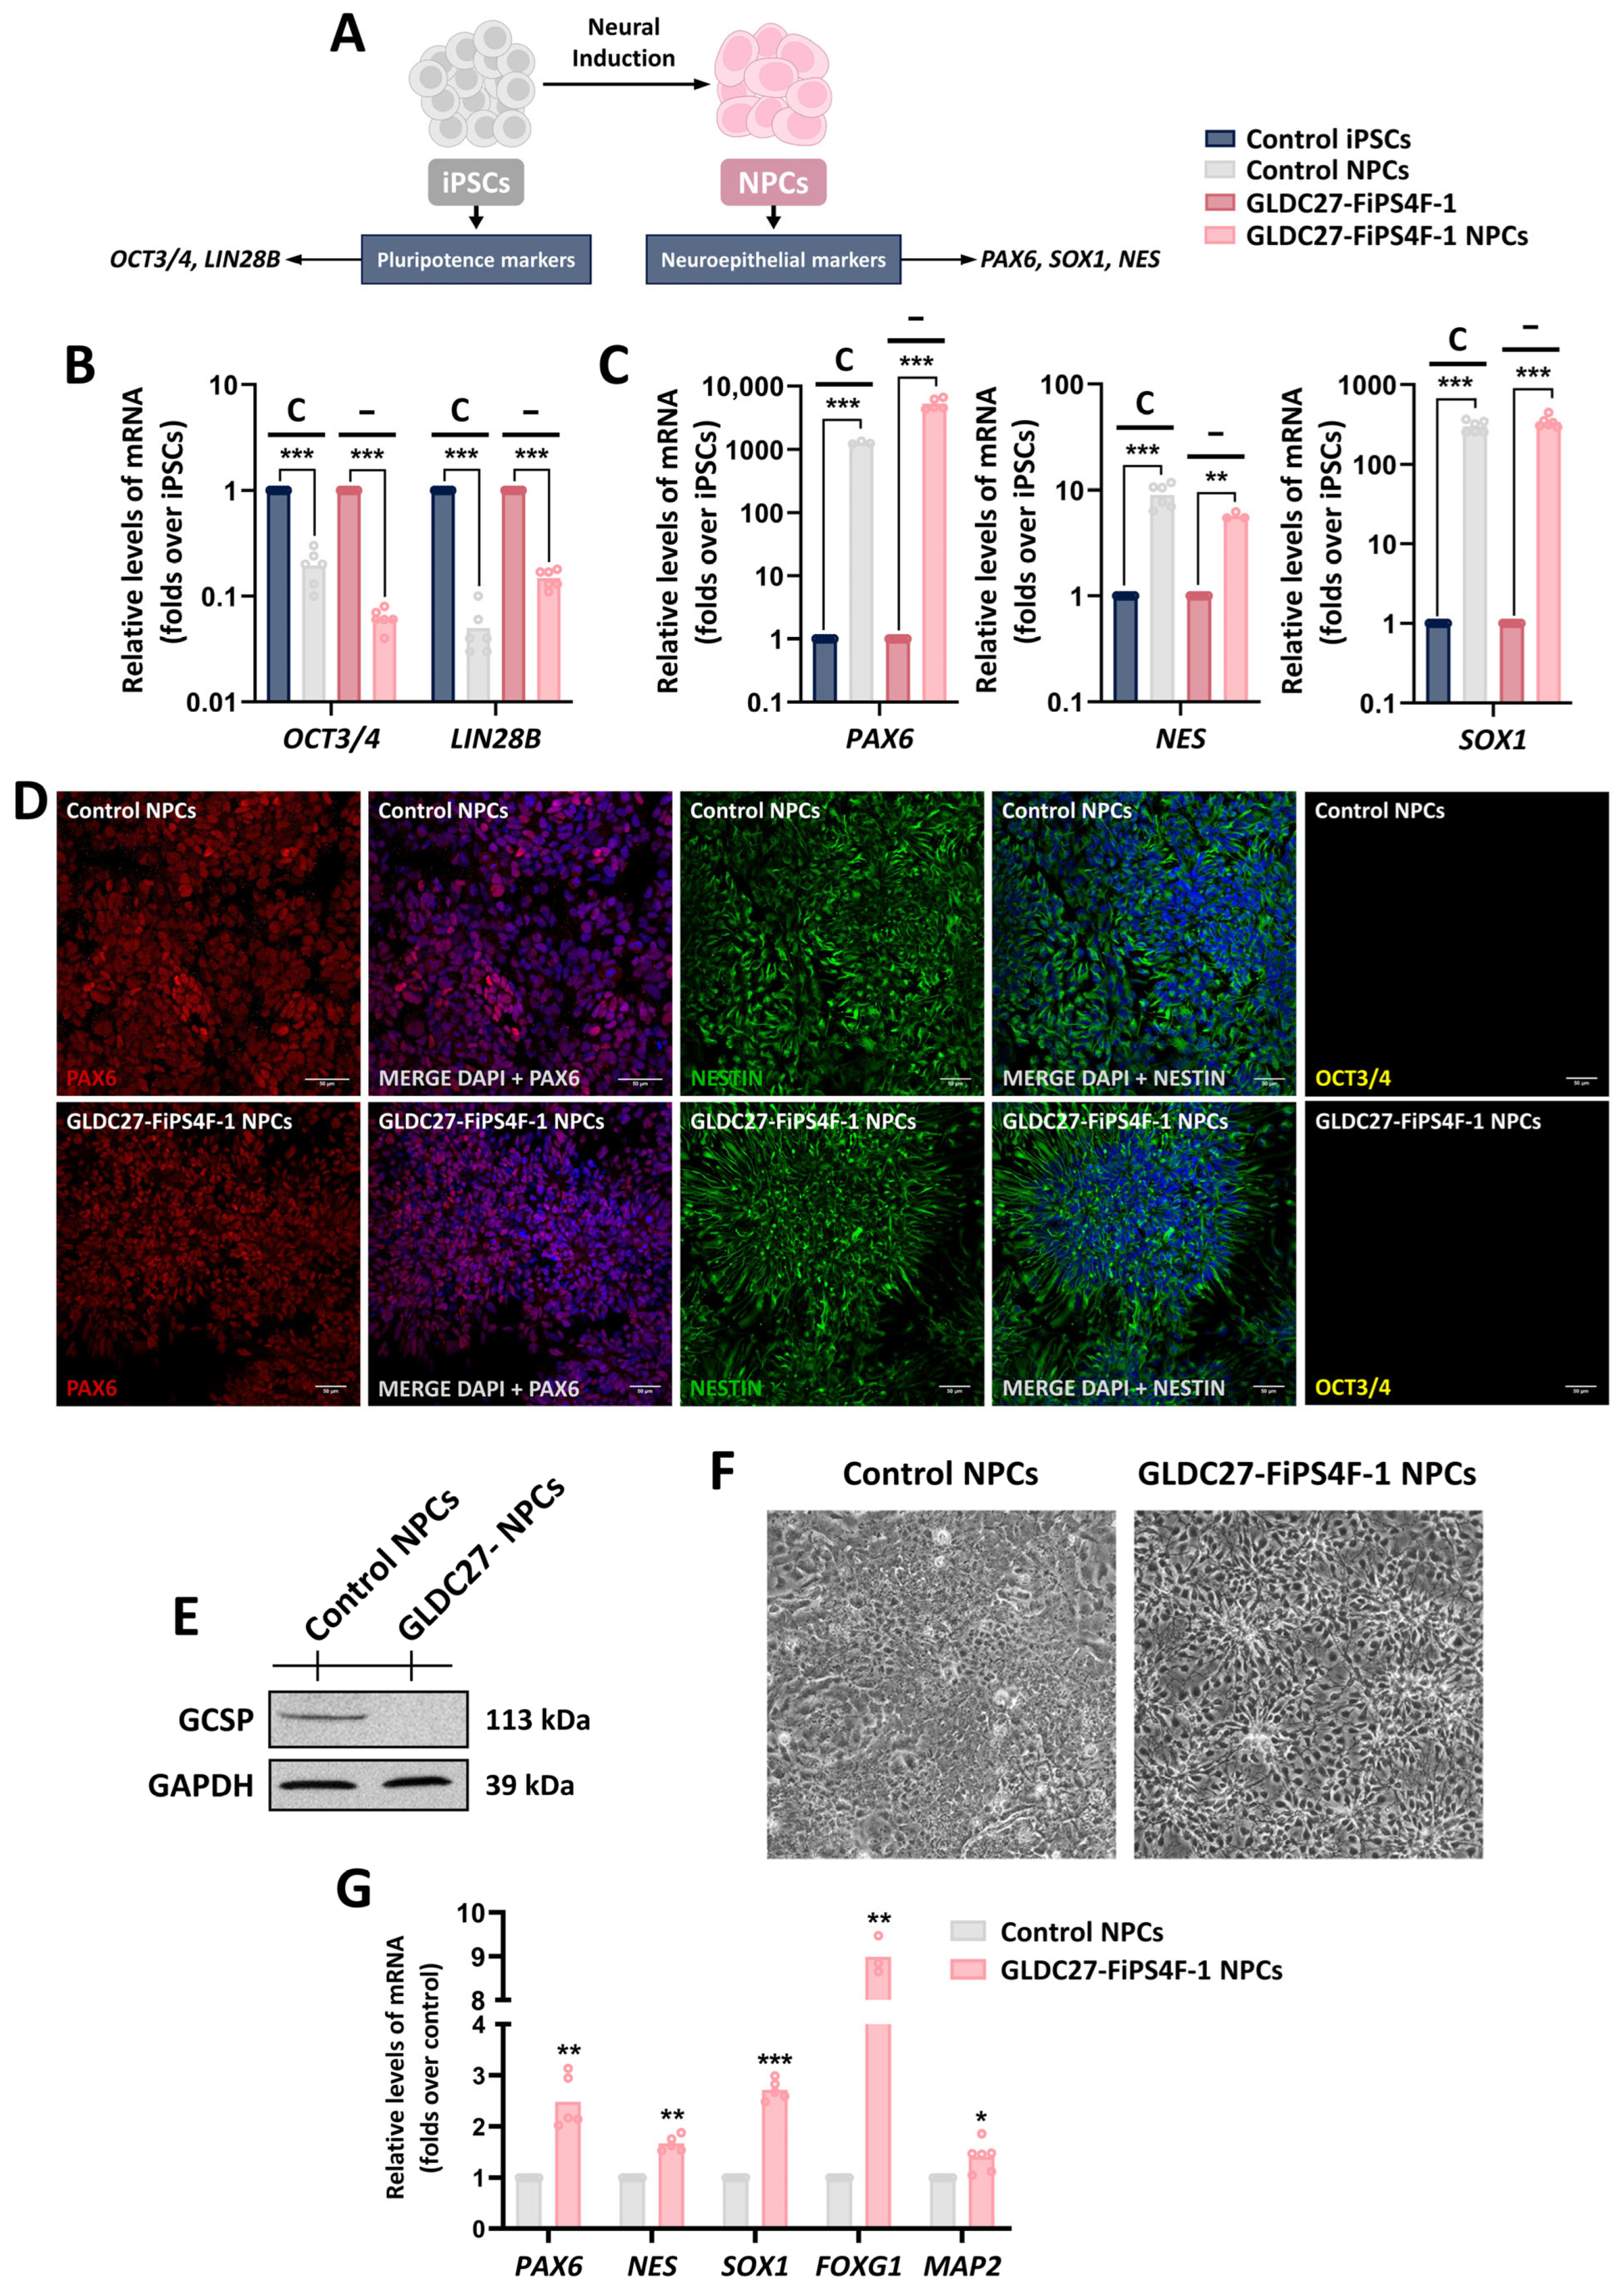
2.5. GLDC27-FiPS4F-1 and Control iPSCs Are Efficiently Differentiated to Neural Progenitor Cells
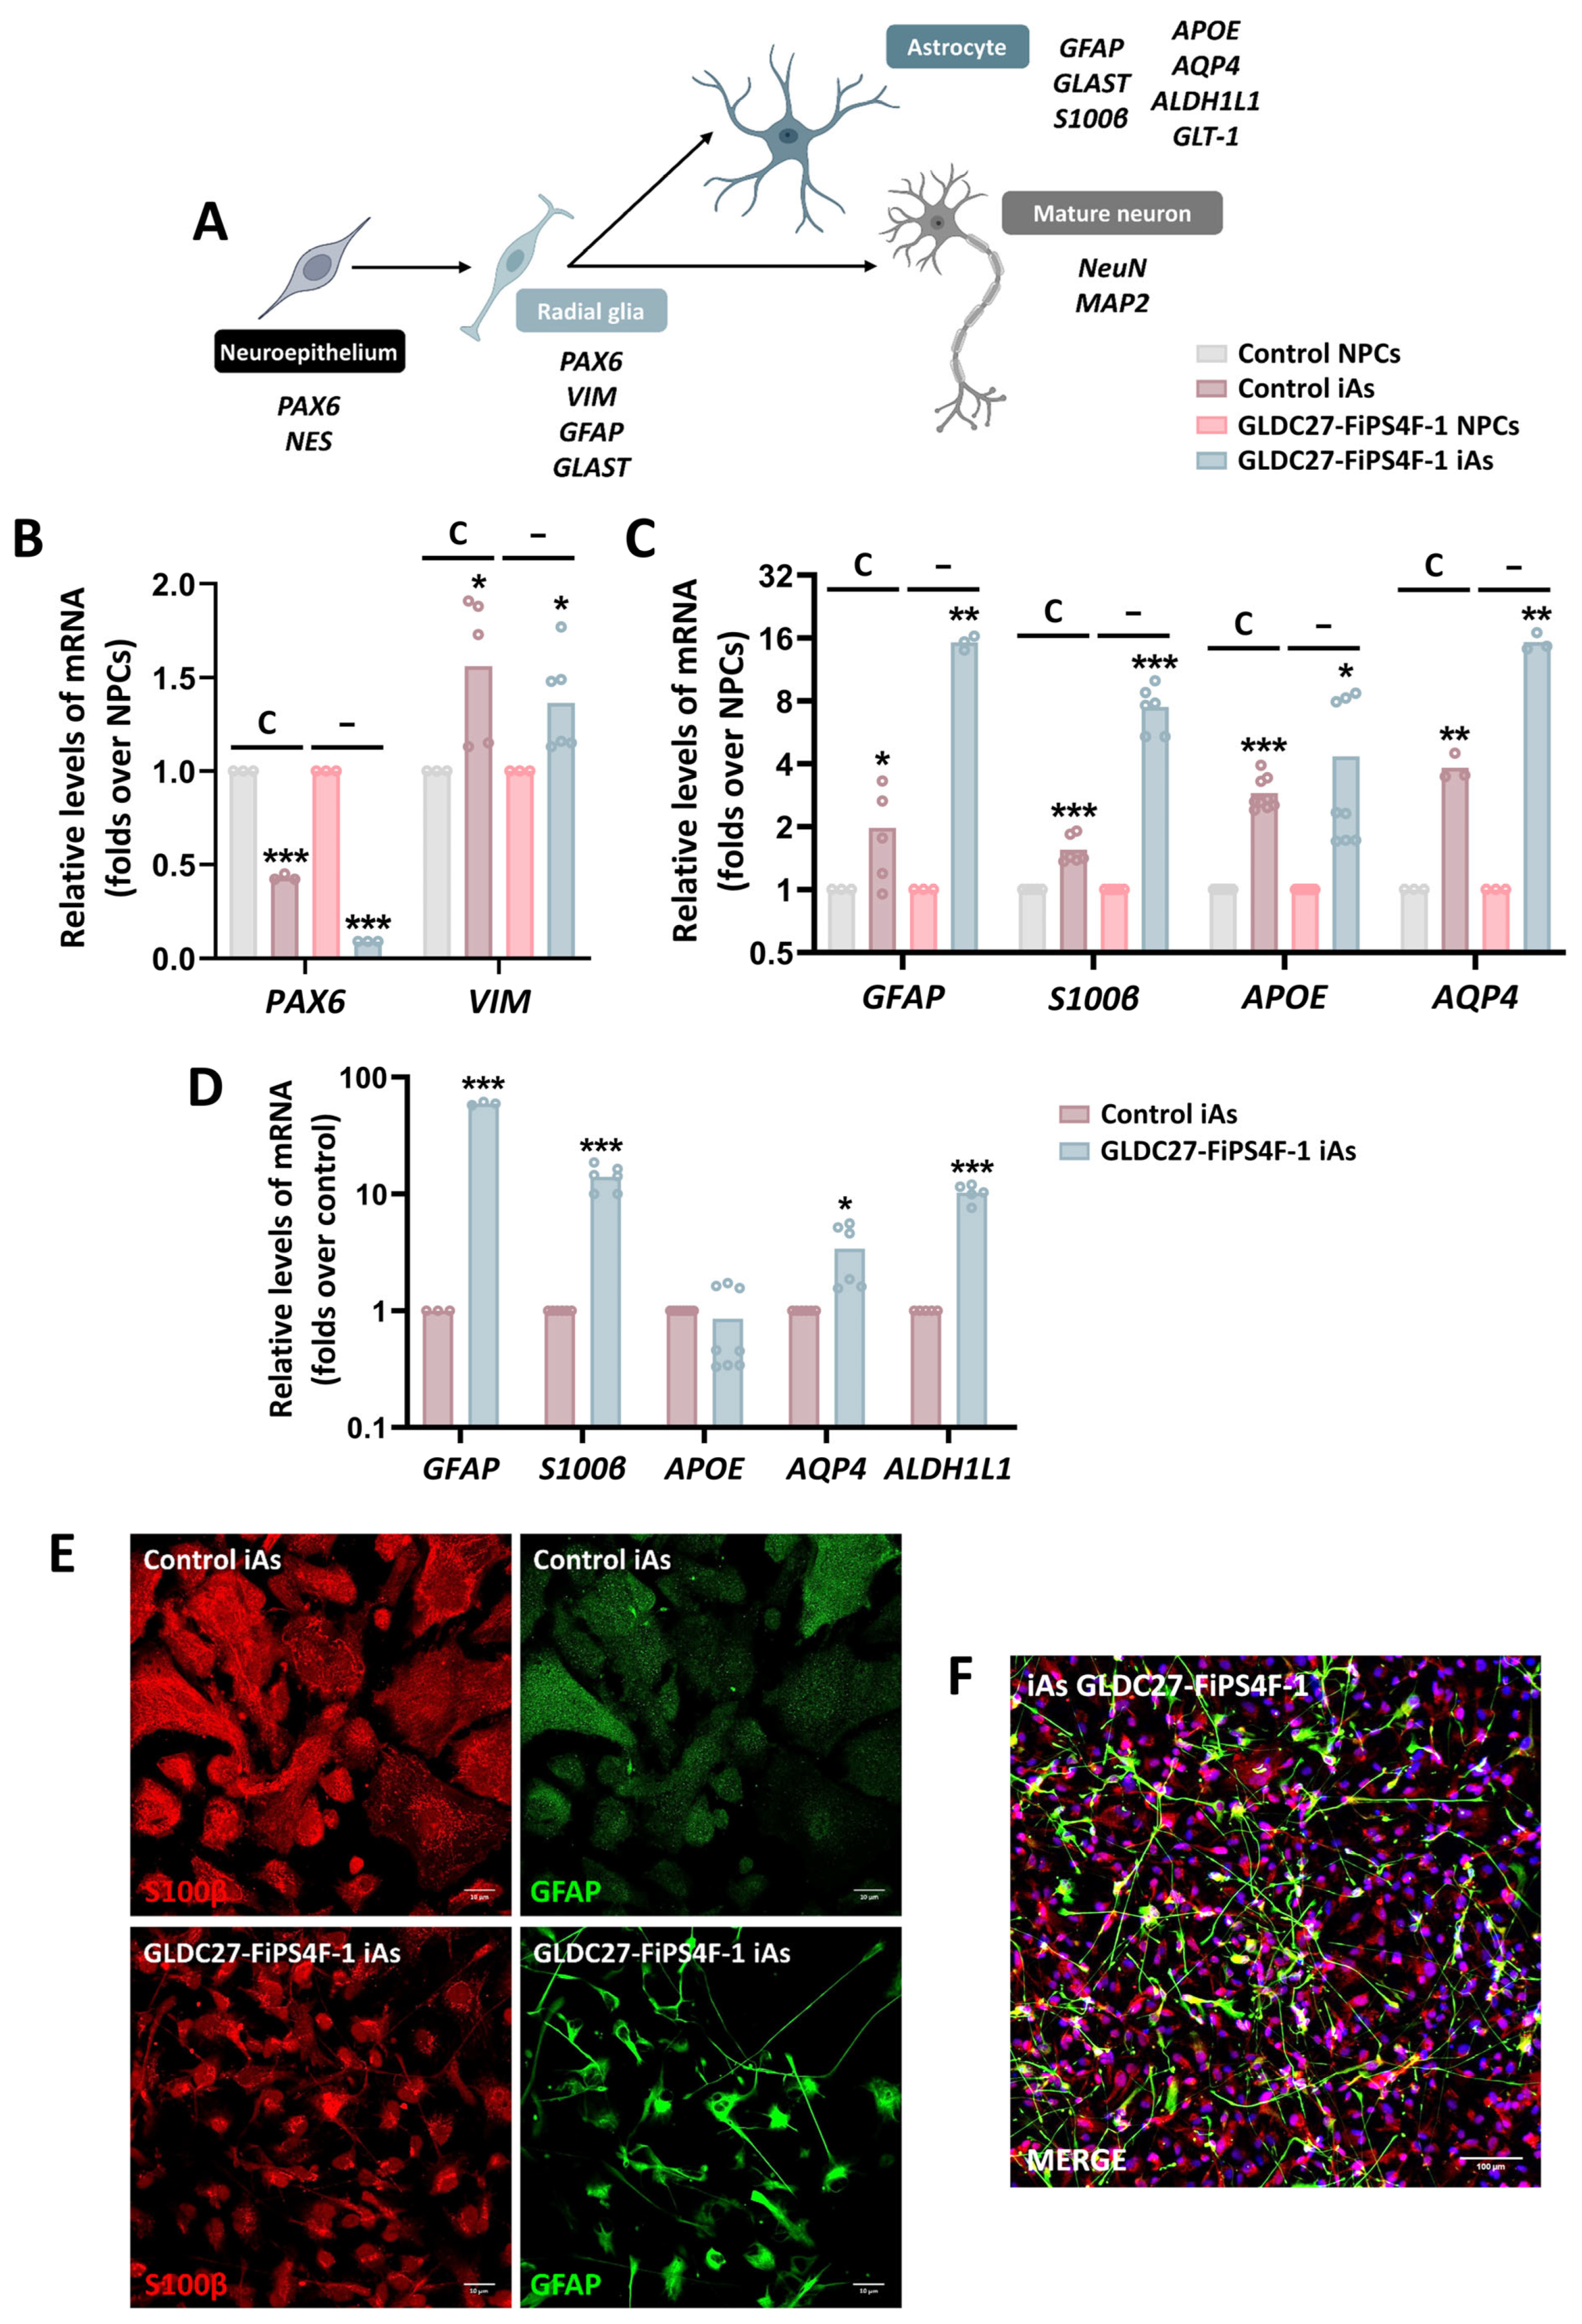
2.6. Astrocyte Induction from Neural Progenitors Shows Different Phenotypes
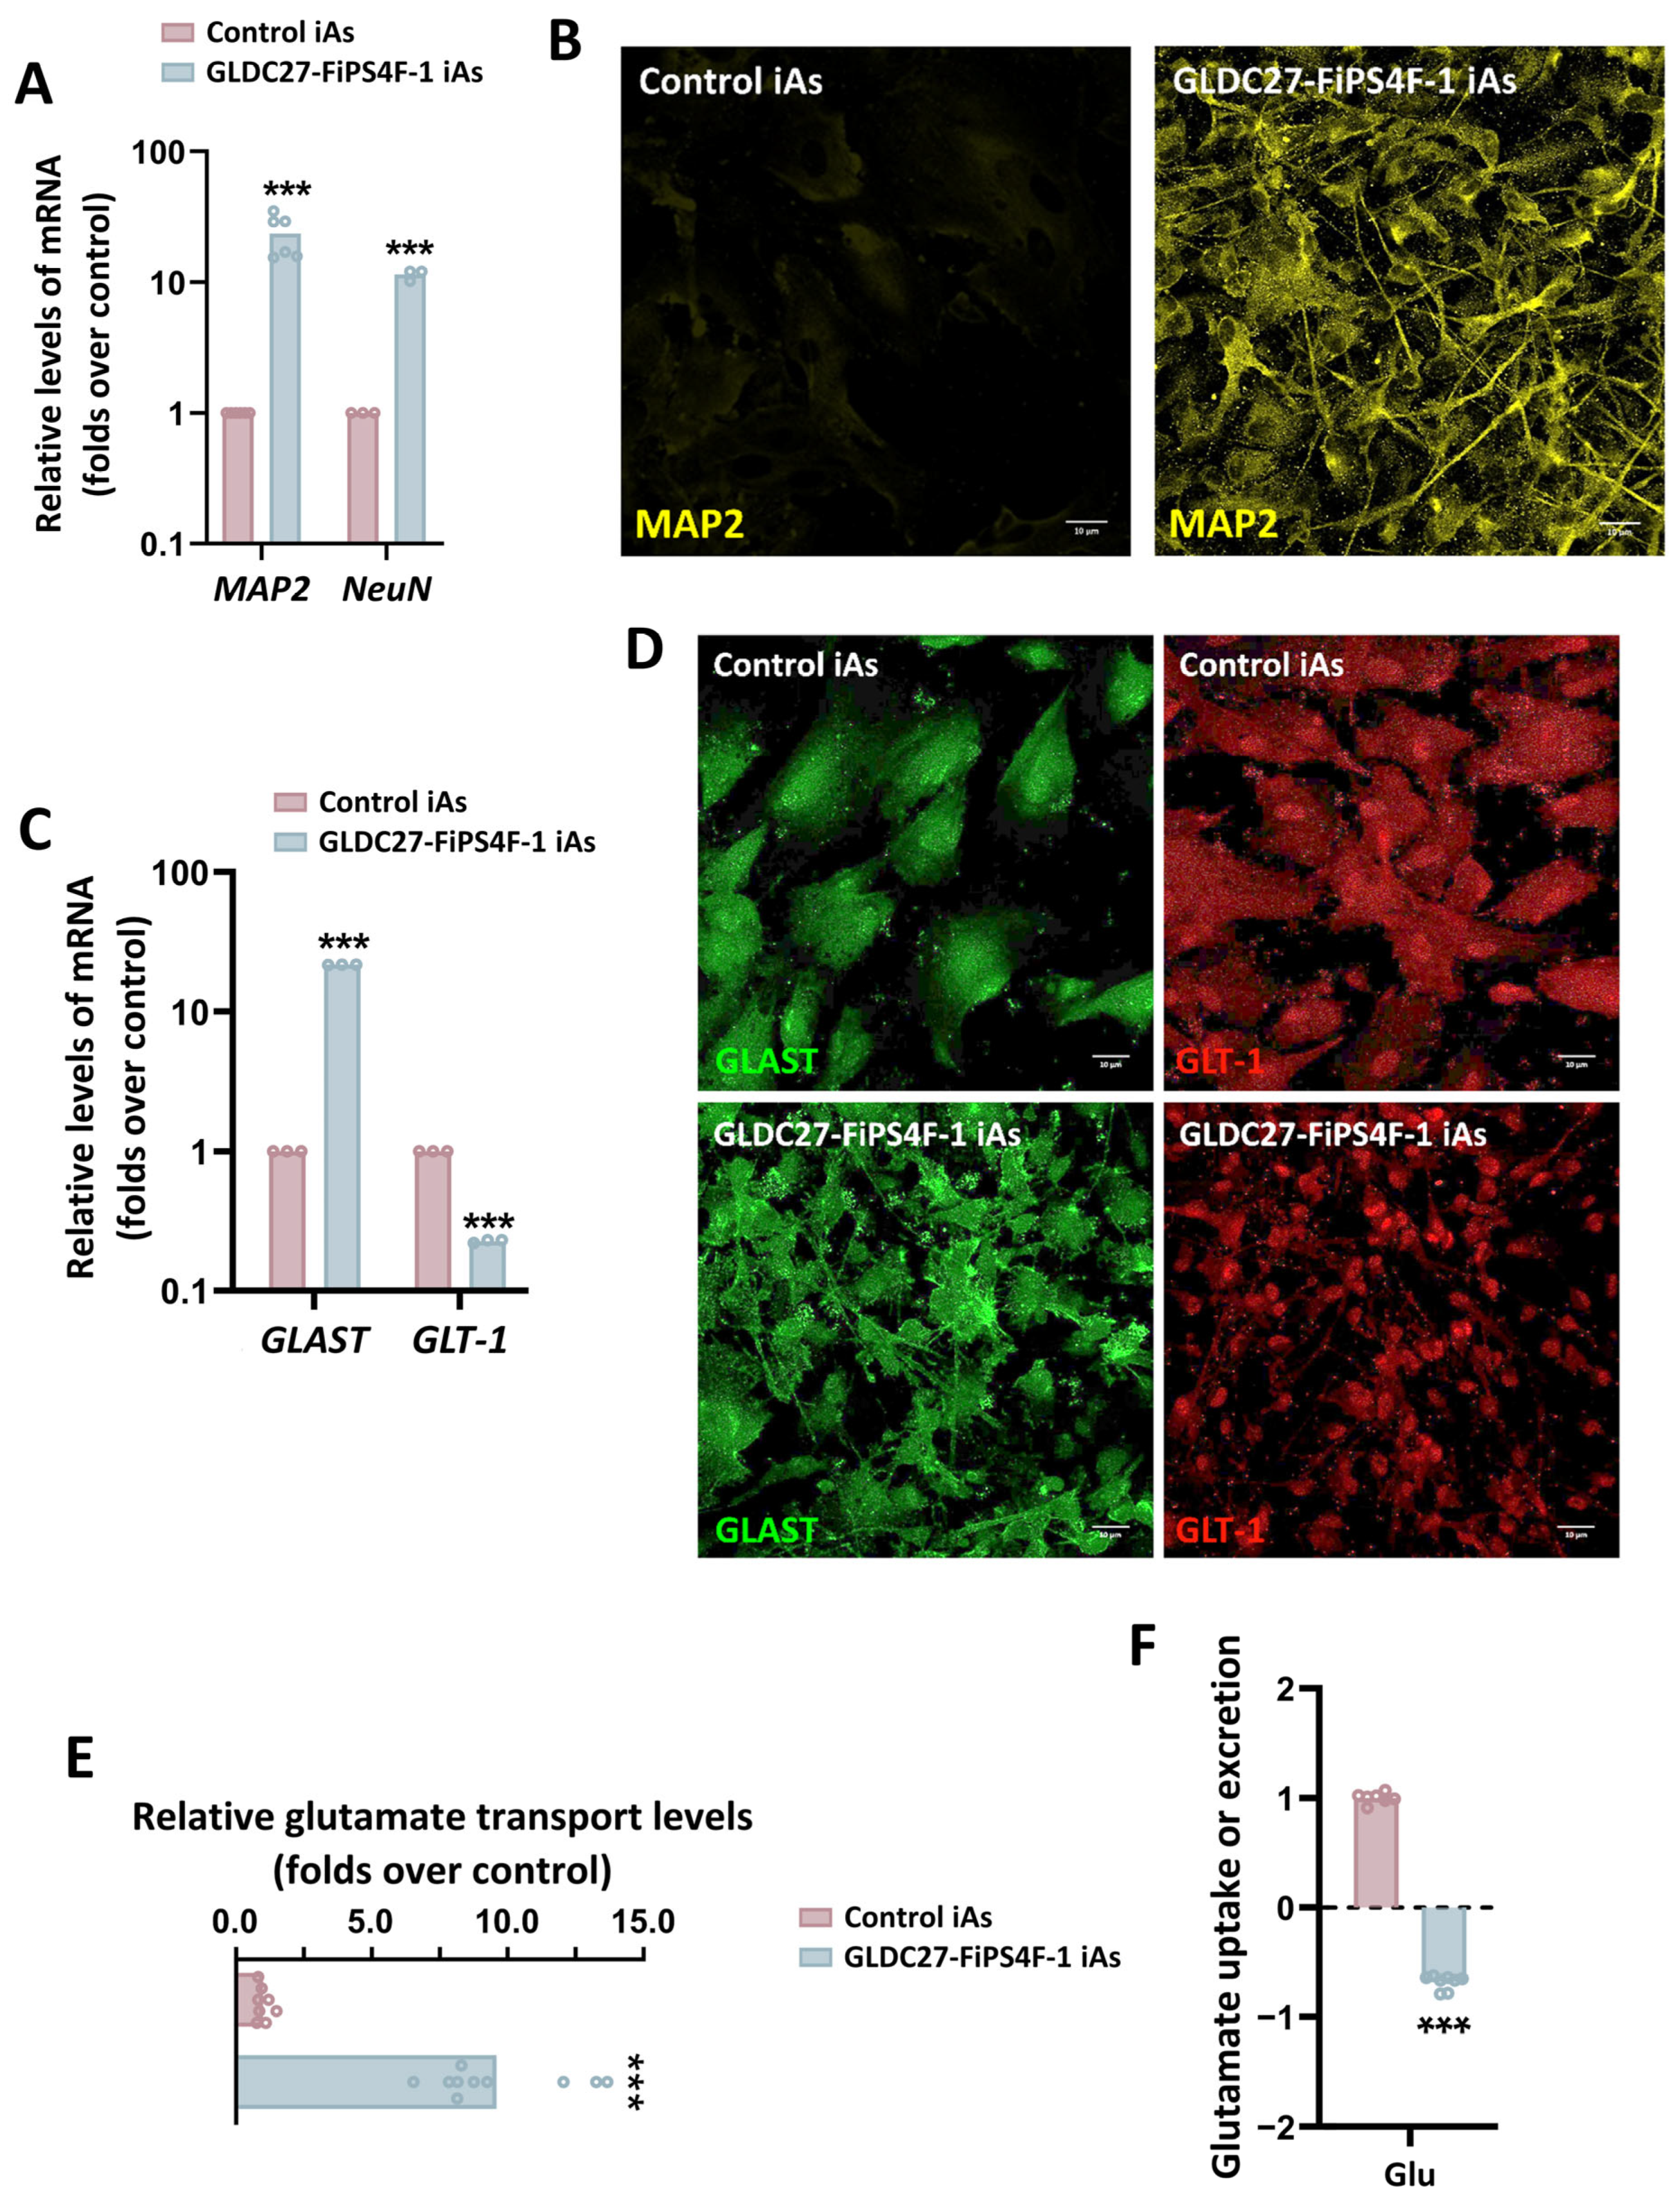
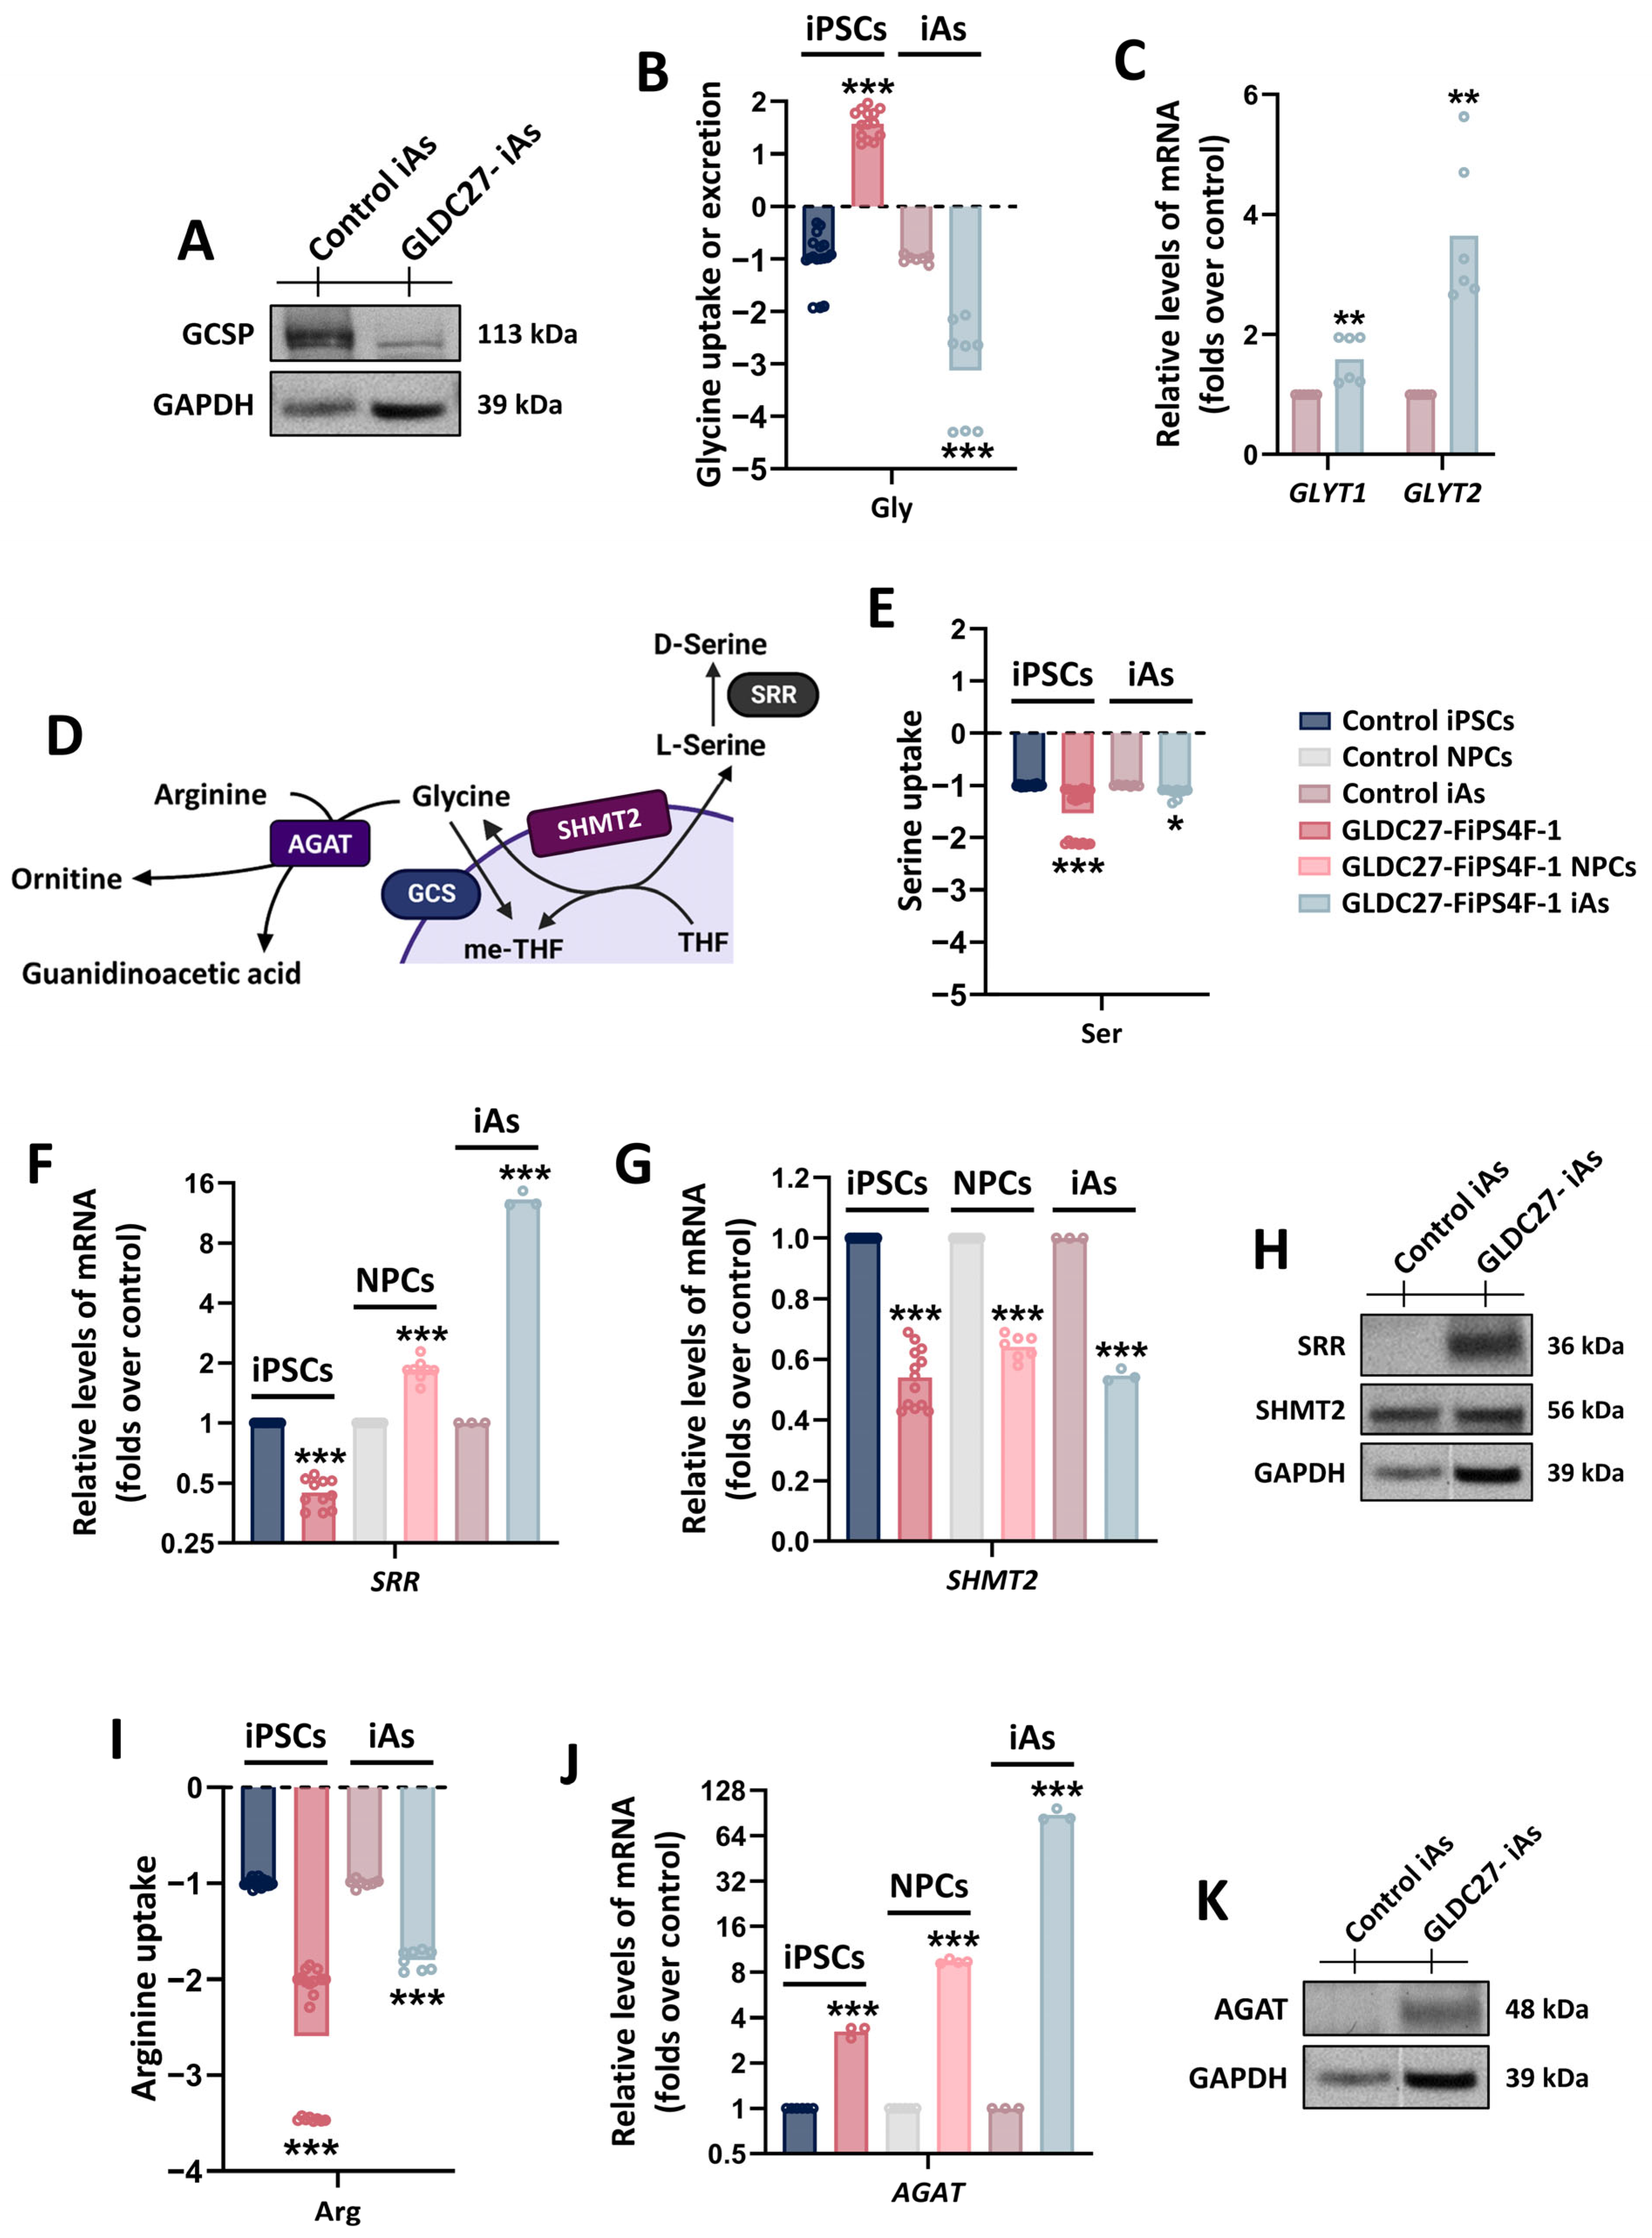
2.7. Maintenance of Glycine Homeostasis in GLDC27-FiPS4F-1 iAs
3. Discussion
4. Materials and Methods
4.1. Cell Culture Conditions
4.2. iPSC Characteristics
4.3. Genetic Background of the iPSCs Lines
4.4. Sample Collection and Metabolite Analysis
4.5. Oxygen Consumption Rate (OCR) Evaluation
4.6. Cell Viability and Cycle Progression
4.7. RT-qPCR
4.8. Mitochondrial DNA Content
4.9. Enzymatic Activity
4.10. Measurement of Protein Levels using SDS Western Blot
4.11. Protein Complex Analysis in Native Conditions
4.12. Immunofluorescence Staining
4.13. Differentiation to Neural Progenitor Cells (NPCs) and Induced Astrocytes (iAs)
4.14. Glutamate Uptake
4.15. Statistical Analysis
5. Conclusions
Supplementary Materials
Author Contributions
Funding
Institutional Review Board Statement
Informed Consent Statement
Data Availability Statement
Acknowledgments
Conflicts of Interest
References
- Liang, K.X.; Kristiansen, C.K.; Mostafavi, S.; Vatne, G.H.; Zantingh, G.A.; Kianian, A.; Tzoulis, C.; Høyland, L.E.; Ziegler, M.; Perez, R.M.; et al. Disease-specific Phenotypes in IPSC-derived Neural Stem Cells with POLG Mutations. EMBO Mol. Med. 2020, 12, e12146. [Google Scholar] [CrossRef] [PubMed]
- Ghirotto, B.; Oliveira, D.F.; Cipelli, M.; Basso, P.J.; de Lima, J.; Breda, C.N.S.; Ribeiro, H.C.; Silva, C.C.C.; Sertié, A.L.; Oliveira, A.E.R.; et al. MS-Driven Metabolic Alterations Are Recapitulated in IPSC-Derived Astrocytes. Ann. Neurol. 2022, 91, 652–669. [Google Scholar] [CrossRef] [PubMed]
- Van Hove, J.L.K.; Coughlin, C., II; Swanson, M.; Hennermann, J.B. Nonketotic Hyperglycinemia. 2002 Nov 14 [updated 2019 May 23]. In GeneReviews® [Internet]; Adam, M.P., Feldman, J., Mirzaa, G.M., Pagon, R.A., Wallace, S.E., Bean, L.J.H., Gripp, K.W., Amemiya, A., Eds.; University of Washington: Seattle, WA, USA, 2019. [Google Scholar]
- Tort, F.; Ferrer-Cortes, X.; Thio, M.; Navarro-Sastre, A.; Matalonga, L.; Quintana, E.; Bujan, N.; Arias, A.; Garcia-Villoria, J.; Acquaviva, C.; et al. Mutations in the Lipoyltransferase LIPT1 Gene Cause a Fatal Disease Associated with a Specific Lipoylation Defect of the 2-Ketoacid Dehydrogenase Complexes. Hum. Mol. Genet. 2013, 23, 1907–1915. [Google Scholar] [CrossRef] [PubMed]
- Baker, P.R.; Friederich, M.W.; Swanson, M.A.; Shaikh, T.; Bhattacharya, K.; Scharer, G.H.; Aicher, J.; Creadon-Swindell, G.; Geiger, E.; MacLean, K.N.; et al. Variant Non Ketotic Hyperglycinemia Is Caused by Mutations in LIAS, BOLA3 and the Novel Gene GLRX5. Brain 2014, 137, 366–379. [Google Scholar] [CrossRef]
- Farris, J.; Calhoun, B.; Alam, M.S.; Lee, S.; Haldar, K. Large Scale Analyses of Genotype-Phenotype Relationships of Glycine Decarboxylase Mutations and Neurological Disease Severity. PLoS Comput. Biol. 2020, 16, e1007871. [Google Scholar] [CrossRef]
- Kuseyri Hübschmann, O.; Juliá-Palacios, N.A.; Olivella, M.; Guder, P.; Zafeiriou, D.I.; Horvath, G.; Kulhánek, J.; Pearson, T.S.; Kuster, A.; Cortès-Saladelafont, E.; et al. Integrative Approach to Predict Severity in Nonketotic Hyperglycinemia. Ann. Neurol. 2022, 92, 292–303. [Google Scholar] [CrossRef] [PubMed]
- Johnson, J.W.; Ascher, P. Glycine Potentiates the NMDA Response in Cultured Mouse Brain Neurons. Nature 1987, 325, 529–531. [Google Scholar] [CrossRef]
- Swanson, M.A.; Coughlin, C.R.; Scharer, G.H.; Szerlong, H.J.; Bjoraker, K.J.; Spector, E.B.; Creadon-Swindell, G.; Mahieu, V.; Matthijs, G.; Hennermann, J.B.; et al. Biochemical and Molecular Predictors for Prognosis in Nonketotic Hyperglycinemia. Ann. Neurol. 2015, 78, 606–618. [Google Scholar] [CrossRef]
- Liu, R.; Zeng, L.-W.; Gong, R.; Yuan, F.; Shu, H.-B.; Li, S. MTORC1 Activity Regulates Post-Translational Modifications of Glycine Decarboxylase to Modulate Glycine Metabolism and Tumorigenesis. Nat. Commun. 2021, 12, 4227. [Google Scholar] [CrossRef]
- Tian, S.; Feng, J.; Cao, Y.; Shen, S.; Cai, Y.; Yang, D.; Yan, R.; Wang, L.; Zhang, H.; Zhong, X.; et al. Glycine Cleavage System Determines the Fate of Pluripotent Stem Cells via the Regulation of Senescence and Epigenetic Modifications. Life Sci. Alliance 2019, 2, e201900413. [Google Scholar] [CrossRef]
- Sato, K. Why Does Hyperglycinemia Exhibit so Grave Brain Anomalies and so Severe Neurological Symptoms? J. Theor. Biol. 2018, 455, 97–100. [Google Scholar] [CrossRef]
- Santos, C.; Pai, Y.J.; Mahmood, M.R.; Leung, K.-Y.; Savery, D.; Waddington, S.N.; Copp, A.J.; Greene, N.D.E. Impaired Folate 1-Carbon Metabolism Causes Formate-Preventable Hydrocephalus in Glycine Decarboxylase–Deficient Mice. J. Clin. Investig. 2020, 130, 1446–1452. [Google Scholar] [CrossRef]
- Pai, Y.J.; Leung, K.-Y.; Savery, D.; Hutchin, T.; Prunty, H.; Heales, S.; Brosnan, M.E.; Brosnan, J.T.; Copp, A.J.; Greene, N.D.E. Glycine Decarboxylase Deficiency Causes Neural Tube Defects and Features of Non-Ketotic Hyperglycinemia in Mice. Nat. Commun. 2015, 4, 6388. [Google Scholar] [CrossRef]
- Arribas-Carreira, L.; Bravo-Alonso, I.; Lopez-Marquez, A.; Alonso-Barroso, E.; Briso-Montiano, A.; Arroyo, I.; Ugarte, M.; Perez, B.; Perez-Cerda, C.; Rodriguez-Pombo, P.; et al. Generation and Characterization of a Human IPSC Line (UAMi005-A) from a Patient with Nonketotic Hyperglycinemia Due to Mutations in the GLDC Gene. Stem Cell Res. 2019, 39, 101503. [Google Scholar] [CrossRef]
- Bravo-Alonso, I.; Navarrete, R.; Arribas-Carreira, L.; Perona, A.; Abia, D.; Couce, M.L.; Garcia-Cazorla, A.; Morais, A.; Domingo, R.; Ramos, M.A.; et al. Nonketotic Hyperglycinemia: Functional Assessment of Missense Variants in GLDC to Understand Phenotypes of the Disease. Hum. Mutat. 2017, 38, 678–691. [Google Scholar] [CrossRef]
- Takahashi, K.; Tanabe, K.; Ohnuki, M.; Narita, M.; Ichisaka, T.; Tomoda, K.; Yamanaka, S. Induction of Pluripotent Stem Cells from Adult Human Fibroblasts by Defined Factors. Cell 2007, 131, 861–872. [Google Scholar] [CrossRef]
- Swanson, M.A.; Miller, K.; Young, S.P.; Tong, S.; Ghaloul-Gonzalez, L.; Neira-Fresneda, J.; Schlichting, L.; Peck, C.; Gabel, L.; Friederich, M.W.; et al. Cerebrospinal Fluid Amino Acids Glycine, Serine, and Threonine in Nonketotic Hyperglycinemia. J. Inherit. Metab. Dis. 2022, 45, 734–747. [Google Scholar] [CrossRef]
- Reid, M.A.; Allen, A.E.; Liu, S.; Liberti, M.V.; Liu, P.; Liu, X.; Dai, Z.; Gao, X.; Wang, Q.; Liu, Y.; et al. Serine Synthesis through PHGDH Coordinates Nucleotide Levels by Maintaining Central Carbon Metabolism. Nat. Commun. 2018, 9, 5442. [Google Scholar] [CrossRef] [PubMed]
- Ducker, G.S.; Chen, L.; Morscher, R.J.; Ghergurovich, J.M.; Esposito, M.; Teng, X.; Kang, Y.; Rabinowitz, J.D. Reversal of Cytosolic One-Carbon Flux Compensates for Loss of the Mitochondrial Folate Pathway. Cell Metab. 2016, 23, 1140–1153. [Google Scholar] [CrossRef] [PubMed]
- Mukha, D.; Fokra, M.; Feldman, A.; Sarvin, B.; Sarvin, N.; Nevo-Dinur, K.; Besser, E.; Hallo, E.; Aizenshtein, E.; Schug, Z.T.; et al. Glycine Decarboxylase Maintains Mitochondrial Protein Lipoylation to Support Tumor Growth. Cell Metab. 2022, 34, 775–782. [Google Scholar] [CrossRef] [PubMed]
- Jog, R.; Chen, G.; Wang, J.; Leff, T. Hormonal Regulation of Glycine Decarboxylase and Its Relationship to Oxidative Stress. Physiol. Rep. 2021, 9, e14991. [Google Scholar] [CrossRef] [PubMed]
- Sato, K. Why Is Glycine Cleavage System Segmentally Expressed in Radial Glia? J. Theor. Biol. 2019, 470, 17–19. [Google Scholar] [CrossRef] [PubMed]
- Chambers, S.M.; Fasano, C.A.; Papapetrou, E.P.; Tomishima, M.; Sadelain, M.; Studer, L. Highly Efficient Neural Conversion of Human ES and IPS Cells by Dual Inhibition of SMAD Signaling. Nat. Biotechnol. 2009, 27, 275–280. [Google Scholar] [CrossRef] [PubMed]
- Kang, P.J.; Zheng, J.; Lee, G.; Son, D.; Kim, I.Y.; Song, G.; Park, G.; You, S. Glycine Decarboxylase Regulates the Maintenance and Induction of Pluripotency via Metabolic Control. Metab. Eng. 2019, 53, 35–47. [Google Scholar] [CrossRef] [PubMed]
- Escartin, C.; Galea, E.; Lakatos, A.; O’Callaghan, J.P.; Petzold, G.C.; Serrano-Pozo, A.; Steinhäuser, C.; Volterra, A.; Carmignoto, G.; Agarwal, A.; et al. Reactive Astrocyte Nomenclature, Definitions, and Future Directions. Nat. Neurosci. 2021, 24, 312–325. [Google Scholar] [CrossRef] [PubMed]
- Clavreul, S.; Dumas, L.; Loulier, K. Astrocyte Development in the Cerebral Cortex: Complexity of Their Origin, Genesis, and Maturation. Front. Neurosci. 2022, 16, 916055. [Google Scholar] [CrossRef] [PubMed]
- Gorina, Y.V.; Salmina, A.B.; Erofeev, A.I.; Gerasimov, E.I.; Bolshakova, A.V.; Balaban, P.M.; Bezprozvanny, I.B.; Vlasova, O.L. Astrocyte Activation Markers. Biochem. Mosc. 2022, 87, 851–870. [Google Scholar] [CrossRef] [PubMed]
- Roybon, L.; Lamas, N.J.; Garcia-Diaz, A.; Yang, E.J.; Sattler, R.; Jackson-Lewis, V.; Kim, Y.A.; Kachel, C.A.; Rothstein, J.D.; Przedborski, S.; et al. Human Stem Cell-Derived Spinal Cord Astrocytes with Defined Mature or Reactive Phenotypes. Cell Rep. 2013, 4, 1035–1048. [Google Scholar] [CrossRef]
- Engel, M.; Do-Ha, D.; Muñoz, S.S.; Ooi, L. Common Pitfalls of Stem Cell Differentiation: A Guide to Improving Protocols for Neurodegenerative Disease Models and Research. Cell Mol. Life Sci. 2016, 73, 3693–3709. [Google Scholar] [CrossRef]
- Doetsch, F.; Caillé, I.; Lim, D.A.; García-Verdugo, J.M.; Alvarez-Buylla, A. Subventricular Zone Astrocytes Are Neural Stem Cells in the Adult Mammalian Brain. Cell 1999, 97, 703–716. [Google Scholar] [CrossRef]
- Lattke, M.; Guillemot, F. Understanding Astrocyte Differentiation: Clinical Relevance, Technical Challenges, and New Opportunities in the Omics Era. WIREs Mech. Dis. 2022, 14, e1557. [Google Scholar] [CrossRef] [PubMed]
- Gomeza, J.; Hülsmann, S.; Ohno, K.; Eulenburg, V.; Szöke, K.; Richter, D.; Betz, H. Inactivation of the Glycine Transporter 1 Gene Discloses Vital Role of Glial Glycine Uptake in Glycinergic Inhibition. Neuron 2003, 40, 785–796. [Google Scholar] [CrossRef] [PubMed]
- Wolosker, H. Serine Racemase and the Serine Shuttle between Neurons and Astrocytes. Biochim. Biophys Acta 2011, 1814, 1558–1566. [Google Scholar] [CrossRef] [PubMed]
- Smith, K.E.; Borden, L.A.; Hartig, P.R.; Branchek, T.; Weinshank, R.L. Cloning and Expression of a Glycine Transporter Reveal Colocalization with NMDA Receptors. Neuron 1992, 8, 927–935. [Google Scholar] [CrossRef]
- Bonvento, G.; Bolaños, J.P. Astrocyte-Neuron Metabolic Cooperation Shapes Brain Activity. Cell Metab. 2021, 33, 1546–1564. [Google Scholar] [CrossRef]
- Leung, K.; De Castro, S.C.P.; Santos, C.; Savery, D.; Prunty, H.; Gold-Diaz, D.; Bennett, S.; Heales, S.; Copp, A.J.; Greene, N.D.E. Regulation of Glycine Metabolism by the Glycine Cleavage System and Conjugation Pathway in Mouse Models of NON-KETOTIC Hyperglycinemia. J. Inher. Metab. Disea. 2020, 43, 1186–1198. [Google Scholar] [CrossRef]
- Alonso-Barroso, E.; Brasil, S.; Briso-Montiano, A.; Navarrete, R.; Perez-Cerda, C.; Ugarte, M.; Perez, B.; Desviat, L.R.; Richard, E. Generation and Characterization of a Human IPSC Line from a Patient with Propionic Acidemia Due to Defects in the PCCA Gene. Stem Cell Res. 2017, 23, 173–177. [Google Scholar] [CrossRef]
- Castro, M.; Perez-Cerda, C.; Merinero, B.; Garcia, M.J.; Bernar, J.; Gil Nagel, A.; Torres, J.; Bermudez, M.; Garavito, P.; Marie, S.; et al. Screening for Adenylosuccinate Lyase Deficiency: Clinical, Biochemical and Molecular Findings in Four Patients. Neuropediatrics 2002, 33, 186–189. [Google Scholar] [CrossRef]
- Gilfix, B.M.; Blank, D.W.; Rosenblatt, D.S. Novel Reductant for Determination of Total Plasma Homocysteine. Clin. Chem. 1997, 43, 687–688. [Google Scholar] [CrossRef]
- Pfeiffer, C.M.; Huff, D.L.; Gunter, E.W. Rapid and Accurate HPLC Assay for Plasma Total Homocysteine and Cysteine in a Clinical Laboratory Setting. Clin. Chem. 1999, 45, 290–292. [Google Scholar] [CrossRef]
- Casado, M.; Bendahan, A.; Zafra, F.; Danbolt, N.C.; Aragón, C.; Giménez, C.; Kanner, B.I. Phosphorylation and Modulation of Brain Glutamate Transporters by Protein Kinase C. J Biol Chem 1993, 268, 27313–27317. [Google Scholar] [CrossRef] [PubMed]
- Panopoulos, A.D.; Yanes, O.; Ruiz, S.; Kida, Y.S.; Diep, D.; Tautenhahn, R.; Herrerías, A.; Batchelder, E.M.; Plongthongkum, N.; Lutz, M.; et al. The Metabolome of Induced Pluripotent Stem Cells Reveals Metabolic Changes Occurring in Somatic Cell Reprogramming. Cell Res. 2012, 22, 168–177. [Google Scholar] [CrossRef] [PubMed]
- Kidder, B.L.; Hu, G.; Zhao, K. KDM5B Focuses H3K4 Methylation near Promoters and Enhancers during Embryonic Stem Cell Self-Renewal and Differentiation. Genome Biol. 2014, 15, R32. [Google Scholar] [CrossRef] [PubMed]
- Shyh-Chang, N.; Ng, H.-H. The Metabolic Programming of Stem Cells. Genes Dev. 2017, 31, 336–346. [Google Scholar] [CrossRef]


Disclaimer/Publisher’s Note: The statements, opinions and data contained in all publications are solely those of the individual author(s) and contributor(s) and not of MDPI and/or the editor(s). MDPI and/or the editor(s) disclaim responsibility for any injury to people or property resulting from any ideas, methods, instructions or products referred to in the content. |
© 2024 by the authors. Licensee MDPI, Basel, Switzerland. This article is an open access article distributed under the terms and conditions of the Creative Commons Attribution (CC BY) license (https://creativecommons.org/licenses/by/4.0/).
Share and Cite
Arribas-Carreira, L.; Castro, M.; García, F.; Navarrete, R.; Bravo-Alonso, I.; Zafra, F.; Ugarte, M.; Richard, E.; Pérez, B.; Rodríguez-Pombo, P. Metabolic Rewiring and Altered Glial Differentiation in an iPSC-Derived Astrocyte Model Derived from a Nonketotic Hyperglycinemia Patient. Int. J. Mol. Sci. 2024, 25, 2814. https://doi.org/10.3390/ijms25052814
Arribas-Carreira L, Castro M, García F, Navarrete R, Bravo-Alonso I, Zafra F, Ugarte M, Richard E, Pérez B, Rodríguez-Pombo P. Metabolic Rewiring and Altered Glial Differentiation in an iPSC-Derived Astrocyte Model Derived from a Nonketotic Hyperglycinemia Patient. International Journal of Molecular Sciences. 2024; 25(5):2814. https://doi.org/10.3390/ijms25052814
Chicago/Turabian StyleArribas-Carreira, Laura, Margarita Castro, Fernando García, Rosa Navarrete, Irene Bravo-Alonso, Francisco Zafra, Magdalena Ugarte, Eva Richard, Belén Pérez, and Pilar Rodríguez-Pombo. 2024. "Metabolic Rewiring and Altered Glial Differentiation in an iPSC-Derived Astrocyte Model Derived from a Nonketotic Hyperglycinemia Patient" International Journal of Molecular Sciences 25, no. 5: 2814. https://doi.org/10.3390/ijms25052814
APA StyleArribas-Carreira, L., Castro, M., García, F., Navarrete, R., Bravo-Alonso, I., Zafra, F., Ugarte, M., Richard, E., Pérez, B., & Rodríguez-Pombo, P. (2024). Metabolic Rewiring and Altered Glial Differentiation in an iPSC-Derived Astrocyte Model Derived from a Nonketotic Hyperglycinemia Patient. International Journal of Molecular Sciences, 25(5), 2814. https://doi.org/10.3390/ijms25052814